Embed Size (px)
DESCRIPTION
TR
Citation preview
ICOSSAR ‘0913 September – 17 September 2009,
Osaka, Japan
Colin C. Caprani & Eugene J. OBrien
Dublin Institute of Technology & University College Dublin
Estimating Extreme Highway Bridge Traffic Load Effects
Introduction
Estimating Extreme Highway Bridge Traffic Load Effect
C.C. Caprani & E.J. OBrien
Statistics in the hands of an engineer are like a lamppost to a drunk – they're used more for support than illumination.
- A. E. Housman.
Extreme Value Methods I
Estimating Extreme Highway Bridge Traffic Load Effect
C.C. Caprani & E.J. OBrien
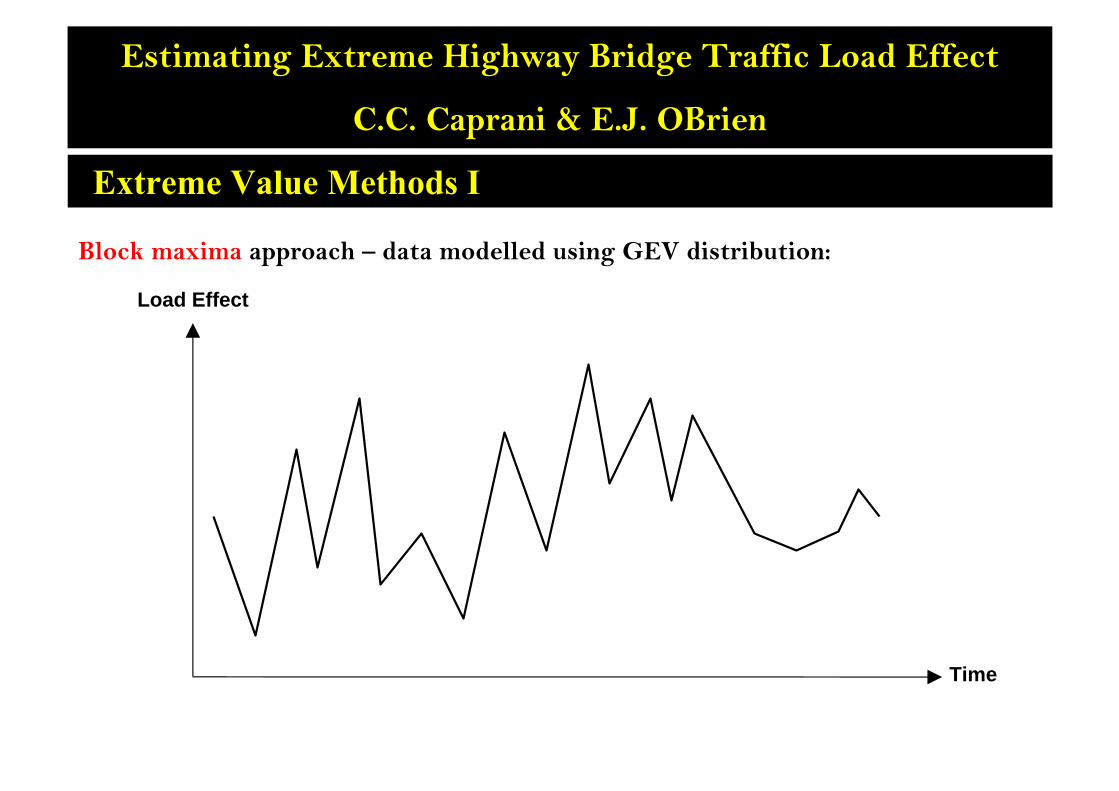
Block maxima approach – data modelled using GEV distribution:
Time
Load Effect
Extreme Value Methods I
Estimating Extreme Highway Bridge Traffic Load Effect
C.C. Caprani & E.J. OBrien
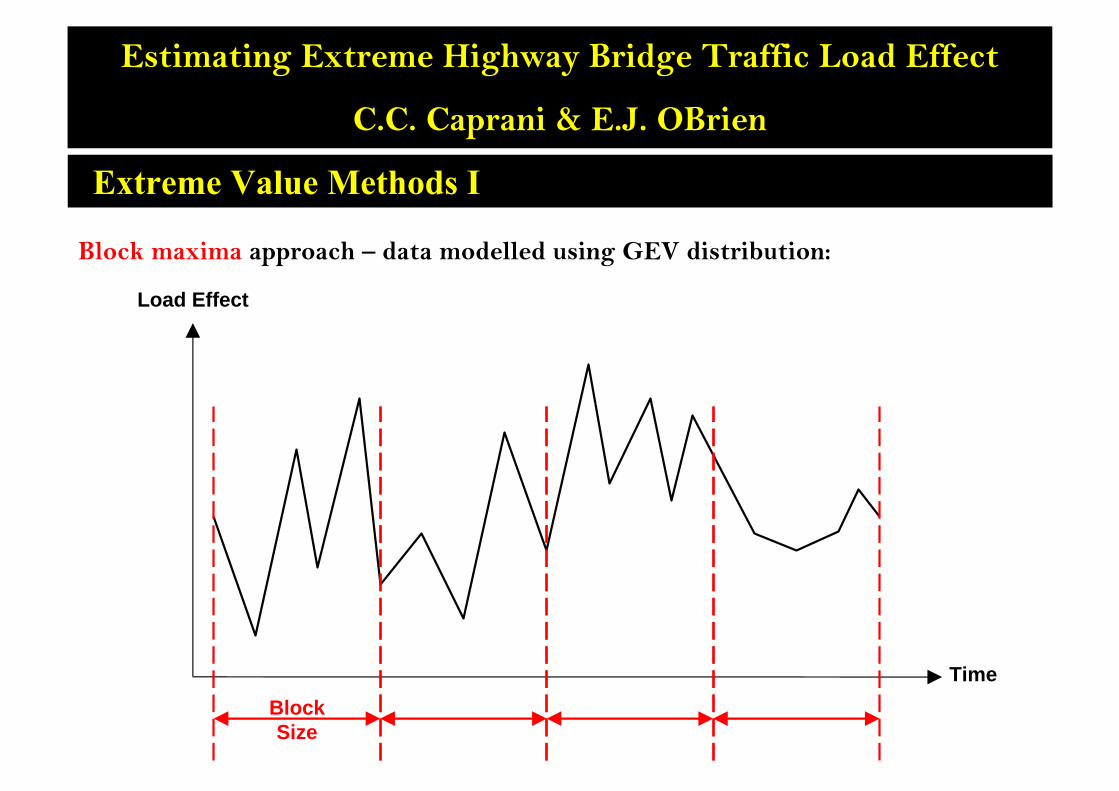
Block maxima approach – data modelled using GEV distribution:
Time
Load Effect
BlockSize
Extreme Value Methods I
Estimating Extreme Highway Bridge Traffic Load Effect
C.C. Caprani & E.J. OBrien
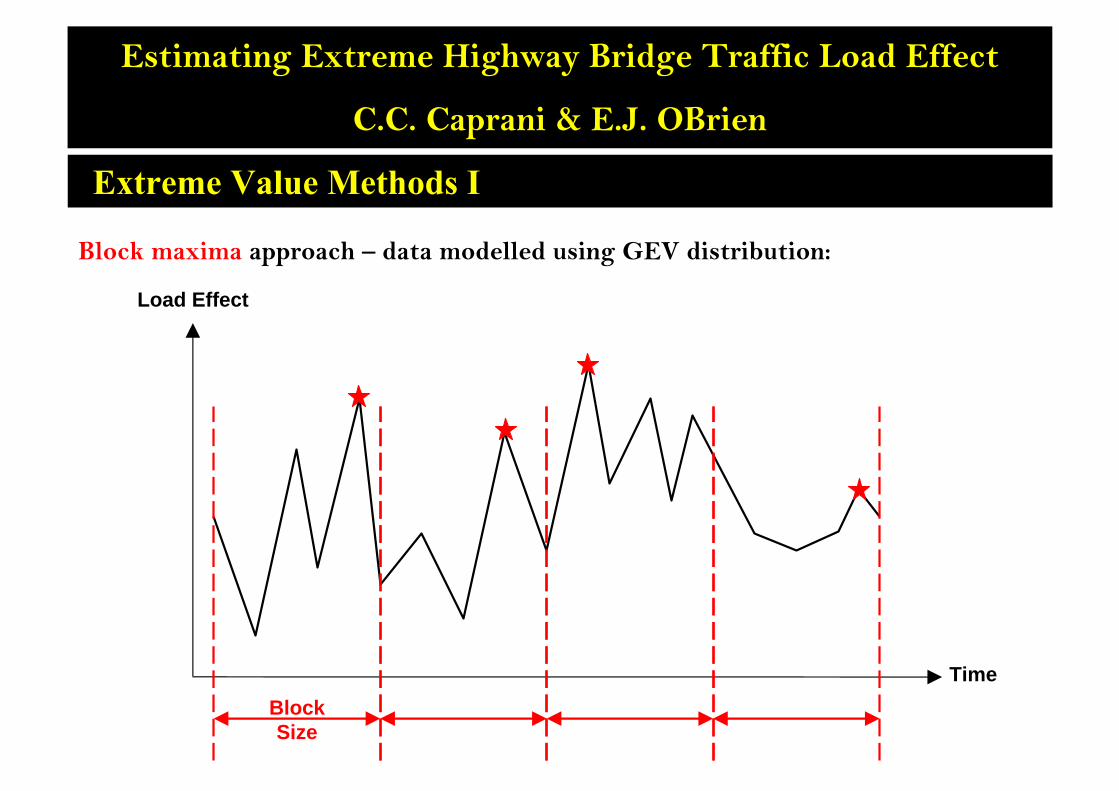
Block maxima approach – data modelled using GEV distribution:
Time
Load Effect
BlockSize
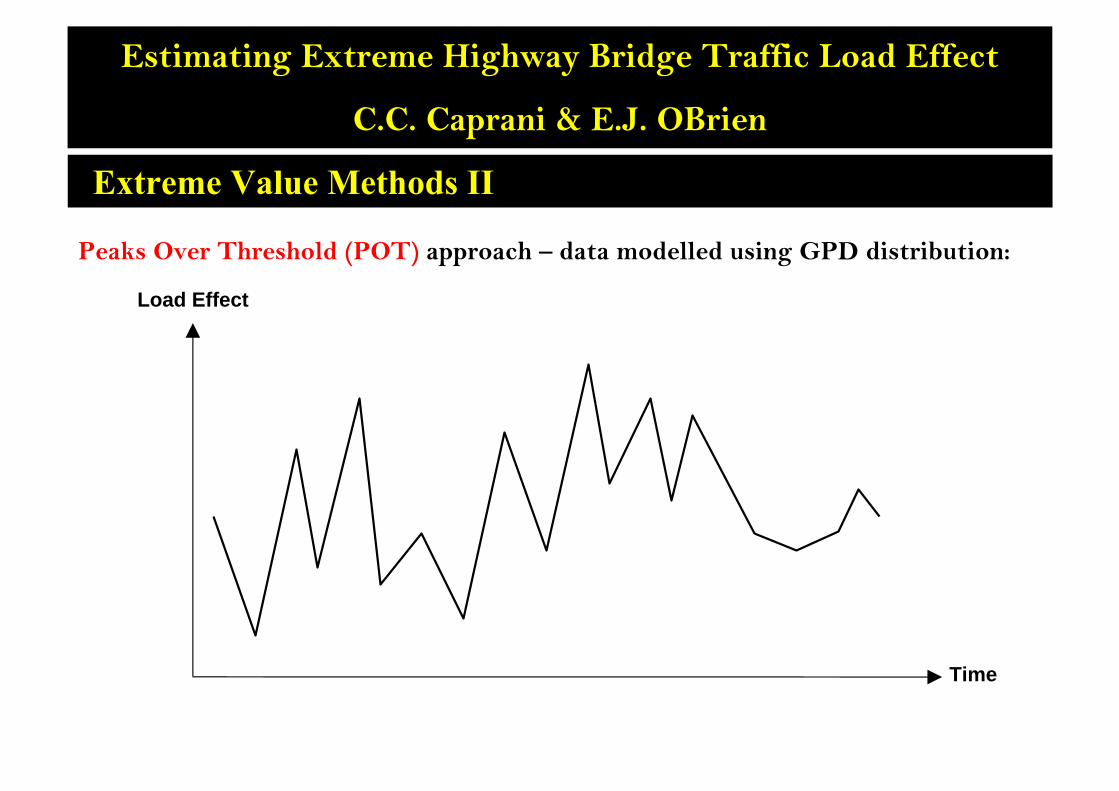
Extreme Value Methods II
Estimating Extreme Highway Bridge Traffic Load Effect
C.C. Caprani & E.J. OBrien
Peaks Over Threshold (POT) approach – data modelled using GPD distribution:
Time
Load Effect
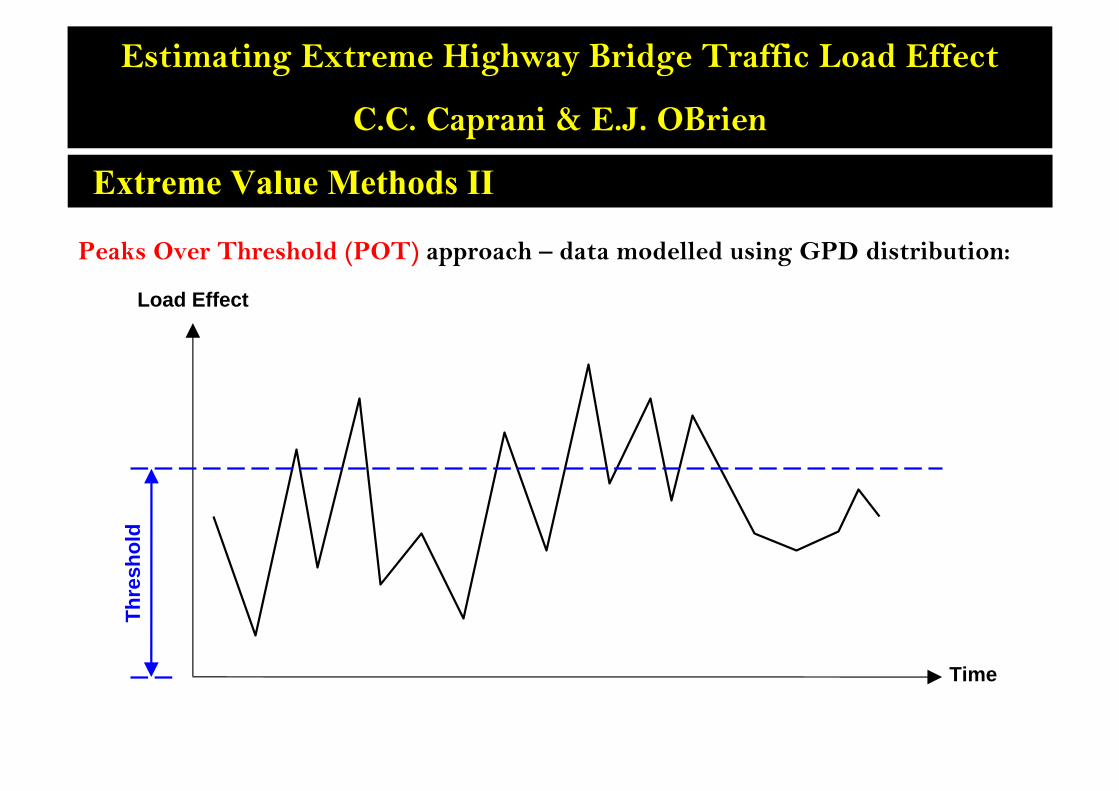
Extreme Value Methods II
Estimating Extreme Highway Bridge Traffic Load Effect
C.C. Caprani & E.J. OBrien
Peaks Over Threshold (POT) approach – data modelled using GPD distribution:
Time
Load Effect
Thre
shol
d
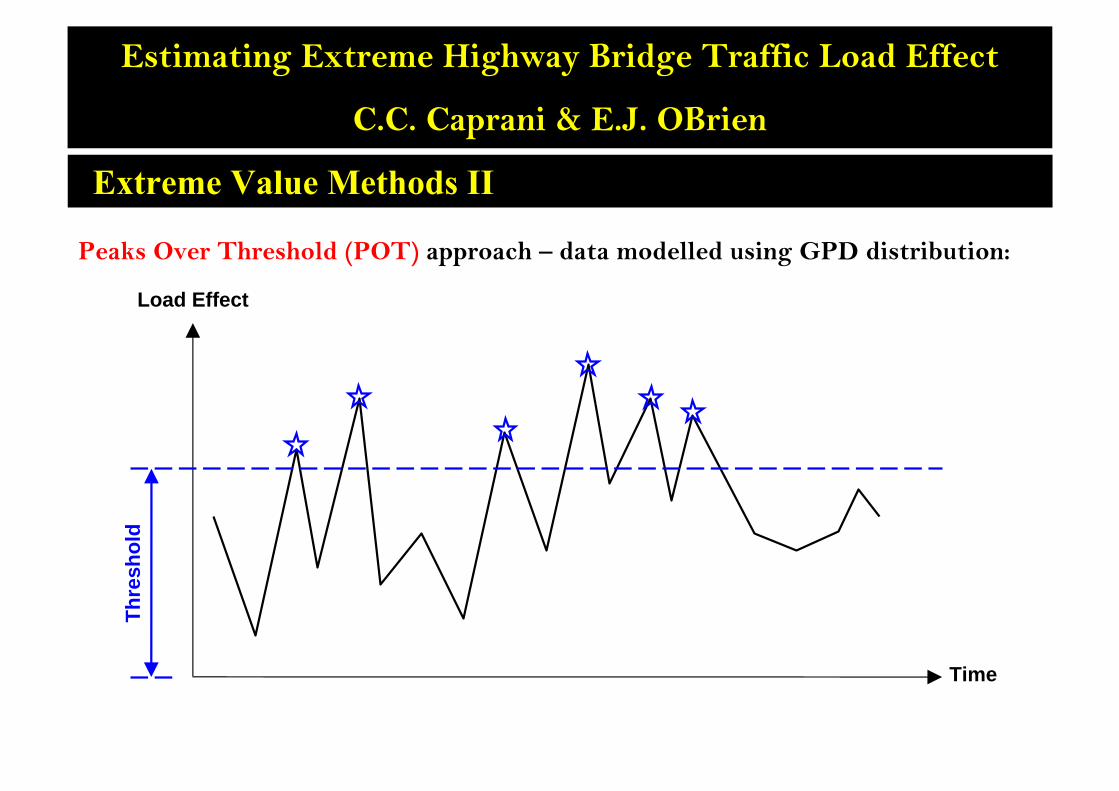
Extreme Value Methods II
Estimating Extreme Highway Bridge Traffic Load Effect
C.C. Caprani & E.J. OBrien
Peaks Over Threshold (POT) approach – data modelled using GPD distribution:
Time
Load Effect
Thre
shol
d
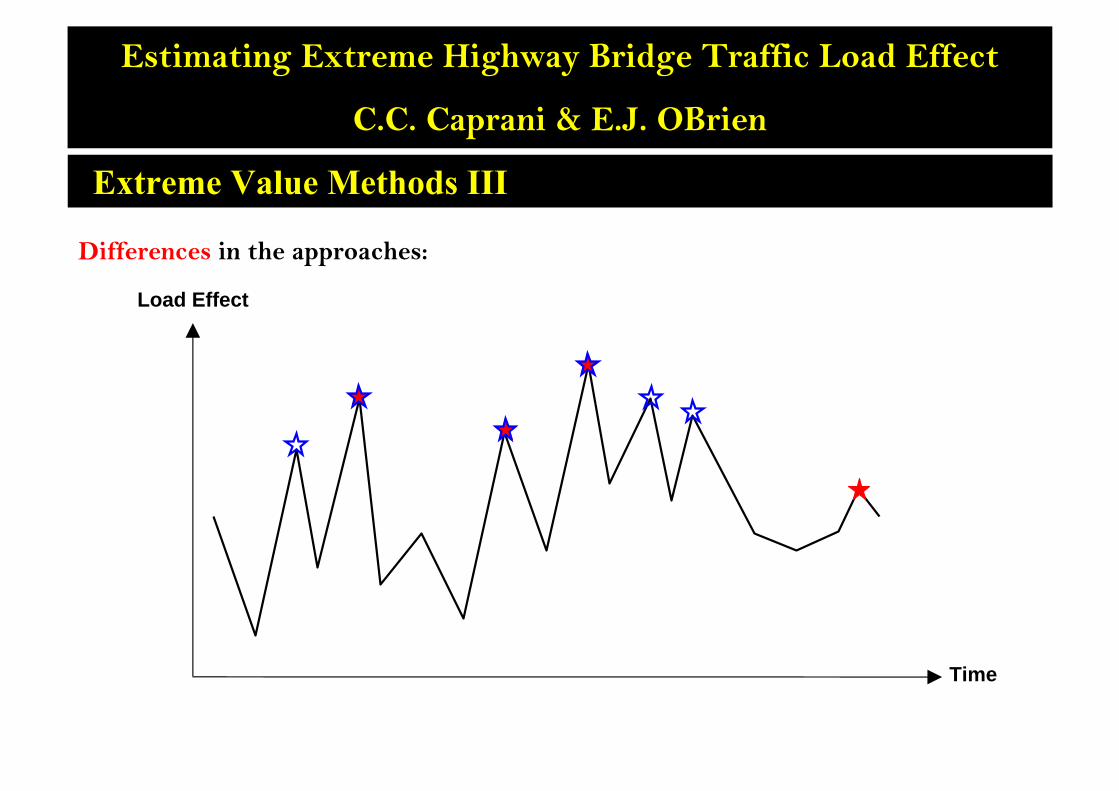
Extreme Value Methods III
Estimating Extreme Highway Bridge Traffic Load Effect
C.C. Caprani & E.J. OBrien
Differences in the approaches:
Time
Load Effect
Extreme Value Methods IV
Estimating Extreme Highway Bridge Traffic Load Effect
C.C. Caprani & E.J. OBrien
Choice between the approaches:
• Gives different results
• Often subjective
• Difficult to assess best model
As the GEV and GPD are different distributions:
• They are non-nested models
• Cannot calculate a statistical significance of differences
Box-Cox GEV Distribution I
Estimating Extreme Highway Bridge Traffic Load Effect
C.C. Caprani & E.J. OBrien
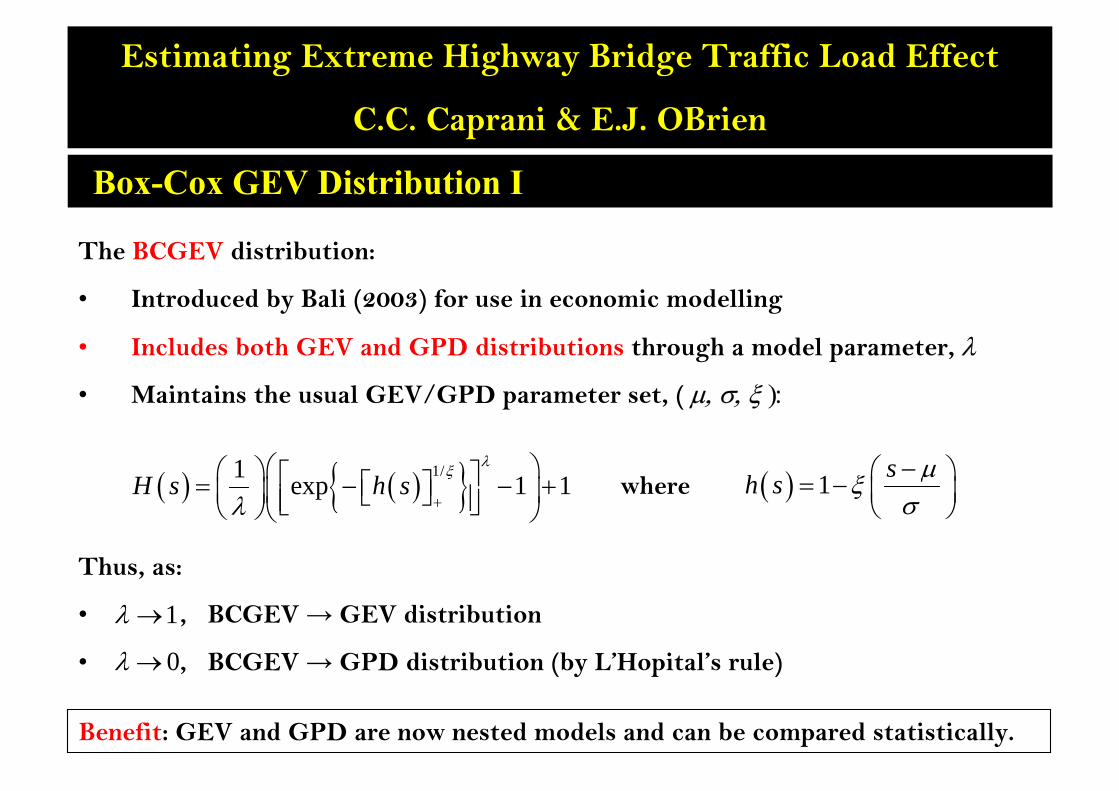
The BCGEV distribution:
• Introduced by Bali (2003) for use in economic modelling
• Includes both GEV and GPD distributions through a model parameter, λ
• Maintains the usual GEV/GPD parameter set, ( µ, σ, ξ ):
( ) ( ){ }1/1 exp 1 1H s h sλξ
λ +
⎛ ⎞⎛ ⎞ ⎡ ⎤⎡ ⎤= − − +⎜ ⎟⎜ ⎟ ⎣ ⎦⎢ ⎥⎣ ⎦⎝ ⎠⎝ ⎠( ) 1 sh s µξ
σ−⎛ ⎞= − ⎜ ⎟
⎝ ⎠where
Thus, as:
• , BCGEV → GEV distribution
• , BCGEV → GPD distribution (by L’Hopital’s rule)
1λ →
0λ →
Benefit: GEV and GPD are now nested models and can be compared statistically.
Box-Cox GEV Distribution II
Estimating Extreme Highway Bridge Traffic Load Effect
C.C. Caprani & E.J. OBrien
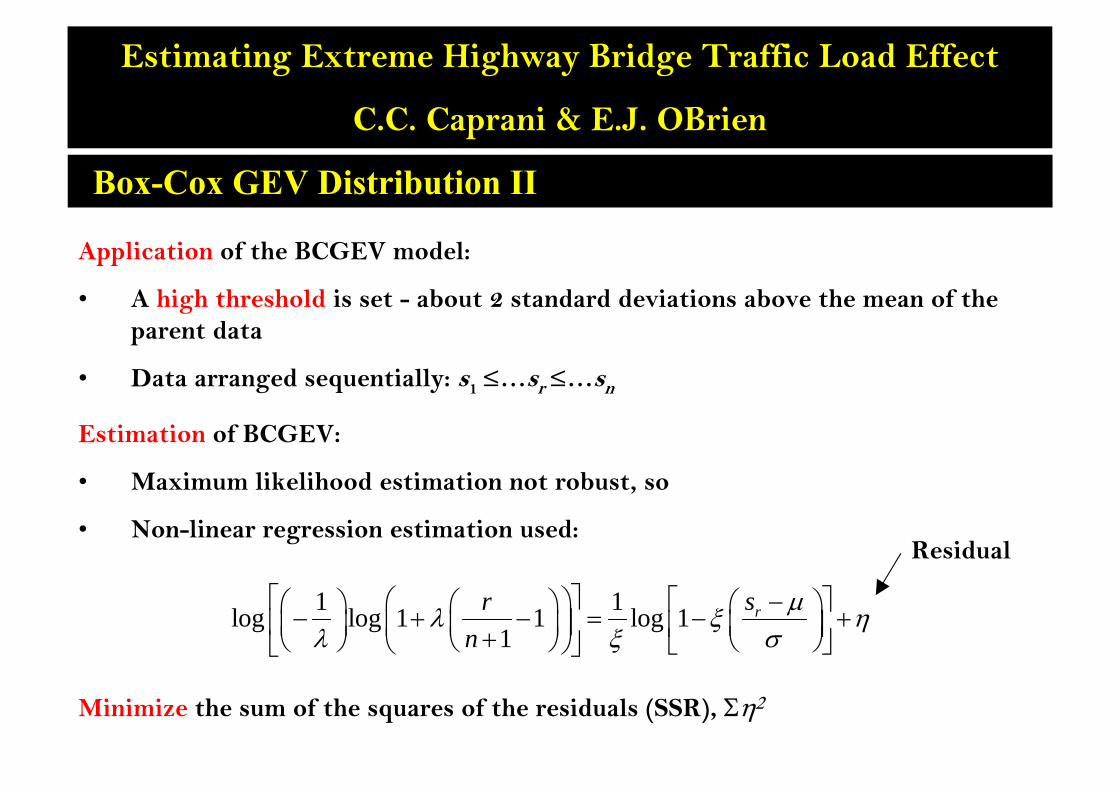
Application of the BCGEV model:
• A high threshold is set - about 2 standard deviations above the mean of the parent data
• Data arranged sequentially: s1 ≤…sr≤…sn
1 1log log 1 1 log 11
rsrn
µλ ξ ηλ ξ σ
⎡ ⎤ ⎡ ⎤⎛ ⎞ −⎛ ⎞⎛ ⎞ ⎛ ⎞− + − = − +⎢ ⎥⎜ ⎟ ⎜ ⎟⎜ ⎟ ⎜ ⎟⎢ ⎥+⎝ ⎠ ⎝ ⎠ ⎝ ⎠⎝ ⎠ ⎣ ⎦⎣ ⎦
Minimize the sum of the squares of the residuals (SSR), Ση2
Estimation of BCGEV:
• Maximum likelihood estimation not robust, so
• Non-linear regression estimation used:Residual
Bridge Traffic Loading I
Estimating Extreme Highway Bridge Traffic Load Effect
C.C. Caprani & E.J. OBrien
0
2
4
6
8
10
0 10 20 30 40Distance
Influ
ence
Ord
inat
e
Effect 1Effect 2
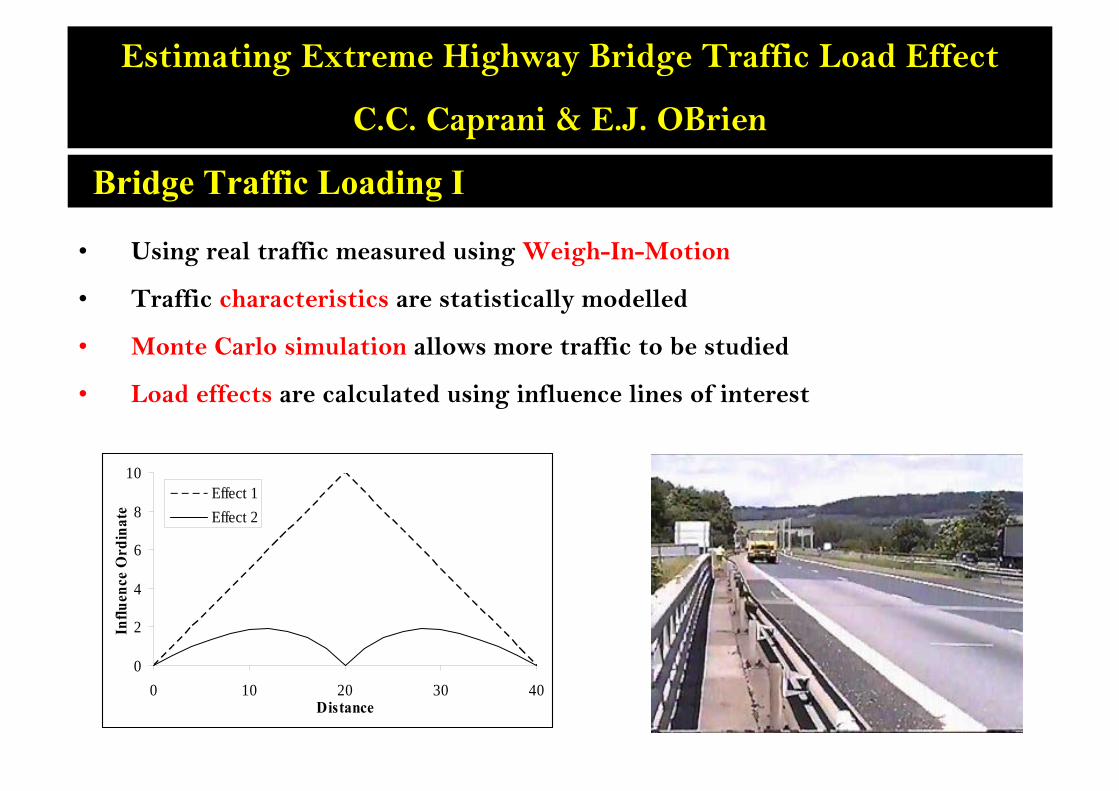
• Using real traffic measured using Weigh-In-Motion
• Traffic characteristics are statistically modelled
• Monte Carlo simulation allows more traffic to be studied
• Load effects are calculated using influence lines of interest
Bridge Traffic Loading II
Estimating Extreme Highway Bridge Traffic Load Effect
C.C. Caprani & E.J. OBrien
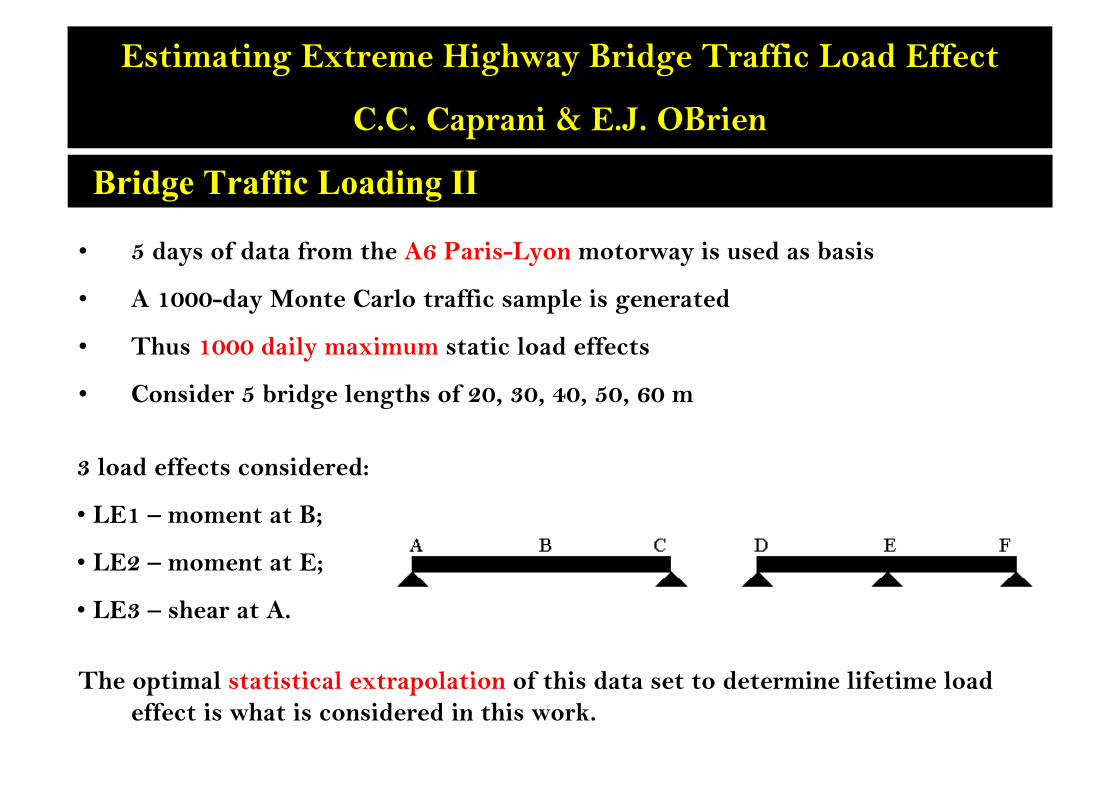
3 load effects considered:
• LE1 – moment at B;
• LE2 – moment at E;
• LE3 – shear at A.
• 5 days of data from the A6 Paris-Lyon motorway is used as basis
• A 1000-day Monte Carlo traffic sample is generated
• Thus 1000 daily maximum static load effects
• Consider 5 bridge lengths of 20, 30, 40, 50, 60 m
The optimal statistical extrapolation of this data set to determine lifetime load effect is what is considered in this work.
Bridge Traffic Loading III
Estimating Extreme Highway Bridge Traffic Load Effect
C.C. Caprani & E.J. OBrien
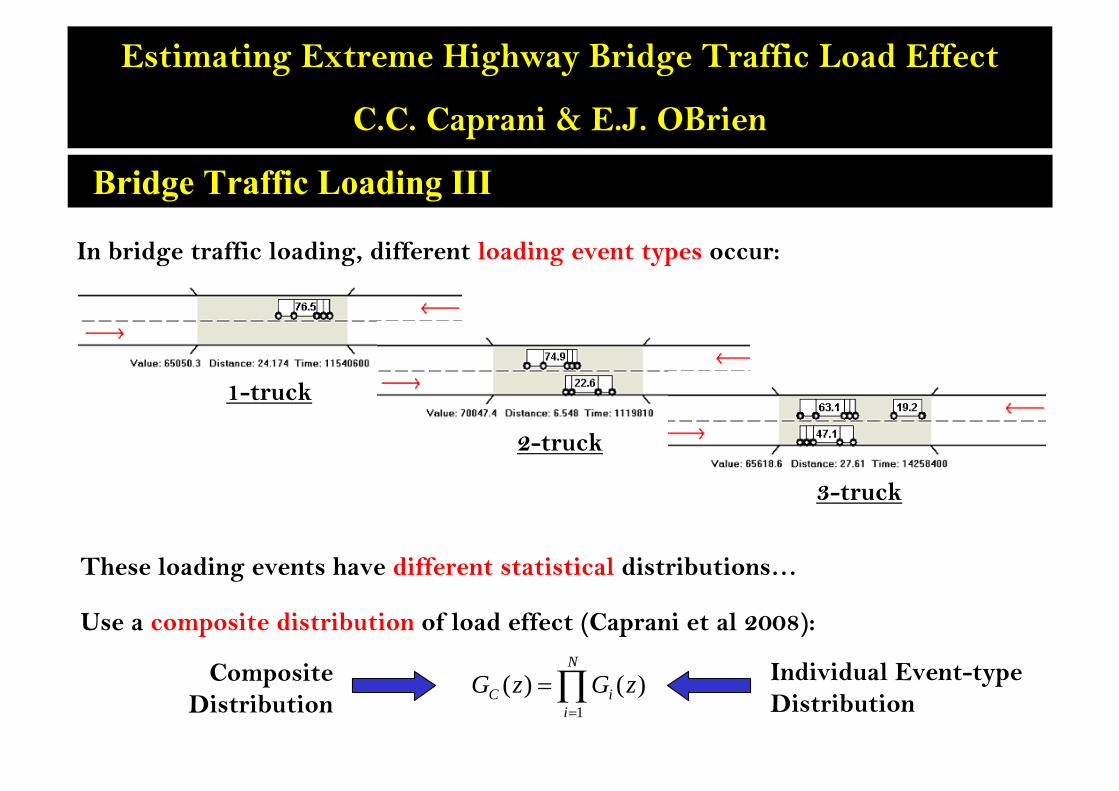
In bridge traffic loading, different loading event types occur:
1-truck
2-truck
3-truck
These loading events have different statistical distributions…
Use a composite distribution of load effect (Caprani et al 2008):
1
( ) ( )N
C ii
G z G z=
= ∏Composite Distribution
Individual Event-type Distribution
Basis of BCGEV Analysis
Estimating Extreme Highway Bridge Traffic Load Effect
C.C. Caprani & E.J. OBrien
For 3 load effects, 5 bridge lengths and each loading event type,
There are 41 data sets to be modelled.
11 thresholds are applied to the daily maximum data:
• In 0.5 standard deviation steps
• From k = -2.5 to k = +2.5 standard deviations about the mean
BCGEV model:
• Estimation of ‘model parameter’, λ is not robust
• Thus λ varied from 0 to 1 in 0.01 steps
• Best fit of remaining parameters then found for each λ.
Optimum BCGEV Parameters
Estimating Extreme Highway Bridge Traffic Load Effect
C.C. Caprani & E.J. OBrien
0
0.5
1 -20
2
0
0.1
0.2
0.3
Threshold: µ + kσModel Parameter, λ
Mea
n S
SR
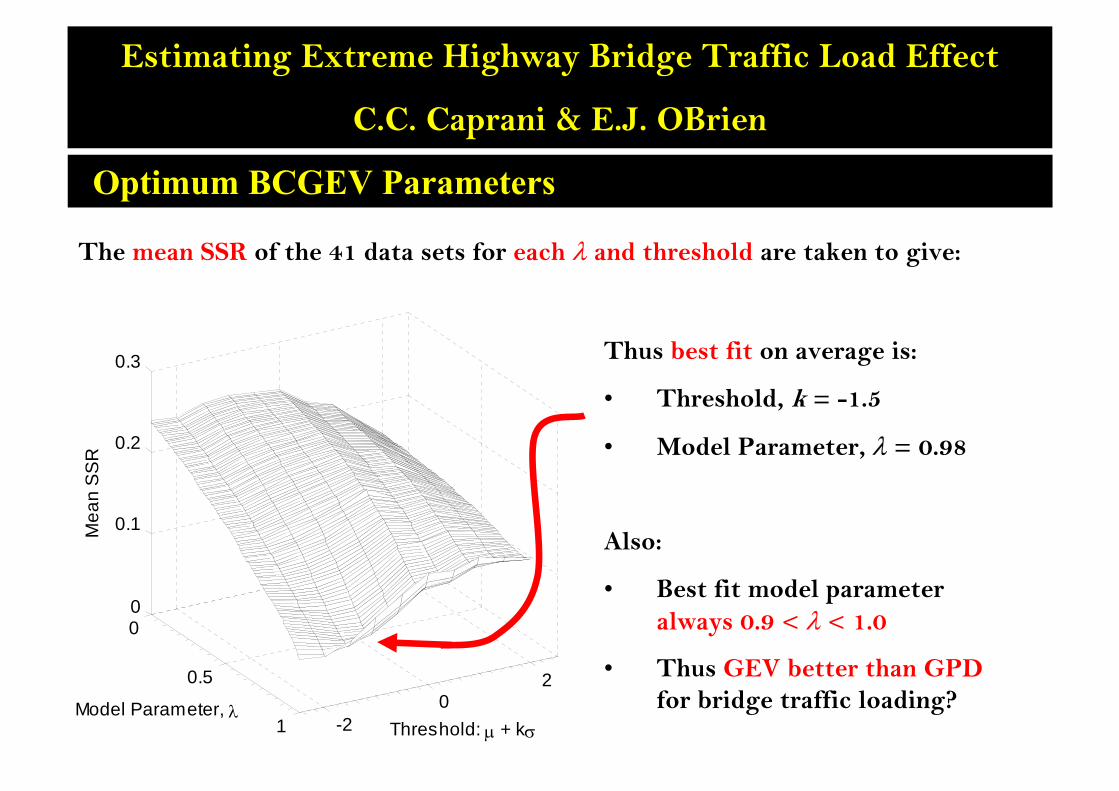
The mean SSR of the 41 data sets for each λ and threshold are taken to give:
Thus best fit on average is:
• Threshold, k = -1.5
• Model Parameter, λ = 0.98
Also:
• Best fit model parameter always 0.9 < λ < 1.0
• Thus GEV better than GPDfor bridge traffic loading?
Likelihood Ratio Test I
Estimating Extreme Highway Bridge Traffic Load Effect
C.C. Caprani & E.J. OBrien
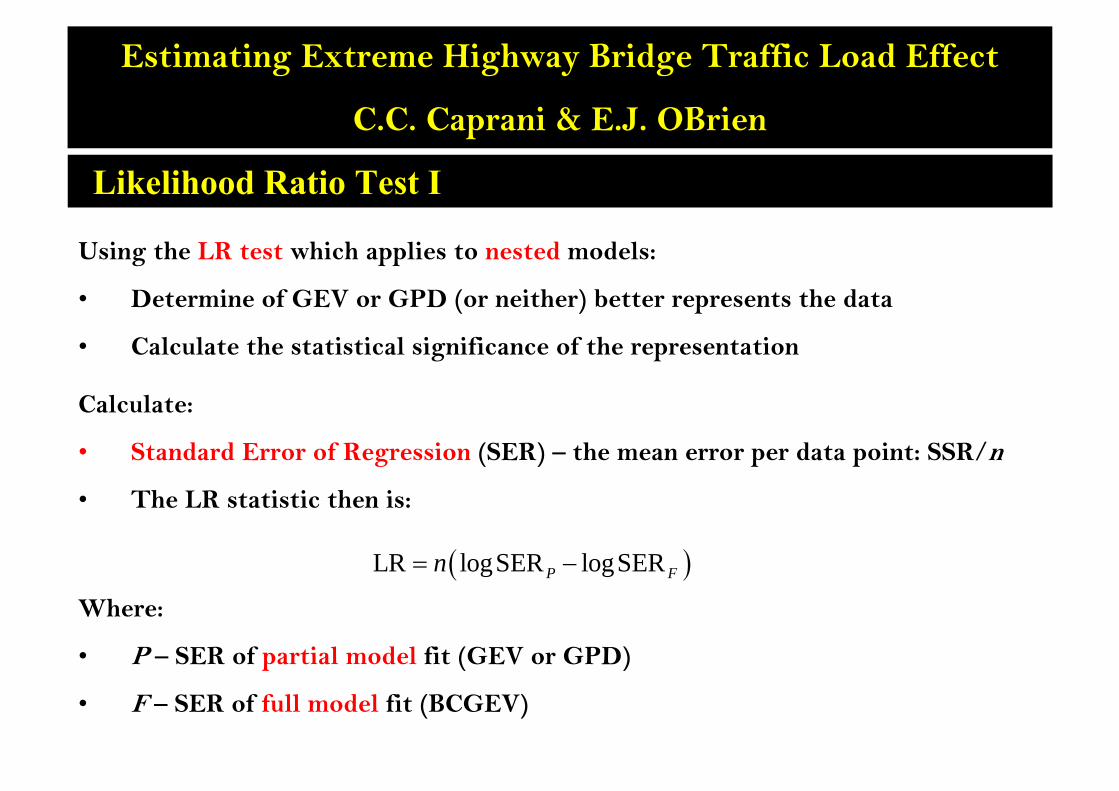
Using the LR test which applies to nested models:
• Determine of GEV or GPD (or neither) better represents the data
• Calculate the statistical significance of the representation
Calculate:
• Standard Error of Regression (SER) – the mean error per data point: SSR/n
• The LR statistic then is:
( )LR logSER logSERP Fn= −
Where:
• P – SER of partial model fit (GEV or GPD)
• F – SER of full model fit (BCGEV)
Likelihood Ratio Test II
Estimating Extreme Highway Bridge Traffic Load Effect
C.C. Caprani & E.J. OBrien
This LR statistic is approx. χ2- distributed with 1 degree of freedom:
• For 95% significance level - critical value is 3.842
• For 99% significance level - critical value is 6.635
Hypothesis: partial model adequately represents data:
• Reject if LR statistic greater than critical value at chosen significance level
-3 -2 -1 0 1 2 3
10-2
100
102
104
Threshold: µ + kσ
Like
lihoo
d R
atio
Sta
tistic
99% Significance95% SignificanceMean GEV LR
Significance Testing I
Estimating Extreme Highway Bridge Traffic Load Effect
C.C. Caprani & E.J. OBrien
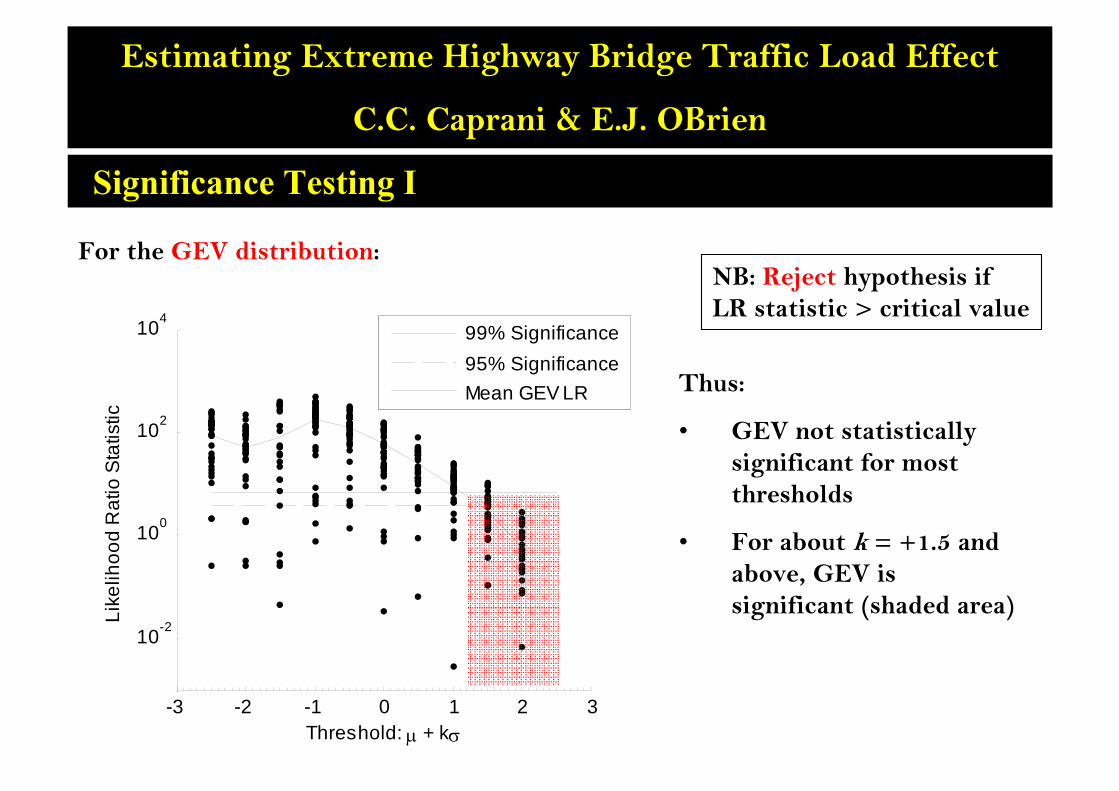
For the GEV distribution:NB: Reject hypothesis if LR statistic > critical value
Thus:
• GEV not statistically significant for most thresholds
• For about k = +1.5 and above, GEV is significant (shaded area)
Significance Testing II
Estimating Extreme Highway Bridge Traffic Load Effect
C.C. Caprani & E.J. OBrien
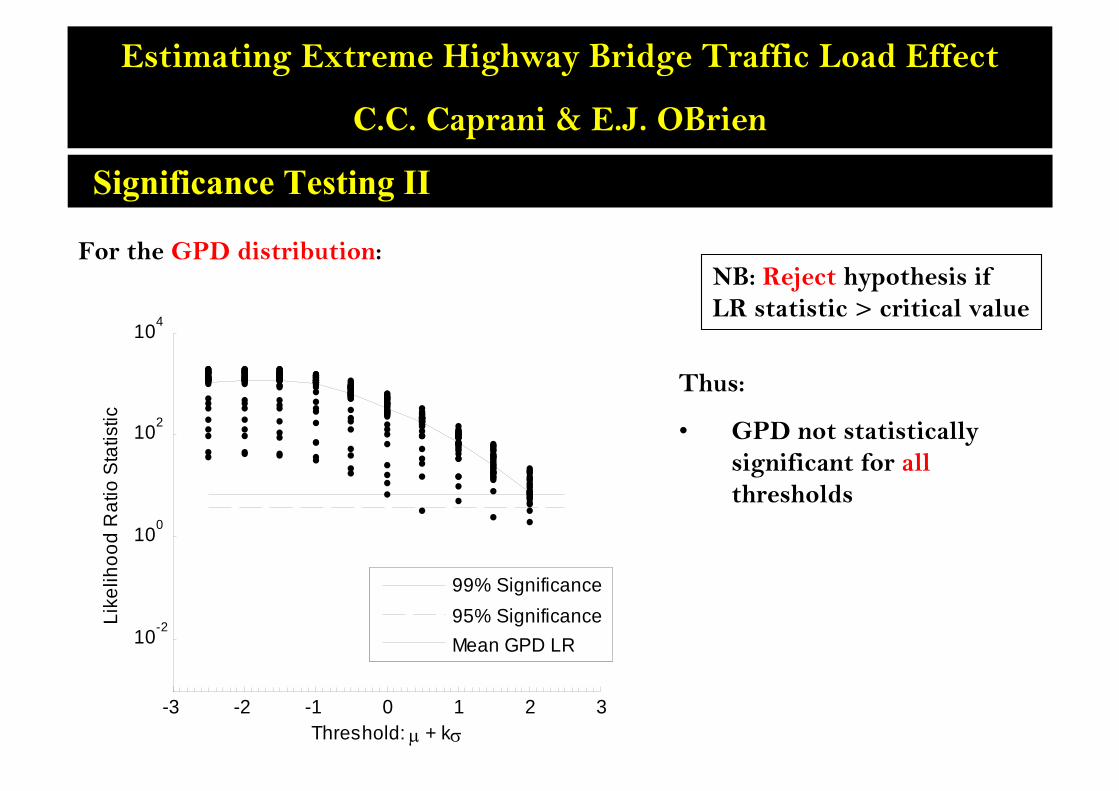
For the GPD distribution:NB: Reject hypothesis if LR statistic > critical value
Thus:
• GPD not statistically significant for allthresholds
-3 -2 -1 0 1 2 3
10-2
100
102
104
Threshold: µ + kσ
Like
lihoo
d R
atio
Sta
tistic
99% Significance95% SignificanceMean GPD LR
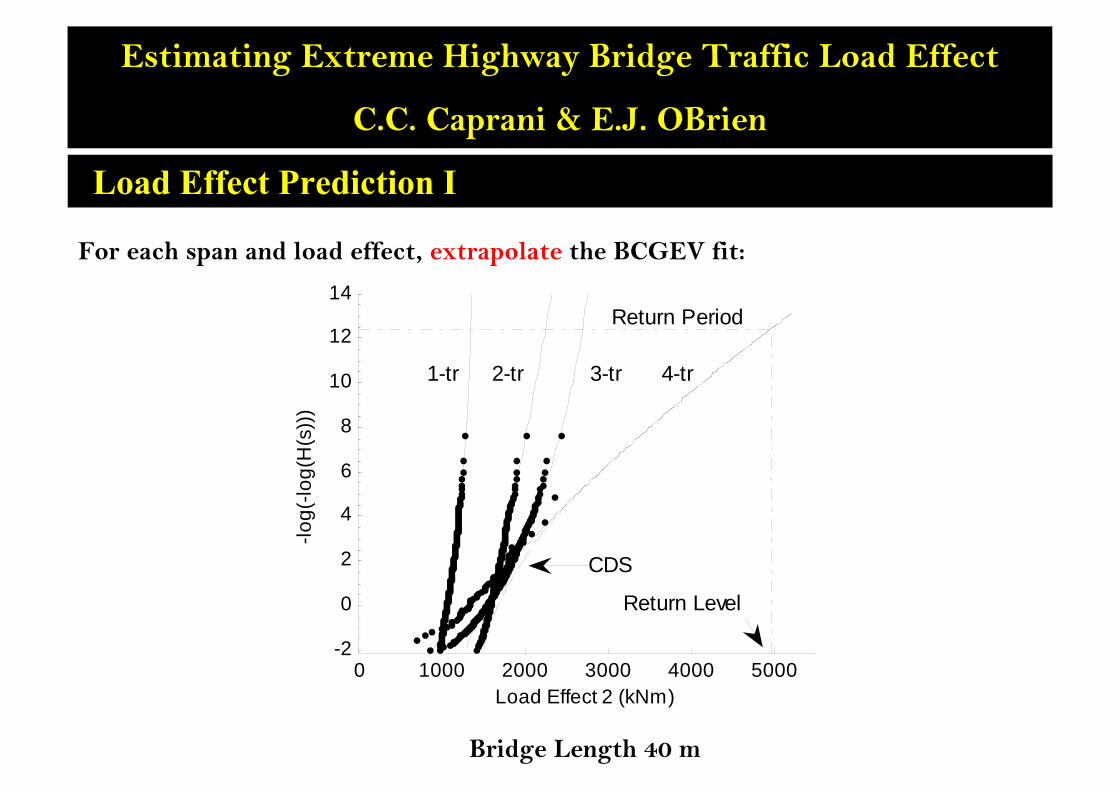
Load Effect Prediction I
Estimating Extreme Highway Bridge Traffic Load Effect
C.C. Caprani & E.J. OBrien
For each span and load effect, extrapolate the BCGEV fit:
0 1000 2000 3000 4000 5000-2
0
2
4
6
8
10
12
14
Load Effect 2 (kNm)
-log(
-log(
H(s
)))
1-tr 2-tr 3-tr 4-tr
CDS
Return Period
Return Level
Bridge Length 40 m
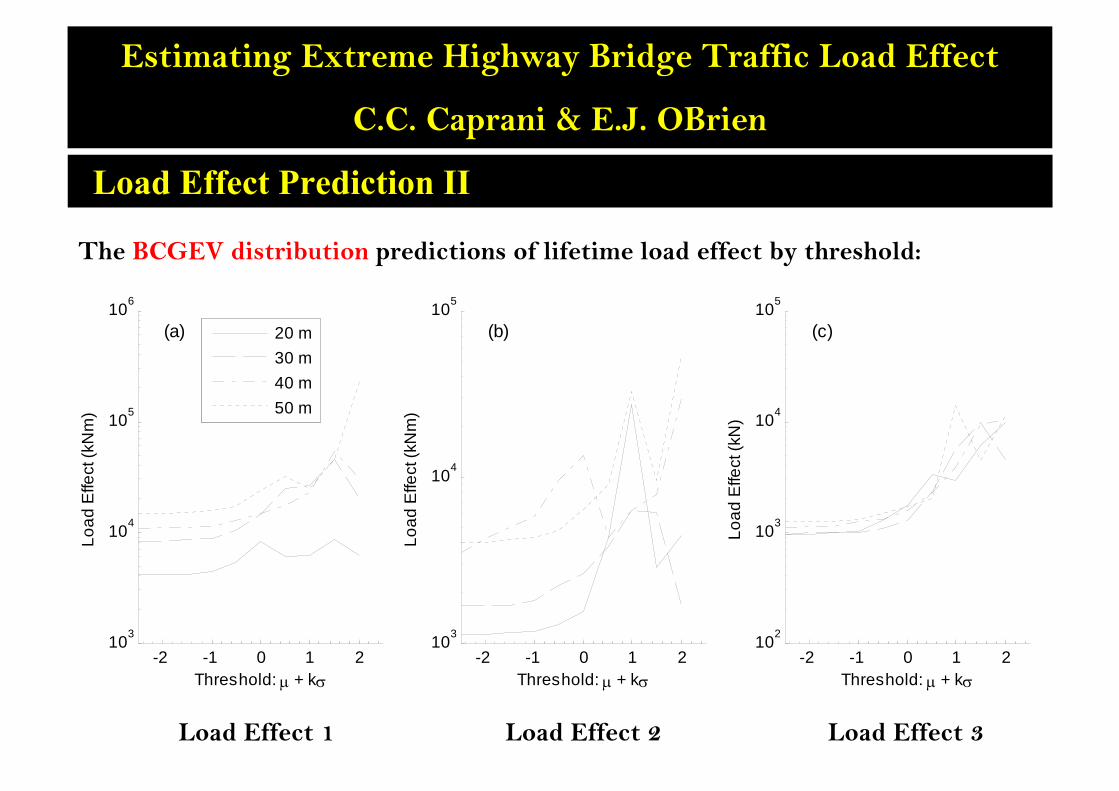
Load Effect Prediction II
Estimating Extreme Highway Bridge Traffic Load Effect
C.C. Caprani & E.J. OBrien
The BCGEV distribution predictions of lifetime load effect by threshold:
-2 -1 0 1 2103
104
105
106
Threshold: µ + kσ
Load
Effe
ct (k
Nm
)
20 m30 m40 m50 m
-2 -1 0 1 2103
104
105
Threshold: µ + kσ
Load
Effe
ct (k
Nm
)
-2 -1 0 1 2102
103
104
105
Threshold: µ + kσ
Load
Effe
ct (k
N)
(a) (b) (c)
Load Effect 1 Load Effect 2 Load Effect 3
Load Effect Prediction III
Estimating Extreme Highway Bridge Traffic Load Effect
C.C. Caprani & E.J. OBrien
Comparison of different prediction methods:
• Conventional: GEV model, ignoring different loading event types
• GEV: using CDS to account for different loading event types
• BCGEV, k = -2.5: considers all data and uses CDS
• BCGEV, k = -1.5: the ‘global optimum’ threshold identified previously
Comparison with GPD not included as the best fit model parameter λ was never found to be close to zero for this data.
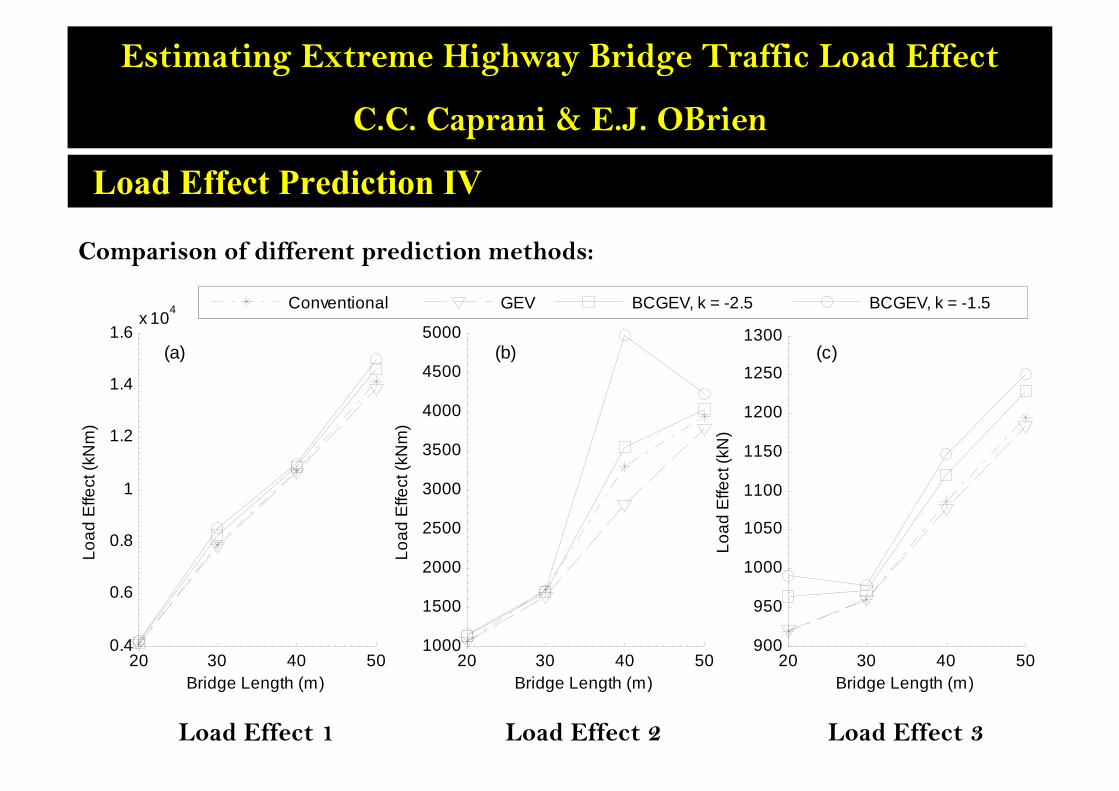
Load Effect Prediction IV
Estimating Extreme Highway Bridge Traffic Load Effect
C.C. Caprani & E.J. OBrien
Comparison of different prediction methods:
20 30 40 500.4
0.6
0.8
1
1.2
1.4
1.6x 10⁴
Bridge Length (m)
Load
Effe
ct (k
Nm
)
20 30 40 501000
1500
2000
2500
3000
3500
4000
4500
5000
Bridge Length (m)
Load
Effe
ct (k
Nm
)
20 30 40 50900
950
1000
1050
1100
1150
1200
1250
1300
Bridge Length (m)
Load
Effe
ct (k
N)
(a) (b) (c)
Conventional GEV BCGEV, k = -2.5 BCGEV, k = -1.5
Load Effect 1 Load Effect 2 Load Effect 3
Conclusions I
Estimating Extreme Highway Bridge Traffic Load Effect
C.C. Caprani & E.J. OBrien
• The Box-Cox-GEV model allows the data to determine the appropriate form of extreme value analysis.
• The BCGEV model has been extended with Composite Distribution Statistics (CDS) to account for the different loading event types.
• The BCGEV model is a better fit than the GEV and GPD models with considerable statistical significance, for almost all thresholds considered.
• Bridge traffic load effect data lies strongly in the domain of the GEVdistribution.
Conclusions II
Estimating Extreme Highway Bridge Traffic Load Effect
C.C. Caprani & E.J. OBrien
• An optimum threshold level to apply to daily maximum load effect has been identified, k = -1.5.
• The BCGEV model is stable for k < 0, i.e. thresholds below the mean daily maximum load effect.
• The BCGEV model gives slightly higher lifetime load effect predictions that other methods.
• The BCGEV model predictions were found to be more sensitive to different loading event types than other models.
Overall Conclusion:
The BCGEV model is more flexible and so more sympathetic to the data, giving increased confidence to load effect predictions.

ICOSSAR ‘0913 September – 17 September 2009,
Osaka, Japan
Colin C. Caprani & Eugene J. OBrien
Dublin Institute of Technology & University College Dublin
Estimating Extreme Highway Bridge Traffic Load Effects
Blank
Estimating Extreme Highway Bridge Traffic Load Effect
C.C. Caprani & E.J. OBrien