Embed Size (px)
Citation preview

ICONICS Worldwide Customer Summit - © 2013
Analyze
Reduce Energy and Save Money with Energy AnalytiXMilesh Patel, Solutions Architect, UKIoannis Apostolakis, Sr Developer, USAJotham Kildea, Business Development Manager
AX-201

ICONICS Worldwide Customer Summit - © 2013
What is Energy AnalytiX?
Agenda
Why choose ICONICS and ICONICS Energy AnalytiX?
Real Customer Application Experience
Product Demonstration Q&A Quiz

ICONICS Worldwide Customer Summit - © 2013
98,022 TWhGlobal Energy use in 2008
12,476 mtoe Global energy use in 2012
10%Largest business expense
Everyone should be interested in reducing Energy!
Why Monitor Energy Usage?

ICONICS Worldwide Customer Summit - © 2013
I have the information, now what can I do to make savings?Process changes, Culture changes?
How is this energy used?Can I break this down by location/function/process/occupancy etc. for better analysisDo I need meters? Do I need control?
How much energy am I currently using?What does this cost me?
Where do you start?

ICONICS Worldwide Customer Summit - © 2013
• Energy Monitoring Module
• Advanced Data Calculation
• Powerful Visualization
What is it? What does it output?
• Aggregated energy usage
• Normalized consumption
• Your own calculation
How does it integrate?
• Connectivity to any device
• BACnet, OPC, SNMP• Easily accessible
summaries
Advanced Energy Monitoring and Analysis Software
ICONICS Worldwide Customer Summit - © 2013
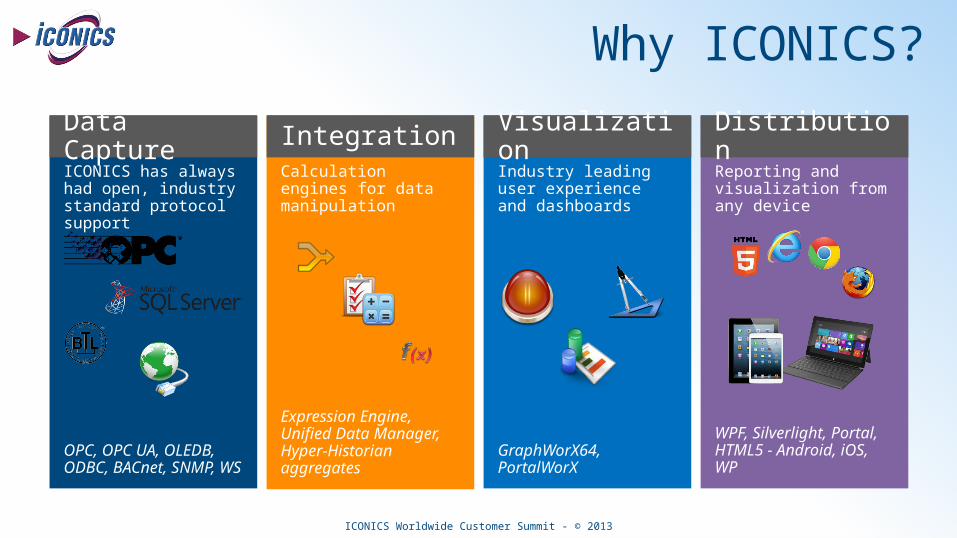
ICONICS has always had open, industry standard protocol support
Data CaptureCalculation engines for data manipulation
IntegrationIndustry leading user experience and dashboards
VisualizationReporting and visualization from any device
Distribution
OPC, OPC UA, OLEDB, ODBC, BACnet, SNMP, WS
Expression Engine, Unified Data Manager, Hyper-Historian aggregates
GraphWorX64, PortalWorX
WPF, Silverlight, Portal, HTML5 - Android, iOS, WP
Why ICONICS?

ICONICS Worldwide Customer Summit - © 2013

ICONICS Worldwide Customer Summit - © 2013

ICONICS Worldwide Customer Summit - © 2013
Energy AnalytiX features

ICONICS Worldwide Customer Summit - © 2013
Asset Based Application Deployment
Powerful Visualization Capabilities
Advanced Data Calculations and Aggregation
Consumption of EnergyCost of EnergyCarbon FootprintEnergy Analytics
Overview of Energy AnalytiX
Built on the latest Technology Stack
• .NET 4.5• Silverlight 5• 64-bit engine• SQL Server
Stream-Insight
• SharePoint enabled

ICONICS Worldwide Customer Summit - © 2013
Government Facilities
Water and Wastewater Plants
Manufacturing Plants
Processing Plants
Commercial and Corporate Campuses
Educational and Health Care Institutions
It’s Not Only About Buildings
• Asset Based Deployment
• Generic Meter Concept
• Powerful Metadata Concept
• Highly Customizable Calculations
• Flexible data Input
Applications of Energy AnalytiX

ICONICS Worldwide Customer Summit - © 2013
How Does Energy AnalytiX Work?
Organize
Collect
Visualize
Analyze
Configuration• Create Tree Structure• Organize Meters by Physical Location• Define Aggregation and Roll-Up
Connect to BAS• Create Calculation• Consumption• Cost• Normalize
Energy Dashboard• Cost• Consumption• Carbon
Interact with Data• Side-by-Side Charts• Drill Down• Commands
ICONICS Worldwide Customer Summit - © 2013
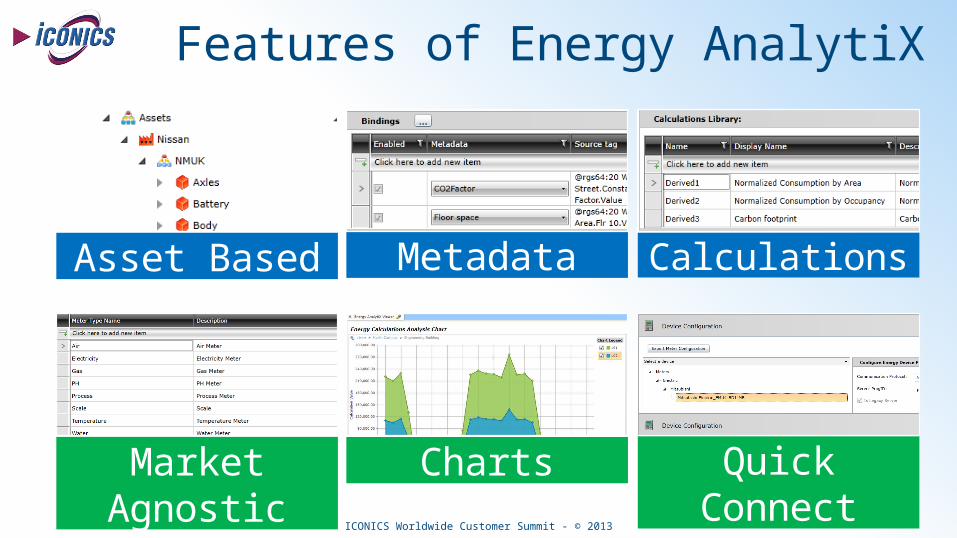
Calculations
Charts
Asset Based
Market Agnostic
Metadata
Quick Connect
Features of Energy AnalytiX

ICONICS Worldwide Customer Summit - © 2013
Enhanced Data Retrieval APINew set of high performance database API to get access to energy data
Quick Connect MetersSimplify energy meter configuration and deployment
New Energy AnalytiX ChartsEasy way to look at Energy Data
New Features for 10.80

ICONICS Worldwide Customer Summit - © 2013
Energy Star ReportsCreate Energy Star compliant reports for Energy usage
Degree Days AnalysisAnalyze energy consumption using weather data
Monitor ViewQuick way to look at application details and diagnostics
New Features for 10.80

ICONICS Worldwide Customer Summit - © 2013
Extensive Charting CapabilityEasy to use
Runtime control panel
Greater visual impact
Drilldown support for assets and time
New Features for 10.80

ICONICS Worldwide Customer Summit - © 2013
Degree Days Analysis
Analyze weather impact
Identify areas to improve
Compare ideal to current data
Reduce energy costs
New Features for 10.80

ICONICS Worldwide Customer Summit - © 2013
Energy Star ReportsEnergy Star compatible reports
Can use ReportWorX or ReportWorX Express
Select energy meters to include in report
Energy Usage
Water Usage
IT Energy Usage
New Features for 10.80

ICONICS Worldwide Customer Summit - © 2013
Quick Connect MetersSimplifies energy meter setup
Template driven using manufacturer data
Generates OPC Server configuration
Modbus support
BACnet support (to come)
New Features for 10.80

ICONICS Worldwide Customer Summit - © 2013
Enhanced Data Retrieval APIEasy way to get data from Energy AnalytiX
Easy way to integrate energy data to enterprise systems
ReportWorX
ReportWorX Express
MS SQL Server Reporting services
Flexible API
Easy to use results
New Features for 10.80

ICONICS Worldwide Customer Summit - © 2013
Monitor View
Look at application load
Review application statistics
Diagnose possible issues
Improve application deployment
New Features for 10.80

ICONICS Worldwide Customer Summit - © 2013
Real Customer Application Experience

ICONICS Worldwide Customer Summit - © 2013
One of North America's largest investors, owners and managers of commercial real estate
Cadillac Fairview
$21 billion Portfolio
76 properties across North America
44 million sq. ft of leasable space

ICONICS Worldwide Customer Summit - © 2013

ICONICS Worldwide Customer Summit - © 2013
Tenants have built out large data centers in their space. They are being charged for
plug load but not being charged for massive heat load being put on building

ICONICS Worldwide Customer Summit - © 2013
Lights being overridden forced
on all night

ICONICS Worldwide Customer Summit - © 2013
Elevators using huge
load all night long

ICONICS Worldwide Customer Summit - © 2013
DemonstrationEnergy Dashboards
Advanced Analysis Tools
Quick-connect Energy Meters
Real World Application

ICONICS Worldwide Customer Summit - © 2013
Data CentresNissan UKSunderland Manufacturing Plant
Cork County CouncilCounty wide water leakage monitoring
MicrosoftPuget Sound Campus
Cadillac FairviewReal-estate management
Who’s using Energy AnalytiX?

ICONICS Worldwide Customer Summit - © 2013
ICONICS has always had open, industry standard protocol support
Data CaptureCalculation engines for data manipulation
IntegrationIndustry leading user experience
VisualizationReporting and visualization from any device
Distribution
OPC, OPC UA, OLEDB, ODBC, BACnet, SNMP, WS
Expression Engine, Unified Data Manager, Hyper-Historian aggregates
GraphWorX64, PortalWorX
WPF, Silverlight, Portal, HTML5 - Android, iOS, WP
Why Choose Energy AnalytiX?

ICONICS Worldwide Customer Summit - © 2013
? Q&A Analyze MobilizeVisualize

ICONICS Worldwide Customer Summit - © 2013
1st Place: Surface Pro
2nd Place: Surface RT
3rd Place: Surface RT
Take the challenge and take the quiz!
Take the quiz at end of each breakout. Top Scores can win a Microsoft Surface Pro or Surface RT Tablet.
Microsoft Surface Pro & Surface RT Prizes
Play to Win at ICONICS 2013 WWCS!Each breakout helps achieve points toward
winning

ICONICS Worldwide Customer Summit - © 2013
Thank You, Sponsors!
PLATINUM PARTNERS
GOLD PARTNERS
Visit our Partner Expo!
ICONICS Worldwide Customer Summit - © 2013
Thank you! Analyze MobilizeVisualize