Embed Size (px)
Citation preview
ICON OFFSHORE BERHAD Analyst Briefing
27 November 2014
Disclosure Statement
1
The information contained in this presentation is for information purposes only and does not constitute an offer or invitation to sell or the solicitation of an offer or invitation to purchase any securities (“Securities”) of Icon Offshore Berhad (“ICON”) in Malaysia, the United States or any other jurisdiction. This presentation should not, nor should anything contained in it, form the basis of, or be relied upon in any connection with any contract or commitment whatsoever. This presentation is confidential and is intended only for the exclusive use of the recipients thereof and may not be reproduced (in whole or in part), retransmitted, summarized or distributed by them to any other persons without ICON's prior written permission This presentation contains forward-looking statements that involve risks and uncertainties. Forward-looking statements are based on certain assumptions and expectations of future events. The future events referred to in these forward-looking statements involve known and unknown risks, uncertainties and other factors, many of which are beyond ICON's control, which may cause the actual results to be materially different from those expressed or implied by the forward-looking statements. These forward-looking statements are based on numerous assumptions regarding ICON's present and future business strategies and the environment in which ICON operates and are not a guarantee of future performance. Any reference to past performance should not be taken as an indication of future performance. ICON makes no representation, warranty or prediction that the results anticipated by such forward-looking statements will be achieved, and such forward-looking statements represent, in each case, only one of many possible scenarios and should not be viewed as the most likely or standard scenario. You are cautioned not to place undue reliance on these forward looking statements, which are based on current view of Icon's management on future events. This presentation has been prepared by ICON. No representation, warranty, express or implied, is made as to, and no reliance should be placed on, the fairness, accuracy, completeness or correctness of the information and opinions in this presentation. Certain data in this presentation was obtained from various external data sources, and ICON has not verified such data with independent sources. None of ICON or any of its directors, officers, employees, agents or advisers, or any of their respective affiliates, advisers or representatives, undertake to update, revise or re-affirm the presentation including any forward-looking statements, whether as a result of new information, future events or otherwise and none of them shall have any liability (in negligence or otherwise) for any loss howsoever arising from any use of this presentation or its contents or otherwise arising in connection with this presentation and any liability therefore (including liability for any direct or indirect consequential loss or damage) is hereby expressly disclaimed and none of them accept any responsibility for any loss or damages howsoever arising, whether directly or indirectly from any use, reliance or distribution of the presentation, its contents or otherwise arising in connection with the prospectus.
Table of contents
1. Industry Outlook
2. Operational Highlights
3. Financial Overview
4. Business Strategies
Appendices
2
1. Industry Outlook
3
Industry trends and leading indicators
4
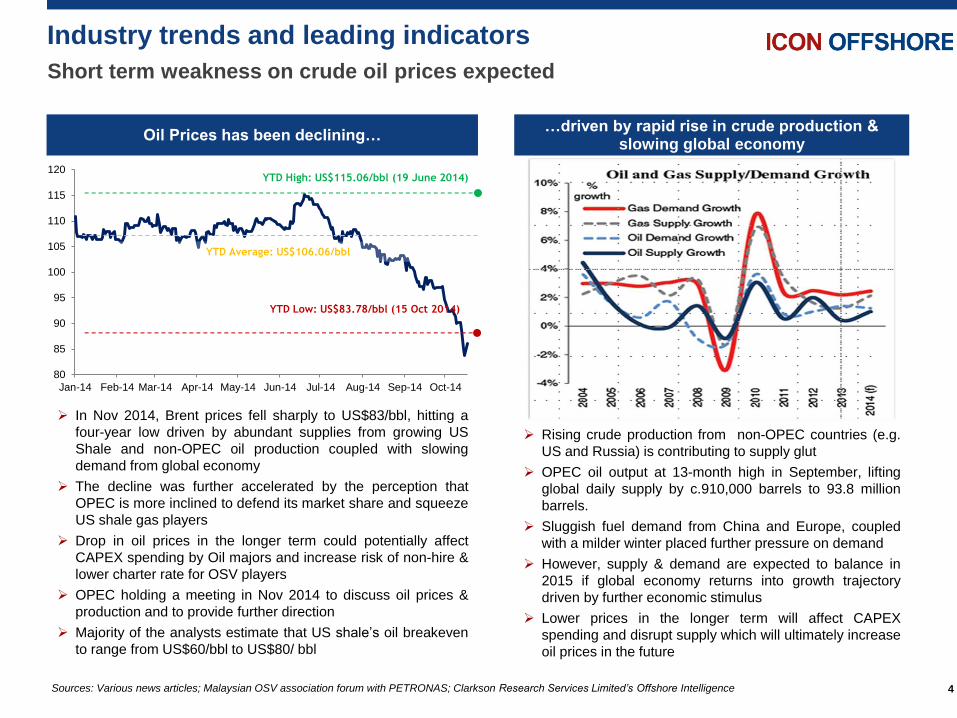
Short term weakness on crude oil prices expected
Oil Prices has been declining…
In Nov 2014, Brent prices fell sharply to US$83/bbl, hitting a
four-year low driven by abundant supplies from growing US
Shale and non-OPEC oil production coupled with slowing
demand from global economy
The decline was further accelerated by the perception that
OPEC is more inclined to defend its market share and squeeze
US shale gas players
Drop in oil prices in the longer term could potentially affect
CAPEX spending by Oil majors and increase risk of non-hire &
lower charter rate for OSV players
OPEC holding a meeting in Nov 2014 to discuss oil prices &
production and to provide further direction
Majority of the analysts estimate that US shale’s oil breakeven
to range from US$60/bbl to US$80/ bbl
…driven by rapid rise in crude production & slowing global economy
Rising crude production from non-OPEC countries (e.g.
US and Russia) is contributing to supply glut
OPEC oil output at 13-month high in September, lifting
global daily supply by c.910,000 barrels to 93.8 million
barrels.
Sluggish fuel demand from China and Europe, coupled
with a milder winter placed further pressure on demand
However, supply & demand are expected to balance in
2015 if global economy returns into growth trajectory
driven by further economic stimulus
Lower prices in the longer term will affect CAPEX
spending and disrupt supply which will ultimately increase
oil prices in the future
80
85
90
95
100
105
110
115
120
Jan-14 Feb-14 Mar-14 Apr-14 May-14 Jun-14 Jul-14 Aug-14 Sep-14 Oct-14
YTD High: US$115.06/bbl (19 June 2014)
YTD Average: US$106.06/bbl
YTD Low: US$83.78/bbl (15 Oct 2014)
Sources: Various news articles; Malaysian OSV association forum with PETRONAS; Clarkson Research Services Limited’s Offshore Intelligence
Production in Malaysia to continue despite signs of weakness in O&G market
5
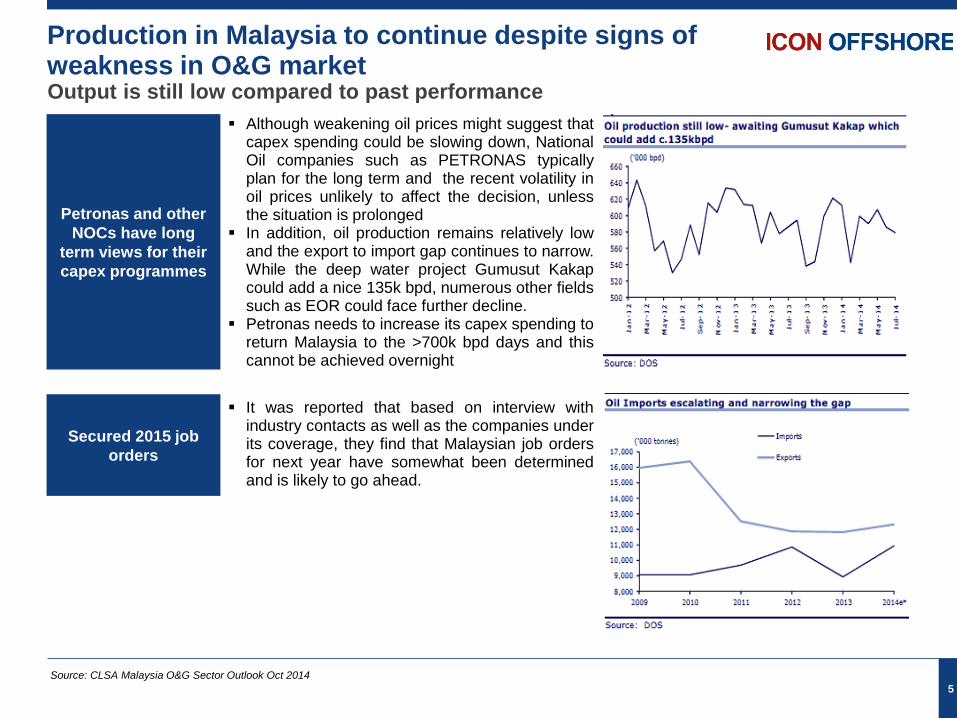
Output is still low compared to past performance
Source: CLSA Malaysia O&G Sector Outlook Oct 2014
Petronas and other
NOCs have long
term views for their
capex programmes
Secured 2015 job
orders
Although weakening oil prices might suggest that capex spending could be slowing down, National Oil companies such as PETRONAS typically plan for the long term and the recent volatility in oil prices unlikely to affect the decision, unless the situation is prolonged
In addition, oil production remains relatively low and the export to import gap continues to narrow. While the deep water project Gumusut Kakap could add a nice 135k bpd, numerous other fields such as EOR could face further decline.
Petronas needs to increase its capex spending to return Malaysia to the >700k bpd days and this cannot be achieved overnight
It was reported that based on interview with industry contacts as well as the companies under its coverage, they find that Malaysian job orders for next year have somewhat been determined and is likely to go ahead.
Old fleets need to be replaced – drilling to continue
6
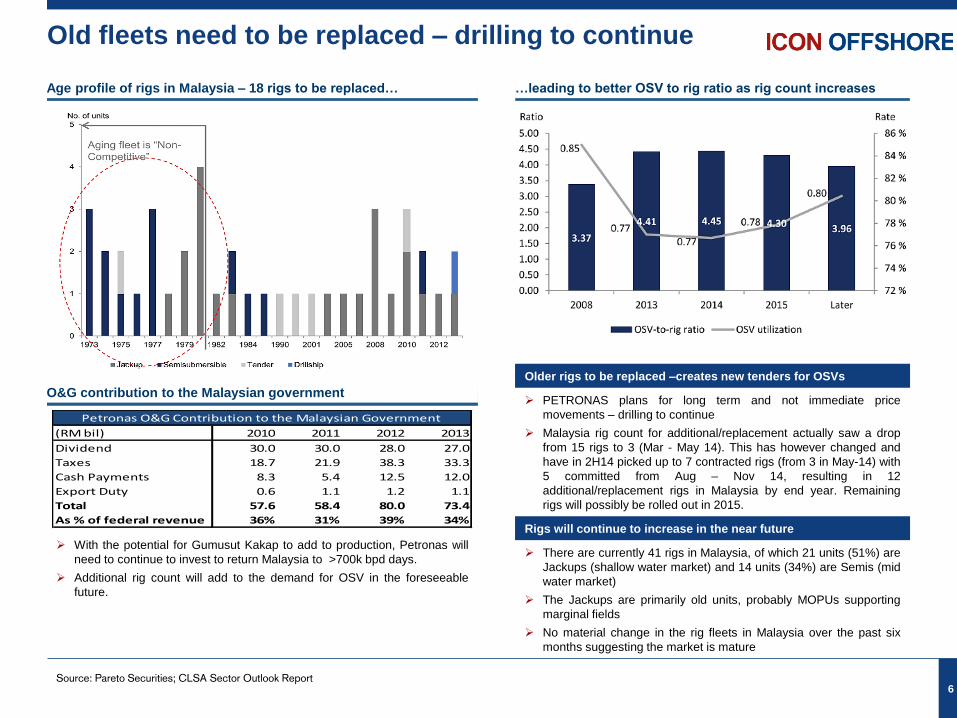
Age profile of rigs in Malaysia – 18 rigs to be replaced… …leading to better OSV to rig ratio as rig count increases
O&G contribution to the Malaysian government
Older rigs to be replaced –creates new tenders for OSVs
PETRONAS plans for long term and not immediate price
movements – drilling to continue
Malaysia rig count for additional/replacement actually saw a drop
from 15 rigs to 3 (Mar - May 14). This has however changed and
have in 2H14 picked up to 7 contracted rigs (from 3 in May-14) with
5 committed from Aug – Nov 14, resulting in 12
additional/replacement rigs in Malaysia by end year. Remaining
rigs will possibly be rolled out in 2015.
Rigs will continue to increase in the near future
There are currently 41 rigs in Malaysia, of which 21 units (51%) are
Jackups (shallow water market) and 14 units (34%) are Semis (mid
water market)
The Jackups are primarily old units, probably MOPUs supporting
marginal fields
No material change in the rig fleets in Malaysia over the past six
months suggesting the market is mature
Source: Pareto Securities; CLSA Sector Outlook Report
(RM bil) 2010 2011 2012 2013
Dividend 30.0 30.0 28.0 27.0
Taxes 18.7 21.9 38.3 33.3
Cash Payments 8.3 5.4 12.5 12.0
Export Duty 0.6 1.1 1.2 1.1
Total 57.6 58.4 80.0 73.4
As % of federal revenue 36% 31% 39% 34%
Petronas O&G Contribution to the Malaysian Government
With the potential for Gumusut Kakap to add to production, Petronas will
need to continue to invest to return Malaysia to >700k bpd days.
Additional rig count will add to the demand for OSV in the foreseeable
future.
Stable day rates for smaller AHTS and some fluctuations in medium dwt PSV
7
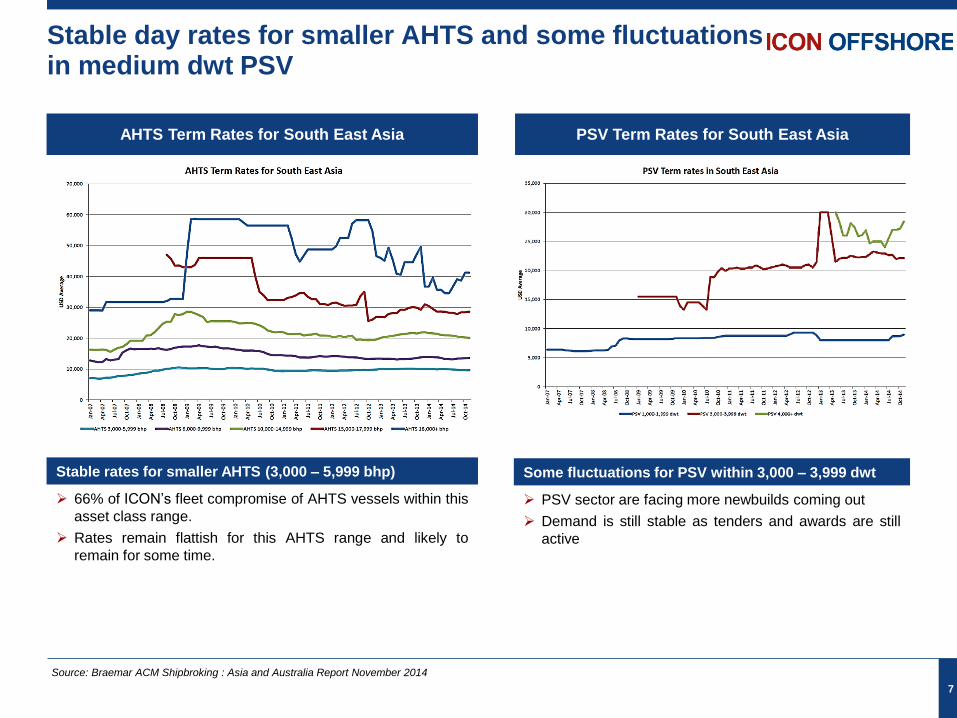
AHTS Term Rates for South East Asia PSV Term Rates for South East Asia
Stable rates for smaller AHTS (3,000 – 5,999 bhp)
66% of ICON’s fleet compromise of AHTS vessels within this
asset class range.
Rates remain flattish for this AHTS range and likely to
remain for some time.
Source: Braemar ACM Shipbroking : Asia and Australia Report November 2014
Some fluctuations for PSV within 3,000 – 3,999 dwt
PSV sector are facing more newbuilds coming out
Demand is still stable as tenders and awards are still
active
2. Operational Highlights
8
Operational Highlights (1/3)
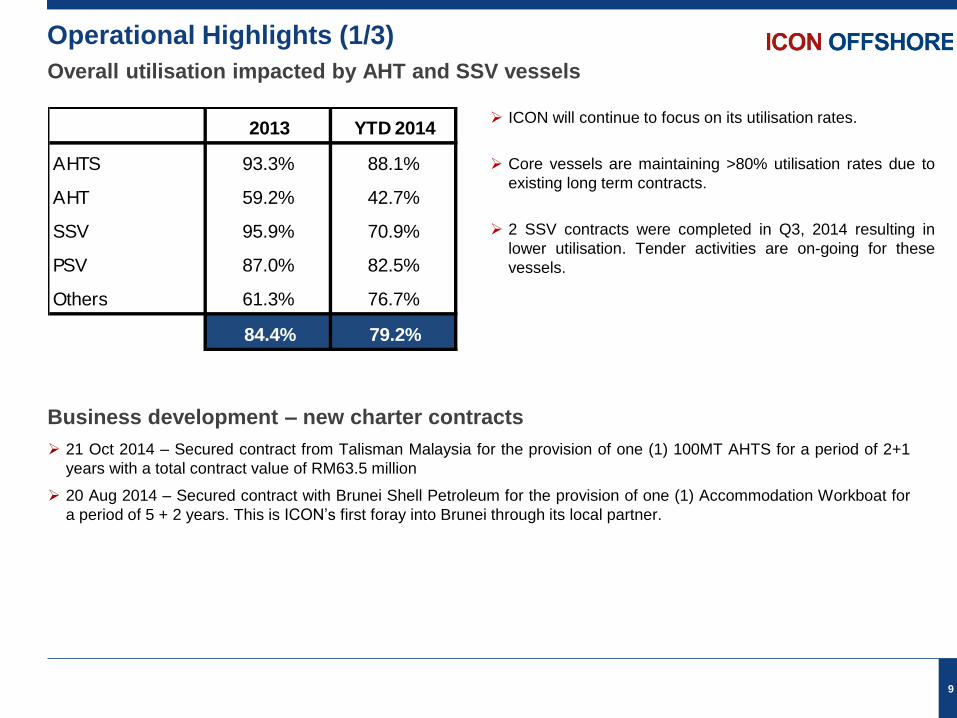
ICON will continue to focus on its utilisation rates.
Core vessels are maintaining >80% utilisation rates due to
existing long term contracts.
2 SSV contracts were completed in Q3, 2014 resulting in
lower utilisation. Tender activities are on-going for these
vessels.
9
Overall utilisation impacted by AHT and SSV vessels
Business development – new charter contracts
21 Oct 2014 – Secured contract from Talisman Malaysia for the provision of one (1) 100MT AHTS for a period of 2+1
years with a total contract value of RM63.5 million
20 Aug 2014 – Secured contract with Brunei Shell Petroleum for the provision of one (1) Accommodation Workboat for
a period of 5 + 2 years. This is ICON’s first foray into Brunei through its local partner.
2013 YTD 2014
AHTS 93.3% 88.1%
AHT 59.2% 42.7%
SSV 95.9% 70.9%
PSV 87.0% 82.5%
Others 61.3% 76.7%
84.4% 79.2%
Operational Highlights (2/3)
10
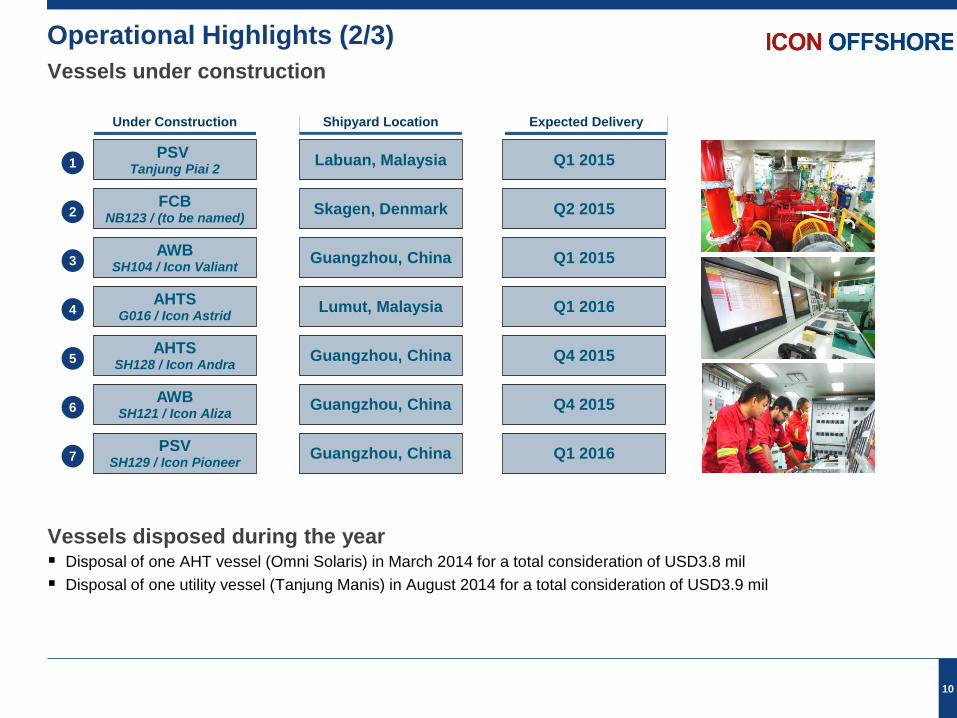
Vessels under construction
PSV Tanjung Piai 2
FCB NB123 / (to be named)
AWB SH104 / Icon Valiant
AHTS G016 / Icon Astrid
AHTS SH128 / Icon Andra
AWB SH121 / Icon Aliza
PSV SH129 / Icon Pioneer
Labuan, Malaysia
Skagen, Denmark
Guangzhou, China
Lumut, Malaysia
Guangzhou, China
Guangzhou, China
Guangzhou, China
Q1 2015
Q2 2015
Q1 2015
Q1 2016
Q4 2015
Q4 2015
Q1 2016
Under Construction Shipyard Location Expected Delivery
3
1
2
4
5
6
7
Disposal of one AHT vessel (Omni Solaris) in March 2014 for a total consideration of USD3.8 mil
Disposal of one utility vessel (Tanjung Manis) in August 2014 for a total consideration of USD3.9 mil
Vessels disposed during the year
Operational Highlights (3/3)
11
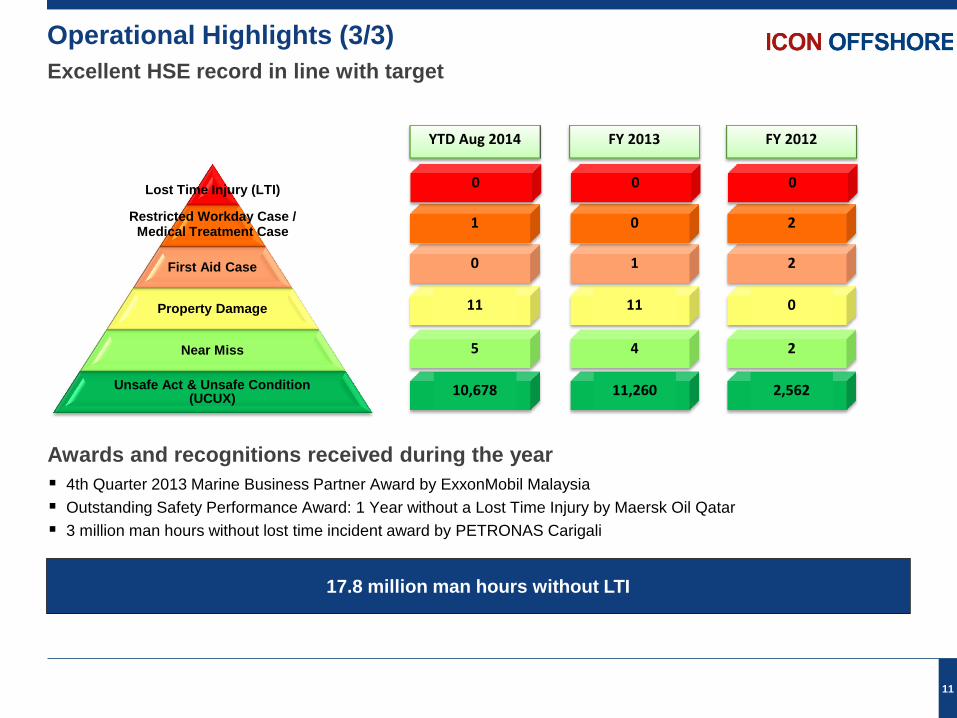
Excellent HSE record in line with target
4th Quarter 2013 Marine Business Partner Award by ExxonMobil Malaysia
Outstanding Safety Performance Award: 1 Year without a Lost Time Injury by Maersk Oil Qatar
3 million man hours without lost time incident award by PETRONAS Carigali
Awards and recognitions received during the year
17.8 million man hours without LTI
First Aid Case
Property Damage
Near Miss
Unsafe Act & Unsafe Condition (UCUX)
Restricted Workday Case / Medical Treatment Case
Lost Time Injury (LTI)
10,678
5
11
0
1
0
11,260
4
11
1
0
0
YTD Aug 2014 FY 2013
2,562
2
0
2
2
0
FY 2012
3. Financial Overview
12
Key takeaways
13
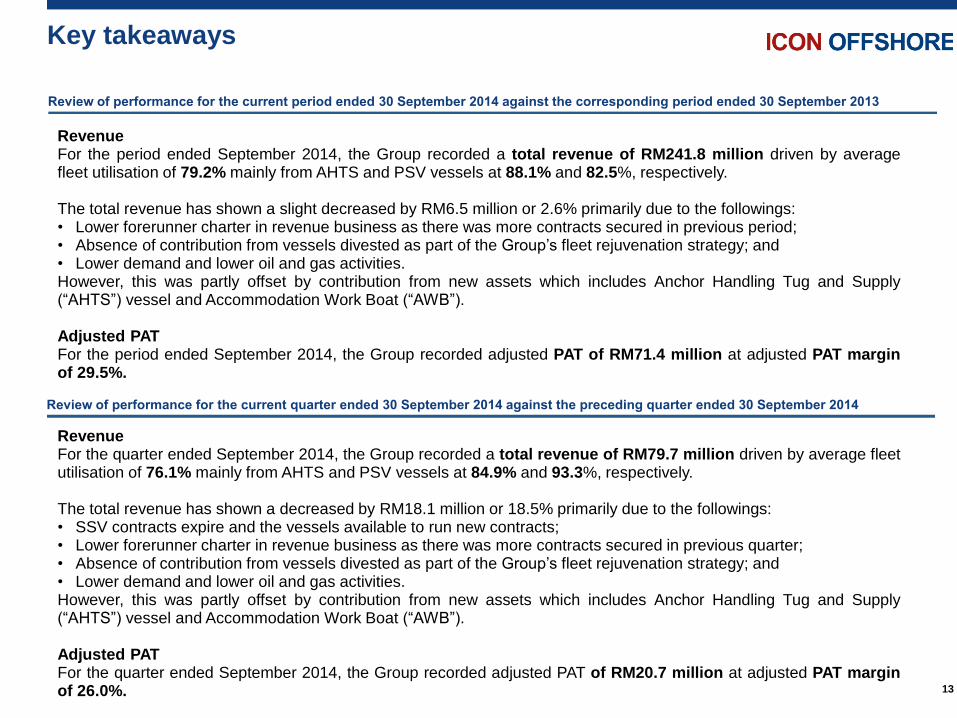
Review of performance for the current period ended 30 September 2014 against the corresponding period ended 30 September 2013
Review of performance for the current quarter ended 30 September 2014 against the preceding quarter ended 30 September 2014
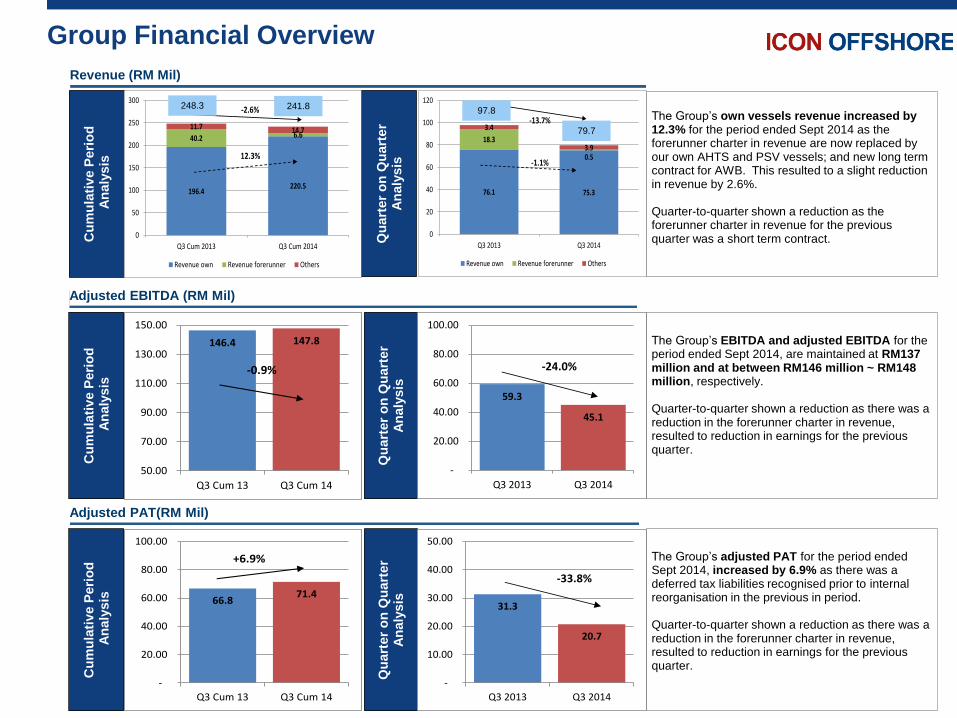
Revenue For the period ended September 2014, the Group recorded a total revenue of RM241.8 million driven by average fleet utilisation of 79.2% mainly from AHTS and PSV vessels at 88.1% and 82.5%, respectively. The total revenue has shown a slight decreased by RM6.5 million or 2.6% primarily due to the followings: • Lower forerunner charter in revenue business as there was more contracts secured in previous period; • Absence of contribution from vessels divested as part of the Group’s fleet rejuvenation strategy; and • Lower demand and lower oil and gas activities. However, this was partly offset by contribution from new assets which includes Anchor Handling Tug and Supply (“AHTS”) vessel and Accommodation Work Boat (“AWB”). Adjusted PAT For the period ended September 2014, the Group recorded adjusted PAT of RM71.4 million at adjusted PAT margin of 29.5%.
Revenue For the quarter ended September 2014, the Group recorded a total revenue of RM79.7 million driven by average fleet utilisation of 76.1% mainly from AHTS and PSV vessels at 84.9% and 93.3%, respectively. The total revenue has shown a decreased by RM18.1 million or 18.5% primarily due to the followings: • SSV contracts expire and the vessels available to run new contracts; • Lower forerunner charter in revenue business as there was more contracts secured in previous quarter; • Absence of contribution from vessels divested as part of the Group’s fleet rejuvenation strategy; and • Lower demand and lower oil and gas activities. However, this was partly offset by contribution from new assets which includes Anchor Handling Tug and Supply (“AHTS”) vessel and Accommodation Work Boat (“AWB”). Adjusted PAT For the quarter ended September 2014, the Group recorded adjusted PAT of RM20.7 million at adjusted PAT margin of 26.0%.
Group Financial Overview
Revenue (RM Mil)
Qu
art
er
on
Qu
art
er
An
aly
sis
Cu
mu
lati
ve P
eri
od
A
naly
sis
Adjusted EBITDA (RM Mil)
Qu
art
er
on
Qu
art
er
An
aly
sis
59.3
45.1
-
20.00
40.00
60.00
80.00
100.00
Q3 2013 Q3 2014
-24.0%
Cu
mu
lati
ve P
eri
od
A
naly
sis
146.4 147.8
50.00
70.00
90.00
110.00
130.00
150.00
Q3 Cum 13 Q3 Cum 14
-0.9%Q
uart
er
on
Qu
art
er
An
aly
sis
Adjusted PAT(RM Mil)
31.3
20.7
-
10.00
20.00
30.00
40.00
50.00
Q3 2013 Q3 2014
-33.8%
Cu
mu
lati
ve P
eri
od
A
naly
sis
66.871.4
-
20.00
40.00
60.00
80.00
100.00
Q3 Cum 13 Q3 Cum 14
+6.9%
196.4220.5
40.2 6.611.7 14.7
0
50
100
150
200
250
300
Q3 Cum 2013 Q3 Cum 2014
Revenue own Revenue forerunner Others
12.3%
-2.6%
76.1 75.3
18.3
0.5
3.4
3.9
0
20
40
60
80
100
120
Q3 2013 Q3 2014
Revenue own Revenue forerunner Others
-1.1%
-13.7%97.8
79.7
The Group’s own vessels revenue increased by 12.3% for the period ended Sept 2014 as the forerunner charter in revenue are now replaced by our own AHTS and PSV vessels; and new long term contract for AWB. This resulted to a slight reduction in revenue by 2.6%. Quarter-to-quarter shown a reduction as the forerunner charter in revenue for the previous quarter was a short term contract.
The Group’s EBITDA and adjusted EBITDA for the period ended Sept 2014, are maintained at RM137 million and at between RM146 million ~ RM148 million, respectively. Quarter-to-quarter shown a reduction as there was a reduction in the forerunner charter in revenue, resulted to reduction in earnings for the previous quarter.
The Group’s adjusted PAT for the period ended Sept 2014, increased by 6.9% as there was a deferred tax liabilities recognised prior to internal reorganisation in the previous in period. Quarter-to-quarter shown a reduction as there was a reduction in the forerunner charter in revenue, resulted to reduction in earnings for the previous quarter.
248.3 241.8
Q32014
Malaysia
Brunei
Qatar
Vietnam
Others
Q32013
Malaysia
Brunei
Qatar
Vietnam
Others
Business Segment Financial Overview
15
Revenue/Utilisation by Vessel Type (RM Mil) Revenue by Geography (RM Mil)
EBITDA by Geography (RM Mil)
-
10,000
20,000
30,000
40,000
50,000
60,000
70,000
Q32013 Q32014
Malaysia
Brunei
Qatar
Vietnam
Others
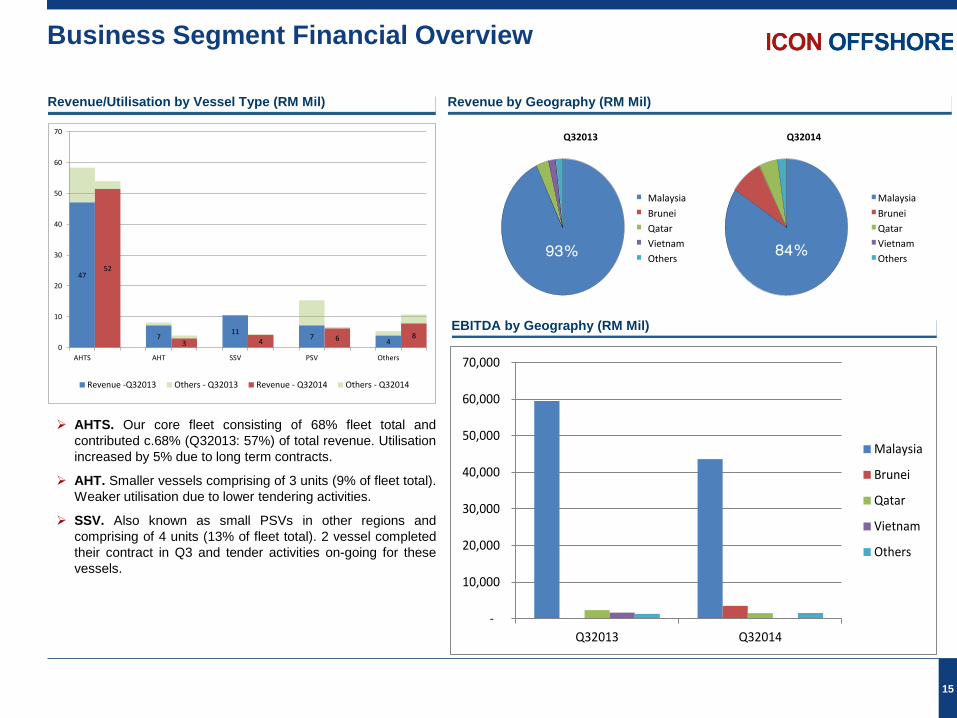
AHTS. Our core fleet consisting of 68% fleet total and
contributed c.68% (Q32013: 57%) of total revenue. Utilisation
increased by 5% due to long term contracts.
AHT. Smaller vessels comprising of 3 units (9% of fleet total).
Weaker utilisation due to lower tendering activities.
SSV. Also known as small PSVs in other regions and
comprising of 4 units (13% of fleet total). 2 vessel completed
their contract in Q3 and tender activities on-going for these
vessels.
47
711
74
52
3 4 6 8
0
10
20
30
40
50
60
70
AHTS AHT SSV PSV Others
Revenue -Q32013 Others - Q32013 Revenue - Q32014 Others - Q32014
93% 84%
Leverage & Capitalisation
16
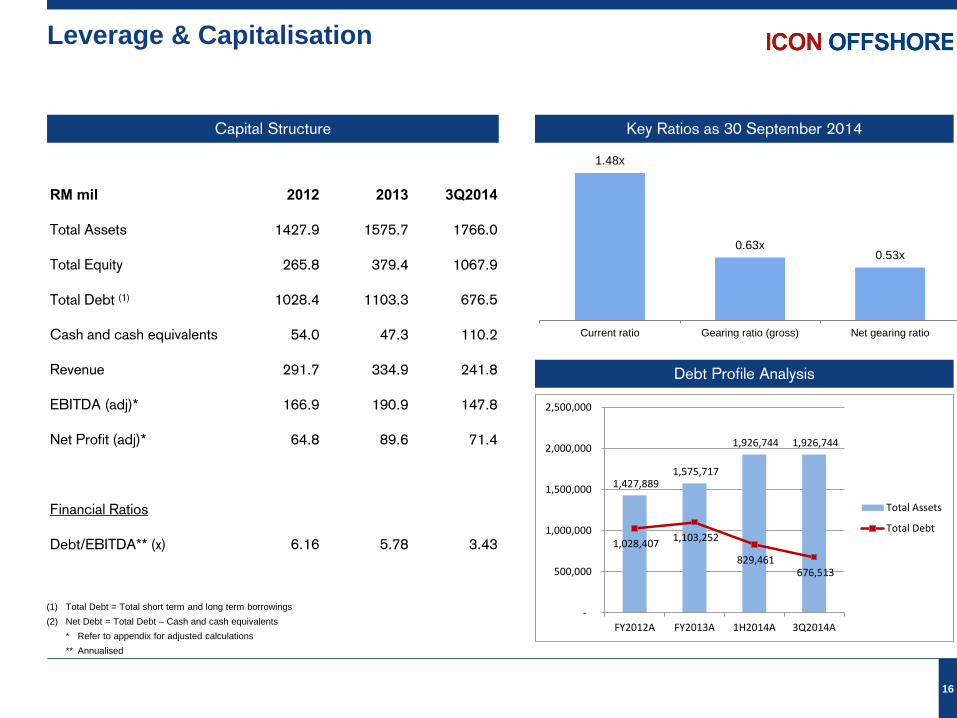
RM mil 2012 2013 3Q2014
Total Assets 1427.9 1575.7 1766.0
Total Equity 265.8 379.4 1067.9
Total Debt (1) 1028.4 1103.3 676.5
Cash and cash equivalents 54.0 47.3 110.2
Revenue 291.7 334.9 241.8
EBITDA (adj)* 166.9 190.9 147.8
Net Profit (adj)* 64.8 89.6 71.4
Financial Ratios
Debt/EBITDA** (x) 6.16 5.78 3.43
(1) Total Debt = Total short term and long term borrowings
(2) Net Debt = Total Debt – Cash and cash equivalents
* Refer to appendix for adjusted calculations
** Annualised
Debt Profile Analysis
1.48x
0.63x 0.53x
Current ratio Gearing ratio (gross) Net gearing ratio
Key Ratios as 30 September 2014 Capital Structure
1,427,889 1,575,717
1,926,744 1,926,744
1,028,407 1,103,252
829,461 676,513
-
500,000
1,000,000
1,500,000
2,000,000
2,500,000
FY2012A FY2013A 1H2014A 3Q2014A
Total Assets
Total Debt
4. Business Strategies
17
Business Strategies
18
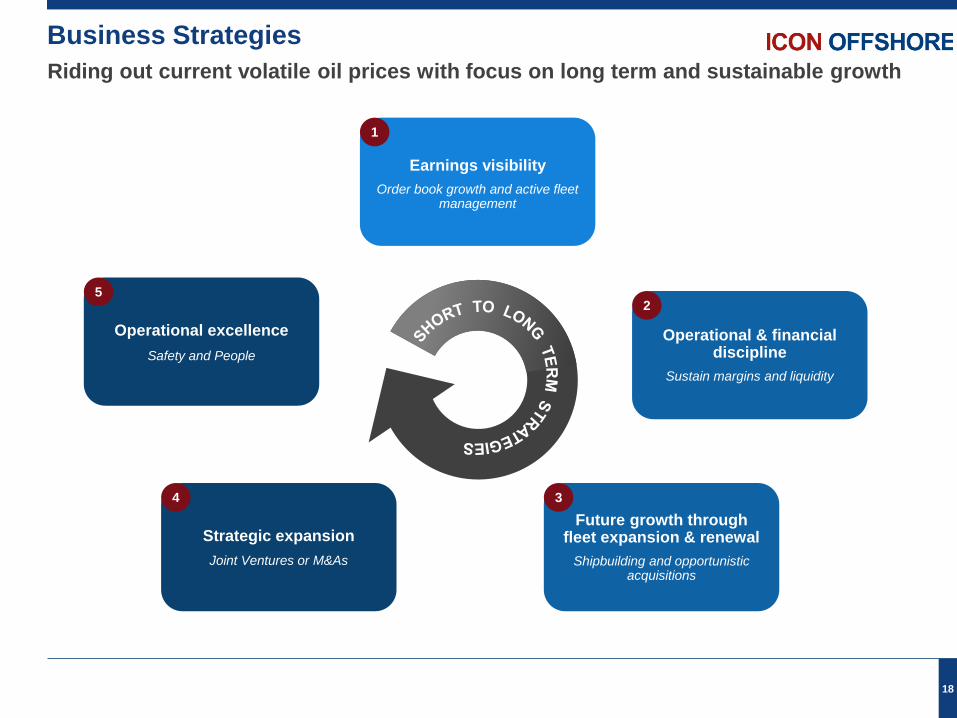
Riding out current volatile oil prices with focus on long term and sustainable growth
Earnings visibility
Order book growth and active fleet management
Operational & financial discipline
Sustain margins and liquidity
Future growth through fleet expansion & renewal
Shipbuilding and opportunistic acquisitions
Strategic expansion
Joint Ventures or M&As
Operational excellence
Safety and People
1
2
3 4
5
Earnings visibility
19
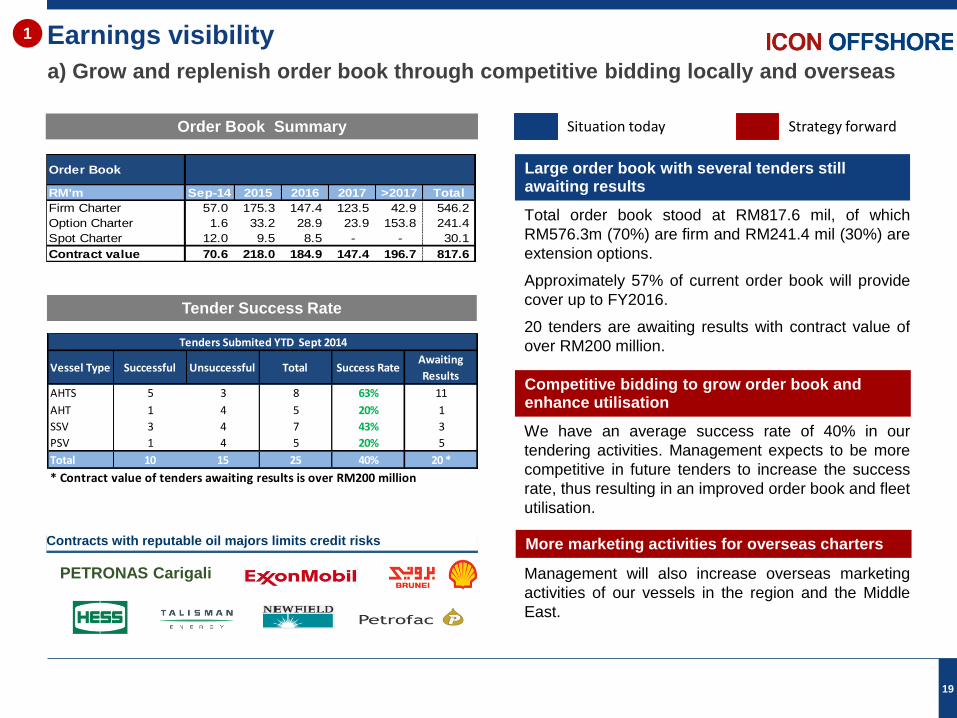
a) Grow and replenish order book through competitive bidding locally and overseas
1
Order Book Summary
Tender Success Rate
Situation today Strategy forward
Large order book with several tenders still awaiting results
Total order book stood at RM817.6 mil, of which
RM576.3m (70%) are firm and RM241.4 mil (30%) are
extension options.
Approximately 57% of current order book will provide
cover up to FY2016.
20 tenders are awaiting results with contract value of
over RM200 million.
Competitive bidding to grow order book and enhance utilisation
We have an average success rate of 40% in our
tendering activities. Management expects to be more
competitive in future tenders to increase the success
rate, thus resulting in an improved order book and fleet
utilisation.
More marketing activities for overseas charters
Management will also increase overseas marketing
activities of our vessels in the region and the Middle
East.
Vessel Type Successful Unsuccessful Total Success RateAwaiting
Results
AHTS 5 3 8 63% 11
AHT 1 4 5 20% 1
SSV 3 4 7 43% 3
PSV 1 4 5 20% 5
Total 10 15 25 40% 20 *
* Contract value of tenders awaiting results is over RM200 million
Tenders Submited YTD Sept 2014
Contracts with reputable oil majors limits credit risks
PETRONAS Carigali
Order Book
RM'm Sep-14 2015 2016 2017 >2017 Total
Firm Charter 57.0 175.3 147.4 123.5 42.9 546.2
Option Charter 1.6 33.2 28.9 23.9 153.8 241.4
Spot Charter 12.0 9.5 8.5 - - 30.1
Contract value 70.6 218.0 184.9 147.4 196.7 817.6
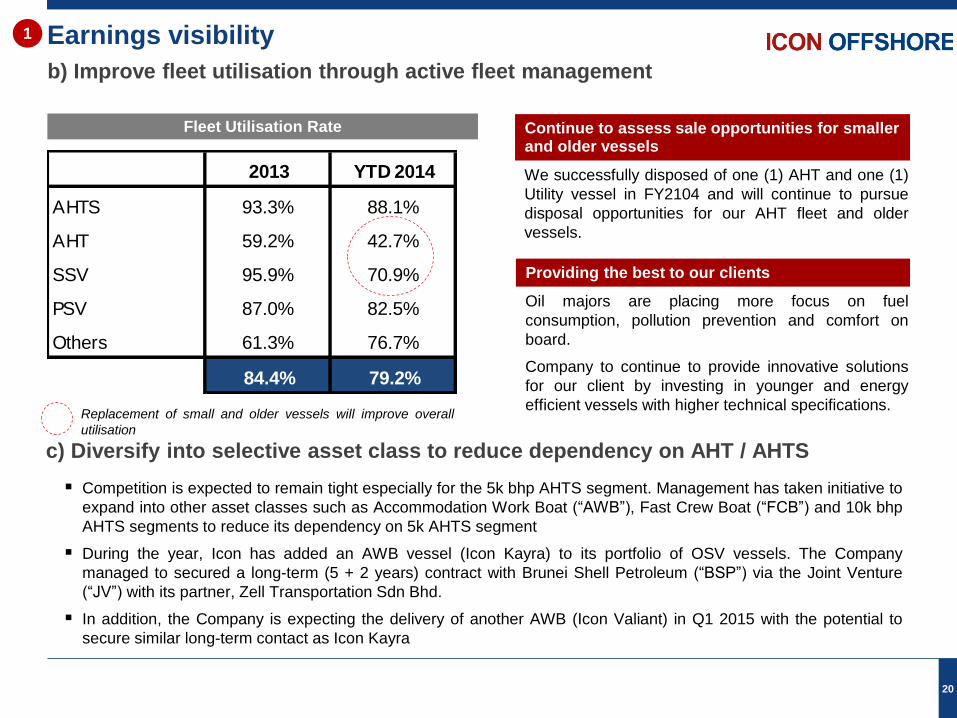
2013 YTD 2014
AHTS 93.3% 88.1%
AHT 59.2% 42.7%
SSV 95.9% 70.9%
PSV 87.0% 82.5%
Others 61.3% 76.7%
84.4% 79.2%
Earnings visibility
20
b) Improve fleet utilisation through active fleet management
1
Continue to assess sale opportunities for smaller and older vessels
We successfully disposed of one (1) AHT and one (1)
Utility vessel in FY2104 and will continue to pursue
disposal opportunities for our AHT fleet and older
vessels.
Fleet Utilisation Rate
Providing the best to our clients
Oil majors are placing more focus on fuel
consumption, pollution prevention and comfort on
board.
Company to continue to provide innovative solutions
for our client by investing in younger and energy
efficient vessels with higher technical specifications. Replacement of small and older vessels will improve overall
utilisation
c) Diversify into selective asset class to reduce dependency on AHT / AHTS
Competition is expected to remain tight especially for the 5k bhp AHTS segment. Management has taken initiative to
expand into other asset classes such as Accommodation Work Boat (“AWB”), Fast Crew Boat (“FCB”) and 10k bhp
AHTS segments to reduce its dependency on 5k AHTS segment
During the year, Icon has added an AWB vessel (Icon Kayra) to its portfolio of OSV vessels. The Company
managed to secured a long-term (5 + 2 years) contract with Brunei Shell Petroleum (“BSP”) via the Joint Venture
(“JV”) with its partner, Zell Transportation Sdn Bhd.
In addition, the Company is expecting the delivery of another AWB (Icon Valiant) in Q1 2015 with the potential to
secure similar long-term contact as Icon Kayra
Operational and financial discipline
21
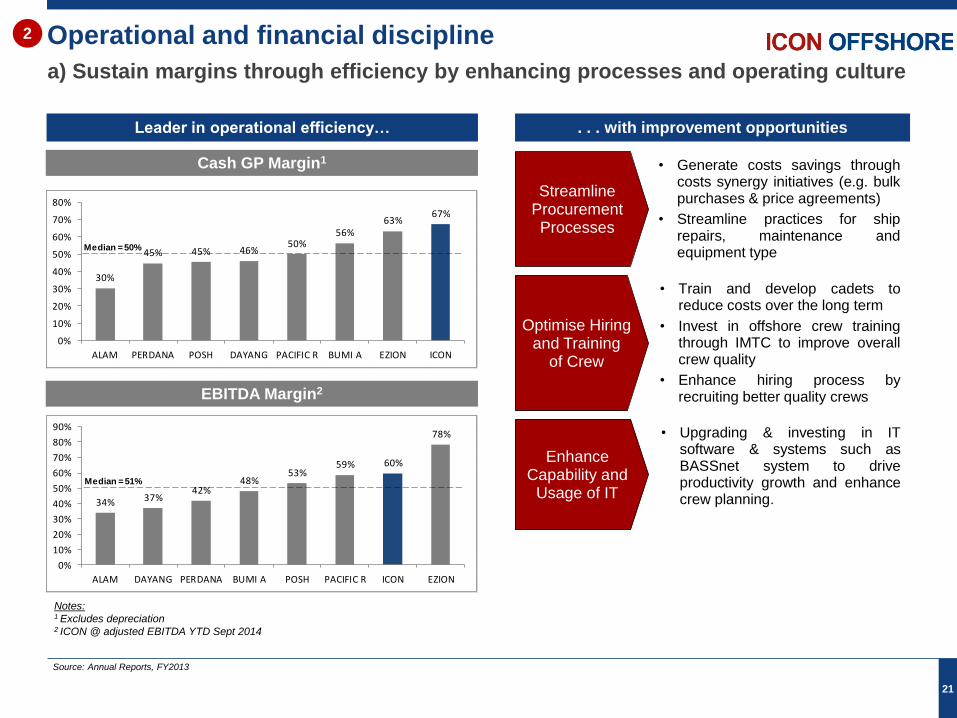
a) Sustain margins through efficiency by enhancing processes and operating culture
Streamline Procurement Processes
Enhance Capability and
Usage of IT
Optimise Hiring and Training
of Crew
• Generate costs savings through costs synergy initiatives (e.g. bulk purchases & price agreements)
• Streamline practices for ship repairs, maintenance and equipment type
• Train and develop cadets to reduce costs over the long term
• Invest in offshore crew training through IMTC to improve overall crew quality
• Enhance hiring process by recruiting better quality crews
Leader in operational efficiency… . . . with improvement opportunities
• Upgrading & investing in IT software & systems such as BASSnet system to drive productivity growth and enhance crew planning.
2
Cash GP Margin1
EBITDA Margin2
Source: Annual Reports, FY2013
Notes: 1 Excludes depreciation 2 ICON @ adjusted EBITDA YTD Sept 2014
30%
45% 45% 46%50%
56%63%
67%
0%
10%
20%
30%
40%
50%
60%
70%
80%
ALAM PERDANA POSH DAYANG PACIFIC R BUMI A EZION ICON
Median = 50%
34% 37%42%
48%53%
59% 60%
78%
0%
10%
20%
30%
40%
50%
60%
70%
80%
90%
ALAM DAYANG PERDANA BUMI A POSH PACIFIC R ICON EZION
Median = 51%
Operational and financial discipline
22
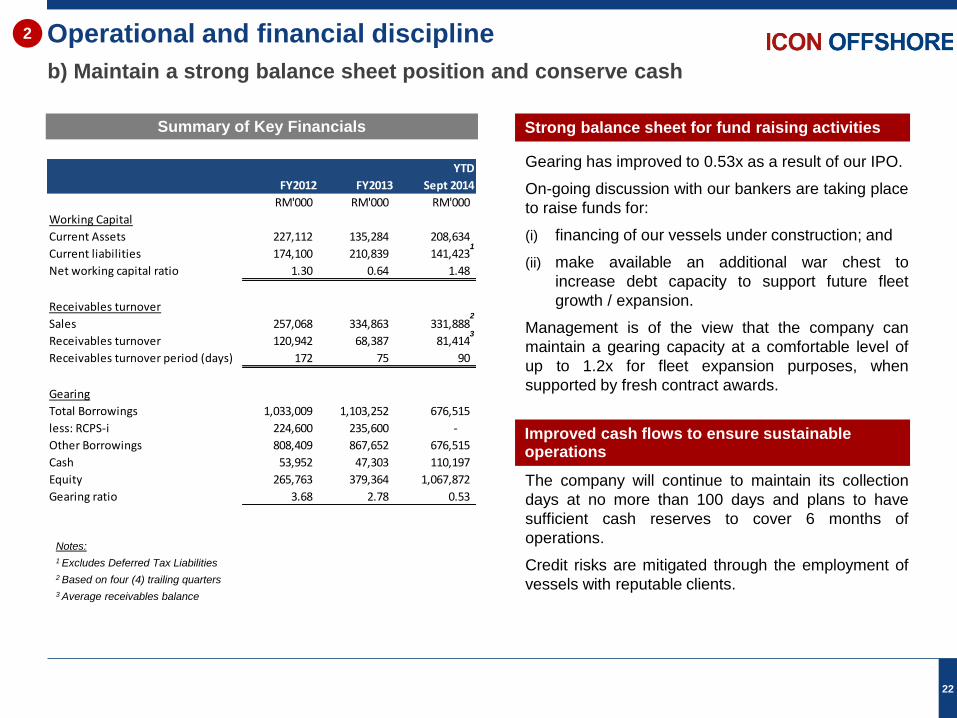
b) Maintain a strong balance sheet position and conserve cash
Summary of Key Financials
Improved cash flows to ensure sustainable operations
The company will continue to maintain its collection
days at no more than 100 days and plans to have
sufficient cash reserves to cover 6 months of
operations.
Credit risks are mitigated through the employment of
vessels with reputable clients.
Strong balance sheet for fund raising activities
Gearing has improved to 0.53x as a result of our IPO.
On-going discussion with our bankers are taking place
to raise funds for:
(i) financing of our vessels under construction; and
(ii) make available an additional war chest to
increase debt capacity to support future fleet
growth / expansion.
Management is of the view that the company can
maintain a gearing capacity at a comfortable level of
up to 1.2x for fleet expansion purposes, when
supported by fresh contract awards.
2
Notes:
1 Excludes Deferred Tax Liabilities
2 Based on four (4) trailing quarters
3 Average receivables balance
1
2
3
FY2012 FY2013
YTD
Sept 2014
RM'000 RM'000 RM'000
Working Capital
Current Assets 227,112 135,284 208,634
Current liabilities 174,100 210,839 141,423
Net working capital ratio 1.30 0.64 1.48
Receivables turnover
Sales 257,068 334,863 331,888
Receivables turnover 120,942 68,387 81,414
Receivables turnover period (days) 172 75 90
Gearing
Total Borrowings 1,033,009 1,103,252 676,515
less: RCPS-i 224,600 235,600 -
Other Borrowings 808,409 867,652 676,515
Cash 53,952 47,303 110,197
Equity 265,763 379,364 1,067,872
Gearing ratio 3.68 2.78 0.53
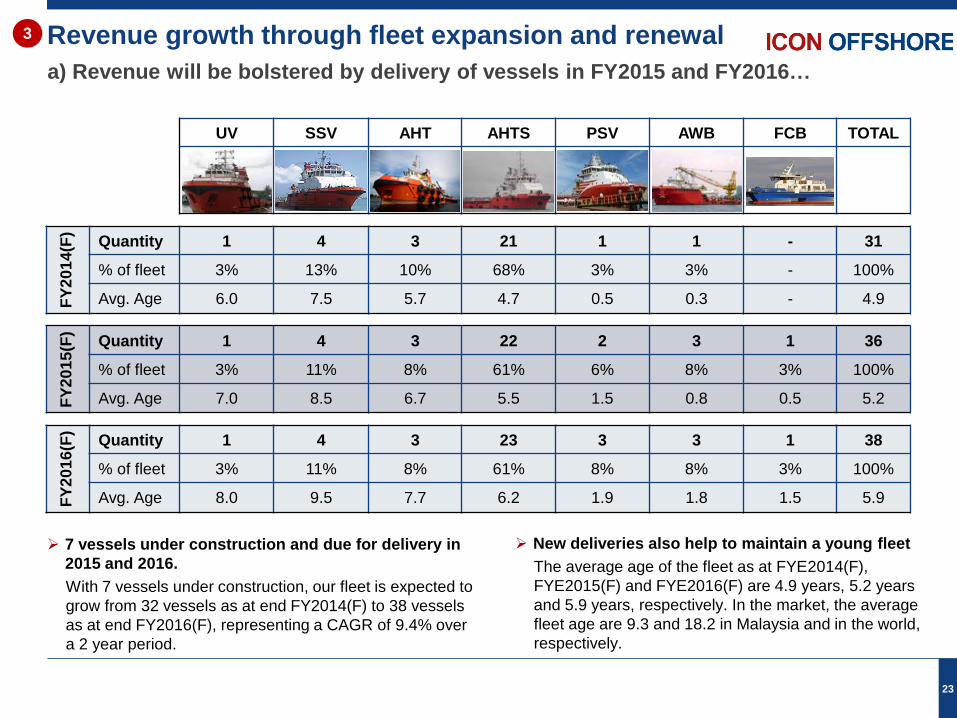
Revenue growth through fleet expansion and renewal
UV SSV AHT AHTS PSV AWB FCB TOTAL
FY
20
14
(F)
Quantity 1 4 3 21 1 1 - 31
% of fleet 3% 13% 10% 68% 3% 3% - 100%
Avg. Age 6.0 7.5 5.7 4.7 0.5 0.3 - 4.9
FY
20
15
(F)
Quantity 1 4 3 22 2 3 1 36
% of fleet 3% 11% 8% 61% 6% 8% 3% 100%
Avg. Age 7.0 8.5 6.7 5.5 1.5 0.8 0.5 5.2
FY
20
16
(F)
Quantity 1 4 3 23 3 3 1 38
% of fleet 3% 11% 8% 61% 8% 8% 3% 100%
Avg. Age 8.0 9.5 7.7 6.2 1.9 1.8 1.5 5.9
23
a) Revenue will be bolstered by delivery of vessels in FY2015 and FY2016…
7 vessels under construction and due for delivery in
2015 and 2016.
With 7 vessels under construction, our fleet is expected to
grow from 32 vessels as at end FY2014(F) to 38 vessels
as at end FY2016(F), representing a CAGR of 9.4% over
a 2 year period.
New deliveries also help to maintain a young fleet
The average age of the fleet as at FYE2014(F),
FYE2015(F) and FYE2016(F) are 4.9 years, 5.2 years
and 5.9 years, respectively. In the market, the average
fleet age are 9.3 and 18.2 in Malaysia and in the world,
respectively.
3
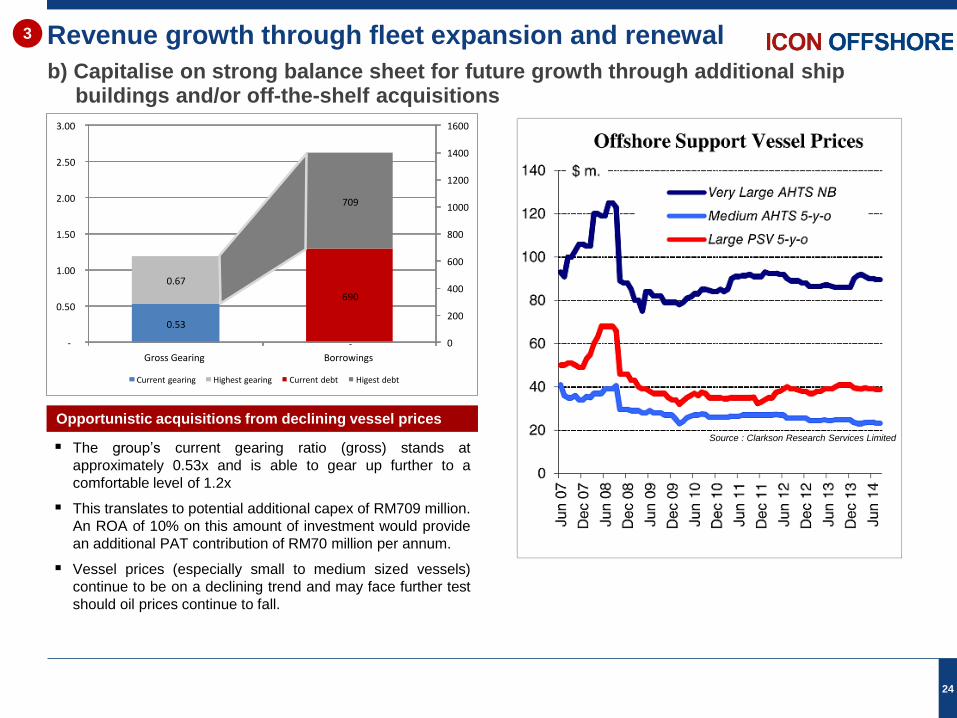
The group’s current gearing ratio (gross) stands at
approximately 0.53x and is able to gear up further to a
comfortable level of 1.2x
This translates to potential additional capex of RM709 million.
An ROA of 10% on this amount of investment would provide
an additional PAT contribution of RM70 million per annum.
Vessel prices (especially small to medium sized vessels)
continue to be on a declining trend and may face further test
should oil prices continue to fall.
Revenue growth through fleet expansion and renewal
24
b) Capitalise on strong balance sheet for future growth through additional ship buildings and/or off-the-shelf acquisitions
Source : Clarkson Research Services Limited
3
Opportunistic acquisitions from declining vessel prices
0.53
0.67
-
690
709
0
200
400
600
800
1000
1200
1400
1600
-
0.50
1.00
1.50
2.00
2.50
3.00
Gross Gearing Borrowings
Current gearing Highest gearing Current debt Higest debt
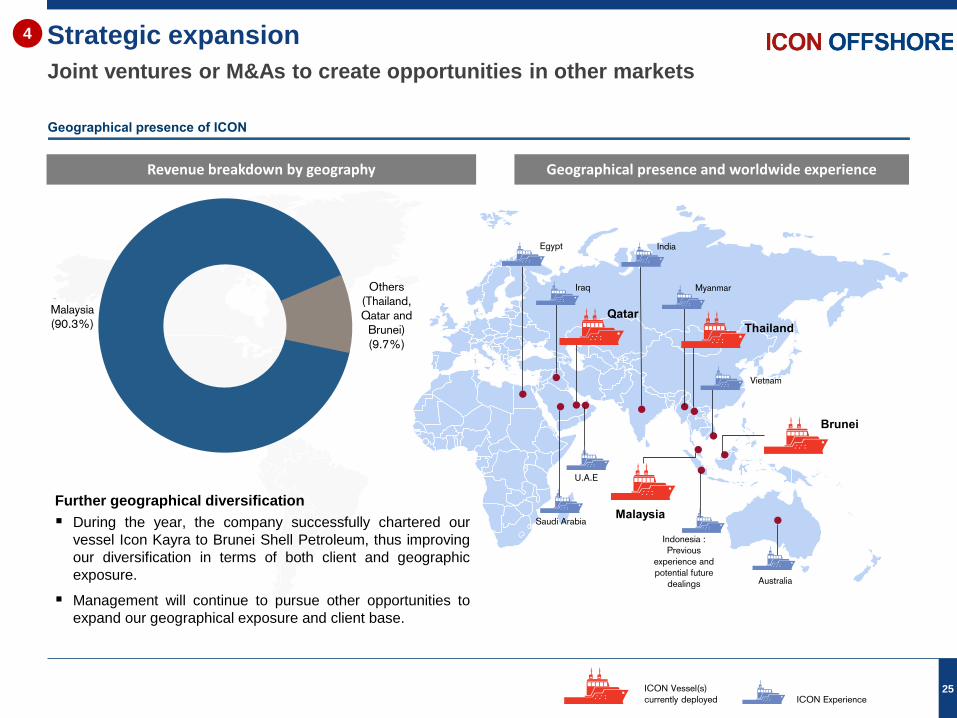
Strategic expansion
25
Joint ventures or M&As to create opportunities in other markets
Geographical presence of ICON
4
Revenue breakdown by geography Geographical presence and worldwide experience
ICON Vessel(s)
currently deployed ICON Experience
Malaysia
(90.3%)
Others
(Thailand,
Qatar and
Brunei)
(9.7%)
Egypt
Saudi Arabia Malaysia
Indonesia :
Previous
experience and
potential future
dealings Australia
India
U.A.E
Iraq Myanmar
Qatar
Thailand
Vietnam
Brunei
Further geographical diversification
During the year, the company successfully chartered our
vessel Icon Kayra to Brunei Shell Petroleum, thus improving
our diversification in terms of both client and geographic
exposure.
Management will continue to pursue other opportunities to
expand our geographical exposure and client base.
Operational excellence
26
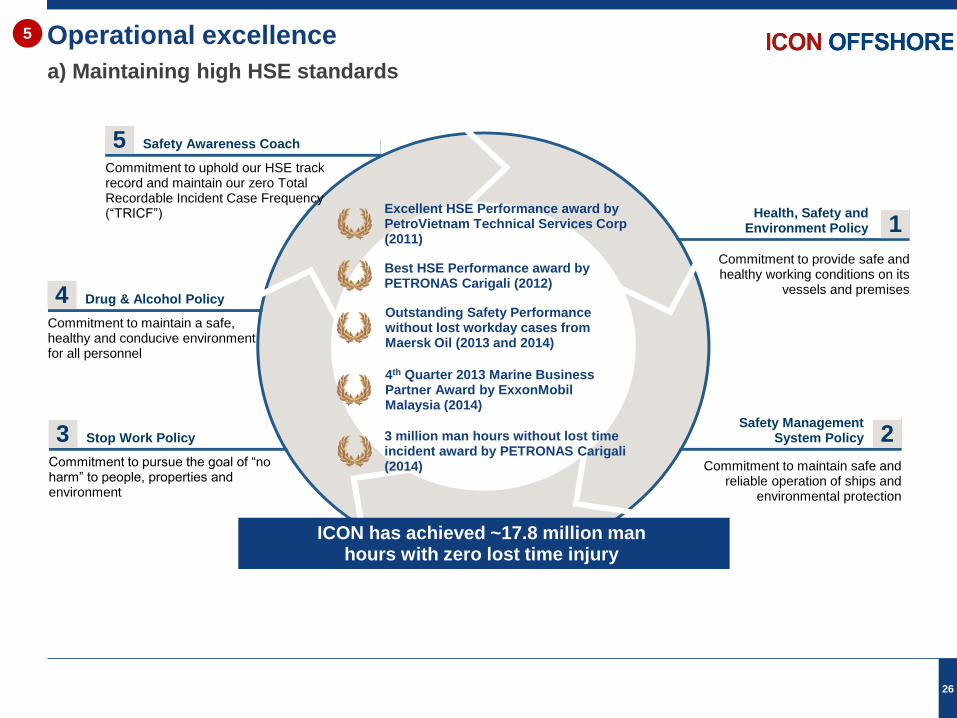
a) Maintaining high HSE standards
Drug & Alcohol Policy
Safety Management System Policy
Health, Safety and Environment Policy
4
1
2
Commitment to maintain a safe, healthy and conducive environment for all personnel
Commitment to provide safe and healthy working conditions on its
vessels and premises
Commitment to maintain safe and reliable operation of ships and
environmental protection
Stop Work Policy 3 Commitment to pursue the goal of “no harm” to people, properties and environment
Best HSE Performance award by PETRONAS Carigali (2012)
Outstanding Safety Performance without lost workday cases from Maersk Oil (2013 and 2014)
Excellent HSE Performance award by PetroVietnam Technical Services Corp (2011)
ICON has achieved ~17.8 million man hours with zero lost time injury
4th Quarter 2013 Marine Business Partner Award by ExxonMobil Malaysia (2014)
3 million man hours without lost time incident award by PETRONAS Carigali (2014)
Safety Awareness Coach 5 Commitment to uphold our HSE track record and maintain our zero Total Recordable Incident Case Frequency (“TRICF”)
5
Operational excellence
27
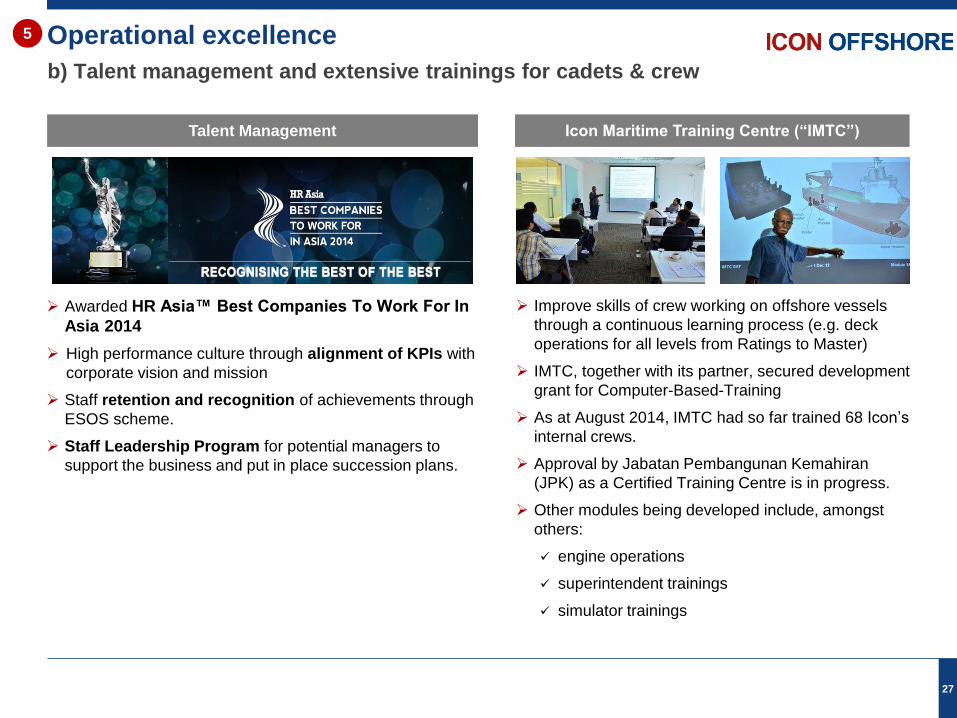
b) Talent management and extensive trainings for cadets & crew
Talent Management Icon Maritime Training Centre (“IMTC”)
Awarded HR Asia™ Best Companies To Work For In
Asia 2014
High performance culture through alignment of KPIs with
corporate vision and mission
Staff retention and recognition of achievements through
ESOS scheme.
Staff Leadership Program for potential managers to
support the business and put in place succession plans.
Improve skills of crew working on offshore vessels
through a continuous learning process (e.g. deck
operations for all levels from Ratings to Master)
IMTC, together with its partner, secured development
grant for Computer-Based-Training
As at August 2014, IMTC had so far trained 68 Icon’s
internal crews.
Approval by Jabatan Pembangunan Kemahiran
(JPK) as a Certified Training Centre is in progress.
Other modules being developed include, amongst
others:
engine operations
superintendent trainings
simulator trainings
5
Appendices
28
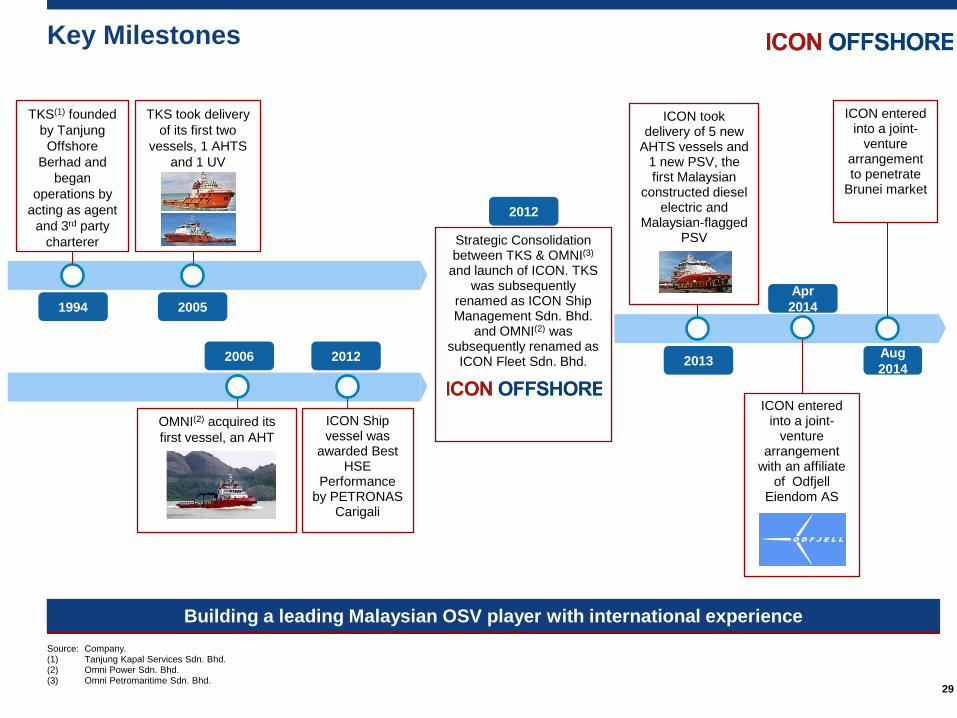
Key Milestones
29
Building a leading Malaysian OSV player with international experience
TKS(1) founded
by Tanjung
Offshore
Berhad and
began
operations by
acting as agent
and 3rd party
charterer
TKS took delivery
of its first two
vessels, 1 AHTS
and 1 UV
Strategic Consolidation between TKS & OMNI(3)
and launch of ICON. TKS was subsequently
renamed as ICON Ship Management Sdn. Bhd.
and OMNI(2) was subsequently renamed as
ICON Fleet Sdn. Bhd.
OMNI(2) acquired its
first vessel, an AHT
ICON Ship vessel was
awarded Best HSE
Performance by PETRONAS
Carigali
Source: Company. (1) Tanjung Kapal Services Sdn. Bhd. (2) Omni Power Sdn. Bhd. (3) Omni Petromaritime Sdn. Bhd.
1994 2005
2006 2012
2012
ICON took delivery of 5 new
AHTS vessels and 1 new PSV, the first Malaysian
constructed diesel electric and
Malaysian-flagged PSV
2013
ICON entered into a joint-
venture arrangement
with an affiliate of Odfjell
Eiendom AS
Apr
2014
Aug
2014
ICON entered into a joint-
venture arrangement to penetrate
Brunei market
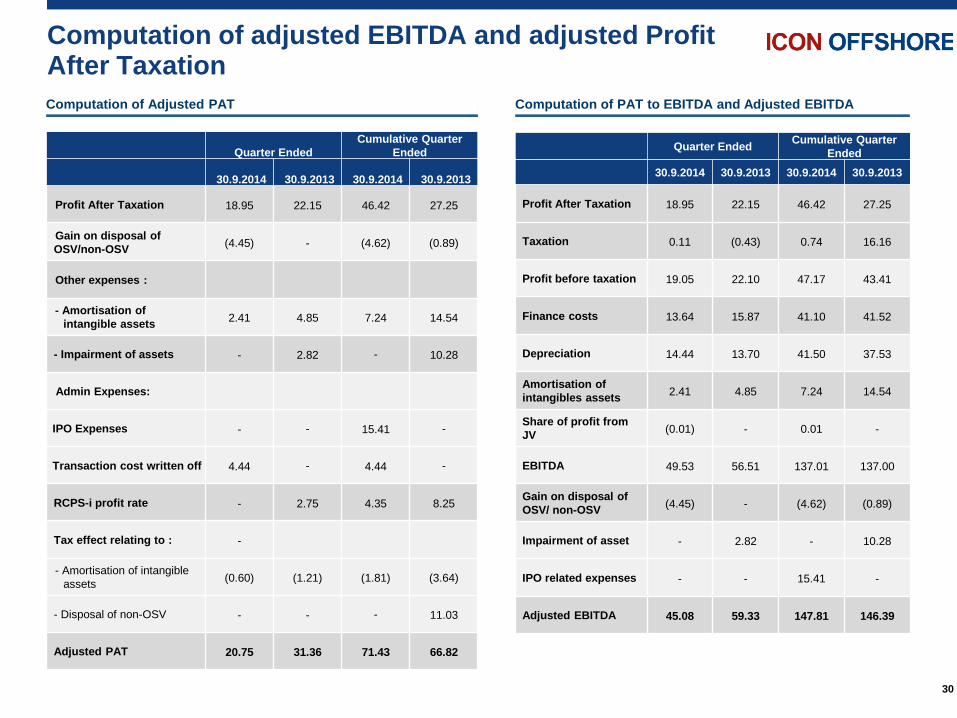
Computation of adjusted EBITDA and adjusted Profit After Taxation
30
Computation of PAT to EBITDA and Adjusted EBITDA Computation of Adjusted PAT
Quarter Ended
Cumulative Quarter
Ended
30.9.2014 30.9.2013 30.9.2014 30.9.2013
Profit After Taxation 18.95 22.15 46.42 27.25
Gain on disposal of
OSV/non-OSV (4.45) - (4.62) (0.89)
Other expenses :
- Amortisation of
intangible assets 2.41 4.85 7.24 14.54
- Impairment of assets - 2.82 - 10.28
Admin Expenses:
IPO Expenses - - 15.41 -
Transaction cost written off 4.44 - 4.44 -
RCPS-i profit rate - 2.75 4.35 8.25
Tax effect relating to : -
- Amortisation of intangible
assets (0.60) (1.21) (1.81) (3.64)
- Disposal of non-OSV - - - 11.03
Adjusted PAT 20.75 31.36 71.43 66.82
Quarter Ended Cumulative Quarter
Ended
30.9.2014 30.9.2013 30.9.2014 30.9.2013
Profit After Taxation 18.95 22.15 46.42 27.25
Taxation 0.11 (0.43) 0.74 16.16
Profit before taxation 19.05 22.10 47.17 43.41
Finance costs 13.64 15.87 41.10 41.52
Depreciation 14.44 13.70 41.50 37.53
Amortisation of
intangibles assets 2.41 4.85 7.24 14.54
Share of profit from
JV (0.01) - 0.01 -
EBITDA 49.53 56.51 137.01 137.00
Gain on disposal of
OSV/ non-OSV (4.45) - (4.62) (0.89)
Impairment of asset - 2.82 - 10.28
IPO related expenses - - 15.41 -
Adjusted EBITDA 45.08 59.33 147.81 146.39


 an](https://img.pdfslide.us/doc/110x75/5fe10a89e9926428ba7fc019/cimbwork-terms-and-conditions-for-petroliam-2020-3-9-1-cimbwork-petronas.jpg)