Embed Size (px)
Citation preview
Page 1 of 12
Introduction In 2016, the International City/County Management Association (ICMA), in partnership with the University of Maryland, Baltimore County (UMBC), conducted a survey to better understand local government cybersecurity practices. The results of this survey provide insights into the cybersecurity issues faced by U.S. local governments, including what their capacities are, what kind of barriers they face, and what type of support they have to implement cybersecurity programs.
Methodology
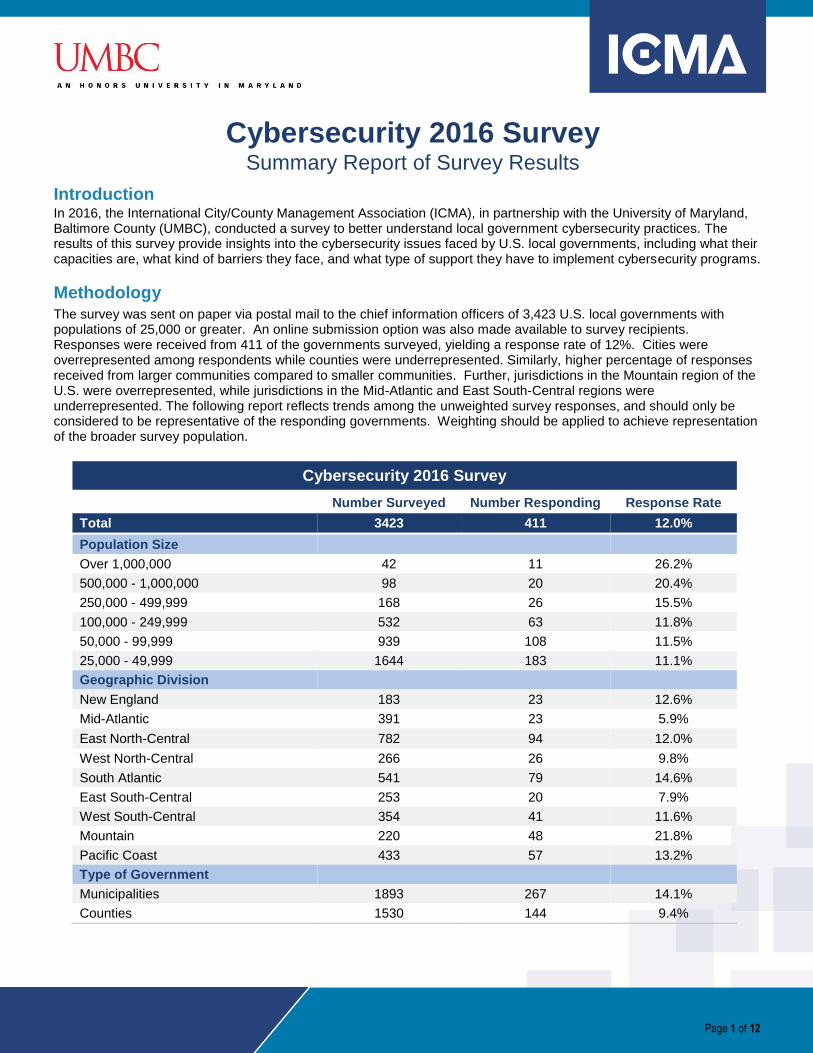
The survey was sent on paper via postal mail to the chief information officers of 3,423 U.S. local governments with populations of 25,000 or greater. An online submission option was also made available to survey recipients. Responses were received from 411 of the governments surveyed, yielding a response rate of 12%. Cities were overrepresented among respondents while counties were underrepresented. Similarly, higher percentage of responses received from larger communities compared to smaller communities. Further, jurisdictions in the Mountain region of the U.S. were overrepresented, while jurisdictions in the Mid-Atlantic and East South-Central regions were underrepresented. The following report reflects trends among the unweighted survey responses, and should only be considered to be representative of the responding governments. Weighting should be applied to achieve representation of the broader survey population.
Cybersecurity 2016 Survey
Number Surveyed Number Responding Response Rate
Total 3423 411 12.0%
Population Size
Over 1,000,000 42 11 26.2%
500,000 - 1,000,000 98 20 20.4%
250,000 - 499,999 168 26 15.5%
100,000 - 249,999 532 63 11.8%
50,000 - 99,999 939 108 11.5%
25,000 - 49,999 1644 183 11.1%
Geographic Division
New England 183 23 12.6%
Mid-Atlantic 391 23 5.9%
East North-Central 782 94 12.0%
West North-Central 266 26 9.8%
South Atlantic 541 79 14.6%
East South-Central 253 20 7.9%
West South-Central 354 41 11.6%
Mountain 220 48 21.8%
Pacific Coast 433 57 13.2%
Type of Government
Municipalities 1893 267 14.1%
Counties 1530 144 9.4%
Cybersecurity 2016 Survey Summary Report of Survey Results
Page 2 of 12
Survey Highlights
This survey provides insight into the cybersecurity practices among local governments in the U.S. Key topics explored
include which departments are responsible for cybersecurity; awareness of and support for cybersecurity; what barriers
local governments face to achieve higher levels of cybersecurity; and what cybersecurity practices and tools local
governments are using. Highlights from the data are outlined below, and responses to survey questions are summarized
in the appendix.
Information Technology and Cybersecurity
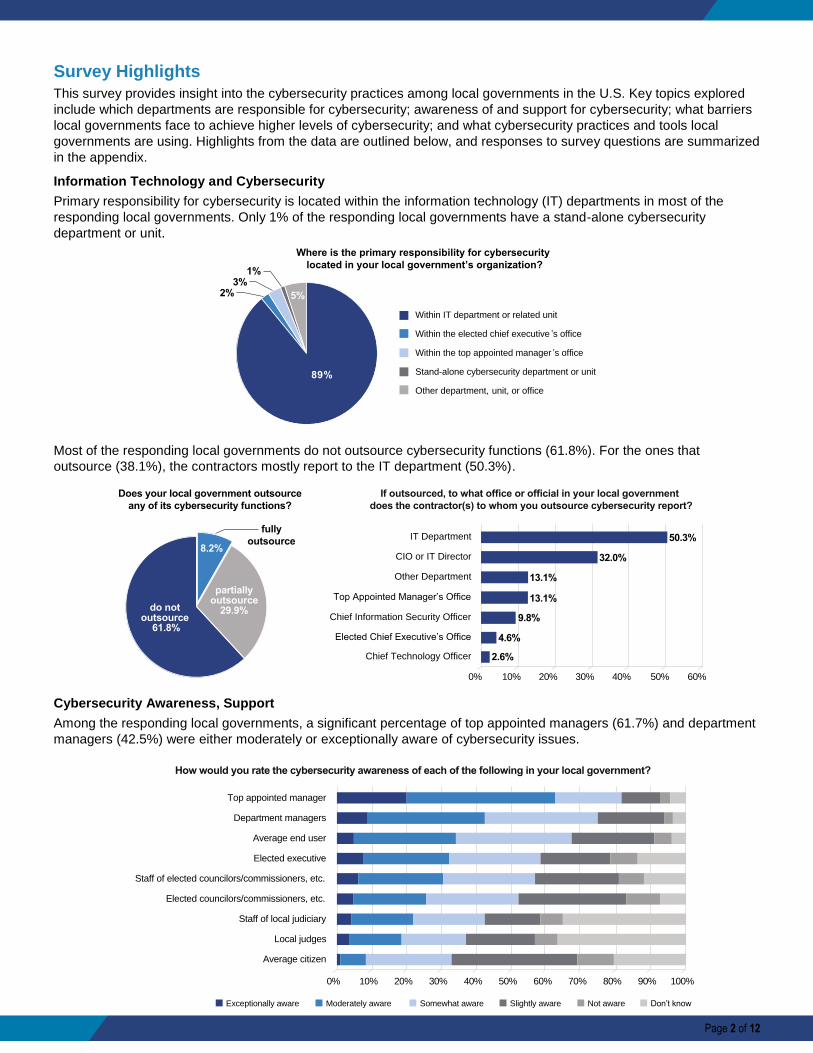
Primary responsibility for cybersecurity is located within the information technology (IT) departments in most of the
responding local governments. Only 1% of the responding local governments have a stand-alone cybersecurity
department or unit.
Most of the responding local governments do not outsource cybersecurity functions (61.8%). For the ones that
outsource (38.1%), the contractors mostly report to the IT department (50.3%).
Cybersecurity Awareness, Support
Among the responding local governments, a significant percentage of top appointed managers (61.7%) and department
managers (42.5%) were either moderately or exceptionally aware of cybersecurity issues.
Where is the primary responsibility for cybersecurity
located in your local government’s organization?1%
3%2%
Within IT department or related unit
Within the elected chief executive ’s office
Within the top appointed manager ’s office
Stand-alone cybersecurity department or unit
Other department, unit, or office
5%
89%
Does your local government outsource
any of its cybersecurity functions?
fully
outsource
partiallyoutsource
29.9%do not outsource
61.8%
8.2%
If outsourced, to what office or official in your local government
does the contractor(s) to whom you outsource cybersecurity report?
0% 10% 20% 30% 40% 50% 60%
Chief Technology Officer
Elected Chief Executive’s Office
Chief Information Security Officer
Top Appointed Manager’s Office
Other Department
CIO or IT Director
IT Department 50.3%
32.0%
13.1%
13.1%
9.8%
4.6%
2.6%
How would you rate the cybersecurity awareness of each of the following in your local government?
0% 10% 20% 30% 40% 50% 60% 70% 80% 90% 100%
Average citizen
Local judges
Staff of local judiciary
Elected councilors/commissioners, etc.
Staff of elected councilors/commissioners, etc.
Elected executive
Average end user
Department managers
Top appointed manager
Exceptionally aware Moderately aware Somewhat aware Slightly aware Not aware Don’t know
Page 3 of 12
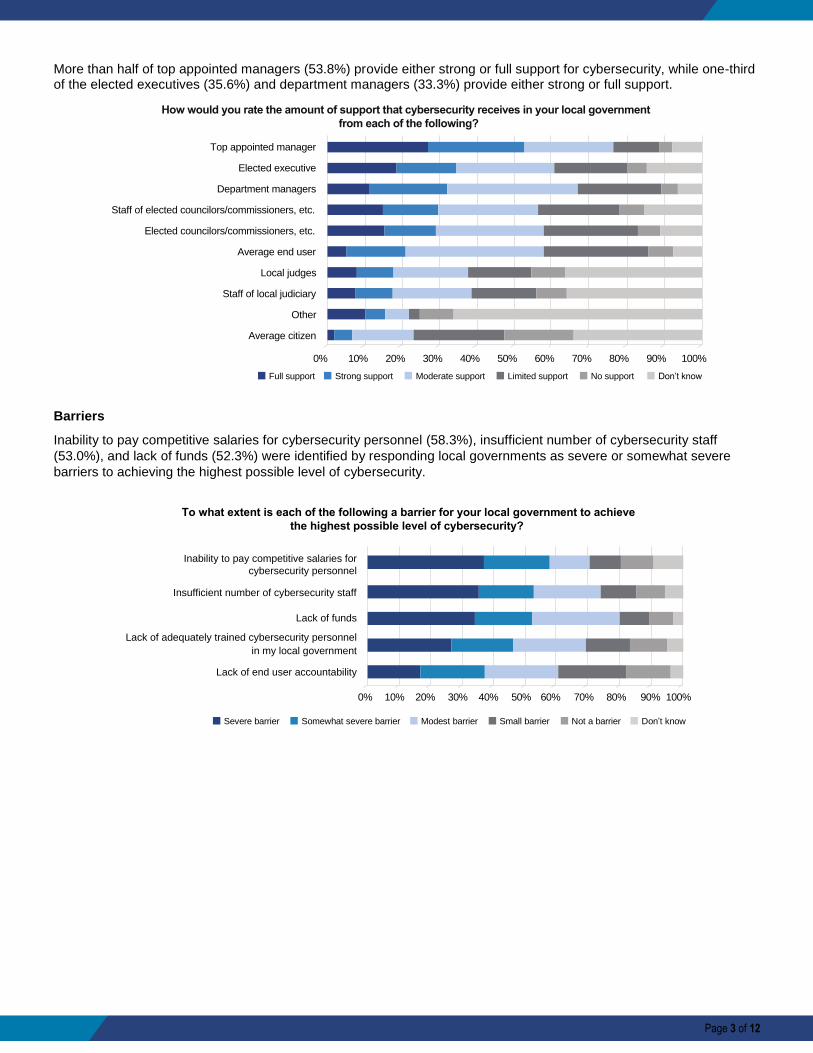
More than half of top appointed managers (53.8%) provide either strong or full support for cybersecurity, while one-third of the elected executives (35.6%) and department managers (33.3%) provide either strong or full support.
Barriers
Inability to pay competitive salaries for cybersecurity personnel (58.3%), insufficient number of cybersecurity staff
(53.0%), and lack of funds (52.3%) were identified by responding local governments as severe or somewhat severe
barriers to achieving the highest possible level of cybersecurity.
How would you rate the amount of support that cybersecurity receives in your local government
from each of the following?
0% 10% 20% 30% 40% 50% 60% 70% 80% 90% 100%
Average citizen
Other
Local judges
Staff of local judiciary
Elected councilors/commissioners, etc.
Staff of elected councilors/commissioners, etc.
Elected executive
Average end user
Department managers
Top appointed manager
Full support Strong support Moderate support Limited support No support Don’t know
To what extent is each of the following a barrier for your local government to achieve
the highest possible level of cybersecurity?
Severe barrier Somewhat severe barrier Modest barrier Small barrier Not a barrier Don’t know
Lack of end user accountability
Lack of adequately trained cybersecurity personnel
in my local government
Lack of funds
Insufficient number of cybersecurity staff
0% 10% 20% 30% 40% 50% 60% 70% 80% 90% 100%
Inability to pay competitive salaries for
cybersecurity personnel
Page 4 of 12
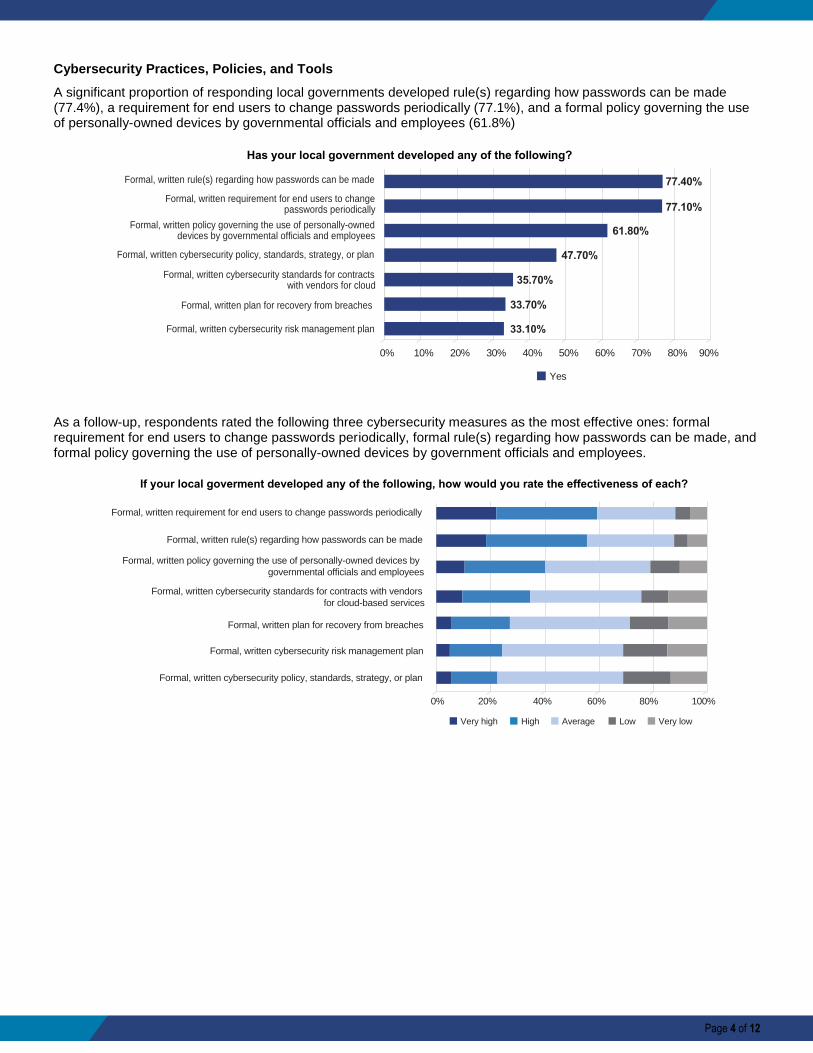
Cybersecurity Practices, Policies, and Tools
A significant proportion of responding local governments developed rule(s) regarding how passwords can be made (77.4%), a requirement for end users to change passwords periodically (77.1%), and a formal policy governing the use of personally-owned devices by governmental officials and employees (61.8%)
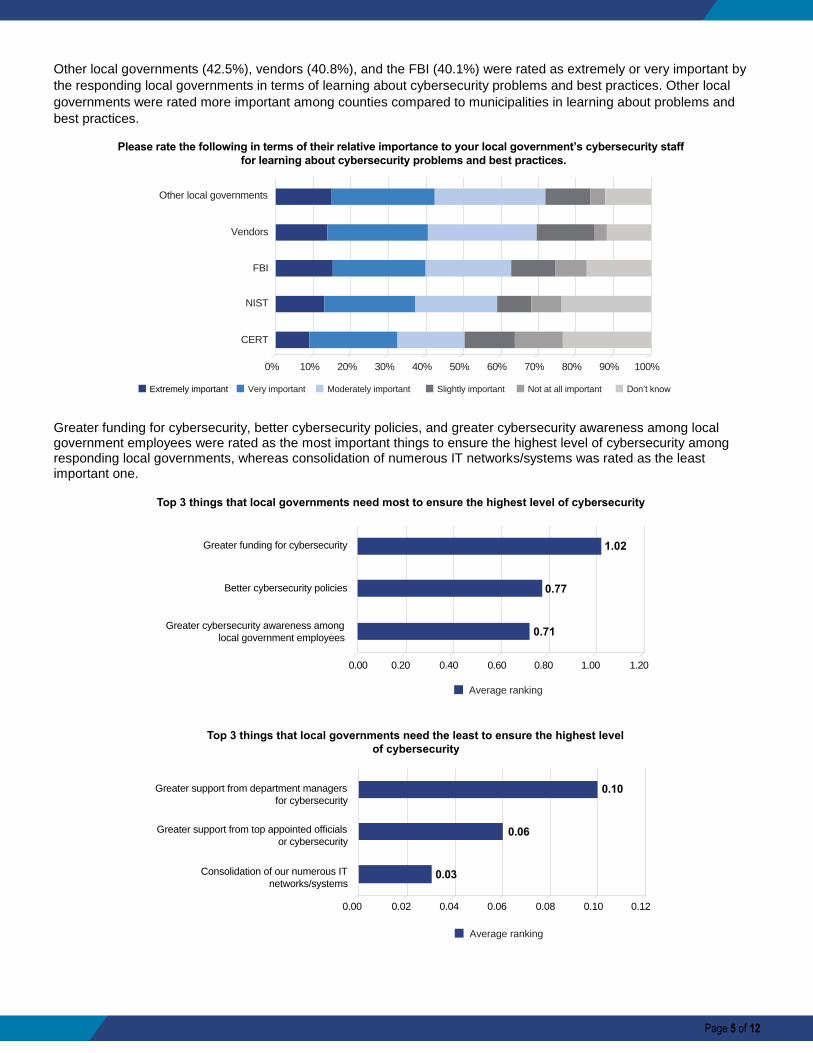
As a follow-up, respondents rated the following three cybersecurity measures as the most effective ones: formal requirement for end users to change passwords periodically, formal rule(s) regarding how passwords can be made, and formal policy governing the use of personally-owned devices by government officials and employees.
Formal, written cybersecurity risk management plan
Formal, written plan for recovery from breaches
Formal, written cybersecurity standards for contractswith vendors for cloud
Formal, written cybersecurity policy, standards, strategy, or plan
Formal, written policy governing the use of personally-owneddevices by governmental officials and employees
Formal, written requirement for end users to changepasswords periodically
Formal, written rule(s) regarding how passwords can be made
0% 10% 20% 30%
33.10%
33.70%
35.70%
47.70%
61.80%
77.10%
77.40%
40% 50% 60% 70% 80% 90%
Yes
Has your local government developed any of the following?
If your local goverment developed any of the following, how would you rate the effectiveness of each?
Very high High Average Low Very low
0% 20% 40% 60% 80% 100%
Formal, written cybersecurity policy, standards, strategy, or plan
Formal, written cybersecurity risk management plan
Formal, written plan for recovery from breaches
Formal, written cybersecurity standards for contracts with vendors
for cloud-based services
Formal, written policy governing the use of personally-owned devices by
governmental officials and employees
Formal, written rule(s) regarding how passwords can be made
Formal, written requirement for end users to change passwords periodically
Page 5 of 12
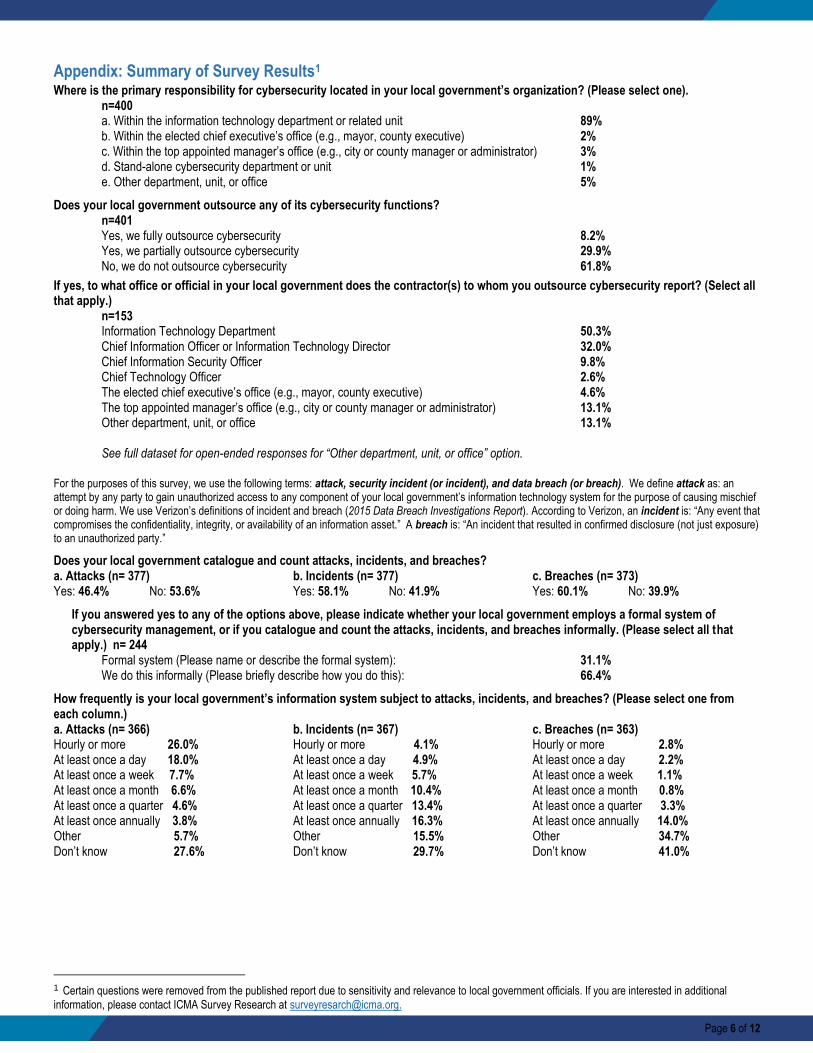
Other local governments (42.5%), vendors (40.8%), and the FBI (40.1%) were rated as extremely or very important by
the responding local governments in terms of learning about cybersecurity problems and best practices. Other local
governments were rated more important among counties compared to municipalities in learning about problems and
best practices.
Greater funding for cybersecurity, better cybersecurity policies, and greater cybersecurity awareness among local government employees were rated as the most important things to ensure the highest level of cybersecurity among responding local governments, whereas consolidation of numerous IT networks/systems was rated as the least important one.
Please rate the following in terms of their relative importance to your local government’s cybersecurity staff
for learning about cybersecurity problems and best practices.
CERT
NIST
FBI
Vendors
Other local governments
0% 10% 20% 30% 40% 50% 60% 70% 80% 90% 100%
Extremely important Very important Moderately important Slightly important Not at all important Don’t know
Average ranking
0.00 0.20 0.40 0.60 0.80 1.00 1.20
Greater cybersecurity awareness among
local government employees
Better cybersecurity policies
Greater funding for cybersecurity
Consolidation of our numerous IT
networks/systems
Greater support from top appointed officials
or cybersecurity
Greater support from department managers
for cybersecurity
Average ranking
0.00 0.02 0.04 0.06 0.08 0.10 0.12
0.10
0.03
0.06
Top 3 things that local governments need most to ensure the highest level of cybersecurity
Top 3 things that local governments need the least to ensure the highest level
of cybersecurity
1.02
0.77
0.71
Page 6 of 12
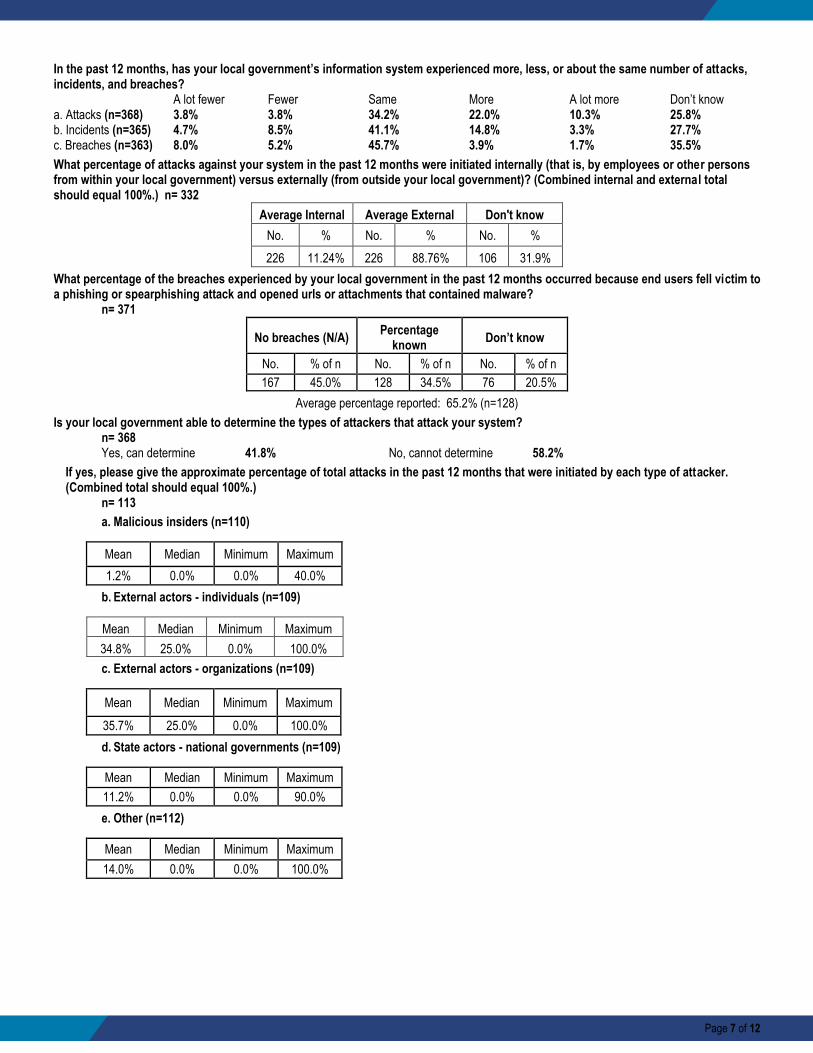
Appendix: Summary of Survey Results1 Where is the primary responsibility for cybersecurity located in your local government’s organization? (Please select one). n=400
a. Within the information technology department or related unit 89% b. Within the elected chief executive’s office (e.g., mayor, county executive) 2% c. Within the top appointed manager’s office (e.g., city or county manager or administrator) 3% d. Stand-alone cybersecurity department or unit 1% e. Other department, unit, or office 5%
Does your local government outsource any of its cybersecurity functions? n=401 Yes, we fully outsource cybersecurity 8.2% Yes, we partially outsource cybersecurity 29.9% No, we do not outsource cybersecurity 61.8%
If yes, to what office or official in your local government does the contractor(s) to whom you outsource cybersecurity report? (Select all that apply.)
n=153 Information Technology Department 50.3% Chief Information Officer or Information Technology Director 32.0% Chief Information Security Officer 9.8% Chief Technology Officer 2.6% The elected chief executive’s office (e.g., mayor, county executive) 4.6% The top appointed manager’s office (e.g., city or county manager or administrator) 13.1% Other department, unit, or office 13.1% See full dataset for open-ended responses for “Other department, unit, or office” option.
For the purposes of this survey, we use the following terms: attack, security incident (or incident), and data breach (or breach). We define attack as: an attempt by any party to gain unauthorized access to any component of your local government’s information technology system for the purpose of causing mischief or doing harm. We use Verizon’s definitions of incident and breach (2015 Data Breach Investigations Report). According to Verizon, an incident is: “Any event that compromises the confidentiality, integrity, or availability of an information asset.” A breach is: “An incident that resulted in confirmed disclosure (not just exposure) to an unauthorized party.”
Does your local government catalogue and count attacks, incidents, and breaches? a. Attacks (n= 377) b. Incidents (n= 377) c. Breaches (n= 373) Yes: 46.4% No: 53.6% Yes: 58.1% No: 41.9% Yes: 60.1% No: 39.9%
If you answered yes to any of the options above, please indicate whether your local government employs a formal system of cybersecurity management, or if you catalogue and count the attacks, incidents, and breaches informally. (Please select all that apply.) n= 244
Formal system (Please name or describe the formal system): 31.1% We do this informally (Please briefly describe how you do this): 66.4%
How frequently is your local government’s information system subject to attacks, incidents, and breaches? (Please select one from each column.) a. Attacks (n= 366) b. Incidents (n= 367) c. Breaches (n= 363) Hourly or more 26.0% Hourly or more 4.1% Hourly or more 2.8% At least once a day 18.0% At least once a day 4.9% At least once a day 2.2% At least once a week 7.7% At least once a week 5.7% At least once a week 1.1% At least once a month 6.6% At least once a month 10.4% At least once a month 0.8% At least once a quarter 4.6% At least once a quarter 13.4% At least once a quarter 3.3% At least once annually 3.8% At least once annually 16.3% At least once annually 14.0% Other 5.7% Other 15.5% Other 34.7% Don’t know 27.6% Don’t know 29.7% Don’t know 41.0%
1 Certain questions were removed from the published report due to sensitivity and relevance to local government officials. If you are interested in additional
information, please contact ICMA Survey Research at [email protected].
Page 7 of 12
In the past 12 months, has your local government’s information system experienced more, less, or about the same number of attacks, incidents, and breaches? A lot fewer Fewer Same More A lot more Don’t know a. Attacks (n=368) 3.8% 3.8% 34.2% 22.0% 10.3% 25.8% b. Incidents (n=365) 4.7% 8.5% 41.1% 14.8% 3.3% 27.7% c. Breaches (n=363) 8.0% 5.2% 45.7% 3.9% 1.7% 35.5%
What percentage of attacks against your system in the past 12 months were initiated internally (that is, by employees or other persons from within your local government) versus externally (from outside your local government)? (Combined internal and external total should equal 100%.) n= 332
Average Internal Average External Don't know
No. % No. % No. %
226 11.24% 226 88.76% 106 31.9%
What percentage of the breaches experienced by your local government in the past 12 months occurred because end users fell victim to a phishing or spearphishing attack and opened urls or attachments that contained malware? n= 371
No breaches (N/A) Percentage
known Don’t know
No. % of n No. % of n No. % of n
167 45.0% 128 34.5% 76 20.5%
Average percentage reported: 65.2% (n=128)
Is your local government able to determine the types of attackers that attack your system? n= 368
Yes, can determine 41.8% No, cannot determine 58.2%
If yes, please give the approximate percentage of total attacks in the past 12 months that were initiated by each type of attacker. (Combined total should equal 100%.)
n= 113
a. Malicious insiders (n=110)
Mean Median Minimum Maximum
1.2% 0.0% 0.0% 40.0%
b. External actors - individuals (n=109)
Mean Median Minimum Maximum
34.8% 25.0% 0.0% 100.0%
c. External actors - organizations (n=109)
Mean Median Minimum Maximum
35.7% 25.0% 0.0% 100.0%
d. State actors - national governments (n=109)
Mean Median Minimum Maximum
11.2% 0.0% 0.0% 90.0%
e. Other (n=112)
Mean Median Minimum Maximum
14.0% 0.0% 0.0% 100.0%
Page 8 of 12
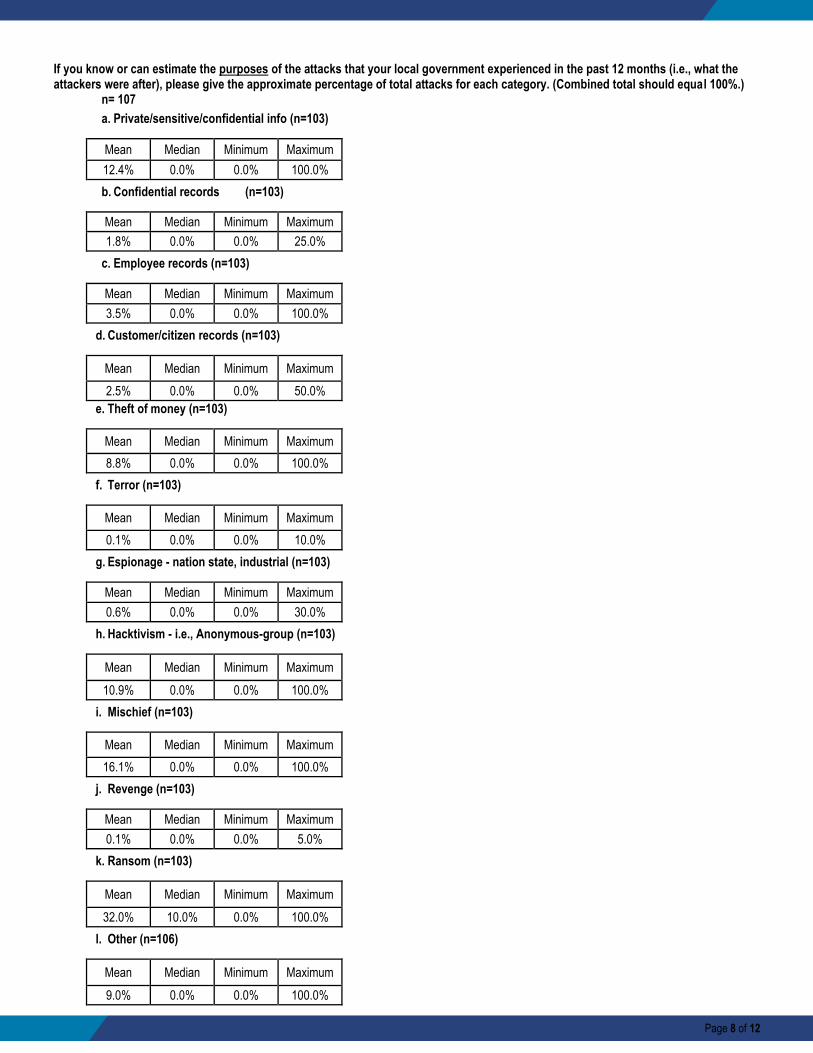
If you know or can estimate the purposes of the attacks that your local government experienced in the past 12 months (i.e., what the attackers were after), please give the approximate percentage of total attacks for each category. (Combined total should equal 100%.)
n= 107
a. Private/sensitive/confidential info (n=103)
Mean Median Minimum Maximum
12.4% 0.0% 0.0% 100.0%
b. Confidential records (n=103)
Mean Median Minimum Maximum
1.8% 0.0% 0.0% 25.0%
c. Employee records (n=103)
Mean Median Minimum Maximum
3.5% 0.0% 0.0% 100.0%
d. Customer/citizen records (n=103)
Mean Median Minimum Maximum
2.5% 0.0% 0.0% 50.0%
e. Theft of money (n=103)
Mean Median Minimum Maximum
8.8% 0.0% 0.0% 100.0%
f. Terror (n=103)
Mean Median Minimum Maximum
0.1% 0.0% 0.0% 10.0%
g. Espionage - nation state, industrial (n=103)
Mean Median Minimum Maximum
0.6% 0.0% 0.0% 30.0%
h. Hacktivism - i.e., Anonymous-group (n=103)
Mean Median Minimum Maximum
10.9% 0.0% 0.0% 100.0%
i. Mischief (n=103)
Mean Median Minimum Maximum
16.1% 0.0% 0.0% 100.0%
j. Revenge (n=103)
Mean Median Minimum Maximum
0.1% 0.0% 0.0% 5.0%
k. Ransom (n=103)
Mean Median Minimum Maximum
32.0% 10.0% 0.0% 100.0%
l. Other (n=106)
Mean Median Minimum Maximum
9.0% 0.0% 0.0% 100.0%
Page 9 of 12
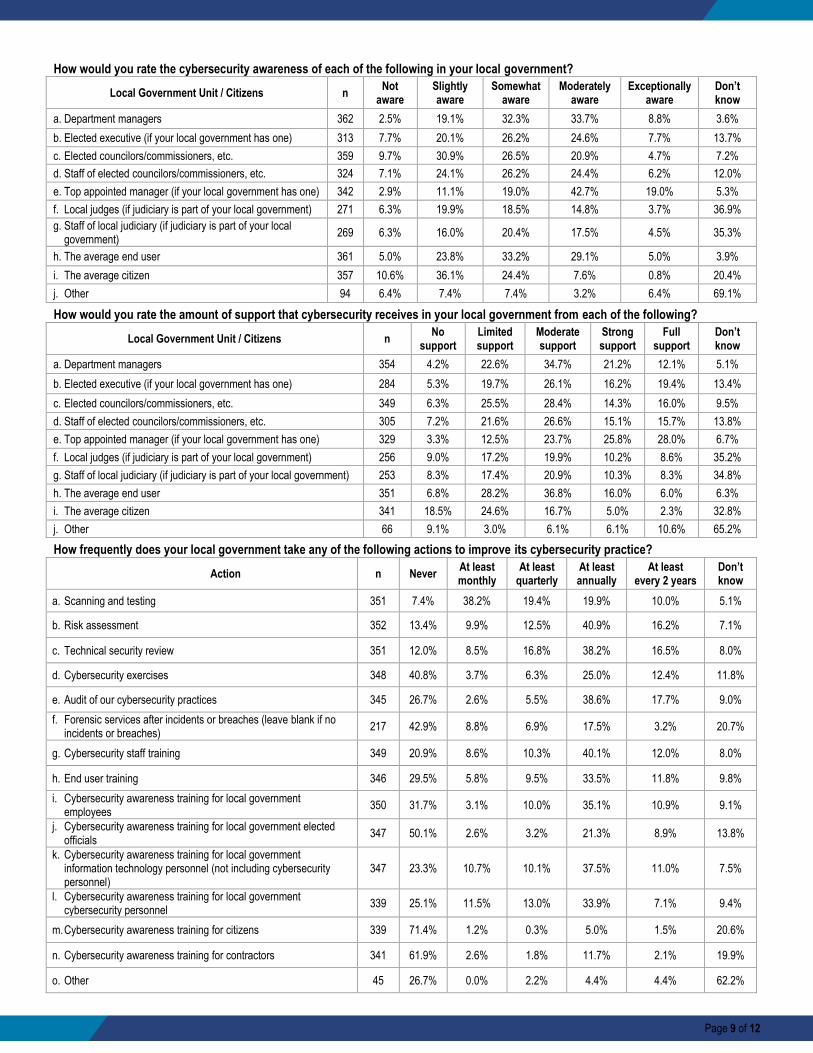
How would you rate the cybersecurity awareness of each of the following in your local government?
Local Government Unit / Citizens n Not
aware Slightly aware
Somewhat aware
Moderately aware
Exceptionally aware
Don’t know
a. Department managers 362 2.5% 19.1% 32.3% 33.7% 8.8% 3.6%
b. Elected executive (if your local government has one) 313 7.7% 20.1% 26.2% 24.6% 7.7% 13.7%
c. Elected councilors/commissioners, etc. 359 9.7% 30.9% 26.5% 20.9% 4.7% 7.2%
d. Staff of elected councilors/commissioners, etc. 324 7.1% 24.1% 26.2% 24.4% 6.2% 12.0%
e. Top appointed manager (if your local government has one) 342 2.9% 11.1% 19.0% 42.7% 19.0% 5.3%
f. Local judges (if judiciary is part of your local government) 271 6.3% 19.9% 18.5% 14.8% 3.7% 36.9%
g. Staff of local judiciary (if judiciary is part of your local government)
269 6.3% 16.0% 20.4% 17.5% 4.5% 35.3%
h. The average end user 361 5.0% 23.8% 33.2% 29.1% 5.0% 3.9%
i. The average citizen 357 10.6% 36.1% 24.4% 7.6% 0.8% 20.4%
j. Other 94 6.4% 7.4% 7.4% 3.2% 6.4% 69.1%
How would you rate the amount of support that cybersecurity receives in your local government from each of the following?
Local Government Unit / Citizens n No
support Limited support
Moderate support
Strong support
Full support
Don’t know
a. Department managers 354 4.2% 22.6% 34.7% 21.2% 12.1% 5.1%
b. Elected executive (if your local government has one) 284 5.3% 19.7% 26.1% 16.2% 19.4% 13.4%
c. Elected councilors/commissioners, etc. 349 6.3% 25.5% 28.4% 14.3% 16.0% 9.5%
d. Staff of elected councilors/commissioners, etc. 305 7.2% 21.6% 26.6% 15.1% 15.7% 13.8%
e. Top appointed manager (if your local government has one) 329 3.3% 12.5% 23.7% 25.8% 28.0% 6.7%
f. Local judges (if judiciary is part of your local government) 256 9.0% 17.2% 19.9% 10.2% 8.6% 35.2%
g. Staff of local judiciary (if judiciary is part of your local government) 253 8.3% 17.4% 20.9% 10.3% 8.3% 34.8%
h. The average end user 351 6.8% 28.2% 36.8% 16.0% 6.0% 6.3%
i. The average citizen 341 18.5% 24.6% 16.7% 5.0% 2.3% 32.8%
j. Other 66 9.1% 3.0% 6.1% 6.1% 10.6% 65.2%
How frequently does your local government take any of the following actions to improve its cybersecurity practice?
Action n Never At least monthly
At least quarterly
At least annually
At least every 2 years
Don’t know
a. Scanning and testing 351 7.4% 38.2% 19.4% 19.9% 10.0% 5.1%
b. Risk assessment 352 13.4% 9.9% 12.5% 40.9% 16.2% 7.1%
c. Technical security review 351 12.0% 8.5% 16.8% 38.2% 16.5% 8.0%
d. Cybersecurity exercises 348 40.8% 3.7% 6.3% 25.0% 12.4% 11.8%
e. Audit of our cybersecurity practices 345 26.7% 2.6% 5.5% 38.6% 17.7% 9.0%
f. Forensic services after incidents or breaches (leave blank if no incidents or breaches)
217 42.9% 8.8% 6.9% 17.5% 3.2% 20.7%
g. Cybersecurity staff training 349 20.9% 8.6% 10.3% 40.1% 12.0% 8.0%
h. End user training 346 29.5% 5.8% 9.5% 33.5% 11.8% 9.8%
i. Cybersecurity awareness training for local government employees
350 31.7% 3.1% 10.0% 35.1% 10.9% 9.1%
j. Cybersecurity awareness training for local government elected officials
347 50.1% 2.6% 3.2% 21.3% 8.9% 13.8%
k. Cybersecurity awareness training for local government information technology personnel (not including cybersecurity personnel)
347 23.3% 10.7% 10.1% 37.5% 11.0% 7.5%
l. Cybersecurity awareness training for local government cybersecurity personnel
339 25.1% 11.5% 13.0% 33.9% 7.1% 9.4%
m. Cybersecurity awareness training for citizens 339 71.4% 1.2% 0.3% 5.0% 1.5% 20.6%
n. Cybersecurity awareness training for contractors 341 61.9% 2.6% 1.8% 11.7% 2.1% 19.9%
o. Other 45 26.7% 0.0% 2.2% 4.4% 4.4% 62.2%
Page 10 of 12
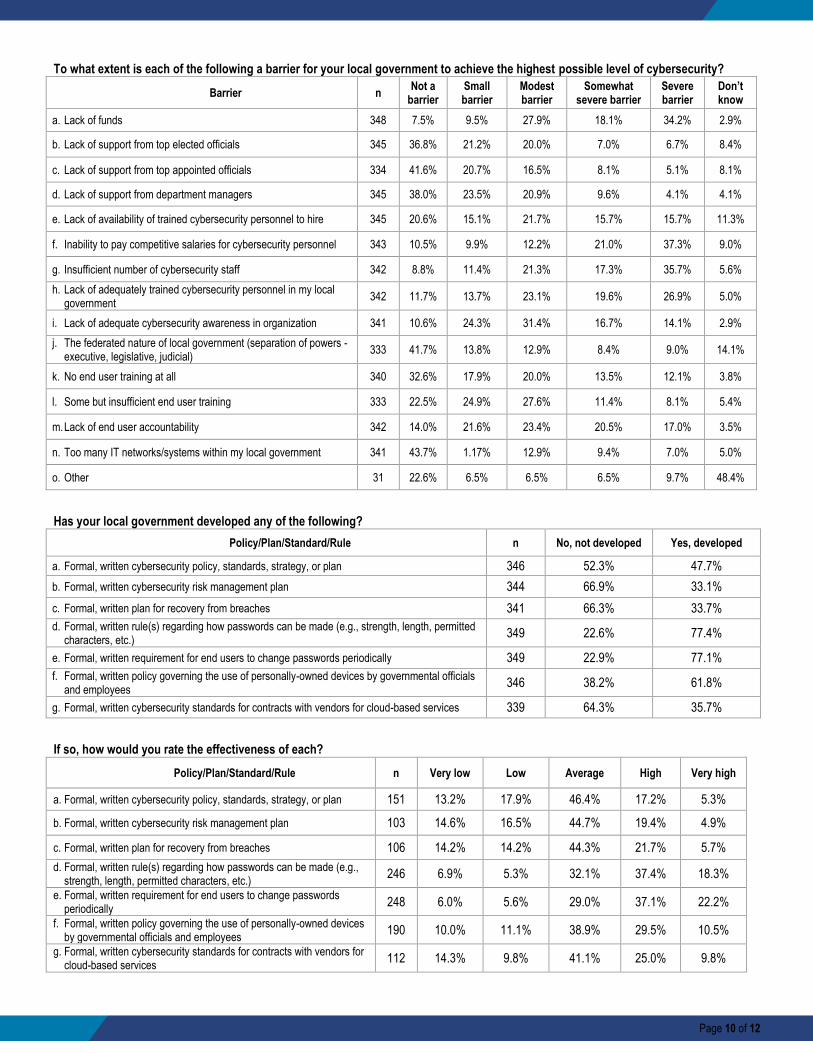
To what extent is each of the following a barrier for your local government to achieve the highest possible level of cybersecurity?
Barrier n Not a
barrier Small barrier
Modest barrier
Somewhat severe barrier
Severe barrier
Don’t know
a. Lack of funds 348 7.5% 9.5% 27.9% 18.1% 34.2% 2.9%
b. Lack of support from top elected officials 345 36.8% 21.2% 20.0% 7.0% 6.7% 8.4%
c. Lack of support from top appointed officials 334 41.6% 20.7% 16.5% 8.1% 5.1% 8.1%
d. Lack of support from department managers 345 38.0% 23.5% 20.9% 9.6% 4.1% 4.1%
e. Lack of availability of trained cybersecurity personnel to hire 345 20.6% 15.1% 21.7% 15.7% 15.7% 11.3%
f. Inability to pay competitive salaries for cybersecurity personnel 343 10.5% 9.9% 12.2% 21.0% 37.3% 9.0%
g. Insufficient number of cybersecurity staff 342 8.8% 11.4% 21.3% 17.3% 35.7% 5.6%
h. Lack of adequately trained cybersecurity personnel in my local government
342 11.7% 13.7% 23.1% 19.6% 26.9% 5.0%
i. Lack of adequate cybersecurity awareness in organization 341 10.6% 24.3% 31.4% 16.7% 14.1% 2.9%
j. The federated nature of local government (separation of powers - executive, legislative, judicial)
333 41.7% 13.8% 12.9% 8.4% 9.0% 14.1%
k. No end user training at all 340 32.6% 17.9% 20.0% 13.5% 12.1% 3.8%
l. Some but insufficient end user training 333 22.5% 24.9% 27.6% 11.4% 8.1% 5.4%
m. Lack of end user accountability 342 14.0% 21.6% 23.4% 20.5% 17.0% 3.5%
n. Too many IT networks/systems within my local government 341 43.7% 1.17% 12.9% 9.4% 7.0% 5.0%
o. Other 31 22.6% 6.5% 6.5% 6.5% 9.7% 48.4%
Has your local government developed any of the following?
Policy/Plan/Standard/Rule n No, not developed Yes, developed
a. Formal, written cybersecurity policy, standards, strategy, or plan 346 52.3% 47.7%
b. Formal, written cybersecurity risk management plan 344 66.9% 33.1%
c. Formal, written plan for recovery from breaches 341 66.3% 33.7%
d. Formal, written rule(s) regarding how passwords can be made (e.g., strength, length, permitted characters, etc.)
349 22.6% 77.4%
e. Formal, written requirement for end users to change passwords periodically 349 22.9% 77.1%
f. Formal, written policy governing the use of personally-owned devices by governmental officials and employees
346 38.2% 61.8%
g. Formal, written cybersecurity standards for contracts with vendors for cloud-based services 339 64.3% 35.7%
If so, how would you rate the effectiveness of each?
Policy/Plan/Standard/Rule n Very low Low Average High Very high
a. Formal, written cybersecurity policy, standards, strategy, or plan 151 13.2% 17.9% 46.4% 17.2% 5.3%
b. Formal, written cybersecurity risk management plan 103 14.6% 16.5% 44.7% 19.4% 4.9%
c. Formal, written plan for recovery from breaches 106 14.2% 14.2% 44.3% 21.7% 5.7%
d. Formal, written rule(s) regarding how passwords can be made (e.g., strength, length, permitted characters, etc.)
246 6.9% 5.3% 32.1% 37.4% 18.3%
e. Formal, written requirement for end users to change passwords periodically
248 6.0% 5.6% 29.0% 37.1% 22.2%
f. Formal, written policy governing the use of personally-owned devices by governmental officials and employees
190 10.0% 11.1% 38.9% 29.5% 10.5%
g. Formal, written cybersecurity standards for contracts with vendors for cloud-based services
112 14.3% 9.8% 41.1% 25.0% 9.8%
Page 11 of 12
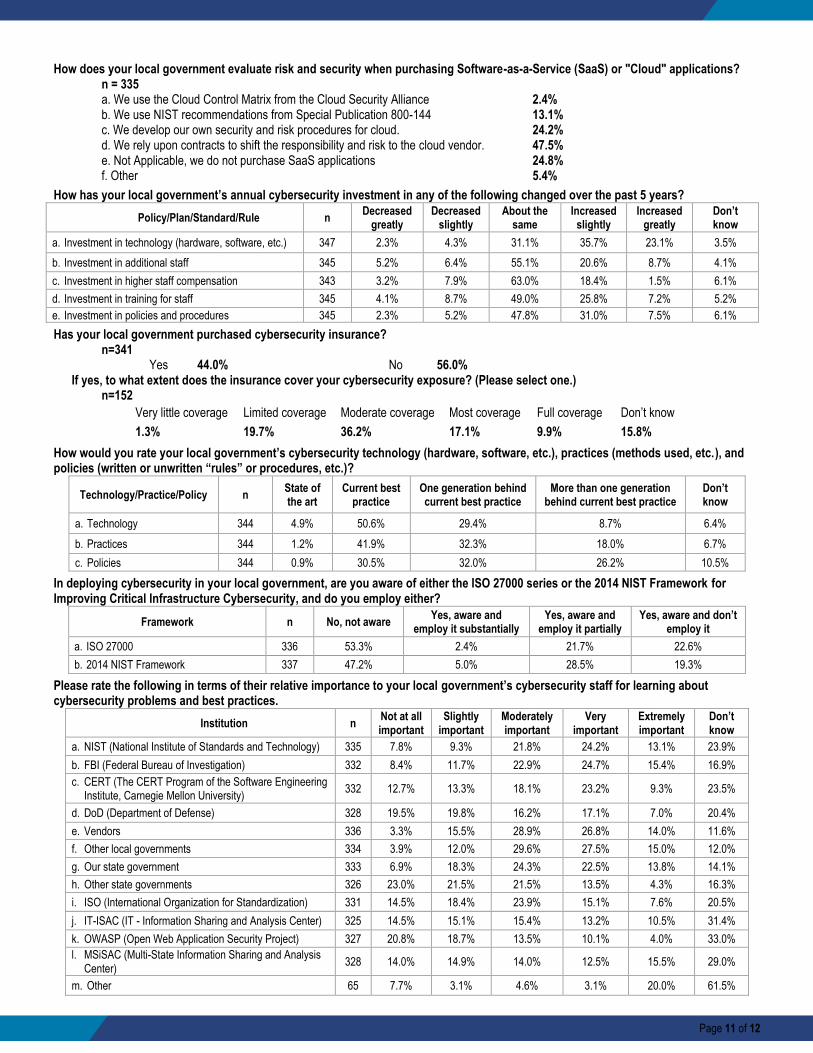
How does your local government evaluate risk and security when purchasing Software-as-a-Service (SaaS) or "Cloud" applications? n = 335
a. We use the Cloud Control Matrix from the Cloud Security Alliance 2.4% b. We use NIST recommendations from Special Publication 800-144 13.1% c. We develop our own security and risk procedures for cloud. 24.2% d. We rely upon contracts to shift the responsibility and risk to the cloud vendor. 47.5% e. Not Applicable, we do not purchase SaaS applications 24.8% f. Other 5.4%
How has your local government’s annual cybersecurity investment in any of the following changed over the past 5 years?
Policy/Plan/Standard/Rule n Decreased
greatly Decreased
slightly About the
same Increased
slightly Increased
greatly Don’t know
a. Investment in technology (hardware, software, etc.) 347 2.3% 4.3% 31.1% 35.7% 23.1% 3.5%
b. Investment in additional staff 345 5.2% 6.4% 55.1% 20.6% 8.7% 4.1%
c. Investment in higher staff compensation 343 3.2% 7.9% 63.0% 18.4% 1.5% 6.1%
d. Investment in training for staff 345 4.1% 8.7% 49.0% 25.8% 7.2% 5.2%
e. Investment in policies and procedures 345 2.3% 5.2% 47.8% 31.0% 7.5% 6.1%
Has your local government purchased cybersecurity insurance? n=341
Yes 44.0% No 56.0% If yes, to what extent does the insurance cover your cybersecurity exposure? (Please select one.)
n=152
Very little coverage Limited coverage Moderate coverage Most coverage Full coverage Don’t know
1.3% 19.7% 36.2% 17.1% 9.9% 15.8%
How would you rate your local government’s cybersecurity technology (hardware, software, etc.), practices (methods used, etc.), and policies (written or unwritten “rules” or procedures, etc.)?
Technology/Practice/Policy n State of the art
Current best practice
One generation behind current best practice
More than one generation behind current best practice
Don’t know
a. Technology 344 4.9% 50.6% 29.4% 8.7% 6.4%
b. Practices 344 1.2% 41.9% 32.3% 18.0% 6.7%
c. Policies 344 0.9% 30.5% 32.0% 26.2% 10.5%
In deploying cybersecurity in your local government, are you aware of either the ISO 27000 series or the 2014 NIST Framework for Improving Critical Infrastructure Cybersecurity, and do you employ either?
Framework n No, not aware Yes, aware and
employ it substantially Yes, aware and
employ it partially Yes, aware and don’t
employ it
a. ISO 27000 336 53.3% 2.4% 21.7% 22.6%
b. 2014 NIST Framework 337 47.2% 5.0% 28.5% 19.3%
Please rate the following in terms of their relative importance to your local government’s cybersecurity staff for learning about cybersecurity problems and best practices.
Institution n Not at all important
Slightly important
Moderately important
Very important
Extremely important
Don’t know
a. NIST (National Institute of Standards and Technology) 335 7.8% 9.3% 21.8% 24.2% 13.1% 23.9%
b. FBI (Federal Bureau of Investigation) 332 8.4% 11.7% 22.9% 24.7% 15.4% 16.9%
c. CERT (The CERT Program of the Software Engineering Institute, Carnegie Mellon University)
332 12.7% 13.3% 18.1% 23.2% 9.3% 23.5%
d. DoD (Department of Defense) 328 19.5% 19.8% 16.2% 17.1% 7.0% 20.4%
e. Vendors 336 3.3% 15.5% 28.9% 26.8% 14.0% 11.6%
f. Other local governments 334 3.9% 12.0% 29.6% 27.5% 15.0% 12.0%
g. Our state government 333 6.9% 18.3% 24.3% 22.5% 13.8% 14.1%
h. Other state governments 326 23.0% 21.5% 21.5% 13.5% 4.3% 16.3%
i. ISO (International Organization for Standardization) 331 14.5% 18.4% 23.9% 15.1% 7.6% 20.5%
j. IT-ISAC (IT - Information Sharing and Analysis Center) 325 14.5% 15.1% 15.4% 13.2% 10.5% 31.4%
k. OWASP (Open Web Application Security Project) 327 20.8% 18.7% 13.5% 10.1% 4.0% 33.0%
l. MSiSAC (Multi-State Information Sharing and Analysis Center)
328 14.0% 14.9% 14.0% 12.5% 15.5% 29.0%
m. Other 65 7.7% 3.1% 4.6% 3.1% 20.0% 61.5%
Page 12 of 12
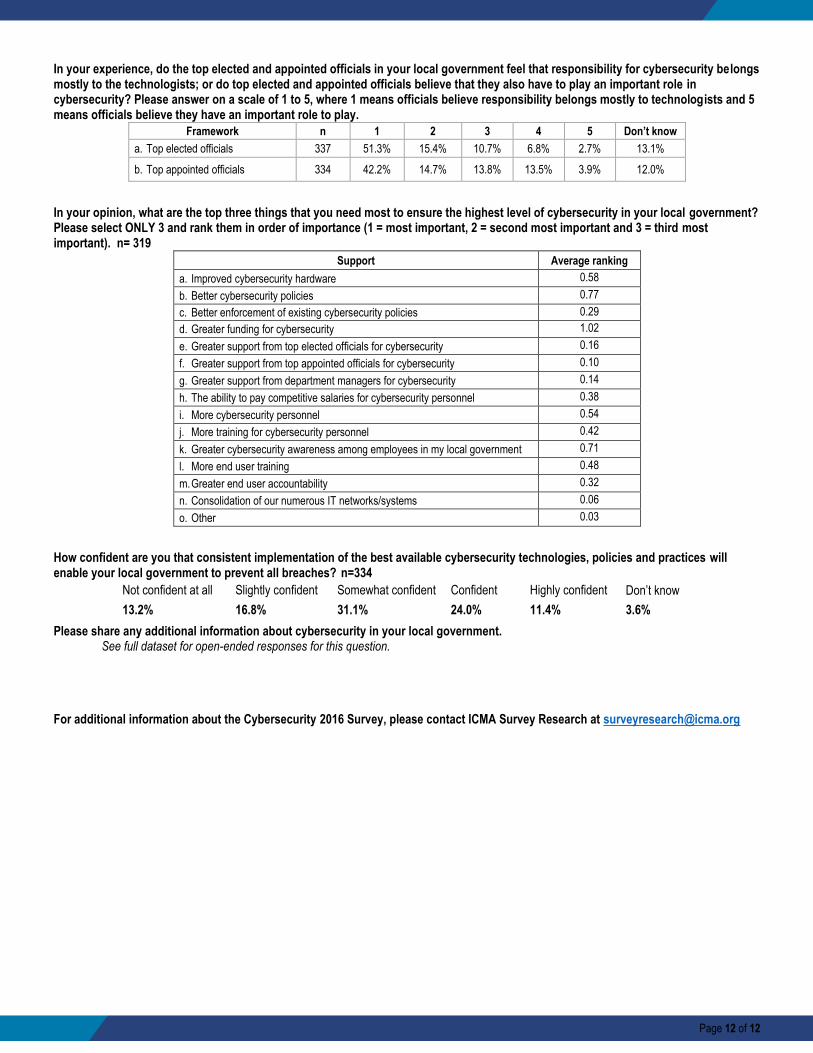
In your experience, do the top elected and appointed officials in your local government feel that responsibility for cybersecurity belongs mostly to the technologists; or do top elected and appointed officials believe that they also have to play an important role in cybersecurity? Please answer on a scale of 1 to 5, where 1 means officials believe responsibility belongs mostly to technologists and 5 means officials believe they have an important role to play.
Framework n 1 2 3 4 5 Don’t know
a. Top elected officials 337 51.3% 15.4% 10.7% 6.8% 2.7% 13.1%
b. Top appointed officials 334 42.2% 14.7% 13.8% 13.5% 3.9% 12.0%
In your opinion, what are the top three things that you need most to ensure the highest level of cybersecurity in your local government? Please select ONLY 3 and rank them in order of importance (1 = most important, 2 = second most important and 3 = third most important). n= 319
Support Average ranking
a. Improved cybersecurity hardware 0.58
b. Better cybersecurity policies 0.77
c. Better enforcement of existing cybersecurity policies 0.29
d. Greater funding for cybersecurity 1.02
e. Greater support from top elected officials for cybersecurity 0.16
f. Greater support from top appointed officials for cybersecurity 0.10
g. Greater support from department managers for cybersecurity 0.14
h. The ability to pay competitive salaries for cybersecurity personnel 0.38
i. More cybersecurity personnel 0.54
j. More training for cybersecurity personnel 0.42
k. Greater cybersecurity awareness among employees in my local government 0.71
l. More end user training 0.48
m. Greater end user accountability 0.32
n. Consolidation of our numerous IT networks/systems 0.06
o. Other 0.03
How confident are you that consistent implementation of the best available cybersecurity technologies, policies and practices will enable your local government to prevent all breaches? n=334
Not confident at all Slightly confident Somewhat confident Confident Highly confident Don’t know
13.2% 16.8% 31.1% 24.0% 11.4% 3.6%
Please share any additional information about cybersecurity in your local government. See full dataset for open-ended responses for this question.
For additional information about the Cybersecurity 2016 Survey, please contact ICMA Survey Research at [email protected]