Embed Size (px)
Citation preview
11/17/2011
1
Can We Save the California Delta F th ff t f l l i ?From the effects of sea level rise?
By Maurice Roos
Chief Hydrologist (part time), CA Dep’t of Water ResourcesResources
For the May 2011 European ICID Regional Congress
Groningen, Netherlands
800 Km of canals, siphons, & tunnels
13.5 BCM total storage capacity
1060 Km miles of canals, siphons, & tunnels
7.1 BCM total storage capacity
11/17/2011
2
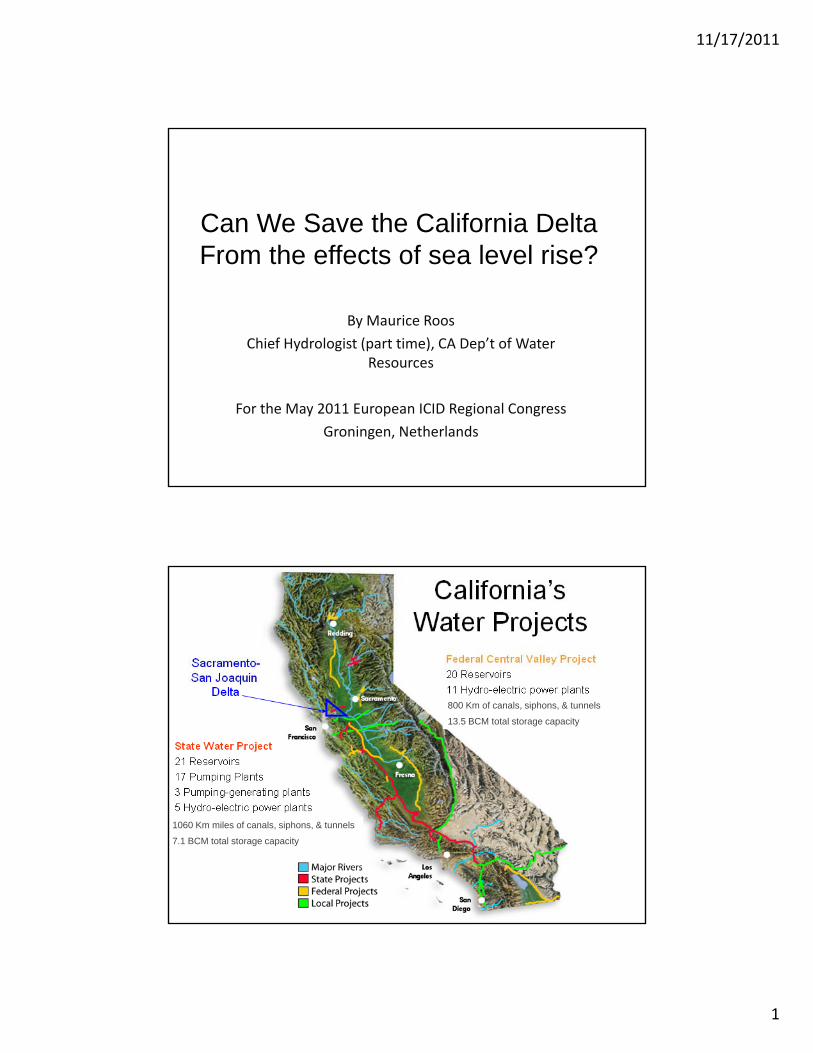
Waterways
• Largest tidal estuary on US West Coast
A id l fl• Average tidal outflow 170,000 cfs (5,000 m3 /s)
• Habitat for 750 fish, bird, and plant species
• Drinking water for 25 illi l
3
million people
• Irrigation water for 4.5 million acres (1.8 million ha) crop land
11/17/2011
3
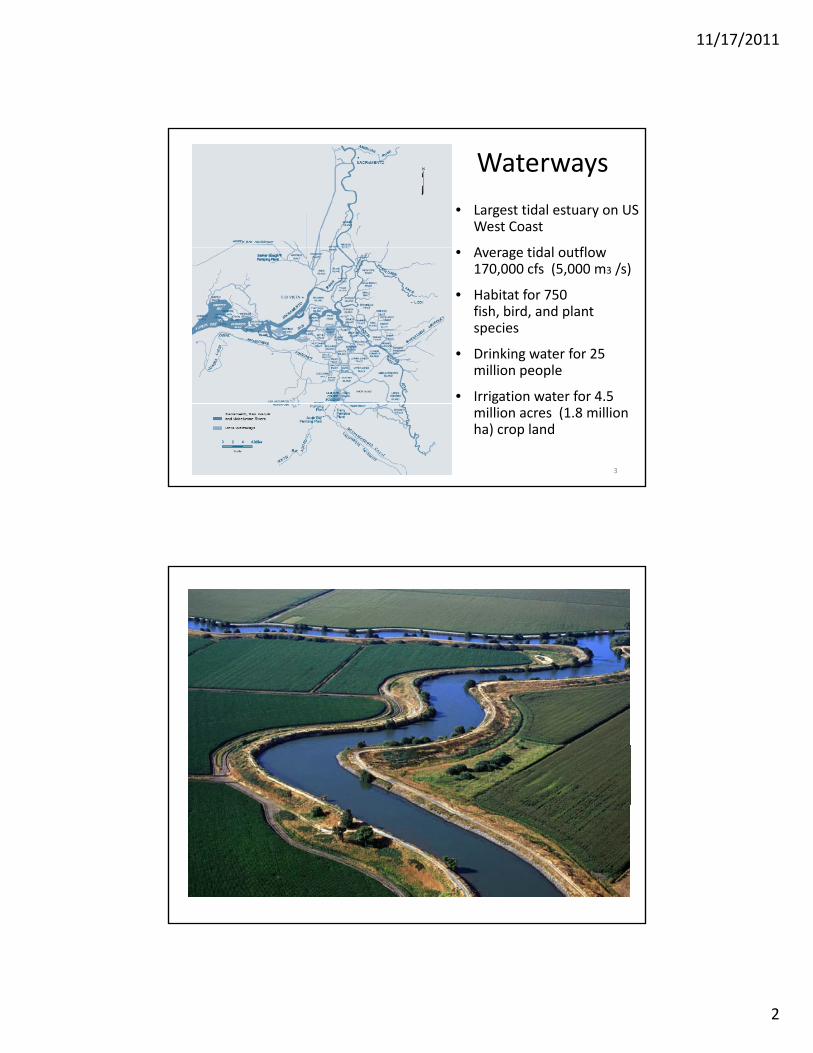
Accommodation Space
• Delta Islands are Delta Bowls
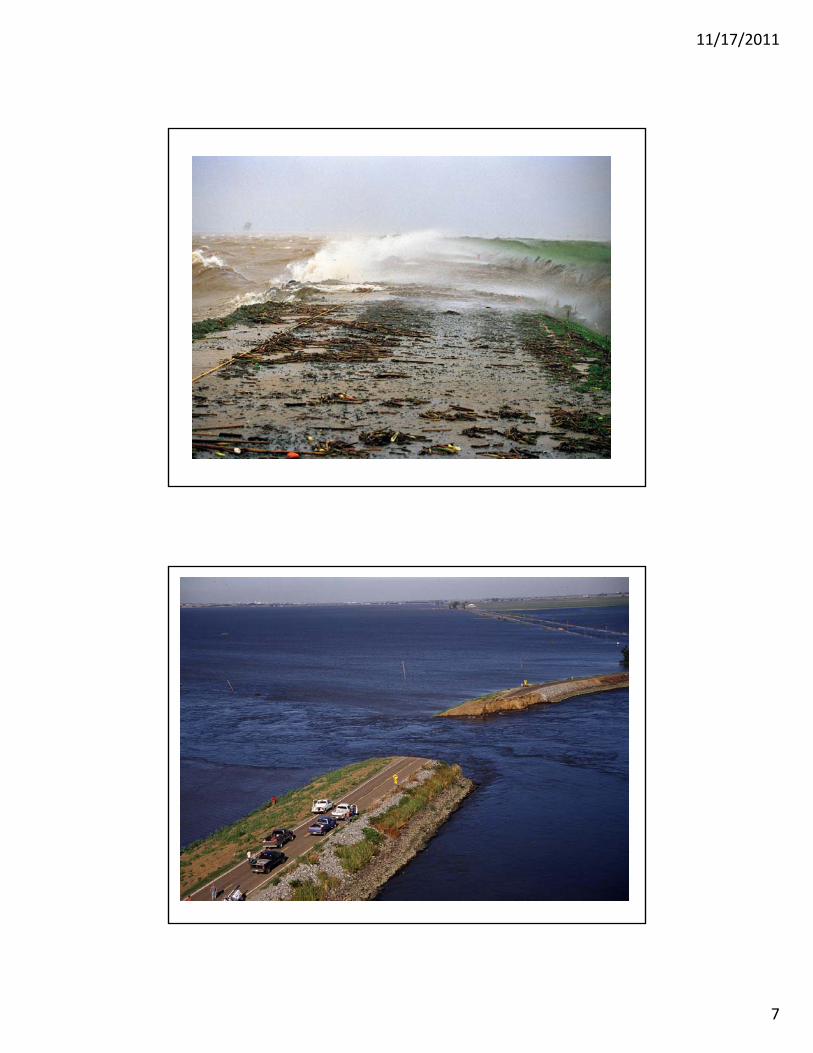
• Pressure on levees is increasing due to both– Subsidence– Sea Level Rise
6
Graphic courtesy ofDr. Jeffrey Mount (UC Davis)
11/17/2011
4
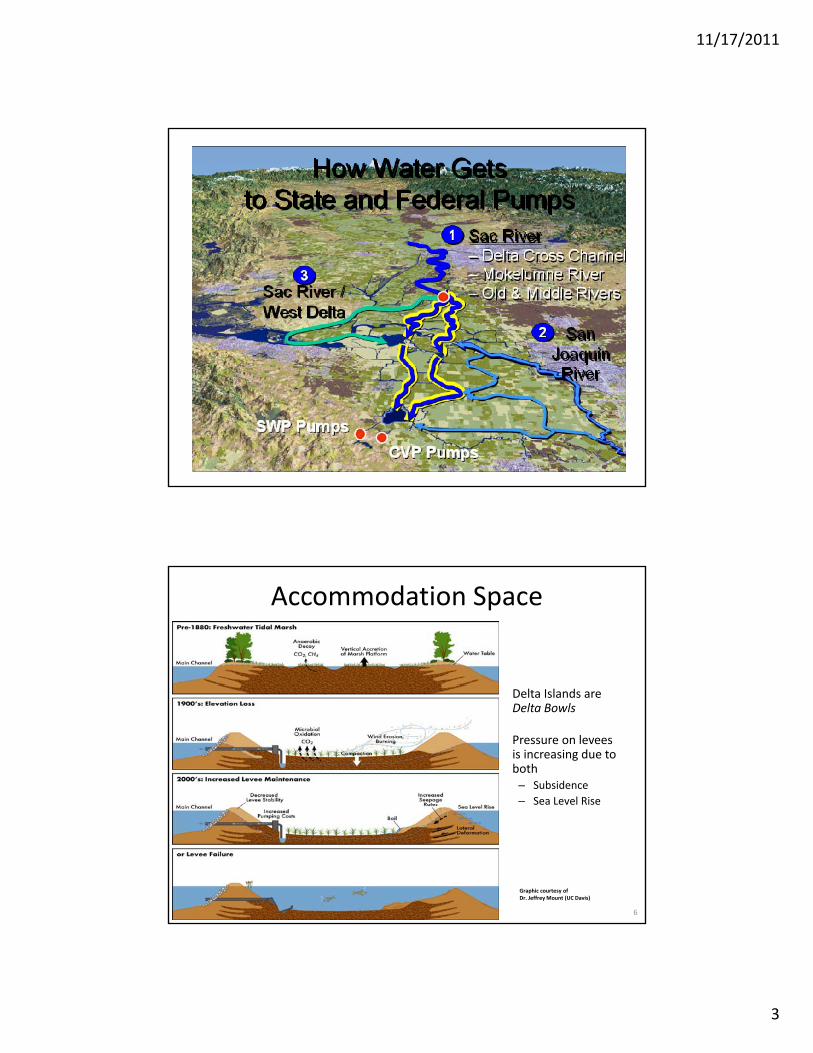
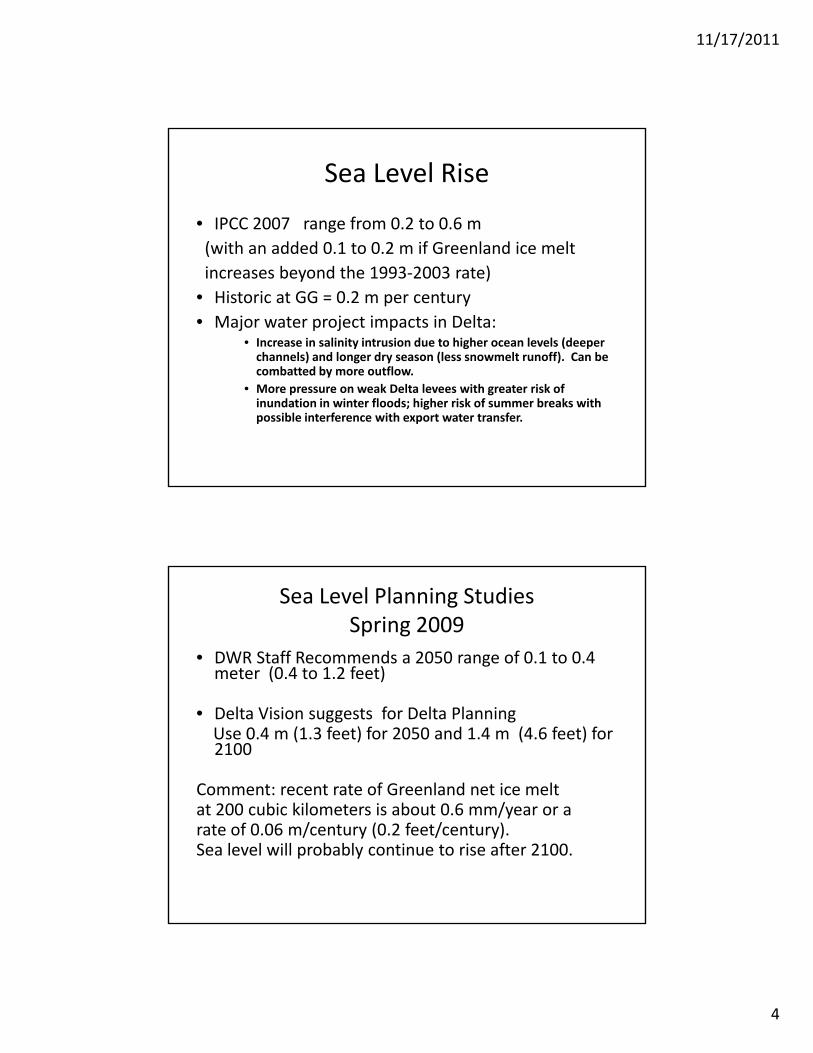
Sea Level Rise
• IPCC 2007 range from 0.2 to 0.6 m(with an added 0 1 to 0 2 m if Greenland ice melt(with an added 0.1 to 0.2 m if Greenland ice meltincreases beyond the 1993‐2003 rate)
• Historic at GG = 0.2 m per century• Major water project impacts in Delta:
• Increase in salinity intrusion due to higher ocean levels (deeper channels) and longer dry season (less snowmelt runoff). Can be
b d b flcombatted by more outflow.• More pressure on weak Delta levees with greater risk of inundation in winter floods; higher risk of summer breaks with possible interference with export water transfer.
Sea Level Planning StudiesSpring 2009
• DWR Staff Recommends a 2050 range of 0.1 to 0.4 meter (0.4 to 1.2 feet)
• Delta Vision suggests for Delta Planning Use 0.4 m (1.3 feet) for 2050 and 1.4 m (4.6 feet) for 2100
Comment: recent rate of Greenland net ice meltt 200 bi kil t i b t 0 6 /at 200 cubic kilometers is about 0.6 mm/year or a rate of 0.06 m/century (0.2 feet/century).Sea level will probably continue to rise after 2100.
11/17/2011
5
3.50
3.70
3.90
9.40
9.60
9.80ee
t)
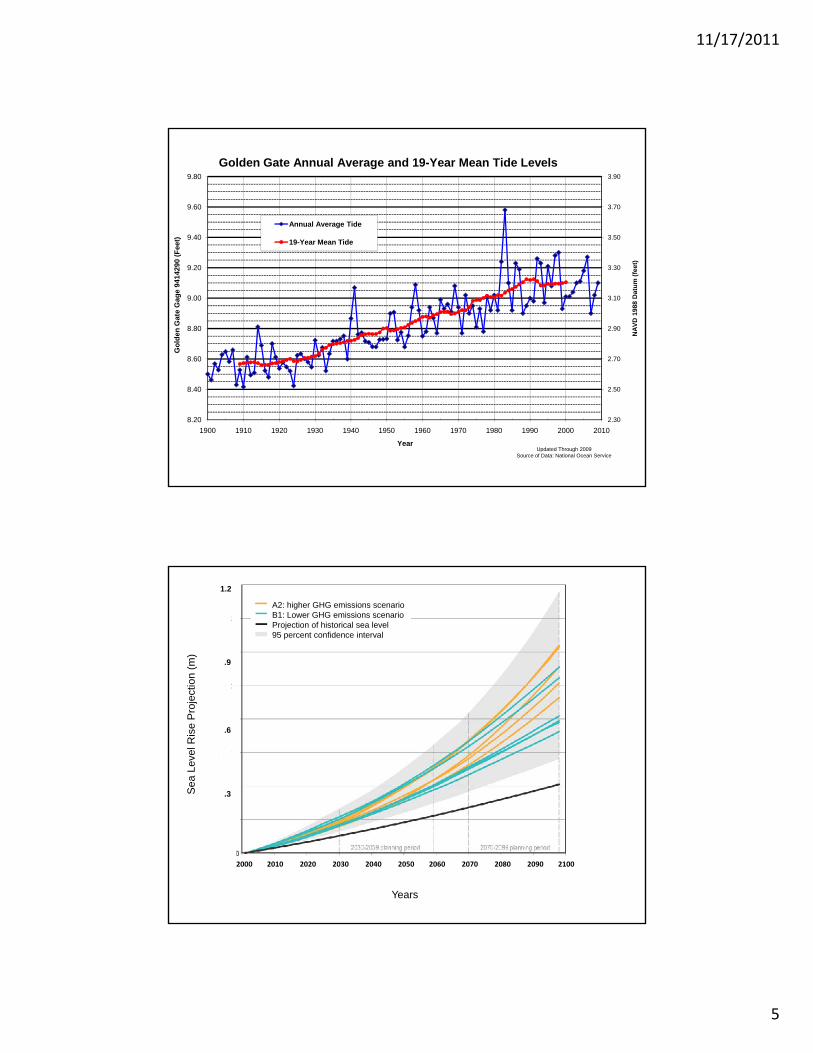
Annual Average Tide
19-Year Mean Tide
Golden Gate Annual Average and 19-Year Mean Tide Levels
2.70
2.90
3.10
3.30
8.60
8.80
9.00
9.20
NAV
D 1
988
Dat
um (f
eet)
Gol
den
Gat
e G
age
9414
290
(Fe
2.30
2.50
8.20
8.40
1900 1910 1920 1930 1940 1950 1960 1970 1980 1990 2000 2010
YearUpdated Through 2009
Source of Data: National Ocean Service
on (m
)
.9
1.2
A2: higher GHG emissions scenarioB1: Lower GHG emissions scenarioProjection of historical sea level95 percent confidence interval
.3 Sea
Lev
el R
ise
Pro
ject
i
.6
2000 2010 2020 2030 2040 2050 2060 2070 2080 2090 2100
Years
11/17/2011
6
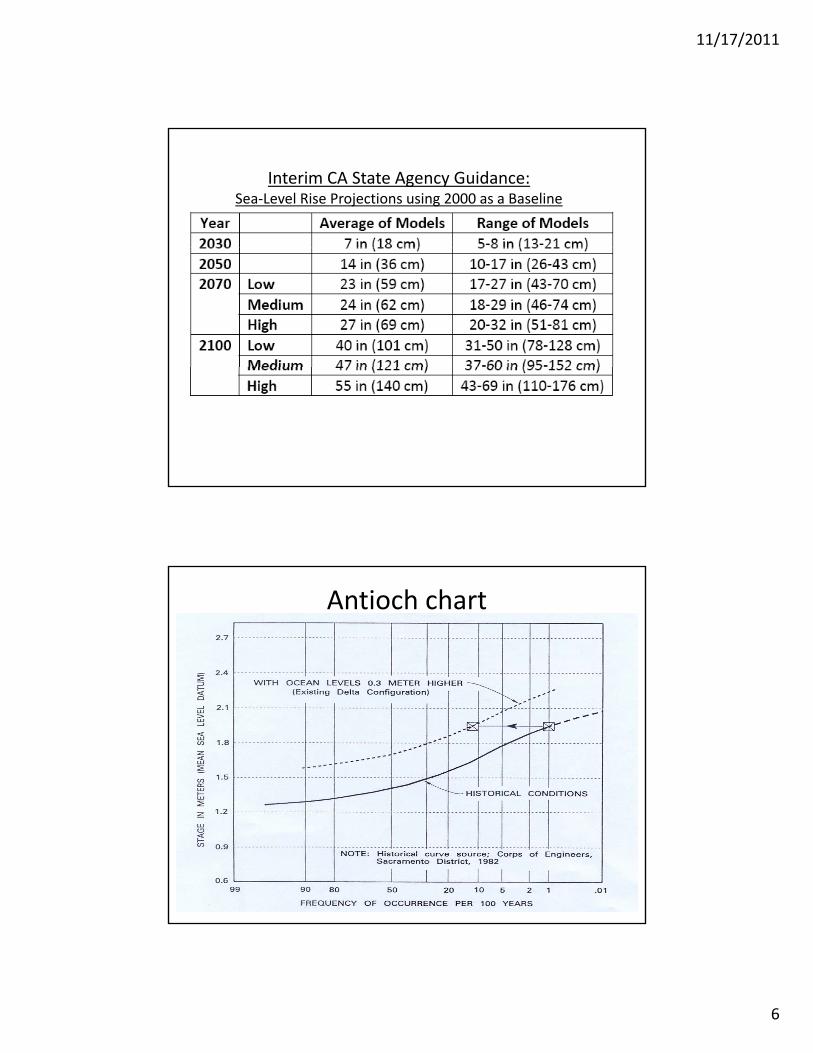
Interim CA State Agency Guidance:Sea‐Level Rise Projections using 2000 as a Baseline
Antioch chart
11/17/2011
7
11/17/2011
8
New NRC Sea Level Rise Panel
• 10 ‐12 experts to provide guidance on long‐i ti t f l i frange rise estimates for planning for
2030, 2050 and 2100
• Evaluate global and local factors
• For CA, OR & WA
• Report due in 2012• Report due in 2012
• Expected cost = $ 500 K or so
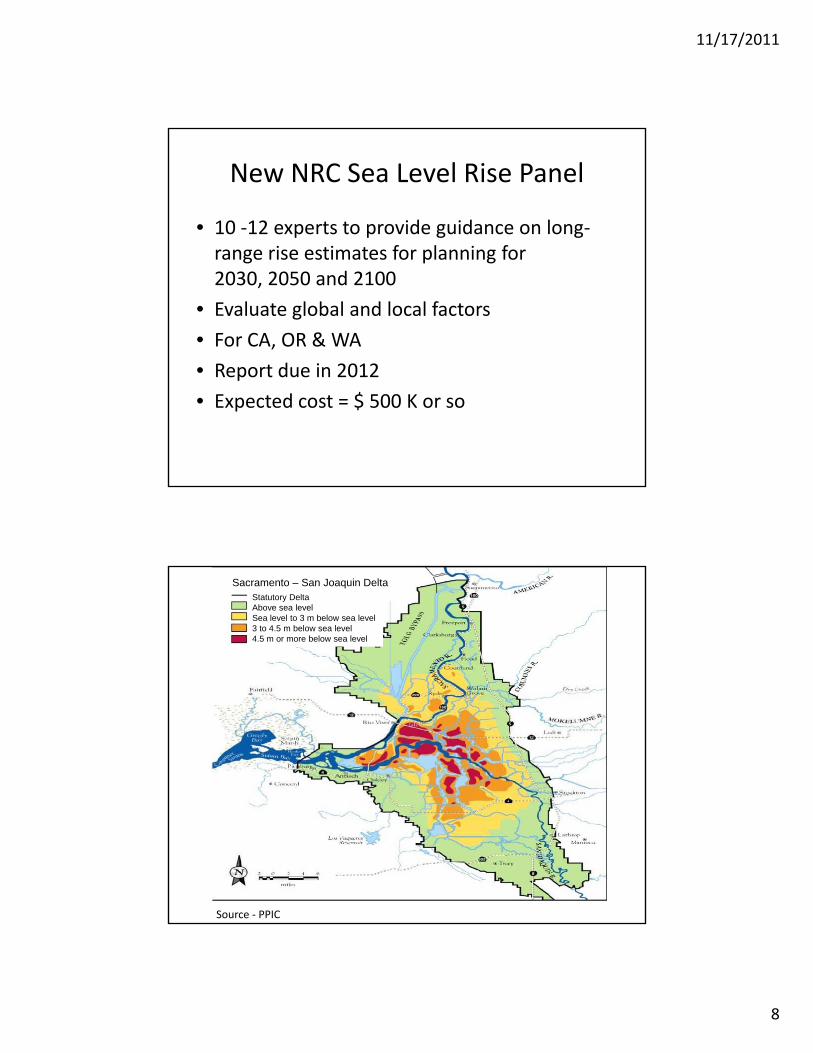
Statutory DeltaAbove sea levelSea level to 3 m below sea level3 to 4.5 m below sea level4.5 m or more below sea level
Sacramento – San Joaquin Delta
Source ‐ PPIC
11/17/2011
9
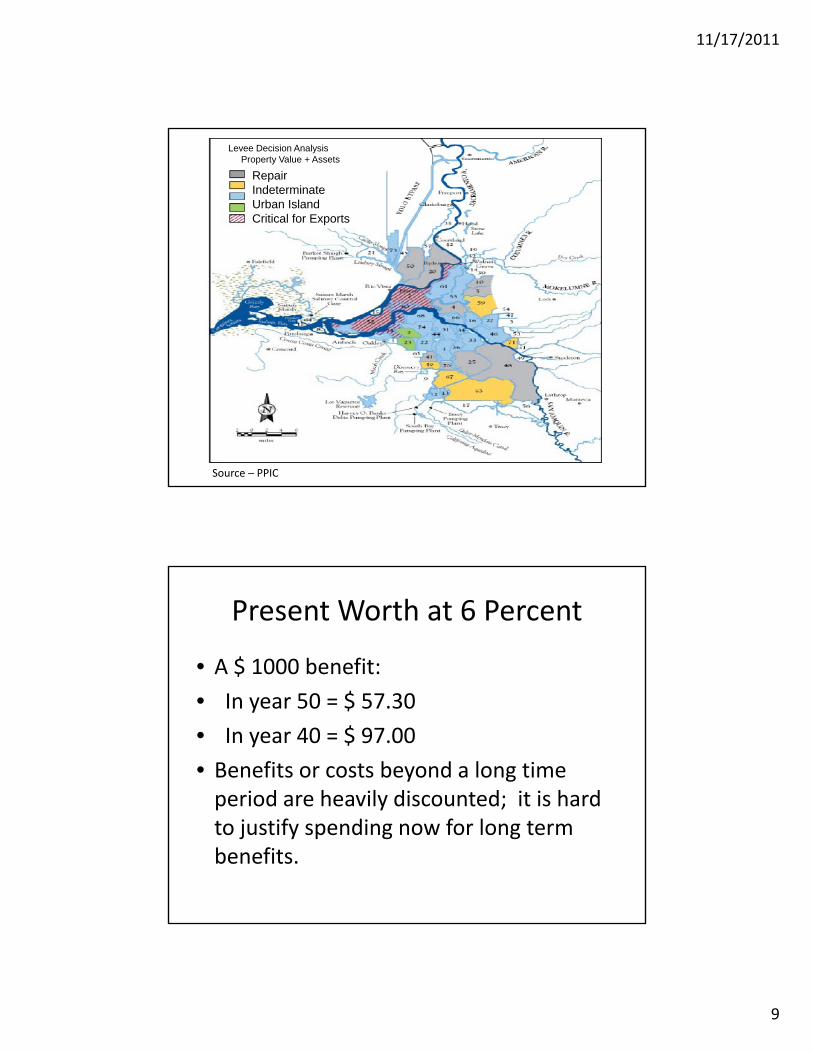
RepairIndeterminateUrban IslandCritical for Exports
Levee Decision Analysis Property Value + Assets
Source – PPIC
Present Worth at 6 Percent
• A $ 1000 benefit:
• In year 50 = $ 57.30
• In year 40 = $ 97.00
• Benefits or costs beyond a long time period are heavily discounted; it is hardperiod are heavily discounted; it is hard to justify spending now for long term benefits.
11/17/2011
10
Best Approach
• Spend modest amounts, on the order of 40 million dollars annually, for the next 20 – 30 years to keep pace with the current slow rise in sea level, maintaining the same relative risk as present. Let our hild d id h t t d th ithchildren decide what to do then with better information and projections.