Embed Size (px)
Citation preview

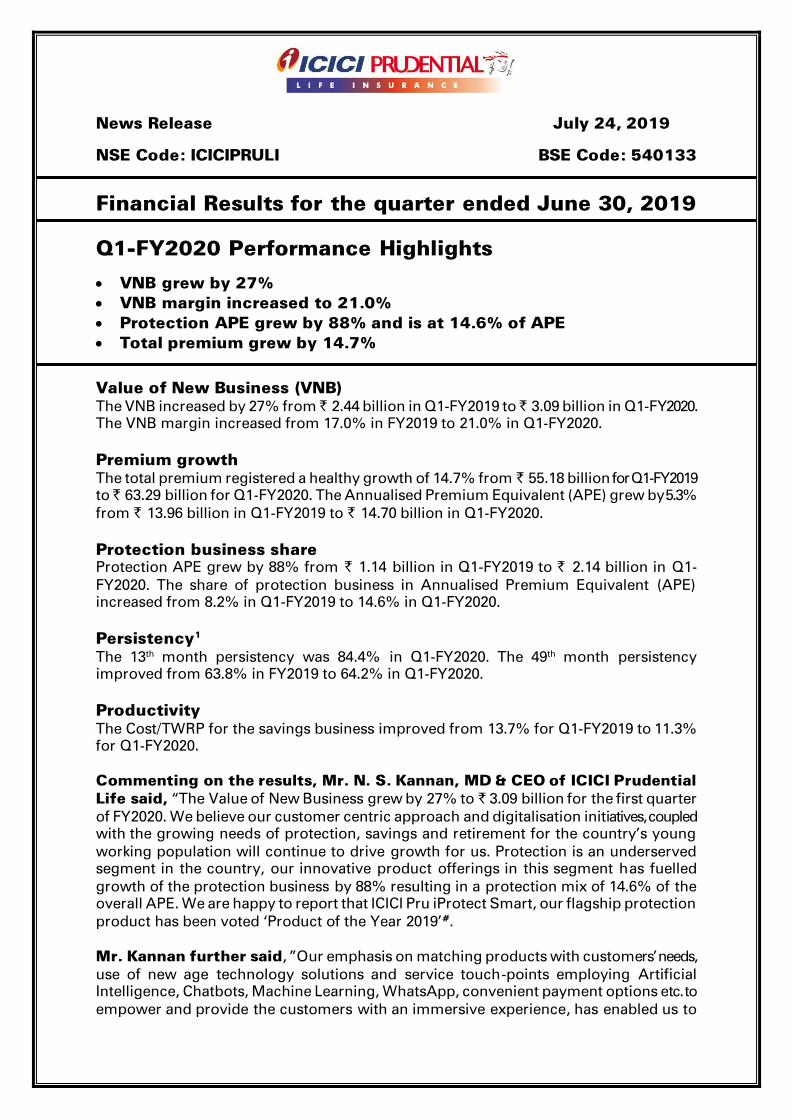
News Release July 24, 2019
NSE Code: ICICIPRULI BSE Code: 540133
Financial Results for the quarter ended June 30, 2019
Q1-FY2020 Performance Highlights
VNB grew by 27%
VNB margin increased to 21.0%
Protection APE grew by 88% and is at 14.6% of APE
Total premium grew by 14.7%
Value of New Business (VNB)
The VNB increased by 27% from ̀ 2.44 billion in Q1-FY2019 to ̀ 3.09 billion in Q1-FY2020.
The VNB margin increased from 17.0% in FY2019 to 21.0% in Q1-FY2020.
Premium growth
The total premium registered a healthy growth of 14.7% from ` 55.18 billion for Q1-FY2019
to ̀ 63.29 billion for Q1-FY2020. The Annualised Premium Equivalent (APE) grew by 5.3%
from ` 13.96 billion in Q1-FY2019 to ` 14.70 billion in Q1-FY2020.
Protection business share
Protection APE grew by 88% from ` 1.14 billion in Q1-FY2019 to ` 2.14 billion in Q1-
FY2020. The share of protection business in Annualised Premium Equivalent (APE)
increased from 8.2% in Q1-FY2019 to 14.6% in Q1-FY2020.
Persistency1
The 13th month persistency was 84.4% in Q1-FY2020. The 49
th month persistency
improved from 63.8% in FY2019 to 64.2% in Q1-FY2020.
Productivity
The Cost/TWRP for the savings business improved from 13.7% for Q1-FY2019 to 11.3%
for Q1-FY2020.
Commenting on the results, Mr. N. S. Kannan, MD & CEO of ICICI Prudential
Life said, “The Value of New Business grew by 27% to ` 3.09 billion for the first quarter
of FY2020. We believe our customer centric approach and digitalisation initiatives, coupled
with the growing needs of protection, savings and retirement for the country’s young
working population will continue to drive growth for us. Protection is an underserved
segment in the country, our innovative product offerings in this segment has fuelled
growth of the protection business by 88% resulting in a protection mix of 14.6% of the
overall APE. We are happy to report that ICICI Pru iProtect Smart, our flagship protection
product has been voted ‘Product of the Year 2019’#.
Mr. Kannan further said, ”Our emphasis on matching products with customers’ needs,
use of new age technology solutions and service touch-points employing Artificial
Intelligence, Chatbots, Machine Learning, WhatsApp, convenient payment options etc. to
empower and provide the customers with an immersive experience, has enabled us to
have one of the best 13th month persistency
1 levels in the industry of 84.4%. Our Assets
under management grew 15% over the year to ` 1.64 trillion.”
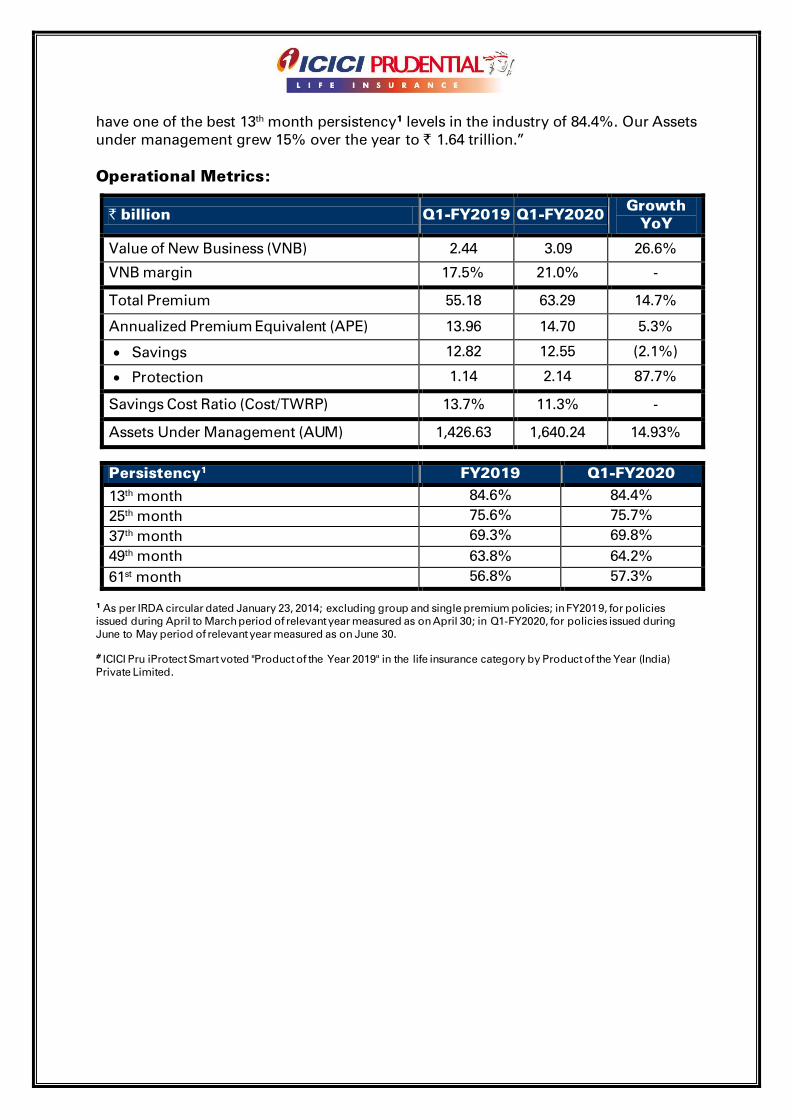
Operational Metrics:
` billion Q1-FY2019 Q1-FY2020 Growth
YoY
Value of New Business (VNB) 2.44 3.09 26.6%
VNB margin 17.5% 21.0% -
Total Premium 55.18 63.29 14.7%
Annualized Premium Equivalent (APE) 13.96 14.70 5.3%
Savings 12.82 12.55 (2.1%)
Protection 1.14 2.14 87.7%
Savings Cost Ratio (Cost/TWRP)
13.7% 11.3% -
Assets Under Management (AUM) 1,426.63 1,640.24 14.93%
Persistency1 FY2019 Q1-FY2020
13th month
84.6% 84.4%
25th month 75.6% 75.7%
37th month 69.3% 69.8%
49th month 63.8% 64.2%
61st month 56.8% 57.3%
1 As per IRDA circular dated January 23, 2014; excluding group and single premium policies; in FY2019, for policies
issued during April to March period of relevant year measured as on April 30; in Q1-FY2020, for policies issued during
June to May period of relevant year measured as on June 30.
# ICICI Pru iProtect Smart voted "Product of the Year 2019" in the life insurance category by Product of the Year (India)
Private Limited.
Definitions, abbreviations and explanatory notes
Annual Premium Equivalent (APE): APE is a measure of new business written by a life
insurance company. It is computed as the sum of annualised first year premiums on regular
premium policies, and ten percent of single premiums, written by the Company during any
period from new retail and group customers.
Value of New Business (VNB) and VNB margin: VNB is used to measure profitability of
the new business written in a period. It is present value of all future profits to shareholders
measured at the time of writing of the new business contract. Future profits are computed on
the basis of long term assumptions which are reviewed annually. VNB is also referred to as NBP
(new business profit). VNB margin is computed as VNB for the period/APE for the period. It is
similar to profit margin for any other business.
Retail Weighted Received Premium (RWRP): RWRP is a new business measure very
similar to APE for the retail (also referred to as individual) business with the only difference
being that the regular premiums considered here are first year premiums actually received by
the life insurer and not annualised. Secondly, since it is a new business measure for retail
business, it includes only premium received from retail customers. It is the sum of all retail first
year premiums and ten percent of retail single premiums received in a period.
Persistency: It is the most common parameter for quality of business representing the
percentage of retail policies (where premiums are expected) that continue paying premiums.
The method of computation of Persistency has been prescribed by IRDAI vide its circular dated
January 23, 2014.
Total Weighted Received Premium (TWRP): TWRP is a measure of total premiums from
new and existing retail and group customers received in a period. It is sum of first year and
renewal premiums on regular premium policies and ten percent of single premiums received
from both retail and group customers by Company during the period.
Cost Ratio: Cost ratio is a measure of the cost efficiency of a Company. Expenses are incurred
by the Company on new business as well as renewal premiums. Cost ratio is computed as a
ratio of all expenses incurred in a period comprising commission, operating expenses,
provision for doubtful debts and bad debts written off to total weighted received premium
(TWRP).
About ICICI Prudential Life Insurance
ICICI Prudential Life is promoted by ICICI Bank Ltd. and Prudential Corporation Holdings Ltd.,
headquartered in United Kingdom. The Company began operations in fiscal 2001 and has
consistently been amongst the top private sector life insurance companies in India.
The Company offers an array of products in the Protection and Savings category which match the
different life stage requirements of customers, enabling them to provide a financial safety net to
their families as well as achieve their long term financial goals. The digital platform of the Company
provides a paperless on-boarding experience to customers, empowers them to conduct an
assortment of self-service transactions, provides a convenient route to make digital payments for
purchasing & making renewal premium payments and facilitates a hassle free claims settlement
process etc.
ICICI Prudential Life is the first private life insurance company to cross the ` 1 trillion mark for Assets
under Management (AUM). At June 30, 2019, the Company had an AUM of ` 1,640.24 billion and a
Total Sum Assured of approx. ` 11.85 trillion. ICICI Prudential Life is listed on both National Stock
Exchange (NSE) and The Bombay Stock Exchange (BSE).
Disclaimer
Except for the historical information contained herein, statements in this release which contain
words or phrases such as 'will', ‘expected to’, etc., and similar expressions or variations of such
expressions may constitute 'forward-looking statements'. These forward-looking statements
involve a number of risks, uncertainties and other factors that could cause actual results,
opportunities and growth potential to differ materially from those suggested by the forward-looking
statements. These risks and uncertainties include but and are not limited to, the actual growth in
demand for insurance and other financial products and services in the countries that we operate or
where a material number of our customers reside, our ability to successfully implement our
strategy, including our use of the Internet and other technology our exploration of merger and
acquisition opportunities, our ability to integrate mergers or acquisitions into our operations and
manage the risks associated with such acquisitions to achieve our strategic and financial objectives,
our growth and expansion in domestic and overseas markets, technological changes, our ability to
market new products, the outcome of any legal, tax or regulatory proceedings in India and in other
jurisdictions we are or become a party to, the future impact of new accounting standards, our ability
to implement our dividend policy, the impact of changes in insurance regulations and other
regulatory changes in India and other jurisdictions on us. ICICI Prudential Life insurance undertakes
no obligation to update forward-looking statements to reflect events or circumstances after the date
thereof. This release does not constitute an offer of securities.
For further queries;
Adfactors PR
Ms. Jyothi Goswami
Mobile: +91 99870 36388
Email: [email protected]
ICICI Prudential Life Insurance Company
` 1 billion = ` 100 crore

Searchable format
(` in Lakhs)
Year
ended/at
June 30,
2019
March 31,
2019
June 30,
2018
March 31,
2019
(Audited) (Audited) (Audited) (Audited)
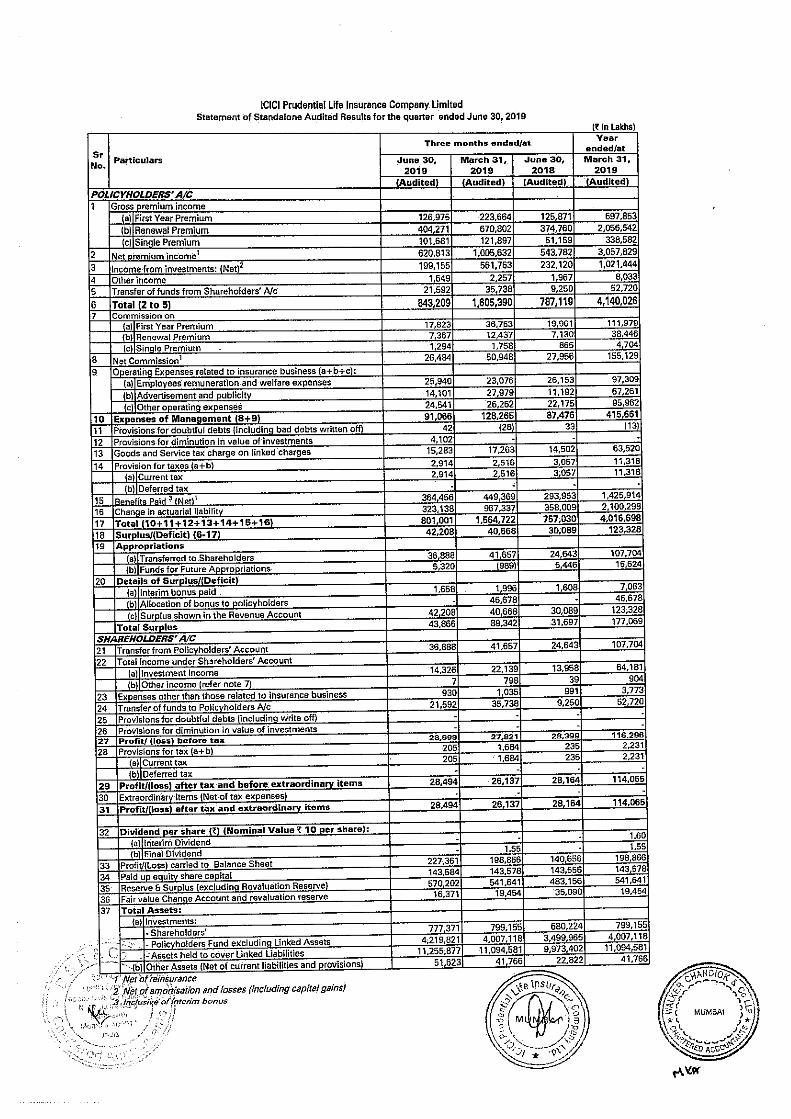
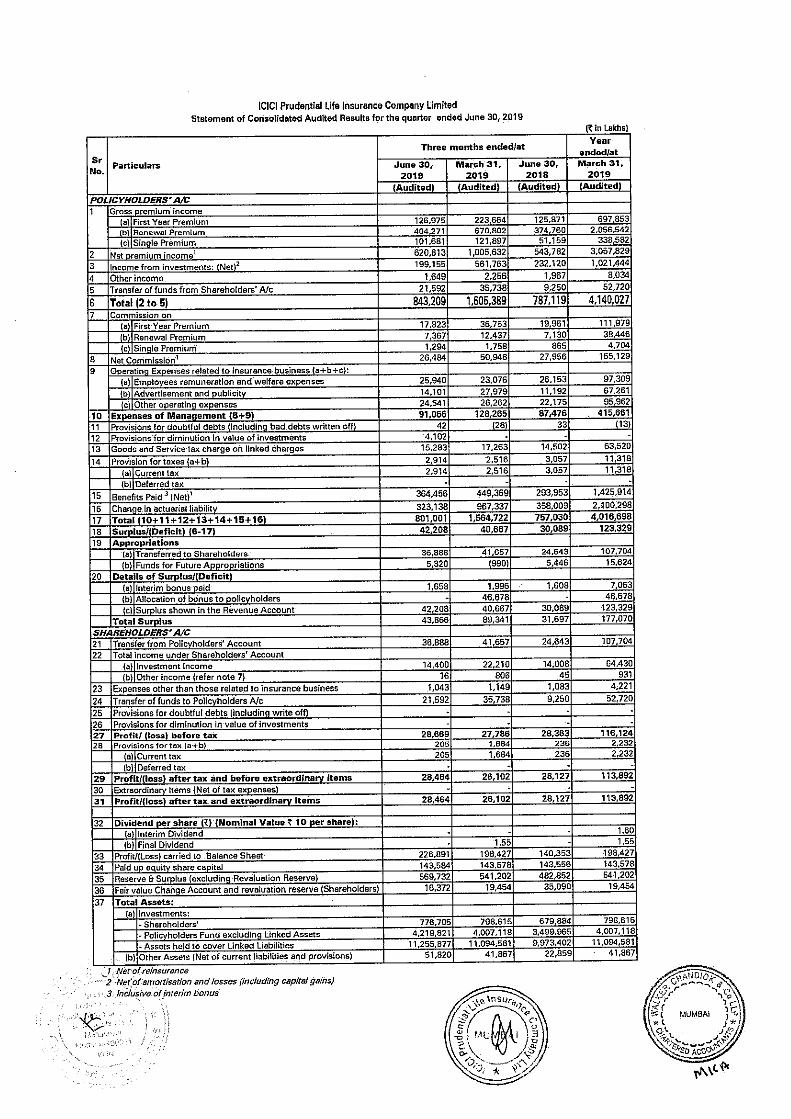
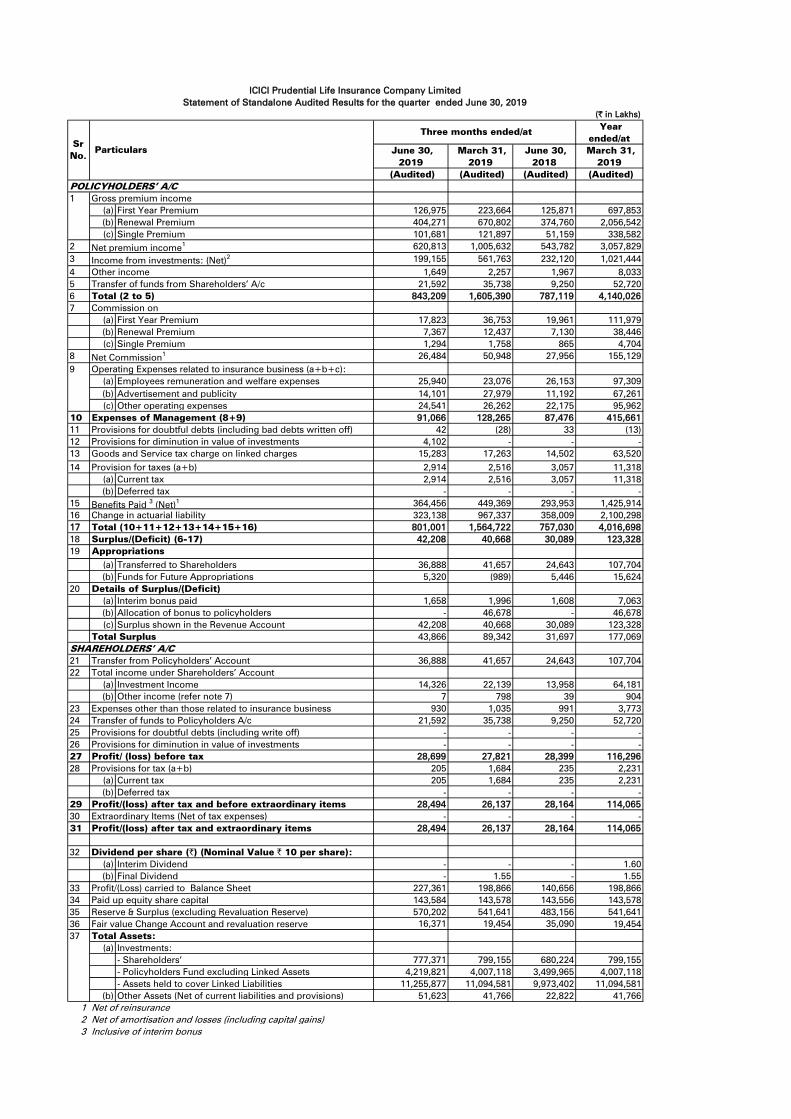
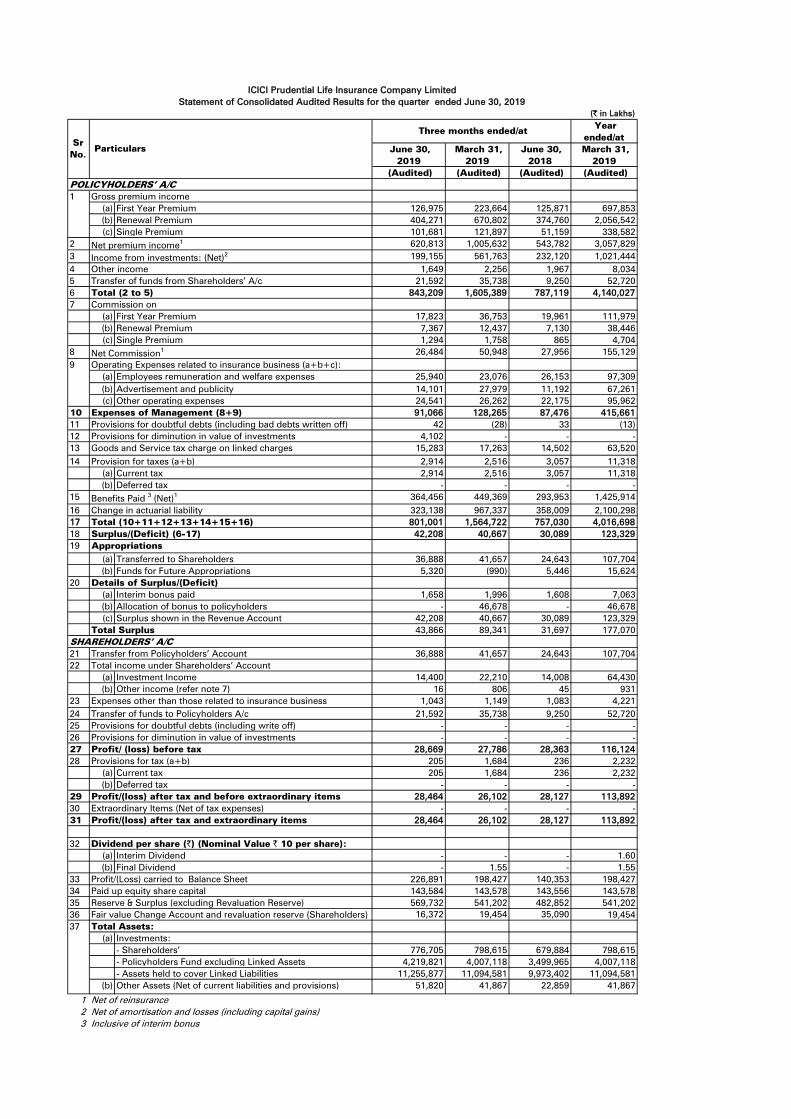
(a) First Year Premium 126,975 223,664 125,871 697,853
(b) Renewal Premium 404,271 670,802 374,760 2,056,542
(c) Single Premium 101,681 121,897 51,159 338,582
2 620,813 1,005,632 543,782 3,057,829
3 199,155 561,763 232,120 1,021,444
4 1,649 2,257 1,967 8,033
5 21,592 35,738 9,250 52,720
6 843,209 1,605,390 787,119 4,140,026
7
(a) First Year Premium 17,823 36,753 19,961 111,979
(b) Renewal Premium 7,367 12,437 7,130 38,446
(c) Single Premium 1,294 1,758 865 4,704
8 26,484 50,948 27,956 155,129
(a) Employees remuneration and welfare expenses 25,940 23,076 26,153 97,309
(b) Advertisement and publicity 14,101 27,979 11,192 67,261
(c) Other operating expenses 24,541 26,262 22,175 95,962
10 91,066 128,265 87,476 415,661
11 42 (28) 33 (13)
12 4,102 - - -
13 15,283 17,263 14,502 63,520
14 2,914 2,516 3,057 11,318
(a) Current tax 2,914 2,516 3,057 11,318
(b) Deferred tax - - - -
15 364,456 449,369 293,953 1,425,914
16 323,138 967,337 358,009 2,100,298
17 801,001 1,564,722 757,030 4,016,698
18 42,208 40,668 30,089 123,328
19
(a) Transferred to Shareholders 36,888 41,657 24,643 107,704
(b) Funds for Future Appropriations 5,320 (989) 5,446 15,624
20
(a) Interim bonus paid 1,658 1,996 1,608 7,063
(b) Allocation of bonus to policyholders - 46,678 - 46,678
(c) Surplus shown in the Revenue Account 42,208 40,668 30,089 123,328
43,866 89,342 31,697 177,069
21 36,888 41,657 24,643 107,704
22
(a) Investment Income 14,326 22,139 13,958 64,181
(b) Other income (refer note 7) 7 798 39 904
23 930 1,035 991 3,773
24 21,592 35,738 9,250 52,720
25 - - - -
26 - - - -
27 28,699 27,821 28,399 116,296
28 205 1,684 235 2,231
(a) Current tax 205 1,684 235 2,231
(b) Deferred tax - - - -
29 28,494 26,137 28,164 114,065
30 - - - -
31 28,494 26,137 28,164 114,065
32
(a) Interim Dividend - - - 1.60
(b) Final Dividend - 1.55 - 1.55
33 227,361 198,866 140,656 198,866
34 143,584 143,578 143,556 143,578
35 570,202 541,641 483,156 541,641
36 16,371 19,454 35,090 19,454
(a) Investments:
- Shareholders’ 777,371 799,155 680,224 799,155
- Policyholders Fund excluding Linked Assets 4,219,821 4,007,118 3,499,965 4,007,118
- Assets held to cover Linked Liabilities 11,255,877 11,094,581 9,973,402 11,094,581
(b) Other Assets (Net of current liabilities and provisions) 51,623 41,766 22,822 41,766
1 Net of reinsurance
2 Net of amortisation and losses (including capital gains)
3 Inclusive of interim bonus
37 Total Assets:
Dividend per share (`) (Nominal Value ` 10 per share):
Profit/(Loss) carried to Balance Sheet
Paid up equity share capital
Reserve & Surplus (excluding Revaluation Reserve)
Fair value Change Account and revaluation reserve
Total income under Shareholders’ Account
Expenses other than those related to insurance business
Transfer of funds to Policyholders A/c
Provisions for doubtful debts (including write off)
Provisions for diminution in value of investments
Profit/ (loss) before tax
Provisions for tax (a+b)
Profit/(loss) after tax and before extraordinary items
Extraordinary Items (Net of tax expenses)
Profit/(loss) after tax and extraordinary items
Transfer from Policyholders’ Account
Change in actuarial liability
Total (10+11+12+13+14+15+16)
Surplus/(Deficit) (6-17)
Appropriations
Details of Surplus/(Deficit)
Total Surplus
SHAREHOLDERS’ A/C
ICICI Prudential Life Insurance Company Limited
Statement of Standalone Audited Results for the quarter ended June 30, 2019
Benefits Paid 3
(Net)1
Transfer of funds from Shareholders’ A/c
Total (2 to 5)
Commission on
Net Commission1
Expenses of Management (8+9)
Provisions for doubtful debts (including bad debts written off)
Provisions for diminution in value of investments
Goods and Service tax charge on linked charges
Provision for taxes (a+b)
9 Operating Expenses related to insurance business (a+b+c):
POLICYHOLDERS’ A/C
1
Income from investments: (Net)2
Other income
Sr
No. Particulars
Three months ended/at
Gross premium income
Net premium income1

(` in Lakhs)
(Audited) (Audited) (Audited)
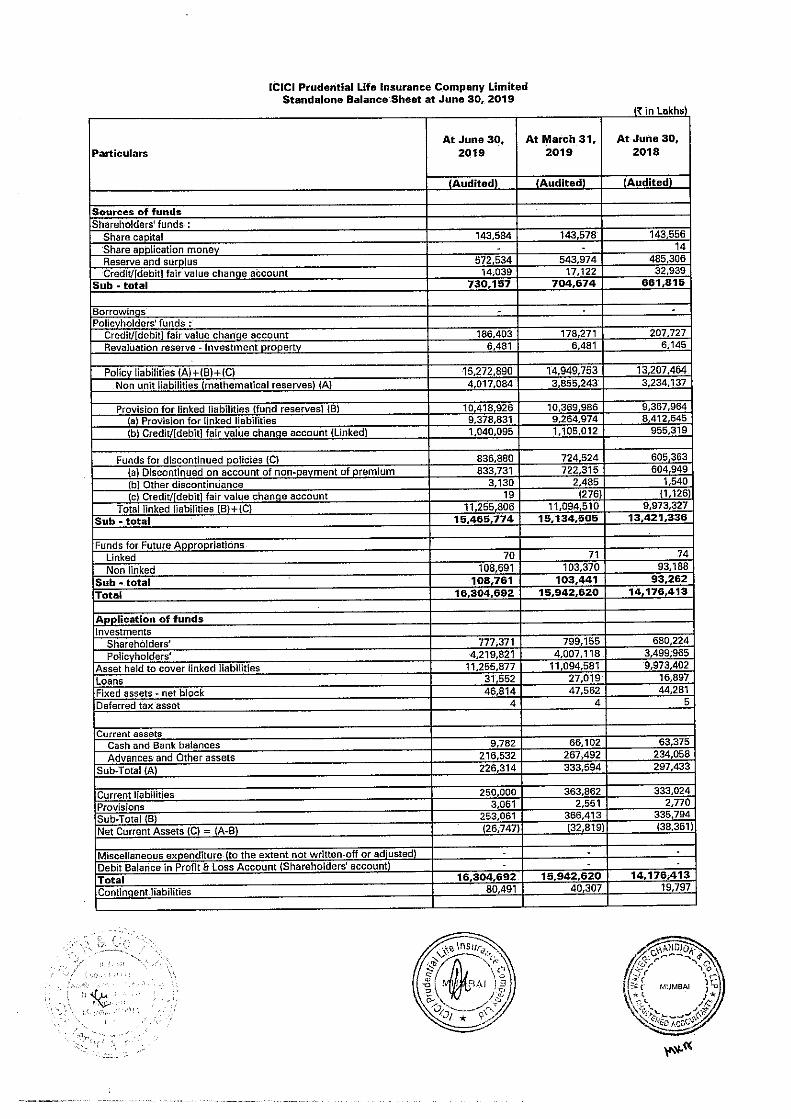
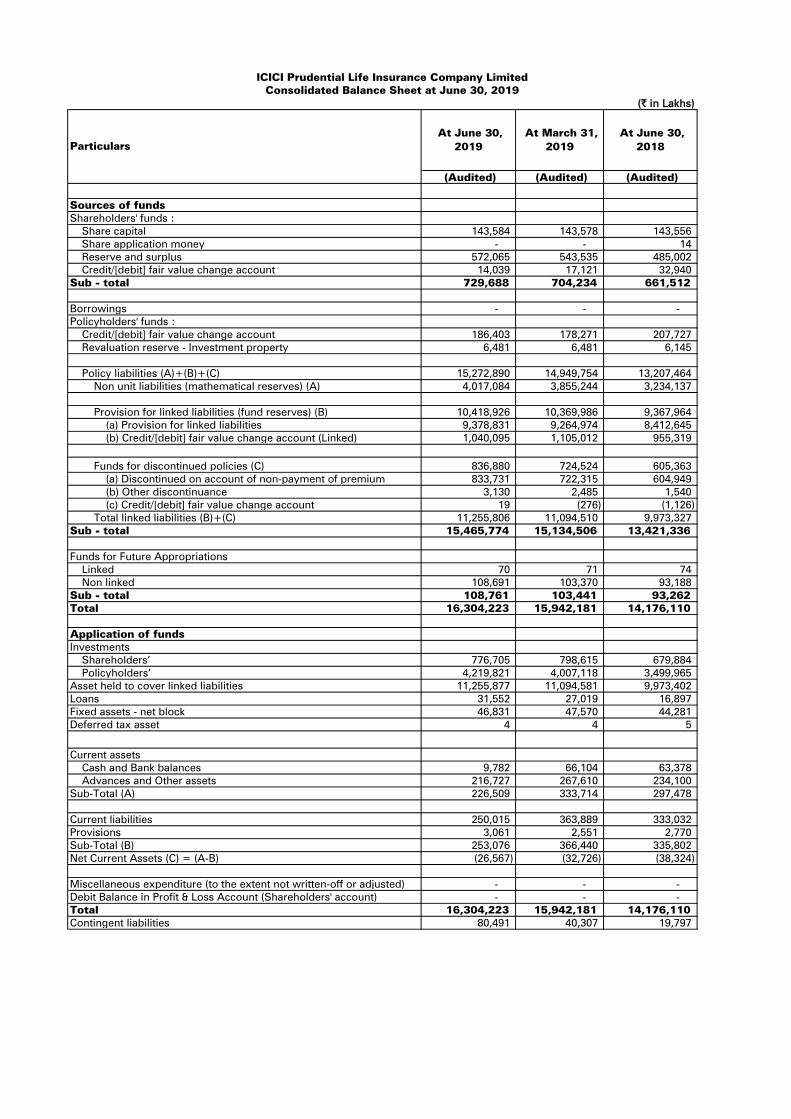
Sources of funds
Shareholders' funds :
Share capital 143,584 143,578 143,556
Share application money - - 14
Reserve and surplus 572,534 543,974 485,306
Credit/[debit] fair value change account 14,039 17,122 32,939
Sub - total 730,157 704,674 661,815
Borrowings - - -
Policyholders' funds :
Credit/[debit] fair value change account 186,403 178,271 207,727
Revaluation reserve - Investment property 6,481 6,481 6,145
Policy liabilities (A)+(B)+(C) 15,272,890 14,949,753 13,207,464
Non unit liabilities (mathematical reserves) (A) 4,017,084 3,855,243 3,234,137
Provision for linked liabilities (fund reserves) (B) 10,418,926 10,369,986 9,367,964
(a) Provision for linked liabilities 9,378,831 9,264,974 8,412,645
(b) Credit/[debit] fair value change account (Linked) 1,040,095 1,105,012 955,319
Funds for discontinued policies (C) 836,880 724,524 605,363
(a) Discontinued on account of non-payment of premium 833,731 722,315 604,949
(b) Other discontinuance 3,130 2,485 1,540
(c) Credit/[debit] fair value change account 19 (276) (1,126)
Total linked liabilities (B)+(C) 11,255,806 11,094,510 9,973,327
Sub - total 15,465,774 15,134,505 13,421,336
Funds for Future Appropriations
Linked 70 71 74
Non linked 108,691 103,370 93,188
Sub - total 108,761 103,441 93,262
Total 16,304,692 15,942,620 14,176,413
Application of funds
Investments
Shareholders’ 777,371 799,155 680,224
Policyholders’ 4,219,821 4,007,118 3,499,965
Asset held to cover linked liabilities 11,255,877 11,094,581 9,973,402
Loans 31,552 27,019 16,897
Fixed assets - net block 46,814 47,562 44,281
Deferred tax asset 4 4 5
Current assets
Cash and Bank balances 9,782 66,102 63,375
Advances and Other assets 216,532 267,492 234,058
Sub-Total (A) 226,314 333,594 297,433
Current liabilities 250,000 363,862 333,024
Provisions 3,061 2,551 2,770
Sub-Total (B) 253,061 366,413 335,794
Net Current Assets (C) = (A-B) (26,747) (32,819) (38,361)
Miscellaneous expenditure (to the extent not written-off or adjusted) - - -
Debit Balance in Profit & Loss Account (Shareholders' account) - - -
Total 16,304,692 15,942,620 14,176,413
Contingent liabilities 80,491 40,307 19,797
ICICI Prudential Life Insurance Company Limited
Standalone Balance Sheet at June 30, 2019
Particulars
At June 30,
2019
At March 31,
2019
At June 30,
2018
(` in Lakhs)
Year ended/at
June 30, 2019 March 31,
2019 June 30, 2018 March 31, 2019
(Audited) (Audited) (Audited) (Audited)
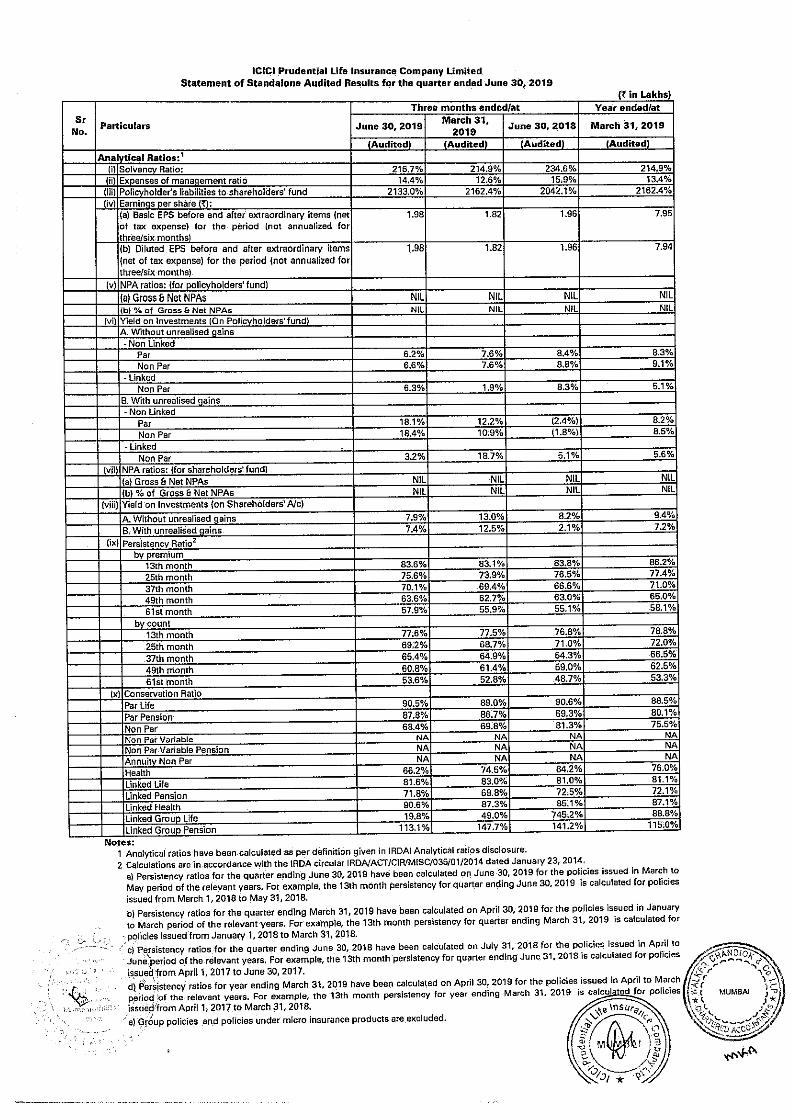
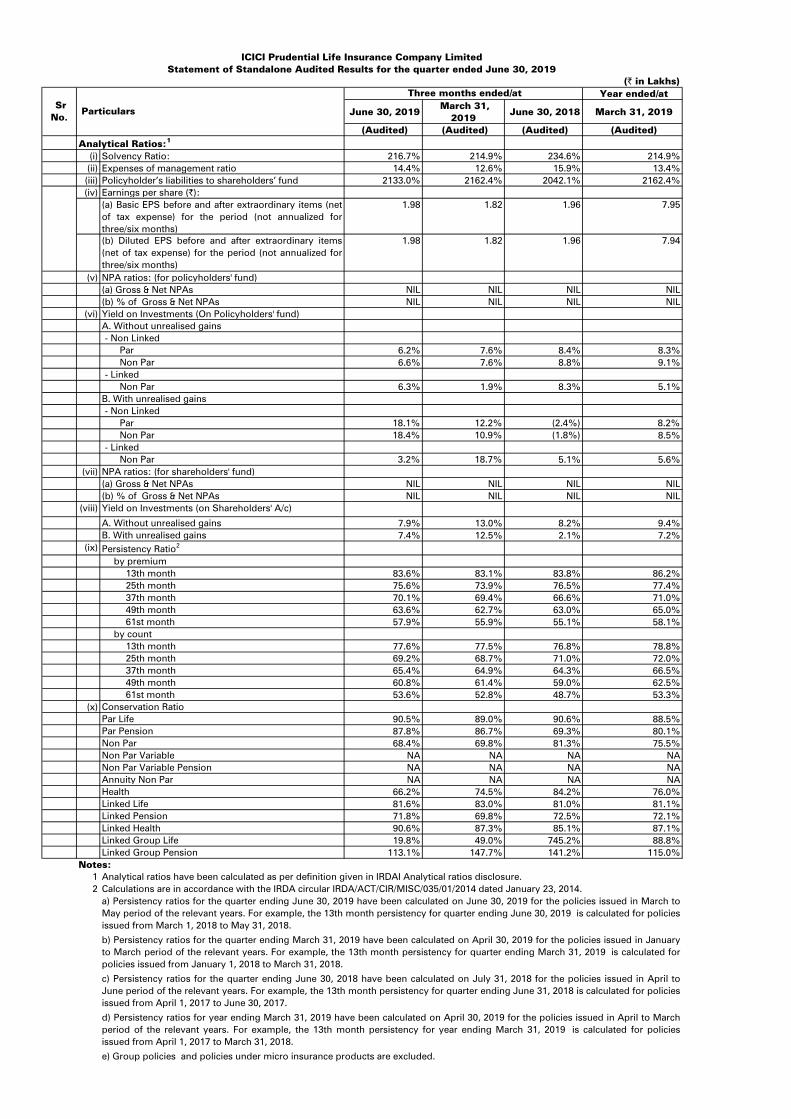
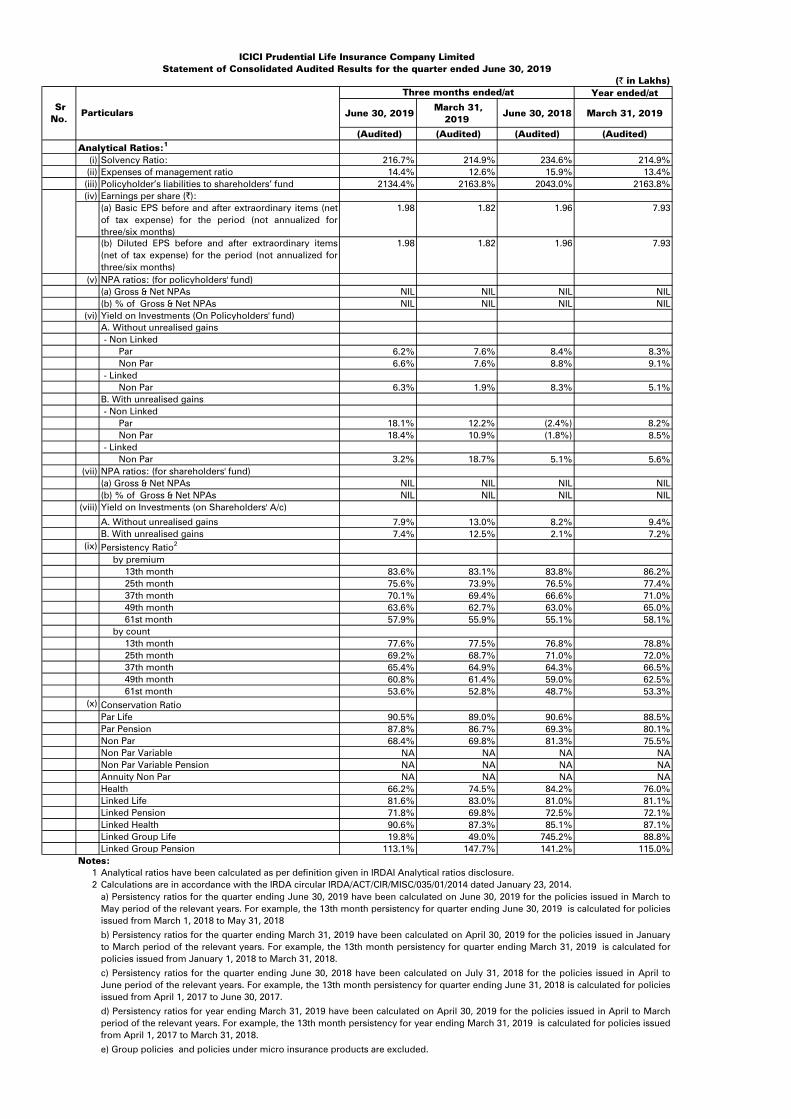
(i) Solvency Ratio: 216.7% 214.9% 234.6% 214.9%
(ii) Expenses of management ratio 14.4% 12.6% 15.9% 13.4%
(iii) Policyholder’s liabilities to shareholders’ fund 2133.0% 2162.4% 2042.1% 2162.4%
(iv) Earnings per share (`):
(a) Basic EPS before and after extraordinary items (net
of tax expense) for the period (not annualized for
three/six months)
1.98 1.82 1.96 7.95
(b) Diluted EPS before and after extraordinary items
(net of tax expense) for the period (not annualized for
three/six months)
1.98 1.82 1.96 7.94
(v) NPA ratios: (for policyholders' fund)
(a) Gross & Net NPAs NIL NIL NIL NIL
(b) % of Gross & Net NPAs NIL NIL NIL NIL
(vi) Yield on Investments (On Policyholders' fund)
A. Without unrealised gains
- Non Linked
Par 6.2% 7.6% 8.4% 8.3%
Non Par 6.6% 7.6% 8.8% 9.1%
- Linked
Non Par 6.3% 1.9% 8.3% 5.1%
B. With unrealised gains
- Non Linked
Par 18.1% 12.2% (2.4%) 8.2%
Non Par 18.4% 10.9% (1.8%) 8.5%
- Linked
Non Par 3.2% 18.7% 5.1% 5.6%
(vii) NPA ratios: (for shareholders' fund)
(a) Gross & Net NPAs NIL NIL NIL NIL
(b) % of Gross & Net NPAs NIL NIL NIL NIL
(viii) Yield on Investments (on Shareholders' A/c)
A. Without unrealised gains 7.9% 13.0% 8.2% 9.4%
B. With unrealised gains 7.4% 12.5% 2.1% 7.2%
(ix) Persistency Ratio2
by premium
13th month 83.6% 83.1% 83.8% 86.2%
25th month 75.6% 73.9% 76.5% 77.4%
37th month 70.1% 69.4% 66.6% 71.0%
49th month 63.6% 62.7% 63.0% 65.0%
61st month 57.9% 55.9% 55.1% 58.1%
by count
13th month 77.6% 77.5% 76.8% 78.8%
25th month 69.2% 68.7% 71.0% 72.0%
37th month 65.4% 64.9% 64.3% 66.5%
49th month 60.8% 61.4% 59.0% 62.5%
61st month 53.6% 52.8% 48.7% 53.3%
(x) Conservation Ratio
Par Life 90.5% 89.0% 90.6% 88.5%
Par Pension 87.8% 86.7% 69.3% 80.1%
Non Par 68.4% 69.8% 81.3% 75.5%
Non Par Variable NA NA NA NA
Non Par Variable Pension NA NA NA NA
Annuity Non Par NA NA NA NA
Health 66.2% 74.5% 84.2% 76.0%
Linked Life 81.6% 83.0% 81.0% 81.1%
Linked Pension 71.8% 69.8% 72.5% 72.1%
Linked Health 90.6% 87.3% 85.1% 87.1%
Linked Group Life 19.8% 49.0% 745.2% 88.8%
Linked Group Pension 113.1% 147.7% 141.2% 115.0%
Notes:
1
2
ICICI Prudential Life Insurance Company Limited
Statement of Standalone Audited Results for the quarter ended June 30, 2019
Sr
No. Particulars
Three months ended/at
Calculations are in accordance with the IRDA circular IRDA/ACT/CIR/MISC/035/01/2014 dated January 23, 2014.
Analytical ratios have been calculated as per definition given in IRDAI Analytical ratios disclosure.
a) Persistency ratios for the quarter ending June 30, 2019 have been calculated on June 30, 2019 for the policies issued in March to
May period of the relevant years. For example, the 13th month persistency for quarter ending June 30, 2019 is calculated for policies
issued from March 1, 2018 to May 31, 2018.
d) Persistency ratios for year ending March 31, 2019 have been calculated on April 30, 2019 for the policies issued in April to March
period of the relevant years. For example, the 13th month persistency for year ending March 31, 2019 is calculated for policies
issued from April 1, 2017 to March 31, 2018.
e) Group policies and policies under micro insurance products are excluded.
Analytical Ratios:1
b) Persistency ratios for the quarter ending March 31, 2019 have been calculated on April 30, 2019 for the policies issued in January
to March period of the relevant years. For example, the 13th month persistency for quarter ending March 31, 2019 is calculated for
policies issued from January 1, 2018 to March 31, 2018.
c) Persistency ratios for the quarter ending June 30, 2018 have been calculated on July 31, 2018 for the policies issued in April to
June period of the relevant years. For example, the 13th month persistency for quarter ending June 31, 2018 is calculated for policies
issued from April 1, 2017 to June 30, 2017.
(` in Lakhs)
Year
ended/at
June 30,
2019
March 31,
2019
June 30,
2018
March 31,
2019
(Audited) (Audited) (Audited) (Audited)
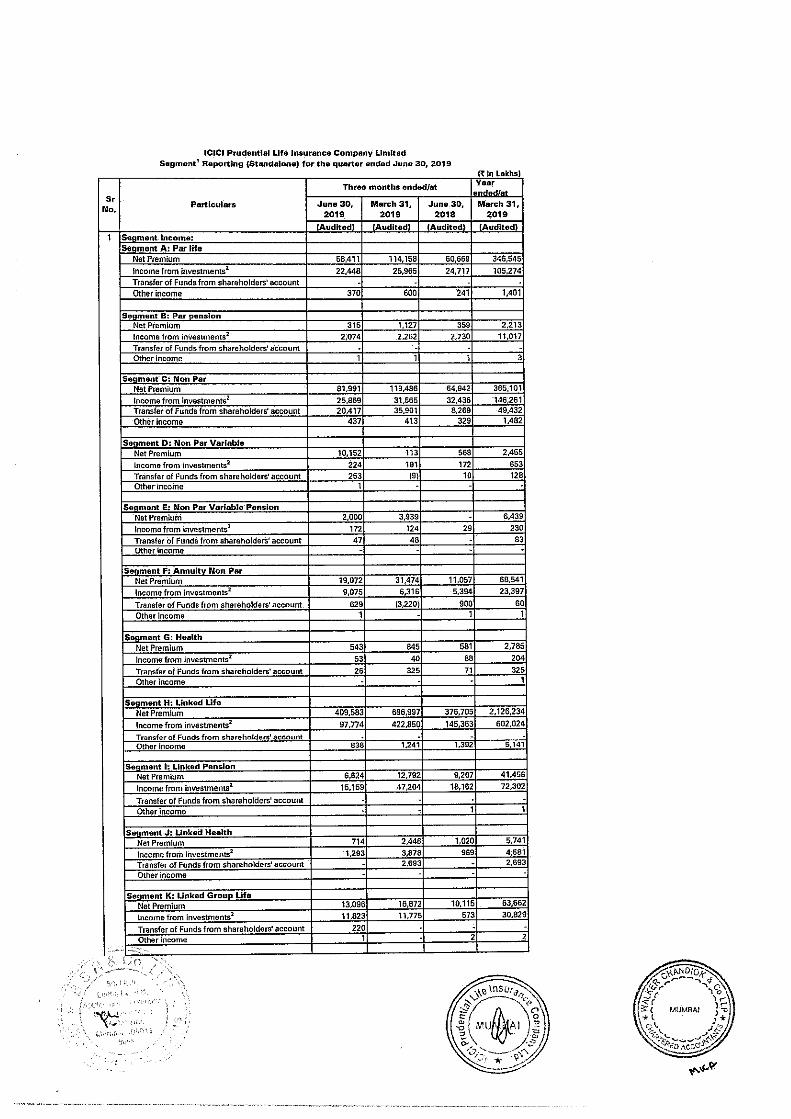
Segment Income:
Segment A: Par life
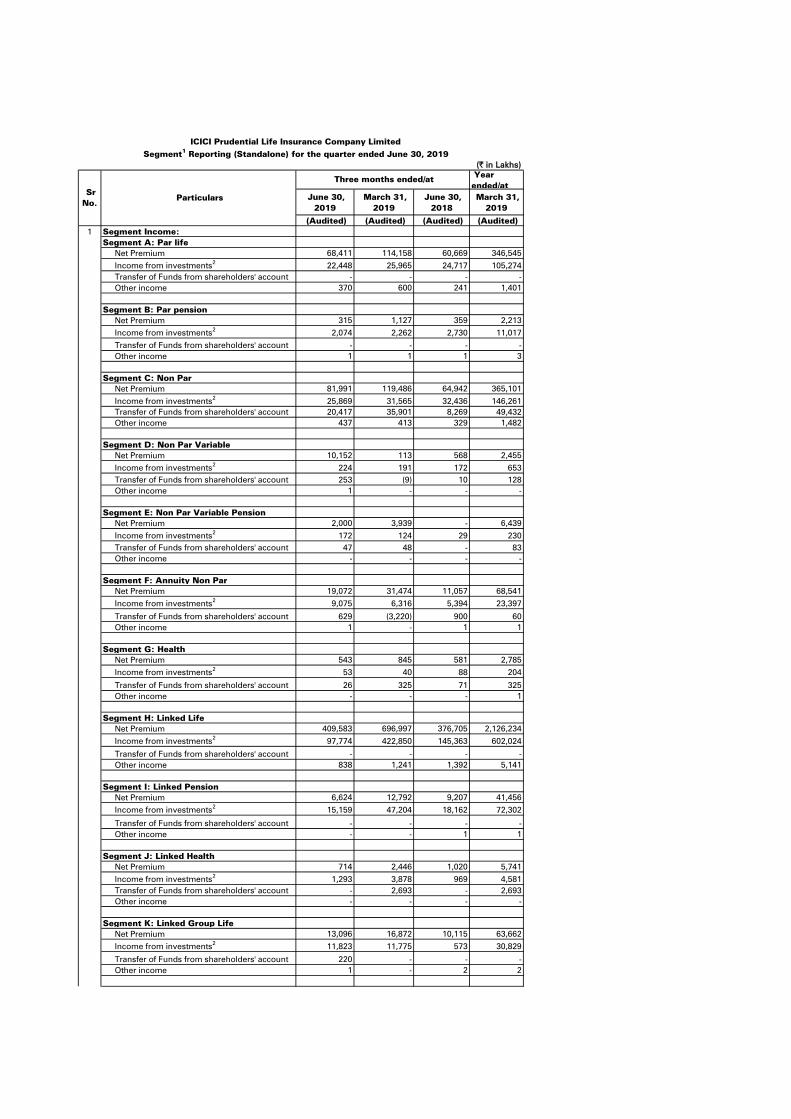
Net Premium 68,411 114,158 60,669 346,545
Income from investments2
22,448 25,965 24,717 105,274
Transfer of Funds from shareholders' account - - - -
Other income 370 600 241 1,401
Segment B: Par pension
Net Premium 315 1,127 359 2,213
Income from investments2
2,074 2,262 2,730 11,017
Transfer of Funds from shareholders' account - - - -
Other income 1 1 1 3
Segment C: Non Par
Net Premium 81,991 119,486 64,942 365,101
Income from investments2
25,869 31,565 32,436 146,261
Transfer of Funds from shareholders' account 20,417 35,901 8,269 49,432
Other income 437 413 329 1,482
Segment D: Non Par Variable
Net Premium 10,152 113 568 2,455
Income from investments2
224 191 172 653
Transfer of Funds from shareholders' account 253 (9) 10 128
Other income 1 - - -
Segment E: Non Par Variable Pension
Net Premium 2,000 3,939 - 6,439
Income from investments2
172 124 29 230
Transfer of Funds from shareholders' account 47 48 - 83
Other income - - - -
Segment F: Annuity Non Par
Net Premium 19,072 31,474 11,057 68,541
Income from investments2
9,075 6,316 5,394 23,397
Transfer of Funds from shareholders' account 629 (3,220) 900 60
Other income 1 - 1 1
Segment G: Health
Net Premium 543 845 581 2,785
Income from investments2
53 40 88 204
Transfer of Funds from shareholders' account 26 325 71 325
Other income - - - 1
Segment H: Linked Life
Net Premium 409,583 696,997 376,705 2,126,234
Income from investments2
97,774 422,850 145,363 602,024
Transfer of Funds from shareholders' account - - - -
Other income 838 1,241 1,392 5,141
Segment I: Linked Pension
Net Premium 6,624 12,792 9,207 41,456
Income from investments2
15,159 47,204 18,162 72,302
Transfer of Funds from shareholders' account - - - -
Other income - - 1 1
Segment J: Linked Health
Net Premium 714 2,446 1,020 5,741
Income from investments2
1,293 3,878 969 4,581
Transfer of Funds from shareholders' account - 2,693 - 2,693
Other income - - - -
Segment K: Linked Group Life
Net Premium 13,096 16,872 10,115 63,662
Income from investments2
11,823 11,775 573 30,829
Transfer of Funds from shareholders' account 220 - - -
Other income 1 - 2 2
1
Three months ended/at
ICICI Prudential Life Insurance Company Limited
Segment1
Reporting (Standalone) for the quarter ended June 30, 2019
Particulars
Sr
No.
(` in Lakhs)
Year
ended/at
June 30,
2019
March 31,
2019
June 30,
2018
March 31,
2019
(Audited) (Audited) (Audited) (Audited)
Three months ended/at
Segment1
Reporting (Standalone) for the quarter ended June 30, 2019
Particulars
Sr
No.
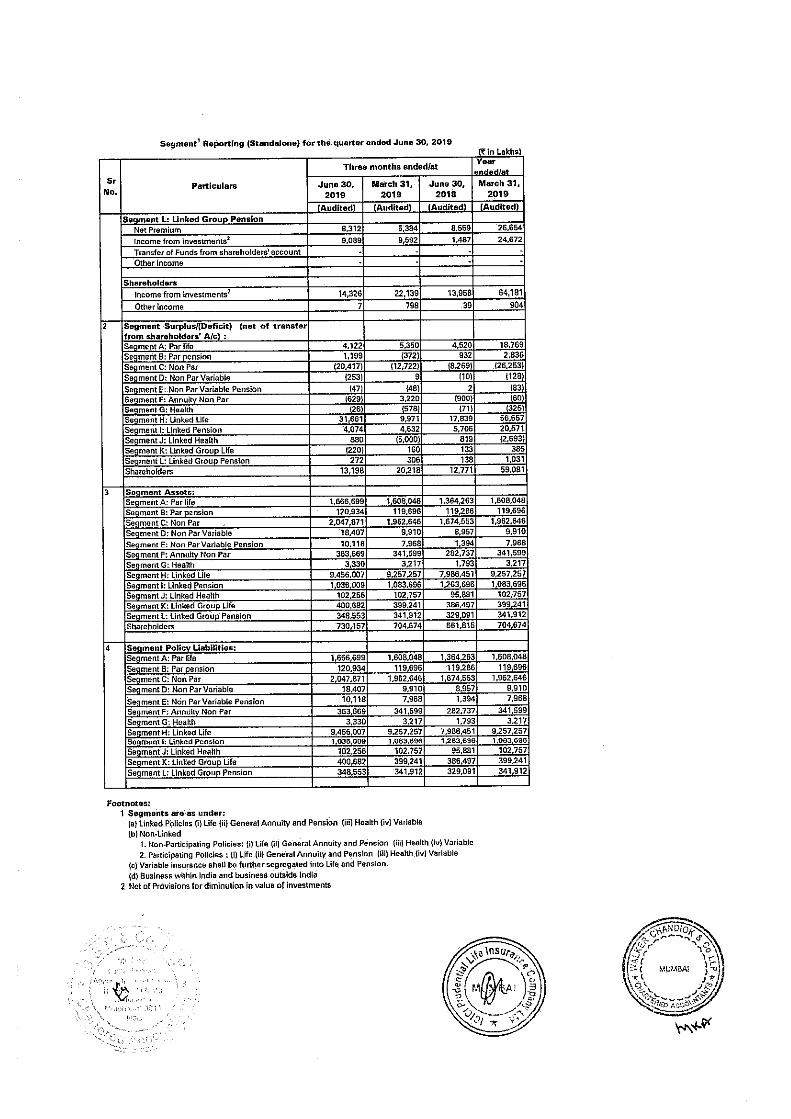
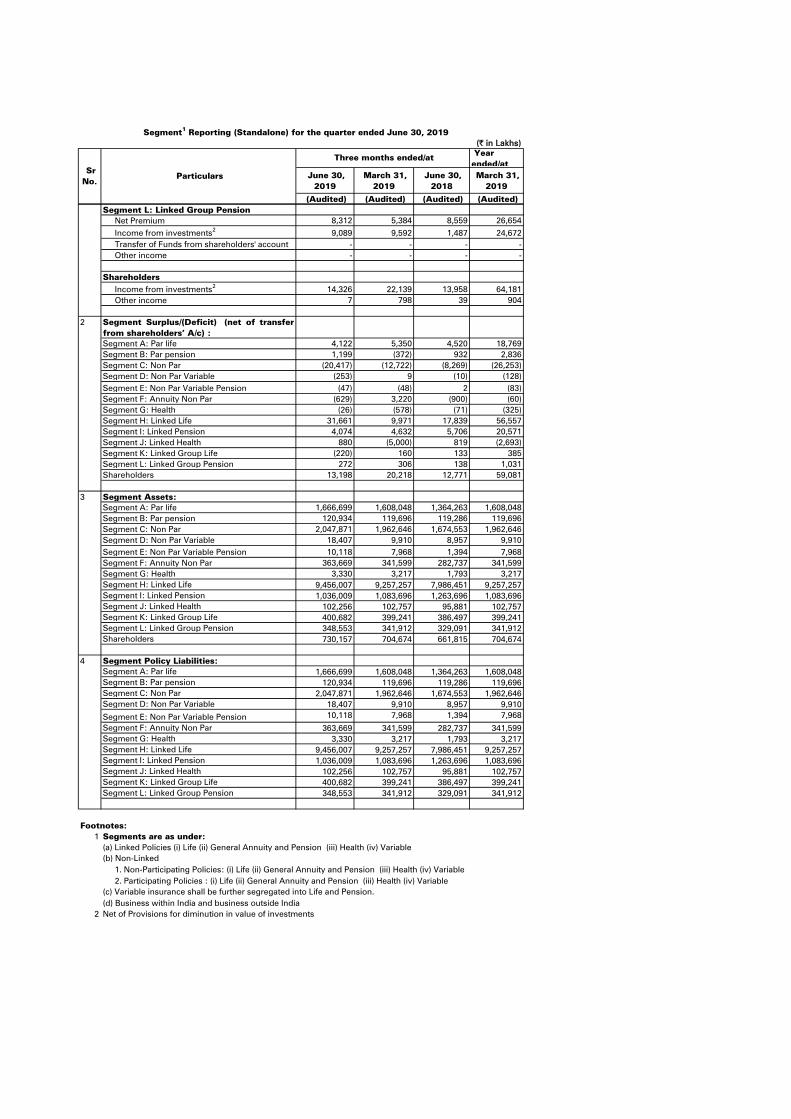
Segment L: Linked Group Pension
Net Premium 8,312 5,384 8,559 26,654
Income from investments2
9,089 9,592 1,487 24,672
Transfer of Funds from shareholders' account - - - -
Other income - - - -
Shareholders
Income from investments2
14,326 22,139 13,958 64,181
Other income 7 798 39 904
Segment Surplus/(Deficit) (net of transfer
from shareholders’ A/c) :
Segment A: Par life 4,122 5,350 4,520 18,769
Segment B: Par pension 1,199 (372) 932 2,836
Segment C: Non Par (20,417) (12,722) (8,269) (26,253)
Segment D: Non Par Variable (253) 9 (10) (128)
Segment E: Non Par Variable Pension (47) (48) 2 (83)
Segment F: Annuity Non Par (629) 3,220 (900) (60)
Segment G: Health (26) (578) (71) (325)
Segment H: Linked Life 31,661 9,971 17,839 56,557
Segment I: Linked Pension 4,074 4,632 5,706 20,571
Segment J: Linked Health 880 (5,000) 819 (2,693)
Segment K: Linked Group Life (220) 160 133 385
Segment L: Linked Group Pension 272 306 138 1,031
Shareholders 13,198 20,218 12,771 59,081
Segment Assets:
Segment A: Par life 1,666,699 1,608,048 1,364,263 1,608,048
Segment B: Par pension 120,934 119,696 119,286 119,696
Segment C: Non Par 2,047,871 1,962,646 1,674,553 1,962,646
Segment D: Non Par Variable 18,407 9,910 8,957 9,910
Segment E: Non Par Variable Pension 10,118 7,968 1,394 7,968
Segment F: Annuity Non Par 363,669 341,599 282,737 341,599
Segment G: Health 3,330 3,217 1,793 3,217
Segment H: Linked Life 9,456,007 9,257,257 7,986,451 9,257,257
Segment I: Linked Pension 1,036,009 1,083,696 1,263,696 1,083,696
Segment J: Linked Health 102,256 102,757 95,881 102,757
Segment K: Linked Group Life 400,682 399,241 386,497 399,241
Segment L: Linked Group Pension 348,553 341,912 329,091 341,912
Shareholders 730,157 704,674 661,815 704,674
Segment Policy Liabilities:
Segment A: Par life 1,666,699 1,608,048 1,364,263 1,608,048
Segment B: Par pension 120,934 119,696 119,286 119,696
Segment C: Non Par 2,047,871 1,962,646 1,674,553 1,962,646
Segment D: Non Par Variable 18,407 9,910 8,957 9,910
Segment E: Non Par Variable Pension 10,118 7,968 1,394 7,968
Segment F: Annuity Non Par 363,669 341,599 282,737 341,599
Segment G: Health 3,330 3,217 1,793 3,217
Segment H: Linked Life 9,456,007 9,257,257 7,986,451 9,257,257
Segment I: Linked Pension 1,036,009 1,083,696 1,263,696 1,083,696
Segment J: Linked Health 102,256 102,757 95,881 102,757
Segment K: Linked Group Life 400,682 399,241 386,497 399,241
Segment L: Linked Group Pension 348,553 341,912 329,091 341,912
Footnotes:
1
(d) Business within India and business outside India
2 Net of Provisions for diminution in value of investments
2
3
4
Segments are as under:
(b) Non-Linked
1. Non-Participating Policies: (i) Life (ii) General Annuity and Pension (iii) Health (iv) Variable
2. Participating Policies : (i) Life (ii) General Annuity and Pension (iii) Health (iv) Variable
(a) Linked Policies (i) Life (ii) General Annuity and Pension (iii) Health (iv) Variable
(c) Variable insurance shall be further segregated into Life and Pension.
(` in Lakhs)
Year
ended/at
June 30,
2019
March 31,
2019
June 30,
2018
March 31,
2019
(Audited) (Audited) (Audited) (Audited)
(a) First Year Premium 126,975 223,664 125,871 697,853
(b) Renewal Premium 404,271 670,802 374,760 2,056,542
(c) Single Premium 101,681 121,897 51,159 338,582
2 620,813 1,005,632 543,782 3,057,829
3 199,155 561,763 232,120 1,021,444
4 1,649 2,256 1,967 8,034
5 21,592 35,738 9,250 52,720
6 843,209 1,605,389 787,119 4,140,027
7
(a) First Year Premium 17,823 36,753 19,961 111,979
(b) Renewal Premium 7,367 12,437 7,130 38,446
(c) Single Premium 1,294 1,758 865 4,704
8 26,484 50,948 27,956 155,129
(a) Employees remuneration and welfare expenses 25,940 23,076 26,153 97,309
(b) Advertisement and publicity 14,101 27,979 11,192 67,261
(c) Other operating expenses 24,541 26,262 22,175 95,962
10 91,066 128,265 87,476 415,661
11 42 (28) 33 (13)
12 4,102 - - -
13 15,283 17,263 14,502 63,520
14 2,914 2,516 3,057 11,318
(a) Current tax 2,914 2,516 3,057 11,318
(b) Deferred tax - - - -
15 364,456 449,369 293,953 1,425,914
16 323,138 967,337 358,009 2,100,298
17 801,001 1,564,722 757,030 4,016,698
18 42,208 40,667 30,089 123,329
19
(a) Transferred to Shareholders 36,888 41,657 24,643 107,704
(b) Funds for Future Appropriations 5,320 (990) 5,446 15,624
20
(a) Interim bonus paid 1,658 1,996 1,608 7,063
(b) Allocation of bonus to policyholders - 46,678 - 46,678
(c) Surplus shown in the Revenue Account 42,208 40,667 30,089 123,329
43,866 89,341 31,697 177,070
21 36,888 41,657 24,643 107,704
22
(a) Investment Income 14,400 22,210 14,008 64,430
(b) Other income (refer note 7) 16 806 45 931
23 1,043 1,149 1,083 4,221
24 21,592 35,738 9,250 52,720
25 - - - -
26 - - - -
27 28,669 27,786 28,363 116,124
28 205 1,684 236 2,232
(a) Current tax 205 1,684 236 2,232
(b) Deferred tax - - - -
29 28,464 26,102 28,127 113,892
30 - - - -
31 28,464 26,102 28,127 113,892
32
(a) Interim Dividend - - - 1.60
(b) Final Dividend - 1.55 - 1.55
33 226,891 198,427 140,353 198,427
34 143,584 143,578 143,556 143,578
35 569,732 541,202 482,852 541,202
36 16,372 19,454 35,090 19,454
(a) Investments:
- Shareholders’ 776,705 798,615 679,884 798,615
- Policyholders Fund excluding Linked Assets 4,219,821 4,007,118 3,499,965 4,007,118
- Assets held to cover Linked Liabilities 11,255,877 11,094,581 9,973,402 11,094,581
(b) Other Assets (Net of current liabilities and provisions) 51,820 41,867 22,859 41,867
1 Net of reinsurance
2 Net of amortisation and losses (including capital gains)
3 Inclusive of interim bonus
Total income under Shareholders’ Account
Expenses other than those related to insurance business
Transfer of funds to Policyholders A/c
Provisions for doubtful debts (including write off)
Provisions for diminution in value of investments
Profit/ (loss) before tax
Provisions for tax (a+b)
Profit/(loss) after tax and before extraordinary items
Extraordinary Items (Net of tax expenses)
Profit/(loss) after tax and extraordinary items
Dividend per share (`) (Nominal Value ` 10 per share):
Profit/(Loss) carried to Balance Sheet
Paid up equity share capital
Reserve & Surplus (excluding Revaluation Reserve)
Fair value Change Account and revaluation reserve (Shareholders)
37 Total Assets:
Transfer from Policyholders’ Account
Change in actuarial liability
Total (10+11+12+13+14+15+16)
Surplus/(Deficit) (6-17)
Appropriations
Details of Surplus/(Deficit)
Total Surplus
SHAREHOLDERS’ A/C
ICICI Prudential Life Insurance Company Limited
Statement of Consolidated Audited Results for the quarter ended June 30, 2019
Benefits Paid 3
(Net)1
Transfer of funds from Shareholders’ A/c
Total (2 to 5)
Commission on
Net Commission1
Expenses of Management (8+9)
Provisions for doubtful debts (including bad debts written off)
Provisions for diminution in value of investments
Goods and Service tax charge on linked charges
Provision for taxes (a+b)
9 Operating Expenses related to insurance business (a+b+c):
POLICYHOLDERS’ A/C
1
Income from investments: (Net)2
Other income
Sr
No. Particulars
Three months ended/at
Gross premium income
Net premium income1
(` in Lakhs)
(Audited) (Audited) (Audited)
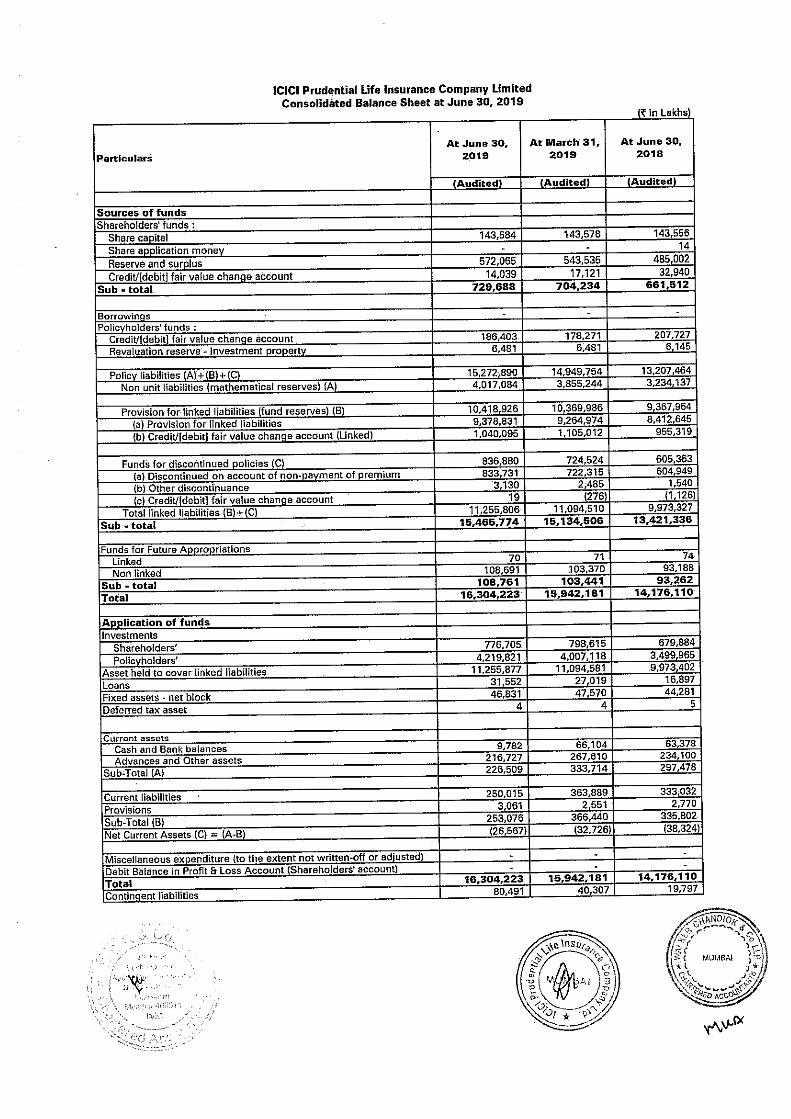
Sources of funds
Shareholders' funds :
Share capital 143,584 143,578 143,556
Share application money - - 14
Reserve and surplus 572,065 543,535 485,002
Credit/[debit] fair value change account 14,039 17,121 32,940
Sub - total 729,688 704,234 661,512
Borrowings - - -
Policyholders' funds :
Credit/[debit] fair value change account 186,403 178,271 207,727
Revaluation reserve - Investment property 6,481 6,481 6,145
Policy liabilities (A)+(B)+(C) 15,272,890 14,949,754 13,207,464
Non unit liabilities (mathematical reserves) (A) 4,017,084 3,855,244 3,234,137
Provision for linked liabilities (fund reserves) (B) 10,418,926 10,369,986 9,367,964
(a) Provision for linked liabilities 9,378,831 9,264,974 8,412,645
(b) Credit/[debit] fair value change account (Linked) 1,040,095 1,105,012 955,319
Funds for discontinued policies (C) 836,880 724,524 605,363
(a) Discontinued on account of non-payment of premium 833,731 722,315 604,949
(b) Other discontinuance 3,130 2,485 1,540
(c) Credit/[debit] fair value change account 19 (276) (1,126)
Total linked liabilities (B)+(C) 11,255,806 11,094,510 9,973,327
Sub - total 15,465,774 15,134,506 13,421,336
Funds for Future Appropriations
Linked 70 71 74
Non linked 108,691 103,370 93,188
Sub - total 108,761 103,441 93,262
Total 16,304,223 15,942,181 14,176,110
Application of funds
Investments
Shareholders’ 776,705 798,615 679,884
Policyholders’ 4,219,821 4,007,118 3,499,965
Asset held to cover linked liabilities 11,255,877 11,094,581 9,973,402
Loans 31,552 27,019 16,897
Fixed assets - net block 46,831 47,570 44,281
Deferred tax asset 4 4 5
Current assets
Cash and Bank balances 9,782 66,104 63,378
Advances and Other assets 216,727 267,610 234,100
Sub-Total (A) 226,509 333,714 297,478
Current liabilities 250,015 363,889 333,032
Provisions 3,061 2,551 2,770
Sub-Total (B) 253,076 366,440 335,802
Net Current Assets (C) = (A-B) (26,567) (32,726) (38,324)
Miscellaneous expenditure (to the extent not written-off or adjusted) - - -
Debit Balance in Profit & Loss Account (Shareholders' account) - - -
Total 16,304,223 15,942,181 14,176,110
Contingent liabilities 80,491 40,307 19,797
ICICI Prudential Life Insurance Company Limited
Consolidated Balance Sheet at June 30, 2019
Particulars
At June 30,
2019
At March 31,
2019
At June 30,
2018
(` in Lakhs)
Year ended/at
June 30, 2019 March 31,
2019
June 30, 2018 March 31, 2019
(Audited) (Audited) (Audited) (Audited)
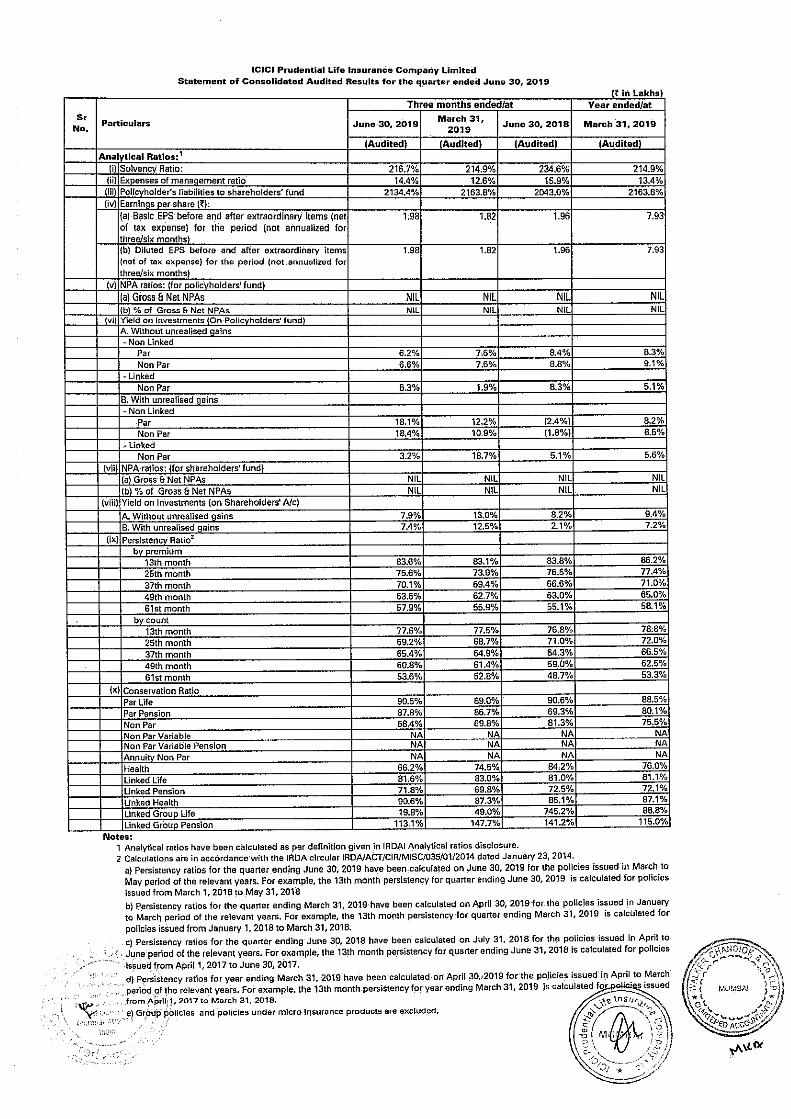
(i) Solvency Ratio: 216.7% 214.9% 234.6% 214.9%
(ii) Expenses of management ratio 14.4% 12.6% 15.9% 13.4%
(iii) Policyholder’s liabilities to shareholders’ fund 2134.4% 2163.8% 2043.0% 2163.8%
(iv) Earnings per share (`):
(a) Basic EPS before and after extraordinary items (net
of tax expense) for the period (not annualized for
three/six months)
1.98 1.82 1.96 7.93
(b) Diluted EPS before and after extraordinary items
(net of tax expense) for the period (not annualized for
three/six months)
1.98 1.82 1.96 7.93
(v) NPA ratios: (for policyholders' fund)
(a) Gross & Net NPAs NIL NIL NIL NIL
(b) % of Gross & Net NPAs NIL NIL NIL NIL
(vi) Yield on Investments (On Policyholders' fund)
A. Without unrealised gains
- Non Linked
Par 6.2% 7.6% 8.4% 8.3%
Non Par 6.6% 7.6% 8.8% 9.1%
- Linked
Non Par 6.3% 1.9% 8.3% 5.1%
B. With unrealised gains
- Non Linked
Par 18.1% 12.2% (2.4%) 8.2%
Non Par 18.4% 10.9% (1.8%) 8.5%
- Linked
Non Par 3.2% 18.7% 5.1% 5.6%
(vii) NPA ratios: (for shareholders' fund)
(a) Gross & Net NPAs NIL NIL NIL NIL
(b) % of Gross & Net NPAs NIL NIL NIL NIL
(viii) Yield on Investments (on Shareholders' A/c)
A. Without unrealised gains 7.9% 13.0% 8.2% 9.4%
B. With unrealised gains 7.4% 12.5% 2.1% 7.2%
(ix) Persistency Ratio2
by premium
13th month 83.6% 83.1% 83.8% 86.2%
25th month 75.6% 73.9% 76.5% 77.4%
37th month 70.1% 69.4% 66.6% 71.0%
49th month 63.6% 62.7% 63.0% 65.0%
61st month 57.9% 55.9% 55.1% 58.1%
by count
13th month 77.6% 77.5% 76.8% 78.8%
25th month 69.2% 68.7% 71.0% 72.0%
37th month 65.4% 64.9% 64.3% 66.5%
49th month 60.8% 61.4% 59.0% 62.5%
61st month 53.6% 52.8% 48.7% 53.3%
(x) Conservation Ratio
Par Life 90.5% 89.0% 90.6% 88.5%
Par Pension 87.8% 86.7% 69.3% 80.1%
Non Par 68.4% 69.8% 81.3% 75.5%
Non Par Variable NA NA NA NA
Non Par Variable Pension NA NA NA NA
Annuity Non Par NA NA NA NA
Health 66.2% 74.5% 84.2% 76.0%
Linked Life 81.6% 83.0% 81.0% 81.1%
Linked Pension 71.8% 69.8% 72.5% 72.1%
Linked Health 90.6% 87.3% 85.1% 87.1%
Linked Group Life 19.8% 49.0% 745.2% 88.8%
Linked Group Pension 113.1% 147.7% 141.2% 115.0%
Notes:
1
2
ICICI Prudential Life Insurance Company Limited
Statement of Consolidated Audited Results for the quarter ended June 30, 2019
Sr
No.
Particulars
Three months ended/at
Calculations are in accordance with the IRDA circular IRDA/ACT/CIR/MISC/035/01/2014 dated January 23, 2014.
Analytical ratios have been calculated as per definition given in IRDAI Analytical ratios disclosure.
a) Persistency ratios for the quarter ending June 30, 2019 have been calculated on June 30, 2019 for the policies issued in March to
May period of the relevant years. For example, the 13th month persistency for quarter ending June 30, 2019 is calculated for policies
issued from March 1, 2018 to May 31, 2018
d) Persistency ratios for year ending March 31, 2019 have been calculated on April 30, 2019 for the policies issued in April to March
period of the relevant years. For example, the 13th month persistency for year ending March 31, 2019 is calculated for policies issued
from April 1, 2017 to March 31, 2018.
e) Group policies and policies under micro insurance products are excluded.
Analytical Ratios:1
b) Persistency ratios for the quarter ending March 31, 2019 have been calculated on April 30, 2019 for the policies issued in January
to March period of the relevant years. For example, the 13th month persistency for quarter ending March 31, 2019 is calculated for
policies issued from January 1, 2018 to March 31, 2018.
c) Persistency ratios for the quarter ending June 30, 2018 have been calculated on July 31, 2018 for the policies issued in April to
June period of the relevant years. For example, the 13th month persistency for quarter ending June 31, 2018 is calculated for policies
issued from April 1, 2017 to June 30, 2017.
(` in Lakhs)
Year
ended/at
June 30,
2019
March 31,
2019
June 30,
2018
March 31,
2019
(Audited) (Audited) (Audited) (Audited)
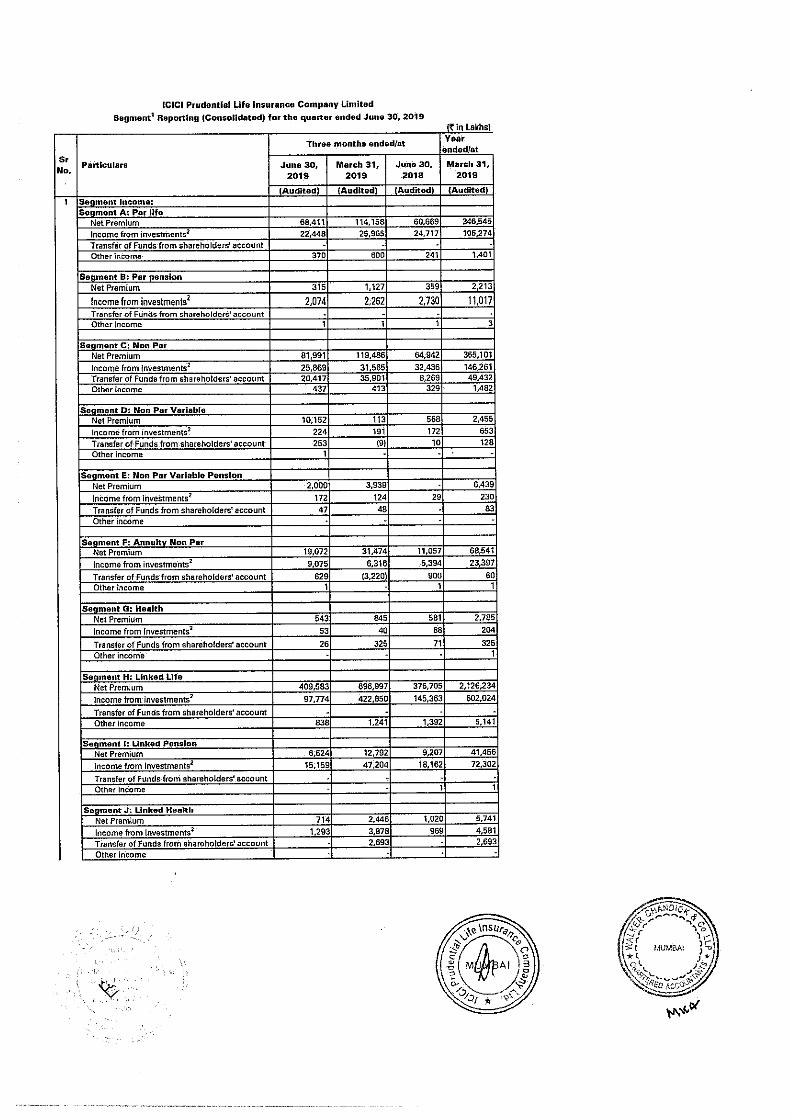
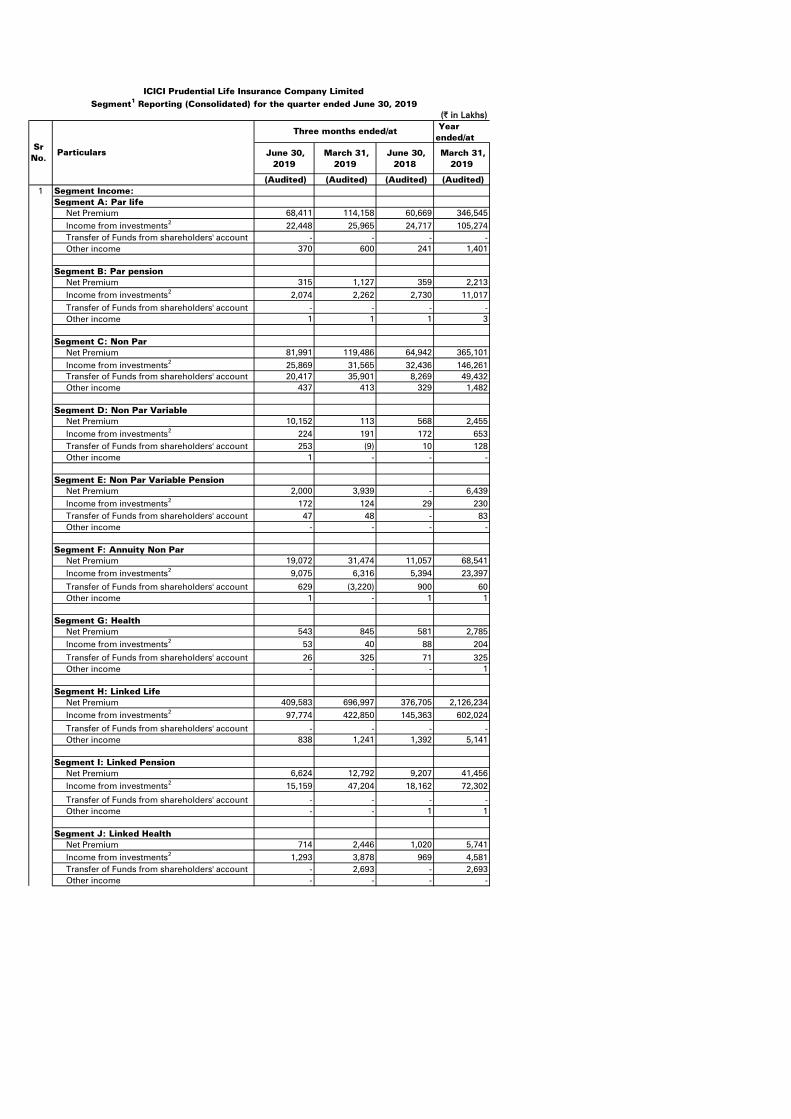
Segment Income:
Segment A: Par life
Net Premium 68,411 114,158 60,669 346,545
Income from investments2
22,448 25,965 24,717 105,274
Transfer of Funds from shareholders' account - - - -
Other income 370 600 241 1,401
Segment B: Par pension
Net Premium 315 1,127 359 2,213
Income from investments2
2,074 2,262 2,730 11,017
Transfer of Funds from shareholders' account - - - -
Other income 1 1 1 3
Segment C: Non Par
Net Premium 81,991 119,486 64,942 365,101
Income from investments2
25,869 31,565 32,436 146,261
Transfer of Funds from shareholders' account 20,417 35,901 8,269 49,432
Other income 437 413 329 1,482
Segment D: Non Par Variable
Net Premium 10,152 113 568 2,455
Income from investments2
224 191 172 653
Transfer of Funds from shareholders' account 253 (9) 10 128
Other income 1 - - -
Segment E: Non Par Variable Pension
Net Premium 2,000 3,939 - 6,439
Income from investments2
172 124 29 230
Transfer of Funds from shareholders' account 47 48 - 83
Other income - - - -
Segment F: Annuity Non Par
Net Premium 19,072 31,474 11,057 68,541
Income from investments2
9,075 6,316 5,394 23,397
Transfer of Funds from shareholders' account 629 (3,220) 900 60
Other income 1 - 1 1
Segment G: Health
Net Premium 543 845 581 2,785
Income from investments2
53 40 88 204
Transfer of Funds from shareholders' account 26 325 71 325
Other income - - - 1
Segment H: Linked Life
Net Premium 409,583 696,997 376,705 2,126,234
Income from investments2
97,774 422,850 145,363 602,024
Transfer of Funds from shareholders' account - - - -
Other income 838 1,241 1,392 5,141
Segment I: Linked Pension
Net Premium 6,624 12,792 9,207 41,456
Income from investments2
15,159 47,204 18,162 72,302
Transfer of Funds from shareholders' account - - - -
Other income - - 1 1
Segment J: Linked Health
Net Premium 714 2,446 1,020 5,741
Income from investments2
1,293 3,878 969 4,581
Transfer of Funds from shareholders' account - 2,693 - 2,693
Other income - - - -
1
Sr
No. Particulars
Three months ended/at
ICICI Prudential Life Insurance Company Limited
Segment1
Reporting (Consolidated) for the quarter ended June 30, 2019
Year
ended/at
June 30,
2019
March 31,
2019
June 30,
2018
March 31,
2019
(Audited) (Audited) (Audited) (Audited)
Sr
No. Particulars
Three months ended/at
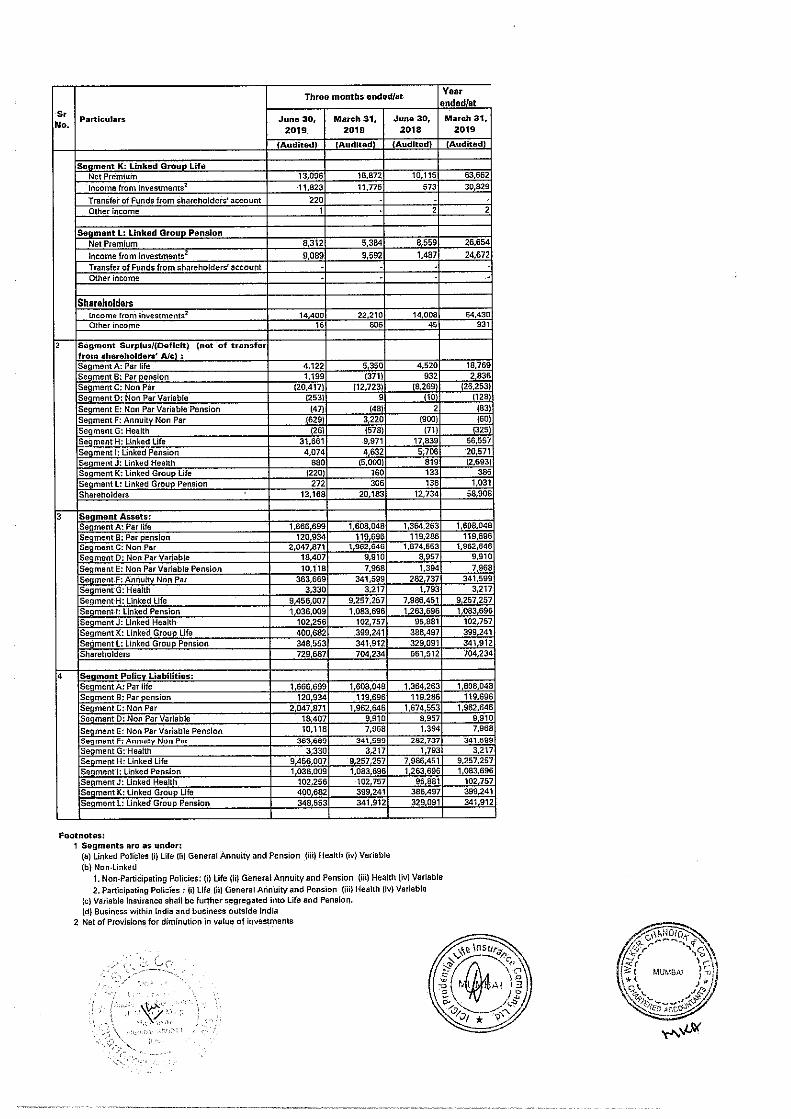
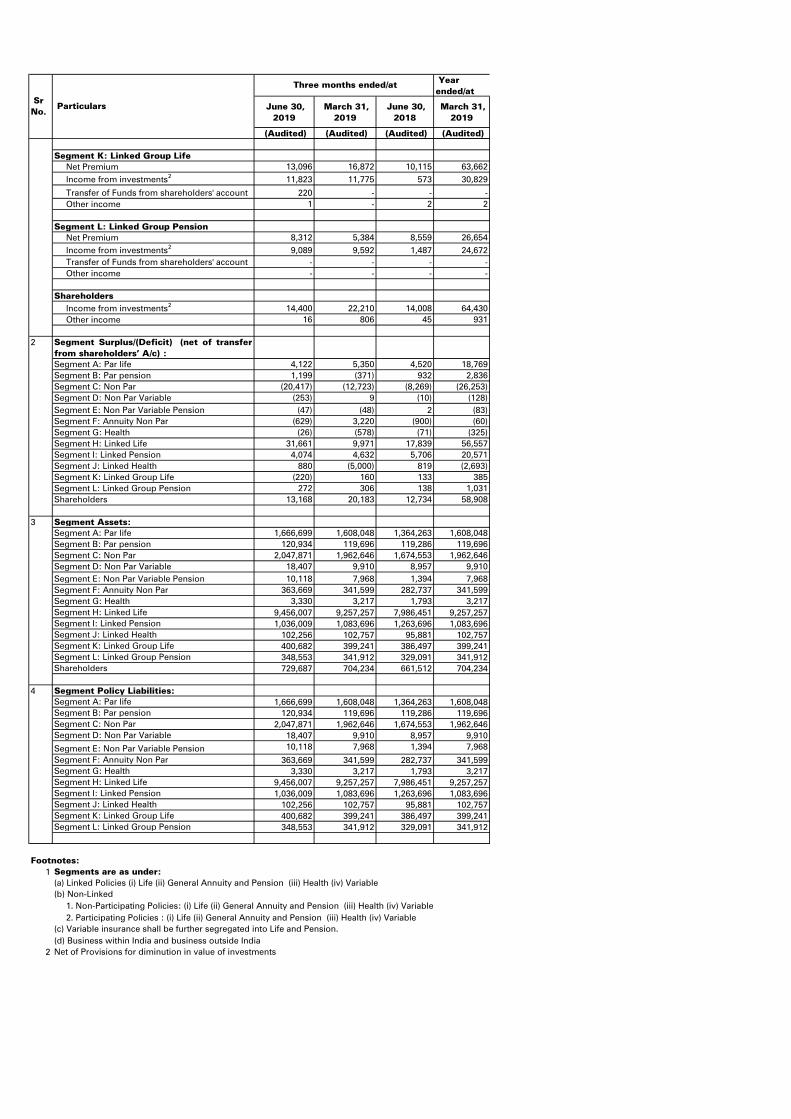
Segment K: Linked Group Life
Net Premium 13,096 16,872 10,115 63,662
Income from investments2
11,823 11,775 573 30,829
Transfer of Funds from shareholders' account 220 - - -
Other income 1 - 2 2
Segment L: Linked Group Pension
Net Premium 8,312 5,384 8,559 26,654
Income from investments2
9,089 9,592 1,487 24,672
Transfer of Funds from shareholders' account - - - -
Other income - - - -
Shareholders
Income from investments2
14,400 22,210 14,008 64,430
Other income 16 806 45 931
Segment Surplus/(Deficit) (net of transfer
from shareholders’ A/c) :
Segment A: Par life 4,122 5,350 4,520 18,769
Segment B: Par pension 1,199 (371) 932 2,836
Segment C: Non Par (20,417) (12,723) (8,269) (26,253)
Segment D: Non Par Variable (253) 9 (10) (128)
Segment E: Non Par Variable Pension (47) (48) 2 (83)
Segment F: Annuity Non Par (629) 3,220 (900) (60)
Segment G: Health (26) (578) (71) (325)
Segment H: Linked Life 31,661 9,971 17,839 56,557
Segment I: Linked Pension 4,074 4,632 5,706 20,571
Segment J: Linked Health 880 (5,000) 819 (2,693)
Segment K: Linked Group Life (220) 160 133 385
Segment L: Linked Group Pension 272 306 138 1,031
Shareholders 13,168 20,183 12,734 58,908
Segment Assets:
Segment A: Par life 1,666,699 1,608,048 1,364,263 1,608,048
Segment B: Par pension 120,934 119,696 119,286 119,696
Segment C: Non Par 2,047,871 1,962,646 1,674,553 1,962,646
Segment D: Non Par Variable 18,407 9,910 8,957 9,910
Segment E: Non Par Variable Pension 10,118 7,968 1,394 7,968
Segment F: Annuity Non Par 363,669 341,599 282,737 341,599
Segment G: Health 3,330 3,217 1,793 3,217
Segment H: Linked Life 9,456,007 9,257,257 7,986,451 9,257,257
Segment I: Linked Pension 1,036,009 1,083,696 1,263,696 1,083,696
Segment J: Linked Health 102,256 102,757 95,881 102,757
Segment K: Linked Group Life 400,682 399,241 386,497 399,241
Segment L: Linked Group Pension 348,553 341,912 329,091 341,912
Shareholders 729,687 704,234 661,512 704,234
Segment Policy Liabilities:
Segment A: Par life 1,666,699 1,608,048 1,364,263 1,608,048
Segment B: Par pension 120,934 119,696 119,286 119,696
Segment C: Non Par 2,047,871 1,962,646 1,674,553 1,962,646
Segment D: Non Par Variable 18,407 9,910 8,957 9,910
Segment E: Non Par Variable Pension 10,118 7,968 1,394 7,968
Segment F: Annuity Non Par 363,669 341,599 282,737 341,599
Segment G: Health 3,330 3,217 1,793 3,217
Segment H: Linked Life 9,456,007 9,257,257 7,986,451 9,257,257
Segment I: Linked Pension 1,036,009 1,083,696 1,263,696 1,083,696
Segment J: Linked Health 102,256 102,757 95,881 102,757
Segment K: Linked Group Life 400,682 399,241 386,497 399,241
Segment L: Linked Group Pension 348,553 341,912 329,091 341,912
Footnotes:
1
(d) Business within India and business outside India
2 Net of Provisions for diminution in value of investments
2
3
4
Segments are as under:
(b) Non-Linked
1. Non-Participating Policies: (i) Life (ii) General Annuity and Pension (iii) Health (iv) Variable
2. Participating Policies : (i) Life (ii) General Annuity and Pension (iii) Health (iv) Variable
(a) Linked Policies (i) Life (ii) General Annuity and Pension (iii) Health (iv) Variable
(c) Variable insurance shall be further segregated into Life and Pension.

Status of Shareholders Complaints for the quarter ended June 30, 2019:
Sr No. Particulars Number
1 No. of investor complaints pending at the beginning of period 2
2 No. of investor complaints received during the period 44
3 No. of investor complaints disposed off during the period 43
4 No. of investor complaints remaining unresolved at the end of the period 3*
* These complaints have been responded to within timeline.
ICICI Prudential Life Insurance Company Limited
Other disclosures:

Notes:
1. The above financial results of the Company for the quarter ended June 30, 2019 were
reviewed by the Audit Committee and subsequently approved by the Board of Directors at its
meeting held on July 24, 2019.
2. These financial results have been prepared in accordance with the requirements of Regulation
33 of the SEBI (Listing Obligation and Disclosure Requirements) Regulations, 2015, to the
extent applicable, and IRDAI circular IRDA/F&I/REG/CIR/208/10/2016 dated October 25, 2016
on publication of financial results for life insurance companies.
3. The above standalone and consolidated financial results are audited by the joint statutory
auditors, B S R & Co. LLP, Chartered Accountants and Walker Chandiok & Co LLP, Chartered
Accountants.
4. In view of seasonality of Industry, the financial results for the quarter are not indicative of full
year's expected performance.
5. The amounts for the quarter ended March 31, 2019 are balancing amounts between the
amounts as per audited accounts for the year ended March 31, 2019 and nine months ended
December 31, 2018.
6. During the quarter ended months ended June 30, 2019, the Company has allotted 55,000
equity shares of face value of ` 10 each pursuant to exercise of employee stock options.
7. Other income includes interest on tax refund for the quarter ended June 30, 2019 of ` nil (for
the quarter and year ended March 31, 2019 of ` 785 lacs & for the quarter ended June 30,
2018 of ` nil).
8. The shareholders have approved a final dividend of ` 1.60 per equity share of face value of `
10 each for the year ended March 31, 2019 at the annual general meeting held on July 17,
2019, as per the requirement of Accounting Standards, same would be accounted for in Q2-
FY2020.
9. Figures of the previous year have been re-grouped wherever necessary, to conform to the
current year presentation.
10. In accordance with requirements of IRDAI Master Circular on “Preparation of Financial
Statements and Filing of Returns of Life Insurance Business” dated December 11, 2013, the
Company will publish the financials on the Company’s website latest by August 14, 2019.
For and on behalf of the Board of Directors
N. S. Kannan
Managing Director & CEO
DIN:00066009

B S R & Co. LLP Walker Chandiok & Co LLP
Chartered Accountants Chartered Accountants
5th Floor, Lodha Excelus
Apollo Mills Compound
Mahalakshmi
Mumbai – 400 011
India
Telephone +91 22 4345 5300
Fax +91 22 4345 5399
16th Floor, Tower II
Indiabulls Finance Centre
S. B. Marg, Elphinstone (West)
Mumbai – 400 013
India
Telephone +91 22 6626 2600
Fax +91 22 6626 2601
B S R & Co. LLP (LLPIN No. AAB-8181),
registered with limited liability
Auditor’s Report on Quarterly Standalone Financial Results of ICICI
Prudential Life Insurance Company Limited pursuant to the Regulation
33 of the SEBI (Listing Obligations and Disclosure Requirements)
Regulations, 2015 read with IRDA Circular reference:
IRDAI/F&I/REG/CIR/208/10/2016 dated 25th October 2016
To The Board of Directors of
ICICI Prudential Life Insurance Company Limited
We have audited the accompanying quarterly standalone financial results of ICICI Prudential Life
Insurance Company Limited (the “Company”) for the quarter ended June 30, 2019, attached
herewith, being submitted by the Company pursuant to the requirement of Regulation 33 of the SEBI
(Listing Obligations and Disclosure Requirements) Regulations, 2015 and IRDA Circular reference:
IRDAI/F&I/REG/CIR/208/10/2016 dated October 25, 2016. These quarterly standalone financial
results have been prepared on the basis of the condensed standalone interim financial statements,
which are the responsibility of the Company’s management and have been approved by the Board
of Directors on July 24, 2019.
Our responsibility is to express an opinion on these quarterly standalone financial results based on
our audit of such condensed standalone interim financial statements, which have been prepared in
accordance with the recognition and measurement principles laid down in Accounting Standard
(“AS”)- 25, “Interim Financial Reporting”, specified under Section 133 of the Companies Act, 2013
(the “Act”), including the relevant provisions of the Insurance Act, 1938 (the “Insurance Act”), the
Insurance Regulatory and Development Authority Act, 1999 (the “IRDA Act”) and other accounting
principles generally accepted in India, to the extent considered relevant and appropriate for the
purpose of quarterly standalone financial results and which are not inconsistent with the accounting
principles as prescribed in the Insurance Regulatory and Development Authority (Preparation of
Financial Statements and Auditors’ Report of Insurance Companies) Regulations, 2002 (the “IRDA
Financial Statements Regulations”) and orders/directions/circulars issued by the Insurance
Regulatory and Development Authority of India (“IRDAI”/ “Authority”), to the extent applicable.
We conducted our audit in accordance with the auditing standards generally accepted in India. Those
standards require that we plan and perform the audit to obtain reasonable assurance about whether
the quarterly standalone financial results are free of material misstatement(s). An audit includes
examining, on a test basis, evidence supporting the amounts disclosed as quarterly standalone
financial results. An audit also includes assessing the accounting principles used and significant
estimates made by management. We believe that our audit provides a reasonable basis for our
opinion.
Attention is drawn to the fact that the figures for the three months ended 31 March 2019 as reported
in these financial results are the balancing figures between audited figures in respect of the full
financial year and the audited published year to date figures upto the end of the third quarter of the
previous financial year.
B S R & Co. LLP Walker Chandiok & Co LLP
Auditor’s Report on Quarterly Standalone Financial Results of ICICI
Prudential Life Insurance Company Limited pursuant to the Regulation
33 of the SEBI (Listing Obligations and Disclosure Requirements)
Regulations, 2015 read with IRDA Circular reference:
IRDAI/F&I/REG/CIR/208/10/2016 dated 25th October 2016 (Continued)
ICICI Prudential Life Insurance Company Limited
In our opinion and to the best of our information and according to the explanations given to us, these
quarterly standalone financial results:
(i) are presented in accordance with the requirements of Regulation 33 of the SEBI (Listing
Obligations and Disclosure Requirements) Regulations, 2015 and IRDAI Circular reference
IRDAI/F&I/REG/CIR/208/10/2016 dated October 25, 2016 in this regard; and
(ii) give a true and fair view of the standalone net profit and other financial information for the
quarter ended June 30, 2019.
Other matter
The actuarial valuation of liabilities for life policies in force and for policies in respect of which
premium has been discontinued but liability exists as at June 30, 2019 is the responsibility of the
Company’s Appointed Actuary (the “Appointed Actuary”). The actuarial valuation of these
liabilities for life policies in force and for policies in respect of which premium has been discontinued
but liability exists as at June 30, 2019 has been duly certified by the Appointed Actuary and in her
opinion, the assumptions for such valuation are in accordance with the guidelines and norms issued
by the IRDAI and the Institute of Actuaries of India in concurrence with the Authority. We have
relied upon the Appointed Actuary’s certificate in this regard for forming our opinion on the
valuation of liabilities for life policies in force and for policies in respect of which premium has been
discontinued but liability exists, as contained in the condensed standalone interim financial
statements of the Company.
Our opinion is not modified in respect of this matter.
For B S R & Co. LLP
Chartered Accountants
For Walker Chandiok & Co LLP
Chartered Accountants
ICAI Firm’s Registration No: 101248W/W-100022 ICAI Firm Registration No:001076N/N500013
Manoj Kumar Vijai Khushroo B. Panthaky Partner Partner
Membership No: 046882 Membership No: 42423
UDIN:
UDIN:
Mumbai Mumbai
July 24, 2019 July 24, 2019
B S R & Co. LLP Walker Chandiok & Co LLP
Chartered Accountants Chartered Accountants
5th Floor, Lodha Excelus
Apollo Mills Compound
Mahalakshmi
Mumbai – 400 011
India
Telephone +91 22 4345 5300
Fax +91 22 4345 5399
16th Floor, Tower II
Indiabulls Finance Centre
S. B. Marg, Elphinstone (West)
Mumbai – 400 013
India
Telephone +91 22 6626 2600
Fax +91 22 6626 2601
B S R & Co. LLP (LLPIN No. AAB-8181),
registered with limited liability
Auditor’s Report on Quarterly Consolidated Financial Results of ICICI
Prudential Life Insurance Company Limited pursuant to the Regulation
33 of the SEBI (Listing Obligations and Disclosure Requirements)
Regulations, 2015 read with IRDA Circular reference:
IRDAI/F&I/REG/CIR/208/10/2016 dated 25th October 2016
To The Board of Directors of
ICICI Prudential Life Insurance Company Limited
We have audited the accompanying quarterly consolidated financial results of ICICI Prudential Life
Insurance Company Limited (hereinafter referred to as the ‘Holding Company’) and its subsidiary
‘ICICI Prudential Pension Funds Management Company Limited’ (the Holding Company and its
subsidiary together referred to as the ‘Group’) for the quarter ended June 30, 2019, attached herewith,
being submitted by the Holding Company pursuant to the requirement of Regulation 33 of the SEBI
(Listing Obligations and Disclosure Requirements) Regulations, 2015 and IRDA Circular reference:
IRDAI/F&I/REG/CIR/208/10/2016 dated October 25, 2016. These quarterly consolidated financial
results have been prepared on the basis of the condensed consolidated interim financial statements,
which are the responsibility of the Holding Company’s management and have been approved by the
Holding Company’s Board of Directors on July 24, 2019.
Our responsibility is to express an opinion on these quarterly consolidated financial results based on
our audit of such condensed consolidated interim financial statements, which have been prepared in
accordance with the recognition and measurement principles laid down in Accounting Standard
(“AS”) 25, “Interim Financial Reporting”, specified under Section 133 of the Companies Act, 2013
(the “Act”), including the relevant provisions of the Insurance Act, 1938 (the “Insurance Act”), the
Insurance Regulatory and Development Authority Act, 1999 (the “IRDA Act”) and other accounting
principles generally accepted in India, to the extent considered relevant and appropriate for the
purpose of quarterly consolidated financial results and which are not inconsistent with the accounting
principles as prescribed in the Insurance Regulatory and Development Authority (Preparation of
Financial Statements and Auditors’ Report of Insurance Companies) Regulations, 2002 (the “IRDA
Financial Statements Regulations”) and orders/directions/circulars issued by the Insurance
Regulatory and Development Authority of India (“IRDAI”/ “Authority”) to the extent applicable.
We conducted our audit in accordance with the auditing standards generally accepted in India. Those
standards require that we plan and perform the audit to obtain reasonable assurance about whether
the quarterly consolidated financial results are free of material misstatement(s). An audit includes
examining, on a test basis, evidence supporting the amounts disclosed as quarterly consolidated
financial results. An audit also includes assessing the accounting principles used and significant
estimates made by management. We believe that our audit provides a reasonable basis for our
opinion.
Attention is drawn to the fact that the figures for the three months ended 31 March 2019 as reported
in these consolidated financial results are the balancing figures between audited figures in respect of
the full financial year and the audited published year to date figures upto the end of the third quarter
of the previous financial year.
B S R & Co. LLP Walker Chandiok & Co LLP
Auditors’ Report on Quarterly Consolidated Financial Results of ICICI
Prudential Life Insurance Company Limited pursuant to the Regulation
33 of the SEBI (Listing Obligations and Disclosure Requirements)
Regulations, 2015 read with IRDA Circular reference:
IRDAI/F&I/REG/CIR/208/10/2016 dated 25th October 2016 (Continued)
ICICI Prudential Life Insurance Company Limited
In our opinion and to the best of our information and according to the explanations given to us, these
quarterly consolidated financial results:
(i) are presented in accordance with the requirements of Regulation 33 of the SEBI (Listing
Obligations and Disclosure Requirements) Regulations, 2015 and IRDAI Circular reference
IRDAI/F&I/REG/CIR/208/10/2016 dated October 25, 2016 in this regard; and
(ii) give a true and fair view of the consolidated net profit and other financial information for the
quarter ended June 30, 2019.
Other matters
1. We did not audit the condensed interim financial statements of the subsidiary included in the
Group, whose condensed interim financial statements reflect total assets of ` 354,013 thousand
as at June 30, 2019, total revenues of ` 8,294 thousand for the quarter June 30, 2019 and net cash
outflow amounting to ` 193 thousand for the quarter ended on that date, as considered in the
condensed consolidated interim financial statements. These condensed interim financial
statements are unaudited and have been furnished to us by the Management and our opinion on
the condensed consolidated interim financial statements, in so far as it relates to the amounts and
disclosures included in respect of such subsidiary is based solely on such unaudited condensed
interim financial statements. In our opinion and according to the information and explanations
given to us by the Management of the Holding Company, these condensed interim financial
statements are not material to the Group. 2. The actuarial valuation of liabilities for life policies in force and for policies in respect of which
premium has been discontinued but liability exists as at June 30, 2019 is the responsibility of the
Holding Company’s Appointed Actuary (the “Appointed Actuary”). The actuarial valuation of
these liabilities for life policies in force and for policies in respect of which premium has been
discontinued but liability exists as at June 30, 2019 has been duly certified by the Appointed
Actuary and in her opinion, the assumptions for such valuation are in accordance with the
guidelines and norms issued by the IRDAI and the Institute of Actuaries of India in concurrence
with the Authority. We have relied upon the Appointed Actuary’s certificate in this regard for
forming our opinion on the valuation of liabilities for life policies in force and for policies in
respect of which premium has been discontinued but liability exists, as contained in the
condensed consolidated interim financial statements of the Group.
Our opinion is not modified in respect of the above matters.
For B S R & Co. LLP
Chartered Accountants
For Walker Chandiok & Co LLP
Chartered Accountants
ICAI Firm’s Registration No: 101248W/W-100022
ICAI Firm Registration No: 001076N/N500013
Manoj Kumar Vijai Khushroo B. Panthaky Partner Partner
Membership No: 046882 Membership No: 42423
UDIN: UDIN:
Mumbai Mumbai
July 24, 2019 July 24, 2019
July 24, 2019
Performance for the quarter ended June 30, 2019
1. Operating performance review
(` in billion)
Persistency6
FY2019 2M-FY20207
13th
month
84.6% 84.4%
25th
month 75.6% 75.7%
37th
month 69.3% 69.8%
49th
month 63.8% 64.2%
61st
month 56.8% 57.3%
1. For full year, based on actual cost; Q1: based on management forecast of full year cost
2. Annualized premium equivalent
3. Retail weighted received premium
4. Source: Life insurance council
5. Total Cost including commission / (Total premium – 90% of single premium)
6. As per IRDA circular dated January 23, 2014; excluding group and single premium policies
7. For policies issued during June to May period of relevant year measured as on June 30
Components may not add up to the totals due to rounding off
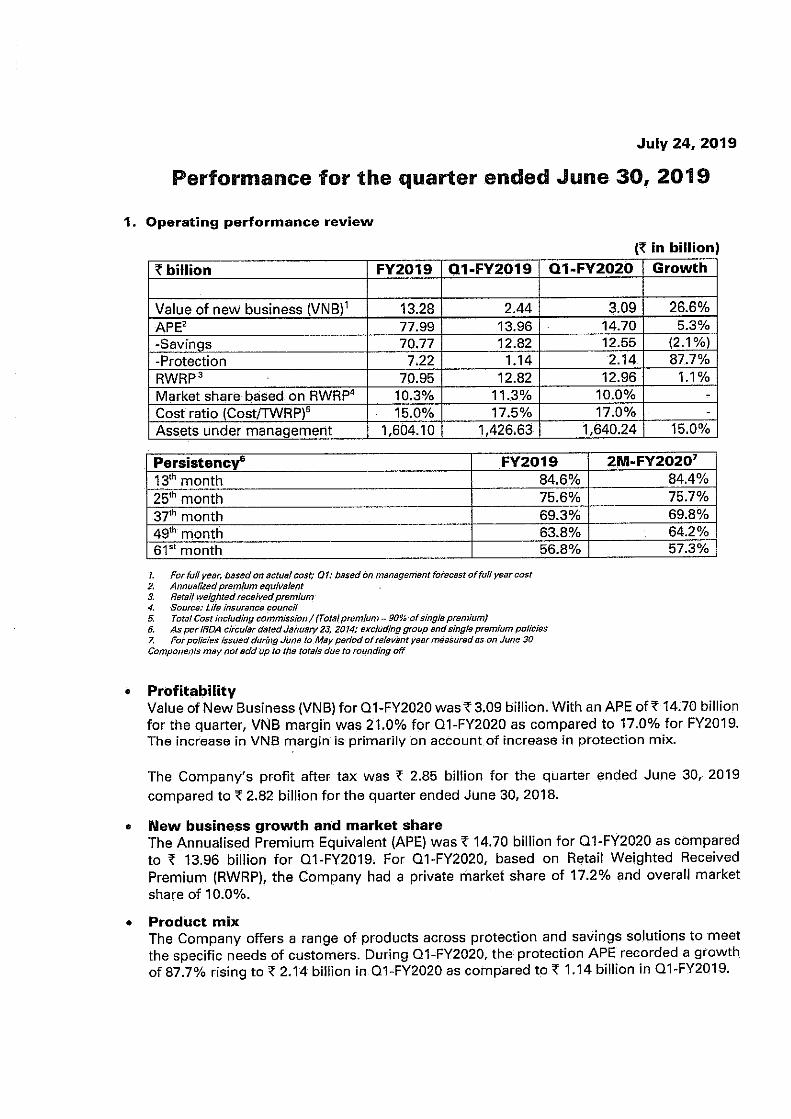
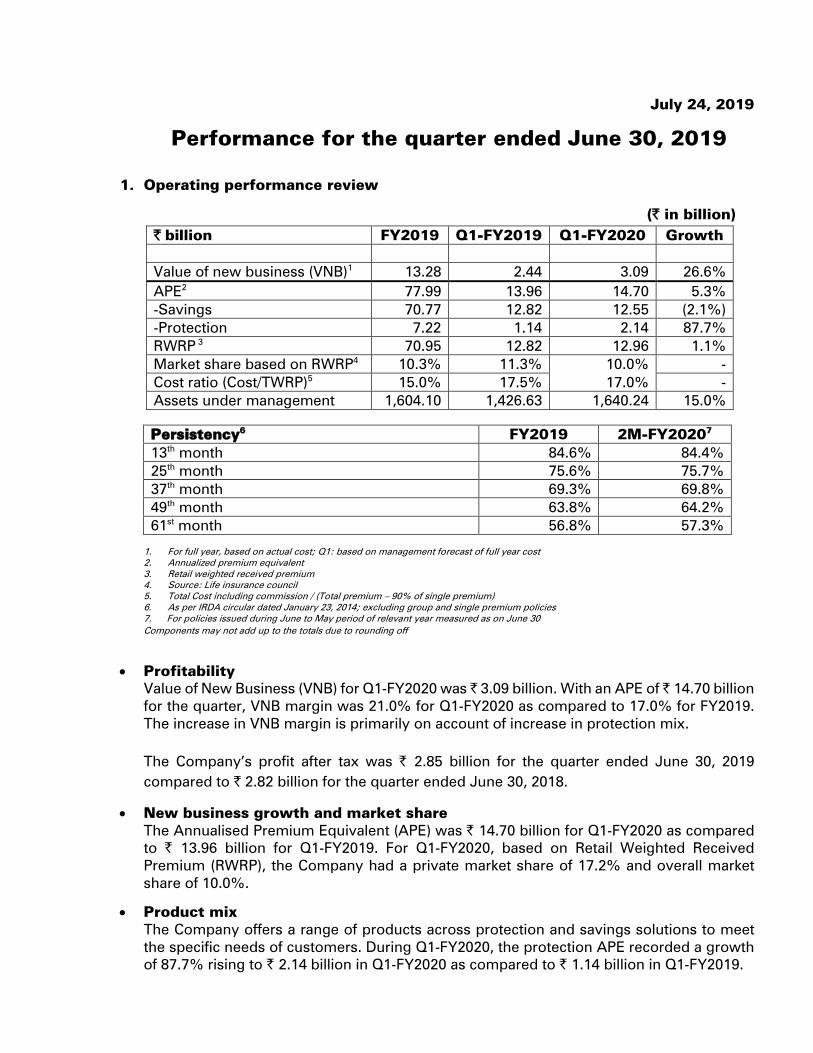
Profitability
Value of New Business (VNB) for Q1-FY2020 was ̀ 3.09 billion. With an APE of ̀ 14.70 billion
for the quarter, VNB margin was 21.0% for Q1-FY2020 as compared to 17.0% for FY2019.
The increase in VNB margin is primarily on account of increase in protection mix.
The Company’s profit after tax was ` 2.85 billion for the quarter ended June 30, 2019
compared to ` 2.82 billion for the quarter ended June 30, 2018.
New business growth and market share
The Annualised Premium Equivalent (APE) was ` 14.70 billion for Q1-FY2020 as compared
to ` 13.96 billion for Q1-FY2019. For Q1-FY2020, based on Retail Weighted Received
Premium (RWRP), the Company had a private market share of 17.2% and overall market
share of 10.0%.
Product mix
The Company offers a range of products across protection and savings solutions to meet
the specific needs of customers. During Q1-FY2020, the protection APE recorded a growth
of 87.7% rising to ` 2.14 billion in Q1-FY2020 as compared to ` 1.14 billion in Q1-FY2019.
` billion FY2019 Q1-FY2019 Q1-FY2020 Growth
Value of new business (VNB)1
13.28 2.44 3.09 26.6%
APE2
77.99 13.96 14.70 5.3%
-Savings 70.77 12.82 12.55 (2.1%)
-Protection 7.22 1.14 2.14 87.7%
RWRP 3
70.95 12.82 12.96 1.1%
Market share based on RWRP4
10.3% 11.3% 10.0% -
Cost ratio (Cost/TWRP)5
15.0% 17.5% 17.0% -
Assets under management 1,604.10 1,426.63 1,640.24 15.0%
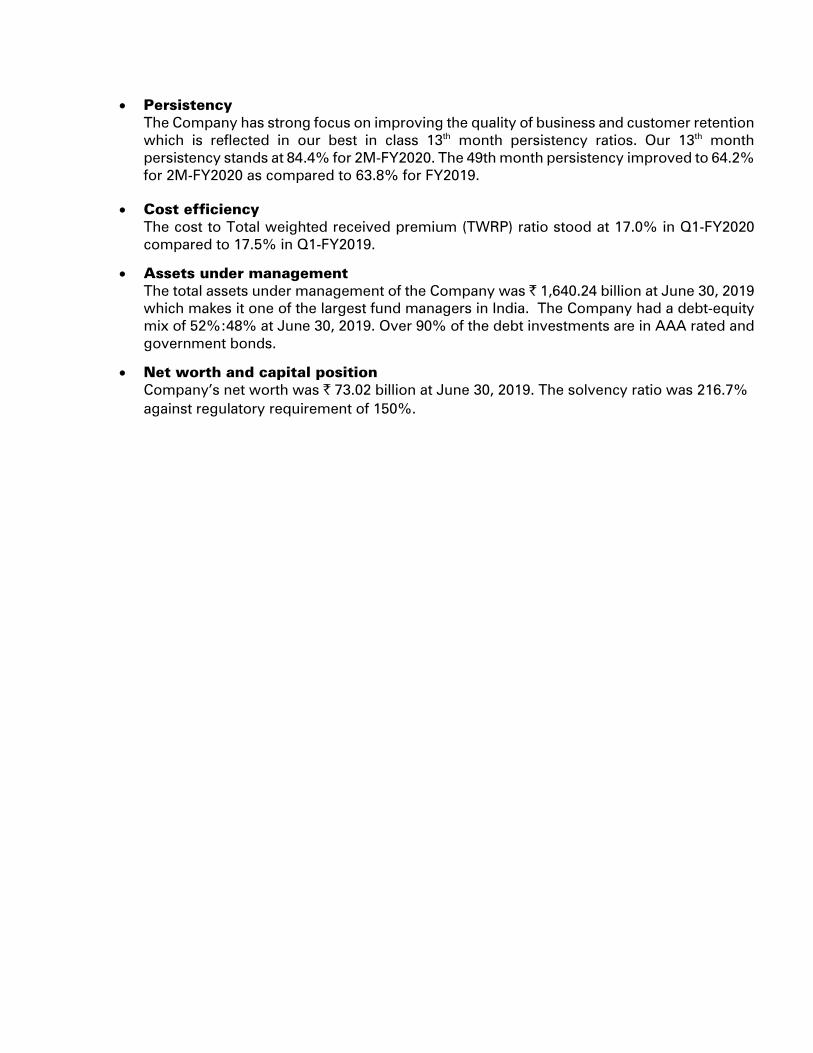
Persistency
The Company has strong focus on improving the quality of business and customer retention
which is reflected in our best in class 13th
month persistency ratios. Our 13th
month
persistency stands at 84.4% for 2M-FY2020. The 49th month persistency improved to 64.2%
for 2M-FY2020 as compared to 63.8% for FY2019.
Cost efficiency
The cost to Total weighted received premium (TWRP) ratio stood at 17.0% in Q1-FY2020
compared to 17.5% in Q1-FY2019.
Assets under management
The total assets under management of the Company was ` 1,640.24 billion at June 30, 2019
which makes it one of the largest fund managers in India. The Company had a debt-equity
mix of 52%:48% at June 30, 2019. Over 90% of the debt investments are in AAA rated and
government bonds.
Net worth and capital position
Company’s net worth was ` 73.02 billion at June 30, 2019. The solvency ratio was 216.7%
against regulatory requirement of 150%.
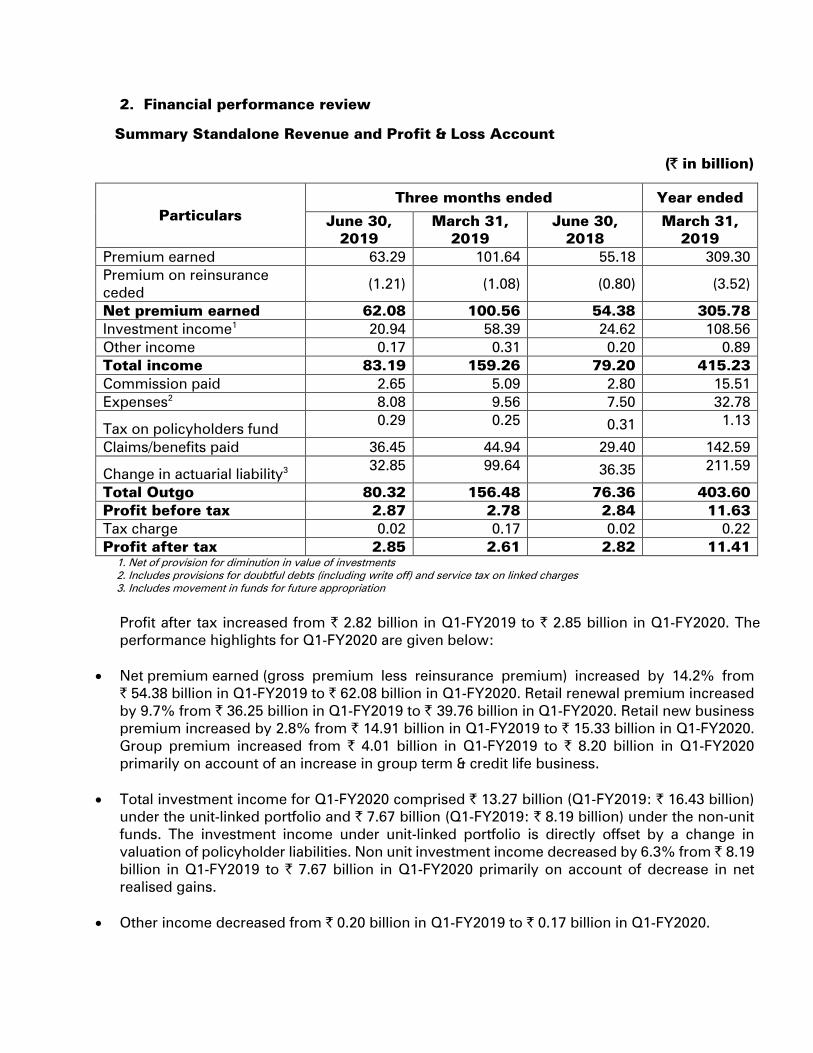
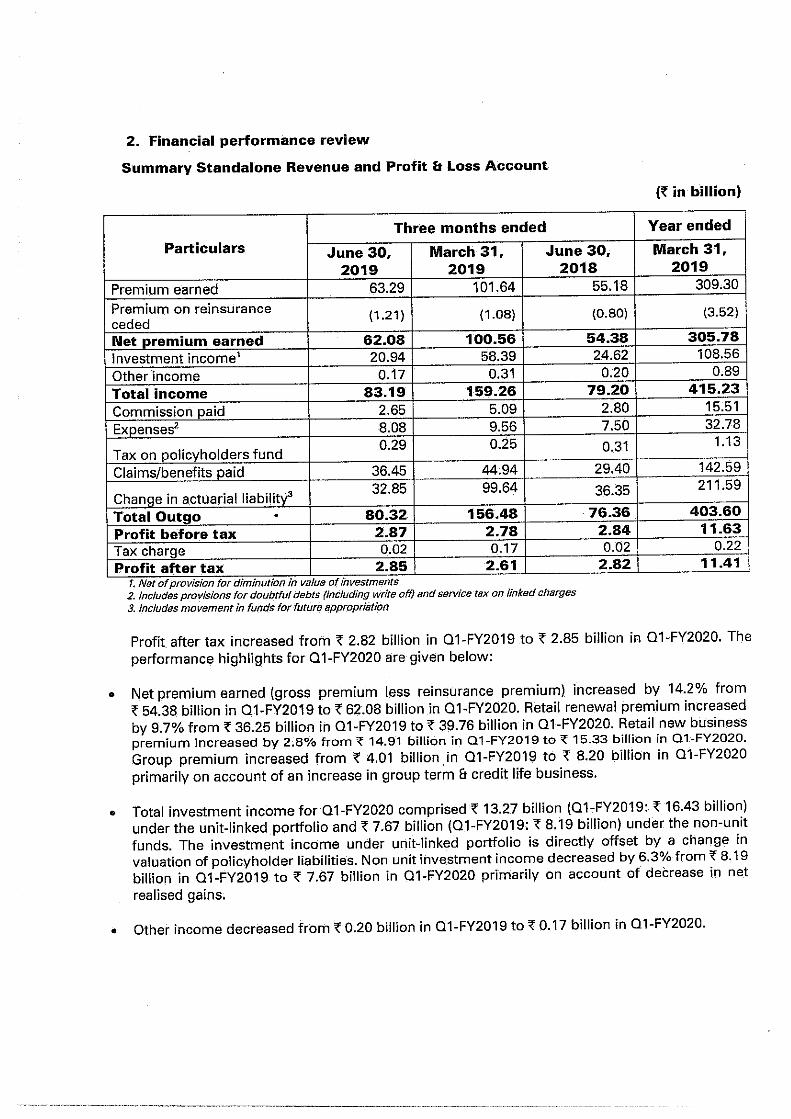
2. Financial performance review
Summary Standalone Revenue and Profit & Loss Account
(` in billion)
Particulars
Three months ended Year ended
June 30,
2019
March 31,
2019
June 30,
2018
March 31,
2019
Premium earned 63.29 101.64 55.18 309.30
Premium on reinsurance
ceded (1.21) (1.08) (0.80) (3.52)
Net premium earned 62.08 100.56 54.38 305.78
Investment income1
20.94 58.39 24.62 108.56
Other income 0.17 0.31 0.20 0.89
Total income 83.19 159.26 79.20 415.23
Commission paid 2.65 5.09 2.80 15.51
Expenses2
8.08 9.56 7.50 32.78
Tax on policyholders fund 0.29 0.25
0.31 1.13
Claims/benefits paid 36.45 44.94 29.40 142.59
Change in actuarial liability3
32.85 99.64
36.35 211.59
Total Outgo 80.32 156.48 76.36 403.60
Profit before tax 2.87 2.78 2.84 11.63
Tax charge 0.02 0.17 0.02 0.22
Profit after tax 2.85 2.61 2.82 11.41
1. Net of provision for diminution in value of investments
2. Includes provisions for doubtful debts (including write off) and service tax on linked charges
3. Includes movement in funds for future appropriation
Profit after tax increased from ` 2.82 billion in Q1-FY2019 to ` 2.85 billion in Q1-FY2020. The
performance highlights for Q1-FY2020 are given below:
Net premium earned (gross premium less reinsurance premium) increased by 14.2% from
` 54.38 billion in Q1-FY2019 to ` 62.08 billion in Q1-FY2020. Retail renewal premium increased
by 9.7% from ` 36.25 billion in Q1-FY2019 to ` 39.76 billion in Q1-FY2020. Retail new business
premium increased by 2.8% from ` 14.91 billion in Q1-FY2019 to ` 15.33 billion in Q1-FY2020.
Group premium increased from ` 4.01 billion in Q1-FY2019 to ` 8.20 billion in Q1-FY2020
primarily on account of an increase in group term & credit life business.
Total investment income for Q1-FY2020 comprised ` 13.27 billion (Q1-FY2019: ` 16.43 billion)
under the unit-linked portfolio and ` 7.67 billion (Q1-FY2019: ` 8.19 billion) under the non-unit
funds. The investment income under unit-linked portfolio is directly offset by a change in
valuation of policyholder liabilities. Non unit investment income decreased by 6.3% from ` 8.19
billion in Q1-FY2019 to ` 7.67 billion in Q1-FY2020 primarily on account of decrease in net
realised gains.
Other income decreased from ` 0.20 billion in Q1-FY2019 to ` 0.17 billion in Q1-FY2020.
Total expenses (including commission) increased by 4.2% from ` 10.30 billion in Q1-FY2019 to
` 10.73 billion in Q1-FY2020. Commission expense decreased by 5.3% from ̀ 2.80 billion in Q1-
FY2019 to ` 2.65 billion in Q1-FY2020. New business commission has decreased from ` 2.08
billion in Q1-FY2019 to ` 1.91 billion in Q1-FY2020. Renewal commission has increased from
` 0.71 billion in Q1-FY2019 to ` 0.74 billion in Q1-FY2020. The decrease in commission expense
is on account of the change in product mix. Operating expenses increased by 7.7% from ` 7.50
billion in Q1-FY2019 to ` 8.08 billion in Q1-FY2020 primarily on account of increased
advertisement cost.
Claims and benefit payouts increased by 24.0% from ` 29.40 billion in Q1-FY2019 to ` 36.45
billion in Q1-FY2020 primarily on account of increase in surrender claims by ` 7.03 billion from
` 21.46 billion in Q1-FY2019 to ` 28.49 billion in Q1-FY2020.
Change in actuarial liability, including funds for future appropriation, decreased from ` 36.35
billion in Q1-FY2019 to ` 32.85 billion in Q1-FY2020. Fund reserve, which represents liability
carried on account of units held by unit linked policyholders, decreased from ` 22.32 billion in
Q1-FY2019 to ` 16.13 billion in Q1-FY2020. The decrease in fund reserves is primarily due to a
direct offset of increase in claims, lower investment income offset by increase in premium in
the unit-linked portfolio. Non-unit reserve increased from ̀ 13.48 billion in Q1-FY2019 to ̀ 16.18
billion in Q1-FY2020.
Disclaimer
Except for the historical information contained herein, statements in this release which contain words or phrases such as
'will', ‘expected to’, etc., and similar expressions or variations of such expressions may constitute 'forward-looking
statements'. These forward-looking statements involve a number of risks, uncertainties and other factors that could cause
actual results, opportunities and growth potential to differ materially from those suggested by the forward-looking
statements. These risks and uncertainties include, but are not limited to, the actual growth in demand for insurance and
other financial products and services in the countries that we operate or where a material number of our customers
reside, our ability to successfully implement our strategy, including our use of the Internet and other technology our
exploration of merger and acquisition opportunities, our ability to integrate mergers or acquisitions into our operations
and manage the risks associated with such acquisitions to achieve our strategic and financial objectives, our growth and
expansion in domestic and overseas markets, technological changes, our ability to market new products, the outcome
of any legal, tax or regulatory proceedings in India and in other jurisdictions we are or become a party to, the future
impact of new accounting standards, our ability to implement our dividend policy, the impact of changes in insurance
regulations and other regulatory changes in India and other jurisdictions on us. ICICI Prudential Life insurance undertakes
no obligation to update forward-looking statements to reflect events or circumstances after the date thereof.
This release does not constitute an offer of securities.
For investor queries please reach out to Investor relations team at +91-22-40391600 or email [email protected].
1 billion = 100 crore

News Release July 24, 2019
NSE Code: ICICIPRULI BSE Code: 540133
Financial Results for the quarter ended June 30, 2019
Q1-FY2020 Performance Highlights
VNB grew by 27%
VNB margin increased to 21.0%
Protection APE grew by 88% and is at 14.6% of APE
Total premium grew by 14.7%
Value of New Business (VNB)
The VNB increased by 27% from ̀ 2.44 billion in Q1-FY2019 to ̀ 3.09 billion in Q1-FY2020.
The VNB margin increased from 17.0% in FY2019 to 21.0% in Q1-FY2020.
Premium growth
The total premium registered a healthy growth of 14.7% from ` 55.18 billion for Q1-FY2019
to ̀ 63.29 billion for Q1-FY2020. The Annualised Premium Equivalent (APE) grew by 5.3%
from ` 13.96 billion in Q1-FY2019 to ` 14.70 billion in Q1-FY2020.
Protection business share
Protection APE grew by 88% from ` 1.14 billion in Q1-FY2019 to ` 2.14 billion in Q1-
FY2020. The share of protection business in Annualised Premium Equivalent (APE)
increased from 8.2% in Q1-FY2019 to 14.6% in Q1-FY2020.
Persistency1
The 13th month persistency was 84.4% in Q1-FY2020. The 49
th month persistency
improved from 63.8% in FY2019 to 64.2% in Q1-FY2020.
Productivity
The Cost/TWRP for the savings business improved from 13.7% for Q1-FY2019 to 11.3%
for Q1-FY2020.
Commenting on the results, Mr. N. S. Kannan, MD & CEO of ICICI Prudential
Life said, “The Value of New Business grew by 27% to ` 3.09 billion for the first quarter
of FY2020. We believe our customer centric approach and digitalisation initiatives, coupled
with the growing needs of protection, savings and retirement for the country’s young
working population will continue to drive growth for us. Protection is an underserved
segment in the country, our innovative product offerings in this segment has fuelled
growth of the protection business by 88% resulting in a protection mix of 14.6% of the
overall APE. We are happy to report that ICICI Pru iProtect Smart, our flagship protection
product has been voted ‘Product of the Year 2019’#.
Mr. Kannan further said, ”Our emphasis on matching products with customers’ needs,
use of new age technology solutions and service touch-points employing Artificial
Intelligence, Chatbots, Machine Learning, WhatsApp, convenient payment options etc. to
empower and provide the customers with an immersive experience, has enabled us to

have one of the best 13th month persistency
1 levels in the industry of 84.4%. Our Assets
under management grew 15% over the year to ` 1.64 trillion.”
Operational Metrics:
` billion Q1-FY2019 Q1-FY2020 Growth
YoY
Value of New Business (VNB) 2.44 3.09 26.6%
VNB margin 17.5% 21.0% -
Total Premium 55.18 63.29 14.7%
Annualized Premium Equivalent (APE) 13.96 14.70 5.3%
Savings 12.82 12.55 (2.1%)
Protection 1.14 2.14 87.7%
Savings Cost Ratio (Cost/TWRP)
13.7% 11.3% -
Assets Under Management (AUM) 1,426.63 1,640.24 14.93%
Persistency1 FY2019 Q1-FY2020
13th month
84.6% 84.4%
25th month 75.6% 75.7%
37th month 69.3% 69.8%
49th month 63.8% 64.2%
61st month 56.8% 57.3%
1 As per IRDA circular dated January 23, 2014; excluding group and single premium policies; in FY2019, for policies
issued during April to March period of relevant year measured as on April 30; in Q1-FY2020, for policies issued during
June to May period of relevant year measured as on June 30.
# ICICI Pru iProtect Smart voted "Product of the Year 2019" in the life insurance category by Product of the Year (India)
Private Limited.

Definitions, abbreviations and explanatory notes
Annual Premium Equivalent (APE): APE is a measure of new business written by a life
insurance company. It is computed as the sum of annualised first year premiums on regular
premium policies, and ten percent of single premiums, written by the Company during any
period from new retail and group customers.
Value of New Business (VNB) and VNB margin: VNB is used to measure profitability of
the new business written in a period. It is present value of all future profits to shareholders
measured at the time of writing of the new business contract. Future profits are computed on
the basis of long term assumptions which are reviewed annually. VNB is also referred to as NBP
(new business profit). VNB margin is computed as VNB for the period/APE for the period. It is
similar to profit margin for any other business.
Retail Weighted Received Premium (RWRP): RWRP is a new business measure very
similar to APE for the retail (also referred to as individual) business with the only difference
being that the regular premiums considered here are first year premiums actually received by
the life insurer and not annualised. Secondly, since it is a new business measure for retail
business, it includes only premium received from retail customers. It is the sum of all retail first
year premiums and ten percent of retail single premiums received in a period.
Persistency: It is the most common parameter for quality of business representing the
percentage of retail policies (where premiums are expected) that continue paying premiums.
The method of computation of Persistency has been prescribed by IRDAI vide its circular dated
January 23, 2014.
Total Weighted Received Premium (TWRP): TWRP is a measure of total premiums from
new and existing retail and group customers received in a period. It is sum of first year and
renewal premiums on regular premium policies and ten percent of single premiums received
from both retail and group customers by Company during the period.
Cost Ratio: Cost ratio is a measure of the cost efficiency of a Company. Expenses are incurred
by the Company on new business as well as renewal premiums. Cost ratio is computed as a
ratio of all expenses incurred in a period comprising commission, operating expenses,
provision for doubtful debts and bad debts written off to total weighted received premium
(TWRP).
About ICICI Prudential Life Insurance
ICICI Prudential Life is promoted by ICICI Bank Ltd. and Prudential Corporation Holdings Ltd.,
headquartered in United Kingdom. The Company began operations in fiscal 2001 and has
consistently been amongst the top private sector life insurance companies in India.
The Company offers an array of products in the Protection and Savings category which match the
different life stage requirements of customers, enabling them to provide a financial safety net to
their families as well as achieve their long term financial goals. The digital platform of the Company
provides a paperless on-boarding experience to customers, empowers them to conduct an
assortment of self-service transactions, provides a convenient route to make digital payments for
purchasing & making renewal premium payments and facilitates a hassle free claims settlement
process etc.
ICICI Prudential Life is the first private life insurance company to cross the ` 1 trillion mark for Assets
under Management (AUM). At June 30, 2019, the Company had an AUM of ` 1,640.24 billion and a
Total Sum Assured of approx. ` 11.85 trillion. ICICI Prudential Life is listed on both National Stock
Exchange (NSE) and The Bombay Stock Exchange (BSE).

Disclaimer
Except for the historical information contained herein, statements in this release which contain
words or phrases such as 'will', ‘expected to’, etc., and similar expressions or variations of such
expressions may constitute 'forward-looking statements'. These forward-looking statements
involve a number of risks, uncertainties and other factors that could cause actual results,
opportunities and growth potential to differ materially from those suggested by the forward-looking
statements. These risks and uncertainties include but and are not limited to, the actual growth in
demand for insurance and other financial products and services in the countries that we operate or
where a material number of our customers reside, our ability to successfully implement our
strategy, including our use of the Internet and other technology our exploration of merger and
acquisition opportunities, our ability to integrate mergers or acquisitions into our operations and
manage the risks associated with such acquisitions to achieve our strategic and financial objectives,
our growth and expansion in domestic and overseas markets, technological changes, our ability to
market new products, the outcome of any legal, tax or regulatory proceedings in India and in other
jurisdictions we are or become a party to, the future impact of new accounting standards, our ability
to implement our dividend policy, the impact of changes in insurance regulations and other
regulatory changes in India and other jurisdictions on us. ICICI Prudential Life insurance undertakes
no obligation to update forward-looking statements to reflect events or circumstances after the date
thereof. This release does not constitute an offer of securities.
For further queries;
Adfactors PR
Ms. Jyothi Goswami
Mobile: +91 99870 36388
Email: [email protected]
ICICI Prudential Life Insurance Company
` 1 billion = ` 100 crore