Embed Size (px)
Citation preview
CLIMATE RESEARCHClim Res
Vol. 36: 17–28, 2008doi: 10.3354/cr00707
Published March 13
1. INTRODUCTION
River ice is present during a part of the year on manyrivers of cold, and even temperate, regions of theglobe. The river ice has significant hydrologic effects,including extreme flood events caused by ice jams,interference with transportation and energy produc-tion, low winter flows and associated ecological andwater quality consequences (Prowse & Beltaos 2002).
Recent record shows a trend of later freeze up andearlier break up of ice on rivers and lakes, in agree-ment with other global warming indicators, e.g. a risein air temperatures over moderate latitudes of theNorthern Hemisphere and particularly over interiorcontinental areas. Freeze- and break-up dates changeby approximately 4 to 7 d for every °C change in airtemperature (WMO 1997), and so can be used as anindicator of climate change. In addition to ecologicaleffects on freshwater systems, changes in lake andriver ice cover could have additional effects, such asthe economic effect on ‘ice road’ transportation.
Comprehensive river ice studies date back to thebeginning of the 20th century. Research into river heatbalance and its components was lead by Devik (1931).Krickij et al. (1947) specified and simplified the heatbalance calculations experimentally. Gotlib et al. (1983)investigated the dependence of riverine ice regimes on
upstream hydrotechnical facilities. These authors alsodeveloped quantitative assessment methods for riverfreeze-up forecast. Temporal variation in river icebreak-up dates, and the predictability of these dates,was analysed by Bulatov (1972), Buzin & Lazarevskaja(1980), Donchenko (1987) and Shiklomanov (1989).Donchenko (1987) divided break-up processes into 3types: (1) processes forced by solar radiation togetherwith air and water temperatures; (2) processes domi-nated by ice melt together with water stream impact;and (3) processes associated with increased pressureon ice cover forced by rising water levels and acceler-ating stream flows. According to Shiklomanov (1989),it is likely that upstream hydrotechnical facilities suchas hydropower plants increase the ice cover break-uprate substantially.
Ice regime characteristics of the inland waters in theformer Soviet Union are comprehensively depicted byVazhnov (1976), Michailov & Dobrovolsky (1991) and,more globally, by Ashton (1986).
Little research has been done on the relationshipsbetween riverine ice regimes and atmospheric circula-tion patterns. Beilinson (1989) has identified large-scale atmospheric circulation patterns precedinganomalous freeze- and break-up dates in Kazakhstanwater bodies, and Jasek (1999) argued that the 1998anomalous early break up and flood on the Yukon river
© Inter-Research 2008 · www.int-res.com*Email: [email protected]
Ice regime dynamics in the Nemunas River,Lithuania
E. Stonevicius*, G. Stankunavicius, K. Kilkus
Department of Hydrology and Climatology of Vilnius University, M. K. Ciurlionio St. 21/27, 03101 Vilnius, Lithuania
ABSTRACT: Ice cover persistence in the lower reaches of the Nemunas River has decreased duringthe last 150 yr. The variation in the river freeze- and break-up dates is related to climatic variables.The significance of the negative break-up trend exceeds that of the positive freeze-up trend. Low-frequency large-scale atmospheric circulation patterns such as the North Atlantic Oscillation andArctic Oscillation (NAO/AO) appear to have more influence on the break-up date than on the freeze-up date. Different classification methods applied to the atmospheric patterns prevailing in the earlyfreeze-up events reveal similar results; however, differences arising between classifications areattributable to non-persistent and high frequency patterns.
KEY WORDS: River ice cover · Freeze up · Break up · Atmospheric forcing
Resale or republication not permitted without written consent of the publisher
Clim Res 36: 17–28, 2008
was forced primarily by El Niño and its mid-latitudeteleconnections.
Kilkus (1989, 1992, 1998) and Rainys (1975) exam-ined the ice regime of rivers and lakes in Lithuania.Kilkus & Valiuskevicius (2001) were the first to analyselong-term (1811–1995) ice cover parameters and theirtrends in various national inland water bodies, whileBukantis & Kilkus (2004) were the first to relate theNorth Atlantic Oscillation (NAO) to the hydrologicalregime of various water bodies in Lithuania.
Anthropogenic influences on the Nemunas River iceregime are examined in only a small number of papers.Rainys (1975) asserted that changes in the river icecover formation were observed 20–30 km downstreamof the Kaunas Hydropower Plant (HPP). Using a vari-ety of statistical techniques, Stonevicius (2004) foundthat the main turning point in the ice regimes of theNemunas and Neris rivers occurred in 1972 (KaunasHPP was built in 1960), and that this turning point wasprobably caused by climate change. Of all ice coverbreak-up events during 1950–2000 in the NemunasRiver lower reaches, 91.7% were forced by a rapid risein water level (34 spring runoff events and 10 winter-time events).
The most recent results for Canada show an interest-ing regional difference, with rivers over the westernregions generally showing trends toward earlier breakup, and rivers over the eastern regions showing laterbreak up (Zhang et al. 2001).
Many factors influence river and lake ice break up,i.e. air temperature, ice thickness, snow cover, wind,water temperature and depth of water below the ice. Infact, river ice is affected by several meteorologicalvariables that define the surface energy balance. Airtemperature is the most important variable affectinglake ice, strongly influencing freeze up, growth, dura-tion, and break up (Barry & Maslanik 1993). For rivers,air temperature dominates ice formation and growth,while rainfall and snowmelt control basin runoff, flow,and ice break up.
In many temperate regions, water temperatures inrivers respond rapidly to changing air temperatures,causing frequent cycles of ice and water storage in thechannel and its subsequent release as unsteady flow.More stable river ice conditions develop in colderregions, typically causing a large seasonal shift in flow,with water stored during freeze up making an impor-tant contribution to the flood at break up (Smith 2000).Of particular concern are large flow changes due tohydropower production that degrade habitats and caneven initiate significant erosion (Liebscher, 1993).
Magnuson et al. (2000) revealed significant trendstowards earlier break up and later formation of lakeice, providing further evidence for systematic globalwarming over the past 150 yr (1846–1995). The annual
duration of ice cover in many sites of the NorthernHemisphere has decreased over the past century. Theaverage rate of change over the 150 yr period wasnearly 9 d later for freeze-up dates and almost 10 dearlier for break-up dates, according to Magnuson etal. (2000). The importance of long-range freeze- andbreak-up observation records is that they are visual,making them difficult to refute in any general way. Inthe 19th century, the selection of ice cover observationsites was not always representative of station distribu-tion. Moreover, the skill of observers is unknown, andthe Smalininkai station used in the present study is notan exception in this regard.
The main goal of this study was to reveal the large-scale circulation impact on the river ice regime, and todistinguish the most typical weather regimes responsi-ble for river freeze- and break-up processes usingobjective classification methods.
Data and methods are presented in Section 2. Thestudy area (see also Fig. 1) and river hydrologicalregime are described in Section 3. Trends of long-termice phenomena and the influence of large-scale circu-lation on the ice regime of the river are examined inSection 4. Typical weather regimes forcing or domi-nating during river freeze up are examined in Sec-tion 5, and conclusions are presented in Section 6.
2. DATA AND METHODS
Nemunas River ice phenomena (lower reaches) andwater level and/or discharge data were taken fromthe Smalininkai gauge station archive for the period1812–2000. Ice phenomena and water-level obser-vations were both always taken from the same site;ice-phenomenon observations were made visually.The definition of freeze- and break-up processesremained unchanged over the complete period. Thefreeze up was registered when the entire river sur-face observable from the Smalininkai station wascovered by motionless ice. The break-up event wasrecorded when at least the majority of the river (usu-ally two thirds of the observable river surface) startedto move.
River ice observations were made as part of a water-level observation programme based at Smalininkai.Since 1811, water-level observations have been per-formed twice daily; one in the early morning and onein the afternoon or evening. River ice observationswere limited to ice break-up (ice drift) date and icecover persistence until 1945. After this date, observa-tions of the ice thickness, break-up type and the stateof ice cover were also recorded. Station equipment andthe location of gauges varied up until 1827. Water leveldata were considered precise after 1827. River ice
18
Stonevicius et al.: Ice dynamics in the Nemunas River
observations were consistent over the entire period,because they were always made over the same sectionof river. River discharge was first measured at Sma-lininkai in 1875. However, regular and consistentdischarge measurements only date from 1896.
The air temperature at 2 m level was taken from theKaunas meteorological station, using an uninterruptedtime series from 1900 onwards. Gridded daily atmos-pheric data—geopotential height at 700 mb level —were taken from NCEP/NCAR reanalysis, going backto 1948. In addition, the following atmosphere circula-tion indices were used: (1) the monthly NAO index,starting from 1826 (Jones et al 1997) and taken fromthe Climatic Research Unit of the University of EastAnglia website (available at: www.cru.uea.ac.uk/cru/data/nao.htm; (2) the daily NAO index, starting from1950 (Barnston & Livezey 1987) taken from the USANational Weather Service (NWS) Climate PredictionCenter archive; (3) the monthly Arctic Oscillation (AO)index starting from 1950 (Thompson & Wallace 2000;available at: www.cpc.ncep.noaa.gov/products/precip/CWlink/daily_ao_index/ao.shtml); and P. Hess & H.Brezowsky (H/B) large-scale daily weather patterndata since 1882 (‘Grosswetterlagen’; available at:http://www.wetterzentrale.de/cgi-bin/wetterchronik/
home.pl?read=743&jump1=region&jump2=1) (Gersten-garbe et al 1999).
The leading atmospheric circulation patterns pre-ceding river ice formation (last 3 d before freezeup) were extracted using both principal componentanalysis (PCA) (Lins 1997, Jolliffe 2002) and clusteranalysis (CA) (Hartigan 1975, Davis & Walker 1992)and compared with the daily H/B classification pat-terns which were aggregated to larger groups accord-ing to the geopotential height field similarity for theBaltic region.
At the first stage in CA analysis, the hierarchicalclustering (complete linkage; Euclidean distance) wasapplied to 700 mb height-anomaly daily data that re-vealed 3 large clusters. After applying a K-mean tech-nique, 3 cluster centres were determined.
Using a PCA technique, the first 4 principal compo-nents (PCs) were extracted from the daily geopotentialheight anomaly data. Rotated PCA only fractionallyimproved the explained variance. Therefore, unrotatedPCs were used in further analysis.
For this study, 5 new large-scale circulation group-patterns were formed from the catalogue of large-scaleweather patterns prepared by H/B (Tables 1 & 2).Group 1 includes the HFZ, HFA, HNFZ and HNFA pat-
19
Table 1. Hess/Brezowsky circulation-pattern (‘Großwetterlagen’) terms and their abbreviations and definitions in English
Original term Abbreviation English description
Hoch Fennoskandien zyklonal HFZ Upper high over Scandinavia; central Europe under cyclonic circulation
Hoch Fennoskandien antizyklonal HFA Upper high over Scandinavia; central Europe under anticyclonic circulation
Hoch Nordmeer–Fennoskandien zyklonal HNFZ Upper high over Fennoscandia and the North Sea; central Europe under cyclonic circulation
Hoch Nordmeer–Fennoskandien antizyklonal HNFA Upper high over Fennoscandia and the North Sea; central Europe under anticyclonic circulation
Winkelförmige Westlage WW Westerly flow makes a cyclonic hook over central Europe
Südliche Westlage WS Westerly flow occupies southernmost position over Europe
Südostlage zyklonal SEZ Upper ridge from the extended southeast;central Europe under cyclonic circulation
Südostlage antizyklonal SEA Upper ridge from the extended southeast;central Europe under anticyclonic circulation
Südlage zyklonal SZ Upper southerly flow over central Europe with surface cyclonic circulation
Südlage antizyklonal SA Upper southerly flow over central Europe with surface anticyclonic circulation
Hoch Mitteleuropa HM Anticyclonic circulation over central EuropeHochdruckbrücke (Rücken) Mitteleuropa BM Upper cut-off low over southeastern Europe,
surface high pressure system over central EuropeHoch Nordmeer–Island, antizyklonal HNA Upper high over North Sea and Iceland, central
Europe under anticyclonic circulationNordwestlage zyklonal NWZ Upper northwesterly flow over central Europe
with surface cyclonic circulationNordwestlage antizyklonal NWA Upper northwesterly flow over central Europe
with surface anticyclonic circulationNordlage zyklonal NZ Upper northerly flow with cyclonic curvature
over central Europe

Clim Res 36: 17–28, 2008
terns that initiate an upper easterly flow over the south-ern Baltic. Group 2 patterns (WW and WS) exhibit anupper trough over the southern Baltic with the contoursof cyclonic curvature. Group 3 patterns (SEZ, SEA, SZand SA) exhibit a warm-core anticyclone southwardfrom the Baltic Sea and near-surface anticyclonic circu-lation. Only 2 patterns belong to Group 4 (HM, BM),which exhibits an upper trough over the Baltic and sta-ble anticyclonic conditions near the surface. Group 5integrates 4 patterns (HNA, NWZ, NWA and NZ) re-sponsible for northerly or northwesterly flow over thesoutheastern Baltic (Table 2).
Group 1 was termed FscanAn because of the promi-nent upper high pressure field over Scandinavia, theNorwegian Sea and/or Northern Russia. Group 2 wastermed SouthZonal because it shows a southward shiftof the zonal westerly flow. Group 3 was termed EastAnbecause of the upper and lower anticyclonic circulationextending to Russia. Group 4 was termed AnCentralbecause of the presence of a surface anticyclone undera large-scale trough over central Europe. Group 5 wastermed Nwest because of the north-northwesterly flowover the Baltic region (Table 2). Other patterns notincluded in Tables 1 & 2 were not very common for theanalysed freeze-up events. The PCA technique wasalso applied to cold season hydrographs (1950 to thepresent) constructed from 10 d water-level averages.This allowed the main prevailing seasonal (November–April) hydrograph types to be extracted.
3. BASIN HYDROLOGICAL REGIME
The Nemunas is the longest Lithuanian river (937 km),and has a total catchment area of ~98 000 km2. Nearly47.5% of the catchment lies within Lithuanian terri-tory. The last 100 km length of the river serves as theinternational border between the EU and Russia, whilethe upper reaches of the river are in Belarus (Fig. 1).
Flow direction is predominantly westward in thelower reaches of the Nemunas River. The river slope inthis section is only 10.5 cm km–1. There are manyislands and bars which significantly impede naviga-tion. Intensive sedimentation takes place a short dis-
tance (~12 to 15 km) downstream from Smalininkaiand this section of the river has been dredged continu-ously since the 19th century.
As with the majority of rivers in Lithuania (except fora small number in the west of the country) the springflood accounts for >40% of the annual runoff. Themean spring flood start-date is in the middle of March.Nemunas River is ice-covered during much of the win-ter season. River ice processes can be classified aseither freeze up or break up. The characteristics ofthese processes depend upon weather and flow condi-tions as well as the operating regime of hydrotechnicalfacilities upstream. The Nemunas River has many trib-utaries of different lengths fed by a variety of hydro-logical sources.
The Smalininkai gauge station is located in the lowerreaches of the river, about 108 km upstream from themouth. The ice regime in this river sector has remainedunaffected by dredging works and continuous naviga-tion use over the entire period. Dredging in the lowerreaches of the river was normally carried out duringthe warm half of the year, after the high water period.Kaunas HPP was built in 1960 ~116 km upstream fromSmalininkai gauge station. Earlier studies have shownthat the influence of Kaunas HPP on the river hydro-logical regime is detectable as far as 100 km down-stream from the HPP and 50 km downstream for icecover phenomena (Jablonskis et al. 1993, Vaitieku-niene & Vinceviciene 2001, Zdankus & Sabas 2006).The mean annual water storage in the Kaunas reser-voir is 4.6 × 10⁸ m3 (Kilkus 1998).
Air temperature and hydrological regime are the 2most important factors affecting water heat loss and iceformation during the freeze-up period. These are theprimary processes by which the river water tempera-ture drops at the beginning of the cold season. Spring
20
Table 2. Hess/Brezowsky aggregated circulation patterns(Grosswetterlagen) used in this study. See Table 1 for Hess/
Brezowsky abbreviations
No. Pattern groups Hess/Brezowsky abbreviations
1 FScanAn HFZ HFA HNFZ HNFA2 SouthZonal WW WS3 EastAn SEZ SEA SA SZ4 AnCentral HM BM5 NWest HNA NWA NWZ NZ
Fig. 1. Nemunas River catchment and locations of the Smalininkai and Kaunas stations
Stonevicius et al.: Ice dynamics in the Nemunas River
snowmelt and rainfall (with subsequent runoff) are themajor factors affecting the ice break-up process in theNemunas River. High rates of snowmelt and (liquid)precipitation, and consequently a rapid increase inriver streamflow, causes the early break up. During the1950–2000 period, 91.7% of all break-up events in theNemunas River lower reaches were forced by a steepwater-level rise (Stonevicius 2004).
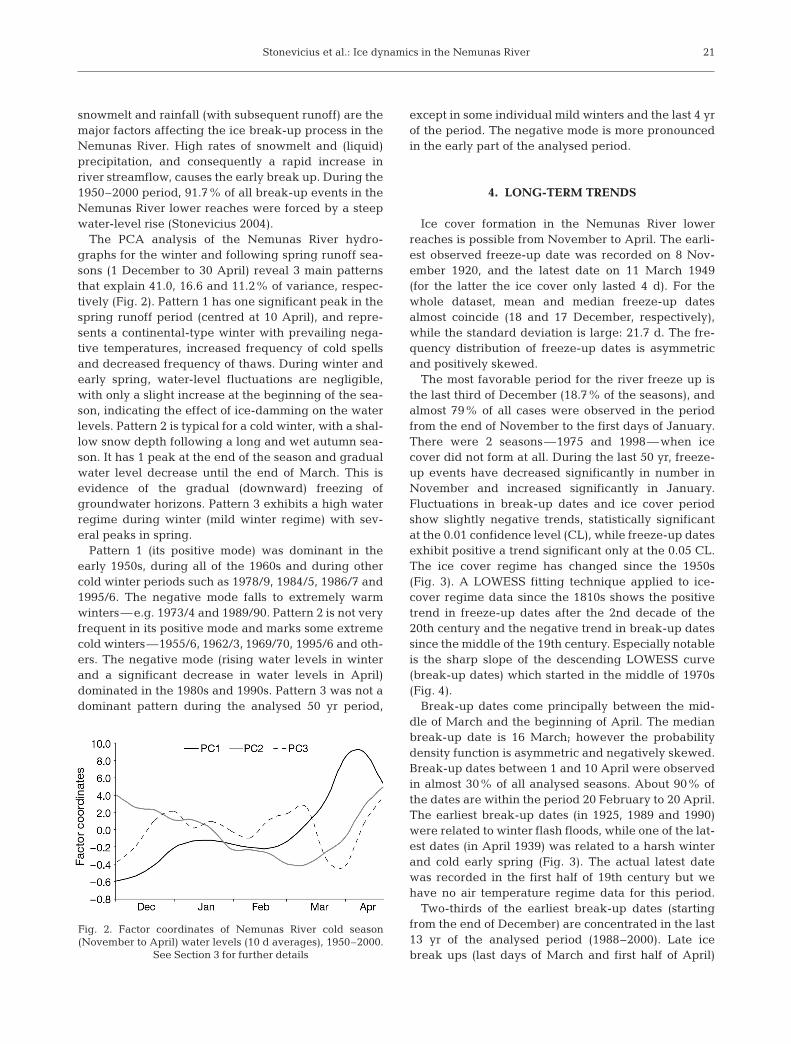
The PCA analysis of the Nemunas River hydro-graphs for the winter and following spring runoff sea-sons (1 December to 30 April) reveal 3 main patternsthat explain 41.0, 16.6 and 11.2% of variance, respec-tively (Fig. 2). Pattern 1 has one significant peak in thespring runoff period (centred at 10 April), and repre-sents a continental-type winter with prevailing nega-tive temperatures, increased frequency of cold spellsand decreased frequency of thaws. During winter andearly spring, water-level fluctuations are negligible,with only a slight increase at the beginning of the sea-son, indicating the effect of ice-damming on the waterlevels. Pattern 2 is typical for a cold winter, with a shal-low snow depth following a long and wet autumn sea-son. It has 1 peak at the end of the season and gradualwater level decrease until the end of March. This isevidence of the gradual (downward) freezing ofgroundwater horizons. Pattern 3 exhibits a high waterregime during winter (mild winter regime) with sev-eral peaks in spring.
Pattern 1 (its positive mode) was dominant in theearly 1950s, during all of the 1960s and during othercold winter periods such as 1978/9, 1984/5, 1986/7 and1995/6. The negative mode falls to extremely warmwinters—e.g. 1973/4 and 1989/90. Pattern 2 is not veryfrequent in its positive mode and marks some extremecold winters—1955/6, 1962/3, 1969/70, 1995/6 and oth-ers. The negative mode (rising water levels in winterand a significant decrease in water levels in April)dominated in the 1980s and 1990s. Pattern 3 was not adominant pattern during the analysed 50 yr period,
except in some individual mild winters and the last 4 yrof the period. The negative mode is more pronouncedin the early part of the analysed period.
4. LONG-TERM TRENDS
Ice cover formation in the Nemunas River lowerreaches is possible from November to April. The earli-est observed freeze-up date was recorded on 8 Nov-ember 1920, and the latest date on 11 March 1949(for the latter the ice cover only lasted 4 d). For thewhole dataset, mean and median freeze-up datesalmost coincide (18 and 17 December, respectively),while the standard deviation is large: 21.7 d. The fre-quency distribution of freeze-up dates is asymmetricand positively skewed.
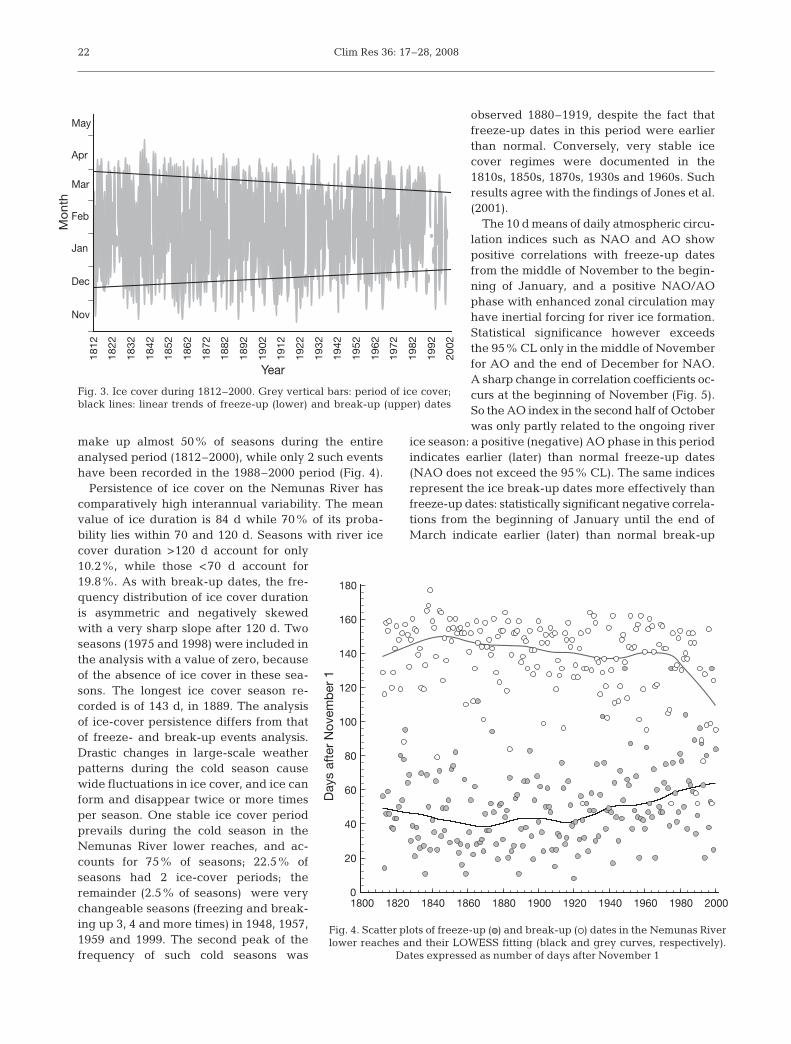
The most favorable period for the river freeze up isthe last third of December (18.7% of the seasons), andalmost 79% of all cases were observed in the periodfrom the end of November to the first days of January.There were 2 seasons—1975 and 1998—when icecover did not form at all. During the last 50 yr, freeze-up events have decreased significantly in number inNovember and increased significantly in January.Fluctuations in break-up dates and ice cover periodshow slightly negative trends, statistically significantat the 0.01 confidence level (CL), while freeze-up datesexhibit positive a trend significant only at the 0.05 CL.The ice cover regime has changed since the 1950s(Fig. 3). A LOWESS fitting technique applied to ice-cover regime data since the 1810s shows the positivetrend in freeze-up dates after the 2nd decade of the20th century and the negative trend in break-up datessince the middle of the 19th century. Especially notableis the sharp slope of the descending LOWESS curve(break-up dates) which started in the middle of 1970s(Fig. 4).
Break-up dates come principally between the mid-dle of March and the beginning of April. The medianbreak-up date is 16 March; however the probabilitydensity function is asymmetric and negatively skewed.Break-up dates between 1 and 10 April were observedin almost 30% of all analysed seasons. About 90% ofthe dates are within the period 20 February to 20 April.The earliest break-up dates (in 1925, 1989 and 1990)were related to winter flash floods, while one of the lat-est dates (in April 1939) was related to a harsh winterand cold early spring (Fig. 3). The actual latest datewas recorded in the first half of 19th century but wehave no air temperature regime data for this period.
Two-thirds of the earliest break-up dates (startingfrom the end of December) are concentrated in the last13 yr of the analysed period (1988–2000). Late icebreak ups (last days of March and first half of April)
21
Fig. 2. Factor coordinates of Nemunas River cold season(November to April) water levels (10 d averages), 1950–2000.
See Section 3 for further details
Clim Res 36: 17–28, 2008
make up almost 50% of seasons during the entireanalysed period (1812–2000), while only 2 such eventshave been recorded in the 1988–2000 period (Fig. 4).
Persistence of ice cover on the Nemunas River hascomparatively high interannual variability. The meanvalue of ice duration is 84 d while 70% of its proba-bility lies within 70 and 120 d. Seasons with river icecover duration >120 d account for only10.2%, while those <70 d account for19.8%. As with break-up dates, the fre-quency distribution of ice cover durationis asymmetric and negatively skewedwith a very sharp slope after 120 d. Twoseasons (1975 and 1998) were included inthe analysis with a value of zero, becauseof the absence of ice cover in these sea-sons. The longest ice cover season re-corded is of 143 d, in 1889. The analysisof ice-cover persistence differs from thatof freeze- and break-up events analysis.Drastic changes in large-scale weatherpatterns during the cold season causewide fluctuations in ice cover, and ice canform and disappear twice or more timesper season. One stable ice cover periodprevails during the cold season in theNemunas River lower reaches, and ac-counts for 75% of seasons; 22.5% ofseasons had 2 ice-cover periods; theremainder (2.5% of seasons) were verychangeable seasons (freezing and break-ing up 3, 4 and more times) in 1948, 1957,1959 and 1999. The second peak of thefrequency of such cold seasons was
observed 1880–1919, despite the fact thatfreeze-up dates in this period were earlierthan normal. Conversely, very stable icecover regimes were documented in the1810s, 1850s, 1870s, 1930s and 1960s. Suchresults agree with the findings of Jones et al.(2001).
The 10 d means of daily atmospheric circu-lation indices such as NAO and AO showpositive correlations with freeze-up datesfrom the middle of November to the begin-ning of January, and a positive NAO/AOphase with enhanced zonal circulation mayhave inertial forcing for river ice formation.Statistical significance however exceedsthe 95% CL only in the middle of Novemberfor AO and the end of December for NAO.A sharp change in correlation coefficients oc-curs at the beginning of November (Fig. 5).So the AO index in the second half of Octoberwas only partly related to the ongoing river
ice season: a positive (negative) AO phase in this periodindicates earlier (later) than normal freeze-up dates(NAO does not exceed the 95% CL). The same indicesrepresent the ice break-up dates more effectively thanfreeze-up dates: statistically significant negative correla-tions from the beginning of January until the end ofMarch indicate earlier (later) than normal break-up
22
1812
1822
1832
1842
1852
1862
1872
1882
1892
1902
1912
1922
1932
1942
1952
1962
1972
1982
1992
2002
May
Apr
Mar
Feb
Jan
Dec
Nov
Year
Mo
nth
Fig. 3. Ice cover during 1812–2000. Grey vertical bars: period of ice cover;black lines: linear trends of freeze-up (lower) and break-up (upper) dates
1800 1820 1840 1860 1880 1900 1920 1940 1960 1980 20000
20
40
60
80
100
120
140
160
180
Day
s af
ter
Nov
emb
er 1
Fig. 4. Scatter plots of freeze-up (ds) and break-up (s) dates in the Nemunas Riverlower reaches and their LOWESS fitting (black and grey curves, respectively).
Dates expressed as number of days after November 1

Stonevicius et al.: Ice dynamics in the Nemunas River
dates under positive (negative) AO/NAO phase (Fig. 5).Most probably, this coherence implies that most coldseasons are not dominated by one particular regime, andgreater persistence of any of the NAO/AO phases existsin the second half of the winter rather than in the firsthalf. Moreover, that persistence has a predictive poten-tial for the river ice break up and the spring runoff earlywarning in the delta region.
On a monthly timescale, January to FebruaryAO/NAO and NAO Jones et al. (1991) indices are pos-itively correlated with surface temperature in theBaltic region with lags of 0 to 3 mo (not shown), whilein the first half of the cold season only the AO indexhas negative statistically significant correlations with3 mo lagged January surface temperature (Fig. 6). Thatyields up the existing AO (and probably NAO) tempo-ral evolution—e.g. a quasi-persistent transition phasebetween positive and negative indices during lateautumn and early winter. Although the NAO is thedominant pattern of the regional atmospheric circula-tion variability, it explains only a fraction of the totalvariance, and a dominating NAO or AO phase cannotsolely characterise most analysed seasons.
5. TYPICAL WEATHER REGIMES DURING RIVERFREEZE-UP PERIODS
The dependence of the river ice freeze-up process onatmospheric forcing over the East European Plain hasbeen thoroughly documented by Shuliakovsky (1960).
23
–0.40
–0.30
–0.20
–0.10
0
0.10
0.20
0.30
0.40
0
5
10
15
20
25
30
Eve
nts
(%)
Freeze upNAO
AO95 % CI
Oct Nov Dec Jan
–0.70
–0.60
–0.50
–0.40
–0.30
–0.20
–0.10
0
0.10
0.20
Co
rrel
atio
n c
oef
ficie
nt
Co
rrel
atio
n c
oef
ficie
nt
0
5
10
15
20
25
30
Eve
nts
(%)
Break upNAO
AO95 % CI
Nov Dec Jan Feb Mar Apr
a
b
Fig. 5. Frequency (bars) of (a) freeze-up and (b) break-upevents (%). Correlations (curves) between Arctic Oscillation(AO) and North Atlantic Oscillation (NAO) indices and river(a) freeze-up and (b) break-up dates, respectively. Dashed
lines: (a) upper and lower, and (b) lower 95% CL
Fig. 6. Correlation between surface temperature in January and Arctic Oscillation (AO) index in the preceding October. Temperature data are obtained from NCEP/NCAR Reanalysis. Dark grey: 95% significance level correlation
Clim Res 36: 17–28, 2008
The technique proposed by Shuliakovsky (1960) in-cluded calculations of water temperatures during peri-ods of permanent air temperature decreases whichused additional data such as heat and groundwaterfluxes. The normal practice is to calculate freezingdegree-days up to ice cover formation. For example,the freezing degree-days according to the Kaunasmeteorological station records correlate with freeze-updates at the Smalininkai gauge station (r = 0.54). Themain shortcoming of this approach is that the later thefreeze up, the larger the freezing degree-days. So, inthe present study, freezing degree-days were calcu-lated for a fixed period, e. g. 30 d.
We applied 3 different classification methods appliedto the atmospheric circulation patterns influencingintensive cooling/freeze-up processes. All freeze-upevents recorded later than 1 January were excludedfrom the analysis because the water temperature isclose to 0 °C in midwinter, and thus little further cool-ing is required for river freeze up. In addition, earlierstudies (Stonevicius 2004) revealed that the break-upprocess in the Nemunas River has no bearing onweather patterns that are likely to force it, and classifi-cation methods used in the present study did not applyto atmospheric circulation patterns prevailing duringthe river break-up period.
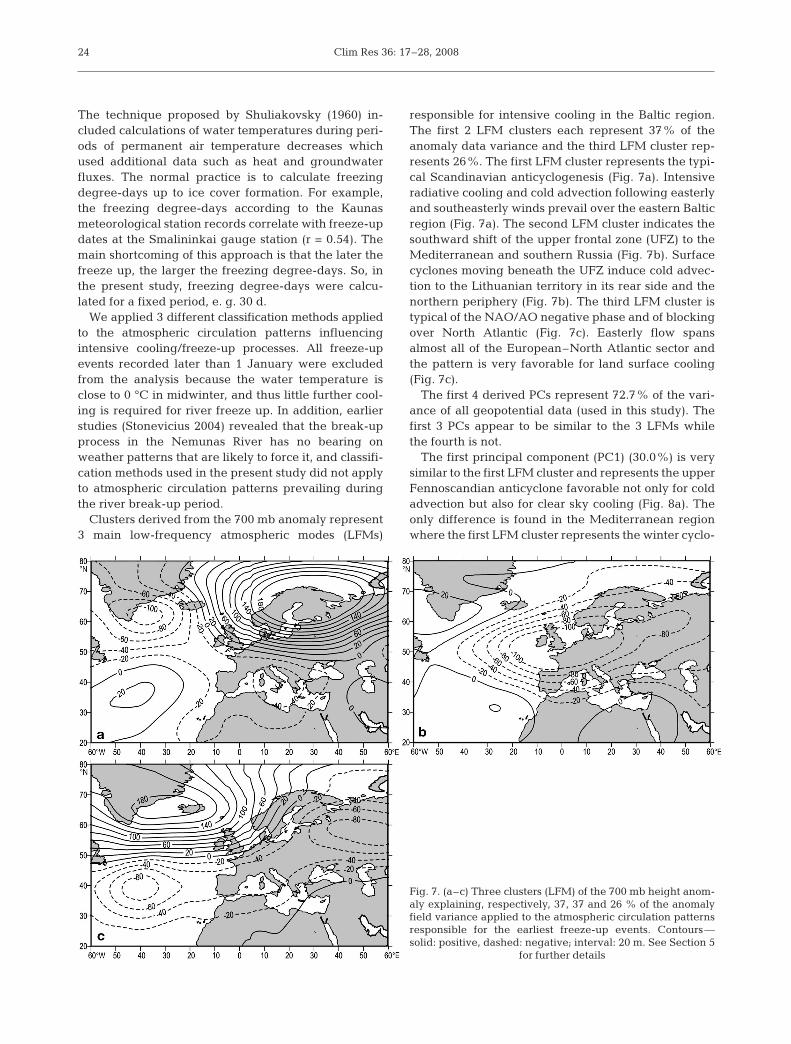
Clusters derived from the 700 mb anomaly represent3 main low-frequency atmospheric modes (LFMs)
responsible for intensive cooling in the Baltic region.The first 2 LFM clusters each represent 37% of theanomaly data variance and the third LFM cluster rep-resents 26%. The first LFM cluster represents the typi-cal Scandinavian anticyclogenesis (Fig. 7a). Intensiveradiative cooling and cold advection following easterlyand southeasterly winds prevail over the eastern Balticregion (Fig. 7a). The second LFM cluster indicates thesouthward shift of the upper frontal zone (UFZ) to theMediterranean and southern Russia (Fig. 7b). Surfacecyclones moving beneath the UFZ induce cold advec-tion to the Lithuanian territory in its rear side and thenorthern periphery (Fig. 7b). The third LFM cluster istypical of the NAO/AO negative phase and of blockingover North Atlantic (Fig. 7c). Easterly flow spansalmost all of the European–North Atlantic sector andthe pattern is very favorable for land surface cooling(Fig. 7c).
The first 4 derived PCs represent 72.7% of the vari-ance of all geopotential data (used in this study). Thefirst 3 PCs appear to be similar to the 3 LFMs whilethe fourth is not.
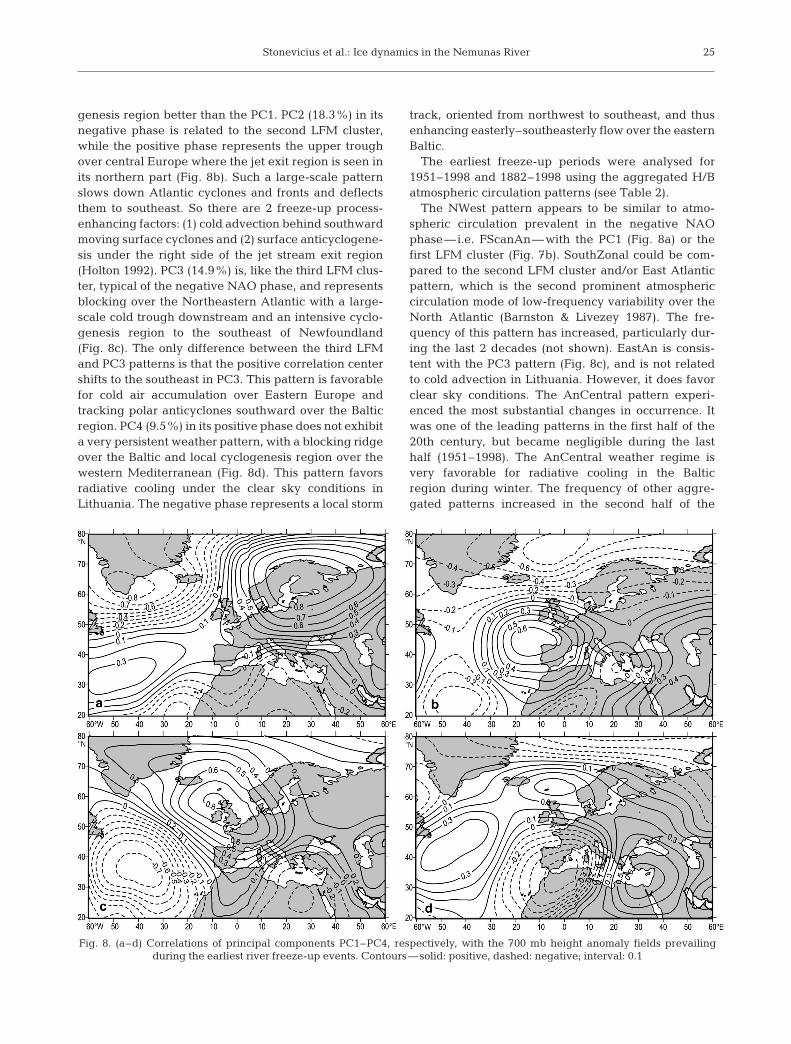
The first principal component (PC1) (30.0%) is verysimilar to the first LFM cluster and represents the upperFennoscandian anticyclone favorable not only for coldadvection but also for clear sky cooling (Fig. 8a). Theonly difference is found in the Mediterranean regionwhere the first LFM cluster represents the winter cyclo-
24
Fig. 7. (a–c) Three clusters (LFM) of the 700 mb height anom-aly explaining, respectively, 37, 37 and 26 % of the anomalyfield variance applied to the atmospheric circulation patternsresponsible for the earliest freeze-up events. Contours—solid: positive, dashed: negative; interval: 20 m. See Section 5
for further details
Stonevicius et al.: Ice dynamics in the Nemunas River
genesis region better than the PC1. PC2 (18.3%) in itsnegative phase is related to the second LFM cluster,while the positive phase represents the upper troughover central Europe where the jet exit region is seen inits northern part (Fig. 8b). Such a large-scale patternslows down Atlantic cyclones and fronts and deflectsthem to southeast. So there are 2 freeze-up process-enhancing factors: (1) cold advection behind southwardmoving surface cyclones and (2) surface anticyclogene-sis under the right side of the jet stream exit region(Holton 1992). PC3 (14.9%) is, like the third LFM clus-ter, typical of the negative NAO phase, and representsblocking over the Northeastern Atlantic with a large-scale cold trough downstream and an intensive cyclo-genesis region to the southeast of Newfoundland(Fig. 8c). The only difference between the third LFMand PC3 patterns is that the positive correlation centershifts to the southeast in PC3. This pattern is favorablefor cold air accumulation over Eastern Europe andtracking polar anticyclones southward over the Balticregion. PC4 (9.5%) in its positive phase does not exhibita very persistent weather pattern, with a blocking ridgeover the Baltic and local cyclogenesis region over thewestern Mediterranean (Fig. 8d). This pattern favorsradiative cooling under the clear sky conditions inLithuania. The negative phase represents a local storm
track, oriented from northwest to southeast, and thusenhancing easterly–southeasterly flow over the easternBaltic.
The earliest freeze-up periods were analysed for1951–1998 and 1882–1998 using the aggregated H/Batmospheric circulation patterns (see Table 2).
The NWest pattern appears to be similar to atmo-spheric circulation prevalent in the negative NAOphase—i.e. FScanAn—with the PC1 (Fig. 8a) or thefirst LFM cluster (Fig. 7b). SouthZonal could be com-pared to the second LFM cluster and/or East Atlanticpattern, which is the second prominent atmosphericcirculation mode of low-frequency variability over theNorth Atlantic (Barnston & Livezey 1987). The fre-quency of this pattern has increased, particularly dur-ing the last 2 decades (not shown). EastAn is consis-tent with the PC3 pattern (Fig. 8c), and is not relatedto cold advection in Lithuania. However, it does favorclear sky conditions. The AnCentral pattern experi-enced the most substantial changes in occurrence. Itwas one of the leading patterns in the first half of the20th century, but became negligible during the lasthalf (1951–1998). The AnCentral weather regime isvery favorable for radiative cooling in the Balticregion during winter. The frequency of other aggre-gated patterns increased in the second half of the
25
Fig. 8. (a–d) Correlations of principal components PC1–PC4, respectively, with the 700 mb height anomaly fields prevailingduring the earliest river freeze-up events. Contours—solid: positive, dashed: negative; interval: 0.1

Clim Res 36: 17–28, 2008
20th century (Fig. 9). The NWest pattern accountedfor one-fifth of the variance of daily H/B patterns anddid not show any substantial changes in its frequencyduring the whole analysed period. However, theintensive radiative cooling and/or cold advection inLithuania are not typical features of this pattern. Thefrequency of the rest of the analysed patterns,FScanAn, EastAn and SouthZonal, has increased dur-ing the later half of the 20th century.
6. DISCUSSION AND CONCLUSIONS
Despite artificial regulation of the intensively-usedNemunas River channels during the 20th century, theriver ice regime seems to follow regional climatechange. Tendencies for the river ice cover period todecrease over the second half of the last century matchother climate change indicators, such as duration ofsnow cover or sea-ice extent at regional and hemi-spheric scales (IPCC 2001).
The dynamics in the Nemunas River freeze- andbreak-up dates yields statistically significant trendssince the first half of 19th century, while smoothed data(LOWESS) show an increasing slope of trends forfreeze-up dates since the 1910s (positive) and a down-ward trend since the 1980s. However, there are sub-stantial interannual and intraseasonal changes in icecover duration. The NAO is a well-known large-scaleatmospheric phenomenon, and its impact on Europeanwinter thermal anomalies is widely documented in sci-entific literature (Hurrell et al. 2003, Kistler et al. 2001).However, the present study shows a weak correla-tion between river freeze-up dates and monthly andweekly NAO/AO indices, while break-up dates aremore closely associated with these atmospheric circu-lation modes. Only early freeze-ups (dates depending
on the lower tercile of probability density function) arepredetermined by the weakened and even negativeNAO-like circulation patterns.
Different classification methods applied to atmos-pheric data representing the earliest freeze-up eventsbenefit from using several large-scale atmospheric cir-culation types (patterns) favorable for cold outbreaksor intensive radiative cooling in the Baltic region.Scandinavian anticyclogenesis always precedes conti-nental polar and/or arctic air-mass advection withprevalent easterly northeasterly winds, and is relatedto clear sky conditions during winter. The negativeNAO phase does not obviously guarantee sudden riverice formation because the prevalent meridional flowpattern differs in sign over the western and easternparts of Europe. However the long duration of suchphases ultimately reduces Atlantic air-mass penetrationfurther to the east. Persistent anticyclones over centralRussia induce a south-southeasterly flow over centralEurope and bring fair-weather conditions over theeastern Baltic region. In the late autumn, when theRussian steppes are not yet snow-covered, the conti-nental air does not have a significant cooling effect, butin December such an air mass only differs marginallyfrom the continental polar mass located further east ornortheast. Finally, all other weather patterns moreor less represent higher than normal surface pressurefields under an upper large-scale trough. On the otherhand, the late freeze-up process does not depend onparticular weather regimes because of the prevalent(close to zero) low water temperatures.
Clustering algorithms are able to identify patternswhich correspond to peaks in the probability densityfunction of the set of analysed weather regimes, whilethe PCs, each constrained to be spatially and tempo-rally orthogonal to each other, are then scaled accord-ing to the amount of total data variance they explain(Cassou et al. 2004). The preferred atmospheric circu-lation states—using PCA—come in pairs, in whichanomalies of opposite polarity have the same spatialstructure. Moreover, the subjective classification, suchas the H/B aggregated weather patterns is substantialonly for the particular region of its origin, e.g. centralEurope. Extracted main weather regimes prevailingduring early freeze-ups seem to be similar despite dif-ferences in the applied technique. This is particularlytrue for the patterns explaining the largest part of datavariance. Conversely, weather regimes representingless than a quarter of the data variance do not seem tobe persistent large-scale patterns.
The second half of the winter period tends to be uni-form in atmosphere circulation, and thus monthly cir-culation indices show better cohesion with ice coverbreak-up dates than with freeze-up dates. As a rule,the harsher the winter, the more substantial the break-
26
6.5
17.415.2
17.419.6
23.9
15.8 15.8
12.314.9
20.2 21.1
0
5
10
15
20
25
30
AnCentral
FScanAn
SouthZonal
EastAnNWest
Other
Eve
nts
(%)
1951–19981882–1998
Fig. 9. Frequency of early freeze-up episodes that occured foreach Hess/Brezowsky aggregated large-scale circulation typefor the periods 1951–1998 and 1882–1998. See Tables 1 & 2
for circulation types and abbreviations
Stonevicius et al.: Ice dynamics in the Nemunas River
up event. Later break ups (after such winters) are asso-ciated with radiative forcing which is able to exceedthe atmospheric circulation contribution. Therefore,the retrieval of pure weather patterns responsible forthe break up seems to be a complex task. There areenough large river basins that have many sub-basinswith different hydrological regimes and spring runofftimes. It is likely that the runoff propagating down-stream from the upper reaches has the largest impacton the ice cover break-up dates for the lower reachesof the Nemunas River.
The present study does not address how changes inthe river ice regime could influence spring runoff be-havior, which would require further research. How-ever, rare intrusions of the sudden, and exceptionallyharsh, cold air masses not only disturbs the riverregime, but are also a sign of the increasing number ofclimate extremes in the last decades.
LITERATURE CITED
Ashton GD (1986) River and lake ice engineering. WaterResources Publications, Littelton, CO
Barnston AG, Livezey RE (1987) Classification, seasonalityand persistence of low-frequency atmospheric circulationpatterns. Mon Weather Rev 115:1083–1126
Barry RG, Maslanik JA (1993) Monitoring lake freeze-up/break-up as a climatic index. In: Barry RG, GoodisonBE, Le Drew EF (eds) Snow Watch ‘92 glaciology datareport, GD-25. World Data Center for Glaciology, Univer-sity of Colorado, Boulder, CO, p 66–79
Beilinson MM (1989) Ice cover formation and break-up (in thestreams and reservoirs of Kazachstan). Nauka KazachskojSSR, Alma-Ata (in Russian)
Bukantis A, Kilkus K (2004) Hydroclimatic cycles in Lithuan-ian rivers and lakes. In: Kilkus K (ed) Proc 3rd Conf on‘Science in the Faculty of Natural Sciences of Vilnius Uni-versity’ April 22–24, 2004. Vilnius University Press, Vil-nius, p 31–42 (in Lithuanian)
Bulatov SN (1972) About the possibility of developing a uni-versal method for river break-up time calculations. TrudyGidromettsentra SSSR 112:28–36 (in Russian)
Buzin VA, Lazarevskaja VN (1980) Methods of the assess-ment of the change of river break-up dates. Trudy GGI270:20–32 (In Russian)
Cassou C, Terray L, Hurrell JW, Deser C (2004) North Atlanticwinter climate regimes: spatial asymmetry, stationaritywith time, and oceanic forcing. J Clim 17:1055–1068
Davis RE, Walker DR (1992) An upper-air synoptic climato-logy of the western United States. J Clim 5:1449–1467
Devik O (1931) Thermische und dynamische Bedingungender Eisbildung in Wasserläufen auf Norwegische Verhält-nisse angewandt. Geophys Norvegica 9:1–100
Donchenko RV (1987) Ice conditions of the rivers of USSR.Gidrometeoizdat, Leningrad (in Russian)
Gerstengarbe FW, Werner PC, Rüge U (1999) Katalog derGrosswetterlagen Europas nach Paul Hess und HelmuthBrezowsky 1881–1998. Deutscher Wetterdienst, Offen-bach a. Main
Gotlib JL, Donchenko RV, Pexovich AI, Sokolov IN (1983)Ice in reservoirs and bottom pools of the hydropowers.Gidrometeoizdat, Leningrad (in Russian)
Hartigan JA (1975) Clustering algorithms. John Wiley & Sons,New York
Holton JR (1992) An introduction to dynamic meteorology,3rd edn. Academic Press, London
Hurrell JW, Kushnir Y, Visbeck M, Ottersen G (2003) Anoverview of the North Atlantic Oscillation. In: HurrellJW, Kushnir Y, Ottersen G, Visbeck M (eds) The NorthAtlantic Oscillation: climate significance and environ-mental impact. Geophys Monogr 134:1–35
IPCC (Intergovernmental Panel on Climate Change) (2001)Climate change 2000: third assessment report. CambridgeUniversity Press, Cambridge
Jablonskis J, Jurgelevicienè J, Juskienè A (1993) Nemunasriver hydrography. Lithuanian Energy Institute Press, Vil-nius (in Lithuanian, summary in English)
Jasek MJ (1999) 1998 break-up and flood on the Yukon Riverat Dawson—Did El Niño and climate play a role? In: ShenHT (ed) Ice in surface waters. Balkema, Rotterdam,p 761–768
Jolliffe IT (2002) Principal component analysis, 2nd edn.Springer, New York
Jones PD, Jonsson T, Wheeler D (1997) Extension to the NorthAtlantic Oscillation using early instrumental pressureobservations from Gibraltar and South-West Iceland. Int JClimatol 17:1433–1450
Jones PD, Osborn TJ, Briffa KR (2001) The evolution of cli-mate over the last millennium. Science 292:662–667
Kilkus K (1989) Hydrology of the lakes in Lithuania. Mokslas,Vilnius (in Lithuanian)
Kilkus K (1992) Inland hydrology at Vilnius University.Geography in Lithuania, Vilnius University Press, Vilnius,(in Lithuanian)
Kilkus K (1998) Geography of the water bodies in Lithuania.Vilnius University Press, Vilnius (in Lithuanian)
Kilkus K, Valiuskevicius G (2001) Climate change reflectionin hydrological and hydrophysical indices of rivers andlakes. In: Climate changes influence the physical geo-graphical processes in Lithuania. Vilnius University Press,Vilnius, p 194–232 (in Lithuanian with summary in Eng-lish)
Kistler R, Kalnay E, Collins W, Saha S and others (2001) TheNCEP-NCAR 50-year reanalysis: monthly means CD-ROMand documentation. Bull Am Meteorol Soc 82:247–268
Krickij SN, Menkel MF, Rosinskij KI (1947) Winter thermalregime of the reservoirs, rivers and channels. Gidrometiz-dat, Moscow (in Russian)
Liebscher HJ (1993) Hydrology for the water management oflarge river basins. Hydrol Sci J 38(1):1–13
Lins HF (1997) Regional streamflow regimes and hydro-climatology of the United States. Water Resour Res 33:1655–1667
Magnuson JJ, Robertson DM, Benson BJ, Wynne RH and oth-ers (2000) Historical trends in lake and river ice cover inthe Northern Hemisphere. Science 289:1743–1746
Michailov VN, Dobrovolsky AD (1991) General hydrology.Russian Academy Press, Moscow (in Russian)
Prowse TD, Beltaos S (2002) Climatic control of river-icehydrology: a review. Hydrol Process 16:805–822
Rainys A (1975) Some aspects of the river ice regime in theNemunas delta region. Hydrometeorol Articles 7:5–10(in Lithuanian)
Shiklomanov IA (1989) Influence of human activity on riverrunoff. Gidrometizdat, Leningrad (in Russian).
Shuliakovsky LG (1960) Appearance of ice and the start offreezing period on rivers, lakes and reservoirs. Cal-culations for purposes of forecasting. Gidrometeoizdat,Moscow (in Russian)
27

Clim Res 36: 17–28, 2008
Smith LC (2000) Trends in Russian arctic river-ice formationand breakup 1917 to 1994. Phys Geogr 21:46–56
Stonevicius E (2004) Long-range ice cover regime fluctuationsand the main influencing factors in the Nemunas rivernear Smalininkai gauge station. MSc thesis, University ofVilnius
Thompson DWJ, Wallace JM, Hegerl GC (2000) Annularmodes in the extratropical circulation. II. Trends. J Clim13:1018–1036
Vaitiekuniene V, Vinceviciene J (2001) Forecasting of waterquality at the lower course of the Nemunas river betweenKaunas city and Smalininkai. Environ Res Eng Manag
2(16):48–55 (in Lithuanian with summary in English)Vazhnov AN (1976) Hydrology of rivers. Lomonosov Moscow
State University Press, Moscow (in Russian)WMO (World Meteorological Organization) (1997) Global
Climate Observing System: GCOS/GTOS plan for ter-restrial climate-related observations, v. 2.0. GCOS-32,WMO/TD-No796, UNEP/DEIA/TR97-7, WMO, Geneva
Zdankus N, Sabas G (2006) The impact of hydropower plantson downstream river reaches. Environ Res Eng Manag4(38):24–31
Zhang X, Harvey KD, Hogg WD, Yuzyk TR (2001) Trends inCanadian streamflow. Water Resour Res 37:987–998
28
Editorial responsibility: Eric DeWeaver,Madison, Wisconsin, USA
Submitted: September 11, 2006; Accepted: October 12, 2007Proofs received from author(s): March 4, 2008