Embed Size (px)
Citation preview
MARINE ECOLOGY PROGRESS SERIESMar Ecol Prog Ser
Vol. 349: 89–102, 2007doi: 10.3354/meps07104
Published November 8
INTRODUCTION
Ice disturbance is a key structural force acting onshallow water benthic communities at high latitudes(e.g. Dayton et al. 1970, Peck et al. 1999, Brown et al.2004, Conlan & Kvitek 2005, Smale et al. in press).However, until recently it has not been possible todirectly study the influence of disturbance intensity oncommunity structure, as quantifying ice disturbanceis both logistically and experimentally challenging.Instead, proxies for disturbance such as depth (Barneset al. 1996, Nonato et al. 2000), topographical protec-tion from iceberg scouring (Sahade et al. 1998, Conlan& Kvitek 2005) and proximity to glaciers (Pugh &Davenport 1997) have been used to investigate theeffect of ice disturbance on polar marine communities.
It has been suggested that where ice disturbance isfrequent and severe, benthic communities are held atearly successional stages (McCook & Chapman 1993,
Barnes 1995a, Pugh & Davenport 1997) dominated bymobile secondary consumers (Richardson & Hedge-peth 1977, Conlan et al. 1998, Conlan & Kvitek 2005)and have skewed population structures (Peck & Bul-lough 1993, Brown et al. 2004). Furthermore, the inten-sity of ice disturbance, in the forms of encasement bythe ice foot, ice scouring and anchor ice formation, isrelated (to varying degrees) to depth (Barnes 1995b,Lenihan & Oliver 1995, Waller et al. 2006, Smale etal. 2007). As a result, many nearshore communitieschange along a bathymetric gradient at high latitudes,although such transitions can be highly patchy (Daytonet al. 1970, Gambi et al. 1994, 2000, Nonato et al. 2000,Barnes & Brockington 2003).
To date, only 2 attempts have been made to linkempirical ice disturbance data with parameters ofnearshore polar benthic community structure; one con-cerned anchor ice uplift, and the second quantifiediceberg scouring. Lenihan & Oliver (1995) used exper-
© Inter-Research 2007 · www.int-res.com*Email: [email protected]
Ice disturbance intensity structures benthiccommunities in nearshore Antarctic waters
Dan A. Smale*
British Antarctic Survey, Natural Environment Research Council, High Cross, Madingley Road, Cambridge CB3 0ET, UK
ABSTRACT: Ice scouring is one of the 5 most significant natural forces acting on ecosystems, yet veryfew data exist linking the intensity of ice disturbance with parameters of benthic community struc-ture. The benthos at 2 nearshore sites on Adelaide Island, Antarctica, was sampled at 3 resolutions tomake novel links between biological data and empirical disturbance data from the literature. A totalof 125 taxa and >70 000 individuals were recorded. A total of 8 parameters of community structurewere measured; all of them were negatively correlated to disturbance intensity at one site, whilst 6significant relationships were found at the other site. At 2 of the 3 sampling resolutions, disturbance,rather than depth or the percentage cover of major substratum types, was the environmental variablemost correlated with the patterns in community structure. Furthermore, biological samples weredivided into 3 categories based on the disturbance data (low, moderate and high). Each group wasstatistically dissimilar and the relative abundance of sessile fauna decreased as disturbance intensityincreased. The intensity of disturbance was broadly correlated with depth, but small-scale differ-ences in topography and substratum type created small-scale refugia, which supported richer assem-blages. Overall, both study sites were disturbed frequently and no evidence of a peak in richness atthe moderately disturbed locations was recorded.
KEY WORDS: Ice scouring · Community structure · Antarctica · Polar benthos
Resale or republication not permitted without written consent of the publisher
Mar Ecol Prog Ser 349: 89–102, 2007
imental stakes to assess the relative force of anchor iceuplift along a depth gradient. The shallow subtidalzone (4 m depth) was intensely disturbed by anchor iceand, as a result, was dominated by motile opportunisticinfauna. Also, total densities of infauna and the num-ber of sedentary taxa were negatively related to theintensity of anchor ice disturbance (Lenihan & Oliver1995).
Brown et al. (2004) used concrete markers to quan-tify the frequency of iceberg impacts in 2 adjacentcoves at Adelaide Island, Antarctica. Their studyshowed, for the first time, that a single point on theseabed at 10 m depth may be impacted by icebergsmore than 3 times in a 2 yr period (Brown et al. 2004).One of their study sites was, on average, disturbedtwice as often as the other, and encrusting bryozoanassemblages were less diverse, covered less space andwere shorter-lived at the more frequently disturbedsite (Brown et al. 2004). Smale et al. (2007) developedthe methods used by Brown et al. (2004) and evaluatedthe intensity of ice disturbance at 24 positions, across 4depth increments at the same 2 sites over a 2 yr period.
Their study showed that the frequency and intensity ofice disturbance varied significantly with depth, seasonand site. In the current study, the benthos at each ofthe positions monitored by Smale et al. (2007) wascomprehensively sampled in order to make novel anddetailed links between environmental parameters andbenthic community structure. Two main hypotheseswere tested: (1) measures of assemblage composition(abundance, species richness, biomass and space cov-erage) all decrease with increasing intensity of ice dis-turbance, and (2) ice-mediated disturbance is the mostimportant of the environmental variables influencingcommunity structure in the Antarctic shallows.
MATERIALS AND METHODS
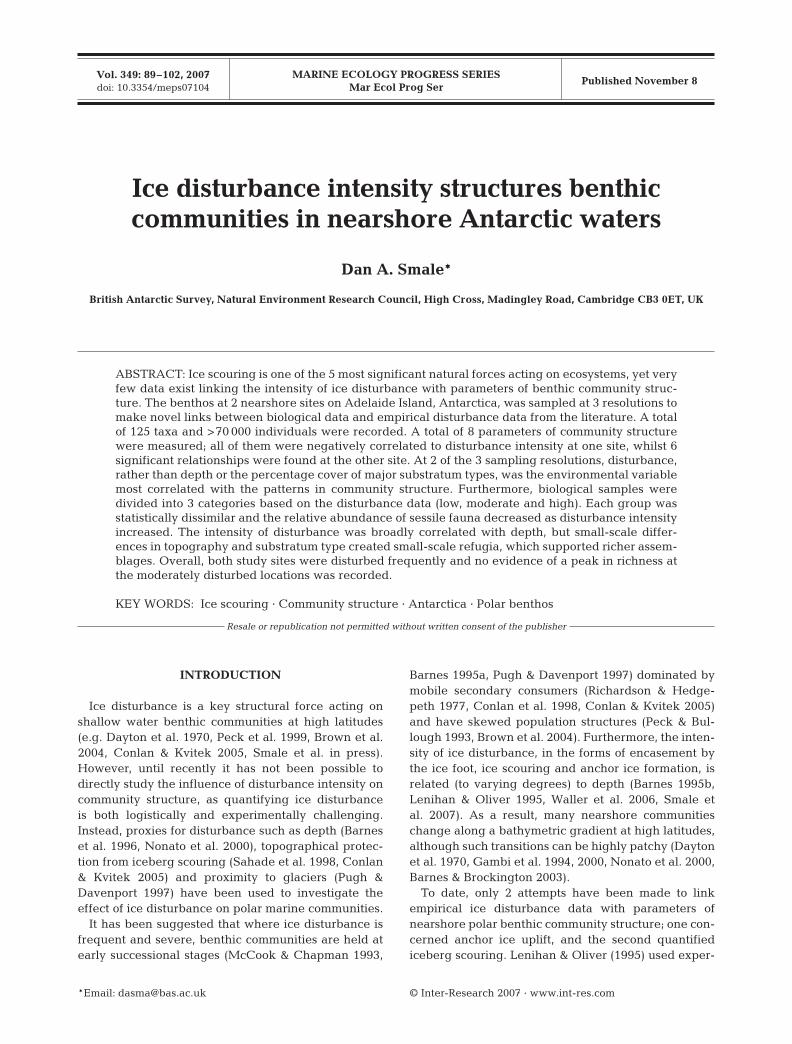
Study site. Sampling was conducted at Hangar Coveand South Cove, 2 sites adjacent to the British Antarc-tic Survey research station at Rothera Point, AdelaideIsland, West Antarctic Peninsula (67° 34.5’ S, 68° 07.0’ W)(Fig. 1). The substratum at South Cove is a mixture of
90
Fig.1. Location of the South Cove (A) and Hangar Cove (B) study sites on Adelaide Island, Antarctica (left). Inset (top) shows posi-tion of Adelaide Island on the Antarctic Peninsula. Small-scale aerial photograph (right) indicates positions of disturbance grids
at each depth increment, and the orientation of transects (labelled 1 to 3) at each site (adapted from Smale et al. 2007)
Smale: Disturbance and shallow Antarctic benthos
hard bedrock and compacted cobbleswith some isolated patches of silt. Thesite is known to support a high abun-dance and richness of megafauna,macrofauna and cryptic fauna (Barnes& Brockington 2003, Bowden 2005,Smale et al. in press). Conversely,Hangar Cove is primarily a soft sedi-ment habitat; a base of compacted cob-bles is covered by a layer of silt thatvaries in thickness from 0 to ~20 cm.Some patches of cobbles are exposedand the site supports an abundantinfauna (Smale et al. in press). Bothsites have a gently sloping topography,are covered by fast ice during winter(for 4 to 8 mo) and are disturbed byicebergs, brash (small pieces of glacialice) and sea ice floes during summer.Brockington and Clarke (2001) give afull description of seawater conditionsat this location.
Smale et al. (2007) recently assessedthe degree of ice scouring at these sitesby deploying a series of grids consist-ing of concrete and clay markers.Twelve disturbance grids (each gridconsisted of 25 markers) were deployedat each site, with triplicate grids laid at0 m (extreme low water), 5 m, 10 m and25 m depth (Fig. 1). If a marker was im-pacted by ice, either the clay section(low intensity impact) or the concrete section (high in-tensity impact) was damaged. Each marker was sur-veyed and replaced (if necessary) every 3 mo during a2 yr survey; over 1500 markers were damaged by iceduring the study. A measure of the intensity of ice dis-turbance (Id), which was based on both the number oftimes and with what force each marker was hit, wasrecorded for each grid location. For the current study,grids were grouped into 3 classes based on these data;disturbance group 1 included the least disturbed grids(Id = 0–100), group 2 included moderately disturbedgrids (Id = 101–200), and disturbance group 3 con-sisted of the most intensely disturbed grids (Id > 201)(Table 1). Smale et al. (2007) observed a significant re-lationship between depth and disturbance frequency,and suggested that South Cove was scoured 1.5 timesmore frequently than Hangar Cove during the 2 yrstudy period (see Table 1 and Smale et al. 2007 for de-tails). Each disturbance grid covered an area of seabedof 16 m2 and samples for the current study were col-lected randomly from within each disturbance grid.
Sampling design. Bowden (2005) showed that atthese sites (and probably generally), sampling resolu-
tion had a significant effect on the type and size offauna detected and analysed. The benthic communi-ties at each disturbance grid were sampled at 3 levelsof resolution. The methods described below were re-peated at each of the 24 disturbance grids. Accord-ingly, a total of 240 photoquadrats, 72 benthic samplesand 240 rocks were analysed. Macroalgae were notsampled as they were completely absent from thestudy areas at Hangar Cove and were diminutive, spe-cies poor and patchily distributed at South Cove. Allsampling was conducted during the austral summer of2005 to 2006, after the 2 yr survey of the disturbancegrids.
Megafauna: Twenty digital photoquadrats weretaken at each grid. From this pool, 10 photoquadratswere randomly selected for analysis. A Nikon D100digital SLR camera fitted with a Nikkor 12–24 mm DXlens was housed in a Nexus D100 casing and usedthroughout the sampling. Lighting was achieved by asingle Nikonos SB105 flash unit fitted with a diffuser. Acarbon fibre framer was fitted to standardise the areasampled and to ensure the camera remained perpen-dicular to the seabed. Each image was cropped to give
91
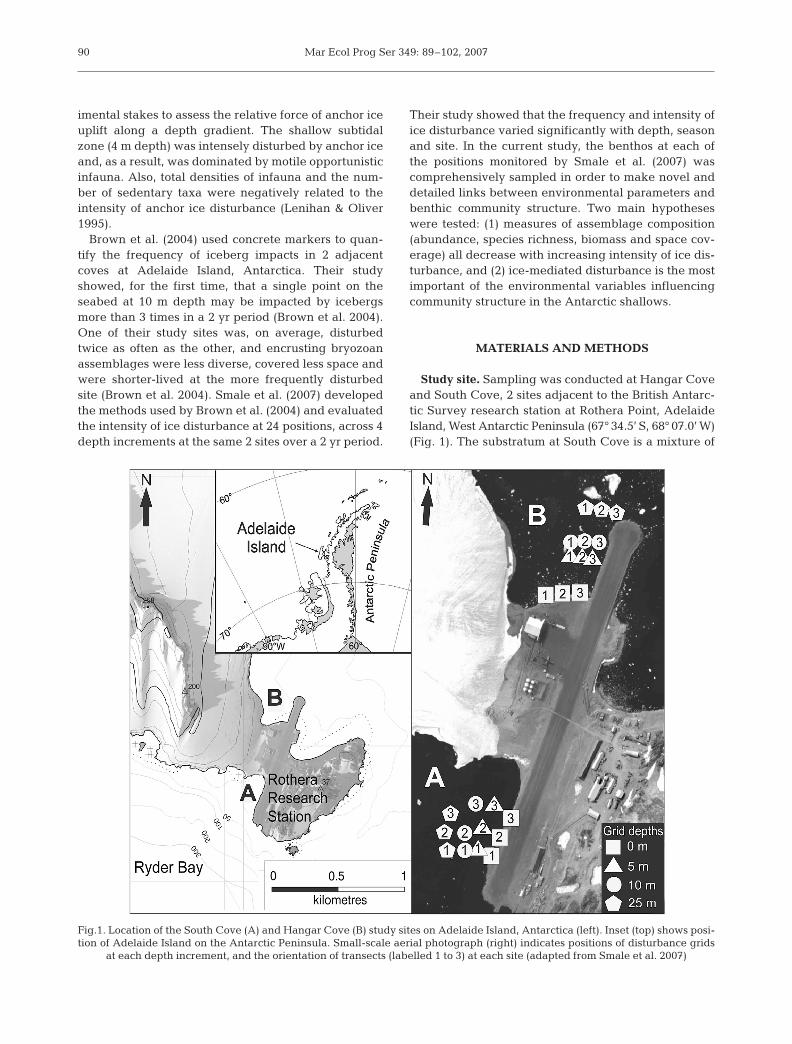
Table 1. Environmental data for each disturbance grid at South Cove andHangar Cove, Adelaide Island, Antarctica. Disturbance data (Id) are total distur-bance intensity values recorded during the 2 yr survey reported by Smale et al.(2007). Disturbance intensity (Id) was a measure of how frequently and severelymarkers within grids were damaged by iceberg impacts (see Smale et al. 2007for details). The percentage cover of soft and hard substrata was estimated fromten 0.32 m2 photoquadrats taken at each grid location. Transect depth in m
below extreme low water
Grid location Disturbance Hard substratumSite Transect Depth Id Group % cover
South Cove 1 0 311 3 1002 0 297 3 1003 0 322 3 1001 5 123 2 872 5 244 3 923 5 73 1 981 10 109 2 962 10 108 2 743 10 101 2 901 25 27 1 912 25 17 1 613 25 38 1 75
Hangar Cove 1 0 201 3 1002 0 206 3 1003 0 201 3 1001 5 128 2 732 5 113 2 813 5 136 2 761 10 76 1 972 10 83 1 803 10 64 1 891 25 0 1 22 25 7 1 193 25 133 2 18
Mar Ecol Prog Ser 349: 89–102, 2007
a sample area of 0.32 m2 and all discernable faunagreater than 5 mm in size were identified to the lowestpossible taxonomic level. All individuals of solitarytaxa were counted, whilst modular taxa (sponges,bryozoans and ascidians) were quantified by the num-ber of colonies/units.
Macrofauna: At South Cove, which consists primarilyof cobbles and patches of silt, 3 replicate 0.03 m2 ran-domly placed quadrats were hand cleared by SCUBAdivers. The silt layer at Hangar Cove was too thin to ef-fectively core, so a scoop and mesh sampler was used tosample a 0.03 m2 area of sediment to a depth of 2 cm.Again, 3 samples were collected from each disturbancegrid. All samples were sieved through a 0.5 mm mesh,coarsely sorted and preserved in 70% ethanol. Speci-mens were sorted to a minimum of family level, al-though most taxa were identified to species. All taxawere counted for abundance values and wet weightsfor all fauna were obtained for biomass analysis.
Cryptofauna: Twenty cobbles (i.e. 64 to 256 mm indiameter, Wentworth 1922) were collected by SCUBAdivers from each grid. From this pool of rocks, 10 wereselected at random, dried, labelled and later analysed.The total surface area of each rock was estimatedusing graph paper; the proportion of rock surface leftuncovered by sediment and available for colonisationwas not clearly defined (perhaps because of frequentturnover). Bryozoans were identified to species level,and abundance (number of colonies) and areal cover-age were recorded for each rock. The abundances ofother encrusting taxa (principally serpulids and spiror-bids, but also sponges) were also recorded.
Environmental variables: The community parame-ters measured from the 3 sampling protocols describedabove were related to 3 environmental variables:depth, intensity of disturbance (and the resultantgroupings, as measured by Smale et al. 2007), and thepercentage surface cover of hard substrata (bedrockand semi-stable substrata), as opposed to soft sedi-ments at each grid. The percentage cover of each sub-stratum type was estimated by projecting a grid ontothe 10 photoquadrats collected for the macrofauna sur-vey. Although this was a rather crude estimation, itallowed the inclusion of a broad-scale measure of sub-stratum type in the analysis.
Statistical analysis. Replicate samples from each dis-turbance grid were pooled to give megafaunal abun-dance and species richness per unit area (3.2 m2),macrofaunal abundance, species richness and biomassper unit area (0.09 m2), and cryptofaunal abundance,species richness and percentage cover per 10 rocks.The relationships between these univariate biologicalparameters and the environmental variables wereassessed using regression analysis in Minitab 14.0 (sig-nificance accepted at p < 0.05 for all tests).
Multivariate analyses of community structure wereperformed using the Primer v. 6 statistical package.Bray-Curtis similarity matrices were produced basedon the abundances of megafauna, macrofauna andcryptofauna, which were pre-treated with 4th roottransformations to down-weight the influence of highlyabundant taxa. The relatedness of the communities ateach grid was assessed using multidimensional scaling(MDS), whilst the strengths of the groupings of depth,disturbance and site factors were tested using theanalysis of similarities (2-way ANOSIM) procedure.
The BIOENV routine, which correlates environmen-tal data with differences in community data (followingnormalisation of environmental data and the construc-tion of a matrix based on Euclidian distance), wasapplied to determine which physical factor (depth,disturbance or hard substrata cover) best explainedthe observed patterns in community structure. Sube-quently, a model matrix generated from similarities indisturbance intensity scores (Id) was correlated withthe biological matrices using the RELATE routine.Finally, the species contributing most to the observeddifferences between disturbance groups and siteswere determined using the similarity percentages(2-way SIMPER) analysis.
RESULTS
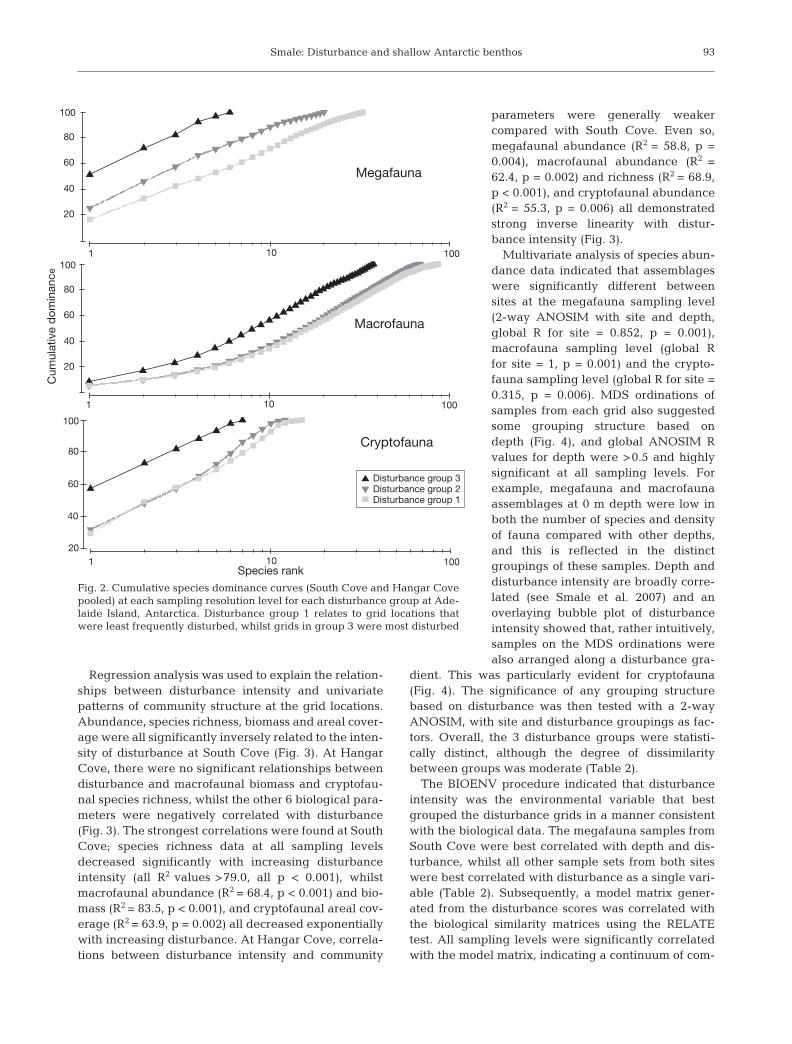
A total of 125 taxa was recorded (see Appendix 1);36, 94 and 16 different taxa were identified from themegafauna, macrofauna and cryptofauna surveys,respectively (21 taxa were recorded at more than onesampling level). Fourteen phyla and 22 classes wererepresented by these taxa. Approximately 11 000 indi-viduals were counted in megafauna samples, ~21 000in macrofauna samples, and ~40 000 encrusting indi-viduals/colonies were counted on rocks. Initially,cumulative species dominance plots (k-dominancecurves) were generated for each disturbance group ateach sampling level (Fig. 2). As could be predicted,k-dominance curves for disturbance group 3, whichincluded samples from the most intensely disturbedgrids, had the greatest y-axis intercepts and were moreelevated than the plots for the less disturbed samples.This suggested that dominance was greater and diver-sity lower in these samples compared with those in dis-turbance groups 1 and 2 (Fig. 2). Conversely, plots forthe least disturbed samples (group 1) were higher indiversity and less dominated by a small number of spe-cies. These patterns suggested that the disturbancegroupings applied to the biological samples on thebasis of the disturbance intensity data (Id) were eco-logically relevant and therefore a suitable groupingstructure for further analysis.
92
Smale: Disturbance and shallow Antarctic benthos
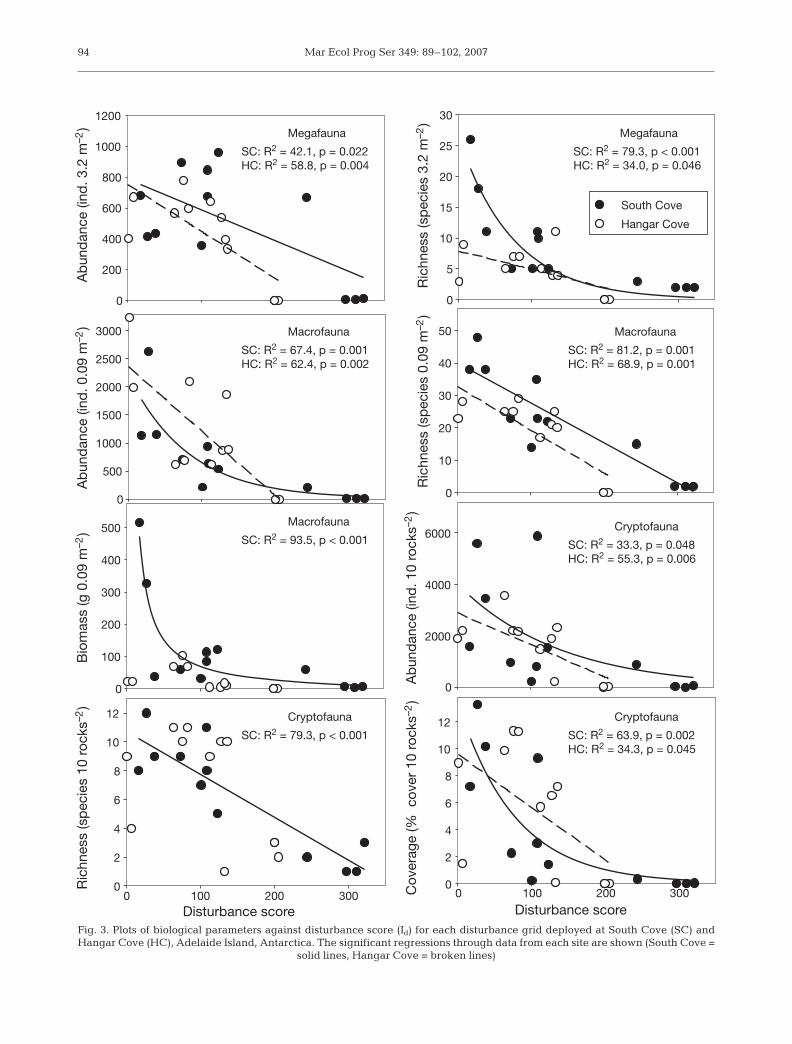
Regression analysis was used to explain the relation-ships between disturbance intensity and univariatepatterns of community structure at the grid locations.Abundance, species richness, biomass and areal cover-age were all significantly inversely related to the inten-sity of disturbance at South Cove (Fig. 3). At HangarCove, there were no significant relationships betweendisturbance and macrofaunal biomass and cryptofau-nal species richness, whilst the other 6 biological para-meters were negatively correlated with disturbance(Fig. 3). The strongest correlations were found at SouthCove; species richness data at all sampling levelsdecreased significantly with increasing disturbanceintensity (all R2 values >79.0, all p < 0.001), whilstmacrofaunal abundance (R2 = 68.4, p < 0.001) and bio-mass (R2 = 83.5, p < 0.001), and cryptofaunal areal cov-erage (R2 = 63.9, p = 0.002) all decreased exponentiallywith increasing disturbance. At Hangar Cove, correla-tions between disturbance intensity and community
parameters were generally weakercompared with South Cove. Even so,megafaunal abundance (R2 = 58.8, p =0.004), macrofaunal abundance (R2 =62.4, p = 0.002) and richness (R2 = 68.9,p < 0.001), and cryptofaunal abundance(R2 = 55.3, p = 0.006) all demonstratedstrong inverse linearity with distur-bance intensity (Fig. 3).
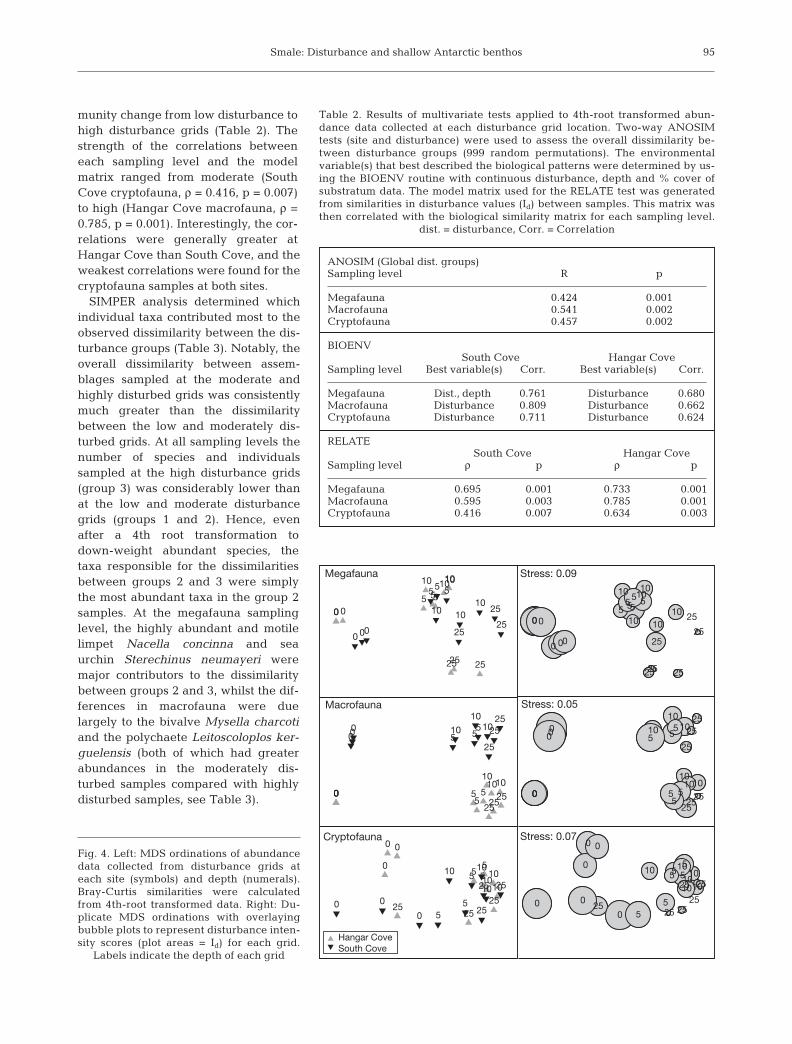
Multivariate analysis of species abun-dance data indicated that assemblageswere significantly different betweensites at the megafauna sampling level(2-way ANOSIM with site and depth,global R for site = 0.852, p = 0.001),macrofauna sampling level (global Rfor site = 1, p = 0.001) and the crypto-fauna sampling level (global R for site =0.315, p = 0.006). MDS ordinations ofsamples from each grid also suggestedsome grouping structure based ondepth (Fig. 4), and global ANOSIM Rvalues for depth were >0.5 and highlysignificant at all sampling levels. Forexample, megafauna and macrofaunaassemblages at 0 m depth were low inboth the number of species and densityof fauna compared with other depths,and this is reflected in the distinctgroupings of these samples. Depth anddisturbance intensity are broadly corre-lated (see Smale et al. 2007) and anoverlaying bubble plot of disturbanceintensity showed that, rather intuitively,samples on the MDS ordinations werealso arranged along a disturbance gra-
dient. This was particularly evident for cryptofauna(Fig. 4). The significance of any grouping structurebased on disturbance was then tested with a 2-wayANOSIM, with site and disturbance groupings as fac-tors. Overall, the 3 disturbance groups were statisti-cally distinct, although the degree of dissimilaritybetween groups was moderate (Table 2).
The BIOENV procedure indicated that disturbanceintensity was the environmental variable that bestgrouped the disturbance grids in a manner consistentwith the biological data. The megafauna samples fromSouth Cove were best correlated with depth and dis-turbance, whilst all other sample sets from both siteswere best correlated with disturbance as a single vari-able (Table 2). Subsequently, a model matrix gener-ated from the disturbance scores was correlated withthe biological similarity matrices using the RELATEtest. All sampling levels were significantly correlatedwith the model matrix, indicating a continuum of com-
93
20
40
60
80
100
Cum
ulat
ive
dom
inan
ce
Megafauna
20
40
60
80
100
Macrofauna
1 10 100
1 10 100
1 10 100
Species rank
20
40
60
80
100
Disturbance group 3Disturbance group 2Disturbance group 1
Cryptofauna
Fig. 2. Cumulative species dominance curves (South Cove and Hangar Covepooled) at each sampling resolution level for each disturbance group at Ade-laide Island, Antarctica. Disturbance group 1 relates to grid locations thatwere least frequently disturbed, whilst grids in group 3 were most disturbed
Mar Ecol Prog Ser 349: 89–102, 200794
2000
4000
6000
Disturbance score0 100 200 300
0
0
2
4
6
8
10
12
0
500
1000
1500
2000
2500
3000
0
100
200
300
400
500
Disturbance score0 100 200 300
0
2
4
6
8
10
12
Megafauna
Ab
und
ance
(ind
. 3.2
m–2
)A
bun
dan
ce (i
nd. 0
.09
m–2
)B
iom
ass
(g 0
.09
m–2
)R
ichn
ess
(sp
ecie
s 10
roc
ks–2
)
Cov
erag
e (%
cov
er 1
0 ro
cks–
2)
Ab
und
ance
(ind
. 10
rock
s–2)
Ric
hnes
s (s
pec
ies
0.09
m–2
)R
ichn
ess
(sp
ecie
s 3.
2 m
–2)
0
200
400
600
800
1000
1200
0
10
20
30
40
50
SC: R2 = 42.1, p = 0.022HC: R2 = 58.8, p = 0.004
Macrofauna
SC: R2 = 67.4, p = 0.001HC: R2 = 62.4, p = 0.002
Macrofauna
SC: R2 = 93.5, p < 0.001
Cryptofauna
SC: R2 = 79.3, p < 0.001
Macrofauna
SC: R2 = 81.2, p = 0.001HC: R2 = 68.9, p = 0.001
Cryptofauna
SC: R2 = 33.3, p = 0.048HC: R2 = 55.3, p = 0.006
Cryptofauna
SC: R2 = 63.9, p = 0.002HC: R2 = 34.3, p = 0.045
0
5
10
15
20
25
30
South Cove
Hangar Cove
Megafauna
SC: R2 = 79.3, p < 0.001HC: R2 = 34.0, p = 0.046
Fig. 3. Plots of biological parameters against disturbance score (Id) for each disturbance grid deployed at South Cove (SC) andHangar Cove (HC), Adelaide Island, Antarctica. The significant regressions through data from each site are shown (South Cove =
solid lines, Hangar Cove = broken lines)
Smale: Disturbance and shallow Antarctic benthos
munity change from low disturbance tohigh disturbance grids (Table 2). Thestrength of the correlations betweeneach sampling level and the modelmatrix ranged from moderate (SouthCove cryptofauna, ρ = 0.416, p = 0.007)to high (Hangar Cove macrofauna, ρ =0.785, p = 0.001). Interestingly, the cor-relations were generally greater atHangar Cove than South Cove, and theweakest correlations were found for thecryptofauna samples at both sites.
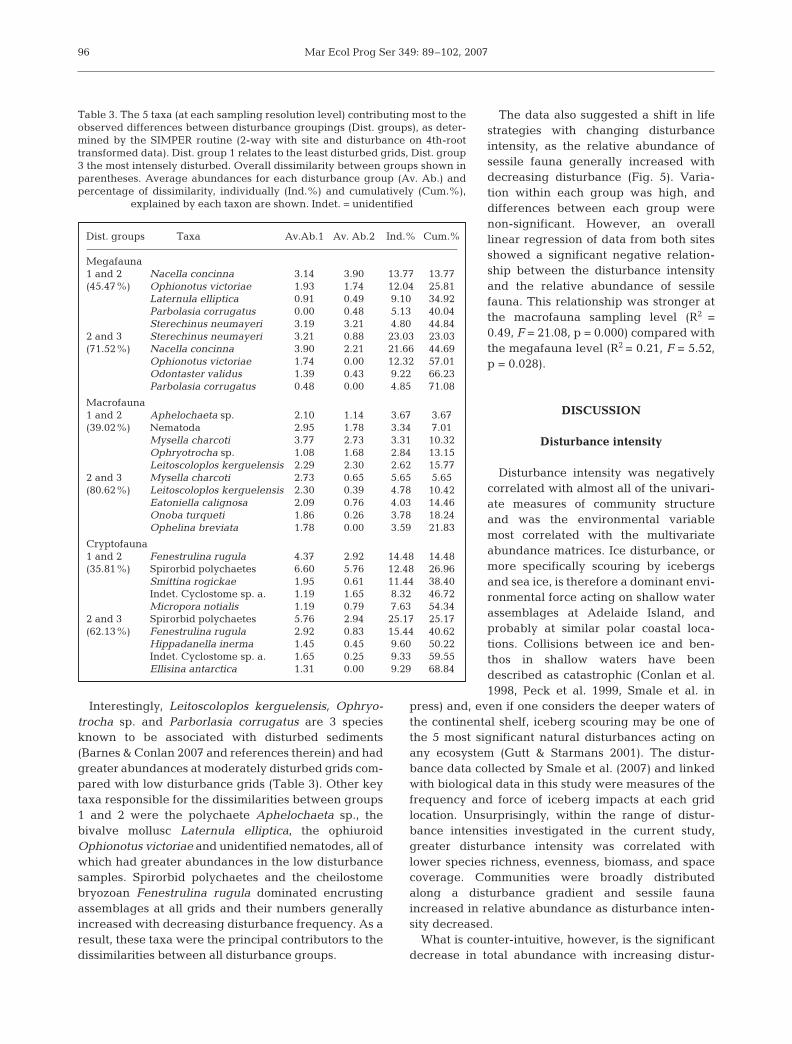
SIMPER analysis determined whichindividual taxa contributed most to theobserved dissimilarity between the dis-turbance groups (Table 3). Notably, theoverall dissimilarity between assem-blages sampled at the moderate andhighly disturbed grids was consistentlymuch greater than the dissimilaritybetween the low and moderately dis-turbed grids. At all sampling levels thenumber of species and individualssampled at the high disturbance grids(group 3) was considerably lower thanat the low and moderate disturbancegrids (groups 1 and 2). Hence, evenafter a 4th root transformation todown-weight abundant species, thetaxa responsible for the dissimilaritiesbetween groups 2 and 3 were simplythe most abundant taxa in the group 2samples. At the megafauna samplinglevel, the highly abundant and motilelimpet Nacella concinna and seaurchin Sterechinus neumayeri weremajor contributors to the dissimilaritybetween groups 2 and 3, whilst the dif-ferences in macrofauna were duelargely to the bivalve Mysella charcotiand the polychaete Leitoscoloplos ker-guelensis (both of which had greaterabundances in the moderately dis-turbed samples compared with highlydisturbed samples, see Table 3).
95
Table 2. Results of multivariate tests applied to 4th-root transformed abun-dance data collected at each disturbance grid location. Two-way ANOSIMtests (site and disturbance) were used to assess the overall dissimilarity be-tween disturbance groups (999 random permutations). The environmentalvariable(s) that best described the biological patterns were determined by us-ing the BIOENV routine with continuous disturbance, depth and % cover ofsubstratum data. The model matrix used for the RELATE test was generatedfrom similarities in disturbance values (Id) between samples. This matrix wasthen correlated with the biological similarity matrix for each sampling level.
dist. = disturbance, Corr. = Correlation
ANOSIM (Global dist. groups)Sampling level R p
Megafauna 0.424 0.001Macrofauna 0.541 0.002Cryptofauna 0.457 0.002
BIOENVSouth Cove Hangar Cove
Sampling level Best variable(s) Corr. Best variable(s) Corr.
Megafauna Dist., depthi 0.761 Disturbance 0.680Macrofauna Disturbance 0.809 Disturbance 0.662Cryptofauna Disturbance 0.711 Disturbance 0.624
RELATESouth Cove Hangar Cove
Sampling level ρ p ρ p
Megafauna 0.695 0.001 0.733 0.001Macrofauna 0.595 0.003 0.785 0.001Cryptofauna 0.416 0.007 0.634 0.003
10Megafauna
Stress: 0.07
Stress: 0.09
Macrofauna
Cryptofauna
00 0
101010
252525
555
0 00
1010
10 25
2525
555
00 0
101010
252525
555
0 00
1010
10 25
2525
555
000
101010
2525
25
55
5
000
101010
2525
25555
000
101010
2525
25
55
5
000
101010
2525
25555
Hangar CoveSouth Cove
0
0
0
1010
10
2525
25
55 5
0 0
0
10
1010
25
25
25
55
5
0
0
0
1010
10
2525
25
55 5
0 0
0
10
1010
25
25
25
55
5
Stress: 0.05
Fig. 4. Left: MDS ordinations of abundancedata collected from disturbance grids ateach site (symbols) and depth (numerals).Bray-Curtis similarities were calculatedfrom 4th-root transformed data. Right: Du-plicate MDS ordinations with overlayingbubble plots to represent disturbance inten-sity scores (plot areas = Id) for each grid.
Labels indicate the depth of each grid
Mar Ecol Prog Ser 349: 89–102, 2007
Interestingly, Leitoscoloplos kerguelensis, Ophryo-trocha sp. and Parborlasia corrugatus are 3 speciesknown to be associated with disturbed sediments(Barnes & Conlan 2007 and references therein) and hadgreater abundances at moderately disturbed grids com-pared with low disturbance grids (Table 3). Other keytaxa responsible for the dissimilarities between groups1 and 2 were the polychaete Aphelochaeta sp., thebivalve mollusc Laternula elliptica, the ophiuroidOphionotus victoriae and unidentified nematodes, all ofwhich had greater abundances in the low disturbancesamples. Spirorbid polychaetes and the cheilostomebryozoan Fenestrulina rugula dominated encrustingassemblages at all grids and their numbers generallyincreased with decreasing disturbance frequency. As aresult, these taxa were the principal contributors to thedissimilarities between all disturbance groups.
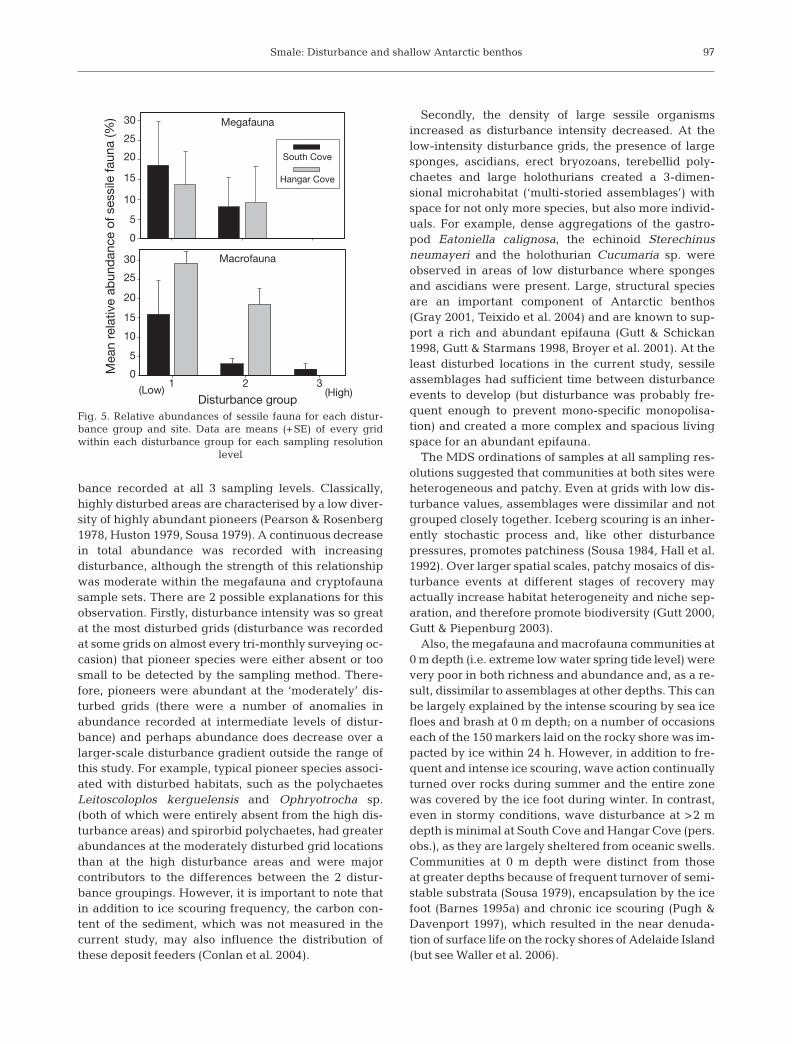
The data also suggested a shift in lifestrategies with changing disturbanceintensity, as the relative abundance ofsessile fauna generally increased withdecreasing disturbance (Fig. 5). Varia-tion within each group was high, anddifferences between each group werenon-significant. However, an overalllinear regression of data from both sitesshowed a significant negative relation-ship between the disturbance intensityand the relative abundance of sessilefauna. This relationship was stronger atthe macrofauna sampling level (R2 =0.49, F = 21.08, p = 0.000) compared withthe megafauna level (R2 = 0.21, F = 5.52,p = 0.028).
DISCUSSION
Disturbance intensity
Disturbance intensity was negativelycorrelated with almost all of the univari-ate measures of community structureand was the environmental variablemost correlated with the multivariateabundance matrices. Ice disturbance, ormore specifically scouring by icebergsand sea ice, is therefore a dominant envi-ronmental force acting on shallow waterassemblages at Adelaide Island, andprobably at similar polar coastal loca-tions. Collisions between ice and ben-thos in shallow waters have beendescribed as catastrophic (Conlan et al.1998, Peck et al. 1999, Smale et al. in
press) and, even if one considers the deeper waters ofthe continental shelf, iceberg scouring may be one ofthe 5 most significant natural disturbances acting onany ecosystem (Gutt & Starmans 2001). The distur-bance data collected by Smale et al. (2007) and linkedwith biological data in this study were measures of thefrequency and force of iceberg impacts at each gridlocation. Unsurprisingly, within the range of distur-bance intensities investigated in the current study,greater disturbance intensity was correlated withlower species richness, evenness, biomass, and spacecoverage. Communities were broadly distributedalong a disturbance gradient and sessile faunaincreased in relative abundance as disturbance inten-sity decreased.
What is counter-intuitive, however, is the significantdecrease in total abundance with increasing distur-
96
Table 3. The 5 taxa (at each sampling resolution level) contributing most to theobserved differences between disturbance groupings (Dist. groups), as deter-mined by the SIMPER routine (2-way with site and disturbance on 4th-roottransformed data). Dist. group 1 relates to the least disturbed grids, Dist. group3 the most intensely disturbed. Overall dissimilarity between groups shown inparentheses. Average abundances for each disturbance group (Av. Ab.) andpercentage of dissimilarity, individually (Ind.%) and cumulatively (Cum.%),
explained by each taxon are shown. Indet. = unidentified
Dist. groups Taxa Av.Ab.1 Av. Ab.2 Ind.% Cum.%
Megafauna1 and 2 Nacella concinna 3.14 3.90 13.77 13.77(45.47%) Ophionotus victoriae 1.93 1.74 12.04 25.81
Laternula elliptica 0.91 0.49 9.10 34.92Parbolasia corrugatus 0.00 0.48 5.13 40.04Sterechinus neumayeri 3.19 3.21 4.80 44.84
2 and 3 Sterechinus neumayeri 3.21 0.88 23.03 23.03(71.52%) Nacella concinna 3.90 2.21 21.66 44.69
Ophionotus victoriae 1.74 0.00 12.32 57.01Odontaster validus 1.39 0.43 9.22 66.23Parbolasia corrugatus 0.48 0.00 4.85 71.08
Macrofauna1 and 2 Aphelochaeta sp. 2.10 1.14 3.67 3.67(39.02%) Nematoda 2.95 1.78 3.34 7.01
Mysella charcoti 3.77 2.73 3.31 10.32Ophryotrocha sp. 1.08 1.68 2.84 13.15Leitoscoloplos kerguelensis 2.29 2.30 2.62 15.77
2 and 3 Mysella charcoti 2.73 0.65 5.65 5.65(80.62%) Leitoscoloplos kerguelensis 2.30 0.39 4.78 10.42
Eatoniella calignosa 2.09 0.76 4.03 14.46Onoba turqueti 1.86 0.26 3.78 18.24Ophelina breviata 1.78 0.00 3.59 21.83
Cryptofauna1 and 2 Fenestrulina rugula 4.37 2.92 14.48 14.48(35.81%) Spirorbid polychaetes 6.60 5.76 12.48 26.96
Smittina rogickae 1.95 0.61 11.44 38.40Indet. Cyclostome sp. a. 1.19 1.65 8.32 46.72Micropora notialis 1.19 0.79 7.63 54.34
2 and 3 Spirorbid polychaetes 5.76 2.94 25.17 25.17(62.13%) Fenestrulina rugula 2.92 0.83 15.44 40.62
Hippadanella inerma 1.45 0.45 9.60 50.22Indet. Cyclostome sp. a. 1.65 0.25 9.33 59.55Ellisina antarctica 1.31 0.00 9.29 68.84
Smale: Disturbance and shallow Antarctic benthos
bance recorded at all 3 sampling levels. Classically,highly disturbed areas are characterised by a low diver-sity of highly abundant pioneers (Pearson & Rosenberg1978, Huston 1979, Sousa 1979). A continuous decreasein total abundance was recorded with increasingdisturbance, although the strength of this relationshipwas moderate within the megafauna and cryptofaunasample sets. There are 2 possible explanations for thisobservation. Firstly, disturbance intensity was so greatat the most disturbed grids (disturbance was recordedat some grids on almost every tri-monthly surveying oc-casion) that pioneer species were either absent or toosmall to be detected by the sampling method. There-fore, pioneers were abundant at the ‘moderately’ dis-turbed grids (there were a number of anomalies inabundance recorded at intermediate levels of distur-bance) and perhaps abundance does decrease over alarger-scale disturbance gradient outside the range ofthis study. For example, typical pioneer species associ-ated with disturbed habitats, such as the polychaetesLeitoscoloplos kerguelensis and Ophryotrocha sp.(both of which were entirely absent from the high dis-turbance areas) and spirorbid polychaetes, had greaterabundances at the moderately disturbed grid locationsthan at the high disturbance areas and were majorcontributors to the differences between the 2 distur-bance groupings. However, it is important to note thatin addition to ice scouring frequency, the carbon con-tent of the sediment, which was not measured in thecurrent study, may also influence the distribution ofthese deposit feeders (Conlan et al. 2004).
Secondly, the density of large sessile organismsincreased as disturbance intensity decreased. At thelow-intensity disturbance grids, the presence of largesponges, ascidians, erect bryozoans, terebellid poly-chaetes and large holothurians created a 3-dimen-sional microhabitat (‘multi-storied assemblages’) withspace for not only more species, but also more individ-uals. For example, dense aggregations of the gastro-pod Eatoniella calignosa, the echinoid Sterechinusneumayeri and the holothurian Cucumaria sp. wereobserved in areas of low disturbance where spongesand ascidians were present. Large, structural speciesare an important component of Antarctic benthos(Gray 2001, Teixido et al. 2004) and are known to sup-port a rich and abundant epifauna (Gutt & Schickan1998, Gutt & Starmans 1998, Broyer et al. 2001). At theleast disturbed locations in the current study, sessileassemblages had sufficient time between disturbanceevents to develop (but disturbance was probably fre-quent enough to prevent mono-specific monopolisa-tion) and created a more complex and spacious livingspace for an abundant epifauna.
The MDS ordinations of samples at all sampling res-olutions suggested that communities at both sites wereheterogeneous and patchy. Even at grids with low dis-turbance values, assemblages were dissimilar and notgrouped closely together. Iceberg scouring is an inher-ently stochastic process and, like other disturbancepressures, promotes patchiness (Sousa 1984, Hall et al.1992). Over larger spatial scales, patchy mosaics of dis-turbance events at different stages of recovery mayactually increase habitat heterogeneity and niche sep-aration, and therefore promote biodiversity (Gutt 2000,Gutt & Piepenburg 2003).
Also, the megafauna and macrofauna communities at0 m depth (i.e. extreme low water spring tide level) werevery poor in both richness and abundance and, as a re-sult, dissimilar to assemblages at other depths. This canbe largely explained by the intense scouring by sea icefloes and brash at 0 m depth; on a number of occasionseach of the 150 markers laid on the rocky shore was im-pacted by ice within 24 h. However, in addition to fre-quent and intense ice scouring, wave action continuallyturned over rocks during summer and the entire zonewas covered by the ice foot during winter. In contrast,even in stormy conditions, wave disturbance at >2 mdepth is minimal at South Cove and Hangar Cove (pers.obs.), as they are largely sheltered from oceanic swells.Communities at 0 m depth were distinct from thoseat greater depths because of frequent turnover of semi-stable substrata (Sousa 1979), encapsulation by the icefoot (Barnes 1995a) and chronic ice scouring (Pugh &Davenport 1997), which resulted in the near denuda-tion of surface life on the rocky shores of Adelaide Island(but see Waller et al. 2006).
97
(Low) (High)
Macrofauna
Disturbance group
0
5
10
15
20
25
30
Megafauna
321
0
5
10
15
20
25
30
South Cove
Hangar Cove
Mea
n re
lativ
e ab
und
ance
of s
essi
le fa
una
(%)
Fig. 5. Relative abundances of sessile fauna for each distur-bance group and site. Data are means (+SE) of every gridwithin each disturbance group for each sampling resolution
level
Mar Ecol Prog Ser 349: 89–102, 2007
Other environmental variables
Benthic assemblages were significantly different be-tween the 2 study sites, which differed in a number ofcharacteristics, including exposure to disturbance andsubstratum type. The substratum at Hangar Cove waspredominantly soft sediment, whilst South Cove wascharacterised by semi-stable hard substrata. It is likelythat variation in community structure between locationswas a result of differences in a number of localised con-ditions (see Ragua-Gil et al. 2004), particularly exposureto disturbance and substratum type. Substratum type isa well-known factor influencing the distributions ofbenthic species at Antarctic locations (Gruzov et al. 1967,Kirkwood & Burton 1988, Barnes 1995b) and the distrib-ution of major substratum types had a broad scale influ-ence on the assemblages sampled at Adelaide Island.
The intensity of ice scouring in polar regions isbroadly correlated with depth (Gutt & Starmans 2001,Laudien et al. 2007, Smale et al. 2007), but small-scaledeviations from the relationship may have an impor-tant role in the distribution of species in nearshorewaters. Two of the disturbance grids deviated consid-erably from the depth-disturbance relationship: one ofthe 5 m depth grids at South Cove had a relativelylow disturbance score and one of the 25 m depth gridsat Hangar Cove had a comparatively high disturbancescore. Small-scale differences in topography andsubstratum type were the most likely cause of theseanomalies, although ice scouring frequency is highlyvariable over time (Smale et al. 2007). The benthicassemblages at these grid locations were similar tothose at grids with similar disturbance scores, ratherthan those at the same depths. To expand, the grid atSouth Cove at 5 m depth, protected by a small rise intopography and larger boulders, received fewerimpacts than other grids at this depth and the assem-blage here was more abundant, speciose and domi-nated by sessile forms (similar to assemblages at 10 mdepth). Therefore, small-scale spatial variation in dis-turbance intensity (just 10s of metres) may allow rela-tively rich communities to develop in close proximityto frequently disturbed assemblages. It seems likelythat the development of rich assemblages, acting assources of potential recruits, may influence the re-colonisation of fresh iceberg scours in nearbyintensely disturbed areas (Peck et al. 1999, Conlan &Kvitek 2005).
Ecological models and future change
In the Arctic, studies on the effects of iceberg scour-ing in nearshore waters have described peaks in spe-cies richness where disturbance intensity is intermedi-
ate (Conlan & Kvitek 2005, Laudien et al. 2007), ascould be predicted by the ‘intermediate disturbancehypothesis’ (Connell 1978, Huston 1979). In the currentstudy, no intermediate peak in richness was recordedwithin the range of disturbance intensities examined.Icebergs or sea ice impacted almost all of the distur-bance grids at least once during the 2 yr survey bySmale et al. (2007), suggesting that these sites areintensely disturbed, even at 25 m depth. Therefore, it islikely that the assemblages at these sites represent the‘disturbed end’ of the disturbance gradient, and spe-cies richness may peak at intermediately disturbedlocations outside the scope of this study (i.e. in deeperwater or more protected sites).
It is currently unclear how climatic change will affectthe intensity of ice disturbance acting on Antarcticbenthic communities. It has been suggested thatglacial retreat and increased iceberg loading intocoastal waters will intensify disturbance pressure(Brown et al. 2004), but on the other hand, warmerwaters will reduce the life expectancy, and perhaps thepopulation size, of travelling icebergs (see Wadhams2000 for iceberg decay rates). There are, of course,many other uncertainties involved in predicting futuredisturbance rates. In the Weddell Sea system, adecreased frequency of disturbance events may bemore detrimental to biodiversity than an increase(Johst et al. 2006). However, the data presented heresuggest that any increase in the intensity of icebergscouring would result in assemblages with fewer spe-cies, fewer individuals and lower biomass inhabitingthe immediate subtidal zone at high latitudes.
Acknowledgements. The author thanks the marine teams of2005 and 2006, and in particular, dive officers J. Withers andM. Brown, for impeccable field support in often-difficult condi-tions. I also thank K. Linse, T. Munilla, C. De Broyer, S. Hull,S. Kaiser and B. Hilbig for their taxonomic expertise andD. Barnes and an anonymous referee for constructive criticismof an earlier version of the manuscript. The UK NFSD isacknowledged for providing support to BAS diving operations.
LITERATURE CITED
Barnes DKA (1995a) Sublittoral epifaunal communities atSigny Island, Antarctica. I. The ice-foot zone. Mar Biol121:555–563
Barnes DKA (1995b) Sublittoral epifaunal communities atSigny Island, Antarctica. II. Below the ice-foot zone. MarBiol 121:565–572
Barnes DKA, Brockington S (2003) Zoobenthic biodiversity,biomass and abundance at Adelaide Island, Antarctica.Mar Ecol Prog Ser 249:145–155
Barnes DKA, Conlan KE (2007) Disturbance, colonization anddevelopment of Antarctic benthic communities. Phil TransR Soc Lond B 362:11–38
Barnes DKA, Rothery P, Clarke A (1996) Colonisation anddevelopment in encrusting communities from the Ant-arctic intertidal and sublittoral. J Exp Mar Biol Ecol 196:251–265
98
Smale: Disturbance and shallow Antarctic benthos
Bowden DA (2005) Quantitative characterization of shallowmarine benthic assemblages at Ryder Bay, AdelaideIsland, Antarctica. Mar Biol 146:1235–1249
Brockington S, Clarke A (2001) The relative influence of tem-perature and food on the metabolism of a marine inverte-brate. J Exp Mar Biol Ecol 258:87–99
Brown KM, Fraser KPP, Barnes DKA, Peck LS (2004) Linksbetween the structure of an Antarctic shallow-water com-munity and ice-scour frequency. Oecologia 141:121–129
Broyer CD, Scailteur Y, Chapelle G, Rauschert M (2001)Diversity of epibenthic habitats of gammaridean amphi-pods in the eastern Weddell Sea. Polar Biol 24:744–753
Conlan KE, Kvitek RG (2005) Recolonization of soft-sedimentice scours on an exposed Arctic coast. Mar Ecol Prog Ser286:21–42
Conlan KE, Lenihan HS, Kvitek RG, Oliver JS (1998) Ice scourdisturbance to benthic communities in the Canadian HighArctic. Mar Ecol Prog Ser 166:1–16
Conlan KE, Kim SL, Lenihan HS, Oliver JS (2004) Benthicchanges during 10 years of organic enrichment byMcMurdo Station, Antarctica. Mar Poll Bull 49:43–60
Connell JH (1978) Diversity in tropical rainforests and coralreefs. Science 199:1302–1310
Dayton PK, Robbiliard GA, Payne T (1970) Benthic faunalzonation as a result of anchor ice at McMurdo Sound,Antarctica. In: Holdgate MW (ed) Antarctic ecology, Vol 1.Academic Press, New York, p 244–258
Gambi MC, Buia MC, Mazzella L, Lorenti M, Scipioni MB(2000) Spatio-temporal variability in the structure ofbenthic populations in a physically controlled system offTerra Nova Bay: the shallow hard bottoms. In: FarandaFM, Guglielmo L, Ionora A (eds) Ross Sea ecology. Sprin-ger-Verlag, Berlin, p 503–514
Gambi MC, Lorenti M, Russo GF, Scipione MB (1994) Benthicassociations of the shallow hard bottoms off Terra NovaBay, Ross Sea: zonation, biomass and population structure.Antarct Sci 6:449–462
Gray JS (2001) Antarctic marine benthic biodiversity in aworld-wide latitudinal context. Polar Biol 24:633–641
Gruzov YN, Propp MV, Pushkin AF (1967) Biological associa-tions of coastal areas of the Davis Sea (based on the obser-vations of divers). Inf Byull Sov Antarkt Eksped 6:523–533
Gutt J (2000) Some “driving forces” structuring communitiesof the sublittoral Antarctic macrobenthos. Antarct Sci12:297–313
Gutt J, Piepenburg D (2003) Scale-dependent impact ondiversity of Antarctic benthos caused by grounding of ice-bergs. Mar Ecol Prog Ser 253:77–83
Gutt J, Schickan T (1998) Epibiotic relationships in Antarcticbenthos. Antarct Sci 10:398–405
Gutt J, Starmans A (1998) Structure and biodiversity ofmegabenthos in the Weddell and Lazarev Seas (Antarc-tica): ecological role of physical parameters and biologicalinteractions. Polar Biol 20:229–247
Gutt J, Starmans A (2001) Quantification of iceberg impactand benthic recolonisation patterns in the Weddell Sea(Antarctica). Polar Biol 24:615–619
Hall SJ, Raffaelli D, Thrush SF (1992) Patchiness and dis-turbance in shallow water benthic assemblages. In:Giller PS, Hildrew AG, Raffaelli DG (eds) Aquatic ecology:scale, pattern and process. Blackwell Scientific, Oxford,p 333–375
Huston MA (1979) A general hypothesis of species diversity.Am Nat 113:81–101
Johst K, Gutt J, Wissel C, Grimm V (2006) Diversity and dis-turbances in the Antarctic megabenthos: feasible versustheoretical disturbance ranges. Ecosystems 9:1145–1155
Kirkwood JM, Burton HR (1988) Macrobenthic speciesassemblages in Ellis Fjord, Vestfold Hills, Antarctica. MarBiol 97:445–457
Laudien J, Herrmann M, Arntz WE (2007) Soft bottom speciesrichness and diversity as a function of depth and icebergscour in Arctic glacial Kongsfjorden (Svalbard). Polar Biol30:1035–1046
Lenihan HS, Oliver JS (1995) Anthropogenic and natural dis-turbances to marine benthic communities in Antarctica.Ecol Appl 5:311–326
McCook LJ, Chapman ARO (1993) Community successionfollowing massive ice-scour on a rocky intertidal shore:recruitment, competition and predation during early, pri-mary succession. Mar Biol 115:565–575
Nonato EF, Brito TAS, De Paiva PC, Petti MAV, Corbisier TN(2000) Benthic megafauna of the nearshore zone of MartelInlet (King George Island, South Shetland Islands, Antarc-tica): depth zonation and underwater observations. PolarBiol 23:580–588
Pearson TH, Rosenberg R (1978) Macrobenthic succession inrelation to organic enrichment and pollution of the marineenvironment. Oceanogr Mar Biol Annu Rev 13:229–311
Peck LS, Brockington S, Vanhove S, Beghyn M (1999) Com-munity recovery following catastrophic iceberg impacts ina soft-sediment shallow-water site at Signy Island, Antarc-tica. Mar Ecol Prog Ser 186:1–8
Peck LS, Bullough LW (1993) Growth and population struc-ture in the infaunal bivalve Yoldia eightsi in relation toiceberg activity at Signy Island, Antarctica. Mar Biol 117:235–241
Pugh PJA, Davenport J (1997) Colonisation vs. disturbance:the effects of sustained ice-scouring on intertidal commu-nities. J Exp Mar Biol Ecol 210:1–21
Ragua-Gil JM, Gutt J, Clarke A, Arntz WE (2004) Antarcticshallow-water mega-epibenthos: shaped by circumpolardispersion or local conditions? Mar Biol 144:829–839
Richardson ME, Hedgepeth JW (1977) Antarctic soft-bottom,macrobenthic community adaptations to a cold, stable,highly productive, glacially affected environment. In:Llano GA (ed) Adaptations within Antarctic ecosystems.Smithsonian Institution Press, Washington, DC, p 181–196
Sahade R, Tatian M, Kowalke J, Kuhne S, Esnal GB (1998)Benthic faunal associations on soft substrates at PotterCove, King George Island, Antarctica. Polar Biol 19:85–91
Smale DA, Barnes DKA, Fraser KPP (2007) The influence ofdepth, site exposure and season on the intensity of icebergscouring in nearshore Antarctic waters. Polar Biol30:769–779
Smale DA, Barnes DKA, Fraser KPP (in press) The influenceof ice scour on benthic communities at three contrastingsites at Adelaide Island, Antarctica. Austral Ecol
Sousa WP (1979) Disturbance in marine intertidal boulderfields: the nonequilibrium maintenance of species diver-sity. Ecology 60:1225–1239
Sousa WP (1984) The role of disturbance in natural communi-ties. Annu Rev Ecol Syst 15:353–391
Teixido N, Garrabou J, Gutt J, Arntz WE (2004) Recovery inAntarctic benthos after iceberg disturbance: trends inbenthic composition, abundance and growth forms. MarEcol Prog Ser 278:1–16
Wadhams P (2000) Ice in the ocean. Gordon & Breach, Ams-terdam
Waller C, Barnes DKA, Convey P (2006) Ecological con-straints across an Antarctic land-sea interface. AustralEcol 31:656–666
Wentworth CK (1922) A scale of grade and class terms forclastic sediments. J Geol 30:377–392
99
Mar Ecol Prog Ser 349: 89–102, 2007100
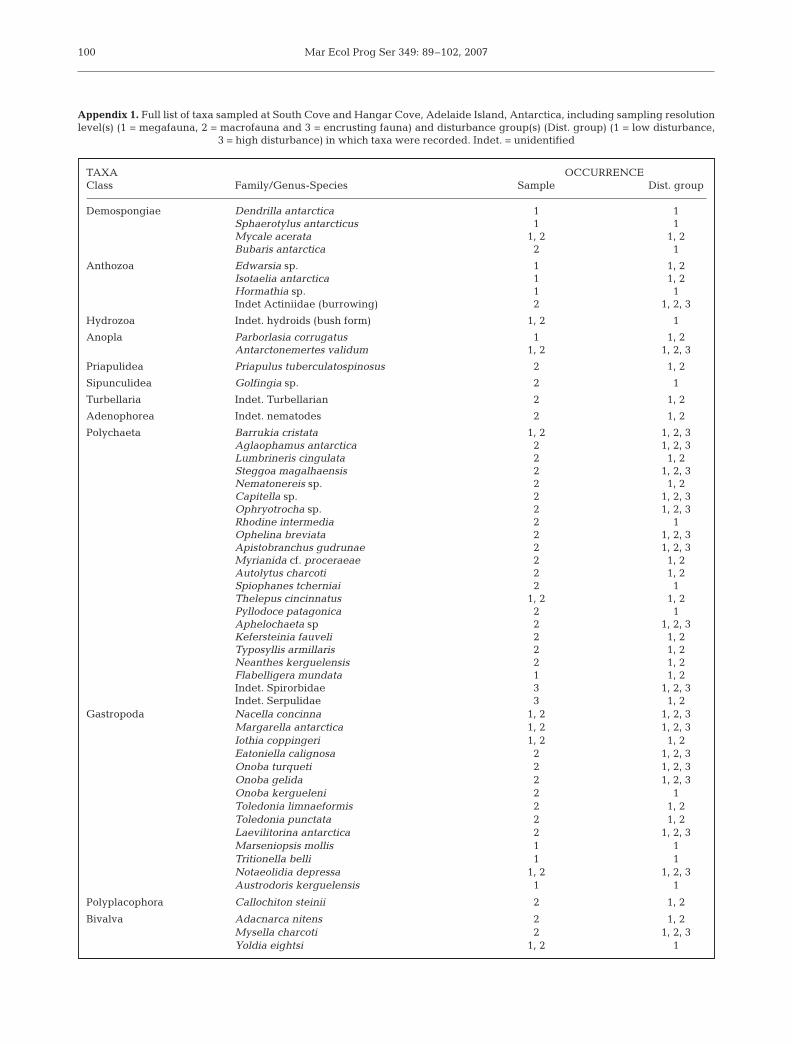
Appendix 1. Full list of taxa sampled at South Cove and Hangar Cove, Adelaide Island, Antarctica, including sampling resolutionlevel(s) (1 = megafauna, 2 = macrofauna and 3 = encrusting fauna) and disturbance group(s) (Dist. group) (1 = low disturbance,
3 = high disturbance) in which taxa were recorded. Indet. = unidentified
TAXA OCCURRENCE Class Family/Genus-Species Sample Dist. group
Demospongiae Dendrilla antarctica 1 1Sphaerotylus antarcticus 1 1Mycale acerata 1, 2 1, 2Bubaris antarctica 2 1
Anthozoa Edwarsia sp. 1 1, 2Isotaelia antarctica 1 1, 2Hormathia sp. 1 1Indet Actiniidae (burrowing) 2 1, 2, 3
Hydrozoa Indet. hydroids (bush form) 1, 2 1
Anopla Parborlasia corrugatus 1 1, 2Antarctonemertes validum 1, 2 1, 2, 3
Priapulidea Priapulus tuberculatospinosus 2 1, 2
Sipunculidea Golfingia sp. 2 1
Turbellaria Indet. Turbellarian 2 1, 2
Adenophorea Indet. nematodes 2 1, 2
Polychaeta Barrukia cristata 1, 2 1, 2, 3Aglaophamus antarctica 2 1, 2, 3Lumbrineris cingulata 2 1, 2Steggoa magalhaensis 2 1, 2, 3Nematonereis sp. 2 1, 2Capitella sp. 2 1, 2, 3Ophryotrocha sp. 2 1, 2, 3Rhodine intermedia 2 1Ophelina breviata 2 1, 2, 3Apistobranchus gudrunae 2 1, 2, 3Myrianida cf. proceraeae 2 1, 2Autolytus charcoti 2 1, 2Spiophanes tcherniai 2 1Thelepus cincinnatus 1, 2 1, 2Pyllodoce patagonica 2 1Aphelochaeta sp 2 1, 2, 3Kefersteinia fauveli 2 1, 2Typosyllis armillaris 2 1, 2Neanthes kerguelensis 2 1, 2Flabelligera mundata 1 1, 2Indet. Spirorbidae 3 1, 2, 3Indet. Serpulidae 3 1, 2
Gastropoda Nacella concinna 1, 2 1, 2, 3Margarella antarctica 1, 2 1, 2, 3Iothia coppingeri 1, 2 1, 2Eatoniella calignosa 2 1, 2, 3Onoba turqueti 2 1, 2, 3Onoba gelida 2 1, 2, 3Onoba kergueleni 2 1Toledonia limnaeformis 2 1, 2Toledonia punctata 2 1, 2Laevilitorina antarctica 2 1, 2, 3Marseniopsis mollis 1 1Tritionella belli 1 1Notaeolidia depressa 1, 2 1, 2, 3Austrodoris kerguelensis 1 1
Polyplacophora Callochiton steinii 2 1, 2
Bivalva Adacnarca nitens 2 1, 2Mysella charcoti 2 1, 2, 3Yoldia eightsi 1, 2 1
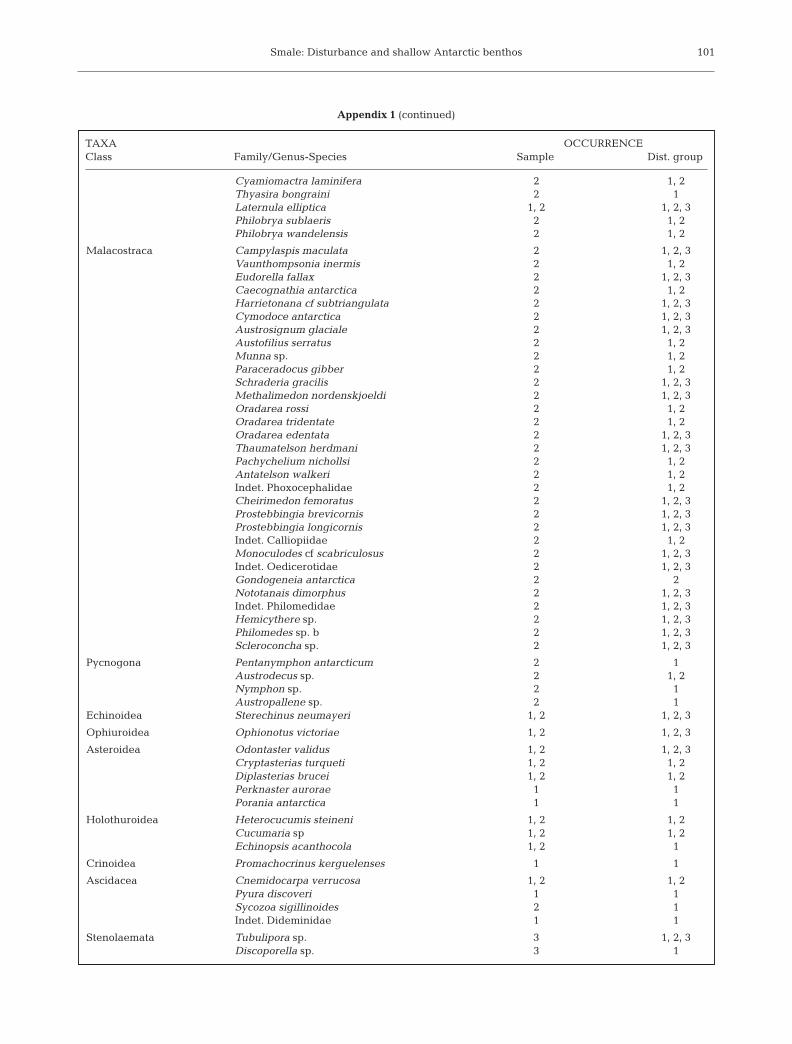
Smale: Disturbance and shallow Antarctic benthos 101
Appendix 1 (continued)
Cyamiomactra laminifera 2 1, 2Thyasira bongraini 2 1Laternula elliptica 1, 2 1, 2, 3Philobrya sublaeris 2 1, 2Philobrya wandelensis 2 1, 2
Malacostraca Campylaspis maculata 2 1, 2, 3Vaunthompsonia inermis 2 1, 2Eudorella fallax 2 1, 2, 3Caecognathia antarctica 2 1, 2Harrietonana cf subtriangulata 2 1, 2, 3Cymodoce antarctica 2 1, 2, 3Austrosignum glaciale 2 1, 2, 3Austofilius serratus 2 1, 2Munna sp. 2 1, 2Paraceradocus gibber 2 1, 2Schraderia gracilis 2 1, 2, 3Methalimedon nordenskjoeldi 2 1, 2, 3Oradarea rossi 2 1, 2Oradarea tridentate 2 1, 2Oradarea edentata 2 1, 2, 3Thaumatelson herdmani 2 1, 2, 3Pachychelium nichollsi 2 1, 2Antatelson walkeri 2 1, 2Indet. Phoxocephalidae 2 1, 2Cheirimedon femoratus 2 1, 2, 3Prostebbingia brevicornis 2 1, 2, 3Prostebbingia longicornis 2 1, 2, 3Indet. Calliopiidae 2 1, 2Monoculodes cf scabriculosus 2 1, 2, 3Indet. Oedicerotidae 2 1, 2, 3Gondogeneia antarctica 2 2Nototanais dimorphus 2 1, 2, 3Indet. Philomedidae 2 1, 2, 3Hemicythere sp. 2 1, 2, 3Philomedes sp. b 2 1, 2, 3Scleroconcha sp. 2 1, 2, 3
Pycnogona Pentanymphon antarcticum 2 1Austrodecus sp. 2 1, 2Nymphon sp. 2 1Austropallene sp. 2 1
Echinoidea Sterechinus neumayeri 1, 2 1, 2, 3
Ophiuroidea Ophionotus victoriae 1, 2 1, 2, 3
Asteroidea Odontaster validus 1, 2 1, 2, 3Cryptasterias turqueti 1, 2 1, 2Diplasterias brucei 1, 2 1, 2Perknaster aurorae 1 1Porania antarctica 1 1
Holothuroidea Heterocucumis steineni 1, 2 1, 2Cucumaria sp 1, 2 1, 2Echinopsis acanthocola 1, 2 1
Crinoidea Promachocrinus kerguelenses 1 1
Ascidacea Cnemidocarpa verrucosa 1, 2 1, 2Pyura discoveri 1 1Sycozoa sigillinoides 2 1Indet. Dideminidae 1 1
Stenolaemata Tubulipora sp. 3 1, 2, 3Discoporella sp. 3 1
TAXA OCCURRENCE Class Family/Genus-Species Sample Dist. group
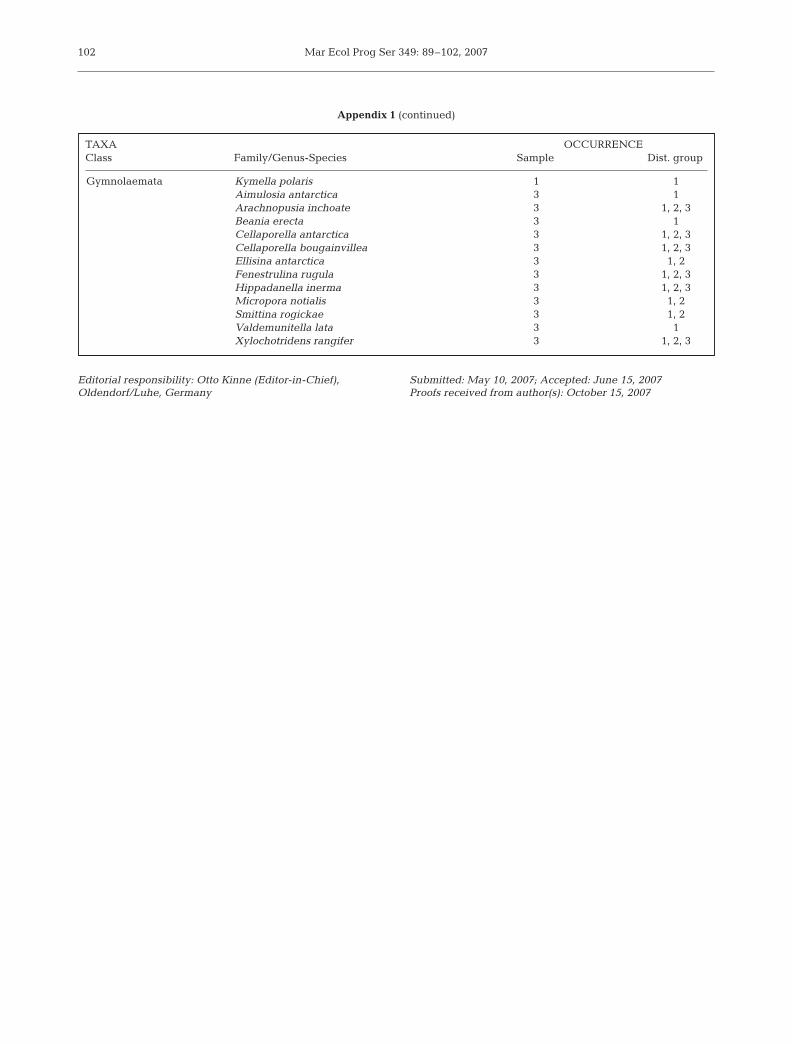
Mar Ecol Prog Ser 349: 89–102, 2007102
Gymnolaemata Kymella polaris 1 1Aimulosia antarctica 3 1Arachnopusia inchoate 3 1, 2, 3Beania erecta 3 1Cellaporella antarctica 3 1, 2, 3Cellaporella bougainvillea 3 1, 2, 3Ellisina antarctica 3 1, 2Fenestrulina rugula 3 1, 2, 3Hippadanella inerma 3 1, 2, 3Micropora notialis 3 1, 2Smittina rogickae 3 1, 2Valdemunitella lata 3 1Xylochotridens rangifer 3 1, 2, 3
Appendix 1 (continued)
TAXA OCCURRENCE Class Family/Genus-Species Sample Dist. group
Editorial responsibility: Otto Kinne (Editor-in-Chief),Oldendorf/Luhe, Germany
Submitted: May 10, 2007; Accepted: June 15, 2007Proofs received from author(s): October 15, 2007