Embed Size (px)
Citation preview
904 Bulletin of the World Health Organization | December 2004, 82 (12)
Objective To evaluate how often coding changes between and within revisions of the International Classification of Diseases (ICD) complicate the description of long-term trends in cause-specific mortality.Methods Data on cause-specific mortality between 1950 and 1999 for men and women aged 60 and older were obtained from Denmark, England and Wales, Finland, the Netherlands, Norway and Sweden. Data were obtained by five-year age groups. We constructed a concordance table using three-digit ICD codes. In addition we evaluated the occurrence of mortality discontinuities by visually inspecting cause-specific trends and country-specific background information. Evaluation was also based on quantification of the discontinuities using a Poisson regression model (including period splines). We compared the observed trends in cause-specific mortality with the trends after adjustment for the discontinuities caused by changes to coding.Findings In 45 out of 416 (10.8 %) instances of ICD revisions to cause-specific mortality codes, significant discontinuities that were regarded as being due to ICD revisions remained. The revisions from ICD-6 and ICD-7 to ICD-8 and a wide range of causes of death, with the exception of the specific cancers, were especially affected. Incidental changes in coding rules were also important causes of discontinuities in trends in cause-specific mortality, especially in England and Wales, Finland and Sweden. Adjusting for these discontinuities can lead to significant changes in trends, although these primarily affect only limited periods of time.Conclusion Despite using a carefully constructed concordance table based on three-digit ICD codes, mortality discontinuities arising as a result of coding changes (both between and within revisions) can lead to substantial changes in long-term trends in cause-specific mortality. Coding changes should therefore be evaluated by researchers and, where necessary, controlled for.
Keywords International Classification of Diseases/history; Mortality/trends; Cause of death/trends; Bias (Epidemiology); Research design; Evaluation studies; Europe; Denmark; Finland; Netherlands; Norway; Sweden; United Kingdom (source: MeSH, NLM).Mots clés Classification internationale des maladies/histoire; Mortalité/orientations; Cause décès/orientations; Biais (Epidémiologie); Projet recherche; Etude évaluation; Europe; Danemark; Finlande; Pays-Bas; Norvège; Suède; Royaume-Uni (source: MeSH, INSERM).Palabras clave Clasificación Internacional de Enfermedades/historia; Mortalidad/tendencias; Causa de muerte/tendencias; Sesgo (Epidemiología); Proyectos de investigación; Estudios de evaluación; Europa; Dinamarca; Finlandia; Países Bajos; Noruega; Suecia; Reino Unido (fuente: DeCS, BIREME).
Bulletin of the World Health Organization 2004;82:904-913.
Voir page 911 le résumé en français. En la página 912 figura un resumen en español.
IntroductionThe study of trends in cause-specific mortality is an impor-tant subject in epidemiology, demography and public health. However, assessment of long-term mortality trends in causes of death can be hampered by changes in coding. For example, numerous revisions of the International Classification of Diseases (ICD) have to be taken into account. Not only can these revi-sions lead to changes in coding rules but additionally each ICD classification can include a different number of items to code the causes of death, causing inconsistency over time. Solutions to overcome the bias that may result vary from simple and crude to elaborate and accurate.
1 Researcher, Department of Public Health, Erasmus MC, University Medical Center Rotterdam, PO Box 1738, 3000 DR Rotterdam, the Netherlands (email: [email protected].). Correspondence should be sent to this author.2 Assistant Professor, Department of Public Health, Erasmus MC, University Medical Center Rotterdam, Rotterdam, the Netherlands. Ref No. 03-006130(Submitted: 9 July 2003 – Final revised version received: 19 March 2004 – Accepted: 22 March 2004)
ICD coding changes and discontinuities in trends in cause-specific mortality in six European countries, 1950–99Fanny Janssen1 & Anton E. Kunst2 for the Netherlands Epidemiology and Demography Compression of Morbidity Research Group (NEDCOM)
A simpler approach is to study mortality trends only in broad, aggregated groups of causes of death or in specific diseases for which the coding is known to have been consistent over time (1). However, many specific causes of death cannot be studied appropriately with these approaches.
Bridge coding is an accurate approach. In bridge coding cross-classifications between successive ICD revisions are used; these are based on the double coding of all causes of death (2). These cross-classifications, however, exist for only a small number of countries and ICD revisions, and their results may not be directly applicable to all countries owing to differences in coding practices and differences in the application of new ICD revisions between countries (3, 4).
.912
905Bulletin of the World Health Organization | December 2004, 82 (12)
Research Fanny Janssen et al. ICD coding changes and cause-specific mortality in Europe
Vallin & Meslé (4–6) elaborately and accurately recon-structed coherent series of data for causes of death in France for the years 1925–94, according to ICD-9. They used carefully constructed concordance tables based on four-digit codes; these concordance tables linked the codes for a specific cause of death through each successive ICD revision. Transition coefficients were calculated to redistribute the numbers of causes of death, based on cross-tabulation of the number of deaths for different revisions. Unfortunately, four-digit codes are not available in many countries. Furthermore, this method is quite time-con-suming, and the redistribution of deaths in one country is not directly applicable to other countries.
An intermediate approach is to use concordance tables based on three-digit codes without redistributing the numbers of deaths (7). These concordance tables often underlie the selec-tion of the codes used for successive ICD revisions in studies on long-term trends in cause-specific mortality (8–10). How-ever, it is unclear whether mortality discontinuities caused by changes in ICD codes can be avoided using this intermediate approach.
Moreover, discontinuities in cause-specific trends can also result from incidental changes in coding rules, e.g. changes within ICD revisions in coding rules applied at statistical offices. The extent to which coding problems remain and may bias the study of trends in cause-specific mortality have not yet been estimated systematically. An assessment of the experience in several countries may aid researchers intending to study these long-term trends.
In this study, we evaluated how often coding problems complicate the description of long-term trends in mortality despite the use of a carefully constructed concordance table that is based on the three-digit codes. We used data from six European countries covering a broad selection of specific causes of death between 1950 and 1999. We considered the effect of mortality discontinuities caused by coding changes both between and within ICD revisions. We assessed in which situ-ations (countries, causes of death) these coding changes led to discontinuities and whether adjustment for these discontinui-ties resulted in different estimates of trends in cause-specific mortality.
MethodsData were obtained on the underlying cause of death, total mortality and mid-year population for Denmark, England and Wales, Finland, the Netherlands, Norway and Sweden. These data were stratified by year of death (1950–99), sex and five-year age group for people aged 60 and older. Data were obtained from the National Institute of Public Health (Denmark), the Office for National Statistics (England and Wales), Statfin (Finland), Statistics Netherlands, NIDI (Netherlands), Statis-tics Norway (Norway) and the National Board of Health and Welfare (Sweden). Data were available only from 1951 for Finland and Norway. They were available for Sweden from 1952. Data for Denmark were available from 1951 to 1998.
The number of deaths for each cause of death in the oldest age groups (85 for England and Wales and the Neth-erlands up until 1969, and 90, 95 and 100 for all other countries and periods) were redistributed into five-year age groups up to the age of 100 years using the distribution observed for total mortality among these age groups. Data on mortality for the oldest age groups were available from the Kannisto-Thatcher Database on Old Age Mortality (11).
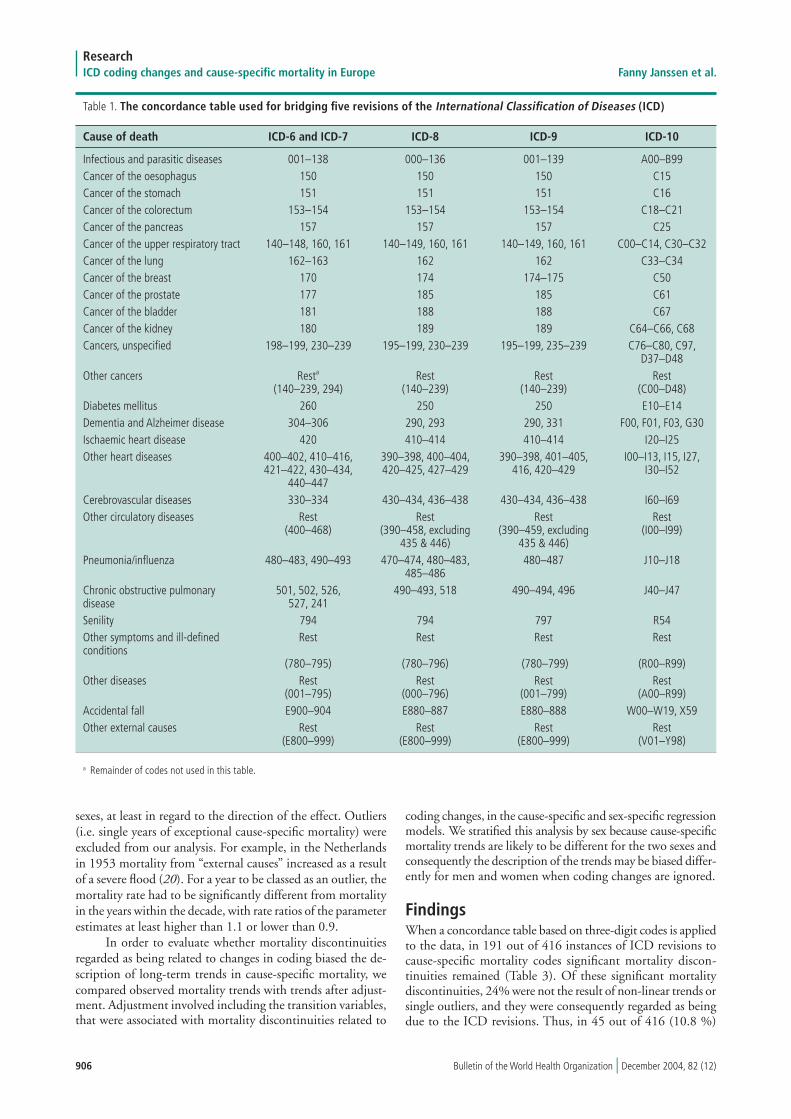
We selected 26 causes of death, mainly on the basis of their relative importance in old-age mortality (Table 1). For Finland, the registry of causes of death by three-digit code was not available and instead data from aggregated code groups were supplemented with data from specific three-digit codes for the selected causes of death.
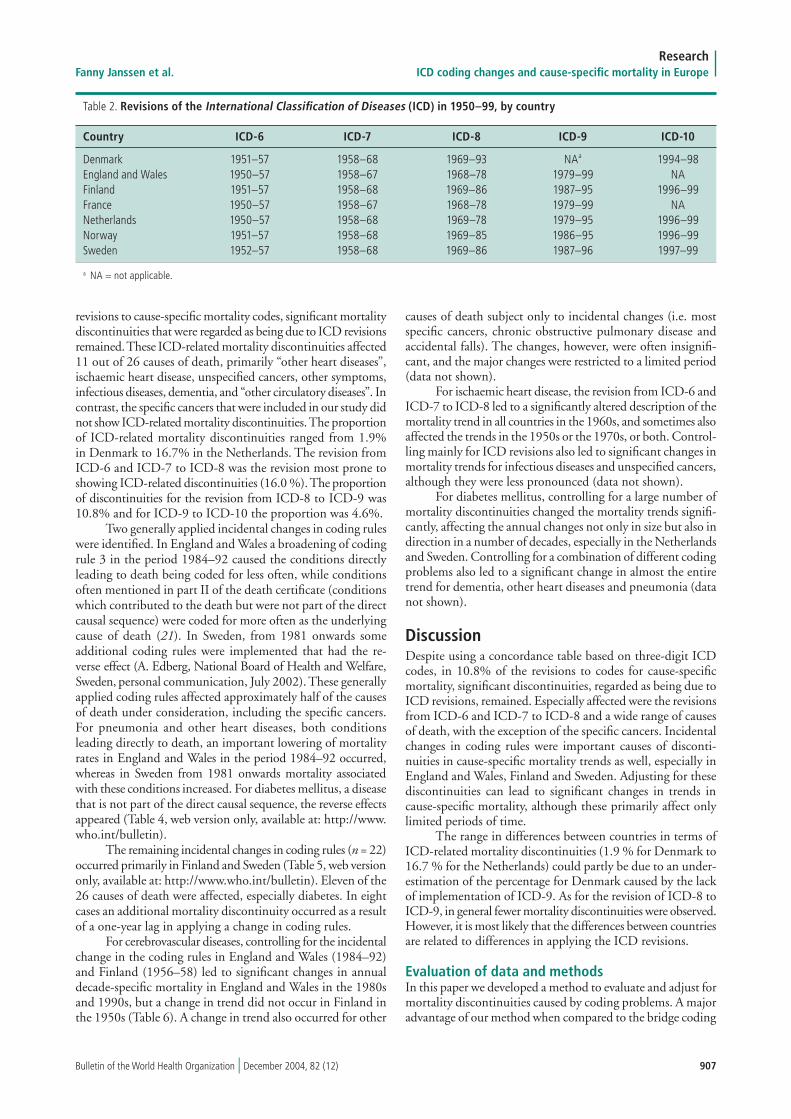
Five different revisions of the ICD occurred between 1950 and 1999 (Table 2), but because the codes remained identical in ICD-6 and ICD-7, only four revisions had to be bridged in order to reconstruct the causes of death. For this purpose, we carefully constructed a concordance table using three-digit codes, building on existing concordance tables (7, 12, 13) and using information from WHO (14–18) (Table 1). The basic rule we applied was that we aimed to safeguard the continuity of the medical content on the causes of death. For Denmark, a country-specific adjustment of the concordance table was made in order to include codes 260–265 for diabetes mellitus for the years 1965–68 (K. Juel, National Institute of Public Health, Denmark, personal communication about diabetes codes, June 2002).
The first step in our evaluation was to visually inspect trends in cause-specific mortality for the combined data on men and women aged 60 years and older. In our evaluation of mortality discontinuities we distinguished between those that were the result of revisions to the ICD, those that were the re-sult of incidental changes in coding rules that applied to many causes of death simultaneously, and those that were the result of incidental changes in coding rules that were applied only to a specific cause of death, for example less restrictive coding for diabetes mellitus. In addition, country-specific background information was obtained through personal communication with national statistical offices or related institutes on the pos-sible cause of observed discontinuities and on national coding practices and coding problems.
In the second step, mortality discontinuities resulting from ICD revisions and generally applied incidental changes in coding rules were quantified in cause-specific Poisson regres-sion models and tested for statistical significance at the 95% significance level. The dependent variable was the number of deaths, with the mid-year population used as an offset variable. The independent variables were age (five-year age groups) and year of death (using splines). Spline functions divide the overall trend into a number of separate, adjacent segments (19) and allow a detailed description of long-term mortality trends to be made. In our analysis, we used five decade-specific segments (1950–59 to 1990–99). To these regression models we added transition variables indicating the ICD revisions (i.e. ICD-6 and ICD-7 to ICD-8, ICD-8 to ICD-9, or ICD-9 to ICD-10) or the general incidental changes in coding rules.
In the third step, we used two criteria to judge whether significant mortality discontinuities were due to coding prob-lems. The first criterion was to ensure that the significant ef-fect could not be attributed to non-linear trends or to a single outlier, for instance an influenza epidemic nearby. The second criterion was to determine whether the observed effect could be related to the coding problem, for example as a direct result of a change at the level of four-digit codes or as an indirect result of an opposite effect on a complementary cause of death. These judgements were based primarily on visual inspection of cause-specific mortality trends without the use of statistical tests.
The identification of mortality discontinuities was based on the trends for men and women combined because changes in coding rules most likely operate in the same manner for both
906 Bulletin of the World Health Organization | December 2004, 82 (12)
ResearchICD coding changes and cause-specific mortality in Europe Fanny Janssen et al.
Table 1. The concordance table used for bridging five revisions of the International Classification of Diseases (ICD)
Cause of death ICD-6 and ICD-7 ICD-8 ICD-9 ICD-10
Infectious and parasitic diseases 001–138 000–136 001–139 A00–B99Cancer of the oesophagus 150 150 150 C15Cancer of the stomach 151 151 151 C16Cancer of the colorectum 153–154 153–154 153–154 C18–C21Cancer of the pancreas 157 157 157 C25Cancer of the upper respiratory tract 140–148, 160, 161 140–149, 160, 161 140–149, 160, 161 C00–C14, C30–C32 Cancer of the lung 162–163 162 162 C33–C34Cancer of the breast 170 174 174–175 C50Cancer of the prostate 177 185 185 C61Cancer of the bladder 181 188 188 C67Cancer of the kidney 180 189 189 C64–C66, C68Cancers, unspecified 198–199, 230–239 195–199, 230–239 195–199, 235–239 C76–C80, C97, D37–D48 Other cancers Resta Rest Rest Rest (140–239, 294) (140–239) (140–239) (C00–D48)Diabetes mellitus 260 250 250 E10–E14Dementia and Alzheimer disease 304–306 290, 293 290, 331 F00, F01, F03, G30Ischaemic heart disease 420 410–414 410–414 I20–I25Other heart diseases 400–402, 410–416, 390–398, 400–404, 390–398, 401–405, I00–I13, I15, I27, 421–422, 430–434, 420–425, 427–429 416, 420–429 I30–I52 440–447 Cerebrovascular diseases 330–334 430–434, 436–438 430–434, 436–438 I60–I69Other circulatory diseases Rest Rest Rest Rest (400–468) (390–458, excluding (390–459, excluding (I00–I99) 435 & 446) 435 & 446) Pneumonia/influenza 480–483, 490–493 470–474, 480–483, 480–487 J10–J18 485–486 Chronic obstructive pulmonary 501, 502, 526, 490–493, 518 490–494, 496 J40–J47 disease 527, 241 Senility 794 794 797 R54Other symptoms and ill-defined Rest Rest Rest Rest conditions (780–795) (780–796) (780–799) (R00–R99)Other diseases Rest Rest Rest Rest (001–795) (000–796) (001–799) (A00–R99)Accidental fall E900–904 E880–887 E880–888 W00–W19, X59Other external causes Rest Rest Rest Rest (E800–999) (E800–999) (E800–999) (V01–Y98)
sexes, at least in regard to the direction of the effect. Outliers (i.e. single years of exceptional cause-specific mortality) were excluded from our analysis. For example, in the Netherlands in 1953 mortality from “external causes” increased as a result of a severe flood (20). For a year to be classed as an outlier, the mortality rate had to be significantly different from mortality in the years within the decade, with rate ratios of the parameter estimates at least higher than 1.1 or lower than 0.9.
In order to evaluate whether mortality discontinuities regarded as being related to changes in coding biased the de-scription of long-term trends in cause-specific mortality, we compared observed mortality trends with trends after adjust-ment. Adjustment involved including the transition variables, that were associated with mortality discontinuities related to
coding changes, in the cause-specific and sex-specific regression models. We stratified this analysis by sex because cause-specific mortality trends are likely to be different for the two sexes and consequently the description of the trends may be biased differ-ently for men and women when coding changes are ignored.
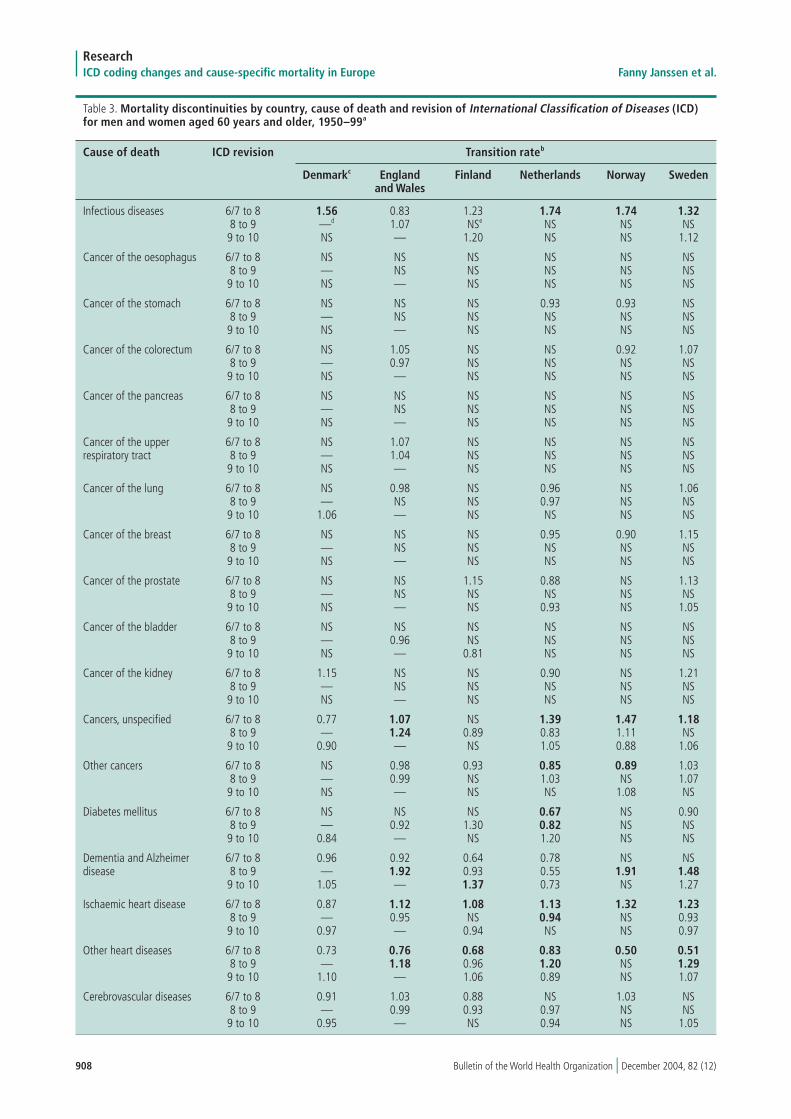
FindingsWhen a concordance table based on three-digit codes is applied to the data, in 191 out of 416 instances of ICD revisions to cause-specific mortality codes significant mortality discon-tinuities remained (Table 3). Of these significant mortality discontinuities, 24% were not the result of non-linear trends or single outliers, and they were consequently regarded as being due to the ICD revisions. Thus, in 45 out of 416 (10.8 %)
a Remainder of codes not used in this table.
907Bulletin of the World Health Organization | December 2004, 82 (12)
Research Fanny Janssen et al. ICD coding changes and cause-specific mortality in Europe
Table 2. Revisions of the International Classification of Diseases (ICD) in 1950–99, by country
Country ICD-6 ICD-7 ICD-8 ICD-9 ICD-10
Denmark 1951–57 1958–68 1969–93 NAa 1994–98England and Wales 1950–57 1958–67 1968–78 1979–99 NAFinland 1951–57 1958–68 1969–86 1987–95 1996–99France 1950–57 1958–67 1968–78 1979–99 NA Netherlands 1950–57 1958–68 1969–78 1979–95 1996–99Norway 1951–57 1958–68 1969–85 1986–95 1996–99Sweden 1952–57 1958–68 1969–86 1987–96 1997–99
a NA = not applicable.
revisions to cause-specific mortality codes, significant mortality discontinuities that were regarded as being due to ICD revisions remained. These ICD-related mortality discontinuities affected 11 out of 26 causes of death, primarily “other heart diseases”, ischaemic heart disease, unspecified cancers, other symptoms, infectious diseases, dementia, and “other circulatory diseases”. In contrast, the specific cancers that were included in our study did not show ICD-related mortality discontinuities. The proportion of ICD-related mortality discontinuities ranged from 1.9% in Denmark to 16.7% in the Netherlands. The revision from ICD-6 and ICD-7 to ICD-8 was the revision most prone to showing ICD-related discontinuities (16.0 %). The proportion of discontinuities for the revision from ICD-8 to ICD-9 was 10.8% and for ICD-9 to ICD-10 the proportion was 4.6%.
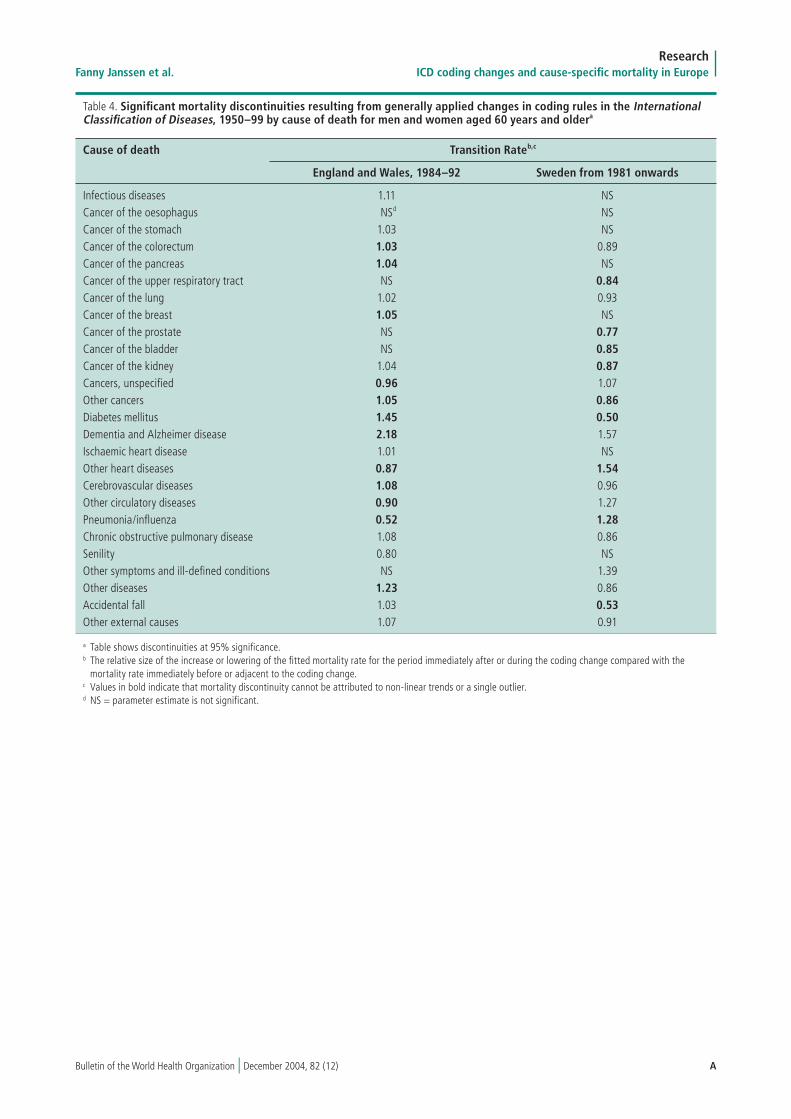
Two generally applied incidental changes in coding rules were identified. In England and Wales a broadening of coding rule 3 in the period 1984–92 caused the conditions directly leading to death being coded for less often, while conditions often mentioned in part II of the death certificate (conditions which contributed to the death but were not part of the direct causal sequence) were coded for more often as the underlying cause of death (21). In Sweden, from 1981 onwards some additional coding rules were implemented that had the re-verse effect (A. Edberg, National Board of Health and Welfare, Sweden, personal communication, July 2002). These generally applied coding rules affected approximately half of the causes of death under consideration, including the specific cancers. For pneumonia and other heart diseases, both conditions leading directly to death, an important lowering of mortality rates in England and Wales in the period 1984–92 occurred, whereas in Sweden from 1981 onwards mortality associated with these conditions increased. For diabetes mellitus, a disease that is not part of the direct causal sequence, the reverse effects appeared (Table 4, web version only, available at: http://www.who.int/bulletin).
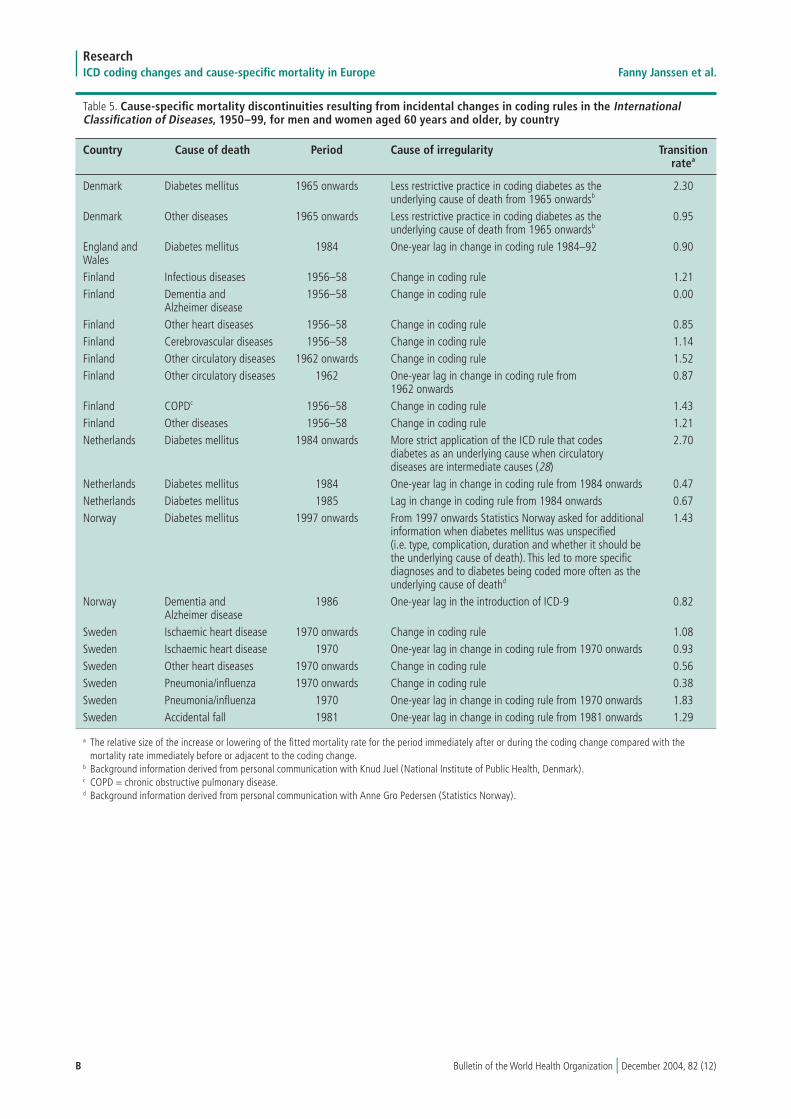
The remaining incidental changes in coding rules (n = 22) occurred primarily in Finland and Sweden (Table 5, web version only, available at: http://www.who.int/bulletin). Eleven of the 26 causes of death were affected, especially diabetes. In eight cases an additional mortality discontinuity occurred as a result of a one-year lag in applying a change in coding rules.
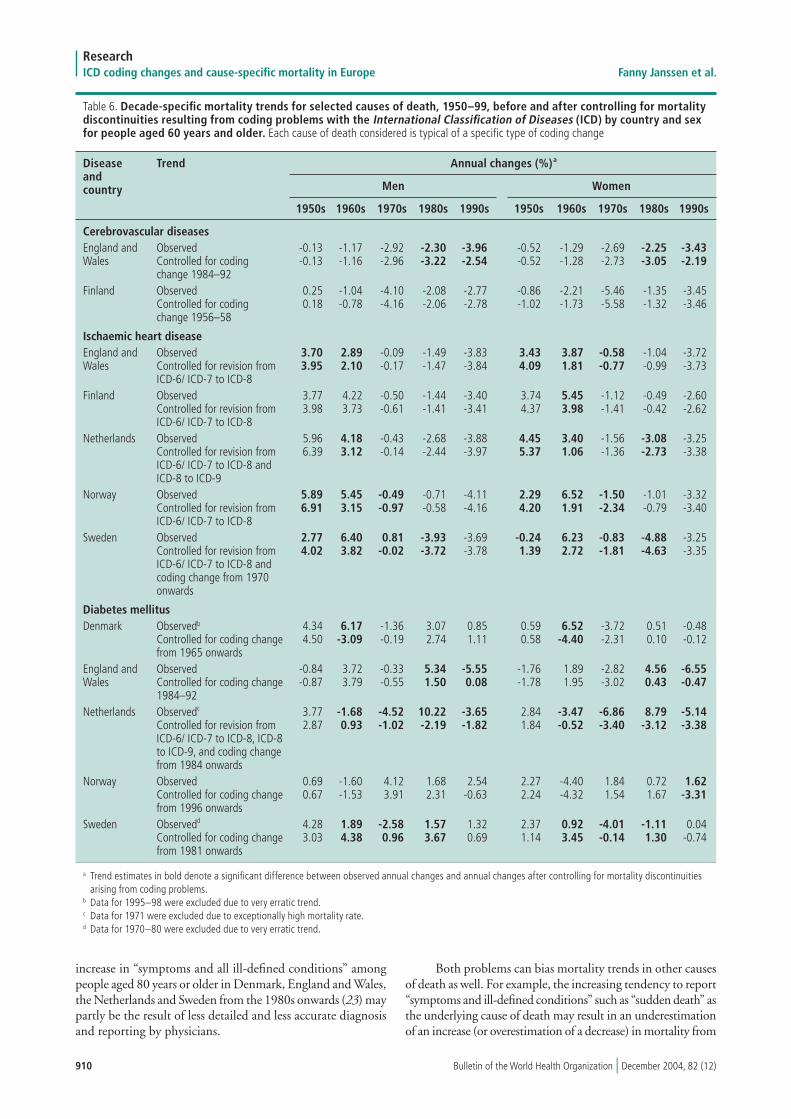
For cerebrovascular diseases, controlling for the incidental change in the coding rules in England and Wales (1984–92) and Finland (1956–58) led to significant changes in annual decade-specific mortality in England and Wales in the 1980s and 1990s, but a change in trend did not occur in Finland in the 1950s (Table 6). A change in trend also occurred for other
causes of death subject only to incidental changes (i.e. most specific cancers, chronic obstructive pulmonary disease and accidental falls). The changes, however, were often insignifi-cant, and the major changes were restricted to a limited period (data not shown).
For ischaemic heart disease, the revision from ICD-6 and ICD-7 to ICD-8 led to a significantly altered description of the mortality trend in all countries in the 1960s, and sometimes also affected the trends in the 1950s or the 1970s, or both. Control-ling mainly for ICD revisions also led to significant changes in mortality trends for infectious diseases and unspecified cancers, although they were less pronounced (data not shown).
For diabetes mellitus, controlling for a large number of mortality discontinuities changed the mortality trends signifi-cantly, affecting the annual changes not only in size but also in direction in a number of decades, especially in the Netherlands and Sweden. Controlling for a combination of different coding problems also led to a significant change in almost the entire trend for dementia, other heart diseases and pneumonia (data not shown).
DiscussionDespite using a concordance table based on three-digit ICD codes, in 10.8% of the revisions to codes for cause-specific mortality, significant discontinuities, regarded as being due to ICD revisions, remained. Especially affected were the revisions from ICD-6 and ICD-7 to ICD-8 and a wide range of causes of death, with the exception of the specific cancers. Incidental changes in coding rules were important causes of disconti-nuities in cause-specific mortality trends as well, especially in England and Wales, Finland and Sweden. Adjusting for these discontinuities can lead to significant changes in trends in cause-specific mortality, although these primarily affect only limited periods of time.
The range in differences between countries in terms of ICD-related mortality discontinuities (1.9 % for Denmark to 16.7 % for the Netherlands) could partly be due to an under-estimation of the percentage for Denmark caused by the lack of implementation of ICD-9. As for the revision of ICD-8 to ICD-9, in general fewer mortality discontinuities were observed. However, it is most likely that the differences between countries are related to differences in applying the ICD revisions.
Evaluation of data and methodsIn this paper we developed a method to evaluate and adjust for mortality discontinuities caused by coding problems. A major advantage of our method when compared to the bridge coding
908 Bulletin of the World Health Organization | December 2004, 82 (12)
ResearchICD coding changes and cause-specific mortality in Europe Fanny Janssen et al.
Table 3. Mortality discontinuities by country, cause of death and revision of International Classification of Diseases (ICD) for men and women aged 60 years and older, 1950–99a
Cause of death ICD revision Transition rateb
Denmarkc England Finland Netherlands Norway Sweden and Wales
Infectious diseases 6/7 to 8 1.56 0.83 1.23 1.74 1.74 1.32 8 to 9 —d 1.07 NSe NS NS NS 9 to 10 NS — 1.20 NS NS 1.12
Cancer of the oesophagus 6/7 to 8 NS NS NS NS NS NS 8 to 9 — NS NS NS NS NS 9 to 10 NS — NS NS NS NS
Cancer of the stomach 6/7 to 8 NS NS NS 0.93 0.93 NS 8 to 9 — NS NS NS NS NS 9 to 10 NS — NS NS NS NS
Cancer of the colorectum 6/7 to 8 NS 1.05 NS NS 0.92 1.07 8 to 9 — 0.97 NS NS NS NS 9 to 10 NS — NS NS NS NS
Cancer of the pancreas 6/7 to 8 NS NS NS NS NS NS 8 to 9 — NS NS NS NS NS 9 to 10 NS — NS NS NS NS
Cancer of the upper 6/7 to 8 NS 1.07 NS NS NS NS respiratory tract 8 to 9 — 1.04 NS NS NS NS 9 to 10 NS — NS NS NS NS
Cancer of the lung 6/7 to 8 NS 0.98 NS 0.96 NS 1.06 8 to 9 — NS NS 0.97 NS NS 9 to 10 1.06 — NS NS NS NS
Cancer of the breast 6/7 to 8 NS NS NS 0.95 0.90 1.15 8 to 9 — NS NS NS NS NS 9 to 10 NS — NS NS NS NS
Cancer of the prostate 6/7 to 8 NS NS 1.15 0.88 NS 1.13 8 to 9 — NS NS NS NS NS 9 to 10 NS — NS 0.93 NS 1.05
Cancer of the bladder 6/7 to 8 NS NS NS NS NS NS 8 to 9 — 0.96 NS NS NS NS 9 to 10 NS — 0.81 NS NS NS
Cancer of the kidney 6/7 to 8 1.15 NS NS 0.90 NS 1.21 8 to 9 — NS NS NS NS NS 9 to 10 NS — NS NS NS NS
Cancers, unspecified 6/7 to 8 0.77 1.07 NS 1.39 1.47 1.18 8 to 9 — 1.24 0.89 0.83 1.11 NS 9 to 10 0.90 — NS 1.05 0.88 1.06
Other cancers 6/7 to 8 NS 0.98 0.93 0.85 0.89 1.03 8 to 9 — 0.99 NS 1.03 NS 1.07 9 to 10 NS — NS NS 1.08 NS
Diabetes mellitus 6/7 to 8 NS NS NS 0.67 NS 0.90 8 to 9 — 0.92 1.30 0.82 NS NS 9 to 10 0.84 — NS 1.20 NS NS
Dementia and Alzheimer 6/7 to 8 0.96 0.92 0.64 0.78 NS NS disease 8 to 9 — 1.92 0.93 0.55 1.91 1.48 9 to 10 1.05 — 1.37 0.73 NS 1.27
Ischaemic heart disease 6/7 to 8 0.87 1.12 1.08 1.13 1.32 1.23 8 to 9 — 0.95 NS 0.94 NS 0.93 9 to 10 0.97 — 0.94 NS NS 0.97
Other heart diseases 6/7 to 8 0.73 0.76 0.68 0.83 0.50 0.51 8 to 9 — 1.18 0.96 1.20 NS 1.29 9 to 10 1.10 — 1.06 0.89 NS 1.07
Cerebrovascular diseases 6/7 to 8 0.91 1.03 0.88 NS 1.03 NS 8 to 9 — 0.99 0.93 0.97 NS NS 9 to 10 0.95 — NS 0.94 NS 1.05
909Bulletin of the World Health Organization | December 2004, 82 (12)
Research Fanny Janssen et al. ICD coding changes and cause-specific mortality in Europe
(Table 3, cont.)
Cause of death ICD revision Transition rateb
Denmarkc England Finland Netherlands Norway Sweden and Wales
Other circulatory diseases 6/7 to 8 1.11 1.12 1.14 1.43 1.09 0.95 8 to 9 — 0.89 NS 0.92 0.89 NS 9 to 10 0.92 — 1.17 NS NS NS
Pneumonia/influenza 6/7 to 8 0.94 1.19 1.53 2.08 1.14 NS 8 to 9 — 0.95 NS NS NS 0.84 9 to 10 0.77 — NS 0.89 0.62 0.82
Chronic obstructive 6/7 to 8 0.77 0.99 0.87 0.86 NS 0.83 pulmonary disease 8 to 9 — 1.17 0.93 0.86 NS NS 9 to 10 NS — 1.14 1.08 NS NS
Senility 6/7 to 8 0.83 NS 0.76 1.06 0.84 NS 8 to 9 — 0.82 0.58 0.69 NS NS 9 to 10 0.86 — NS 0.93 0.76 NS
Other symptoms and 6/7 to 8 NS 1.68 NS 1.13 0.90 0.74 ill-defined conditions 8 to 9 — 0.31 0.51 0.47 1.10 NS 9 to 10 NS — NS 1.15 0.70 2.04
Other diseases 6/7 to 8 0.80 NS 0.82 NS 0.89 NS 8 to 9 — NS 1.18 1.25 NS 1.15 9 to 10 1.05 — 0.83 0.98 1.09 0.92
Accidental fall 6/7 to 8 0.84 1.13 NS 0.94 NS 1.41 8 to 9 — 0.96 NS NS NS 1.16 9 to 10 NS — 1.15 NS 1.11 1.38
Other external causes 6/7 to 8 NS 0.91 NS NS NS NS 8 to 9 — 1.10 1.22 NS NS 0.94 9 to 10 NS — NS NS 1.18 NS
a Values in bold indicate that the mortality discontinuity cannot be attributed to non-linear trends or a single outlier.b The relative size of the increase or lowering of the fitted mortality rate for the period immediately after the coding change compared with the mortality rate immediately before.c For Denmark the ICD revision 9 to 10 is actually from ICD-8 to ICD-10; ICD-9 was not used.d — = not applicablee NS = parameter estimate is not significant.
method (2) is that our method can detect incidental changes in coding rules. In comparison to the method developed by Vallin & Meslé our method can be easily applied to other countries and can be extended to new ICD revisions fairly easily. More-over, estimates of discontinuities observed using our method can easily be taken into account in trend analyses using regres-sion or related techniques.
Inherent in our adjustment method is the assumption that the relative increase or decrease in mortality is equal in all years prior to or after the transition. For ischaemic heart disease, however, inclusion of code 422.1 in ICD-6 and ICD-7 for England and Wales and Norway, which was done to ensure better comparability with codes in ICD-8 (22), gave different results than our adjustment, primarily due to a change in the frequency of use of this code throughout ICD-6 and ICD-7. Although we could not explicitly check this assumption for other causes of death, note that the mortality discontinuity for ischaemic heart disease that appeared during the transition to ICD-8 is much more pronounced in absolute terms than the transitions for other causes of death.
The transition coefficients we found for people aged 60 and older cannot be applied directly to other age groups. A comparison of the transition rates for people aged 60 and 80 yielded changes greater than 10% in almost half of the cases (data not shown). Therefore, adjustment should be age-specific.
Persisting problems in studies of long-term mortality trendsThe comparability of cause of death statistics over time is af-fected not only by ICD revisions or incidental changes in coding rules but also by changes in the reporting of the cause of death on death certificates and by changes in the number of deaths from ill-defined causes and other unspecified causes (1, 4).
Changes in the reporting of causes of death on the death certificate may be the result of developments in medical science or the use of new diagnostic techniques as well as changes in concepts of diseases (1). For example, a growing propensity for physicians to report dementia as an underlying cause of death may have contributed to the large annual increases in mortality from “dementia and Alzheimer disease” among elderly people aged 80 years and older in a number of north-western European countries in the 1980s and 1990s (23). Part of the increase in mortality rates from chronic obstructive pulmonary disease may be the result of increased diagnosis and changes in how physicians code for the disease (24, 25).
An increase in the number of deaths from “symptoms and ill-defined conditions” may be the result of both stricter diagnostic criteria for a given specific disease and a real increase in unknown causes (26). However, mortality trends in “symp-toms and ill-defined conditions” are also often closely related to the quality and the accuracy of the diagnosis (1, 26) (F. Meslé, unpublished data presented October 2000). For example, the
910 Bulletin of the World Health Organization | December 2004, 82 (12)
ResearchICD coding changes and cause-specific mortality in Europe Fanny Janssen et al.
Table 6. Decade-specific mortality trends for selected causes of death, 1950–99, before and after controlling for mortality discontinuities resulting from coding problems with the International Classification of Diseases (ICD) by country and sex for people aged 60 years and older. Each cause of death considered is typical of a specific type of coding change
Trend Annual changes (%)a
Men Women
1950s 1960s 1970s 1980s 1990s 1950s 1960s 1970s 1980s 1990s
Cerebrovascular diseases England and Observed -0.13 -1.17 -2.92 -2.30 -3.96 -0.52 -1.29 -2.69 -2.25 -3.43 Wales Controlled for coding -0.13 -1.16 -2.96 -3.22 -2.54 -0.52 -1.28 -2.73 -3.05 -2.19 change 1984–92Finland Observed 0.25 -1.04 -4.10 -2.08 -2.77 -0.86 -2.21 -5.46 -1.35 -3.45 Controlled for coding 0.18 -0.78 -4.16 -2.06 -2.78 -1.02 -1.73 -5.58 -1.32 -3.46 change 1956–58
Ischaemic heart disease England and Observed 3.70 2.89 -0.09 -1.49 -3.83 3.43 3.87 -0.58 -1.04 -3.72 Wales Controlled for revision from 3.95 2.10 -0.17 -1.47 -3.84 4.09 1.81 -0.77 -0.99 -3.73 ICD-6/ ICD-7 to ICD-8Finland Observed 3.77 4.22 -0.50 -1.44 -3.40 3.74 5.45 -1.12 -0.49 -2.60 Controlled for revision from 3.98 3.73 -0.61 -1.41 -3.41 4.37 3.98 -1.41 -0.42 -2.62 ICD-6/ ICD-7 to ICD-8Netherlands Observed 5.96 4.18 -0.43 -2.68 -3.88 4.45 3.40 -1.56 -3.08 -3.25 Controlled for revision from 6.39 3.12 -0.14 -2.44 -3.97 5.37 1.06 -1.36 -2.73 -3.38 ICD-6/ ICD-7 to ICD-8 and ICD-8 to ICD-9Norway Observed 5.89 5.45 -0.49 -0.71 -4.11 2.29 6.52 -1.50 -1.01 -3.32 Controlled for revision from 6.91 3.15 -0.97 -0.58 -4.16 4.20 1.91 -2.34 -0.79 -3.40 ICD-6/ ICD-7 to ICD-8Sweden Observed 2.77 6.40 0.81 -3.93 -3.69 -0.24 6.23 -0.83 -4.88 -3.25 Controlled for revision from 4.02 3.82 -0.02 -3.72 -3.78 1.39 2.72 -1.81 -4.63 -3.35 ICD-6/ ICD-7 to ICD-8 and coding change from 1970 onwards
Diabetes mellitus Denmark Observedb 4.34 6.17 -1.36 3.07 0.85 0.59 6.52 -3.72 0.51 -0.48 Controlled for coding change 4.50 -3.09 -0.19 2.74 1.11 0.58 -4.40 -2.31 0.10 -0.12 from 1965 onwardsEngland and Observed -0.84 3.72 -0.33 5.34 -5.55 -1.76 1.89 -2.82 4.56 -6.55 Wales Controlled for coding change -0.87 3.79 -0.55 1.50 0.08 -1.78 1.95 -3.02 0.43 -0.47 1984–92 Netherlands Observedc 3.77 -1.68 -4.52 10.22 -3.65 2.84 -3.47 -6.86 8.79 -5.14 Controlled for revision from 2.87 0.93 -1.02 -2.19 -1.82 1.84 -0.52 -3.40 -3.12 -3.38 ICD-6/ ICD-7 to ICD-8, ICD-8 to ICD-9, and coding change from 1984 onwardsNorway Observed 0.69 -1.60 4.12 1.68 2.54 2.27 -4.40 1.84 0.72 1.62 Controlled for coding change 0.67 -1.53 3.91 2.31 -0.63 2.24 -4.32 1.54 1.67 -3.31 from 1996 onwardsSweden Observedd 4.28 1.89 -2.58 1.57 1.32 2.37 0.92 -4.01 -1.11 0.04 Controlled for coding change 3.03 4.38 0.96 3.67 0.69 1.14 3.45 -0.14 1.30 -0.74 from 1981 onwards
a Trend estimates in bold denote a significant difference between observed annual changes and annual changes after controlling for mortality discontinuities arising from coding problems.b Data for 1995–98 were excluded due to very erratic trend.c Data for 1971 were excluded due to exceptionally high mortality rate. d Data for 1970–80 were excluded due to very erratic trend.
Disease and country
increase in “symptoms and all ill-defined conditions” among people aged 80 years or older in Denmark, England and Wales, the Netherlands and Sweden from the 1980s onwards (23) may partly be the result of less detailed and less accurate diagnosis and reporting by physicians.
Both problems can bias mortality trends in other causes of death as well. For example, the increasing tendency to report “symptoms and ill-defined conditions” such as “sudden death” as the underlying cause of death may result in an underestimation of an increase (or overestimation of a decrease) in mortality from
911Bulletin of the World Health Organization | December 2004, 82 (12)
Research Fanny Janssen et al. ICD coding changes and cause-specific mortality in Europe
cardiovascular diseases (26). Unfortunately, there are no formal methods that can be used to cope with changes in the reporting of causes of death on the death certificate because they result in gradual shifts that are difficult to detect and quantify (4). The number of deaths attributed to ill-defined or unknown causes are increasingly being redistributed by researchers among spe-cific causes (5, 27). This applies especially to heart disease; it is less common for cancer-related deaths (F. Meslé, unpublished data presented October 2000). However, it remains unclear whether these reclassifications, which are based on assumptions about, among others, the distribution of ill-defined or unknown causes among specific causes of death, actually lead to improve-ments in assessing long-term trends in cause-specific mortality. Aggregating ill-defined causes of death with specific causes probably will improve the comparability of data over time but information on specific causes of death will be lost, and this may be an unacceptable loss in many cases.
ConclusionsWhen describing long-term trends in cause-specific mortality, evaluating and adjusting for mortality discontinuities caused by coding changes between and within ICD revisions is essential because these changes can substantially bias the description and analysis of cause-specific trends in mortality. An accurate and fairly easy method for evaluating and adjusting for these coding-related mortality discontinuities has been proposed in this paper — that is, a combination of visual inspection of the
trends and the use of a formal regression method after applica-tion of a concordance table based on three-digit ICD codes. The other problems that remain when studying long-term trends in cause-specific mortality, such as changes in the reporting of causes of death by physicians, should always be taken into account when interpreting these trends. O
AcknowledgementsWe are grateful to Hilkka Ahonen (Statfin, Finland), Annika Edberg (National Board of Health and Welfare, Sweden), Örjan Hemström (Sweden), Allan Baker and Glenn Meredith (ONS, England and Wales), Knud Juel (National Institute of Public Health, Denmark), and Jens-Kristian Borgan and Anne Gro Pedersen (Statistics Norway) for providing data on cause-specific mortality and population data and for giving useful information on national coding practices. We gratefully thank James Vaupel and Vladimir Shkolnikov (Max-Planck Institute for Demographic Research) for the use of the Kannisto-Thatcher Database on Old Age Mortality.
The Netherlands Epidemiology and Demography Com-pression of Morbidity research group also includes J. Barendregt, L. Bonneux, C. de Laet, J.P. Mackenbach, W. Nusselder, A. Peeters, A. Al Mamun, and F. Willekens.
Funding: This project is financed by the Netherlands Orga-nization for Scientific Research.
Conflicts of interest: none declared.
Résumé
Modifications de la codification selon la Classification internationale des maladies (CIM) et discontinuités des tendances de la mortalité par cause dans six pays européens, 1950-99Objectif Évaluer la manière dont les fréquentes modifications de la codification entre les révisions de la Classification internationale des maladies (CIM) et au cours de celles-ci compliquent la description des tendances à long terme de la mortalité par cause.Méthodes Des données relatives à la mortalité par cause des hommes et des femmes de 60 ans et plus entre 1950 et 1999 ont été obtenues auprès de l’Angleterre et du Pays de Galles, du Danemark, de la Finlande, de la Norvège, des Pays-Bas et de la Suède. Ces données ont été fournies par tranche d’âge de cinq ans. Les auteurs ont construit un tableau de concordance à l’aide des codes CIM à trois caractères. Ils ont également évalué l’apparition de discontinuités de la mortalité en examinant visuellement les tendances de la mortalité par cause et les informations générales particulières aux différents pays. L’évaluation a aussi été réalisée à partir d’une quantification des discontinuités par un modèle de régression de Poisson (comprenant des fonctions splines périodiques). Les auteurs ont comparé les tendances observées pour la mortalité par cause avec les tendances de cette mortalité après ajustement pour les discontinuités provoquées par les modifications de codification.
Résultats Dans 45 des 416 cas (10,8 %) de révision de la CIM portant sur les codes de mortalité par cause, il est resté des discontinuités importantes, qui ont été considérées comme dues aux révisions de la CIM. Les révisions de la CIM-6 et des CIM-7 et CIM-8, ainsi qu’une large palette de causes de décès, à l’exception des cancers spécifiques, étaient particulièrement concernées. Des modifications imprévues des règles de codification ont constitué également d’importantes causes de discontinuité dans les tendances de la mortalité par cause, notamment en Angleterre et au Pays de Galles, en Finlande et en Suède. L’ajustement pour tenir compte de ces discontinuités peut conduire à des variations notables des tendances, bien que ces variations n’affectent principalement que des périodes de temps limitées.Conclusion En dépit du tableau de concordance soigneusement établi à partir des codes CIM à trois caractères, les discontinuités de la mortalité résultant des modifications de codification (tant entre les révisions qu’au cours de celles-ci) peuvent entraîner des variations substantielles des tendances à long terme de la mortalité par cause. Il conviendrait donc que ces modifications de codification soient évaluées par des chercheurs et, si besoin est, prises en compte.
Resumen
Cambios de codificación de la CIE y discontinuidades en las tendencias de la mortalidad por causas específicas en seis países europeos, 1950–1999Objetivo Evaluar con qué frecuencia los cambios de codificación entre y dentro de las revisiones de la Clasificación Internacional
de Enfermedades (CIE) complican la descripción de las tendencias a largo plazo de la mortalidad por causas específicas.
912 Bulletin of the World Health Organization | December 2004, 82 (12)
ResearchICD coding changes and cause-specific mortality in Europe Fanny Janssen et al.
References 1. Alter G, Carmichael A. Studying causes of death in the past: problems and models. Historical Methods 1996;29:44-8. 2. Anderson RN, Minino AM, Hoyert DL, Rosenberg HM. Comparability of cause of death between ICD-9 and ICD-10: preliminary estimates. National Vital Statistics Report 2001;49:1-32. 3. Meslé F, Vallin J. Causes de décès: de la 8e à la 9e révision, deux cas différents, la France et l’Angleterre [Causes of death: from the eighth to the ninth revision, two different cases, France and England]. In: Blum A, Rallu J-L, editors. European Population: Demographic Dynamics. Vol II. Paris: John Libbey/INED; 1993. p. 421-45. In French. 4. Meslé F, Vallin J. Reconstructing long-term series of causes of death — the case of France. Historical Methods 1996;29:72-87. 5. Vallin J, Meslé F. Les causes de décès en France de 1925 à 1978 [Causes of death in France from 1925 to 1978]. Paris: INED, PUF; 1988. In French. 6. Vallin J, Meslé F. Les causes de décès en France depuis 1925 [Causes of death in France since 1925]. Available from: http://matisse.ined.fr/%7 Etania/causfra/data/. In French.
7. Wolleswinkel-van den Bosch JH, van Poppel FW, Mackenbach JP. Reclassifying causes of death to study the epidemiological transition in the Netherlands, 1875-1992. European Journal of Population/Revue Européenne de Démographie 1996;12:327-61. 8. Juel K, Bjerregaard P, Madsen M. Mortality and life expectancy in Denmark and in other European countries. What is happening to middle- aged Danes? European Journal of Public Health 2000;10:93-100. 9. Nusselder WJ, Mackenbach JP. Lack of improvement of life expectancy at advanced ages in the Netherlands. International Journal of Epidemiology 2000;29:140-8. 10. La Vecchia C, Lucchini F, Negri E, Boyle P, Maisonneuve P, Levi F. Trends of cancer mortality in Europe, 1955-1989. I. Digestive sites. European Journal of Cancer 1992;28:132-8. 11. Kannisto V. Development of oldest-old mortality, 1950-1990: evidence from 28 developed countries. Odense, Denmark: Odense University Press; 1994.
Métodos Se obtuvieron datos de Dinamarca, Inglaterra y Gales, Finlandia, los Países Bajos, Noruega y Suecia sobre la mortalidad por causas específicas de hombres y mujeres de 60 y más años entre 1950 y 1999. Los datos correspondían a grupos de edad de cinco años. Construimos un cuadro de concordancia con los códigos de tres dígitos de la CIE. Además evaluamos la aparición de discontinuidades de la mortalidad examinando visualmente las tendencias por causas específicas y los antecedentes propios de cada país. Como parte de la evaluación, asimismo, se cuantificaron las discontinuidades mediante el modelo de regresión de Poisson (incluida interpolación polinómica). Comparamos las tendencias observadas en la mortalidad por causas específicas con las tendencias obtenidas tras ajustar en función de las discontinuidades causadas por los cambios de codificación.Resultados De 416 casos de revisión de la CIE que afectaban a códigos de mortalidad por causas específicas, en 45 (10,8%) seguía habiendo discontinuidades significativas que se atribuyeron a las revisiones de la CIE. El problema se centraba especialmente
en los cambios introducidos entre las clasificaciones CIE-6 y CIE-7 y la CIE-8 y en una amplia variedad de causas de defunción, exceptuando cánceres específicos. Algunos cambios secundarios de las reglas de codificación eran también una causa importante de discontinuidad en las tendencias de la mortalidad por causas específicas, sobre todo en Inglaterra y Gales, Finlandia y Suecia. El ajuste para estas discontinuidades puede alterar notablemente las tendencias, aunque la mayoría de los cambios afectan sólo a periodos limitados.Conclusión Pese a usar un cuadro de concordancia cuidadosamente elaborado con los códigos de tres dígitos de la CIE, las discontinuidades de la mortalidad resultantes de los cambios de codificación (tanto entre revisiones como dentro de ellas) pueden modificar sustancialmente las tendencias a largo plazo de la mortalidad por causas específicas. Por consiguiente, es preciso que los investigadores evalúen los cambios de codificación y que cuando sea necesario controlen ese factor.
913Bulletin of the World Health Organization | December 2004, 82 (12)
Research Fanny Janssen et al. ICD coding changes and cause-specific mortality in Europe
12. Vallin J, Meslé F. Les causes de décès [Causes of death]. Available from: http://www-deces.ined.fr. In French. 13. Statistics Finland. Causes of death 1969–2002, 20 October 2003. Available from: http://statfin.stat.fi/statweb/start.asp?LA=en&DM=SLE N&lp=catalog&clg=health 14. World Health Organization. Manual of the international statistical classification of diseases, injuries and causes of death: seventh revision. Geneva: WHO; 1957. 15. World Health Organization. Manual of the international statistical classification of diseases, injuries and causes of death: eighth revision. Geneva: WHO; 1967. 16. World Health Organization. Manual of the international statistical classification of diseases, injuries and causes of death: ninth revision. Geneva: WHO; 1977. 17. World Health Organization. Manual of the international statistical classification of diseases, injuries and causes of death: tenth revision. Geneva:WHO; 1993. 18. World Health Organization. ICD-9 ↔ ICD-10. International Classification of Diseases: translator ninth and tenth revisions. Geneva: WHO; 1997. 19. McNeil DR, Trussell TJ, Turner JC. Spline interpolation of demographic data. Demography 1977;14:245-52. 20. Janssen F, Nusselder WJ, Looman CWN, Mackenbach JP, Kunst AE. Stagnation in mortality decline among elders in the Netherlands. Gerontologist 2003;43:722-34. 21. Office of Population Censuses and Surveys. Mortality statistics: causes
1993/94. London: Office of Population Censuses and Surveys; 1995. 22. Mackenbach JP, Looman CW, Kunst AE. Geographic variation in the onset of decline of male ischemic heart disease mortality in the Netherlands. American Journal of Public Health 1989;79:1621-7. 23. Janssen F, Mackenbach JP, Kunst AE. Trends in old-age mortality in seven European countries, 1950-1999. Journal of Clinical Epidemiology 2004;57:203-16. 24. Thom TJ. International comparisons in COPD mortality. American Review of Respiratory Disease 1989;140 Suppl 3:S27-34. 25. Marcus EB, Buist AS, Maclean CJ, Yano K. Twenty-year trends in mortality from chronic obstructive pulmonary disease: the Honolulu Heart Program. American Review of Respiratory Disease 1989;140 Suppl 3:S64-68. 26. Juel K, Sjol A. Decline in mortality from heart disease in Denmark: some methodological problems. Journal of Clinical Epidemiology 1995;48:467-72. 27. Lozano R, Murray CJL, Lopez AD, Satoh T. Miscoding and misclassification of ischaemic heart disease mortality. Geneva: World Health Organization; 2001 (Global Programme on Evidence for Health Policy, Working Paper No. 12). 28. Mackenbach JP, Snels IA, Friden-Kill LM. Nederlands Tijdschrift voor Geneeskkunde [Diabetes mellitus as cause of death]. 1991;135:1492-96. In Dutch.
ABulletin of the World Health Organization | December 2004, 82 (12)
Research Fanny Janssen et al. ICD coding changes and cause-specific mortality in Europe
Table 4. Significant mortality discontinuities resulting from generally applied changes in coding rules in the International Classification of Diseases, 1950–99 by cause of death for men and women aged 60 years and oldera
Cause of death Transition Rateb,c
England and Wales, 1984–92 Sweden from 1981 onwards
Infectious diseases 1.11 NSCancer of the oesophagus NSd NSCancer of the stomach 1.03 NSCancer of the colorectum 1.03 0.89Cancer of the pancreas 1.04 NSCancer of the upper respiratory tract NS 0.84Cancer of the lung 1.02 0.93Cancer of the breast 1.05 NSCancer of the prostate NS 0.77Cancer of the bladder NS 0.85Cancer of the kidney 1.04 0.87Cancers, unspecified 0.96 1.07Other cancers 1.05 0.86Diabetes mellitus 1.45 0.50Dementia and Alzheimer disease 2.18 1.57Ischaemic heart disease 1.01 NSOther heart diseases 0.87 1.54Cerebrovascular diseases 1.08 0.96Other circulatory diseases 0.90 1.27Pneumonia/influenza 0.52 1.28Chronic obstructive pulmonary disease 1.08 0.86Senility 0.80 NSOther symptoms and ill-defined conditions NS 1.39Other diseases 1.23 0.86Accidental fall 1.03 0.53Other external causes 1.07 0.91
a Table shows discontinuities at 95% significance.b The relative size of the increase or lowering of the fitted mortality rate for the period immediately after or during the coding change compared with the mortality rate immediately before or adjacent to the coding change. c Values in bold indicate that mortality discontinuity cannot be attributed to non-linear trends or a single outlier.d NS = parameter estimate is not significant.
B Bulletin of the World Health Organization | December 2004, 82 (12)
ResearchICD coding changes and cause-specific mortality in Europe Fanny Janssen et al.
Table 5. Cause-specific mortality discontinuities resulting from incidental changes in coding rules in the International Classification of Diseases, 1950–99, for men and women aged 60 years and older, by country
Country Cause of death Period Cause of irregularity Transition ratea
Denmark Diabetes mellitus 1965 onwards Less restrictive practice in coding diabetes as the 2.30 underlying cause of death from 1965 onwardsb
Denmark Other diseases 1965 onwards Less restrictive practice in coding diabetes as the 0.95 underlying cause of death from 1965 onwardsb
England and Diabetes mellitus 1984 One-year lag in change in coding rule 1984–92 0.90 WalesFinland Infectious diseases 1956–58 Change in coding rule 1.21Finland Dementia and 1956–58 Change in coding rule 0.00 Alzheimer diseaseFinland Other heart diseases 1956–58 Change in coding rule 0.85Finland Cerebrovascular diseases 1956–58 Change in coding rule 1.14Finland Other circulatory diseases 1962 onwards Change in coding rule 1.52Finland Other circulatory diseases 1962 One-year lag in change in coding rule from 0.87 1962 onwardsFinland COPDc 1956–58 Change in coding rule 1.43Finland Other diseases 1956–58 Change in coding rule 1.21Netherlands Diabetes mellitus 1984 onwards More strict application of the ICD rule that codes 2.70 diabetes as an underlying cause when circulatory diseases are intermediate causes (28)Netherlands Diabetes mellitus 1984 One-year lag in change in coding rule from 1984 onwards 0.47Netherlands Diabetes mellitus 1985 Lag in change in coding rule from 1984 onwards 0.67Norway Diabetes mellitus 1997 onwards From 1997 onwards Statistics Norway asked for additional 1.43 information when diabetes mellitus was unspecified (i.e. type, complication, duration and whether it should be the underlying cause of death). This led to more specific diagnoses and to diabetes being coded more often as the underlying cause of deathd Norway Dementia and 1986 One-year lag in the introduction of ICD-9 0.82 Alzheimer diseaseSweden Ischaemic heart disease 1970 onwards Change in coding rule 1.08Sweden Ischaemic heart disease 1970 One-year lag in change in coding rule from 1970 onwards 0.93Sweden Other heart diseases 1970 onwards Change in coding rule 0.56Sweden Pneumonia/influenza 1970 onwards Change in coding rule 0.38Sweden Pneumonia/influenza 1970 One-year lag in change in coding rule from 1970 onwards 1.83Sweden Accidental fall 1981 One-year lag in change in coding rule from 1981 onwards 1.29
a The relative size of the increase or lowering of the fitted mortality rate for the period immediately after or during the coding change compared with the mortality rate immediately before or adjacent to the coding change.b Background information derived from personal communication with Knud Juel (National Institute of Public Health, Denmark).c COPD = chronic obstructive pulmonary disease.d Background information derived from personal communication with Anne Gro Pedersen (Statistics Norway).


![[Read from slide.] - Rethink Obesity · 2020-07-17 · Reference 1. Prospective Studies Collaboration, Whitlock G, Lewington S, et al. Body-mass index and cause-specific mortality](https://img.pdfslide.us/doc/110x75/5f6340d3c6f58b297158cd30/read-from-slide-rethink-obesity-2020-07-17-reference-1-prospective-studies.jpg)