Embed Size (px)
Citation preview

Radar observations and a physical model of contact binary Asteroid 4486 Mithra
Marina Brozovic a,*, Lance A.M. Benner a, Christopher Magri b, Steven J. Ostro a, Daniel J. Scheeres c,Jon D. Giorgini a, Michael C. Nolan d, Jean-Luc Margot e, Raymond F. Jurgens a, Randy Rose a
a Jet Propulsion Laboratory, California Institute of Technology, Pasadena, CA 91109-8099, USAbUniversity of Maine at Farmington, Preble Hall, Farmington, ME 04938, USAcAerospace Engineering Sciences, University of Colorado, Boulder, CO 80309-0429, USAdArecibo Observatory, National Astronomy and Ionosphere Center, Arecibo, PR 00613, USAeDepartment of Earth and Space Sciences, University of California, Los Angeles, CA 90095-1567, USA
a r t i c l e i n f o
Article history:Received 14 September 2009Revised 3 January 2010Accepted 31 January 2010Available online 7 February 2010
Keywords:Radar observationsAsteroids
a b s t r a c t
Arecibo (2380 MHz, 12.6 cm) and Goldstone (8560 MHz, 3.5 cm) delay-Doppler radar images obtained inJuly and August of 2000 reveal that 4486 Mithra is an irregular, significantly bifurcated object, with a cen-tral valley !380 m deep and a long axis potentially exceeding 2 km. With its bimodal appearance, Mithrais a strong candidate for a contact binary asteroid. Sequences of Goldstone images spanning up to 3 h perday show very little rotation and establish that Mithra is an unusually slow rotator. We used Goldstoneand Arecibo data to estimate Mithra’s 3D shape and spin state. We obtain prograde (k = 337!, b = 19!) andretrograde (k = 154!, b = "19!) models that give comparable fits, have very similar shapes roughly resem-bling an hourglass, and have a rotation period of 67.5 ± 6.0 h. The dimensions of these two modelsare very similar; for the prograde solution the maximum dimensions are X = 2.35 ± 0.15 km,Y = 1.65 ± 0.10 km, Z = 1.44 ± 0.10 km. Dynamical analysis of our models suggests that in the past, Mithramost likely went through a period of even slower rotation with its obliquity close to 90!. The spin rate ispredicted to be increasing due to thermal torque (YORP), while the obliquity, which is currently +68! and+106! for the prograde and retrograde models, respectively, is predicted to move away from 90!.
" 2010 Elsevier Inc. All rights reserved.
1. Introduction
4486 Mithra (1987 SB) was discovered on September 22, 1987by E. Elst, V. Ivanova, and V. Shkodrov at the Bulgarian NationalObservatory in Smolyan. Mithra (a = 2.20 AU, e = 0.66, i = 3.0!) be-longs to the Apollo class and it crosses the orbits of both Earthand Mars. Its perihelion lies just outside the orbit of Venus, so italso makes close approaches (<0.02 AU) to this planet. Mithra hasan absolute magnitude of 15.6, suggesting a diameter of roughly2 km, but otherwise its physical properties are unknown. No light-curves have been reported and the taxonomic class is unknown.Here we report radar images and shape modeling of Mithra that re-veal one of the most bifurcated and irregular shapes seen to date inthe near-Earth population.
2. Observations and data reduction
Radar observations involve transmission of a circularly polar-ized signal and reception of echoes in the same and opposite circu-
lar polarizations (SC and OC). The duration of each transmit–receive cycle (or ‘‘run”) is determined by the target’s distance. Eachrun can be analyzed as a sum of some number of statistically inde-pendent measurements or ‘‘looks” (Ostro, 1993; Magri et al., 2007).The data from different looks are combined in incoherent sums inorder to reduce the fractional noise fluctuation by
!!!!!!!!!!!Nlooks
p.
We observed Mithra at Arecibo and Goldstone on eight datesduring July and August 2000. Table 1 summarizes the radar obser-vations. The subradar latitude (angular distance from the asteroid’sequatorial plane to the radar line of sight) was changing from dayto day as Mithra traversed !34! on the sky from July 22 to August9. At the time of the Arecibo observations, Mithra was still rela-tively distant (>0.18 AU) and we initially estimated that signal-to-noise ratios (SNRs) might be !40 per day. However, the SNRsturned out to be much higher: several hundred per day. After July30 Mithra moved too far south for Arecibo to track. Goldstone wasable to observe Mithra at much closer distances as it moved south;our strongest images were obtained on August 9 when Mithra waswithin 0.07 AU and when the SNRs at Goldstone soared to morethan a 1000 per day. After August 10 Mithra moved too far southfor Goldstone to track. Closest approach was on August 14 at0.0465 AU when Mithra was at a declination of "69!.
Fig. 1A shows continuous-wave (CW, Doppler-only) echo powerspectra obtained at Arecibo (S-band, 2380 MHz) and Fig. 1B shows
0019-1035/$ - see front matter " 2010 Elsevier Inc. All rights reserved.doi:10.1016/j.icarus.2010.01.035
* Corresponding author. Address: Mail Stop 301-121, Jet Propulsion Laboratory,California Institute of Technology, Pasadena, CA 91109-8099, USA. Fax: +1 818 3937116.
E-mail address: [email protected] (M. Brozovic).
Icarus 208 (2010) 207–220
Contents lists available at ScienceDirect
Icarus
journal homepage: www.elsevier .com/locate / icarus
a single Goldstone CW spectrum (X-band, 8560 MHz) from August6. Mithra’s OC echoes are obviously stronger than its SC echoes,although the Goldstone SC spectrum appears stronger than wewould expect based on the Arecibo data if scattering propertiesat 3.5 cm and 12.6 cm were identical. This may indicate higher sur-face roughness on 3.5 cm scales compared to 12.6 cm scales. Mi-thra’s bandwidths are very narrow, !0.2 Hz at Arecibo and!0.8 Hz at Goldstone, suggesting a very slow rotation (period ofdays) and/or close to a pole-on view of the object. The statisticallysignificant dip in the center of the OC spectrum on July 22 (andpossibly July 25) is evidence for a central concavity. The SC/OC ra-tio in the center of the spectrum is higher because of a double-reflection backscatter from two almost perpendicular surfaces atthe center of the object. Similar evidence for a central concavitywas observed in CW spectra of Asteroids 4769 Castalia (Ostroet al., 1990), 3908 Nyx (Benner et al., 2002), and 2063 Bacchus(Benner et al., 1999).
Fig. 2 shows representative delay-Doppler images of Mithrafrom each day. Goldstone delay-Doppler images achieved resolu-tion in range as fine as 0.125 ls (19 m) and we were able to placehundreds of pixels on the object. Table 2 lists the bandwidths andvisible extents obtained by visual inspection of the delay-Dopplerimages where we counted the pixels that we subjectively deemedabove the noise level. If Mithra were a sphere, we would see onlyabout half of the object, so in general, we try to estimate the trueextents by doubling the visible extents. We initially consider thelong axis to be between 1.5 km and 2.5 km. For reasons that willbecome clear shortly, we are confident that Mithra’s subradar lat-itude was at least several tens of degrees from the equator duringour observations.
Mithra looks like a double-lobed object. The valley between thelobes is !380 m deep based on the August 8 images. Images fromJuly 25 and 28 and August 7 and 8 also reveal a short ‘‘bridge” be-tween the lobes whichmakes us confident that the lobes are in con-tact. Images from August 6 contain a radar dark feature (‘‘Feature1”) near the leading edge of the bottom lobe. We suspect it is a con-cavity. ‘‘Feature 2” marks a radar bright area near the leading edge
of the right lobe on August 8. This could be interpreted as some-thing resembling a ‘‘knuckle”. We observe a radar dark formationsimilar to ‘‘Feature 1” on the leading edge of the top lobe on August9 image (‘‘Feature 3”). This could be another concavity. The lobesshow sharp drop-offs on the sides of the echo on August 7 and 8,suggesting flat sides that are almost parallel to the line of sight.
The echo bandwidths (Table 2) are consistently narrow and sug-gest slow rotation, a nearly pole-on view, or both. The bandwidthdecreased between July 22 and August 6, when it reached a mini-mum, remained very narrow on August 7, and then noticeably in-creased between August 7 and 9. Additional evidence for thechange in the subradar latitude is the increase in the distance be-tween the leading edges of the lobes on August 6 (!260 m) and Au-gust 9 (!500 m). This suggests that the subradar point movedtoward the equator after August 7.
The Doppler broadening is given by B = 4pD cos(d)/(kP), where Bis the bandwidth, D is the object’s dimension in the plane of the skyperpendicular to the spin vector, k is radar wavelength, P is the per-iod of rotation, and d is the subradar latitude. We used this equa-tion to constrain Mithra’s period. Due to the irregular shape,individual extents and bandwidths will produce a wide range ofrotation periods. The upper bound on Mithra’s period is establishedby assuming d = 0! (equatorial view). The bandwidths consistentlyimply a period up to several days.
We also investigated whether Mithra’s rotation can be detecteddirectly in the images. Fig. 3 shows two delay-Doppler images fromAugust 8. These images have mean times 2.63 h apart. Drawingwhite parallel lines as a reference highlights the slow rotation.The receding edge moved about 6(±1) rows, each 19 m in rangeor !95–133 m. Let us assume that the arc of the rotation is smallenough during 2.63 h so that the length of the arc is roughly equalto this distance. This gives a tangential velocity of 0.012–0.014 m s"1. Based on the dimensions from Table 2 and on thedepth of the valley between the lobes, we estimate the distanceof the leading edge from the center-of-mass to be !500–700 m.This gives an angular velocity of 4 deg h"1 to 6 deg h"1 and a rota-tion period in the realm of 60–90 h.
Table 1Radar observations of Mithra.
Date Time range (UTC) Obs. Type Resolution Runs RA (!) Declination (!) Distance (AU) Sol Code
START–STOP (ls) (Hz)
July 22 17:41:33–18:27:26 A CW – 0.033 6 152 +6 0.245 13 –19:08:13–19:29:13 A CW – 0.033 3 13 –
July 23 17:47:46–17:51:34 A CW – 0.020 1 152 +6 0.233 15 –17:58:34–18:02:20 A Ranging 4.0 – 1 15 409518:24:09–18:27:55 A Ranging 4.5 – 1 15 4095
July 25 17:32:41–17:36:08 A CW – 0.020 2 152 +4 0.212 17 –17:55:54–18:41:24 A Imaging 0.500 0.030 7 17 65535
July 28 17:27:46–17:30:41 A CW – 0.020 1 152 +2 0.180 19 –17:36:15–18:48:57 A Imaging 0.500 0.030 11 19 65535
August 06 18:49:47–19:18:02 G CW – 0.120 10 149 "14 0.091 24 –20:19:34–20:39:15 G Ranging 10.0 – 7 26 25520:44:42–21:10:17 G Ranging 11.0 – 9 26 25521:33:38–22:11:21 G Imaging 0.250 0.065 13 26 25522:48:08–23:59:19 G Imaging 0.125 0.040 24 26 255
August 07 18:14:18–20:32:27 G Imaging 0.125 0.040 50 148 "17 0.083 26 25520:44:17–21:10:38 G Imaging 0.125 0.040 10 26 255
August 08 18:04:52–19:44:59 G Imaging 0.125 0.040 40 146 "22 0.074 26 25520:01:30–21:05:47 G Imaging 0.125 0.040 26 26 255
August 09 21:21:16–21:26:53 G Imaging 0.125 0.040 3 145 "27 0.067 26 25521:34:59–22:45:23 G Imaging 0.125 0.040 11 26 255
Masterlog of Mithra radar observations. All observing dates refer to 2000. Arecibo and Goldstone observations were done monostatically with average transmitter powers of900 kW at Arecibo and 430 kW at Goldstone. For the imaging data, the echoes were received in SC and OC polarizations at Arecibo and only in the OC polarization atGoldstone. Arecibo observations were in S-band (2380 MHz, 12.6 cm) and Goldstone observations were in X-band (8560 MHz, 3.5 cm). The time range shows the start andend of reception of echoes on each day. The data resolution is given in time delay (ls) and Doppler frequency (Hz). Right ascension, declination, and distance in AU are givenat the beginning of each observation session. We also list the number of transmit–receive cycles (runs) and the orbital solution (sol) used to compute delay-Dopplerephemeris predictions. Code refers to the length of the repeating binary phase code.
208 M. Brozovic et al. / Icarus 208 (2010) 207–220

3. Shape modeling
We used the Shape software to estimate Mithra’s 3D shape andspin state. Shape uses constrained, weighted least squares and theinput data may be delay-Doppler images, CW spectra, optical light-curves, and/or plane-of-sky images. The software was originallywritten by Hudson (1993) and pioneered on 4769 Castalia (Hudsonand Ostro, 1994), 4179 Toutatis (Hudson and Ostro, 1995), and1620 Geographos (Hudson and Ostro, 1999). There have beenmany recent improvements (Magri et al., 2007) and the softwarecontinues to expand and acquire new capabilities. The parameterspace is very large and the user needs to constrain this space bythe set of initial values, step sizes, and convergence criteria. Wewent though iterative adjustments of the input delay-Doppler
and CW data weights in order get the optimal fits both visuallyand in terms of v2 goodness of fit.
3.1. Shape modeling of Mithra
The first stage of shape modeling is to fit an ellipsoid. Mithra’sbifurcated shape forced us to use a two-component model in theearly stages of the modeling. The initial model consisted of a pairof identical ellipsoids. Each ellipsoid was parameterized with its
Fig. 1. (A) Mithra OC and SC echo power spectra obtained at Arecibo. Eachspectrum is a weighted sum of the number of runs from each day given in Table 1.The number of looks for each day is 48, 3, 8 and 4, respectively. Df is the Dopplerfrequency resolution. (B) OC and SC spectra obtained at Goldstone. The number oflooks is 77.
Fig. 2. Selected delay-Doppler images of Mithra from each day. Time delayincreases from top to bottom and Doppler frequency increases from left to right.Arecibo images were scaled in Doppler by the ratio of observing frequencies toenable direct comparison with Goldstone images. The resolution for Arecibo data is0.5 ls # 0.03 Hz and 0.125 ls # 0.04 Hz for Goldstone data. If we convert timedelay into distance, the vertical dimension of each image is 1350 m. Arrows indicatefeatures discussed in the text. Other images obtained on each day look very similar.
M. Brozovic et al. / Icarus 208 (2010) 207–220 209

three principal axis dimensions and three offsets in the x, y, and zdirections from the center-of-mass. At this point, we tested a widerange of long axis lengths (1.5 km, 1.8 km, 2.2 km and 2.5 km). Ourgoal was to establish which size reproduces the visible extent asobserved in the images (Fig. 2). In Shape, an ellipsoid is constructedfrom triangular facets and the size of the facets controls the mod-eling resolution. This becomes particularly important in the laterstages of modeling.
Modeling the lobes as two spheroids was useful only for thevery early stages of the fit while we were trying to constrain thelarge parameter space. In the second stage of the modeling, theshape was converted into a single component model by using a10th order spherical harmonic series. In the third and final stageof modeling, we converted the 10th order harmonic series modelinto a model that consisted of 3000 vertices defining 5996 triangu-lar facets. The approximate angular resolution is 4!. The parameterspace was well constrained at this time, and the vertex fit was usedto further refine Mithra’s shape and other physical parameters.
Shape also estimates the radar scattering law, the spin state, theradar calibration, as well as the corrections to the delay-Dopplerprediction ephemerides. We used a simple cosine law to modelthe radar reflectivity of the surface:
drdA
$ R%C & 1'%cosa'2C %1'
Here, r is a radar cross-section, A is the target surface area, a is thescattering angle, R is the Fresnel reflectivity and C is a measure ofthe specularity of the scattering (Michel et al., 1996).
3.2. Mithra’s spin state
Our initial modeling assumption was that Mithra rotates aboutits short principal axis (PA rotation). Shape uses four parametersthat define a principal axis spin state: the pole’s ecliptic longitude
k, latitude b, rotation phase w at an arbitrarily chosen referenceepoch, and the rotation period P about the short principal axis.
Initially, we used Shape to conduct a grid search for the poledirection and the rotation period. We limited our search to the pro-grade model (the retrograde model will be discussed in the follow-ing section). The pole directions were initialized in 20! intervalsfrom 0! to 360! in k and in 15! intervals from 0! to 90! in b. Theperiods were first investigated in 10-h increments from 50 h to90 h. Shape was allowed to adjust the pole direction and periodin each of the grid search runs. This was a very labor-intensive ap-proach, with many subjective estimates of which pole-period com-binations appear to work best. The v2 goodness of fit is not veryuseful at the ellipsoid stage of the modeling because Mithra hassuch an irregular shape. We found that a visual inspection of thefits is a much better way to pinpoint candidate models. We weremainly interested in reproducing the bandwidths and orientationof the two lobes (approximated as the ellipsoids), which we usedas a starting point for the harmonic stage of fitting.
Later in the analysis, we investigated a more straightforwardmethod to estimate the pole direction based purely on the pre-dicted variation in subradar latitude during our observations. Weinvestigated poles that provide a subradar latitude above 50! fromthe equator (either north or south) on August 6 and 7, with asubradar latitude roughly constant or increasing between July 22and August 7, and then decreasing after August 7 (see Fig. 2). Therequirement that the subradar latitude on August 6 and 7 has tobe above 50! comes from considering a suite of plausible diametersbetween 1.5 and 2.5 km and rotation periods between 60 and150 h and adjusting d to match the observed range of bandwidths.At this point we made no selection based on the amount of subra-dar latitude change. This very general selection eliminated themajority of the candidate poles and we were left with the pole re-gions highlighted in Fig. 4. After this we narrowed down our esti-mates of Mithra’s size and rotation period by using Shape to run theforward problem for a series of hand-edited models spanning arange of periods and ellipsoid sizes. In order to reproduce the lon-gest visible extent observed on August 9, the high subradar lati-tudes pushed Mithra’s longest axis to be in the realm of 2.2–2.5 km. The rotation period was more difficult to pinpoint becauseat high subradar latitudes, the bandwidth changes substantially fora slightly different pole direction. Our conclusion is that the band-width is much more sensitive to the change in pole direction thanthe change in period. Our preliminary period estimate based on theellipsoidal stage of the fit was between 60 and 75 h.
We continued to refine Mithra’s shape and spin state through aone component harmonic fit and finally through a vertex fit. Thevertex mode approximated Mithra’s shape with 5996 triangularfacets. The final pole direction in ecliptic coordinates is k = 337!,b = 19! (Fig. 4 shows our estimate and their associated errors).The best rotation period estimate for Mithra is 67.5 ± 6.0 h. Theuncertainty limits include Mithra’s alternative periods, also ob-
Table 2Bandwidths and visible extents in delay-Doppler images.
Date Obs Left/top bandwidth (Hz) Right/bottom bandwidth (Hz) Total S-band bandwidth (Hz) Total X-band bandwidth (Hz) Visible range (m)
July 25 A 0.15 0.09 0.24 ± 0.03 0.86 ± 0.11 675 ± 75July 28 A 0.12 0.09 0.21 ± 0.03 0.76 ± 0.11 750 ± 75August 06 G 0.32 0.32 0.32 ± 0.04 638 ± 40August 07 G 0.28 0.32 0.60 ± 0.04 544 ± 40August 08 G 0.36 0.52 0.88 ± 0.04 600 ± 40August 09 G 0.80 0.52 1.02 ± 0.04 1070 ± 40
Doppler bandwidths and visible extents of Mithra estimated by visual inspection from delay-Doppler images with resolutions given in Table 1. We assign uncertainties basedon the data resolution and our subjective estimate of how precisely are we able to determine Mithra’s dimensions. We label components ‘‘left/top” or ‘‘right/bottom” basedonly on their location in the delay-Doppler imaging. Doppler bandwidth of each component is given in S-band (2380 MHz) for Arecibo (A) and X-band (8560 MHz) forGoldstone (G). Total bandwidth does not necessarily equal the sum of the component bandwidths due to echo overlap in the images. In order to facilitate direct bandwidthcomparison between Arecibo and Goldstone data, Mithra’s total bandwidths (July 25 and 28) have been multiplied by 3.6 to convert from S-band to X-band.
Fig. 3. Delay-Doppler images from August 8, separated by 2.63 h, demonstrate thatMithra is a very slow rotator. The images show counterclockwise rotation wherethe receding edge has moved !6 ± 1 rows (each 19 m long) relative to thehorizontal white line. Delay-Doppler images are north–south ambiguous so thecounterclockwise rotation does not distinguish between prograde and retrograderotation.
210 M. Brozovic et al. / Icarus 208 (2010) 207–220
tained during the vertex stage of modeling, of 61.9 h and 71.9 h;these two models have poorer v2 values than our preferred model,but visually the fits are close enough that these periods cannot beexcluded. This is partly due to the fact that our data covered fewerthan seven rotations and we sampled only a limited number of ori-entations with respect to the line of sight.
3.3. ‘‘Mirror” model of Mithra
The viewing geometry never changed enough to distinguish be-tween prograde and retrograde rotation. Here, we define retro-
grade rotation as right-hand rotation about the pole with anobliquity greater than 90!. Multiple apparitions at different skypositions, more dates with radar observations, longer tracks acrossthe sky during a single apparition, and possibly photometry wouldprovide enough geometric leverage to resolve the ambiguity. Theissue of the so-called ‘‘mirror” models has been discussed previ-ously in Hudson et al. (1997) and Hudson and Ostro (1999). Insummary, we construct a mirror model by swapping the positionof the triangular facets about the y–z plane (a left–right reflectionin the plane defined by the short and intermediate principal axes)and by reversing the sense of rotation (P? "P) and phase
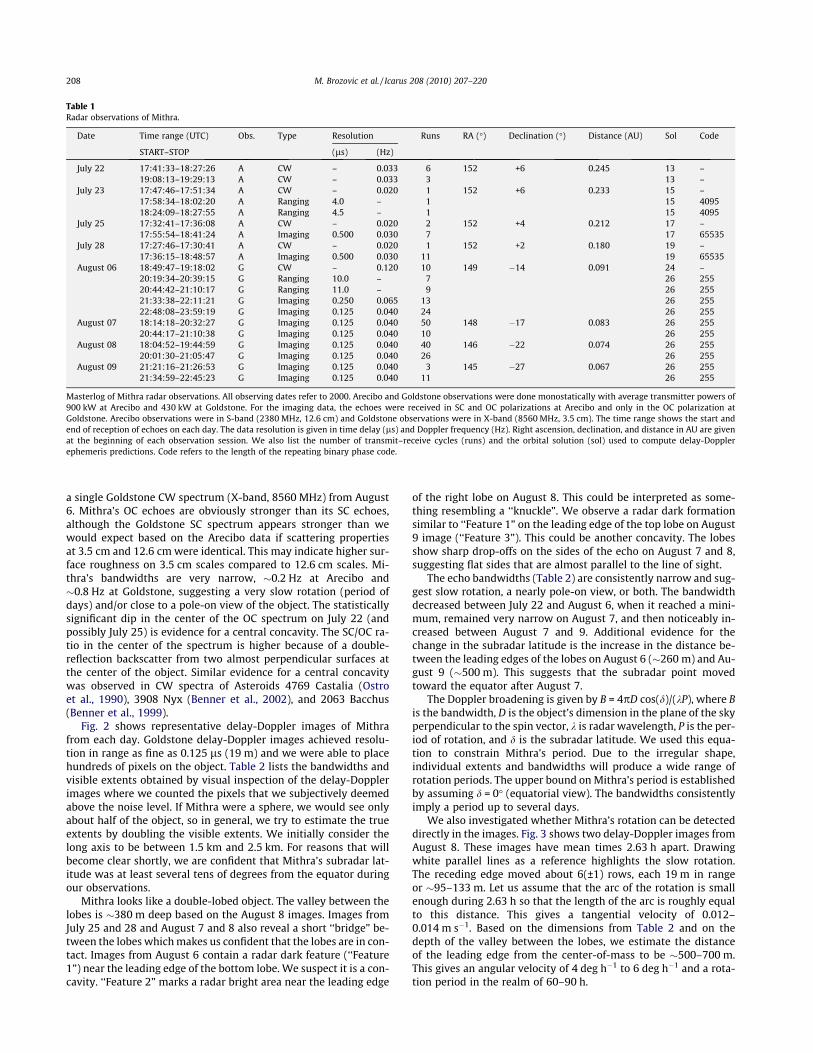
Fig. 4. 3-r region for viable pole solutions. (A) Prograde pole (black square) is contained inside an uncertainty polygon with pole boundaries (k, b) at (0!, +15!), (0!, +25!),(300!, +20!) and (300!, +15!). (B) Retrograde pole (black circle) is contained inside 3-r region of (180!, "15!), (180!, "25!), (120!, "20!) and (120!, "15!).
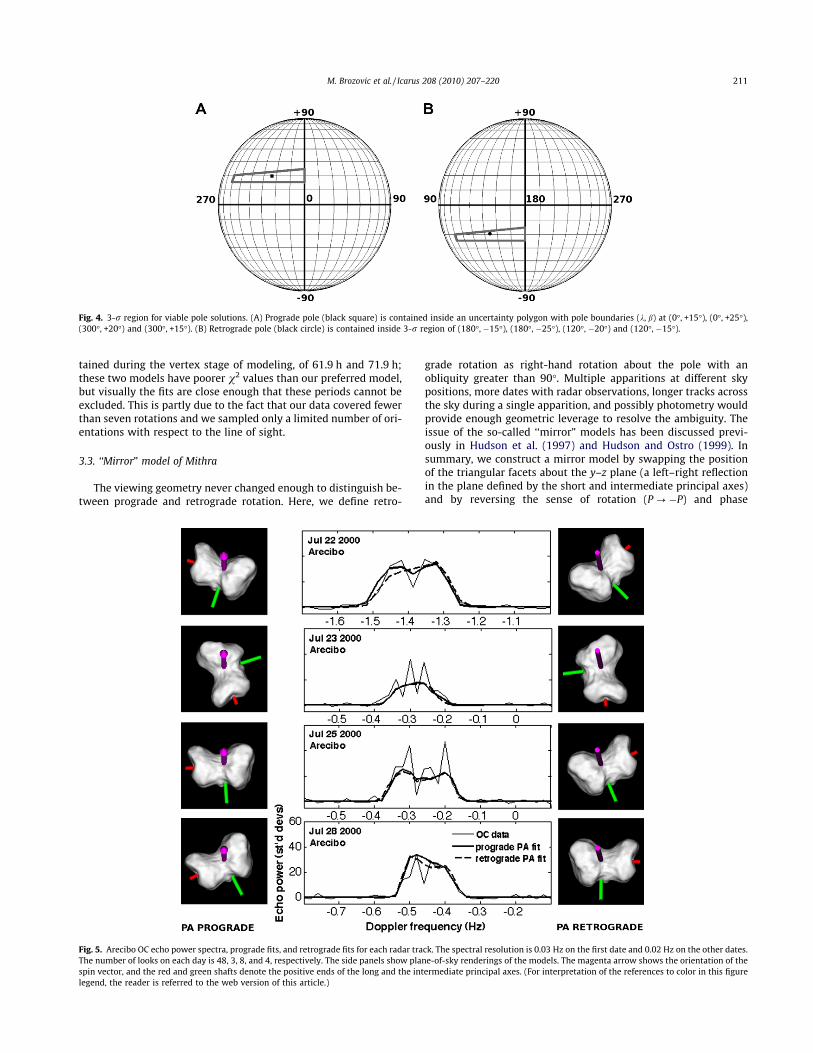
Fig. 5. Arecibo OC echo power spectra, prograde fits, and retrograde fits for each radar track. The spectral resolution is 0.03 Hz on the first date and 0.02 Hz on the other dates.The number of looks on each day is 48, 3, 8, and 4, respectively. The side panels show plane-of-sky renderings of the models. The magenta arrow shows the orientation of thespin vector, and the red and green shafts denote the positive ends of the long and the intermediate principal axes. (For interpretation of the references to color in this figurelegend, the reader is referred to the web version of this article.)
M. Brozovic et al. / Icarus 208 (2010) 207–220 211
(w? "w). This mirror model gives the same radar echo as the ini-tial model. After the initial inversion, we let Shape further adjust allthe vertices and spin state parameters. Our mirror model closelyresembles the original model of Mithra due to the geometric con-straints of the nearly pole-on view in the radar data.
The mirror pole direction is k = 154! and b = "19!, which is 177!from the other pole (also shown in Fig. 4). For the prograde pole,the subradar latitude increased from 75! to 79! from July 22 to28, reached a maximum of 83! on August 6, and decreased to 69!by August 9. For the retrograde model, a virtually identical se-quence occurs, but with southern subradar latitudes.
3.4. Shape modeling fit to the data
Fig. 5 shows OC CW data, fits, and plane-of-sky (POS) views ofthe prograde and retrograde models. A primary objective was toobtain the correct bandwidth on each of the observing days, sincethis is closely correlated with our spin state estimate. Overall, themodeled CW spectra match the bandwidths and the basic structure
of the data reasonably well. We used the simple cosine law in Eq.(1) to model the radar scattering, which limits how well the details(e.g. the depth of the bifurcation) may be matched. Due to thenumber of looks (N = 48) in the spectrum on July 22, the centraldip is statistically significant. The number of looks in the otherspectra is less than 10, which means that the echoes are dominatedby self-noise and precise fits to the dips and peaks would be ‘‘fit-ting the noise”.
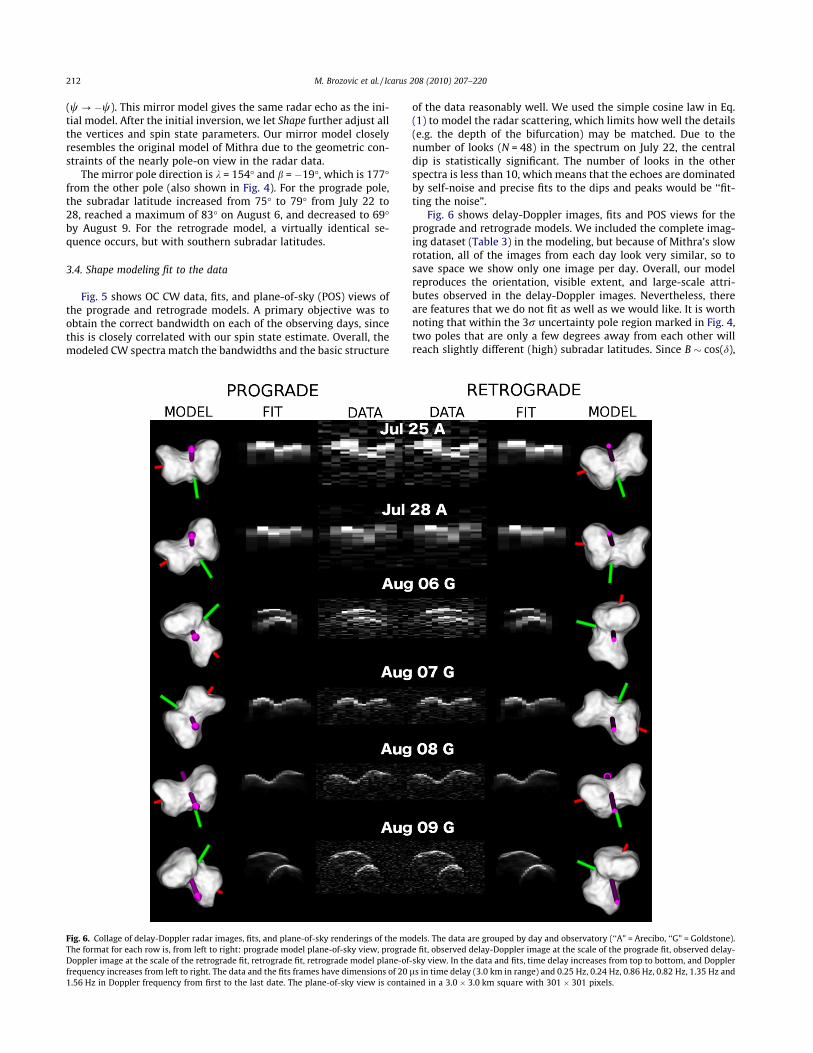
Fig. 6 shows delay-Doppler images, fits and POS views for theprograde and retrograde models. We included the complete imag-ing dataset (Table 3) in the modeling, but because of Mithra’s slowrotation, all of the images from each day look very similar, so tosave space we show only one image per day. Overall, our modelreproduces the orientation, visible extent, and large-scale attri-butes observed in the delay-Doppler images. Nevertheless, thereare features that we do not fit as well as we would like. It is worthnoting that within the 3r uncertainty pole region marked in Fig. 4,two poles that are only a few degrees away from each other willreach slightly different (high) subradar latitudes. Since B ! cos(d),
Fig. 6. Collage of delay-Doppler radar images, fits, and plane-of-sky renderings of the models. The data are grouped by day and observatory (‘‘A” = Arecibo, ‘‘G” = Goldstone).The format for each row is, from left to right: prograde model plane-of-sky view, prograde fit, observed delay-Doppler image at the scale of the prograde fit, observed delay-Doppler image at the scale of the retrograde fit, retrograde fit, retrograde model plane-of-sky view. In the data and fits, time delay increases from top to bottom, and Dopplerfrequency increases from left to right. The data and the fits frames have dimensions of 20 ls in time delay (3.0 km in range) and 0.25 Hz, 0.24 Hz, 0.86 Hz, 0.82 Hz, 1.35 Hz and1.56 Hz in Doppler frequency from first to the last date. The plane-of-sky view is contained in a 3.0 # 3.0 km square with 301 # 301 pixels.
212 M. Brozovic et al. / Icarus 208 (2010) 207–220
and since cos(d) varies rapidly near the poles, this difference insubradar latitude can easily create a bandwidth mismatch of tensof percent. There is a modest bandwidth mismatch on August 6,where the fits (both prograde and retrograde) appear one Dopplerbin (!12%) narrower than in the data. Conversely, the images arenoisy enough that it is difficult to make a strong statement onthe bandwidth mismatch where the fits are slightly wider thanthe observations. There is also a three-Doppler bin (!19%) band-width mismatch on the trailing lobe in the August 9 delay-Dopplerimages. We have increased the weights on these images up to 250times with respect to the rest of the dataset in an attempt to bringout the corresponding shape features, but we never achieved bet-ter bandwidth match on the trailing lobe. This could be due to thefact that the leading lobe is wider in bandwidth and has a strongerecho, so it dominates v2 on this date. This is similar to the situationthat was encountered with models of 25143 Itokawa, when theimages showed a narrower leading edge at some orientations thatwas never reproduced to a satisfactory degree in the models (Ostroet al., 2004, 2005).
3.5. Mithra’s size and shape
Fig. 7A and B shows principal axis views of the prograde andretrograde models. Mithra consists of two irregular lobes that areconnected by a short bridge or a neck. The shape is elongated;the prograde model has dimensions of 2.35 # 1.65 # 1.44 km andthe retrograde model has dimensions 2.48 # 1.70 # 1.48 km. Mi-thra has a moderate elongation with X/Y ( 1.42 ± 0.15 for the pro-grade model and X/Y ( 1.46 ± 0.15 for the retrograde model, valuesslightly lower than the average NEA elongation as derived from ra-dar shape estimations (http://echo.jpl.nasa.gov/~lance/nea_elon-gations.html); 1.55 ± 0.47 (N = 28). Table 4 summarizes thephysical properties of Mithra from the prograde and retrogrademodels. The uncertainties on the dimensions are inclusive of both
prograde and retrograde models. This is a more conservative num-ber than the values that we have obtained based on the statisticalvariations among modeling runs.
The radar coverage is limited to less than 50% ofMithra’s surface,and is centered at high latitudes, so the shape on the hemisphereunseen by the radar is not well constrained. The shape on that sideis constrained dynamically, since we assumed that Mithra is a uni-form density object that rotates about its short principal axis – thatis, we employed penalty functions that forced the model’s overallshape to conform to these two requirements. However, it is unlikelythat this particular shape of the unseen side is the only possiblesolution. Penalties that controlled concavities and smoothness alsoaffect the shape on the hidden hemisphere, and in the absence ofdata, this hemisphere has a much less pronounced bimodal appear-ance because the central concavity has been smoothed out.
3.6. Non-principal axis rotation?
Is Mithra a non-principal axis (NPA) rotator? Preliminaryinspection of the images (Ostro et al., 2000) hinted that Mithracould be an NPA rotator. We have investigated this possibilityextensively. We find that the delay-Doppler images and CW spec-tra are consistent with short axis mode NPA rotation that is veryclose to PA rotation, but that NPA rotation is not required to obtaingood fits to the data (see supplementary material). Thus, we adopta conservative approach in which we favor PA rotation. However,we include the NPA rotation state in our estimate of the spin vectorx by using xx and xy components as the uncertainty limits of thePA state (Table 3).
3.7. Optical albedo
Our shape model allows us to estimate Mithra’s visual geomet-ric albedo, which we calculated from pv $ %1329=D'2 # 10"0:4Hv
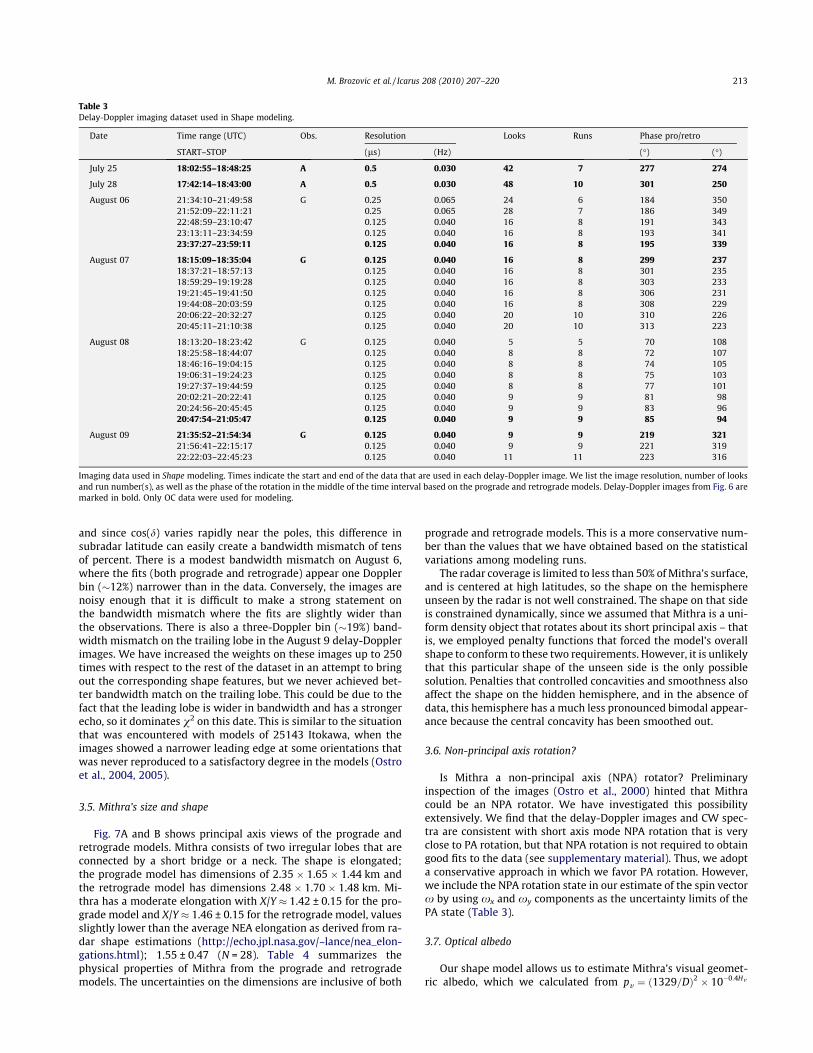
Table 3Delay-Doppler imaging dataset used in Shape modeling.
Date Time range (UTC) Obs. Resolution Looks Runs Phase pro/retro
START–STOP (ls) (Hz) (!) (!)
July 25 18:02:55–18:48:25 A 0.5 0.030 42 7 277 274
July 28 17:42:14–18:43:00 A 0.5 0.030 48 10 301 250
August 06 21:34:10–21:49:58 G 0.25 0.065 24 6 184 35021:52:09–22:11:21 0.25 0.065 28 7 186 34922:48:59–23:10:47 0.125 0.040 16 8 191 34323:13:11–23:34:59 0.125 0.040 16 8 193 34123:37:27–23:59:11 0.125 0.040 16 8 195 339
August 07 18:15:09–18:35:04 G 0.125 0.040 16 8 299 23718:37:21–18:57:13 0.125 0.040 16 8 301 23518:59:29–19:19:28 0.125 0.040 16 8 303 23319:21:45–19:41:50 0.125 0.040 16 8 306 23119:44:08–20:03:59 0.125 0.040 16 8 308 22920:06:22–20:32:27 0.125 0.040 20 10 310 22620:45:11–21:10:38 0.125 0.040 20 10 313 223
August 08 18:13:20–18:23:42 G 0.125 0.040 5 5 70 10818:25:58–18:44:07 0.125 0.040 8 8 72 10718:46:16–19:04:15 0.125 0.040 8 8 74 10519:06:31–19:24:23 0.125 0.040 8 8 75 10319:27:37–19:44:59 0.125 0.040 8 8 77 10120:02:21–20:22:41 0.125 0.040 9 9 81 9820:24:56–20:45:45 0.125 0.040 9 9 83 9620:47:54–21:05:47 0.125 0.040 9 9 85 94
August 09 21:35:52–21:54:34 G 0.125 0.040 9 9 219 32121:56:41–22:15:17 0.125 0.040 9 9 221 31922:22:03–22:45:23 0.125 0.040 11 11 223 316
Imaging data used in Shape modeling. Times indicate the start and end of the data that are used in each delay-Doppler image. We list the image resolution, number of looksand run number(s), as well as the phase of the rotation in the middle of the time interval based on the prograde and retrograde models. Delay-Doppler images from Fig. 6 aremarked in bold. Only OC data were used for modeling.
M. Brozovic et al. / Icarus 208 (2010) 207–220 213

(Campins et al., 1985; Pravec and Harris, 2007). For an absolute vi-sual magnitude of Hv = 15.6 and the equivalent diameter of theprograde model, D = 1.69 km, we obtain pv = 0.36. The optical albe-do calculated for the slightly larger (D = 1.75 km) retrograde modelis 0.33. Both results imply that Mithra is optically bright and thatits albedo is consistent with an S-class object.
4. Mithra orbit refinement
Radar astrometric data are referenced to the center-of-masslocation of an asteroid’s echo at the time of the observations. Theobserver usually estimates this location (and its uncertainty) visu-ally in time delay and Doppler frequency. One advantage of havinga 3D model is that, with the assumption of homogeneous density,Shape gives precise locations of the center of mass and enables usto assign much smaller uncertainties than we previously estimatedby eye and thus significantly improves the orbit.
Table 5 lists model-based astrometric measurements and post-fit residuals from the new orbital solution (#68). We used center-of-mass estimates obtained from the prograde model, although theother model gave virtually identical values. The small size of thepost-fit residuals in Table 5 is an indicator of the consistency be-tween the shape model’s center of mass and optical astrometryspanning 22 years of measurement. The dynamical model of thesolution includes the relativistic point-mass gravitational pertur-bations of the Sun, Moon, Planets, Ceres, Pallas, and Vesta, in acoordinate system defined by the DE405 planetary ephemeris solu-tion, a quasar-based frame generally within 0.01 arcsec of the opti-cal FK5/J2000 frame.
Table 6 lists orbital elements for the latest solution, and Table 7lists past and present encounters by Mithra with various bodies inthe Solar System. The encounter observed in 2000 was the closestwith Earth for the foreseeable future. Mithra has frequent encoun-ters with Venus at distances closer than with Earth.
Fig. 7. Principal-axis views of the Mithra shape models. Both models have 3000 vertices that form 5996 triangular facets with 4! spacing between the adjacent vertices.Yellow shading indicates areas that are not well constrained by the data because the radar scattering angle was always greater than 60!. (A) Prograde model with dimensionsof 2.35 # 1.65 # 1.44 km. (B) Retrograde model with dimensions of 2.48 # 1.70 # 1.48 km.
214 M. Brozovic et al. / Icarus 208 (2010) 207–220
5. Disk-integrated properties
Table 8 lists disk-integrated properties for Mithra. We com-bined the circular polarization ratios (SC/OC) from both Arecibodata and previously reported Goldstone measurements (Benneret al., 2008) and obtained an average of 0.31 ± 0.14. The Arecibodata show significant internal scatter. This could be due to dif-ferences in the surface properties (e.g. a heterogeneous regolithdistribution), which is possible, but somewhat speculative, ordue to calibration issues that varied from day to day, which isperhaps the more likely explanation. An additional puzzle is thatthe single Goldstone SC/OC measurement from August 6 is 23%larger than the highest measured SC/OC ratio from Arecibo.Although the cause of the difference is most likely in the calibra-tion of the two systems, it is also possible that the different ra-tios represent wavelength-dependent properties of Mithra’ssurface.
The SC/OC ratio provides a measure of the near-surface rough-ness. Ratios that are small (up to !0.2) indicate smoothness atthe radar wavelengths (centimeter to decimeter scales) while ra-tios higher than 0.5 indicate significant surface and near-surfaceroughness. Recently, Benner et al. (2008) found that there is astrong correlation between the SC/OC ratio and visible-infraredtaxonomic class. The mean SC/OC in the sample of 214 NEAs is0.34 ± 0.25. The means for different classes ranged from SC/OC < 0.2 (M, P, D and F) through 0.2 6 SC/OC < 0.5 (S, C and O) toSC/OC > 0.5 (V, E and X). We conclude that Mithra’s SC/OC ratiodoes not tie the object to a specific taxonomic class, although theclass could be S (consistent with our optical albedo estimate).The C class and perhaps P class is also consistent with the SC/OCratio, although their optical albedos are much darker than our esti-mates for Mithra. Our results probably exclude the M, E, and V clas-ses because their SC/OC ratios are either too low or too high.
Table 8 lists the OC radar cross-section, rOC. The mean mea-sured OC cross-section (both Arecibo and Goldstone data) for Mi-thra is rOC = 0.42 ± 0.17 km2. The OC radar albedo is calculatedby dividing the measured OC cross-section by the projected areaof the model. We obtain consistent OC radar albedos of
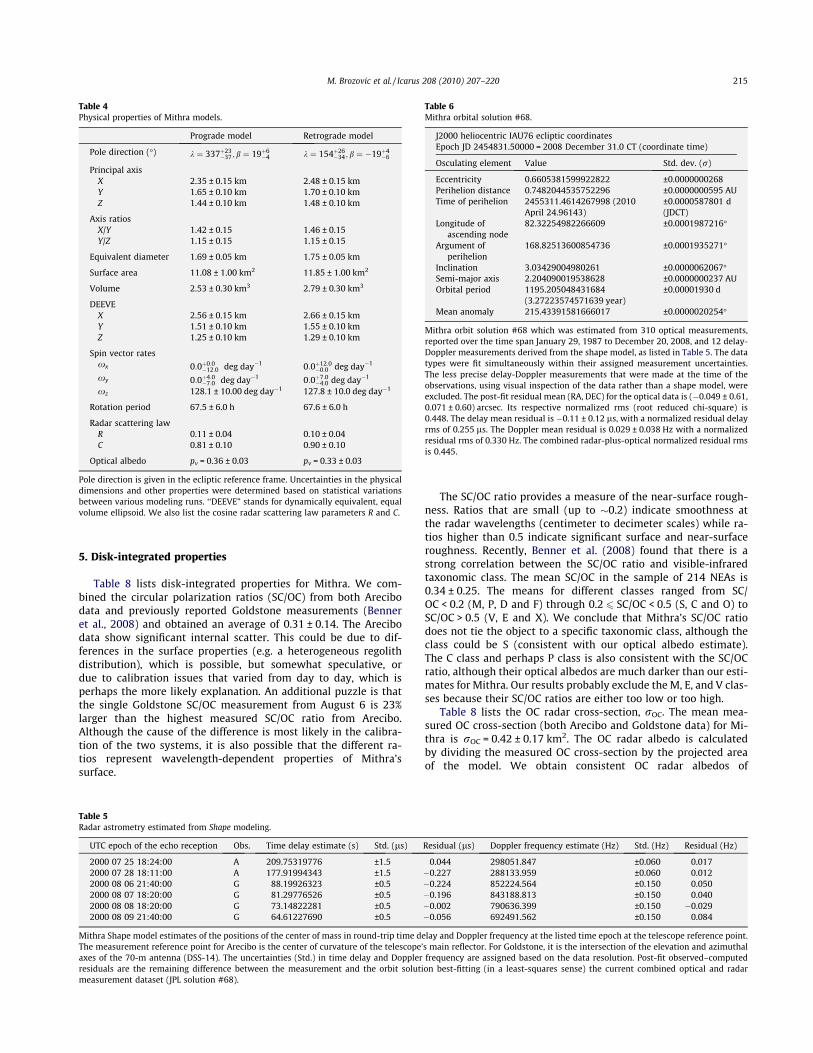
Table 4Physical properties of Mithra models.
Prograde model Retrograde model
Pole direction (!) k $ 337&23"37; b $ 19&6
"4 k $ 154&26"34; b $ "19&4
"6
Principal axisX 2.35 ± 0.15 km 2.48 ± 0.15 kmY 1.65 ± 0.10 km 1.70 ± 0.10 kmZ 1.44 ± 0.10 km 1.48 ± 0.10 km
Axis ratiosX/Y 1.42 ± 0.15 1.46 ± 0.15Y/Z 1.15 ± 0.15 1.15 ± 0.15
Equivalent diameter 1.69 ± 0.05 km 1.75 ± 0.05 km
Surface area 11.08 ± 1.00 km2 11.85 ± 1.00 km2
Volume 2.53 ± 0.30 km3 2.79 ± 0.30 km3
DEEVEX 2.56 ± 0.15 km 2.66 ± 0.15 kmY 1.51 ± 0.10 km 1.55 ± 0.10 kmZ 1.25 ± 0.10 km 1.29 ± 0.10 km
Spin vector ratesxx 0:0&0:0
"12:0 deg day"1 0:0&12:0"0:0 deg day"1
xy 0:0&4:0"7:0 deg day"1 0:0&7:0
"4:0 deg day"1
xz 128.1 ± 10.00 deg day"1 127.8 ± 10.0 deg day"1
Rotation period 67.5 ± 6.0 h 67.6 ± 6.0 h
Radar scattering lawR 0.11 ± 0.04 0.10 ± 0.04C 0.81 ± 0.10 0.90 ± 0.10
Optical albedo pv = 0.36 ± 0.03 pv = 0.33 ± 0.03
Pole direction is given in the ecliptic reference frame. Uncertainties in the physicaldimensions and other properties were determined based on statistical variationsbetween various modeling runs. ‘‘DEEVE” stands for dynamically equivalent, equalvolume ellipsoid. We also list the cosine radar scattering law parameters R and C.
Table 5Radar astrometry estimated from Shape modeling.
UTC epoch of the echo reception Obs. Time delay estimate (s) Std. (ls) Residual (ls) Doppler frequency estimate (Hz) Std. (Hz) Residual (Hz)
2000 07 25 18:24:00 A 209.75319776 ±1.5 0.044 298051.847 ±0.060 0.0172000 07 28 18:11:00 A 177.91994343 ±1.5 "0.227 288133.959 ±0.060 0.0122000 08 06 21:40:00 G 88.19926323 ±0.5 "0.224 852224.564 ±0.150 0.0502000 08 07 18:20:00 G 81.29776526 ±0.5 "0.196 843188.813 ±0.150 0.0402000 08 08 18:20:00 G 73.14822281 ±0.5 "0.002 790636.399 ±0.150 "0.0292000 08 09 21:40:00 G 64.61227690 ±0.5 "0.056 692491.562 ±0.150 0.084
Mithra Shape model estimates of the positions of the center of mass in round-trip time delay and Doppler frequency at the listed time epoch at the telescope reference point.The measurement reference point for Arecibo is the center of curvature of the telescope’s main reflector. For Goldstone, it is the intersection of the elevation and azimuthalaxes of the 70-m antenna (DSS-14). The uncertainties (Std.) in time delay and Doppler frequency are assigned based on the data resolution. Post-fit observed–computedresiduals are the remaining difference between the measurement and the orbit solution best-fitting (in a least-squares sense) the current combined optical and radarmeasurement dataset (JPL solution #68).
Table 6Mithra orbital solution #68.
J2000 heliocentric IAU76 ecliptic coordinatesEpoch JD 2454831.50000 = 2008 December 31.0 CT (coordinate time)
Osculating element Value Std. dev. (r)
Eccentricity 0.6605381599922822 ±0.0000000268Perihelion distance 0.7482044535752296 ±0.0000000595 AUTime of perihelion 2455311.4614267998 (2010
April 24.96143)±0.0000587801 d(JDCT)
Longitude ofascending node
82.32254982266609 ±0.0001987216!
Argument ofperihelion
168.82513600854736 ±0.0001935271!
Inclination 3.03429004980261 ±0.0000062067!Semi-major axis 2.204090019538628 ±0.0000000237 AUOrbital period 1195.205048431684
(3.27223574571639 year)±0.00001930 d
Mean anomaly 215.43391581666017 ±0.0000020254!
Mithra orbit solution #68 which was estimated from 310 optical measurements,reported over the time span January 29, 1987 to December 20, 2008, and 12 delay-Doppler measurements derived from the shape model, as listed in Table 5. The datatypes were fit simultaneously within their assigned measurement uncertainties.The less precise delay-Doppler measurements that were made at the time of theobservations, using visual inspection of the data rather than a shape model, wereexcluded. The post-fit residual mean (RA, DEC) for the optical data is ("0.049 ± 0.61,0.071 ± 0.60) arcsec. Its respective normalized rms (root reduced chi-square) is0.448. The delay mean residual is "0.11 ± 0.12 ls, with a normalized residual delayrms of 0.255 ls. The Doppler mean residual is 0.029 ± 0.038 Hz with a normalizedresidual rms of 0.330 Hz. The combined radar-plus-optical normalized residual rmsis 0.445.
M. Brozovic et al. / Icarus 208 (2010) 207–220 215

gOC = 0.17 ± 0.04 for the prograde model and gOC = 0.16 ± 0.04 forthe retrograde model. These are close to the average value for NEAs(gOC = 0.17 ± 0.11, N = 28, http://echo.jpl.nasa.gov/~lance/aster-oid_radar_properties/nea.radaralbedo.html).
We used our OC cross-section and the ‘‘Eros-calibrated” ap-proach from Magri et al. (2001) to estimate the near-surface soliddensity. In order to establish a maximum value we assumed aporosity p = 0. For the prograde model, we obtain a maximumnear-surface solid density of 3.0 g cm"3 and a maximum densityof 2.9 g cm"3 for the retrograde model. The uncertainty of thesevalues is at least a few tens of percent due to assumptions madefor the analysis (Magri et al., 2001).
6. Mithra’s gravitational/dynamical environment
6.1. Mithra’s surface environment
Given Mithra’s shape and spin state, we can evaluate the surfaceenvironment on this asteroid (Scheeres et al., 1996). Of most inter-
est is the gravitational slope distribution across the body, as thisplaces implicit constraints on the strength of the surface. The grav-itational slope is the angle that a plumb line would make with thenormal to the surface. Specifically, if regions have slopes above 35–40!, we infer that the surface has some degree of cohesiveness andtensile strength (Holsapple, 2001, 2004). For a slowly rotating bodysuch as Mithra, the slope is dominated by the total gravitationalattraction and surface topography. For a homogeneous density,the surface slopes are independent of interior density.
Due to the mirror-symmetries between the retrograde and di-rect shape models, the slope statistics and distributions are similarbetween the two bodies. We assumed a bulk density of 2 g cm"3. InFig. 8, we present the slope distributions for the observed hemi-spheres of the asteroid (northern for the prograde model, southernfor the retrograde model). Across both models we find slopes thatrange from zero to nearly 60!. Slopes of 60! exceed the angle of re-pose and suggest bare rock (i.e. no regolith). We note that Asteroid25143 Itokawa also has local slope regions up to 60!, most notablyalong the ‘‘face” of the ‘‘head” (Demura et al., 2006). These regionsare very rough, with many large boulders exposed.
Table 7Close approaches for Mithra based on the orbital solution #68.
Date (coordinate time) Body CAdist (AU) MINdist (AU) MAXdist (AU) Vrel (km s"1) TCA3Sg (min)
A.D. 1602 August 10.42424 Earth 0.096603 0.096145 0.097063 19.783 45.72A.D. 1615 August 09.67753 Earth 0.089114 0.080460 0.097952 19.428 922.38A.D. 1628 August 09.49165 Earth 0.085290 0.074560 0.096383 19.473 1176.10A.D. 1651 April 17.10156 Venus 0.029173 0.029033 0.029313 9.256 593.82A.D. 1664 January 06.34485 Mars 0.095954 0.092705 0.099203 18.622 294.69A.D. 1664 March 10.60422 Earth 0.075274 0.072109 0.078562 18.857 431.75A.D. 1697 February 13.28837 Mars 0.032422 0.032134 0.032808 17.047 139.59A.D. 1706 August 31.41195 Venus 0.031066 0.031001 0.031131 9.230 157.98A.D. 1729 August 10.62671 Earth 0.061932 0.061430 0.062436 18.598 69.51A.D. 1762 January 22.54108 Venus 0.045713 0.045377 0.046047 10.788 120.87A.D. 1765 March 12.28086 Earth 0.093986 0.093553 0.094420 19.581 46.61A.D. 1781 January 07.64429 Vesta 0.073318 0.073081 0.073555 11.874 15.41A.D. 1794 August 31.63016 Venus 0.037587 0.037420 0.037754 10.795 66.47A.D. 1827 March 21.97209 Earth 0.059563 0.059214 0.059919 16.508 94.08A.D. 1846 May 10.65532 Vesta 0.090676 0.089687 0.091667 12.047 80.09A.D. 1846 December 21.01411 Venus 0.063721 0.062036 0.065400 11.766 404.90A.D. 1853 August 11.44425 Earth 0.052501 0.052014 0.052998 17.998 94.68A.D. 1856 October 03.73940 Venus 0.032347 0.032153 0.032541 9.597 167.55A.D. 1856 December 28.50540 Mars 0.079120 0.078714 0.079526 15.795 35.55A.D. 1879 January 15.13059 Vesta 0.047588 0.047545 0.047631 11.181 3.86A.D. 1909 January 16.03817 Venus 0.040111 0.039841 0.040380 10.187 127.48A.D. 1912 March 18.74426 Earth 0.071580 0.071278 0.071884 18.589 43.27A.D. 1919 January 31.62547 Mars 0.040440 0.040252 0.040632 17.518 27.82A.D. 1944 May 17.54748 Vesta 0.030770 0.030745 0.030795 11.294 4.05A.D. 1951 July 09.48218 Venus 0.028461 0.028459 0.028462 9.278 12.38A.D. 1977 January 14.62488 Vesta 0.029472 0.029468 0.029476 11.507 0.79A.D. 1993 December 23.05494 Venus 0.018640 0.018640 0.018641 9.771 0.72A.D. 2000 August 14.34276 Earth 0.046542 0.046542 0.046542 17.571 0.00A.D. 2009 September 17.98843 Vesta 0.034266 0.034264 0.034267 11.269 0.12A.D. 2056 February 04.08307 Venus 0.016640 0.016638 0.016641 9.852 2.46A.D. 2059 January 20.81068 Mars 0.096285 0.096271 0.096298 15.841 1.33A.D. 2098 August 09.79261 Venus 0.092416 0.092319 0.092514 13.705 15.02A.D. 2108 May 08.35213 Venus 0.066347 0.066330 0.066365 12.674 3.47A.D. 2134 August 18.65724 Earth 0.052931 0.052813 0.053050 17.943 26.47A.D. 2150 November 04.67652 Venus 0.013836 0.013784 0.013888 9.825 205.68A.D. 2203 February 06.63767 Venus 0.057081 0.054539 0.059608 11.995 586.32A.D. 2229 June 13.52853 Mars 0.070934 0.049113 0.095666 18.123 2081.80A.D. 2235 October 15.83885 Venus 0.052897 0.022275 0.081507 11.571 7993.70A.D. 2245 April 02.11114 Mars 0.038825 0.036647 0.041069 17.696 342.63A.D. 2255 March 31.24666 Earth 0.051588 0.050147 0.076379 16.942 5211.60
Mithra encounters with Earth, Venus, Mars, Ceres, Pallas, and Vesta, less than 0.1 AU, limited in time by Earth encounters for which the 3-r Earth time-of-encounteruncertainty is less than 10 days and the 3-r Earth encounter distance uncertainty is less than 0.1 AU. These criteria are satisfied over the interval 1602–2255, defining theapproximate limits of reliable Earth encounter prediction for Mithra. The encounter observed by radar in 2000 was the closest for the foreseeable future. Nominal close-approach dates are given. CAdist is the nominal close-approach distance at the nominal close-approach time, uncorrected for light travel time. MINdist and MAXdist are theencounter distance 3-r uncertainties at the nominal encounter time. Vrel is the nominal relative velocity. TCA3Sg is close-approach time 3-r uncertainty. Integrations wereperformed using the DE405 planetary ephemeris to include relativistic point-mass perturbations due to the Sun, Planets, and Moon, as well as Ceres, Pallas, and Vesta. Thelimits of predictability for km-sized and smaller objects having multiple planetary encounters over centuries can be affected by additional factors such as radiation pressure,Yarkovsky acceleration, planetary mass uncertainties, and asteroid perturbations. These factors are not included here, since the relevant physical models are impreciselydefined and key parameters are unmeasured.
216 M. Brozovic et al. / Icarus 208 (2010) 207–220

The gravitational potential also varies strongly across thesurfaces of both models of Mithra (see Fig. 9). We find that thedeepest portion of the gravitational potential lies at the contactregion between the two bodies. By analogy with Itokawa, we sug-gest that the regions of deepest gravitational potential may con-tain accumulated loose material and low slope. We note that thedeepest locations for both models also correspond to low slopes.
6.2. Mithra’s spin state evolution
The spin states of moderately sized asteroids (<10 km) arestrongly affected by collisions between asteroids, by close plane-
tary encounters, and by the thermal torque originating fromabsorption and re-emission of solar radiation from an asteroid’ssurface. The theory of the YORP (Yarkovsky–O’Keefe–Radziev-skii–Paddack) effect (Rubincam, 2000) describes the evolution ofspin state and obliquity due to solar radiation. We apply the the-ory outlined in Scheeres (2007a) and Scheeres and Mirrahimi(2008) to our shape model of Mithra. The detailed topographyof the unobserved regions is important for the overall YORP evo-lution (Statler, 2009), so in the absence of any other information,we adopt the models at face value and explore their implications.We note that a small change in shape or small center-of-mass off-set can completely reverse the torque direction, thus estimatedspin acceleration, and should be taken as only dimensionalestimates.
Due to the near mirror-symmetries between the models theYORP responses of both bodies are quite similar. Assuming a den-sity of 2 g cm"3, we compute current YORP rotational accelerationsof approximately 4.5 # 10"11 rad s"1 year"1 for the prograde mod-el and 4.2 # 10"11 rad s"1 year"1 for the retrograde model, leadingto doubling of the spin rate in approximately 575,000 and615,000 years, respectively, comparable to that observed for Aster-oid (54509) YORP (Taylor et al., 2007). This is also the time it wouldtake Mithra to spin up to its current spin rate from no rotation,assuming we apply the current, constant spin acceleration to thebody.
We find that both models have obliquities that should be mov-ing away from 90!. They are currently at +68! and +106! with re-spect to Mithra’s orbital plane. More precise estimates of thecurrent obliquity rate require an estimate of the body’s thermalinertia, which we do not know. However, both models indicate thatMithra’s obliquity was closer to 90! in the past. Using the terminol-ogy for the dynamical evolution of the asteroid’s spin state pre-sented in Scheeres and Mirrahimi (2008), we classify Mithra tobe a Type II+, meaning that its asymptotic spin state in the futureis a slow rotation with obliquity going towards 0! or 180!. Itsasymptotic spin state in the past is a slow rotation with obliquityapproaching 90!.
We made a preliminary estimate (at nominal values of theobliquities) of the relationship between Mithra’s pole precessionfrequency a (Laskar and Robutel, 1993; Laskar et al., 1993; Skoglövet al., 1996) and the nodal precession frequency dX dt"1. The pro-grade model has a = 4000 0 year"1 while the retrograde model hasa = "2960 0 year"1. We have numerically integrated Mithra’s nodeangle from year 1600 to year 2200, and based on this, we estab-lished a linear downward secular trend with a slope of"310 0 year"1. We conclude that since the pole precesses rapidlycompared to the nodal precession rate the obliquity precesses ata more or less constant angle around the orbit normal.
Table 8Disk-integrated properties.
Arecibo and Goldstone CW data
Date Obs. rOC (km2) SC/OC # Looks
2000 July 22 A 0.44 0.33 ± 0.01 482000 July 23 A 0.60 0.13 ± 0.02 452000 July 25 A 0.55 0.21 ± 0.02 822000 July 28 A 0.35 0.39 ± 0.02 352000 August 06 G 0.18 0.48 ± 0.01 77
0.42 ± 0.17 0.31 ± 0.14
Prograde model
Date Long (!) Lat (!) w (!) Area (km2) gOC
2000 July 22 109 75 251 2.91 0.152000 July 23 342 76 18 2.83 0.212000 July 25 88 77 272 2.90 0.192000 July 28 63 79 297 2.89 0.12
0.17 ± 0.04Retrograde model
Date Long (!) Lat (!) w (!) Area (km2) gOC
2000 July 22 122 "75 238 3.16 0.142000 July 23 354 "76 6 3.05 0.202000 July 25 99 "77 261 3.14 0.182000 July 28 73 "80 287 3.11 0.11
0.16 ± 0.04
Top: disk-integrated OC cross-section (rOC), circular polarization ratio (SC/OC)estimated from Arecibo and Goldstone CW spectra. Arecibo CW data were reducedwith 0.2 Hz resolution for all but the July 22 data, which have a resolution of0.03 Hz. The resolution was chosen in order to get enough looks to obtain Gaussiannoise statistics. The number of looks represents the number of statistically inde-pendent measurements that were used to get the average SC and OC spectra. In thesecond and third part of this table we list each model’s predictions for the projectedsurface area at the mid-receive epoch. Lat, Long, and w represent model estimatesof the subradar latitude and longitude, as well as the rotation phase at the timewhen CW spectra were obtained. OC radar albedo (gOC) is calculated by dividing thecross-section (rOC) by the projected area.
Fig. 8. Gravitational slopes for the prograde (A) and retrograde (B) models. We only show the side of Mithra (north or south pole view) that was observed by radar.
M. Brozovic et al. / Icarus 208 (2010) 207–220 217

7. Discussion
7.1. Abundance of contact binaries in the NEA population
Radar observations suggest that candidate contact binariesmake up about 10% of the NEAs larger than 200 m in diameter(Benner et al., 2006). Mithra’s bifurcated shape clearly establishesthat it is a candidate contact binary, which we define as ‘‘an aster-oid consisting of two lobes that are in contact, have a bimodal massdistribution, and might have once been separate” (Benner et al.,2006). We are confident that Mithra’s lobes are in compressivecontact not only due to the visible bridge, but also because a truebinary configuration with an orbital period of 67 h would implyan implausibly low bulk density. Table 9 lists all known candidatesin the radar sample, which now includes 20 objects. When com-bined with the NEA binary systems population (!16%) with thesame size threshold (Margot et al., 2002; Pravec et al., 2006) thisindicates that at least 25% of the NEAs are contact binaries or truebinary systems.
Table 9 shows that candidate contact binaries appear to be avery diverse group with a wide range of sizes and rotational peri-ods. We do not include 25143 Itokawa (Demura et al., 2006; Fujiw-ara et al., 2006; Scheeres, 2007b) or Toutatis (Hudson and Ostro,1995) because they do not have a bimodal mass distribution. Cas-talia (Hudson and Ostro, 1994) and 2063 Bacchus (Benner et al.,1999) are the only other contact binaries for which we have a mod-el, although the model for Mithra is much more detailed.
7.2. Origin of Mithra’s shape
How did Mithra’s shape originate? Mithra’s bimodal mass dis-tribution may be a product of a low-velocity collision, perhaps be-tween the components of a true binary system (Farinella, 1992;Hudson and Ostro, 1995; Chauvineau et al., 1995; Bottke and Me-losh, 1996a,b; Leinhardt et al., 2000; Taylor, 2009). Leinhardt et al.(2000) presented a modeling study where they simulated slowcollisions between two 1-km diameter rubble piles and found thatlow-speed (<10 m s"1), off-center collisions could produce peanut-
Fig. 9. Gravitational potential for the prograde (A) and retrograde (B) models. We only show the side of Mithra that was observed by radar.
Table 9Candidate contact binaries observed by radar.
Asteroid Diameter (km) Res’n (m) Period (h) Radar references
4769 Castalia 1.0 300.0 4.0 Ostro et al. (1990) and Hudson and Ostro (1994)68346 2001 KZ66 1.0 15.0 !6.0 Nolan et al. (unpublished)2005 CR37 1.0 15.0 6.5 Benner et al. (2006)*2007 VD12 0.5 19.0 7.4a Benner et al. (unpublished)11066 Sigurd 3.0 75.0 8.5 Benner et al. (2004)*1996 HW1 2.0 75.0 8.8b Nolan et al. (unpublished)*179806 2002 TD66 0.3 7.5 9.5c Nolan et al. (unpublished)*2000 YF29 0.5 15.0 <12.0 Benner et al. (unpublished)*2002 HK12 0.6 15.0 12.7b Nolan et al. (unpublished)2063 Bachus 0.6 75.0 15.1 Benner et al. (1999)*1998 FW4 0.4 7.5 !18.0 Busch et al. (unpublished)2002 NY40 0.4 7.5 20.0d Nolan et al. (unpublished)*2004 XL14 0.4 7.5 !1 day Brozovic et al. (unpublished)52387 1993 OM7 1.0 15.0 >26.0b Ostro et al. (unpublished)*2008 SV11 !0.8 15.0 32.4c Nolan et al. (unpublished)*2007 TU24 0.3 7.5 1–2 days Ostro et al. (unpublished)*4450 Pan 1.0 15.0 2–3a,b days Nolan et al. (unpublished)4486 Mithra 1.6 19.0 67.4 This paper2002 FC 0.7 15.0 Days Ostro et al. (unpublished)2004 RF84 2.4 15.0 Weeks Benner et al. (unpublished)
Candidate contact binaries sorted by rotation period. Asteroids marked with an asterisk have been observed for the first time since the first version of this table was publishedin Benner et al. (2006). 2001 KZ66 has a corrected rotation period of !6.0 h as opposed to the originally reported 2.7 h. We list each object’s diameter, radar imagingresolution in range, and rotation period. Unless superscripted by a letter (photometry reference), the periods have been estimated (sometimes very roughly) from sequencesof radar images only.
a Carbognani (2008).b Pravec et al. (unpublished) – http://www.asu.cas.cz/~ppravec/newres.txt.c Warner et al. (unpublished) – http://www.minorplanetobserver.com/.d Pravec et al. (2005).
218 M. Brozovic et al. / Icarus 208 (2010) 207–220

shaped contact binaries. Alternatively, Mithra’s shape may be a re-sult of distortion of a gravitationally-bound agglomerate that oc-curred during close approaches to a planet (Asphaug and Benz,1996; Richardson et al., 1998, 2002; Merline et al., 2002; Bottkeet al., 2002; Richardson and Walsh, 2006). Spin-up due to YORPor a close planetary encounter may eventually lead Mithra to be-come a true binary.
7.3. Mithra’s despinning time does not require an NPA spin state
With period of 67.5 h, Mithra is clearly a slow rotator. Among!450 NEAs with known rotation periods (http://www.asu.cas.cz/~ppravec/newres.txt), only !8% rotate more slowly than Mithra.Pravec et al. (2005) suggested that YORP is the most likely explana-tion for slow rotation, although planetary encounters could alsoslow the rotation. There have been many recent theoretical paperson the influence of YORP and of planetary flybys on asteroid spinstates (Bottke et al., 2002; Scheeres et al., 2004; Scheeres,2007a,b; Scheeres and Mirrahimi, 2008).
Many slow rotators are NPA rotators, and an additional hint thata slow rotator may be an NPA rotator is the damping timescale s.This represents the timescale in which NPA rotators dissipate en-ergy and evolve toward PA rotation (Burns and Safronov, 1973).Harris (1994) expressed the damping timescale s = P3/(C3D2),where P is the asteroid’s rotation period in hours, D is the meandiameter in km, and all other factors (bulk density, rigidity, shape,quality factor) are lumped into a constant C, which has a value(within a factor of 2.5) of 17. Pravec and Harris (2000) suggested‘‘that tumbling rotation is the norm for slowly rotating asteroidswhere the damping time scale is long” and Pravec et al. (2005) pre-sented evidence that most asteroids larger than !0.4 km with esti-mated damping timescales of 4.5 byr and longer are NPA rotators.We define snorm as the damping timescale s normalized to 4.5 byr.Asteroids with log snorm values just a few tenths less than zero arein the region where the PA rotation starts dominating. For Mithra,log snorm = 0.69 which is in the region where Pravec et al. (2005)predominantly find NPA rotators. However, our results showedthat if an NPA component exists in Mithra’s rotation, it is verysmall. In fact, Pravec et al. (2005) found several PA rotators inthe snorm region dominated by tumblers (e.g. (3102) Krok, withsnorm = 1.8), which implies that the damping timescale value isonly an approximate criterion. An alternative implication for thedamping timescale is that slow rotation per se does not lead totumbling, that is, the mechanism of slowing (YORP) is not the sameas the mechanism exciting NPA rotation. In order for a slow rotatorto become an NPA rotator, something other than despinning has totrigger NPA rotation.
7.4. Future observation opportunities and objectives
The next opportunity to observe Mithra with radar at SNRscomparable to those discussed here will occur in April 2059. How-ever, Mithra will be a good target for lightcurve measurements inMarch 2010 when it approaches within 0.19 AU, reaches a solarelongation of 127!, and becomes brighter than magnitude 15.The prograde pole estimates suggest that the lightcurves will sam-ple latitudes from +50! to "50! between February 10 and March20. The equatorial aspect occurs in early-to-mid March and coin-cides with large solar phase angles when the lightcurve amplitudeis likely to exceed a full magnitude. Photometric observations in2010 could significantly refine the spin state and potentially eluci-date whether Mithra is a non-principal axis rotator. Additionally,this would help to constrain the shape on the side unseen by radar.Thermal IR observations could constrain the thermal inertia andthus improve our predictions for Mithra’s spin evolution due toYORP. Our optical albedo and SC/OC ratio hint that Mithra could
be an S-class object, but only spectroscopy will be able to deter-mine Mithra’s taxonomic class with higher certainty.
Acknowledgments
We dedicate this paper to the memory of Steve Ostro whopassed away as we were finalizing this analysis. Mithra fascinatedhim since the time he observed it in 2000 and he continued to beinvolved in this study until the very end. Steve was the most amaz-ing mentor, colleague, and friend.
We would like to thank AlanW. Harris (USA) and Patrick A. Tay-lor for insightful reviews that improved the paper. We thank theArecibo and Goldstone technical and support staffs for help withthe radar observations. The Arecibo Observatory is part of the Na-tional Astronomy and Ionosphere Center, which is operated by Cor-nell University under a cooperative agreement with the NationalScience Foundation (NSF) and, at the time of this experiment, alsohad support from the National Aeronautics and Space Administra-tion (NASA). Some of this work was performed at the Jet PropulsionLaboratory, California Institute of Technology, under contract withNASA. This material is based in part upon work supported by NASAunder the Science Mission Directorate Research and AnalysisPrograms.
Appendix A. Supplementary material
Supplementary data associated with this article can be found, inthe online version, at doi:10.1016/j.icarus.2010.01.035.
References
Asphaug, E., Benz, W., 1996. Size, density, and structure of Comet Shoemaker-Levy 9inferred from the physics of tidal breakup. Icarus 121, 225–248.
Benner, L.A.M., and 11 colleagues, 1999. Radar observations of Asteroid 2063Bacchus. Icarus 139, 309–327.
Benner, L.A.M., Ostro, S.J., Hudson, R.S., Rosema, K.D., Jurgens, R.F., Yeomans, D.K.,Campbell, D.B., Chandler, J.F., Shapiro, I.I., 2002. Radar observations of Asteroid3908 Nyx. Icarus 158, 379–388.
Benner, L.A.M., Nolan, M.C., Carter, L.M., Ostro, S.J., Giorgini, J.D., Magri, C., Margot,J.-L., 2004. Radar imaging of near-Earth Asteroid 11066 Sigurd. Bull. Am. Astron.Soc. 36, 1143.
Benner, L.A.M., Nolan, M.C., Ostro, S.J., Giorgini, J.D., Pray, D.P., Harris, A.W., Magri,C., Margot, J.-L., 2006. Near-Earth Asteroid 2005 CR37: Radar images andphotometry of a candidate contact binary. Icarus 182, 474–481.
Benner, L.A.M., and 10 colleagues, 2008. Near-Earth asteroid surface roughnessdepends on compositional class. Icarus 198, 294–304.
Bottke, W.F., Melosh, H.J., 1996a. Formation of the asteroid satellites and doubletcraters by planetary tidal forces. Nature 381, 51–53.
Bottke, W.F., Melosh, H.J., 1996b. Binary asteroids and the formation of doubletcraters. Icarus 124, 372–391.
Bottke, W.F., Vokrouhlicky, D., Rubincam, D.P., Broz, M., 2002. The effect ofYarkovsky thermal forces on the dynamical evolution of asteroids andmeteoroids. In: Bottke, W.F., Cellino, A., Paolicchi, P., Binzel, R.P. (Eds.),Asteroids III. University of Arizona Press, Tucson, pp. 395–408.
Burns, J.A., Safronov, V.S., 1973. Asteroid nutation angles. Mon. Not. R. Astron. Soc.165, 403–411.
Campins, H., Rieke, G.H., Lebofsky, M.J., 1985. Absolute calibration of photometry at1 through 5 microns. Astron. J. 90, 896–899.
Carbognani, A., 2008. Lightcurve photometry of NEAs 4450 Pan, (170891) 2004TY16, 2002 RC118, and 2007 VD12. Minor Planet Bull. 35, 109–110.
Chauvineau, B., Farinella, P., Harris, A.W., 1995. The evolution of Earth-approachingbinary asteroids: A Monte Carlo dynamical model. Icarus 115, 36–46.
Demura, H., and 19 colleagues, 2006. Pole and global shape of 25143 Itokawa.Science 312, 1347–1349.
Farinella, P., 1992. Evolution of Earth-crossing binary asteroids due to gravitationalencounters with the Earth. Icarus 96, 284–285.
Fujiwara, A., and 21 colleagues, 2006. The rubble-pile asteroid Itokawa as observedby Hayabusa. Science 312, 1330–1334.
Harris, A.W., 1994. Tumbling asteroids. Icarus 107, 209–211.Holsapple, K.A., 2001. Equilibrium configurations of solid cohesionless bodies.
Icarus 154, 432–448.Holsapple, K.A., 2004. Equilibrium figures of spinning bodies with self-gravity.
Icarus 172, 272–303.Hudson, S., 1993. Three-dimensional reconstruction of asteroids from radar
observations. Remote Sens. Rev. 8, 195–203.
M. Brozovic et al. / Icarus 208 (2010) 207–220 219

Hudson, R.S., Ostro, S.J., 1994. Shape of Asteroid 4769 Castalia (1989 PB) frominversion of radar images. Science 263, 940–943.
Hudson, R.S., Ostro, S.J., 1995. Shape and non-principal axis spin state of Asteroid4179 Toutatis. Science 270, 84–86.
Hudson, R.S., Ostro, S.J., 1999. Physical model of Asteroid 1620 Geographos fromradar and optical data. Icarus 140, 369–378.
Hudson, R.S., Ostro, S.J., Harris, A.W., 1997. Constraints on spin state and Hapkeparameters of Asteroid 4769 Castalia using lightcurves and a radar-derivedshape model. Icarus 130, 165–176.
Laskar, J., Robutel, P., 1993. The chaotic obliquity of the planets. Nature 361, 608–612.
Laskar, J., Joutel, F., Robutel, P., 1993. Stabilization of the Earth’s obliquity by theMoon. Nature 361, 615–617.
Leinhardt, Z.M., Richardson, D.C., Quinn, T., 2000. Direct N-body simulations ofrubble pile collisions. Icarus 146, 133–151.
Magri, C., Consolmagno, G.J., Ostro, S.J., Benner, L.A.M., Beeney, B.R., 2001. Radarconstraints on asteroid regolith properties using 433 Eros as ground truth.Meteorit. Planet. Sci. 36, 1697–1709.
Magri, C., Ostro, S.J., Scheeres, D.J., Nolan, M.C., Giorgini, J.D., Benner, L.A.M., Margot,J.-L., 2007. Radar observations and a physical model of Asteroid 1580 Betulia.Icarus 186, 152–177.
Margot, J.L., Nolan, M.C., Benner, L.A.M., Ostro, S.J., Jurgens, R.F., Giorgini, J.D., Slade,M.A., Campbell, D.B., 2002. Binary asteroids in the near-Earth object population.Science 296, 1445–1448.
Merline, W.J., Weidenschilling, S.J., Durda, D.D., Margot, J.-L., Pravec, P., Storrs, A.D.,2002. Asteroids do have satellites. In: Bottke, W.F., Cellino, A., Paolicchi, P.,Binzel, R.P. (Eds.), Asteroids III. University of Arizona Press, Tucson, pp. 289–312.
Michel, P., Froeschlé, Ch., Farinella, P., 1996. Dynamical evolution of two near-Earthasteroids to be explored by spacecraft. Astron. Astrophys. 313, 993–1007.
Ostro, S.J., 1993. Planetary radar astronomy. Rev. Mod. Phys. 65, 1235–1279.Ostro, S.J., Chandler, J.F., Hine, A.A., Rosema, K.D., Shapiro, I.I., Yeomans, D.K., 1990.
Radar images of Asteroid 1989 PB. Science 248, 1523–1528.Ostro, S.J., Hudson, R.S., Benner, L.A.M., Nolan, M.C., Margot, J.-L., Giorgini, J.D.,
Jurgens, R.F., Rose, R., Yeomans, D.K., 2000. Radar observations of Asteroid 4486Mithra. Bull. Am. Astron. Soc. 32, 1003.
Ostro, S.J., and 15 colleagues, 2004. Radar observations of Asteroid 25143 Itokawa(1998 SF36). Meteorit. Planet. Sci. 39, 407–424.
Ostro, S.J., and 12 colleagues, 2005. Radar observations of Itokawa in 2004 andimproved shape estimation. Meteorit. Planet. Sci. 40, 1563–1574.
Pravec, P., Harris, A.W., 2000. Fast and slow rotation of asteroids. Icarus 148, 12–20.Pravec, P., Harris, A.W., 2007. Binary asteroid population. I. Angular momentum
content. Icarus 190, 250–259.Pravec, P., and 19 colleagues, 2005. Tumbling asteroids. Icarus 173, 108–131.Pravec, P., and 56 colleagues, 2006. Photometric survey of binary near-Earth
asteroids. Icarus 181, 63–93.Richardson, D.C., Walsh, K.J., 2006. Binary minor planets. Annu. Rev. Earth Planet.
Sci. 34, 47–81.Richardson, D.C., Bottke, W.F., Love, S.G., 1998. Tidal distortion and disruption of
Earth-crossing asteroids. Icarus 134, 47–76.Richardson, D.C., Leinhardt, Z.M., Melosh, H.J., Bottke, W.F., Asphaug, E., 2002.
Gravitational aggregates: Evidence and evolution. In: Bottke, W.F., Cellino, A.,Paolicchi, P., Binzel, R.P. (Eds.), Asteroids III. University of Arizona Press, Tucson,pp. 501–515.
Rubincam, D.P., 2000. Radiative spin-up and spin-down of small asteroids. Icarus148, 2–11.
Scheeres, D.J., 2007a. The dynamical evolution of uniformly rotating asteroidssubject to YORP. Icarus 188, 430–450.
Scheeres, D.J., 2007b. Rotational fission of contact binary asteroids. Icarus 189, 370–385.
Scheeres, D.J., Mirrahimi, S., 2008. Rotational dynamics of a Solar System bodyunder solar radiation torques. Celest. Mech. Dynam. Astron. 101, 69–103.
Scheeres, D.J., Ostro, S.J., Hudson, R.S., Werner, R.A., 1996. Orbits close to Asteroid4769 Castalia. Icarus 121, 67–87.
Scheeres, D.J., Marzari, F., Rossi, A., 2004. Evolution of NEO rotation rates due toclose encounters with Earth and Venus. Icarus 170, 312–323.
Skoglöv, E., Magnusson, P., Dahlgren, M., 1996. Evolution of the obliquities for tenasteroids. Planet. Space Sci. 44, 1177–1183.
Statler, T.S., 2009. Extreme sensitivity of the YORP effect to small-scale topography.Icarus 202, 502–513.
Taylor, P.A., 2009. Preferential production of contact binary asteroids withcomponents of similar mass via angular momentum loss. Bull. Am. Astron.Soc. 41, 905.
Taylor, P.A., and 11 colleagues, 2007. Spin rate of Asteroid (54509) 2000 PH5increasing due to the YORP effect. Science 316, 274–277.
220 M. Brozovic et al. / Icarus 208 (2010) 207–220