Embed Size (px)
Citation preview

Dharmapuri – 636 703
Regulation : 2013
Branch : B.E. – ECE
Year & Semester : II Year / IV Semester
ICAL ENG
ANNA UNIVERSITY
EE6461- ELECTRICAL ENGINEERING ANDCONTROL SYSTEM LABORATORY
LAB MANUAL

EE6461 – ELECTRICAL ENGINEERING AND CONTROL SYSTEM LAB 2
VVIT DEPARTMENT OF ELECTRICAL AND ELECTRONICS ENGINEERING
ANNA UNIVERSITY : CHENNAI
REGULATION – 2013
EE6461 ELECTRICAL ENGINEERING AND CONTROL SYSTEM LABORATORY
LIST OF EXPERIMENTS:
1. Study of DC & AC motor starters
2. Study of three phase circuits
3. Speed Control of DC shunt motor
4. Load Test on DC shunt motor
5. OCC & Load Characteristics of DC shunt generator
6. Transfer Function of separately excited D.C Generator.
7. Regulation of three phase alternator
8. Open Circuit and Short Circuit test on single phase transformer to draw its equivalent circuit
9. Load test on single-phase transformer
10. Load test on single phase and three-phase Induction motor
11. Measurement of passive elements using Bridge Networks.
12. Study of transducers and characterization.
13. Digital simulation of linear systems.
14. Stability Analysis of Linear system using MATLAB or equivalent Software.
15. Study the effect of P, PI, PID controllers using MATLAB or equivalent Software.
16. Design of Lead and Lag compensator.
TOTAL: 45 PERIODS

EE6461 – ELECTRICAL ENGINEERING AND CONTROL SYSTEM LAB 3
VVIT DEPARTMENT OF ELECTRICAL AND ELECTRONICS ENGINEERING
INDEX
Sl.No DATE LIST OF EXPERIMENTS
STAFFSIGNATURE REMARKS
1 Load Test on DC Shunt Motor
2 Speed Control of DC Shunt Motor
3Open Circuit Characteristics of Self ExcitedDC Shunt Generator
4Load Characteristics of Self Excited DC ShuntGenerator
5 Load Test on Single Phase Transformer
6Open Circuit And Short Circuit Test on ASingle Phase Transformer
7 Load Test on Single Phase Induction Motor
8 Load Test on Three Phase Induction Motor
9Transfer Function of Separately DC ShuntGenerator
10 Transfer Function Of Self DC Shunt Generator
11 Study of DC Motor Starters
12 Study of Induction Motor Starters
13 Digital Simulation of Linear System
14 Stability Analysis of Linear System
15Study The Effect of P,PI,PID ControllersUsing Mat Lab
16 Design of Lead And Lag Compensator
17 Regulation of Three Phase Alternators
18 Study of Transducers and Characterization

EE6461 – ELECTRICAL ENGINEERING AND CONTROL SYSTEM LAB 4
VVIT DEPARTMENT OF ELECTRICAL AND ELECTRONICS ENGINEERING
INTRODUCTION
SYSTEM
The number of elements or components connected in sequence to form a group
and that group is said to be a system.
CONTROL SYSTEM
The output quantity is controlled by varying the input quantity. This system is
said to be control system.
Control systems are ubiquitous. They appear in our homes, in cars, in industry
and in systems for communication and transport, just to give a few examples. Control
is increasingly becoming mission critical; processes will fail if the control does not
work. Control has been important for design of experimental equipment and
instrumentation used in basic sciences and will be even more so in the future.
Principles of control also have an impact on such diverse fields as economics,
biology, and medicine.
Controls, like many other branches of engineering science, have developed in
the same pattern as natural science. Although there are strong similarities between
natural science and engineering science it is important to realize that there are some
fundamental differences. The inspiration for natural science is to understand
phenomena in nature. This has led to a strong emphasis on analysis and isolation of
specific phenomena, so called reductionism. A key goal of natural science is to find
basic laws that describe nature. The inspiration of engineering science is to
understand, invent, and design man-made technical systems. This places much more
emphasis on interaction and design. Interaction is a key feature of practically all
manmade systems. It is therefore essential to replace reductionism with a holistic
systems approach. The technical systems are now becoming so complex that they
pose challenges comparable to the natural systems.

EE6461 – ELECTRICAL ENGINEERING AND CONTROL SYSTEM LAB 5
VVIT DEPARTMENT OF ELECTRICAL AND ELECTRONICS ENGINEERING
A fundamental goal of engineering science is to find system principles that
make it possible to effectively design complex systems. Feedback, which is at the
heart of automatic control, is an example of such a principle.
A simple form of feedback consists of two dynamical systems connected in a
closed loop which creates an interaction between the systems. Simple causal
reasoning about such a system is difficult because, the first system influences the
second and the second system influences the first, leading to a circular argument.
This makes reasoning based on cause and effect difficult and it is necessary to
analyze the system as a whole. A consequence of this is that the behavior of a
feedback system is often counterintuitive.
To understand feedback systems it is therefore necessary to resort to formal
methods. Feedback has many advantages. It is possible to create linear behavior out of
nonlinear components. Feedback can make a system very resilient towards external
influences. The total system can be made very insensitive to external disturbances and
to variations in its individual components. Feedback has one major disadvantage; it
may create instability, which is intrinsically a dynamic phenomenon. To understand
feedback systems it is therefore necessary to have a good insight into dynamics. The
wide applicability of control has many advantages.
Since control can be used in so many different fields, it is a very good vehicle
for technology transfer. Ideas invented in one field can be applied to another technical
field. Control is inherently multi-disciplinary. A typical control system contains
sensors, actuators, computers and software. Analysis of design of control systems
require knowledge about the particular process to be controlled, knowledge of the
techniques of control and specific technology used in sensors and actuators.
Controllers are typically implemented using digital computers.

EE6461 – ELECTRICAL ENGINEERING AND CONTROL SYSTEM LAB 6
VVIT DEPARTMENT OF ELECTRICAL AND ELECTRONICS ENGINEERING
EX.NO : 01 LOAD TEST ON DC SHUNT MOTORDATE
AIM:
To conduct load test on DC shunt motor and to find efficiency.
APPARATUS REQUIRED:
Sl. No. Apparatus Range Type Quantity
1 Ammeter (0-20)A MC 1
2 Voltmeter (0-300)V MC 1
3 Rheostat 1250, 0.8A Wire Wound 1
4 Tachometer (0-1500) rpm Digital 1
5 Connecting Wires 2.5sq.mm. Copper Few
PRECAUTIONS:
1. DC shunt motor should be started and stopped under no load condition.
2. Field rheostat should be kept in the minimum position.
3. Brake drum should be cooled with water when it is under load.
PROCEDURE:
1. Connections are made as per the circuit diagram.
2. After checking the no load condition, and minimum field rheostat position, DPST switch is
closed and starter resistance is gradually removed.
3. The motor is brought to its rated speed by adjusting the field rheostat.
4. Ammeter, Voltmeter readings, speed and spring balance readings are noted under no load
condition.
5. The load is then added to the motor gradually and for each load, voltmeter, ammeter, spring
balance readings and speed of the motor are noted.
6. The motor is then brought to no load condition and field rheostat to minimum position, then
DPST switch is opened.

EE6461 – ELECTRICAL ENGINEERING AND CONTROL SYSTEM LAB 7
VVIT DEPARTMENT OF ELECTRICAL AND ELECTRONICS ENGINEERING
CIRCUIT DIAGRAM: (Load Test on DC Shunt Motor)
TABULAR COLUMN: (LOAD TEST ON DC SHUNT MOTOR)
Circumference of the Brake drum = cm.
S.No.
Voltage(VL )
Volts
Current(IL)
Amps
SpringBalanceReading
(S1S2)
Kg
Speed(N)
rpm
Torque(T)
Nm
OutputPower(Po)
Watts
InputPower
(Pi )
Watts
Efficiency()
%
S1
Kg
S2
Kg

EE6461 – ELECTRICAL ENGINEERING AND CONTROL SYSTEM LAB 8
VVIT DEPARTMENT OF ELECTRICAL AND ELECTRONICS ENGINEERING
MODEL GRAPHS: (Load Test on DC Shunt Motor)
FORMULAE:
1. Radius of brake drum(R) =п
m
2. Torque T = (S1 S2) x R x 9.81 Nm
3. Input Power Pi = V*I Watts
4. Output Power P0 =п
Watts
5. Efficiency % = x 100%
MODEL CALCULATIONS:
RESULT:
Thus the efficiency of the DC shunt motor with the load is tested.
Spee
d N
(rpm
)
Torq
ue T
(Nm
)
Effic
ienc
y %
N
T
y3 y2 y1
Output Power (Watts)
Spee
d N
(rpm
)
y
x
Torque T (Nm)

EE6461 – ELECTRICAL ENGINEERING AND CONTROL SYSTEM LAB 9
VVIT DEPARTMENT OF ELECTRICAL AND ELECTRONICS ENGINEERING
AIM:
To obtain speed control of DC shunt motor by
a. Varying armature voltage with field current constant.
b. Varying field current with armature voltage constant
APPARATUS REQUIRED:
Sl. No. Apparatus Range Type Quantity
1 Ammeter (0-20) A MC 1
2 Voltmeter (0-300) V MC 1
3 Rheostats1250, 0.8A
50, 3.5A
Wire
WoundEach 1
4 Tachometer (0-3000) rpm Digital 1
5 Connecting Wires 2.5sq.mm. Copper Few
PRECAUTIONS:
1. Field Rheostat should be kept in the minimum resistance position at the time of starting and
stopping the motor.
2. Armature Rheostat should be kept in the maximum resistance position at the time of starting
and stopping the motor.
PROCEDURE:
1. Connections are made as per the circuit diagram.
2. After checking the maximum position of armature rheostat and minimum position of field
rheostat, DPST switch is closed
(i) Armature Control:
Field current is fixed to various values and for each fixed value, by varying the armature
rheostat, speed is noted for various voltages across the armature.
EX.NO :02 SPEED CONTROL OF DC SHUNT MOTORDATE

EE6461 – ELECTRICAL ENGINEERING AND CONTROL SYSTEM LAB 10
VVIT DEPARTMENT OF ELECTRICAL AND ELECTRONICS ENGINEERING
(ii) Field Control:
1. Armature voltage is fixed to various values and for each fixed value, by adjusting
the field rheostat, speed is noted for various field currents.
2. Bringing field rheostat to minimum position and armature rheostat to maximum
position DPST switch is opened.
CIRCUIT DIAGRAM(Speed Control of DC Shunt Motor)
MODEL GRAPHS: (Speed Control of DC Shunt Motor)
1.2.3.4.5.Sp
eed
N (r
pm)
Spee
d N
(rpm
)
If (Amps)Va (Volts)
If1
If3
If2
Va3
Va1
Va2

EE6461 – ELECTRICAL ENGINEERING AND CONTROL SYSTEM LAB 11
VVIT DEPARTMENT OF ELECTRICAL AND ELECTRONICS ENGINEERING
TABULAR COLUMN:
(i) Armature Voltage Control:
S. No.
If1 = If2 = If3 =
ArmatureVoltage
(Va )Volts
Speed(N)
rpm
ArmatureVoltage
(Va)
Volts
Speed(N)
rpm
ArmatureVoltage ,
(Va)Volts
Speed(N)
rpm
(ii) Field Control:
S. No.
Va1 = Va2 = Va3 =
FieldCurrent
(If )Amps
Speed(N )
rpm
FieldCurrent
(If )Amps
Speed(N )
rpm
FieldCurrent
(If )Amps
Speed(N )
rpm
RESULT:
Thus the speed control of DC shunt motor by Varying armature voltage with field current constant
and Varying field current with armature voltage constant is verified.

EE6461 – ELECTRICAL ENGINEERING AND CONTROL SYSTEM LAB 12
VVIT DEPARTMENT OF ELECTRICAL AND ELECTRONICS ENGINEERING
EX.NO :03 OPEN CIRCUIT CHARACTERISTICS OF SELF EXCITED DC
SHUNT GENERATORDATE
AIM:
To obtain open circuit characteristics of self excited DC shunt generator and to find its
critical resistance.
APPARATUS REQUIRED:
FUSE RATING
125% of rated current (full load current)
PRECAUTIONS:
1. The field rheostat of motor should be in minimum resistance position at the time of starting and
stopping the machine.
2. The field rheostat of generator should be in maximum resistance position at the time of starting and
stopping the machine.
3. SPST switch is kept open during starting and stopping.
PROCEDURE:
1. Connections are made as per the circuit diagram.
2. After checking minimum position of motor field rheostat, maximum position of generator field
rheostat, DPST switch is closed and starting resistance is gradually removed.
3. By adjusting the field rheostat, the motor is brought to rated speed.
SL.
NO.APPARATUS RANGE TYPE QUANTITY
1 Ammeter (0-2)A MC 1
2 Voltmeter (0-300) V MC 1
3 Rheostats1250, 1A Wire
WoundEach 1
4 Tachometer (0-3000) rpm Digital 1
5 Connecting Wires 2.5sq.mm. Copper Few

EE6461 – ELECTRICAL ENGINEERING AND CONTROL SYSTEM LAB 13
VVIT DEPARTMENT OF ELECTRICAL AND ELECTRONICS ENGINEERING
4. Voltmeter and ammeter readings are taken when the SPST switch is kept open.
5. After closing the SPST switch, by varying the generator field rheostat, voltmeter and ammeter
readings are taken.
6. After bringing the generator rheostat to maximum position, field rheostat of motor to minimum
position, SPST switch is opened and DPST switch is opened.
CIRCUIT DIAGRAM: (Open Circuit Characteristics of Self Excited DC Shunt Generator)
TABULAR COLUMN: (Open Circuit Characteristics of Self Excited DC Shunt Generator)
SL.NOField Current
( If )Amps
Armature Voltage(E0)volts

EE6461 – ELECTRICAL ENGINEERING AND CONTROL SYSTEM LAB 14
VVIT DEPARTMENT OF ELECTRICAL AND ELECTRONICS ENGINEERING
MODEL GRAPH: (Open Circuit Characteristics of Self Excited DC Shunt Generator)
RESULT
Thus the self excited DC shunt generator open circuit characteristics are obtained and the
critical resistance is found.

EE6461 – ELECTRICAL ENGINEERING AND CONTROL SYSTEM LAB 15
VVIT DEPARTMENT OF ELECTRICAL AND ELECTRONICS ENGINEERING
EX.NO :04 LOAD CHARACTERISTICS OF SELF EXCITED DC SHUNTGENERATORDATE
AIM:
To obtain internal and external characteristics of DC shunt generator.
APPARATUS REQUIRED:
Sl. No. Apparatus Range Type Quantity
1 Ammeter(0-2)A
(0-20A)MC Each 1
2 Voltmeter (0-300) V MC 1
3 Rheostats 1250, 1A WireWound
Each 1
4 Tachometer (0-3000) rpm Digital 1
5 Connecting Wires 2.5sq.mm. Copper Few
PRECAUTIONS:
1. The field rheostat of motor should be at minimum position.
2. The field rheostat of generator should be at maximum position.
3. No load should be connected to generator at the time of starting and stopping.
PROCEDURE:
1. Connections are made as per the circuit diagram.2. After checking minimum position of DC shunt motor field rheostat and maximumposition of DC shunt generator field rheostat, DPST switch is closed and starting resistanceis gradually removed.3. Under no load condition, Ammeter and Voltmeter readings are noted, after bringing thevoltage to rated voltage by adjusting the field rheostat of generator.4. Load is varied gradually and for each load, voltmeter and ammeter readings are noted.
EE6461 – ELECTRICAL ENGINEERING AND CONTROL SYSTEM LAB 16
VVIT DEPARTMENT OF ELECTRICAL AND ELECTRONICS ENGINEERING
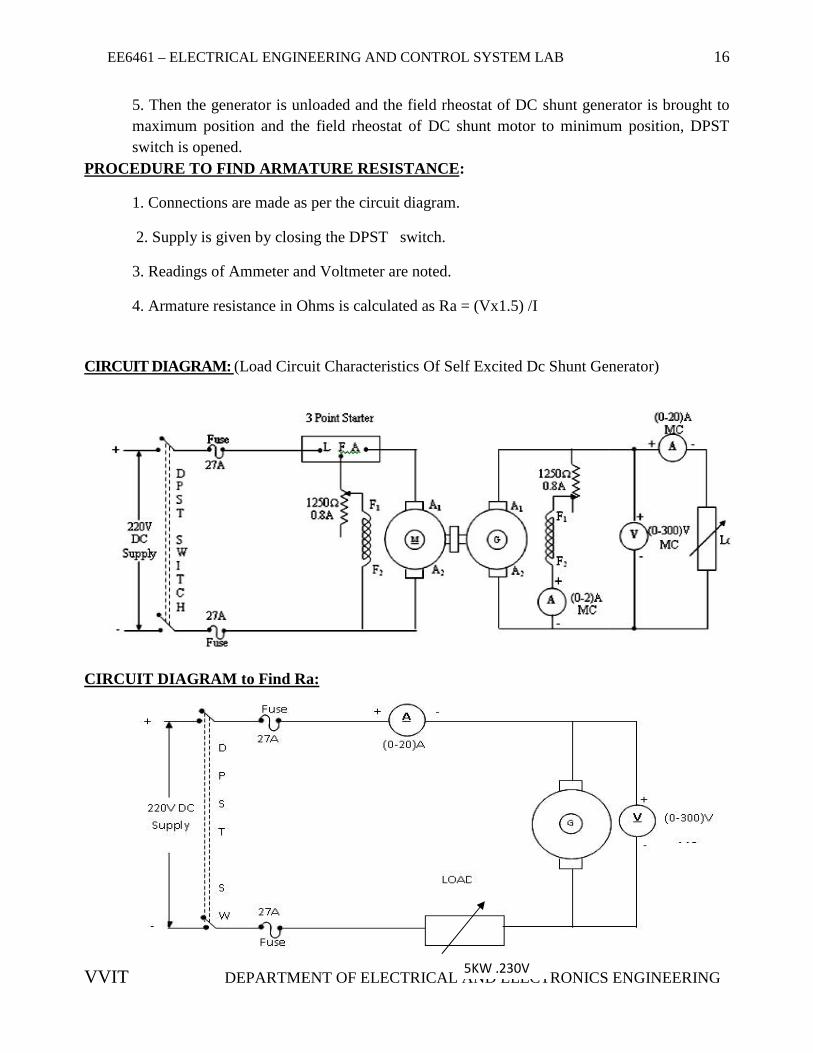
5. Then the generator is unloaded and the field rheostat of DC shunt generator is brought tomaximum position and the field rheostat of DC shunt motor to minimum position, DPSTswitch is opened.
PROCEDURE TO FIND ARMATURE RESISTANCE:
1. Connections are made as per the circuit diagram.
2. Supply is given by closing the DPST switch.
3. Readings of Ammeter and Voltmeter are noted.
4. Armature resistance in Ohms is calculated as Ra = (Vx1.5) /I
CIRCUIT DIAGRAM: (Load Circuit Characteristics Of Self Excited Dc Shunt Generator)
CIRCUIT DIAGRAM to Find Ra:
5KW ,230V
EE6461 – ELECTRICAL ENGINEERING AND CONTROL SYSTEM LAB 16
VVIT DEPARTMENT OF ELECTRICAL AND ELECTRONICS ENGINEERING
5. Then the generator is unloaded and the field rheostat of DC shunt generator is brought tomaximum position and the field rheostat of DC shunt motor to minimum position, DPSTswitch is opened.
PROCEDURE TO FIND ARMATURE RESISTANCE:
1. Connections are made as per the circuit diagram.
2. Supply is given by closing the DPST switch.
3. Readings of Ammeter and Voltmeter are noted.
4. Armature resistance in Ohms is calculated as Ra = (Vx1.5) /I
CIRCUIT DIAGRAM: (Load Circuit Characteristics Of Self Excited Dc Shunt Generator)
CIRCUIT DIAGRAM to Find Ra:
5KW ,230V

EE6461 – ELECTRICAL ENGINEERING AND CONTROL SYSTEM LAB 17
VVIT DEPARTMENT OF ELECTRICAL AND ELECTRONICS ENGINEERING
TABULATION: (Load Circuit Characteristics of Self Excited DC Shunt Generator)
S.L.NO
FieldCurrent
(If )Amps
LoadCurrent
(IL )Amps
TerminalVoltage
(V)volts
Ia=If+IL
Amps
Eg=V+IaRa
volts
FORMULAE:
Eg = V + Ia Ra (Volts)
Ia = IL + If (Amps)
Where,
Eg : Generated emf in VoltsV : Terminal Voltage in VoltsIa : Armature Current in AmpsIL : Line Current in AmpsIf : Field Current in AmpsRa : Armature Resistance in Ohms

EE6461 – ELECTRICAL ENGINEERING AND CONTROL SYSTEM LAB 18
VVIT DEPARTMENT OF ELECTRICAL AND ELECTRONICS ENGINEERING
TABULATION : (Load Circuit Characteristics of Self Excited DC Shunt Generator)
S.LNOVoltage
(V )Volts
Current(I )
Amps
Armature Resistance(Ra)ohms
MODEL GRAPH: (Load Circuit Characteristics of Self Excited DC Shunt Generator)
RESULT:
Thus the internal and external characteristics of DC shunt generator are verified.
EE6461 – ELECTRICAL ENGINEERING AND CONTROL SYSTEM LAB 19
VVIT DEPARTMENT OF ELECTRICAL AND ELECTRONICS ENGINEERING
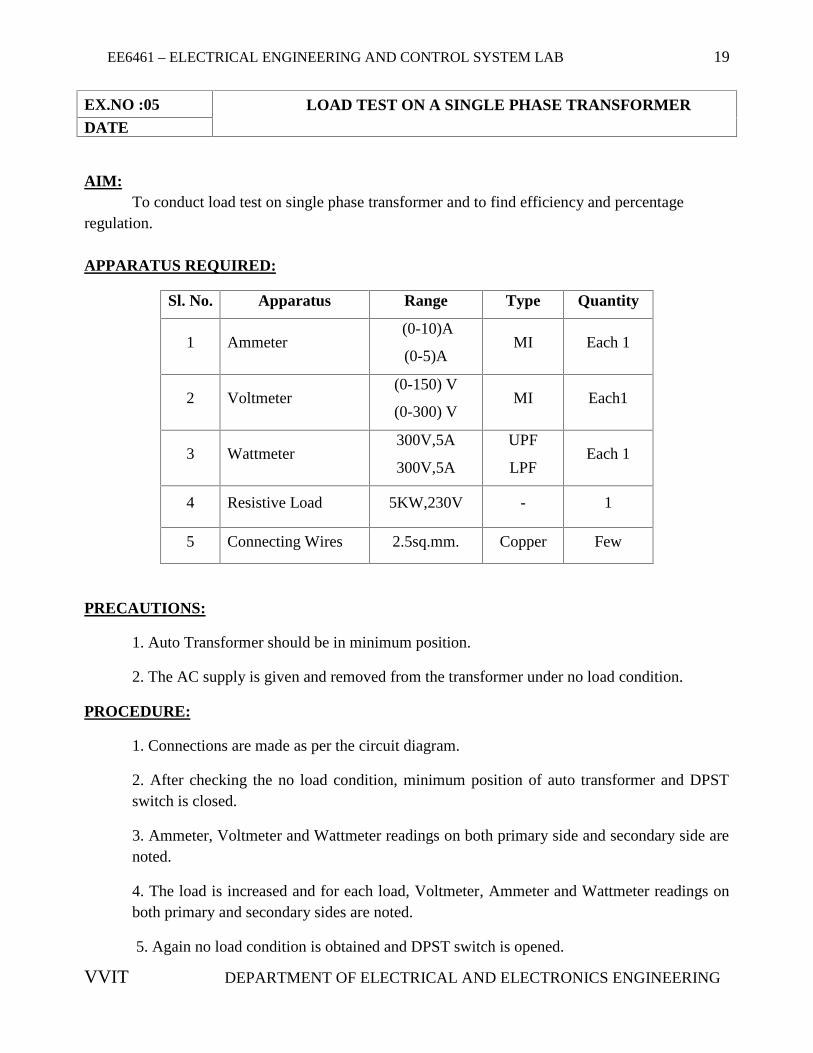
AIM:To conduct load test on single phase transformer and to find efficiency and percentage
regulation.
APPARATUS REQUIRED:
Sl. No. Apparatus Range Type Quantity
1 Ammeter(0-10)A
(0-5)AMI Each 1
2 Voltmeter(0-150) V
(0-300) VMI Each1
3 Wattmeter300V,5A
300V,5A
UPF
LPFEach 1
4 Resistive Load 5KW,230V - 1
5 Connecting Wires 2.5sq.mm. Copper Few
PRECAUTIONS:
1. Auto Transformer should be in minimum position.
2. The AC supply is given and removed from the transformer under no load condition.
PROCEDURE:
1. Connections are made as per the circuit diagram.
2. After checking the no load condition, minimum position of auto transformer and DPSTswitch is closed.
3. Ammeter, Voltmeter and Wattmeter readings on both primary side and secondary side arenoted.
4. The load is increased and for each load, Voltmeter, Ammeter and Wattmeter readings onboth primary and secondary sides are noted.
5. Again no load condition is obtained and DPST switch is opened.
EX.NO :05 LOAD TEST ON A SINGLE PHASE TRANSFORMERDATE

EE6461 – ELECTRICAL ENGINEERING AND CONTROL SYSTEM LAB 20
VVIT DEPARTMENT OF ELECTRICAL AND ELECTRONICS ENGINEERING
CIRCUIT DIAGRAM: (Load Test on A Single Phase Transformer)
MODEL GRAPH: (Load Test on A Single Phase Transformer)
EE6461 – ELECTRICAL ENGINEERING AND CONTROL SYSTEM LAB 20
VVIT DEPARTMENT OF ELECTRICAL AND ELECTRONICS ENGINEERING
CIRCUIT DIAGRAM: (Load Test on A Single Phase Transformer)
MODEL GRAPH: (Load Test on A Single Phase Transformer)
EE6461 – ELECTRICAL ENGINEERING AND CONTROL SYSTEM LAB 20
VVIT DEPARTMENT OF ELECTRICAL AND ELECTRONICS ENGINEERING
CIRCUIT DIAGRAM: (Load Test on A Single Phase Transformer)
MODEL GRAPH: (Load Test on A Single Phase Transformer)

TABULATION: (Load Test on A Single Phase Transformer)
(MF – Multiplication factor)
Sl.NO
Load
Primary Secondary
InpurpowerW1 XMF
Outpurpower
W2 X MF
%Efficiency %Regulation
V1
Volt
I1
Amp
W1
Watts
V2
Volt
I2
Amp
W2
Watts
Pin
Watts
Pout
Watts
ŋ ( %)%

FORMULAE:
RESULT:
Thus the load test on single phase transformer and to find efficiency and percentageregulation is conducted.
1.Output Power(Pout )= W2 x Multiplication factor
2.Input Power(Pin )= W1 x Multiplication factor
Output Power3.Efficiency in ŋ % = -------------------- x 100%
Input Power
VNL - VFL (Secondary)4.Regulation R % = ------------------------------ x 100%
VNL
Where,VNL – No load voltage in volts
VFL- Full load voltage in volts
W1- Primary watt meter reading in watts
W2- Secondary watt meter reading in watts

EE6461 – ELECTRICAL ENGINEERING AND CONTROL SYSTEM LAB 23
VVIT DEPARTMENT OF ELECTRICAL AND ELECTRONICS ENGINEERING
AIM:
To predetermine the efficiency and regulation of a transformer by conducting open circuittest and short circuit test and to draw equivalent circuit.
APPARATUS REQUIRED:
Sl. No. Apparatus Range Type Quantity
1 Ammeter(0-2)A
(0-5)AMC Each 1
2 Voltmeter (0-300) V MC 1
3 Wattmeter150V,5A
150V,5A
UPF
LPFEach 1
5 Connecting Wires 2.5sq.mm. Copper Few
PRECAUTIONS:
1. Auto Transformer should be in minimum voltage position at the time of closing & opening
DPST Switch.
PROCEDURE:
Open Circuit Test:
1. Connections are made as per the circuit diagram.
2. After checking the minimum position of Autotransformer, DPST switch is closed.
3. Auto transformer is adjusted get the rated primary voltage.
4. Voltmeter, Ammeter and Wattmeter readings on primary side are noted.
5. Auto transformer is again brought to minimum position and DPST switch is opened
EX.NO :06 OPEN CIRCUIT & SHORT CIRCUIT TEST ON ASINGLE PHASE TRANSFORMER
DATE

EE6461 – ELECTRICAL ENGINEERING AND CONTROL SYSTEM LAB 24
VVIT DEPARTMENT OF ELECTRICAL AND ELECTRONICS ENGINEERING
SHORT CIRCUIT TEST:
1. Connections are made as per the circuit diagram.
2. After checking the minimum position of Autotransformer, DPST switch is closed.
3. Auto transformer is adjusted get the rated primary current.
4. Voltmeter, Ammeter and Wattmeter readings on primary side are noted.
5. Auto transformer is again brought to minimum position and DPST switch is
opened.
CIRCUIT DIAGRAM: (Open Circuit Test)
TABULATION: (Open Circuit Test)
V0 – Open circuit voltage in volts
SL.NO
Voltage(V0)
Volts
Current(I0 )
Amps
Power(W0)
Watts

EE6461 – ELECTRICAL ENGINEERING AND CONTROL SYSTEM LAB 25
VVIT DEPARTMENT OF ELECTRICAL AND ELECTRONICS ENGINEERING
I0 – Open circuit current in Amps
W0– Open circuit power in watts
CIRCUIT DIAGRAM: (Short Circuit Test)
TABULATION FOR SHORT CIRCUIT:
SL.NO
Voltage(Vsh )
Volts
Current(Ish )
Amps
Power(Wsh )
Watts
V sh– Short circuit voltage in volts
Ish– Short circuit current in Amps
Wsh– Short circuit power in watts

EE6461 – ELECTRICAL ENGINEERING AND CONTROL SYSTEM LAB 26
VVIT DEPARTMENT OF ELECTRICAL AND ELECTRONICS ENGINEERING
FORMULA USED:
1.No load power factor CosǾ0= W0/ V0I0
Where V0- Open circuit voltage in volts
I0- Open circuit current in amps
W0- No load power in watts(Iron loss)
2.Working component of no load current Iw = Io cos Ǿ0
3.Magnetizing component of no load current Iµ= Io sinǾ0
4.RO= V0/ Iw
5.XO= V0/ Iµ
6.Equivalent impedence of transformer w.r.t HV side Z o2= Vsc / Isc
7. Equivalent resistance of transformer w.r.t HV side Ro2= Wsc / Isc2
8. Equivalent reactance of transformer w.r.t HV side Xo2= √ Z o22 -
Ro229.Transformer ratio K = V2 / V1
10. Equivalent resistance of transformer w.r.t LV side R o1= Ro2 / K2
11. Equivalent reactance of transformer w.r.t LV side Xo1= Xo2 / K2
MODEL GRAPH: (Short Circuit Test)

EE6461 – ELECTRICAL ENGINEERING AND CONTROL SYSTEM LAB 27
VVIT DEPARTMENT OF ELECTRICAL AND ELECTRONICS ENGINEERING
TO PREDETERMINE PECENTAGE EFFICIENCY :
1.Q = KVA of the given transformer
2.X= Fraction of load
3.Total Losses= X2 Wsc + W0
4.Input= Output + Losses
5.Percentage Efficency=(Output/ Input)*100
TO CALCULATE PERCENTAGE REGULATION:
1.For lagging power factor, Percentage Regulation = (X* Isc / V0)*(Ro2 Cosθ + Xo2 Sinθ) *100
2.For lagging power factor, Percentage Regulation=(X* Isc / V0)*(Ro2 Cosθ - Xo2 Sinθ) *100
RESULT:
Thus the efficiency and regulation of a transformer by conducting open circuit test and short circuittest and to draw equivalent circuit is determined.

EE6461 – ELECTRICAL ENGINEERING AND CONTROL SYSTEM LAB 28
VVIT DEPARTMENT OF ELECTRICAL AND ELECTRONICS ENGINEERING
AIM:
To conduct the direct load test on a given 3-phase induction motor and plot the performancecharacteristics of the machine.
APPARATUS REQUIRED:
Sl. No. Apparatus Range Type Quantity
1 Ammeter (0-10)A MI 1
2 Voltmeter (0-300) V MI 1
3 Wattmeter 300V,10A UPF Each 1
4Single phase auto
transformer0-230v AC 1
5 Connecting Wires 2.5sq.mm. Copper Few
PRECAUTIONS:
1. Motor should be started and stopped under no load condition.
2. Brake drum should be cooled with water when it is under load.
PROCEDURE:
1. Connections are made as per the circuit diagram.
2. The DPST switch is closed. The autotransformer is adjusted to get rated voltage
and corresponding no load readings are noted down.
3. Gradually increase the load upto the rated current and for each load the corresponding
meter readings are tabulated
4. Then load is removed and autotransformer reduced to zero. Then DPST switch opened.
EX.NO :07 LOAD TEST ON SINGLE PHASE INDUCTION MOTORDATE

EE6461 – ELECTRICAL ENGINEERING AND CONTROL SYSTEM LAB 29
VVIT DEPARTMENT OF ELECTRICAL AND ELECTRONICS ENGINEERING
CIRCUIT DIAGRAM (Load Test on Single phase Induction Motor)
EE6461 – ELECTRICAL ENGINEERING AND CONTROL SYSTEM LAB 29
VVIT DEPARTMENT OF ELECTRICAL AND ELECTRONICS ENGINEERING
CIRCUIT DIAGRAM (Load Test on Single phase Induction Motor)
EE6461 – ELECTRICAL ENGINEERING AND CONTROL SYSTEM LAB 29
VVIT DEPARTMENT OF ELECTRICAL AND ELECTRONICS ENGINEERING
CIRCUIT DIAGRAM (Load Test on Single phase Induction Motor)

TABULATION: (Load Test on Single phase Induction Motor)
Circumference of the Brake drum =___________meter
S.NO
Voltage(VL )
Volts
Current(IL)
Amps
SpringBalanceReading
(S1S2)
Kg
Speed(N)
rpm
Torque(T)
Nm
OutputPower(Po)
Watts
InputPower(Pi )
Watts
Efficiency()
%
Slip
%
Powerfactor
Cos Ø
S1
Kg
S2
Kg

FORMULAE:
1. Radius of brake drum(R) =п
m
2. Torque T = (S1 S2) x R x 9.81 Nm
3. Input Power Pi = V*I Watts
4. Output Power P0 =п
Watts
5. Efficiency % = x 100%
6. Slip Ns% = x 100%
Where , Ns(synchronous speed) = 1500 rpm, N = Actual speed for motor
CALCULATIONS:
RESULTS:
Thus the direct load test on a given 3-phase induction motor and plot the performancecharacteristics of the machine is conducted.

EE6461 – ELECTRICAL ENGINEERING AND CONTROL SYSTEM LAB 32
VVIT DEPARTMENT OF ELECTRICAL AND ELECTRONICS ENGINEERING
AIM:
To conduct the direct load test on a given 3-phase induction motor and plot theperformance characteristics of the machine.
APPARATUS REQUIRED:
Sl.
No.Apparatus Range Type Quantity
1 Ammeter (0-10)A MI 1
2 Voltmeter (0-300) V MI 1
3 Wattmeter
600 V,10A
(double
element)
UPF 1
4Three phase auto
transformer0-270v 1
5 Tachometer - - 1
6 Connecting Wires 2.5sq.mm. Copper Few
PRECAUTIONS: (Not to be included in the Record)
1. Remove the fuse carrier before starting wiring
2. Fuse rating calculation: Since this is load test, the required fuse rating is only120% of the rated current of the motor
3. Before switching on the supply ensure the motor in on no load condition and theautotransformer is in the minimum position
4. Replace the fuse carriers with appropriate fuse wires after the circuit connections arechecked by the staff in charge
EX.NO :08 LOAD TEST ON THREE PHASE INDUCTION MOTORDATE

EE6461 – ELECTRICAL ENGINEERING AND CONTROL SYSTEM LAB 33
VVIT DEPARTMENT OF ELECTRICAL AND ELECTRONICS ENGINEERING
PROCEDURE:
1. The connections are given as shown in circuit diagram.
2. The 3Ф ac supply is switched ON to the motor using the starter.
3. Under this load condition, one set of readings of the ammeter (IL), voltmeter (VL),wattmeter (W), spring balance and the speed (N) of motor are noted down.
4. Now the mechanical load on motor is increased in regular steps in such a way that thecurrent drawn by the motor increases in steps of 1A.
5. At each step of loading, the entire meter readings are noted down in the tabular column.
6. This procedure is continued until the current drawn by the motor equals 120% of its ratedvalue.
7. After the experiment is completed, the main supply is switched OFF.
8. After completing the experiment, Torque, Output Power, Power Factor, % Slip and% efficiency are calculated by using the given formulae.
9. Using the obtained data, the plot of % efficiency Vs Output power, .% Slip vs Outputpower, Speed vs Output power, power factor vs Output power, Line current vs Output powerand Slip vs torque
CIRCUIT DIAGRAM:( Load Test on Three Phase Induction Motor)
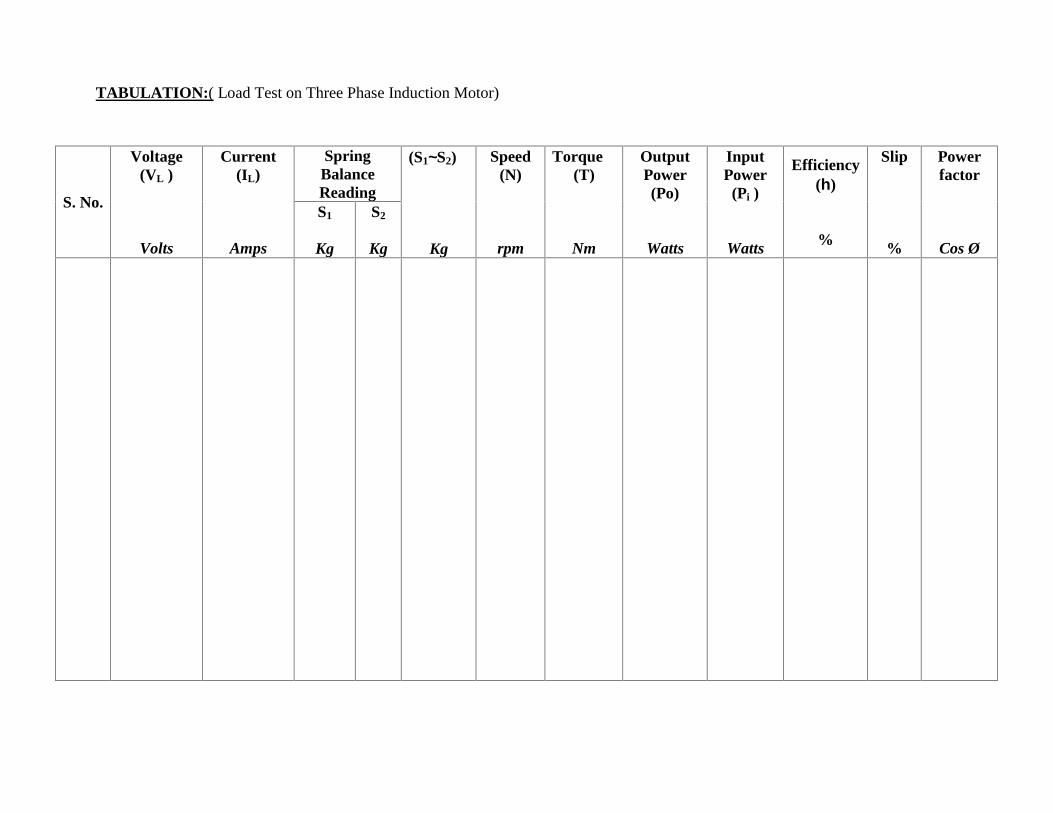
TABULATION:( Load Test on Three Phase Induction Motor)
S. No.
Voltage(VL )
Volts
Current(IL)
Amps
SpringBalanceReading
(S1S2)
Kg
Speed(N)
rpm
Torque(T)
Nm
OutputPower(Po)
Watts
InputPower
(Pi )
Watts
Efficiency()
%
Slip
%
Powerfactor
Cos Ø
S1
Kg
S2
Kg

MODEL GRAPH:( Load Test on Three Phase Induction Motor)
FORMULA:
1. Radius of brake drum(R) = m
2. Torque T = (S1 S2) x R x 9.81 Nm
3. Input Power Pi = V*I Watts
4. Output Power P0 = Watts
5. Efficiency % = x 100%
6. Slip Ns% = x 100%
Where , Ns(synchronous speed) = 1500 rpm, N = Actual speed for motor
RESULT :
Thus the direct load test on a given 3-phase induction motor and plot theperformance characteristics of the machine is verified.

EE6461 – ELECTRICAL ENGINEERING AND CONTROL SYSTEM LAB 36
VVIT DEPARTMENT OF ELECTRICAL AND ELECTRONICS ENGINEERING
AIM:
To obtain internal and external characteristics of DC separately excited DC shunt generator.
APPARATUS REQUIRED:
Sl. No. Apparatus Range Type Quantity
1 Ammeter(0-2)A
(0-20) A
MC
MC
1
1
2 Voltmeter (0-300)V MC 1
3 Rheostats 1200, 0.8A Wire Wound 2
4 Loading Rheostat 5KW, 230V - 1
5 Tachometer (0-1500)rpm Digital 1
6 Connecting Wires 2.5sq.mm. Copper Few
PRECAUTIONS:
1. The field rheostat of motor should be at minimum position.
2. The field rheostat of generator should be at maximum position.
3. No load should be connected to generator at the time of starting and stopping.
PROCEDURE:
1. Connections are made as per the circuit diagram.
2. After checking minimum position of DC shunt motor field rheostat and maximum position
of DC shunt generator field rheostat, DPST switch is closed and starting resistance is
gradually removed.
3. Under no load condition, Ammeter and Voltmeter readings are noted, after bringing the
voltage to rated voltage by adjusting the field rheostat of generator.
4. Load is varied gradually and for each load, voltmeter and ammeter readings are noted.
EX.NO :09TRANSFER FUNCTION OF SEPARATELY EXCITED
DC SHUNT GENERATORDATE

EE6461 – ELECTRICAL ENGINEERING AND CONTROL SYSTEM LAB 37
VVIT DEPARTMENT OF ELECTRICAL AND ELECTRONICS ENGINEERING
5. Then the generator is unloaded and the field rheostat of DC shunt generator is brought to
maximum position and the field rheostat of DC shunt motor to minimum position, DPST
switch is opened.
CIRCUIT DIAGRAM: (Transfer Function of Separately Excited DC Shunt Generator)
DETERMINATION OF ARMATURE RESISTANCE:
6.7.
D
P
S
T
S
W
I
T
C
H
+
-
-+
(0-300)V
MC
(0-20)A
MC
Fuse
Fuse
A1
A2
27A
27A
LOAD
5 KW, 230V
G
A
V220V DCSupply
+
-

EE6461 – ELECTRICAL ENGINEERING AND CONTROL SYSTEM LAB 38
VVIT DEPARTMENT OF ELECTRICAL AND ELECTRONICS ENGINEERING
TABULATION: (Transfer Function of Separately Excited DC Shunt Generator)
MODEL GRAPH: (Transfer Function of Separately Excited DC Shunt Generator)
S. No. Voltage(V )Volts
Current(I )
Amps
Armature Resistance( Ra )Ohms
S. No.
FieldCurrent
(If )Amps
LoadCurrent
(IL )Amps
TerminalVoltage
(V)Volts
Ia = IL + If
Amps
Eg =V + Ia Ra
Volts
V L, E
(Vol
ts)
If, IL (Amps)
V Vs IL
(Ext Char)
E Vs IL
(Int Char)

EE6461 – ELECTRICAL ENGINEERING AND CONTROL SYSTEM LAB 39
VVIT DEPARTMENT OF ELECTRICAL AND ELECTRONICS ENGINEERING
FORMULAE:
RESULT:
Thus the internal and external characteristics of DC separately excited DC shunt generator isobtained.
1.Eg = V + Ia Ra (Volts)
2.Ia = IL + If (Amps)
Where as
Eg : Generated emf in Volts
V : Terminal Voltage in Volts
Ia : Armature Current in Amps
IL : Line Current in Amps
If : Field Current in Amps
Ra : Armature Resistance in Ohms

EE6461 – ELECTRICAL ENGINEERING AND CONTROL SYSTEM LAB 40
VVIT DEPARTMENT OF ELECTRICAL AND ELECTRONICS ENGINEERING
AIM:
To obtain internal and external characteristics of DC shunt generator.
APPARATUS REQUIRED:
Sl. No. Apparatus Range Type Quantity
1 Ammeter(0-2)A
(0-20) A
MC
MC
1
1
2 Voltmeter (0-300)V MC 1
3 Rheostats 400, 0.8A Wire Wound 2
4 Loading Rheostat 5KW, 230V - 1
5 Tachometer (0-1500)rpm Digital 1
6 Connecting Wires 2.5sq.mm. Copper Few
PRECAUTIONS:
1. The field rheostat of motor should be at minimum position.
2. The field rheostat of generator should be at maximum position.
3. No load should be connected to generator at the time of starting and stopping.
PROCEDURE:
1. Connections are made as per the circuit diagram.
2. After checking minimum position of DC shunt motor field rheostat and maximum position of
DC shunt generator field rheostat, DPST switch is closed and starting resistance is gradually
removed.
3. Under no load condition, Ammeter and Voltmeter readings are noted, after bringing the
voltage to rated voltage by adjusting the field rheostat of generator.
EX.NO :10 TRANSFER FUNCTION OF SELF EXCITED
DC SHUNT GENERATORDATE

EE6461 – ELECTRICAL ENGINEERING AND CONTROL SYSTEM LAB 41
VVIT DEPARTMENT OF ELECTRICAL AND ELECTRONICS ENGINEERING
4. Load is varied gradually and for each load, voltmeter and ammeter readings are noted. Then
the generator is unloaded and the field rheostat of DC shunt generator is brought to
maximum position and the field rheostat of DC shunt motor to minimum position, DPST
switch is opened.
CIRCUIT DIAGRAM: (Transfer Function of Self Excited DC Shunt Generator)
DETERMINATION OF ARMATURE RESISTANCE:
D
P
S
T
S
W
I
T
C
+
-
-+
(0-300)V
MC
(0-20)A
MC
Fuse
Fuse
A1
A2
27A
27A
LOAD
5 KW, 230V
G
A
V220V DCSupply
+
-

EE6461 – ELECTRICAL ENGINEERING AND CONTROL SYSTEM LAB 42
VVIT DEPARTMENT OF ELECTRICAL AND ELECTRONICS ENGINEERING
PROCEDURE:
1. Connections are made as per the circuit diagram.
2. Supply is given by closing the DPST switch.
3. Readings of Ammeter and Voltmeter are noted.
4. Armature resistance in Ohms is calculated as Ra = (Vx1.5) /I
FORMULAE:
1.Eg = V + Ia Ra (Volts)
2.Ia = IL + If (Amps)
Where as
.Eg: Generated emf in Volts
. V : Terminal Voltage in Volts
Ia : Armature Current in Amps
IL : Line Current in Amps
If : Field Current in Amps
Ra: Armature Resistance in Ohms
TABULAR COLUMN: (Transfer Function of Self Excited DC Shunt Generator)
S. No. Voltage
(V)
Volts
Current
(I )
Amps
Armature Resistance
(Ra )
Ohms

EE6461 – ELECTRICAL ENGINEERING AND CONTROL SYSTEM LAB 43
VVIT DEPARTMENT OF ELECTRICAL AND ELECTRONICS ENGINEERING
MODEL GRAPH: (Transfer Function of Self Excited DC Shunt Generator)
RESULT:
Thus the open circuit characteristics of self excited DC shunt generator are obtained.
S. No.
FieldCurrent
(If )Amps
LoadCurrent
(IL)Amps
TerminalVoltage
(V)Volts
Ia = IL + If
Amps
Eg =V + Ia Ra
Volts
V L, E
(Vol
ts)
If, IL (Amps)
V Vs IL
(Ext Char)
E Vs IL
(Int Char)

EE6461 – ELECTRICAL ENGINEERING AND CONTROL SYSTEM LAB 44
VVIT DEPARTMENT OF ELECTRICAL AND ELECTRONICS ENGINEERING
AIM:
To study the different kinds of D.C motor starters
EQUIPMENT AND APPARATUS REQUIRED:
Sl. No. Name of the apparatus Quantity
1 Two Point starter 1
2 Three Point starter 1
3 Four Point starter 1
THEORY :
The value of the armature current in a D.C shunt motor is given by
Ia = ( V – Eb )/ Ra
Where V = applied voltage.
Ra = armature resistance.
E b = Back .e.m.f .
In practice the value of the armature resistance is of the order of 1 ohms and at the instant ofstarting the value of the back e.m.f is zero volts. Therefore under starting conditions the value of thearmature current is very high. This high inrush current at the time of starting may damage the motor.To protect the motor from such dangerous current the D.C motors are always started using starters.
The types of D.C motor starters arei) Two point startersii) Three point startersiii) Four point starters.The functions of the starters arei) It protects the dangerous high speed.ii) It protects the motor from overloads.
EX.NO :11STUDY OF D.C MOTOR STARTERS
DATE

EE6461 – ELECTRICAL ENGINEERING AND CONTROL SYSTEM LAB 45
VVIT DEPARTMENT OF ELECTRICAL AND ELECTRONICS ENGINEERING
i) TWO POINT STARTERS: ( refer fig 11.1)
It is used for starting D.C. series motors which has the problem of over speeding due to theloss of load from its shaft. Here for starting the motor the control arm is moved in clock-wisedirection from its OFF position to the ON position against the spring tension. The control arm is heldin the ON position by the electromagnet E. The exciting coil of the hold-on electromagnet E isconnected in series with the armature circuit. If the motor loses its load, current decreases and hencethe strength of the electromagnet also decreases. The control arm returns to the OFF position due tothe spring tension, Thus preventing the motor from over speeding. The starter also returns to theOFF position when the supply voltage decreases appreciably. L and F are the two points of thestarter which are connected with the motor terminals.
FIGURE 11.1

EE6461 – ELECTRICAL ENGINEERING AND CONTROL SYSTEM LAB 46
VVIT DEPARTMENT OF ELECTRICAL AND ELECTRONICS ENGINEERING
ii) THREE POINT STARTER: ( refer fig 11.2 )
It is used for starting the shunt or compound motor. The coil of the hold on electromagnet Eis connected in series with the shunt field coil. In the case of disconnection in the field circuit thecontrol arm will return to its OFF position due to spring tension. This is necessary because the shuntmotor will over speed if it loses excitation. The starter also returns to the OFF position in case of lowvoltage supply or complete failure of the supply. This protection is therefore is called No VoltRelease ( NVR).
OVER LOAD PROTECTION:
When the motor is over loaded it draws a heavy current. This heavy current also flowsthrough the exciting coil of the over load electromagnet ( OLR). The electromagnet then pulls aniron piece upwar6.ds which short circuits the coils of the NVR coil. The hold on magnet gets de-energized and therefore the starter arm returns to the OFF position, thus protecting the motor againstoverload. L, A and F are the three terminals of the three point starter.
FIGURE 11.2

EE6461 – ELECTRICAL ENGINEERING AND CONTROL SYSTEM LAB 47
VVIT DEPARTMENT OF ELECTRICAL AND ELECTRONICS ENGINEERING
iii) FOUR POINT STARTER: ( refer fig 11.3 )
The connection diagram of the four point starter is shown in fig 3. In a four point starter armtouches the starting resistance, the current from the supply is divided into three paths. One throughthe starting resistance and the armature, one through the field circuit, and one through the NVR coil.A protective resistance is connected in series with the NVR coil. Since in a four point starter theNVR coil is independent of the of the field circuit connection , the DC motor may over speed if thereis a break in the field circuit. A D.C motor can be stopped by opening the main switch. The steps ofthe starting resistance are so designed that the armature current will remain within the certain limitsand will not change the torque developed by the motor to a great extent.
FIGURE 11.3

EE6461 – ELECTRICAL ENGINEERING AND CONTROL SYSTEM LAB 48
VVIT DEPARTMENT OF ELECTRICAL AND ELECTRONICS ENGINEERING
RESULT:
Thus the construction and working of different starters for starting D.C series, shunt,compound and three phase induction motors are studied.

EE6461 – ELECTRICAL ENGINEERING AND CONTROL SYSTEM LAB 49
VVIT DEPARTMENT OF ELECTRICAL AND ELECTRONICS ENGINEERING
EX.NO :12 STUDY OF INDUCTION MOTOR STARTERSDATE
AUTO –TRANSFORMER STARTING( refer fig 12.1 )
An auto transformer starter consists of an auto transformer and a switch as shown in the fig.When the switch S is put on START position, a reduced voltage is applied across the motorterminals. When the motor picks up speed, say to 80 per cent of its normal speed, the switch is put toRUN position. Then the auto-transformer is cut out of the circuit and full rated voltage gets appliedacross the motor terminals.
The circuit diagram in the fig is for a manual auto-transformer starter. This can be made pushbutton operated automatic controlled starter so that the contacts switch over from start to runposition as the motor speed picks up to 80% of its speed. Over-load protection relay has not beenshown in the figure. The switch S is air-break type for small motors and oil break type for largemotors. Auto transformer may have more than one tapping to enable the user select any suitablestarting voltage depending upon the conditions. Series resistors or reactors can be used to causevoltage drop in them and thereby allow low voltage to be applied across the motor terminals atstarting. These are cut out of the circuit as the motor picks up speed.
FIGURE 12.1

EE6461 – ELECTRICAL ENGINEERING AND CONTROL SYSTEM LAB 50
VVIT DEPARTMENT OF ELECTRICAL AND ELECTRONICS ENGINEERING
STAR- DELTA METHOD OF STARTING: ( refer fig 12.2 )
The startor phase windings are first connected in star and full voltage is connected across itsfree terminals. As the motor picks up speed, the windings are disconnected through a switch andthey are reconnected in delta across the supply terminals. The current drawn by the motor from thelines is reduced to as compared to the current it would have drawn if connected in delta.The motorwindings, first in star and then in delta the line current drawn by the motor at starting is reduced toone third as compared to starting current with the windings delta-connected.
In making connections for star-delta starting, care should be taken such that sequence ofsupply connections to the winding terminals does not change while changing from star connection todelta connection. Otherwise the motor will start rotating in the opposite direction, when connectionsare changed from star to delta. Star-delta starters are available for manual operation using pushbutton control. An automatic star – delta starter used time delay relays(T.D.R) through which star todelta connections take place automatically with some pre-fixed time delay. The delay time of theT.D.R is fixed keeping in view the starting time of the motor.
FIGURE 12.2

EE6461 – ELECTRICAL ENGINEERING AND CONTROL SYSTEM LAB 51
VVIT DEPARTMENT OF ELECTRICAL AND ELECTRONICS ENGINEERING
FULL VOLTAGE OR DIRECT –ON-LINE STARTING( refer fig 12.3 )
When full voltage is connected across the stator terminals of an induction motor, largecurrent is drawn by the windings. This is because, at starting the induction motor behaves as a shortcircuited transformer with its secondary, i.e. the rotor separated from the primary, i.e. the stator by asmall air-gap. At starting when the rotor is at stand still, emf is induced in the rotor circuit exactlysimilar to the emf induced in the secondary winding of a transformer. This induced emf of the rotorwill circulate a very large current through its windings.
The primary will draw very large current from the supply mains to balance the rotor ampere-turns. To limit the stator and rotor currents at starting to a safe value, it may be necessary to reducethe stator supply voltage to a low value. If induction motors are started direct-on-line such a heavystarting current of short duration may not cause harm to the motor since the construction ofinduction motors are rugged.
Other motors and equipment connected to the supply lines will receive reduced voltage. Inindustrial installations, however, if a number of large motors are started by this method, the voltagedrop will be very high and may be really objectionable for the other types of loads connected to thesystem. The amount of voltage drop will not only be dependent on the size of the motor but also onfactors like the capacity of the power supply system, the size and length of the line leading to themotors etc. Indian Electricity Rule restricts direct on line starting of 3 phase induction motors above5 hp.
FIGURE 12.3

EE6461 – ELECTRICAL ENGINEERING AND CONTROL SYSTEM LAB 52
VVIT DEPARTMENT OF ELECTRICAL AND ELECTRONICS ENGINEERING
RESULT:
Thus the construction and working of different starters for starting three phase inductionmotors are studied.

EE6461 – ELECTRICAL ENGINEERING AND CONTROL SYSTEM LAB 53
VVIT DEPARTMENT OF ELECTRICAL AND ELECTRONICS ENGINEERING
EX.NO :13 Digital Simulation of Linear SystemsDATE
AIM:To digitally simulate the time response characteristics of higher-order MIMO linear systems
using state – variable formulation
EQUIPMENTS REQUIRED:PC system with mat lab
THEORY:
INTRODUCTION TO MATLAB & SIMULINK
MATLAB® is a high-performance language for technical computing. It integratescomputation, visualization, and programming in an easy-to-use environment where problems andsolutions are expressed in familiar mathematical notation. Typical uses include
Math and computation Algorithm development Data acquisition Modeling, simulation, and prototyping Data analysis, exploration, and visualization Scientific and engineering graphics Application development, including graphical user interface building
MATLAB is an interactive system whose basic data element is an array that does not requiredimensioning. This allows you to solve many technical computing problems, especially those withmatrix and vector formulations, in a fraction of the time it would take to write a program in a scalarno interactive language such as C or FORTRAN.
The name MATLAB stands for matrix laboratory. MATLAB was originally written toprovide easy access to matrix software developed by the LINPACK and EISPACK projects. Today,MATLAB engines incorporate the LAPACK and BLAS libraries, embedding the state of the art insoftware for matrix computation.

EE6461 – ELECTRICAL ENGINEERING AND CONTROL SYSTEM LAB 54
VVIT DEPARTMENT OF ELECTRICAL AND ELECTRONICS ENGINEERING
MATLAB PROGRAM:Open new m file and type the given program% State Space Analysis of MIMO System%-----X^ = Ax+Bu; y =Cx+Du -------%A=[-1 -1; 6.5 0]; %----State Matrix-----%B=[1 1;1 0]; %----Input Matrix------%C=[1 0;0 1]; %----Output Matrix ------%D=[0 0;0 1]; %----Transistion Matrix---%step(A,B,C,D,1)holdstep(A,B,C,D,2)title('Step Response of MIMO System')grid[num1,den1]=ss2tf(A,B,C,D,1)[num2,den2]=ss2tf(A,B,C,D,2)n1=num1(1,:)n2=num1(2,:)n3=num2(1,:)n4=num2(2,:)d1=den1(1,:)d2=den2(1,:)tf1=tf(n1,d1)tf2=tf(n2,d1)tf3=tf(n3,d2)tf4=tf(n4,d2)
EE6461 – ELECTRICAL ENGINEERING AND CONTROL SYSTEM LAB 55
VVIT DEPARTMENT OF ELECTRICAL AND ELECTRONICS ENGINEERING
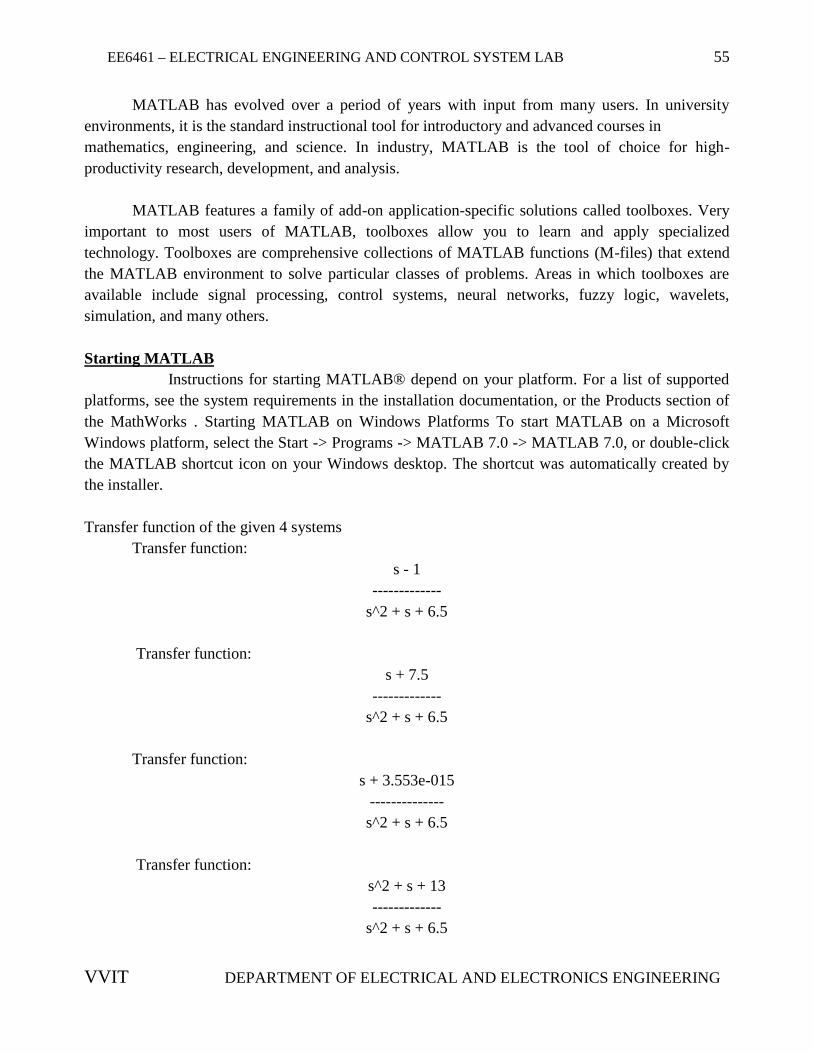
MATLAB has evolved over a period of years with input from many users. In universityenvironments, it is the standard instructional tool for introductory and advanced courses inmathematics, engineering, and science. In industry, MATLAB is the tool of choice for high-productivity research, development, and analysis.
MATLAB features a family of add-on application-specific solutions called toolboxes. Veryimportant to most users of MATLAB, toolboxes allow you to learn and apply specializedtechnology. Toolboxes are comprehensive collections of MATLAB functions (M-files) that extendthe MATLAB environment to solve particular classes of problems. Areas in which toolboxes areavailable include signal processing, control systems, neural networks, fuzzy logic, wavelets,simulation, and many others.
Starting MATLABInstructions for starting MATLAB® depend on your platform. For a list of supported
platforms, see the system requirements in the installation documentation, or the Products section ofthe MathWorks . Starting MATLAB on Windows Platforms To start MATLAB on a MicrosoftWindows platform, select the Start -> Programs -> MATLAB 7.0 -> MATLAB 7.0, or double-clickthe MATLAB shortcut icon on your Windows desktop. The shortcut was automatically created bythe installer.
Transfer function of the given 4 systemsTransfer function:
s - 1-------------
s^2 + s + 6.5
Transfer function:s + 7.5
-------------s^2 + s + 6.5
Transfer function:s + 3.553e-015
--------------s^2 + s + 6.5
Transfer function:s^2 + s + 13-------------
s^2 + s + 6.5

EE6461 – ELECTRICAL ENGINEERING AND CONTROL SYSTEM LAB 56
VVIT DEPARTMENT OF ELECTRICAL AND ELECTRONICS ENGINEERING
FOR IMPULSE RESPONSEresponse MIMO system% State Space Analysis of MIMO System%-----X^ = Ax+Bu; y =Cx+Du -------%A=[-1 -1; 6.5 0];%----State Matrix-----%B=[1 1;1 0];%----Input Mtrix------%C=[1 0;0 1];%----Output Matrix ------%D=[0 0;0 1];%----Transistion Matrix---%impulse(A,B,C,D,1)holdimpulse(A,B,C,D,2)title('Impulse Response of MIMO System')grid[num1,den1]=ss2tf(A,B,C,D,1)[num2,den2]=ss2tf(A,B,C,D,2)n1=num1(1,:)n2=num1(2,:)n3=num2(1,:)n4=num2(2,:)d1=den1(1,:)d2=den2(1,:)tf1=tf(n1,d1)tf2=tf(n2,d1)tf3=tf(n3,d2)tf4=tf(n4,d2)

EE6461 – ELECTRICAL ENGINEERING AND CONTROL SYSTEM LAB 57
VVIT DEPARTMENT OF ELECTRICAL AND ELECTRONICS ENGINEERING
RESULT:
Thus the time response characteristics of higher-order MIMO linear systems using state – variableformulation is simulated.

EE6461 – ELECTRICAL ENGINEERING AND CONTROL SYSTEM LAB 58
VVIT DEPARTMENT OF ELECTRICAL AND ELECTRONICS ENGINEERING
AIM:
To analyze the stability of linear systems using Bode, Root locus, Nyquist plots
EQUIPMENTS REQUIRED:
PC system with mat lab
PROGRAM:
STABILITY ANALYSISProgram For Nyquist Plot.%---Given System G(s)=1/(s^2+0.8s+1)-----%%--------Nyquist plot-----------%num=[0 0 1];den=[1 0.8 1];nyquist(num,den);axis(v)gridtitle('Nyquist plot of G(s)=1/(s^2+0.8s+1)')xlabel('Real axis')ylabel('Imag axis')hold on
RESPONSE OF VARIOUS SYSTEMS:
Nyquist plot of)18.0(
1)(
2
sssG
EX.NO :14 Stability Analysis of Linear SystemsDATE

EE6461 – ELECTRICAL ENGINEERING AND CONTROL SYSTEM LAB 59
VVIT DEPARTMENT OF ELECTRICAL AND ELECTRONICS ENGINEERING
PROGRAM FOR ROOT LOCUS
%---conditionally stable system--%%---Given System G(s)=k(s^2+2s+4)/[s(s+4)(s+6)(s^2+1.4s+1)-----%clc;close all;clear all;%--------Root Locus----------%numz=[0 0 0 1 2 4];denp=[1 11.4 39 43.6 24 0];r=rlocus(numz,denp);plot(r,'o');axis(v)gridtitle('Root locus plot ofG(s)=k(s^2+2s+4)/[s(s+4)(s+6)(s^2+1.4s+1)]')xlabel('real axis')ylabel('imag axis')hold
ROOT LOCUS
Root locus plot of
)14.1)(6)(4(
42)(
2
2
sssss
ssksG

EE6461 – ELECTRICAL ENGINEERING AND CONTROL SYSTEM LAB 60
VVIT DEPARTMENT OF ELECTRICAL AND ELECTRONICS ENGINEERING
PROGRAM FOR BODE PLOT%---Given System=s^3+2s+3/(s^5+s^4+s^3+s^2+s+1)---%%--------Bode Plot ----------%numg=[1 0 2 3];deng=[1 1 1 1 1 1 ];'G(s)'u=tf(numg,deng);bode(u)gridholdtitle('Bode plot of G(s)=s^3+2s+3/(s^5+s^4+s^3+s^2+s+1)')[Gm,Pm,Wcg,Wcp] = margin(u)Gm_dB = 20*log10(Gm)
BODE PLOT

EE6461 – ELECTRICAL ENGINEERING AND CONTROL SYSTEM LAB 61
VVIT DEPARTMENT OF ELECTRICAL AND ELECTRONICS ENGINEERING
PROGRAM FOR POLAR PLOT
format compactset (gcf,'Toolbar','none','Name','Polar Plot', ...
'Number Title','off','Position',[10,350,350,300]);theta = 2*pi*linspace(0,1,30);r = 2*(1 + cos(theta));Polar (theta,r,'r-')Set (gca,'Position',[0.1 0.1 0.75 0.75]);Title ('\bf\itA PolarPlot','Color','k','VerticalAlignment','bottom')textstr (1)='r = 2(1+cos\theta)';textstr(2)='\theta = 0 -> 2\pi';text(5*cos(pi/4),5*sin(pi/4), ...
strcat(textstr))title('Polar plot ')
hold
POLAR PLOT

EE6461 – ELECTRICAL ENGINEERING AND CONTROL SYSTEM LAB 62
VVIT DEPARTMENT OF ELECTRICAL AND ELECTRONICS ENGINEERING
PROGRAM FOR NICHOLS CHART
%Plot the Nichols response of the systemnum = [-4 48 -18 250 600];den = [1 30 282 525 60];H = tf(num,den)nichols(H); ngrid
NICHOLS CHART
RESULT:
Thus the stability of linear systems using Bode, Root locus, Nyquist plots is analysed.

EE6461 – ELECTRICAL ENGINEERING AND CONTROL SYSTEM LAB 63
VVIT DEPARTMENT OF ELECTRICAL AND ELECTRONICS ENGINEERING
EX.NO :15 STUDY THE EFFECT OF P, PI, PID CONTROLLERS USINGMAT LABDATE
AIM:To Study the effect of P, PI, PID controllers using Mat lab.
THEORY
1 Choice of the Controller type
In so far were described proportional, integrative and derivative modes of the controllers anda rational behind their use was explained. However, excerpt for a few tips, an attention was notgiven to a question when to use different types of controllers. The rest of this section will give someanswers on that particular topic.
1.1 On-off ControllerOn-off controller is the simplest controller and it has some important advantages. It is
economical, simple to design and it does not require any parameter tuning. If oscillations willhamper the operation of the system and if controller parameter tuning is to be avoided, on-offcontroller is a good solution. In addition, if actuators work in only two modes (on and off), then it isalmost always only controller that can be used with such actuators. That is a reason why on-offcontrollers are often used in home appliances (refrigerators, washers etc.) and in process industrywhen control quality requirements are not high (temperature control in buildings etc.). Additionaladvantage of on-off controllers is that they in general do not require any maintenance.
1.2 P ControllerWhen P controller is used, large gain is needed to improve steady state error. Stable system
do not have a problems when large gain is used. Such systems are systems with one energy storage(1st order capacitive systems). If constant steady state error can be accepted with such processes,than P controller can be used. Small steady state errors can be accepted if sensor will give measuredvalue with error or if importance of measured value is not too great anyway. Example of suchsystem is liquid level control in tanks when exact approximate level of liquid suffice for the properplant operation. Also, in cascade control sometime it is not important if there is an error inside innerloop, so P controller can a good solution in such cases.
Derivative mode is not required if the process itself is fast or if the control system as wholedoes not have to be fast in response. Processes of 1st order react immediately on the reference signalchange, so it is not necessary to predict error (introduce D mode) or compensate for the steady stateerror (introduce I mode) if it is possible to achieve satisfactory steady state error using only Pcontroller.

EE6461 – ELECTRICAL ENGINEERING AND CONTROL SYSTEM LAB 64
VVIT DEPARTMENT OF ELECTRICAL AND ELECTRONICS ENGINEERING
1.3 PD controllerIt is well known that thermal processes with good thermal insulation act almost as
integrators. Since insulation is good and thermal losses are small, the most significant art of theenergy that is led to the system is used temperature rise. Those processes allow 18 for large gains sothat integral mode in the controller is not needed. These processes can be described as differentconnections of thermal energy storages. Thermal energy is shifted from one storage into another. Ingeneral, with such processes there is present a process dynamics with large inertia. Since dynamicsis slow, derivative mode is required for control of such processes. Integral mode would only alreadyslow dynamics make more slowly. The other reason for using PPD controllers in such systems arethat is possible to measure temperature with low level of noise in the measured signal.
PD controller is often used in control of moving objects such are flying and underwatervehicles, ships, rockets etc. One of the reason is in stabilizing effect of PD controller on suddenchanges in heading variable y(t). Often a "rate gyro" for velocity measurement is used as sensor ofheading change of moving object.
1.3 PI controllerPI controllers are the most often type used today in industry. A control without D mode is
used when:a) fast response of the system is not requiredb) large disturbances and noise are present during operation of the processc) there is only one energy storage in process (capacitive or inductive)d) there are large transport delays in the system
If there are large transport delays present in the controlled process, error prediction isrequired. However, D mode cannot be used for prediction because every information is delayed tillthe moment when a change in controlled variable is recorded. In such cases it is better to predict theoutput signal using mathematical model of the process in broader sense (process + actuator). Thecontroller structures that can be used are, for example, Otto-Smith predictor (controller), PIPcontroller or so called Internal Model Controller (IMC).
An interesting feature of IMC is that when the model of the process is precise (A = AM andB = BM), then a feedback signal eM = y – yM is equal to disturbance:
It follows that a control signal is not influenced by the reference signal and control systemsbehaves as open loop. A usual problems with stability that arrise when closed loop systems are usedare then avoided. Control system with IMC controller will be stable and if IMC and process arestable. With the exact model of process IMC is actually a feed forward controller and can designedas such, but, unlike feed forward controllers, it can compensate for unmeasured disturbances becausefeedback signal is equal to disturbance, which allows suitable tuning of the reference value of thecontroller.

EE6461 – ELECTRICAL ENGINEERING AND CONTROL SYSTEM LAB 65
VVIT DEPARTMENT OF ELECTRICAL AND ELECTRONICS ENGINEERING
If model of the process is not exact5 (AM = A, BM =B), then feedback signal eM will
contain not only disturbance d but a modeling error, also. Thus, a feedback willhave its usual role, and stability problem can arise. This requires for parameters6 to be tuned againso the stability is not lost.
1.4 PID controllerDerivative mode improves stability of the system and enables increase in gain K and
decrease in integral time constant Ti, which increases speed of the controller response. PIDcontroller is used when dealing with higher order capacitive processes (processes with more thanone energy storage) when their dynamic is not similar to the dynamics of an integrator (like in manythermal processes). PID controller is often used in industry, but also in the control of mobile objects(course and trajectory following included) when stability and precise reference following arerequired. Conventional autopilot are for the most part PID type controllers.
1.5 Topology of PID controllersProblem of topology (structure) of controller arises when:
designing control system (defining structure and controller parameters) tuning parameters of the given controller
There are a number of different PID controller structures. Different manufacturers designcontrollers in different manner. However, two topologies are the most often case: parallel (non-interactive)
serial (interactive)
Parallel structure is most often in textbooks, so it is often called "ideal" or "textbook type".This non-interactive structure because proportional, integral and derivative mode are independent oneach other. Parallel structure is still very rare in the market. The reason for that is mostly historical.First controllers were pneumatic and it was very difficult to build parallel structure using pneumaticcomponents. Due to certain conservatism in process industry most of the controller used there arestill in serial structure, although it is relatively simple to realize parallel structure controller usingelectronics. In other areas, where tradition is not so strong, parallel structure can be found moreoften.
1.5.1 Parallel PID topologyA parallel connection of proportional, derivative and integral element is called parallel or
non-interactive structure of PID controller. Parallel structure is shown in Fig.It can be seen that P, I and D channels react on the error signal and that they are unbundled.
This is basic structure of PID controller most often found in textbooks. There are other non-interactive structures.

EE6461 – ELECTRICAL ENGINEERING AND CONTROL SYSTEM LAB 66
VVIT DEPARTMENT OF ELECTRICAL AND ELECTRONICS ENGINEERING
CIRCUIT DIAGRAM (EFFECT OF P, PI, PID CONTROLLERS)
EE6461 – ELECTRICAL ENGINEERING AND CONTROL SYSTEM LAB 66
VVIT DEPARTMENT OF ELECTRICAL AND ELECTRONICS ENGINEERING
CIRCUIT DIAGRAM (EFFECT OF P, PI, PID CONTROLLERS)
EE6461 – ELECTRICAL ENGINEERING AND CONTROL SYSTEM LAB 66
VVIT DEPARTMENT OF ELECTRICAL AND ELECTRONICS ENGINEERING
CIRCUIT DIAGRAM (EFFECT OF P, PI, PID CONTROLLERS)

EE6461 – ELECTRICAL ENGINEERING AND CONTROL SYSTEM LAB 67
VVIT DEPARTMENT OF ELECTRICAL AND ELECTRONICS ENGINEERING
RESULT:
Thus the effect of P, PI, PID controllers using Mat lab are studied.
EE6461 – ELECTRICAL ENGINEERING AND CONTROL SYSTEM LAB 67
VVIT DEPARTMENT OF ELECTRICAL AND ELECTRONICS ENGINEERING
RESULT:
Thus the effect of P, PI, PID controllers using Mat lab are studied.
EE6461 – ELECTRICAL ENGINEERING AND CONTROL SYSTEM LAB 67
VVIT DEPARTMENT OF ELECTRICAL AND ELECTRONICS ENGINEERING
RESULT:
Thus the effect of P, PI, PID controllers using Mat lab are studied.

EE6461 – ELECTRICAL ENGINEERING AND CONTROL SYSTEM LAB 68
VVIT DEPARTMENT OF ELECTRICAL AND ELECTRONICS ENGINEERING
EX.NO :16 DESIGN AND IMPLEMENTATION OF COMPENSATORSDATE
AIM:
To study the compensation of the second order process by using lead – Lag Compensator
EQUIPMENT REQUIRED:
1. LEAD – Lag network system kit2. Capacitors – 0.1μF3. Decade Resistance Box4. CRO
DESIGN:
1. Lead – Lag network using operational amplifier:2. An electronic lead –lag network using operational Amplifier is shown in Fig.
PROCEDURE:
3. Switch ON the power to the instrument.4. Connect the individual blocks using patch chords bypassing the compensating network
and gain as shown in fig. 4.2.5. Give a sinusoidal input as the set value to the error detector.6. Measure the amplitude and frequency of the input signal.7. Measure the amplitude and phase difference of the output signal with respect to the input
signal using DSO.8. Using the technique explained previously, calculate the values of R1, R2, C2, and C1 to
compensate for the phase shift of the output signal.9. Connects the components at the points provided.10. Now include the compensation block in the forward path before the process using patch
chords as shown in fig.4.2.11. Observe the compensated wave form through DSO.
The transfer function for this circuit can be obtained as follows:
Let
Z1 = R1 || C1
Z2 = R2 || C2

EE6461 – ELECTRICAL ENGINEERING AND CONTROL SYSTEM LAB 69
VVIT DEPARTMENT OF ELECTRICAL AND ELECTRONICS ENGINEERING
The second op-amp acts as a sign inverter with a variable gain to compensate for the
magnitude. The transfer function of the entire system is given by G(j).
)1(
)1()(
2213
1124
sCRRR
sCRRRsG
We have
)1(
)1()(
22231
22142
TRR
TRRjG
Where
T1 = R1C1
T2 = R2C2 and
Thus the steady state output is
)tantan()1(
)1()( 2
11
1
22231
22142
TTtSin
TRR
TRRtYss
for an input Esint.
From this expression, we find that if T1>T2, then 21
11 tantan TT >0. Thus if T1>T2, then the
network is a lead network. If T1 <T2, the network is a lag network.
Determination of values for angle compensation:
Frequency of sine wave (f)= 20Hz.
Phase angle to be compensated =14.50
sec023.0
)*20*2(tan)1.0*20*2(tan5.14
sec1.0
)2(tan)2(tan
2
211
1
21
11
T
T
TLet
fTfT

EE6461 – ELECTRICAL ENGINEERING AND CONTROL SYSTEM LAB 70
VVIT DEPARTMENT OF ELECTRICAL AND ELECTRONICS ENGINEERING
CIRCUIT DIAGRAM:(Lead-Lag Compensators)
TABULATION: (Lead-Lag Compensators)
SiNo
Amplitude
V
Frequency
Hz
PhaseShift
Resistance
(R1)
Ohms
Capacitance
(C1 )
Farad
Resistance
(R2)
Ohms
Capacitance
(C2 )
Farad

EE6461 – ELECTRICAL ENGINEERING AND CONTROL SYSTEM LAB 71
VVIT DEPARTMENT OF ELECTRICAL AND ELECTRONICS ENGINEERING
CALCULATION: (frequency = Hz)
Hence the values of T1 and T2 are chosen from which the values of R1, R2, C1, and C2 can bedetermined. For Example,
T1 = R1C1 = 0.1;
If C1 = 0.1μF, R1=1MΩ
T2 = 0.023sec
If C2 = 0.1 μF, R2 =230KΩ.
These values produce a phase lead of 14.5o, which is the desired compensation angle.
RESULT:
Thus the compensator is designed for the given process and the performance of thecompensated system is found to work satisfactorily.
Frequency : Hz R1 = C1 =
R2 = C2 =
Frequency : Hz R1 = C1 =
R2 = C2 =

EE6461 – ELECTRICAL ENGINEERING AND CONTROL SYSTEM LAB 72
VVIT DEPARTMENT OF ELECTRICAL AND ELECTRONICS ENGINEERING
EX.NO :17 Predetermination of Regulation of Three Phase Alternator by EMF andMMF Methods
DATE
AIM:
To predetermine the regulation of three phase alternator by EMF and MMF method and alsoto draw the vector diagrams.
APPARATUS REQUIRED:
sl. no Name of the apparatus Type Range Quantity
1 Ammeter MI 0-10A 2
2 Voltmeter Mi 0-230V 2
3 Three point starter 1
4 Rheostat Wire wound 1250, 0.8A 2
FUSE RATING:
125 % of current (Full load current)
For dc shunt motor.
For alternator
PRECAUTION:
i. The motor field rheostat should be kept in the minimum resistance position.ii. The alternator field potential divider should be in the maximum voltage position.
iii. Initially all switches are in open position.
Procedure for both emf and MMF method:
1. Note down the nameplate details of motor and alternator.2. Connections are made as per the circuit diagram.3. Give the supply by closing the dust switch.4. Using the three point starter, start the motor to run at the synchronous speed by varying the
motor filed rheostat.5. Conduct an open circuit test by varying the potential divider for various values of field
current and tabulate the corresponding open circuit voltage readings.

EE6461 – ELECTRICAL ENGINEERING AND CONTROL SYSTEM LAB 73
VVIT DEPARTMENT OF ELECTRICAL AND ELECTRONICS ENGINEERING
6. Conduct a short circuit test by closing the TPST switch and adjust the potential divider to setthe rated armature current, tabulate the corresponding field current.
7. Conduct a stator resistance test by giving connection as per the circuit diagram and tabulatethe voltage and current readings for various resistive loads.
Procedure to draw the graph for EMF method:
1. Draw the open circuit characteristics curve (generator voltage per phase Vs field current)2. Draw the short circuit characteristics curve (short circuit current Vs field current)3. From the graph find the open circuit voltage per phase (E1 (ph)) for the rated short circuit
current (Isc).4. By using respective formulae find the Zs, Xs, Eo and percentage regulation.
Procedure to draw the graph for MMF method:
1. Draw the open circuit characteristics curve (generator voltage per phase Vs field current)2. Draw the short circuit characteristics curve (short circuit current Vs field current)3. Draw the line OL to represent If’ which gives the rated generated voltage (V).4. Draw the line LA at an angle (90Φ) to represent If” which gives the rated full load
current.(Isc) on short circuit [(90Φ) for lagging power factor and (90- Φ) for leading powerfactor].
5. Join the points O and A and find the field current (If) measuring the distance OA that givesthe open circuit voltage (E0) from the open circuit characteristics.
6. Find the percentage regulation by using suitable formula.
CIRCUIT DIAGRAM(Regulation of Three Phase Alternator by EMF and MMF Methods)

EE6461 – ELECTRICAL ENGINEERING AND CONTROL SYSTEM LAB 74
VVIT DEPARTMENT OF ELECTRICAL AND ELECTRONICS ENGINEERING
FORMULAE USED:
emf method:
Armature resistance Ra = 1.6 Rdc where - Rdc is the resistance in DC supply.
Synchronous impedance Zs = (VOL /3) / (Isc)
Synchronous impedance Xs = (Zs2-Ra2)
Open circuit voltage Eo = ((Vrated cos + Ia Ra)2 + (Vrated sin +IaXs)
2)(For lagging powerfactor)
Open circuit voltage Eo = ((Vrated cos + Ia Ra)2+(Vrated sin - IaXs)
2) (For leading powerfactor)
Open circuit voltage Eo = ((Vrated cos + Ia Ra)2+( IaXs)
2) (For unity power factor)
Percentage regulation = (Eo-Vrated /Vrated)*100(For both EMF and MMF methods)
TABULATION:(Open Circuit Test)
S.NO
Field current(If)
Amps
Open circuit lineVoltage-VOL
Volts
Open circuit phasevoltage(Vo(ph))Volts

EE6461 – ELECTRICAL ENGINEERING AND CONTROL SYSTEM LAB 75
VVIT DEPARTMENT OF ELECTRICAL AND ELECTRONICS ENGINEERING
TABULATION:(Short circuit test)
Tabulation to find out the armature resistance (ra):
S.No
Field current(If)
Amps
Short Circuit Current(120 to 150 % of rated current )
(Isc)Amps
S.No
Armaturecurrent
(I)Amps
Armaturevoltage
(V)Volts
Armature ResistanceRa=V/IOhms

EE6461 – ELECTRICAL ENGINEERING AND CONTROL SYSTEM LAB 76
VVIT DEPARTMENT OF ELECTRICAL AND ELECTRONICS ENGINEERING
TABULATION: (EMF and MMF)
MODEL CALCULATION:
RESULT:
Thus the regulation of three phase alternator by EMF and MMF method and also to draw thevector diagrams is determined.
S.No
Powerfactor
EMF method MMF method
Lagging Leading unity Lagging Leading unity
1. 0.2
2. 0.4
3. 0.6
4. 0.8
5. 1.0

EE6461 – ELECTRICAL ENGINEERING AND CONTROL SYSTEM LAB 77
VVIT DEPARTMENT OF ELECTRICAL AND ELECTRONICS ENGINEERING
EX.NO :18STUDY OF TRANSDUCERS AND CHARACTERIZATION
DATE
AIM :To study the displacement transducer using LVDT
APPARATUS REQUIRED :
S.No Name of the Trainer Kit/ Copmponents Quantity1 LVDT trainer kit containing the signal conditioning unit 12 LVDT calibration jig 13 Multi meter 14 Patch cards FEW
THEORY:
LVDT is the most commonly and extensively used transducer, for linear displacementmeasurement. The LVDT consists of three symmetrical spaced coils wound onto an insulatedbobbin. A magnetic core, which moves through the bobbin without contact, provides a path for themagnetic flux linkage between the coils. The position of the magnetic core controls the mutualinductance between the primary coil and with the two outside or secondary coils. When an ACexcitation is applied to the primary coil, the voltage is induced in secondary coils that are wired in aseries opposing circuit. When the core is centered between two secondary coils, the voltage inducedin the secondary coils are equal, but out of phase by 180°. The voltage in the two coils cancels andthe output voltage will be zero.
CIRCUIT OPERATION:
The primary is supplied with an alternating voltage of amplitude between 5V to 25V with afrequency of 50 cycles per sec to 20 K cycles per sec. The two secondary coils are identical & for acentrally placed core the induced voltage in the secondary’s Es1&Es2 are equal. The secondary’s areconnected in phase opposition. Initially the net o/p is zero. When the displacement is zero the core iscentrally located. The output is linear with displacement over a wide range but undergoes a phaseshift of 180°. It occurs when the core passes through the zero displacement position.

EE6461 – ELECTRICAL ENGINEERING AND CONTROL SYSTEM LAB 78
VVIT DEPARTMENT OF ELECTRICAL AND ELECTRONICS ENGINEERING
CIRCUIT DIAGRAM: (Transducers)
RESULT:Thus the displacement transducer characteristics was studied using LVDT.
EE6461 – ELECTRICAL ENGINEERING AND CONTROL SYSTEM LAB 78
VVIT DEPARTMENT OF ELECTRICAL AND ELECTRONICS ENGINEERING
CIRCUIT DIAGRAM: (Transducers)
RESULT:Thus the displacement transducer characteristics was studied using LVDT.
EE6461 – ELECTRICAL ENGINEERING AND CONTROL SYSTEM LAB 78
VVIT DEPARTMENT OF ELECTRICAL AND ELECTRONICS ENGINEERING
CIRCUIT DIAGRAM: (Transducers)
RESULT:Thus the displacement transducer characteristics was studied using LVDT.
![Physics Potential of the ICAL detector at the India-based ... India-based Neutrino Observatory (INO) arXiv:1505.07380v1 [physics.ins-det] 27 May 2015 The ICAL Collaboration [The ICAL](https://img.pdfslide.us/doc/110x75/5aaedf227f8b9adb688ce7fc/physics-potential-of-the-ical-detector-at-the-india-based-india-based-neutrino.jpg)