Embed Size (px)
Citation preview
Interface shear strength in fiber-reinforced soil Interfacer de la force de cisailles dans le sol fibre-renforcé
Chunling Li & Jorge G Zornberg The University of Texas at Austin, USA
ABSTRACTUnder confining pressure typical of geotechnical project, the governing failure mode of fiber-reinforced soil is the pullout of fibersfrom the soil matrix. Accordingly, interface shear strength between fibers and soils is required for the prediction of equivalent shearstrength of fiber-soil composite using the recently-proposed discrete framework. A specially-designed pullout test was conducted tostudy the interface shear strength between individual fibers and soil. The interface friction angle was found to decrease as confiningpressure increases due to the dilatancy effect. For confining pressure between 0 to 200 kPa (typical of triaxial test), the pullout resis-tance of fibers is well presented by a coefficient of interaction of 0.8 and an effective surface area determined from assuming a circu-lar cross-section.
RÉSUMÉSous la pression d'emprisonnement typique de géotechnique projetez, le mode de défaillance régissant de sol fibre-renforcé est le dé-gagement des fibres du sol matrice. En conséquence, la résistance au cisaillement d'interface entre les fibres et les sols est exigée pourla prédiction de force de cisailles équivalente de composite de fibre-sol utilisant le récemment proposé cadre discret.Un essai spécial-conçu de dégagement a été conduit pour étudier la résistance au cisaillement d'interface. Le frottement d'interface l'angle s'est avérépour diminuer comme confinant des augmentations de pression dues au effet d'épaississement. Pour la pression d'emprisonnement en-tre le kPa 0 à 200 (typique d'essai de trois axes), la résistance de dégagement des fibres peut être estimé en utilisant un coefficient deinteraction de 0.8 et une superficie efficace déterminée à partir de la circulaire prétention en coupe.
A specially designed pullout test program using a single longfiber embedded in soil matrix was conducted to more accuratelyquantify the interface shear strength between fibers and soil. In-terface shear strength parameters were obtained by analyzingthe pullout test results using a load transfer model. The circularfiber cross-section assumption is also evaluated in this study.
1 INTRODUCTION
Fiber-reinforcement is a promising solution to applications suchas reinforcement of soil veneer and repair of failed slope. Soils mixed with randomly distributed fibers can be used as patchesin the localized repair of failed slopes as it can accommodatethe irregular shape of failed slopes. In the reinforcement of soilveneer such as landfill covers, fiber reinforcement eliminatesthe need of anchorage that exists with planar reinforcement. 2 BACKGROUND
A discrete framework was recently proposed (Zornberg,2002), which predicts the shear strength of fiber-soil compositesbased on the independent properties of fiber and soil (e.g. fiber content, fiber aspect ratio and shear strength of unreinforcedsoil).
A brief overview of the discrete framework (Zornberg, 2002) ispresented in this section. Under shearing, fiber reinforcementcontributes to the increase of shear resistance by mobilizing ten-sile stress within fibers. Accordingly, the equivalent shearstrength of fiber-reinforced specimens, Seq, can be defined as:For the polymeric fibers commonly used in engineering
practice, the critical failure mode under confining pressure typi-cal of geotechnical projects is the pullout of fibers from the soilmatrix. Consequently, the interface shear strength is needed as input of the discrete framework. For pullout type of failure, acoefficient of interaction of 0.8 is assumed in the discreteframework. Due to the lack of experimental data, this value isinferred from pullout test results conducted on woven polypro-pylene geotextiles (Koutsourais et al., 1998), which was consid-ered representative of the interface shear strength on individual fibers
t (1)ct S= S neq ⋅++=⋅+ αφσα tan
where α is an empirical coefficient that accounts for the partialcontribution of fibers (assumed α=1 for randomly distributedfibers); t is the fiber-induced tension defined as the tensile forceper unit area induced in a soil mass by randomly distributed fi-bers; S is the shear strength of the unreinforced soil; and c and φare the shear strength parameters of unreinforced soil.
The expression of t can be derived for different failuremodes. At low confining stress when failure is governed by thepullout of the fibers, the fiber-induced distributed tension, tp,can be estimated as:
The surface area of single fibers is also needed in order to es-timate the pullout resistance. However, the irregular shape of fi-bers (especially for fibrillated fibers) is difficult to quantify. At the microscopic level, the contact area between the fiber andsoil depends on the size and shape of soil particles, and of theshape of fibers. Consequently, the portion of surface area that isin effective contact with soil is also unknown. The discreteframework typically assumed a circular cross-section of fibers,for which the surface area of fiber is estimated using the equiva-lent diameter calculated from the cross-sectional area of fibers.
( )avenicip ccc=t ,,, tan σφηχ φ ⋅⋅+⋅⋅⋅ (2)
where η is the aspect ratio, defined as the ratio of fiber lengthover equivalent diameter of individual fibers; χ is the volumet-ric fiber content defined as the ratio of fiber volume over thevolume of fiber-soil composite; and σn,ave is the average normalstress acting on the random fibers. The interaction coefficients,ci,c and ci,φ, commonly used in soil reinforcement literature for
1373
Li, C., and Zornberg, J.G. (2005). “Interface Shear Strength in Fiber-Reinforced Soil.” Proceedings of the Sixteenth International Conference of Soil Mechanics and Geotechnical Engineering (ISSMGE), Osaka, Japan, September 12-17, pp. 1373-1376.
continuous planar reinforcement, are adopted herein to relatethe interface shear strength to the shear strength of the soil. Theinteraction coefficients are defined as:
ca=c ci ,
(3)
φδ
φ tantan
, =ci(4)
where a is the adhesive component of the interface shearstrength between soil and the polymeric fiber, and tanδ is thefrictional component.
When failure is governed by the yielding of the fibers, thedistributed tension, tt , is determined from the tensile strength ofthe fiber:
ultft =t ,σχ ⋅ (5)
where σf,ult is the ultimate tensile strength of the individual fi-bers.
Accordingly, the following expressions can be used to definethe equivalent shear strength when failure is governed by fiberpullout:
( ) npeqpeqpeq c= S σφ ⋅+ ,,, tan (6)
( ) cc=c cipeq ⋅⋅⋅⋅+ ,, 1 χηα (7)
( ) ( ) φχηαφ φ tan1tan ,, ⋅⋅⋅⋅+ ipeq c= (8)
The following expressions can be obtained to define theequivalent shear strength when failure is governed by tensile breakage of the fibers:
S (9)( ) nteqteqteq c= σφ ⋅+ ,,, tan
ultfteq c=c ,, σχα ⋅⋅+ (10)
(11)( ) φφ tantan , =teq
The above expressions yield a bilinear shear strength enve-lope, which is shown in Figure 1.
The interface shear strength can be obtained by analyzing thepullout force vs. displacement relationship using a load transfermodel (Juran and Chen, 1988), in which the interface shearstress τs can be expressed as a function of relative displacementbetween the fiber and soil us:
Figure 1. Representation of the equivalent shear strength according to the discrete approach
3 EXPERIMENTAL TESTTING PROGRAM
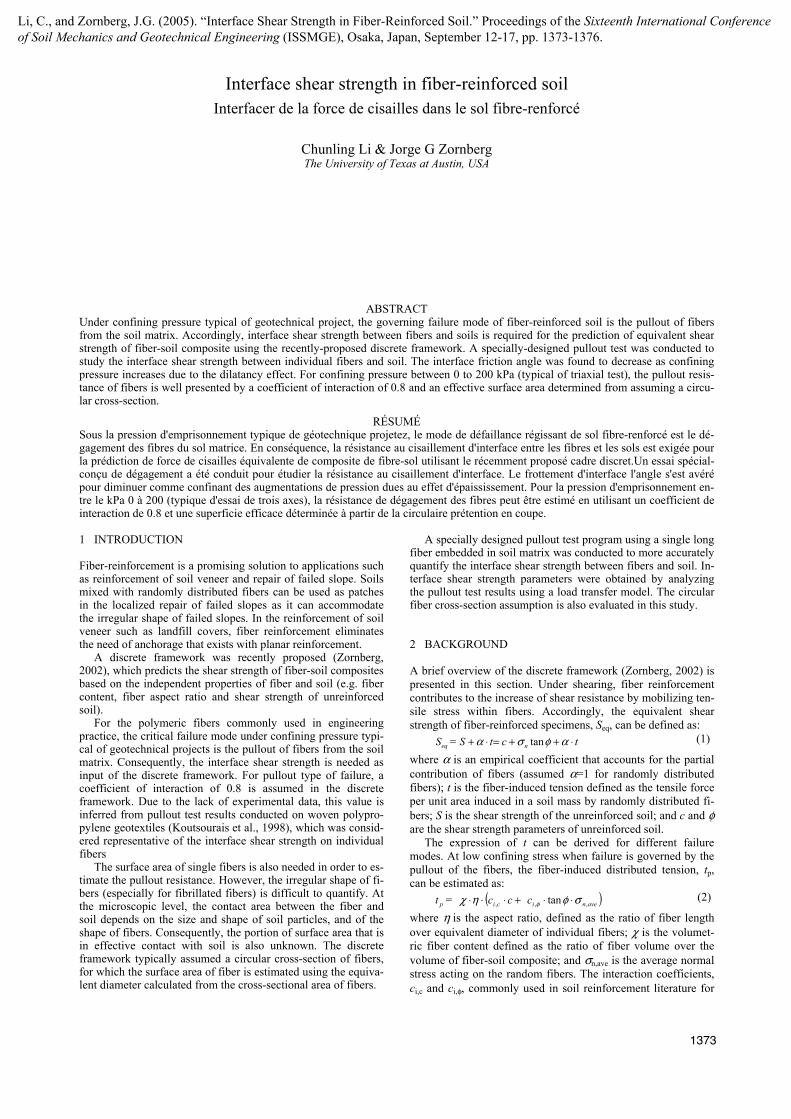
A large scale direct shear box was modified to perform the indi-vidual fiber pullout test. The test setup is shown in Figure 2. The fiber used was a single long polypropylene tape fiber thathad not been cut into the specified length in the manufacturingprocess. The upper box of the direct shear box has in-plane di-mension of 508 mm by 508 mm and height of 127 mm. The bottom box has a dimension of 1016 mm by 508 mm by 127mm. A vertical hydraulic actuator was used to generate the normalload. The fiber was passed through the plastic tubes, placed atthe bottom of the upper box, and used to control the effectivelength of fiber subjected to interface friction. The actual effecti-ve length of fiber is 152mm (6 inches), which equals the lengthof upper box minus the length of the two plastic tubes as shown in Figure 2. Use of a small anchored length would have made the pullout force too small to measure, while use of a longerembedded length would have made the pullout force to be larger
than the tensile strength of fibers. Accordingly an embeddedlength of fiber larger than the typical embedded length of fiberswithin fiber-reinforced soil was selected in the pullout test. Thetest setup is similar to a ‘pull through’ test, in which the length of fiber under interface friction remains constant during the test. The The section of fiber subjected to interface friction was loca-ted in the center of upper box, which was under a uniform dis-tribution of normal stress.
The pullout force was applied through the horizontal hydrau-lic actuators. A load cell with capacity up to 50 lbs was installedto measure the normal load. Two LVDTs were used to measurethe displacement in the pullout front and end. The front end offiber was attached to a metal wire, which can be considered asinextensible. Therefore, the measurement of LVDT 1 can be as-sumed to be the displacement of pullout front. The displacementof the pullout end is measured by LVDT 2.
The soil used was Monterey No. 30 sand, which is a cleanuniformly graded sand and classifies as SP according to the uni-fied soil classification system. The soils was compacted to thetarget density using the pluviation techniques, which involveraining the sand from a fixed height through a specially desig-ned funnel. The target soil densities, Dr, were 48% and 65%.
LVDT2
PlasticTube
Fiber
Metal wire
Hydraulicactuator
Load cellLVDT1
Hydraulicactuator
LVDT2
PlasticTube
Fiber
Metal wire
Hydraulicactuator
Load cellLVDT1
Hydraulicactuator
Figure 2. Setup of the fiber pullout test
Seq=S+t
1
tanφ
σn
c
S
σn,crit
s
t
4 ANALYSIS OF RESULTS
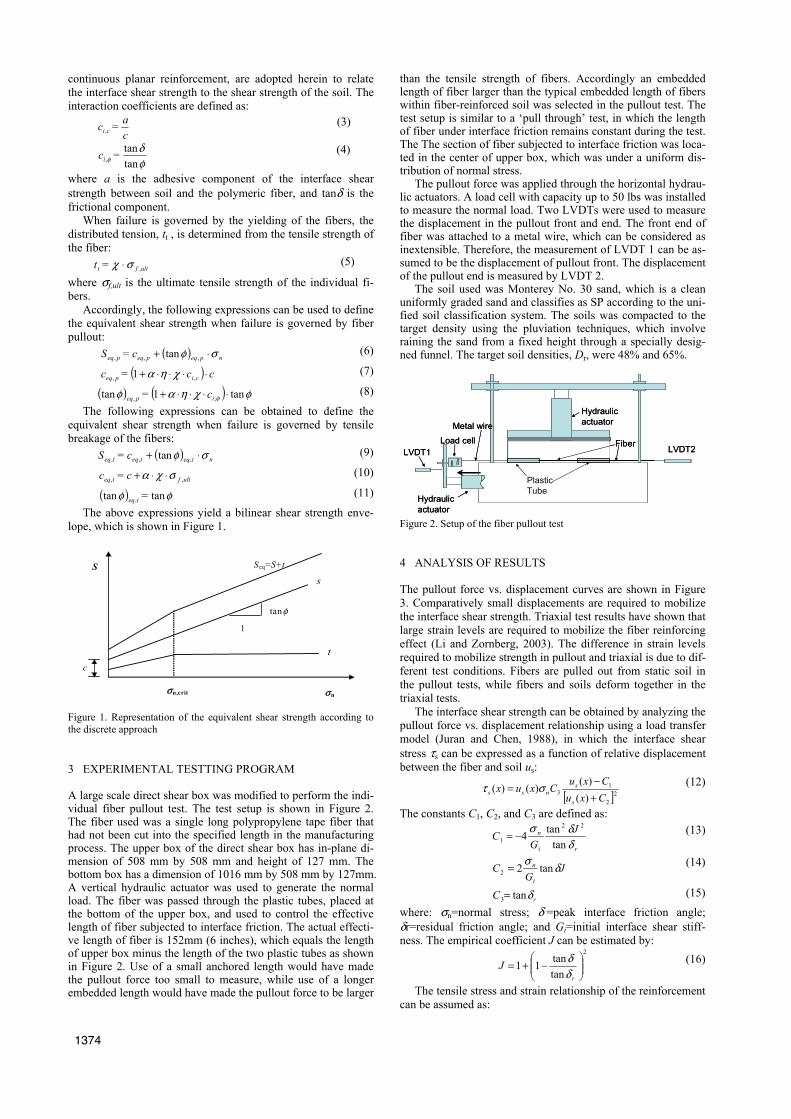
The pullout force vs. displacement curves are shown in Figure3. Comparatively small displacements are required to mobilizethe interface shear strength. Triaxial test results have shown thatlarge strain levels are required to mobilize the fiber reinforcingeffect (Li and Zornberg, 2003). The difference in strain levelsrequired to mobilize strength in pullout and triaxial is due to dif-ferent test conditions. Fibers are pulled out from static soil inthe pullout tests, while fibers and soils deform together in thetriaxial tests.
[ ]22
13 )(
)()()(
CxuCxu
Cxuxs
snss +
−= στ (12)
The constants C1, C2, and C3 are defined as:
ri
n JG
Cδδσ
tantan4
22
1 −= (13)
JGi
n δσtan22 =C (14)
rC δtan3= (15)
where: σn=normal stress; δ =peak interface friction angle;δr=residual friction angle; and Gi=initial interface shear stiff-ness. The empirical coefficient J can be estimated by:
2
tantan11 ��
�
����
�−+=
r
Jδδ (16)
The tensile stress and strain relationship of the reinforcementcan be assumed as:
1374
εεba
F+
= (17)
where ε is the tensile strain of the reinforcement, and constantsa and b can be determined from the initial elastic module E andultimate tensile strength σf,ult using the relations, as follows:
AEa
⋅= 1 (18)
Ab
ultf ⋅=
,
1σ
(19)
where A is the cross-sectional area of the reinforcement. For360 denier polypropylene fibers, a and b, estimated from a ten-sile testing results (Zornberg, 2002) are 5.35 N-1 and 53.5 N-1,respectively.
0123456789
10
0 5 10 15 20 25 30Frontal displacement (mm)
Pullo
ut fo
rce
(N)
σn=143 kPa
σn=72 kPa
σn=214 kPa
σn=288 kPa
σn=360 kPa
Figure 3. Pullout test results (Dr=65%)
The reinforcement can be discretized into n sections with an equal spacing between nodes ∆x. The coordinate and displace-ment at node i are denoted as xi and us,i. The equation to besolved is:
s
[ ] 21,1,2
1,,1,2
2,
1,,3
22
)2(
��
���
�∆−
+∆
+−=
+−
−+
−+
xuu
bax
uuuaCuCu
uCisis
isisis
is
isisnσ (20)
Equation (20) combines the equilibrium condition of each section, stress-strain relationship of reinforcement (Equation(17)) and interface behavior (Equation (12)). The boundaryconditions to be satisfied are:
at the pullout front, us(x1)=us,1 (21)
at the pullout end (no shear stress at node n),
0)(
=dx
xdu ns (22)
The pullout force F corresponding to the displacement at thepullout front, us,1, can be calculated as follows. Displacementus,i+1 can be solved if us,i and us,i-1 are known. For a given valueof us,1, the solving procedure begins with an assumed displace-ment at an imaginary node 0, us,0. The displacements at nodes 2,3 …etc. are solved subsequently using Equation (20) until thedisplacement of the pullout end is solved. If the boundary con-dition as shown in Equation (22) is satisfied, the assumed us,0 isthe correct solution and the corresponding pullout force F iscalculated as the summation of the interface friction on eachsection of the reinforcement. Otherwise, us,0 should be reas-sumed and the calculation procedure is repeated until Equation(22) is satisfied. The pullout force vs. displacement curve can beobtained by calculating the pullout force corresponding to dif-ferent displacement of the pullout front.
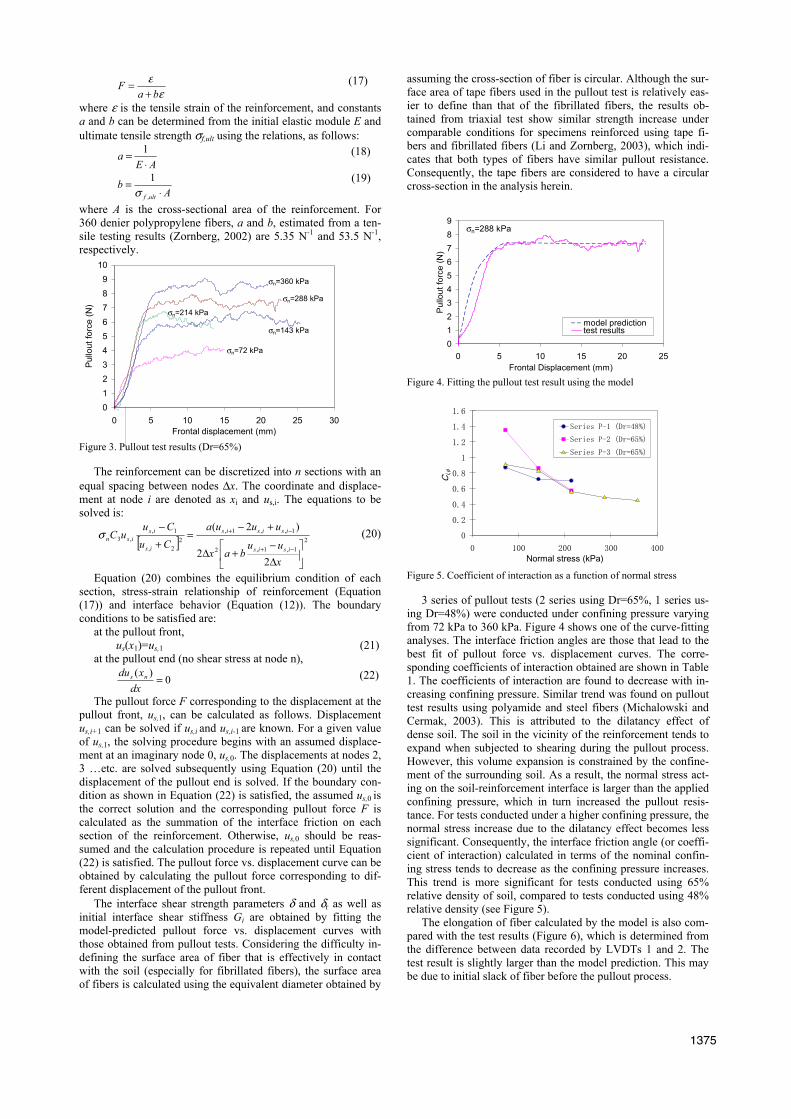
The interface shear strength parameters δ and δr as well asinitial interface shear stiffness Gi are obtained by fitting themodel-predicted pullout force vs. displacement curves withthose obtained from pullout tests. Considering the difficulty in-defining the surface area of fiber that is effectively in contactwith the soil (especially for fibrillated fibers), the surface areaof fibers is calculated using the equivalent diameter obtained by
assuming the cross-section of fiber is circular. Although the sur-face area of tape fibers used in the pullout test is relatively eas-ier to define than that of the fibrillated fibers, the results ob-tained from triaxial test show similar strength increase undercomparable conditions for specimens reinforced using tape fi-bers and fibrillated fibers (Li and Zornberg, 2003), which indi-cates that both types of fibers have similar pullout resistance.Consequently, the tape fibers are considered to have a circularcross-section in the analysis herein.
0123456789
0 5 10 15 20 25Frontal Displacement (mm)
Pul
lout
forc
e(N
)
model predictiontest results
σn=288 kPa
Figure 4. Fitting the pullout test result using the model
�
���
���
���
���
�
���
���
���
� ��� ��� ��� ����������������������
� ��φ
�������������������
�������������������
�������������������
Figure 5. Coefficient of interaction as a function of normal stress
3 series of pullout tests (2 series using Dr=65%, 1 series us-ing Dr=48%) were conducted under confining pressure varyingfrom 72 kPa to 360 kPa. Figure 4 shows one of the curve-fittinganalyses. The interface friction angles are those that lead to thebest fit of pullout force vs. displacement curves. The corre-sponding coefficients of interaction obtained are shown in Table1. The coefficients of interaction are found to decrease with in-creasing confining pressure. Similar trend was found on pullouttest results using polyamide and steel fibers (Michalowski andCermak, 2003). This is attributed to the dilatancy effect ofdense soil. The soil in the vicinity of the reinforcement tends toexpand when subjected to shearing during the pullout process.However, this volume expansion is constrained by the confine-ment of the surrounding soil. As a result, the normal stress act-ing on the soil-reinforcement interface is larger than the appliedconfining pressure, which in turn increased the pullout resis-tance. For tests conducted under a higher confining pressure, thenormal stress increase due to the dilatancy effect becomes lesssignificant. Consequently, the interface friction angle (or coeffi-cient of interaction) calculated in terms of the nominal confin-ing stress tends to decrease as the confining pressure increases.This trend is more significant for tests conducted using 65%relative density of soil, compared to tests conducted using 48%relative density (see Figure 5).
The elongation of fiber calculated by the model is also com-pared with the test results (Figure 6), which is determined fromthe difference between data recorded by LVDTs 1 and 2. Thetest result is slightly larger than the model prediction. This maybe due to initial slack of fiber before the pullout process.
1375
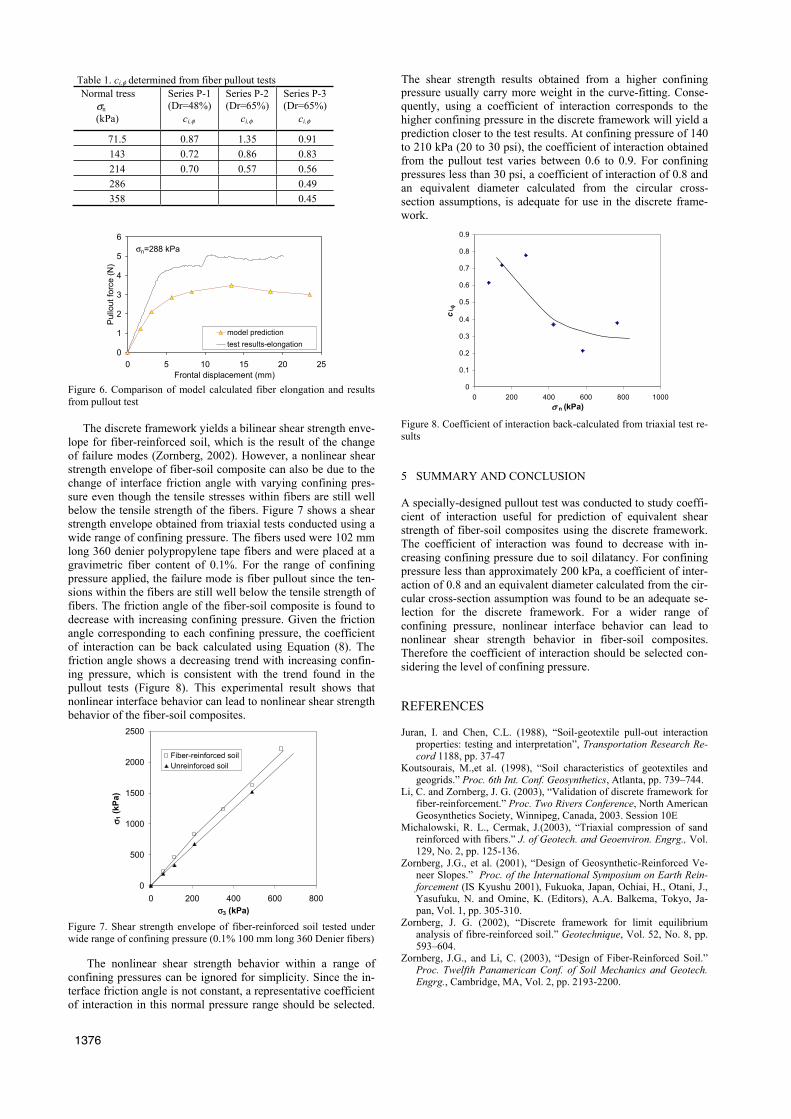
Table 1. ci,φ� determined from fiber pullout tests Normal tress
σn(kPa)
Series P-1(Dr=48%)
ci,φ
Series P-2(Dr=65%)
ci,φ
Series P-3(Dr=65%)
ci,φ
71.5 0.87 1.35 0.91143 0.72 0.86 0.83214 0.70 0.57 0.56286 0.49358 0.45
0
1
2
3
4
5
6
0 5 10 15 20 25Frontal displacement (mm)
Pullo
ut fo
rce
(N)
model predictiontest results-elongation
σn=288 kPa
Figure 6. Comparison of model calculated fiber elongation and resultsfrom pullout test
The discrete framework yields a bilinear shear strength enve-lope for fiber-reinforced soil, which is the result of the changeof failure modes (Zornberg, 2002). However, a nonlinear shearstrength envelope of fiber-soil composite can also be due to thechange of interface friction angle with varying confining pres-sure even though the tensile stresses within fibers are still wellbelow the tensile strength of the fibers. Figure 7 shows a shearstrength envelope obtained from triaxial tests conducted using awide range of confining pressure. The fibers used were 102 mm long 360 denier polypropylene tape fibers and were placed at agravimetric fiber content of 0.1%. For the range of confiningpressure applied, the failure mode is fiber pullout since the ten-sions within the fibers are still well below the tensile strength of fibers. The friction angle of the fiber-soil composite is found todecrease with increasing confining pressure. Given the frictionangle corresponding to each confining pressure, the coefficientof interaction can be back calculated using Equation (8). Thefriction angle shows a decreasing trend with increasing confin-ing pressure, which is consistent with the trend found in thepullout tests (Figure 8). This experimental result shows thatnonlinear interface behavior can lead to nonlinear shear strengthbehavior of the fiber-soil composites.
0
500
1000
1500
2000
2500
0 200 400 600 800σ3 (kPa)
σ 1 (k
Pa)
Fiber-reinforced soilUnreinforced soil
Figure 7. Shear strength envelope of fiber-reinforced soil tested under wide range of confining pressure (0.1% 100 mm long 360 Denier fibers)
The nonlinear shear strength behavior within a range ofconfining pressures can be ignored for simplicity. Since the in-terface friction angle is not constant, a representative coefficient of interaction in this normal pressure range should be selected.
pressure usually carry more weight in the curve-fitting. Conse-quently, using a coefficient of interaction corresponds to the higher confining pressure in the discrete framework will yield a prediction closer to the test results. At confining pressure of 140 to 210 kPa (20 to 30 psi), the coefficient of interaction obtained from the pullout test varies between 0.6 to 0.9. For confining pressures less than 30 psi, a coefficient of interaction of 0.8 and an equivalent diameter calculated from the circular cross-section assumptions, is adequate for use in the discrete frame-work.
0
0.1
0.2
0.3
0.4
0.5
0.6
0.7
0.8
0.9
0 200 400 600 800 1000σ n (kPa)
c i, φ
Figure 8. Coefficient of interaction back-calculated from triaxial test re-sults
5 SUMMARY AND CONCLUSION
A specially-designed pullout test was conducted to study coeffi-cient of interaction useful for prediction of equivalent shear strength of fiber-soil composites using the discrete framework. The coefficient of interaction was found to decrease with in-creasing confining pressure due to soil dilatancy. For confining pressure less than approximately 200 kPa, a coefficient of inter-action of 0.8 and an equivalent diameter calculated from the cir-cular cross-section assumption was found to be an adequate se-lection for the discrete framework. For a wider range of confining pressure, nonlinear interface behavior can lead to nonlinear shear strength behavior in fiber-soil composites. Therefore the coefficient of interaction should be selected con-sidering the level of confining pressure.
REFERENCES
Juran, I. and Chen, C.L. (1988), “Soil-geotextile pull-out interaction properties: testing and interpretation”, Transportation Research Re-cord 1188, pp. 37-47
Koutsourais, M.,et al. (1998), “Soil characteristics of geotextiles and geogrids.” Proc. 6th Int. Conf. Geosynthetics, Atlanta, pp. 739–744.
Li, C. and Zornberg, J. G. (2003), “Validation of discrete framework for fiber-reinforcement.” Proc. Two Rivers Conference, North American Geosynthetics Society, Winnipeg, Canada, 2003. Session 10E
Michalowski, R. L., Cermak, J.(2003), “Triaxial compression of sand reinforced with fibers.” J. of Geotech. and Geoenviron. Engrg., Vol. 129, No. 2, pp. 125-136.
Zornberg, J.G., et al. (2001), “Design of Geosynthetic-Reinforced Ve-neer Slopes.” Proc. of the International Symposium on Earth Rein-forcement (IS Kyushu 2001), Fukuoka, Japan, Ochiai, H., Otani, J., Yasufuku, N. and Omine, K. (Editors), A.A. Balkema, Tokyo, Ja-pan, Vol. 1, pp. 305-310.
Zornberg, J. G. (2002), “Discrete framework for limit equilibrium analysis of fibre-reinforced soil.” Geotechnique, Vol. 52, No. 8, pp. 593–604.
Zornberg, J.G., and Li, C. (2003), “Design of Fiber-Reinforced Soil.” Proc. Twelfth Panamerican Conf. of Soil Mechanics and Geotech. Engrg., Cambridge, MA, Vol. 2, pp. 2193-2200.
The shear strength results obtained from a higher confining
1376