Embed Size (px)
Citation preview
8/3/2019 IBM whitepaper: Building a Dynamic Infrastructure with IBM Power Systems: A Closer Look at Private Cloud TCO
http://slidepdf.com/reader/full/ibm-whitepaper-building-a-dynamic-infrastructure-with-ibm-power-systems-a 1/24
Bu hilding a Dynamic Infrastructure wit
IBM Power Systems:
A Closer Look at Private Cloud TCO
Scott A. Bain
Fehmina Merchant
Bob Minns
John J Thomas
IBM SWG Competitive Project Office
March, 2010

8/3/2019 IBM whitepaper: Building a Dynamic Infrastructure with IBM Power Systems: A Closer Look at Private Cloud TCO
http://slidepdf.com/reader/full/ibm-whitepaper-building-a-dynamic-infrastructure-with-ibm-power-systems-a 2/24
Table of ContentsTable of Contents............................................................................................................................... ........... 2
Executive Summary....................................................................................................................................... 3
A Virtuous Circle to Reduce IT Costs .............................................................................................................4
Take Cost Out Through Virtualization...........................................................................................................5
Labor and the Server Provisioning Lifecycle ...............................................................................................10
Standardization Helps Lower Labor Costs ..................................................................................................14
Automation Can Help Lower Labor Costs Even Further! ............................................................................17
Putting It All Together................................................................................................................................. 21
Summary ............................................................................................................................... ...................... 23
Page 2 of 24
8/3/2019 IBM whitepaper: Building a Dynamic Infrastructure with IBM Power Systems: A Closer Look at Private Cloud TCO
http://slidepdf.com/reader/full/ibm-whitepaper-building-a-dynamic-infrastructure-with-ibm-power-systems-a 3/24
Executive Summary
Many companies are finding their need for greater business agility being frustrated by an increasingly
costly and rigid IT infrastructure. The culprits are many. Maintenance of the current environment
accounts for over 70% of the IT budget, leaving less than 30% available for new projects. Annual
operational costs (power, cooling, and labor) of distributed systems and networking exceed their
acquisition cost by 2-3X and continue to climb. Utilization rates of these commodity servers hover
around 5-15% on average, leading to excess capacity going to waste. Time to provision new servers can
be as long as six months, hampering lines-of-business efforts to quickly respond to competitive threats
or new opportunities. As a result, LOB units are beginning to go outside the datacenter to public cloud
providers like Amazon in hopes of lowering their costs and improving their responsiveness. To avoid
disintermediation, IT needs to re-invent the datacenter by moving towards a more dynamic
infrastructure. One that takes out cost through the use of virtualization to improve utilization levels
with a commensurate reduction in power consumption. One that embraces a private cloud model that
uses standardized workloads and service automation to dynamically provision IT services in
minutes/hours rather than months (and at lower cost) via self-service portals. Customers can build such
an environment using IBM’s Power Systems servers coupled with Tivoli service management software.
This paper examines the Total Cost of Ownership (TCO) for a dynamic infrastructure built around private
cloud services and compares it to public cloud alternatives as well as conventional one-application-per-
distributed server models. The results show that private cloud implementations built around new
POWER7 based servers can be up to 90% less expensive than public cloud options over a three year
period and over 70% less than a distributed stand-alone server approach.
Page 3 of 24
8/3/2019 IBM whitepaper: Building a Dynamic Infrastructure with IBM Power Systems: A Closer Look at Private Cloud TCO
http://slidepdf.com/reader/full/ibm-whitepaper-building-a-dynamic-infrastructure-with-ibm-power-systems-a 4/24
A Virtuous Circle to Reduce IT Costs
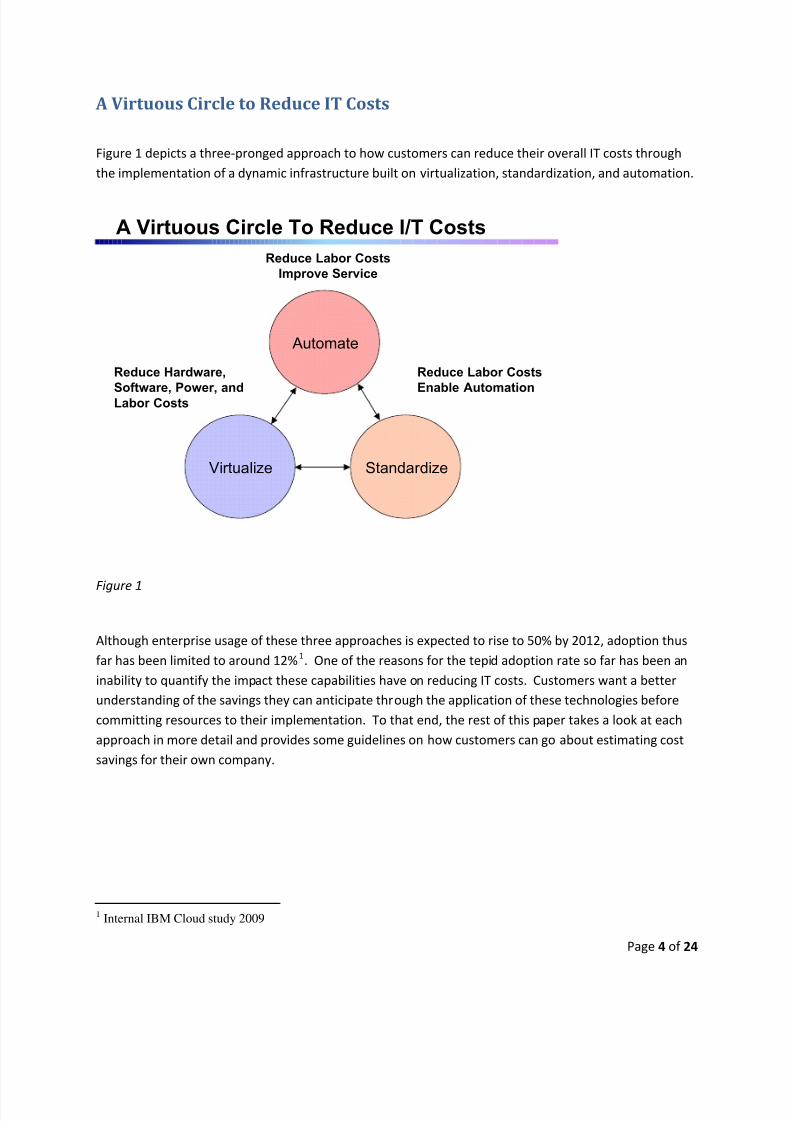
Figure 1 depicts a three-pronged approach to how customers can reduce their overall IT costs through
the implementation of a dynamic infrastructure built on virtualization, standardization, and automation.
A Virtuous Circle To Reduce I/T Costs
Automate
Virtualize Standardize
Reduce Labor Costs
Improve Service
Reduce Hardware,
Software, Power, andLabor Costs
Reduce Labor Costs
Enable Automation
Figure 1
Although enterprise usage of these three approaches is expected to rise to 50% by 2012, adoption thus
far has been limited to around 12%1. One of the reasons for the tepid adoption rate so far has been an
inability to quantify the impact these capabilities have on reducing IT costs. Customers want a better
understanding of the savings they can anticipate through the application of these technologies before
committing resources to their implementation. To that end, the rest of this paper takes a look at each
approach in more detail and provides some guidelines on how customers can go about estimating cost
savings for their own company.
1 Internal IBM Cloud study 2009
Page 4 of 24
8/3/2019 IBM whitepaper: Building a Dynamic Infrastructure with IBM Power Systems: A Closer Look at Private Cloud TCO
http://slidepdf.com/reader/full/ibm-whitepaper-building-a-dynamic-infrastructure-with-ibm-power-systems-a 5/24
Take Cost Out Through Virtualization
A recent IBM internal study of its nearly 4000 distributed servers showed annual operational costs
attributed to each server to be over $34,000, with almost 90% due to software maintenance and
systems administration. It stands to reason that reducing the number of physical servers to fewer,larger, more capable machines can serve to greatly reduce these costs. Indeed, the virtues of
virtualization to accomplish this have been well-publicized. What has proven to be more elusive,
however, is the quantification of these benefits. How many workloads can actually be consolidated
onto a given platform while maintaining acceptable service level agreements? Which platform gives you
the greatest economy of scale, producing the lowest cost per virtual machine image/workload?
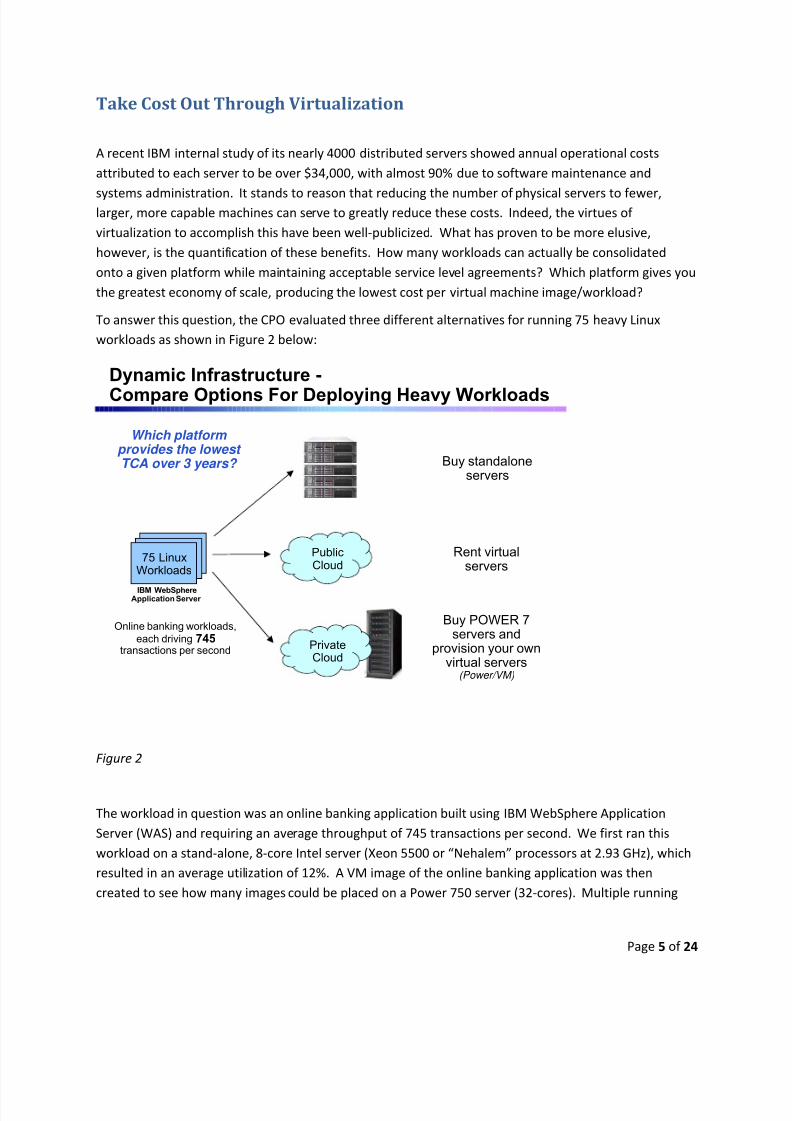
To answer this question, the CPO evaluated three different alternatives for running 75 heavy Linux
workloads as shown in Figure 2 below:
PrivateCloud
PublicCloud
75 LinuxWorkloads
Buy POWER 7servers and
provision your ownvirtual servers
(Power/VM)
Buy standaloneservers
Rent virtualservers
Which platform provides the lowest TCA over 3 years?
Dynamic Infrastructure -
Compare Options For Deploying Heavy Workloads
IBM WebSphereApplication Server
Online banking workloads,each driving 745
transactions per second
Figure 2
The workload in question was an online banking application built using IBM WebSphere Application
Server (WAS) and requiring an average throughput of 745 transactions per second. We first ran this
workload on a stand-alone, 8-core Intel server (Xeon 5500 or “Nehalem” processors at 2.93 GHz), which
resulted in an average utilization of 12%. A VM image of the online banking application was then
created to see how many images could be placed on a Power 750 server (32-cores). Multiple running
Page 5 of 24
8/3/2019 IBM whitepaper: Building a Dynamic Infrastructure with IBM Power Systems: A Closer Look at Private Cloud TCO
http://slidepdf.com/reader/full/ibm-whitepaper-building-a-dynamic-infrastructure-with-ibm-power-systems-a 6/24
instances of this VM image were added incrementally to the servers until it could no longer handle any
additional throughput.
It should be noted, however, that this approach drives the machine to 100% utilization with no
consideration of workload variation. In practice, real world workloads have variability in demand. This
variability has an effect on what CPU utilization can be tolerated on the target virtualization platform.
Ideally, you want to be able to run utilization levels high enough to achieve the highest consolidation
ratio, but still keep it less than 100% to allow for peaks caused by this variance in workload demand.
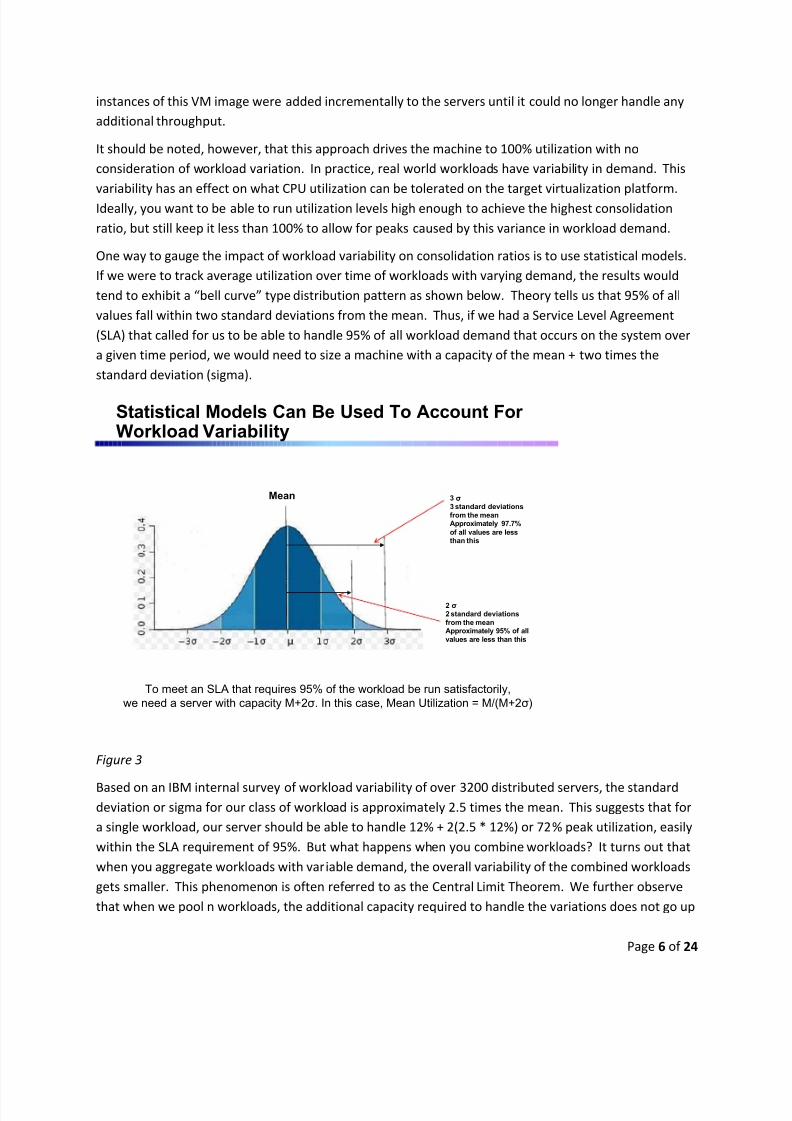
One way to gauge the impact of workload variability on consolidation ratios is to use statistical models.
If we were to track average utilization over time of workloads with varying demand, the results would
tend to exhibit a “bell curve” type distribution pattern as shown below. Theory tells us that 95% of all
values fall within two standard deviations from the mean. Thus, if we had a Service Level Agreement
(SLA) that called for us to be able to handle 95% of all workload demand that occurs on the system over
a given time period, we would need to size a machine with a capacity of the mean + two times the
standard deviation (sigma).
Statistical Models Can Be Used To Account For Workload Variability
Mean
2 σ2 standard deviations
from the meanApproximately 95% of all
values are less than this
3 σ3 standard deviations
from the meanApproximately 97.7%
of all values are lessthan this
To meet an SLA that requires 95% of the workload be run satisfactorily,we need a server with capacity M+2σ. In this case, Mean Utilization = M/(M+2σ)
Figure 3
Based on an IBM internal survey of workload variability of over 3200 distributed servers, the standarddeviation or sigma for our class of workload is approximately 2.5 times the mean. This suggests that for
a single workload, our server should be able to handle 12% + 2(2.5 * 12%) or 72% peak utilization, easily
within the SLA requirement of 95%. But what happens when you combine workloads? It turns out that
when you aggregate workloads with variable demand, the overall variability of the combined workloads
gets smaller. This phenomenon is often referred to as the Central Limit Theorem. We further observe
that when we pool n workloads, the additional capacity required to handle the variations does not go up
Page 6 of 24
8/3/2019 IBM whitepaper: Building a Dynamic Infrastructure with IBM Power Systems: A Closer Look at Private Cloud TCO
http://slidepdf.com/reader/full/ibm-whitepaper-building-a-dynamic-infrastructure-with-ibm-power-systems-a 7/24
by n, it goes up only by the square root of (n). For example, when you combine four workloads of
roughly equal size, you only need a server capable of handling 3.5 times the average demand or
utilization. Combining 16 workloads results in needing only 2.25 times the mean, whereas if you
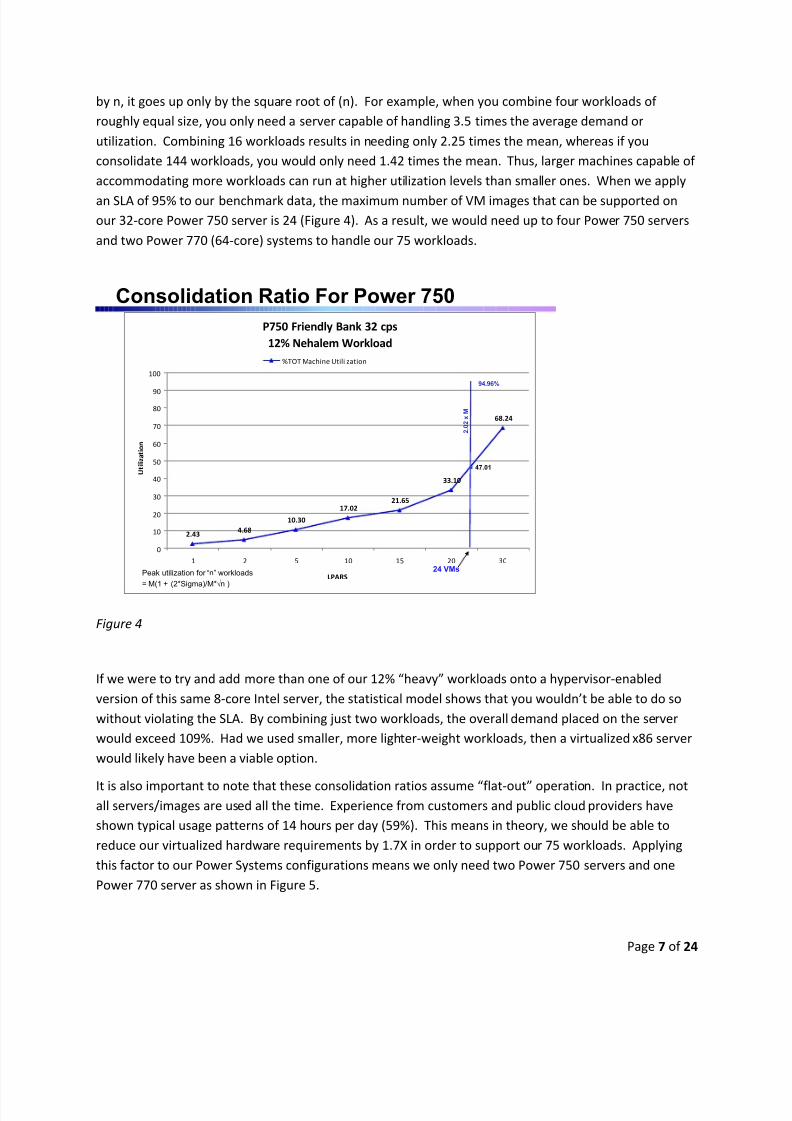
consolidate 144 workloads, you would only need 1.42 times the mean. Thus, larger machines capable of
accommodating more workloads can run at higher utilization levels than smaller ones. When we apply
an SLA of 95% to our benchmark data, the maximum number of VM images that can be supported on
our 32-core Power 750 server is 24 (Figure 4). As a result, we would need up to four Power 750 servers
and two Power 770 (64-core) systems to handle our 75 workloads.
Consolidation Ratio For Power 750
P750 Friendly Bank 32 cps
12% Nehalem Workload
2.434.68
10.30
17.0221.65
33.10
68.24
0
10
20
30
40
50
60
70
80
90
100
1 2 5 10 15 20 30
LPARS
U t i l i z a t i o n
%TOT Machine Utili zation
Peak utilization for “n” workloads
= M(1 + (2*Sigma)/M*√n )
2 . 0 2 x M
94.96%
47.01
24 VMs
Figure 4
If we were to try and add more than one of our 12% “heavy” workloads onto a hypervisor-enabled
version of this same 8-core Intel server, the statistical model shows that you wouldn’t be able to do so
without violating the SLA. By combining just two workloads, the overall demand placed on the server
would exceed 109%. Had we used smaller, more lighter-weight workloads, then a virtualized x86 server
would likely have been a viable option.
It is also important to note that these consolidation ratios assume “flat-out” operation. In practice, notall servers/images are used all the time. Experience from customers and public cloud providers have
shown typical usage patterns of 14 hours per day (59%). This means in theory, we should be able to
reduce our virtualized hardware requirements by 1.7X in order to support our 75 workloads. Applying
this factor to our Power Systems configurations means we only need two Power 750 servers and one
Power 770 server as shown in Figure 5.
Page 7 of 24
8/3/2019 IBM whitepaper: Building a Dynamic Infrastructure with IBM Power Systems: A Closer Look at Private Cloud TCO
http://slidepdf.com/reader/full/ibm-whitepaper-building-a-dynamic-infrastructure-with-ibm-power-systems-a 8/24
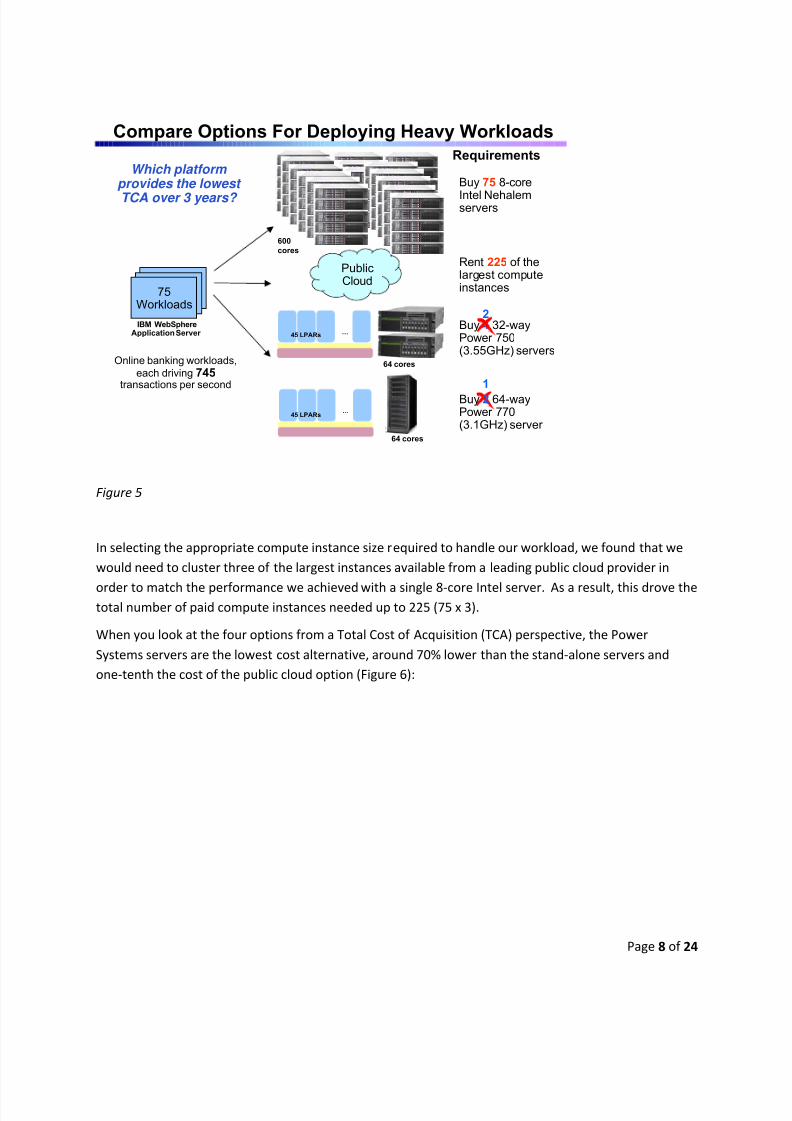
Compare Options For Deploying Heavy Workloads
75Workloads
Rent 225 of thelargest computeinstances
Which platform provides the lowest
TCA over 3 years?
Requirements
IBM WebSphereApplication Server
Buy 4 32-wayPower 750(3.55GHz) servers
Buy 2 64-wayPower 770(3.1GHz) server
…
…
Online banking workloads,
each driving 745transactions per second
45 LPARs
45 LPARs
600
cores
64 cores
64 cores
PublicCloud
Buy 75 8-core
Intel Nehalemservers
1
2
Figure 5
In selecting the appropriate compute instance size required to handle our workload, we found that we
would need to cluster three of the largest instances available from a leading public cloud provider in
order to match the performance we achieved with a single 8-core Intel server. As a result, this drove thetotal number of paid compute instances needed up to 225 (75 x 3).
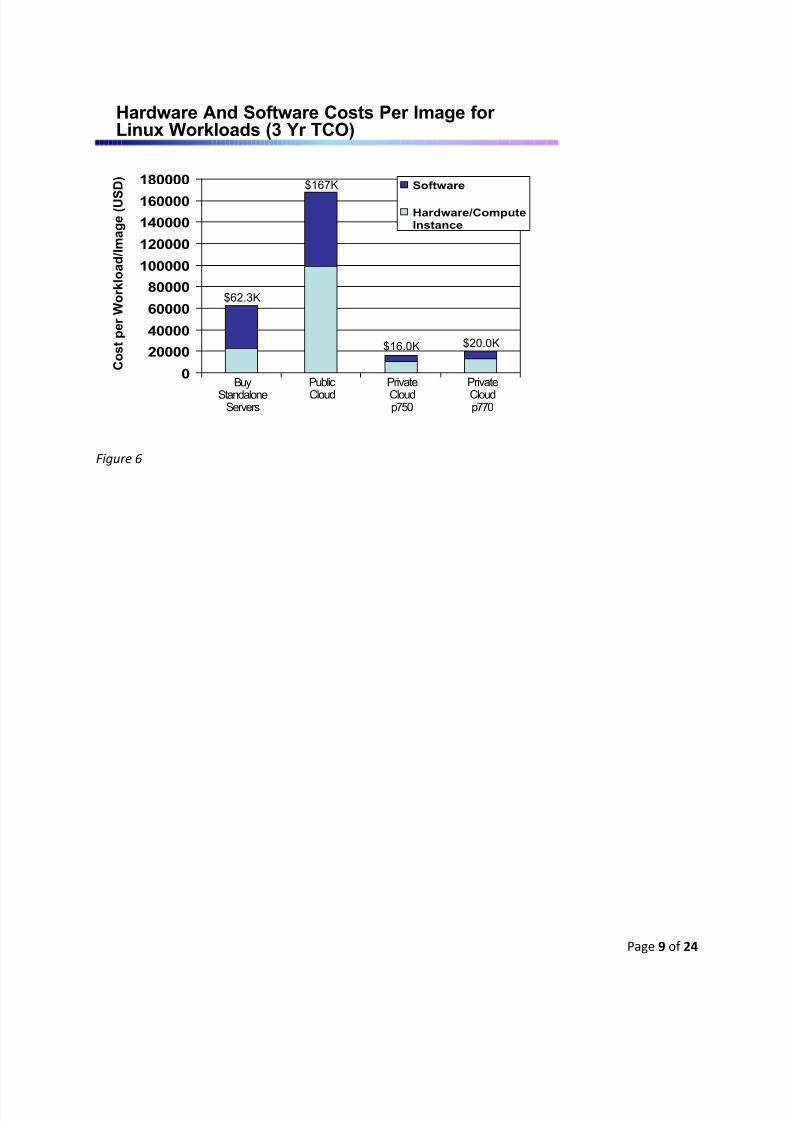
When you look at the four options from a Total Cost of Acquisition (TCA) perspective, the Power
Systems servers are the lowest cost alternative, around 70% lower than the stand-alone servers and
one-tenth the cost of the public cloud option (Figure 6):
Page 8 of 24
8/3/2019 IBM whitepaper: Building a Dynamic Infrastructure with IBM Power Systems: A Closer Look at Private Cloud TCO
http://slidepdf.com/reader/full/ibm-whitepaper-building-a-dynamic-infrastructure-with-ibm-power-systems-a 9/24
0
20000
40000
60000
80000
100000
120000
140000
160000
180000 Software
Hardware/ComputeInstance
$62.3K
$167K
Buy
StandaloneServers
Public
Cloud
Private
Cloudp770
C o s t p e r W o r k l o a d / I m a g e ( U S
D )
$20.0K
Hardware And Software Costs Per Image for Linux Workloads (3 Yr TCO)
Private
Cloudp750
$16.0K
Figure 6
Page 9 of 24
8/3/2019 IBM whitepaper: Building a Dynamic Infrastructure with IBM Power Systems: A Closer Look at Private Cloud TCO
http://slidepdf.com/reader/full/ibm-whitepaper-building-a-dynamic-infrastructure-with-ibm-power-systems-a 10/24
Labor and the Server Provisioning Lifecycle
Now that we have a handle on the impact of virtualization on hardware and software costs, what about
the effects of labor? Any discussion of labor needs to start with a process that describes the tasks
associated with the acquisition, deployment and retirement of servers. Servers are first planned andacquired, then they are handed over to administrators to configure, set up and deploy. The operating
systems software is installed, Hypervisors are configured, virtual servers configured, security profiles for
users established, and the server is tested and deployed into production. Monthly maintenance
continues including routine patches and fixes, and upgrades. The servers are ultimately cleansed and
retired from service.
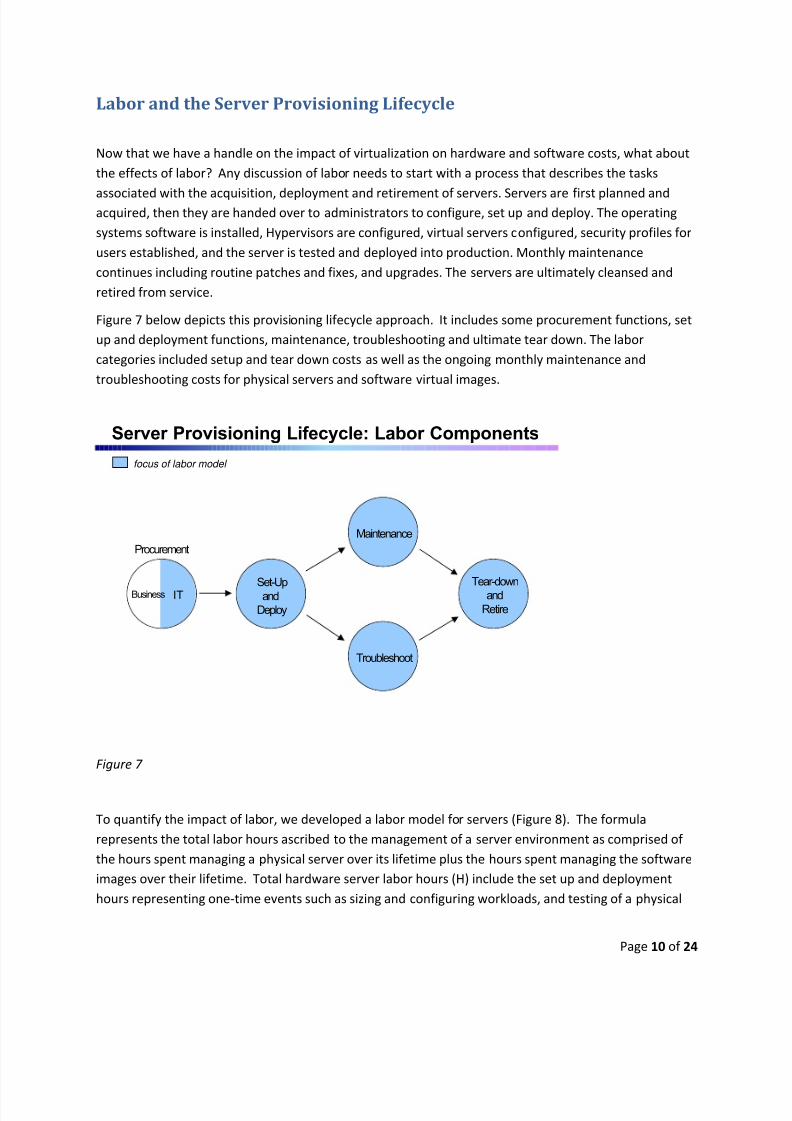
Figure 7 below depicts this provisioning lifecycle approach. It includes some procurement functions, set
up and deployment functions, maintenance, troubleshooting and ultimate tear down. The labor
categories included setup and tear down costs as well as the ongoing monthly maintenance and
troubleshooting costs for physical servers and software virtual images.
Server Provisioning Lifecycle: Labor Components
Set-Up
and
Deploy
Tear-down
and
Retire
Procurement
Maintenance
Troubleshoot
Business IT
focus of labor model
Figure 7
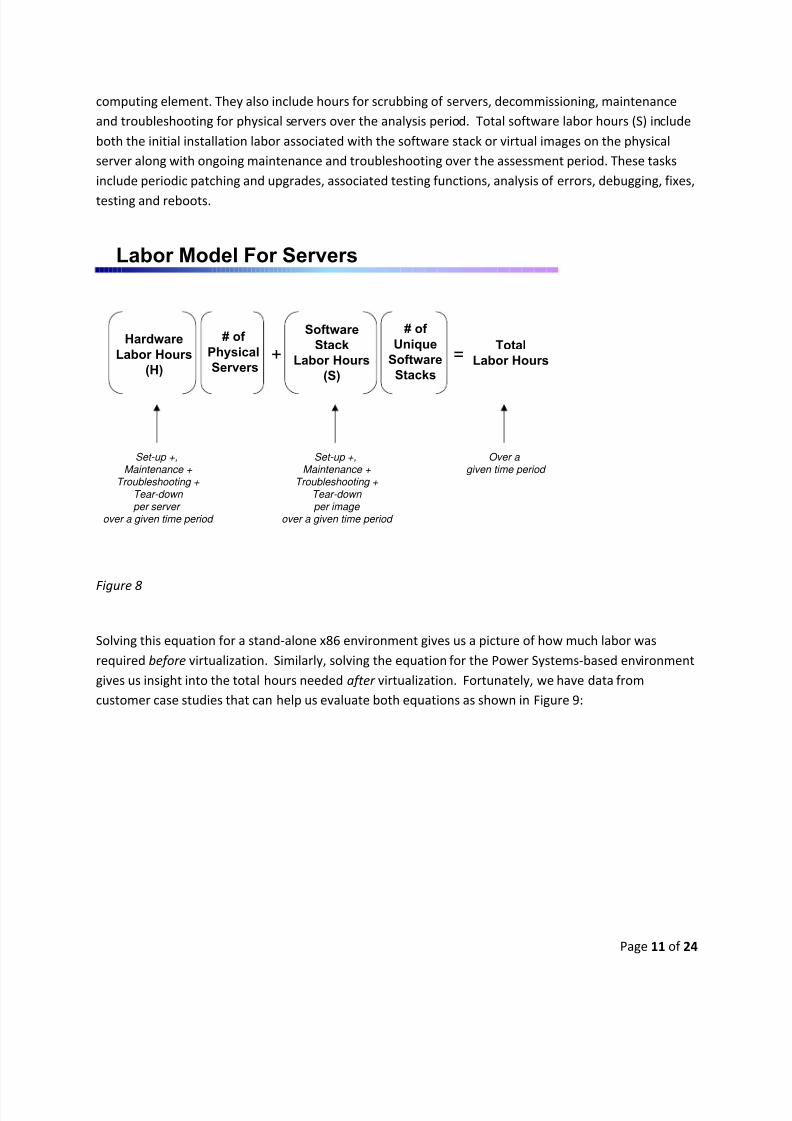
To quantify the impact of labor, we developed a labor model for servers (Figure 8). The formula
represents the total labor hours ascribed to the management of a server environment as comprised of
the hours spent managing a physical server over its lifetime plus the hours spent managing the software
images over their lifetime. Total hardware server labor hours (H) include the set up and deployment
hours representing one-time events such as sizing and configuring workloads, and testing of a physical
Page 10 of 24
8/3/2019 IBM whitepaper: Building a Dynamic Infrastructure with IBM Power Systems: A Closer Look at Private Cloud TCO
http://slidepdf.com/reader/full/ibm-whitepaper-building-a-dynamic-infrastructure-with-ibm-power-systems-a 11/24
computing element. They also include hours for scrubbing of servers, decommissioning, maintenance
and troubleshooting for physical servers over the analysis period. Total software labor hours (S) include
both the initial installation labor associated with the software stack or virtual images on the physical
server along with ongoing maintenance and troubleshooting over the assessment period. These tasks
include periodic patching and upgrades, associated testing functions, analysis of errors, debugging, fixes,
testing and reboots.
Software
Stack
Labor Hours
(S)
Labor Model For Servers
Total
Labor Hours=Hardware
Labor Hours
(H)
# of
Physical
Servers+
Over a given time period
Set-up +,Maintenance +
Troubleshooting + Tear-down per server
over a given time period
Set-up +,Maintenance +
Troubleshooting + Tear-down per image
over a given time period
# of
Unique
Software
Stacks
Figure 8
Solving this equation for a stand-alone x86 environment gives us a picture of how much labor was
required before virtualization. Similarly, solving the equation for the Power Systems-based environment
gives us insight into the total hours needed after virtualization. Fortunately, we have data from
customer case studies that can help us evaluate both equations as shown in Figure 9:
Page 11 of 24

8/3/2019 IBM whitepaper: Building a Dynamic Infrastructure with IBM Power Systems: A Closer Look at Private Cloud TCO
http://slidepdf.com/reader/full/ibm-whitepaper-building-a-dynamic-infrastructure-with-ibm-power-systems-a 12/24
0
10
20
30
40
50
60
Power/VMx86 hypervisor
Dist Intel
Dist UNIX
Average
Using Customer Data to Derive Average Number of Servers per Administrator
S e r v e r s p e r F T E
Customer Data
14.68
55.90
30.68
52.45
Figure 9
For the stand-alone x86 server case, this works out to be 30.7 servers/FTE, while the virtualized Power
Systems server case turns out to be 55.9 servers per administrator.
We then wanted to calculate the portion of FTE labor needed to manage a server .
Calculating the FTEs per server for stand-alone and virtualized x86-based servers
• Stand-alone x86 data shows 30.7 servers managed per FTE,
1/30.7= .0326 FTE’s needed per server
• Virtualized Power Systems data shows 55.9 virtual servers managed per
FTE,
1/55.9 = .0179 FTE’s needed per server
Next, we wrote equations to represent the total FTE hours required to manage our 75 Linux workloads
each year for both stand-alone and virtualized Power Systems platforms.
Page 12 of 24
8/3/2019 IBM whitepaper: Building a Dynamic Infrastructure with IBM Power Systems: A Closer Look at Private Cloud TCO
http://slidepdf.com/reader/full/ibm-whitepaper-building-a-dynamic-infrastructure-with-ibm-power-systems-a 13/24
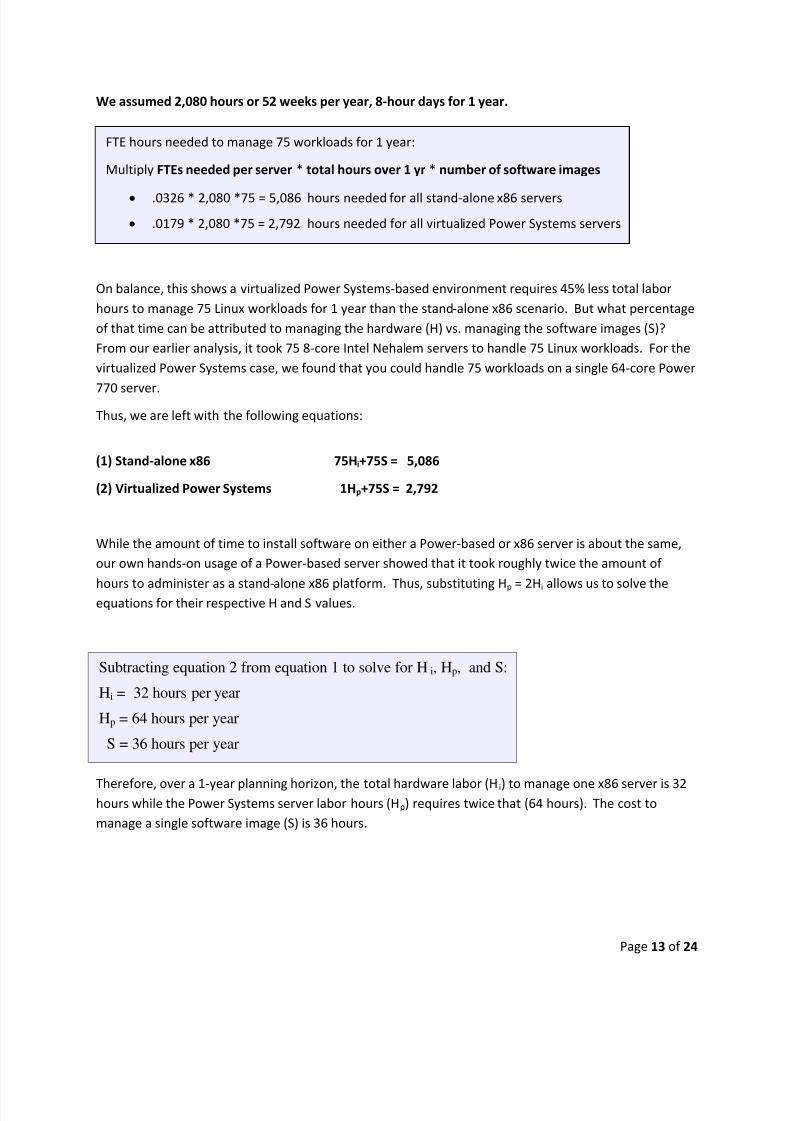
We assumed 2,080 hours or 52 weeks per year, 8-hour days for 1 year.
FTE hours needed to manage 75 workloads for 1 year:
Multiply FTEs needed per server * total hours over 1 yr * number of software images
• .0326 * 2,080 *75 = 5,086 hours needed for all stand-alone x86 servers
• .0179 * 2,080 *75 = 2,792 hours needed for all virtualized Power Systems servers
On balance, this shows a virtualized Power Systems-based environment requires 45% less total labor
hours to manage 75 Linux workloads for 1 year than the stand-alone x86 scenario. But what percentage
of that time can be attributed to managing the hardware (H) vs. managing the software images (S)?
From our earlier analysis, it took 75 8-core Intel Nehalem servers to handle 75 Linux workloads. For the
virtualized Power Systems case, we found that you could handle 75 workloads on a single 64-core Power
770 server.
Thus, we are left with the following equations:
(1) Stand-alone x86 75Hi+75S = 5,086
(2) Virtualized Power Systems 1Hp+75S = 2,792
While the amount of time to install software on either a Power-based or x86 server is about the same,
our own hands-on usage of a Power-based server showed that it took roughly twice the amount of
hours to administer as a stand-alone x86 platform. Thus, substituting Hp = 2Hi allows us to solve theequations for their respective H and S values.
Subtracting equation 2 from equation 1 to solve for H i, Hp, and S:
Hi = 32 hours per year
Hp = 64 hours per year
S = 36 hours per year
Therefore, over a 1-year planning horizon, the total hardware labor (Hi) to manage one x86 server is 32hours while the Power Systems server labor hours (Hp) requires twice that (64 hours). The cost to
manage a single software image (S) is 36 hours.
Page 13 of 24
8/3/2019 IBM whitepaper: Building a Dynamic Infrastructure with IBM Power Systems: A Closer Look at Private Cloud TCO
http://slidepdf.com/reader/full/ibm-whitepaper-building-a-dynamic-infrastructure-with-ibm-power-systems-a 14/24
Standardization Helps Lower Labor Costs
Servers need a full load of software to run a workload. This includes not only an operating system,
middleware and the application itself, but also things like patches and configuration specifications. We
refer to all of this software as a “software stack”. Without controls, the variety of software stacks tendsto proliferate, driving up labor costs. For example, many stacks will have different levels of software
installed, along with different patches and product selections. The standardization of these software
stacks, however, can reduce labor costs. Uniformity reduces the number of unique stacks to manage
and allows for greater re-use. We refer to the concept of re-using a standard software stack as
“cloning”. The question is, how can we quantify the material impact standardization has on reducing
labor costs?
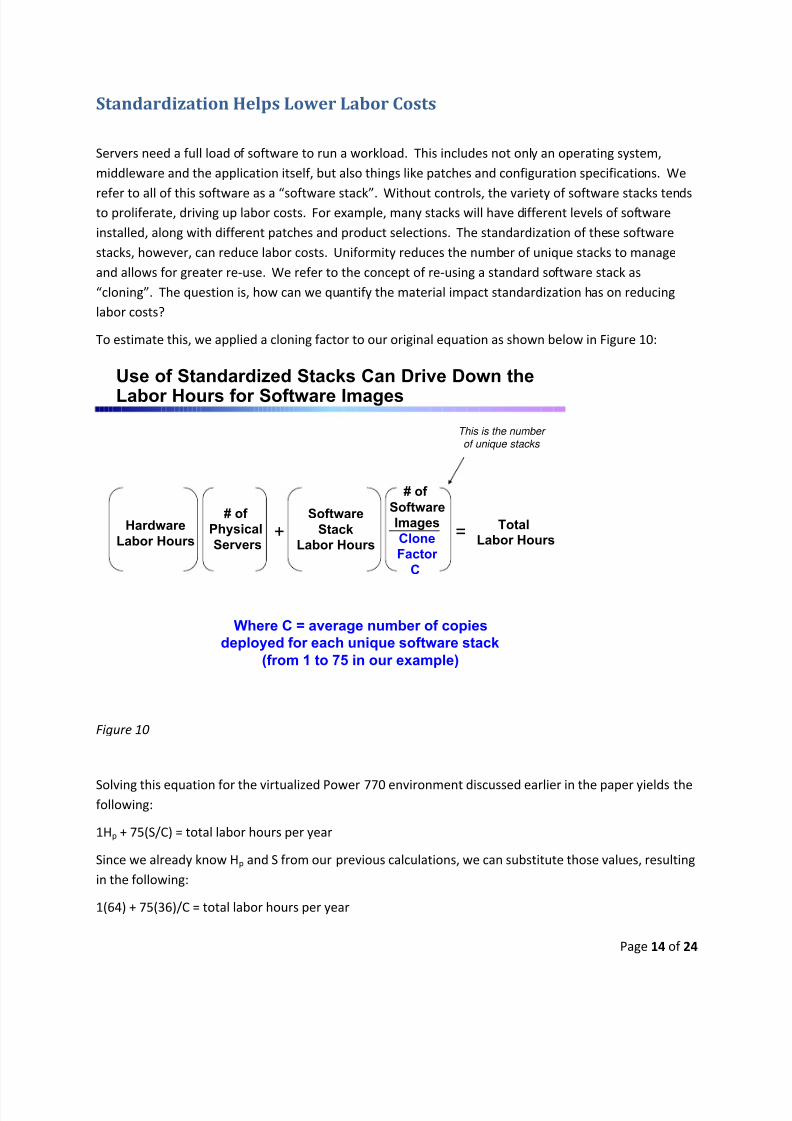
To estimate this, we applied a cloning factor to our original equation as shown below in Figure 10:
# of
Software
Images
Clone
Factor
C
Use of Standardized Stacks Can Drive Down the
Labor Hours for Software Images
Where C = average number of copies
deployed for each unique software stack
(from 1 to 75 in our example)
Software
Stack
Labor Hours
TotalLabor Hours
=Hardware
Labor Hours
# of
Physical
Servers+
This is the number
of unique stacks
Figure 10
Solving this equation for the virtualized Power 770 environment discussed earlier in the paper yields thefollowing:
1Hp + 75(S/C) = total labor hours per year
Since we already know Hp and S from our previous calculations, we can substitute those values, resulting
in the following:
1(64) + 75(36)/C = total labor hours per year
Page 14 of 24
8/3/2019 IBM whitepaper: Building a Dynamic Infrastructure with IBM Power Systems: A Closer Look at Private Cloud TCO
http://slidepdf.com/reader/full/ibm-whitepaper-building-a-dynamic-infrastructure-with-ibm-power-systems-a 15/24
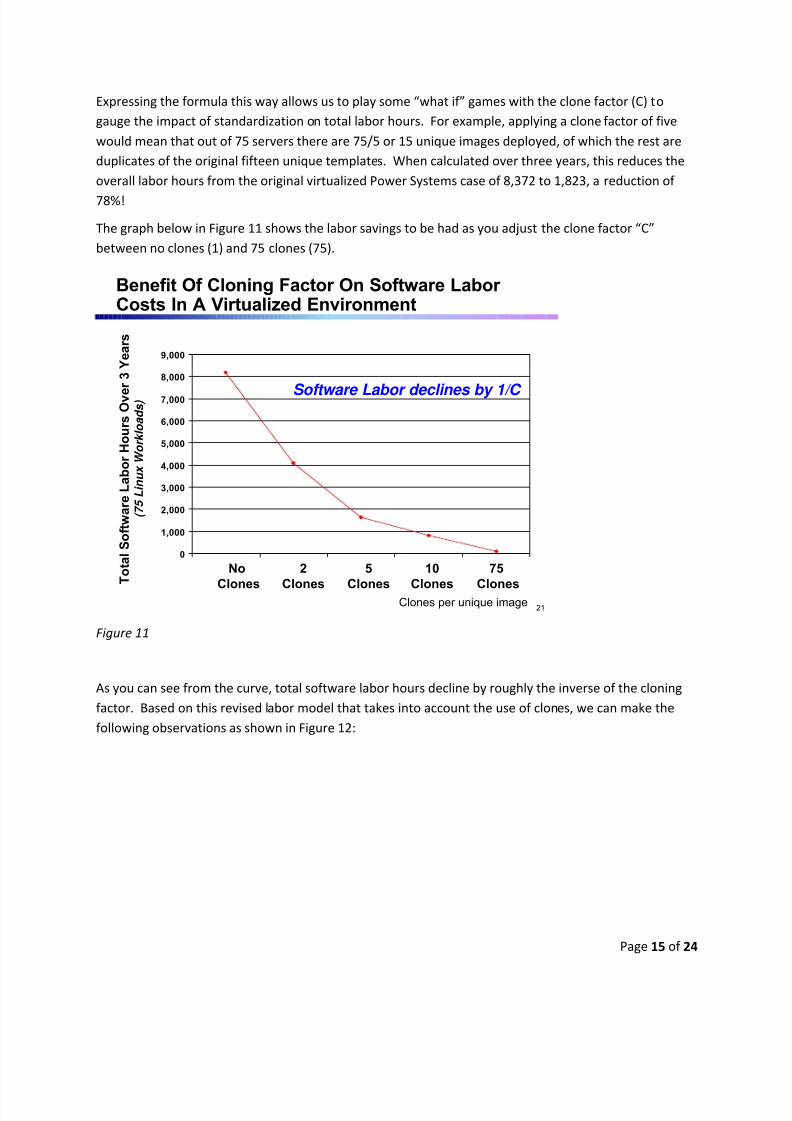
Expressing the formula this way allows us to play some “what if” games with the clone factor (C) to
gauge the impact of standardization on total labor hours. For example, applying a clone factor of five
would mean that out of 75 servers there are 75/5 or 15 unique images deployed, of which the rest are
duplicates of the original fifteen unique templates. When calculated over three years, this reduces the
overall labor hours from the original virtualized Power Systems case of 8,372 to 1,823, a reduction of
78%!
The graph below in Figure 11 shows the labor savings to be had as you adjust the clone factor “C”
between no clones (1) and 75 clones (75).
21
Benefit Of Cloning Factor On Software Labor Costs In A Virtualized Environment
0
1,000
2,000
3,000
4,000
5,000
6,000
7,000
8,000
9,000
75
Clones
No
Clones
2
Clones
5
Clones
10
Clones T o t a l S o f t w a r e L a b o r H o u r s O v e
r 3 Y e a r s
( 7 5 L i n u x W o r k l o a d s ) Software Labor declines by 1/C
Clones per unique image
Figure 11
As you can see from the curve, total software labor hours decline by roughly the inverse of the cloning
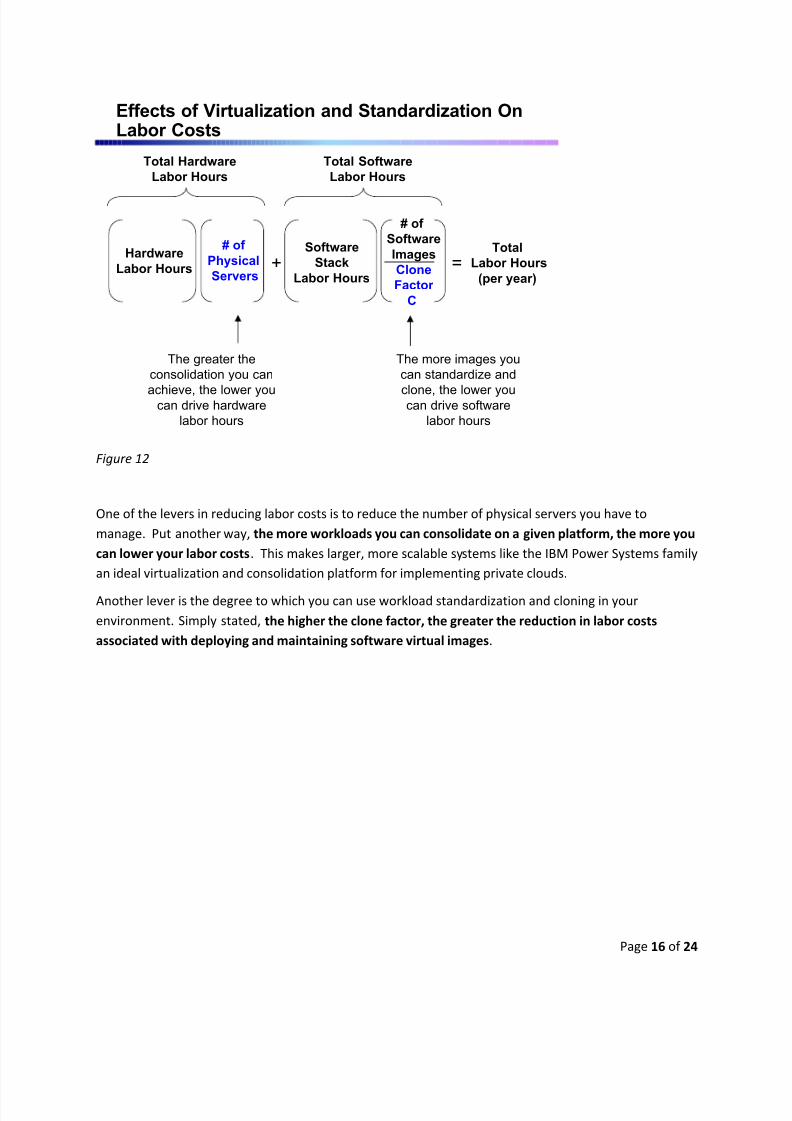
factor. Based on this revised labor model that takes into account the use of clones, we can make the
following observations as shown in Figure 12:
Page 15 of 24
8/3/2019 IBM whitepaper: Building a Dynamic Infrastructure with IBM Power Systems: A Closer Look at Private Cloud TCO
http://slidepdf.com/reader/full/ibm-whitepaper-building-a-dynamic-infrastructure-with-ibm-power-systems-a 16/24
# of
Software
Images
Clone
Factor
C
Effects of Virtualization and Standardization OnLabor Costs
Total Software
Labor Hours
Total Hardware
Labor Hours
The more images youcan standardize and
clone, the lower youcan drive software
labor hours
The greater theconsolidation you can
achieve, the lower youcan drive hardware
labor hours
=# of
Physical
Servers+
Software
Stack
Labor Hours
Hardware
Labor Hours
Total
Labor Hours
(per year)
Figure 12
One of the levers in reducing labor costs is to reduce the number of physical servers you have to
manage. Put another way, the more workloads you can consolidate on a given platform, the more you
can lower your labor costs. This makes larger, more scalable systems like the IBM Power Systems family
an ideal virtualization and consolidation platform for implementing private clouds.
Another lever is the degree to which you can use workload standardization and cloning in your
environment. Simply stated, the higher the clone factor, the greater the reduction in labor costs
associated with deploying and maintaining software virtual images.
Page 16 of 24
8/3/2019 IBM whitepaper: Building a Dynamic Infrastructure with IBM Power Systems: A Closer Look at Private Cloud TCO
http://slidepdf.com/reader/full/ibm-whitepaper-building-a-dynamic-infrastructure-with-ibm-power-systems-a 17/24
Automation Can Help Lower Labor Costs Even Further!
While virtualization and standardization can go a long way in reducing overall labor costs, the task of
deploying a software stack as a VM image onto a virtualized server has historically been a highly labor-
intensive task. For instance, one has to first deploy and configure the OS along with all requisitepatches. After that, the administrator has to install and configure the application server and all its
constituent components (e.g. HTTP server, etc.) as well as patches and other fixes. For applications
requiring a database, that becomes yet another piece of middleware that needs to be installed and
configured. Then there is the application itself. Collectively, deploying and testing a complete
application manually can require days or weeks to accomplish depending upon its overall complexity. In
a private cloud environment, this kind of turnaround is untenable. The use of automation promises to
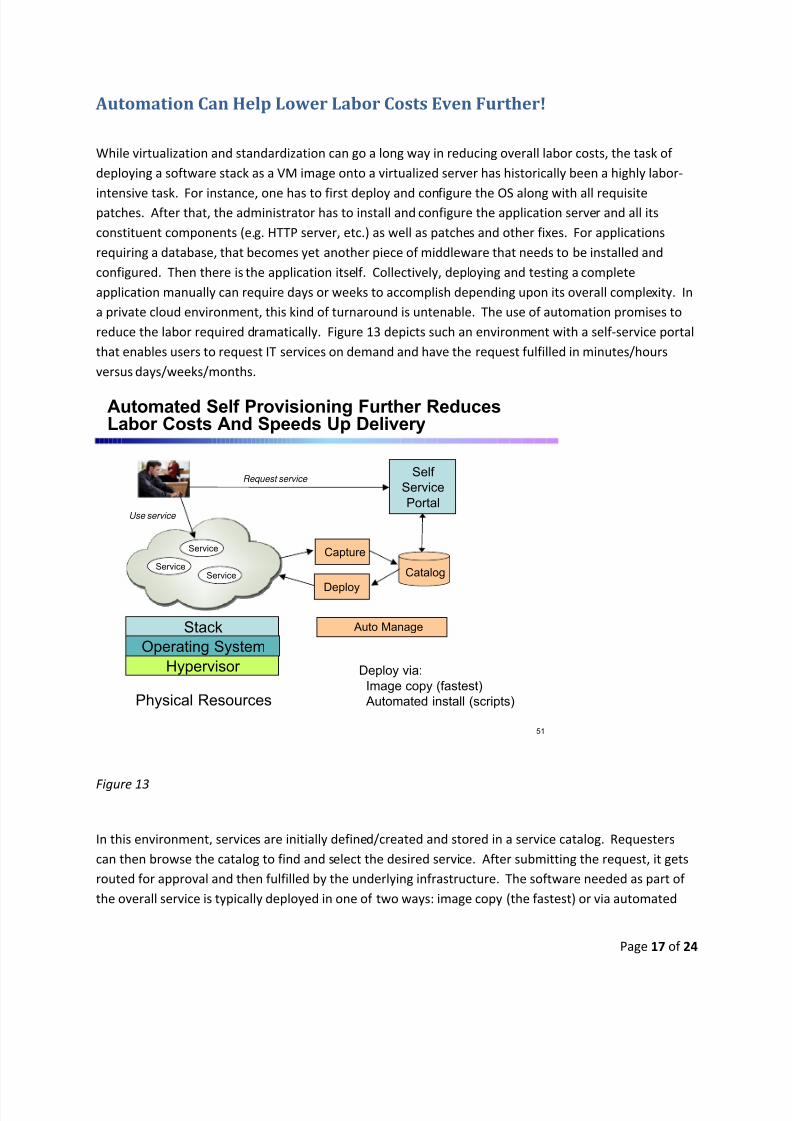
reduce the labor required dramatically. Figure 13 depicts such an environment with a self-service portal
that enables users to request IT services on demand and have the request fulfilled in minutes/hours
versus days/weeks/months.
51
Automated Self Provisioning Further ReducesLabor Costs And Speeds Up Delivery
ServiceService
Service
Auto Manage
Catalog
Deploy
Use service
Request service
Stack
Hypervisor
Operating System
Self ServicePortal
Capture
Physical Resources
Deploy via:Image copy (fastest)Automated install (scripts)
Figure 13
In this environment, services are initially defined/created and stored in a service catalog. Requesters
can then browse the catalog to find and select the desired service. After submitting the request, it gets
routed for approval and then fulfilled by the underlying infrastructure. The software needed as part of
the overall service is typically deployed in one of two ways: image copy (the fastest) or via automated
Page 17 of 24

8/3/2019 IBM whitepaper: Building a Dynamic Infrastructure with IBM Power Systems: A Closer Look at Private Cloud TCO
http://slidepdf.com/reader/full/ibm-whitepaper-building-a-dynamic-infrastructure-with-ibm-power-systems-a 18/24
install using scripts. When the service is no longer needed, the affected resources are freed up so that
they can be claimed by other subsequent requests. In order for all of this to work seamlessly and
transparently to the user, there needs to be automated management software that undergirds each
step in the process.
IBM offers Tivoli Service Automation Manager (TSAM) to manage this cloud services lifecycle and deliver
request-driven provisioning for a private cloud environment. It leverages Tivoli Service Request
Manager (TSRM) to provide a self-service UI for users to search against the catalog and select the
desired service. It also utilizes Tivoli Provisioning Manager (TPM) to provision hardware and software
resources according to best practices to satisfy the service request (Figure 14).
Example: IBM Tivoli Service Automation Manager (TSAM) Delivers Fast Self-Service Provisioning
Service
Catalog
Automated
Provisioning
User browses service catalogAdds service to shopping cartSubmits request
TSAM starts the deployment
process via IBM TivoliProvisioning Manager workflow
TSAM enables standardization viaa catalog of service offerings
TSAM provides automated provisioning
TSAM
Power Hardware
PowerVM
VirtualServer
VirtualServer
NewVirtualServer
Figure 14
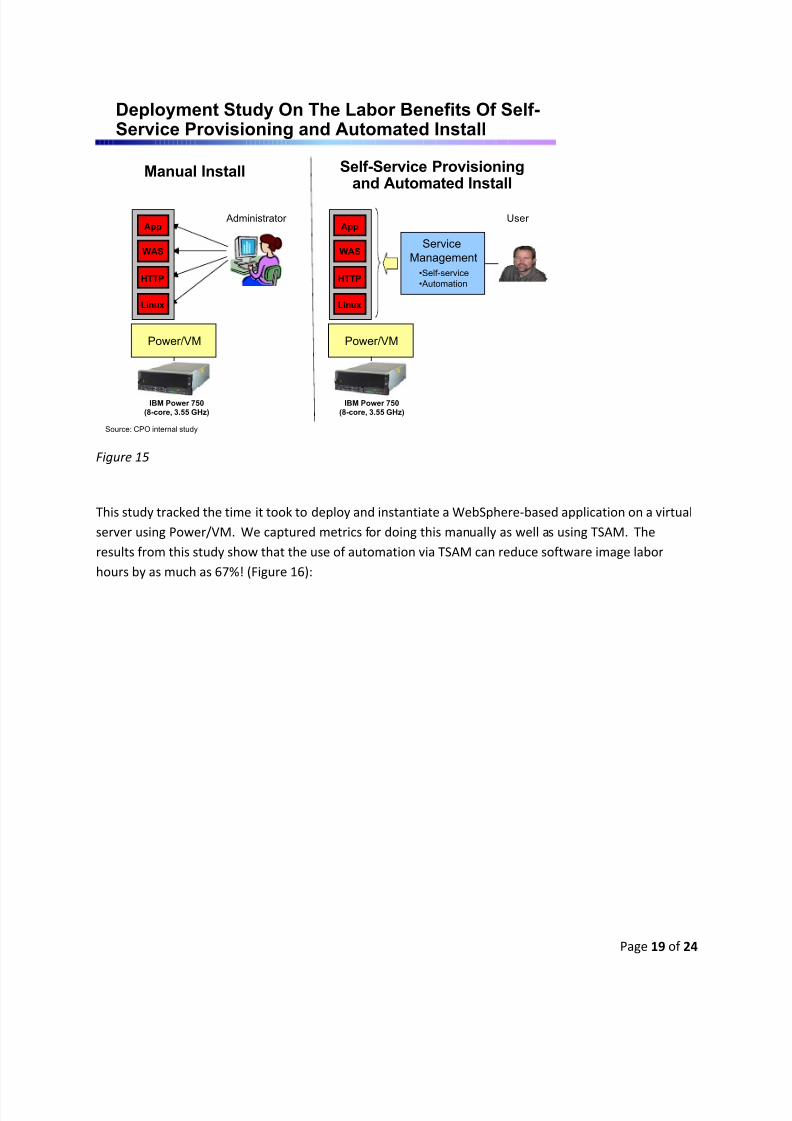
To help assess the extent to which the use of TSAM can reduce labor hours, we conducted a hands-on
study as shown on Figure 15 below:
Page 18 of 24
8/3/2019 IBM whitepaper: Building a Dynamic Infrastructure with IBM Power Systems: A Closer Look at Private Cloud TCO
http://slidepdf.com/reader/full/ibm-whitepaper-building-a-dynamic-infrastructure-with-ibm-power-systems-a 19/24
Deployment Study On The Labor Benefits Of Self-Service Provisioning and Automated Install
IBM Power 750(8-core, 3.55 GHz)
Self-Service Provisioningand Automated Install
ServiceManagement
Linux
App
HTTP
WAS
Power/VM
Linux
App
HTTP
WAS
Manual Install
User Administrator
•Self-service•Automation
Power/VM
IBM Power 750(8-core, 3.55 GHz)
Source: CPO internal study
Figure 15
This study tracked the time it took to deploy and instantiate a WebSphere-based application on a virtual
server using Power/VM. We captured metrics for doing this manually as well as using TSAM. The
results from this study show that the use of automation via TSAM can reduce software image labor
hours by as much as 67%! (Figure 16):
Page 19 of 24

8/3/2019 IBM whitepaper: Building a Dynamic Infrastructure with IBM Power Systems: A Closer Look at Private Cloud TCO
http://slidepdf.com/reader/full/ibm-whitepaper-building-a-dynamic-infrastructure-with-ibm-power-systems-a 20/24
Benefit Of Automated, Self Provisioning OnLabor Costs
0
50
100
150
200
250
300
T o t a l D e p l o y m e n t T i m
e
( m i n u t e s )
AutomatedInstall
ManualInstall
67%reduction
40 min
120 min
Applying this labor savings ratio reduces Software Labor (S) from 36 to 12 for each VM image!
Figure 16
Page 20 of 24

8/3/2019 IBM whitepaper: Building a Dynamic Infrastructure with IBM Power Systems: A Closer Look at Private Cloud TCO
http://slidepdf.com/reader/full/ibm-whitepaper-building-a-dynamic-infrastructure-with-ibm-power-systems-a 21/24
Putting It All Together
As our analysis shows, there are significant labor savings to be had through the use of virtualization,
standardization, and automation. For our example of 75 Linux workloads over three years, virtualization
by itself yields a 46% reduction while standardization alone reduces labor hours up to 78% with just amodest clone factor (C=5). Using Tivoli Service Automation Manager for automation in conjunction with
Power/VM hypervisor on a Power Systems server yields a reduction of 60%. Taken collectively,
companies can reduce their labor costs by up to 95% compared to a traditional stand-alone x86
environment and manual deployment methods (Figure 17):
0
2,000
4,000
6,000
8,000
10,000
12,000
14,000
16,000
18,000
Total Hardware and Software Labor Hours for 75Linux Workloads Over 3 Years
T o t a l H a r d w a r e a n d S o f t w
a r e
L a b o r H o u r s O v e r 3 Y e a
r s
( 7 5 L i n u x W o r k l o a d s )
60% less
95% less
Virtualized +
Standardized(C=5) +Automation
Distributed
(Intel)
Virtualized
(POWER)
Virtualized +
Standardized(C=5)
46% less
78% less
Figure 17
Now that we have been able to quantify the labor savings through the use of virtualization,
standardization, and automation, we need to combine these with our earlier hardware and software
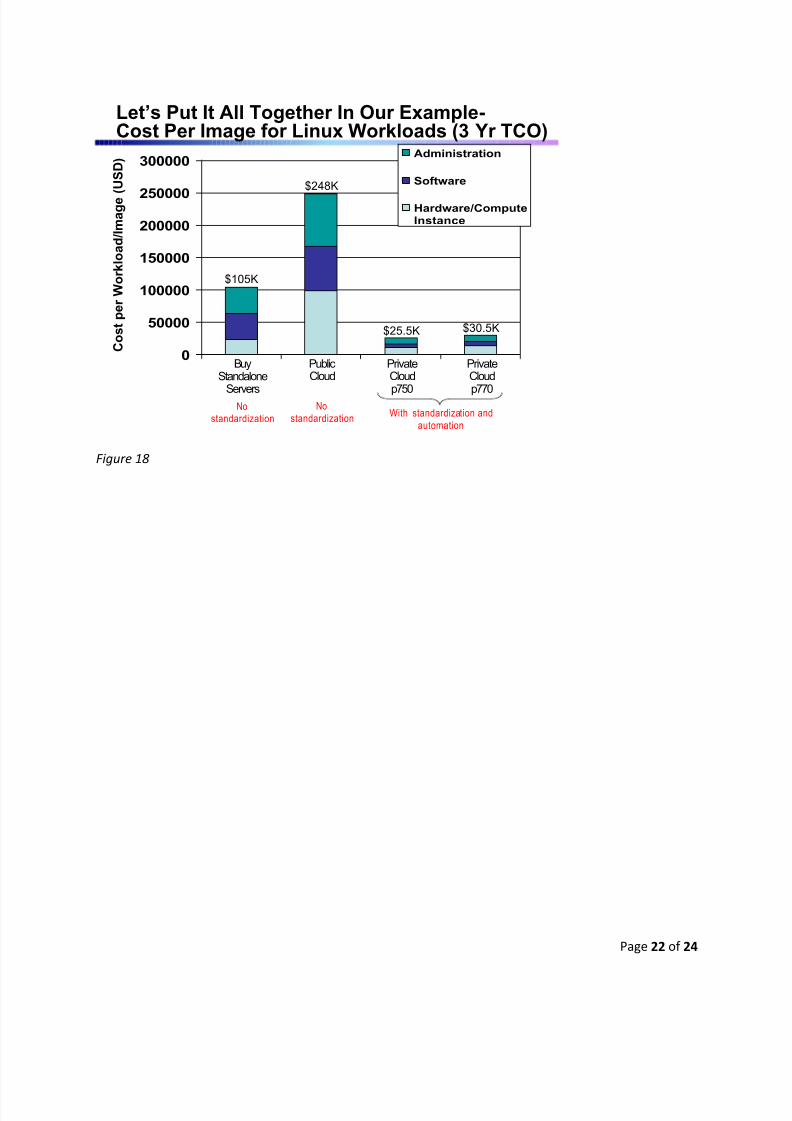
numbers in order to show a complete cost picture. As shown in Figure 18, you see that the Power
Systems 750 and 770 server options come in at the lowest cost per image over three years for our 75
workloads at $25.5K and $30.5K, respectively. This works out to be a savings of over 70% compared to
the stand-alone x86 server alternative and almost 90% for the public cloud option.
Page 21 of 24
8/3/2019 IBM whitepaper: Building a Dynamic Infrastructure with IBM Power Systems: A Closer Look at Private Cloud TCO
http://slidepdf.com/reader/full/ibm-whitepaper-building-a-dynamic-infrastructure-with-ibm-power-systems-a 22/24
0
50000
100000
150000
200000
250000
300000Administration
Software
Hardware/ComputeInstance
BuyStandalone
Servers
PublicCloud
PrivateCloud
p770
C o s t p e r W o r k l o a d / I m a g e ( U S D )
PrivateCloud
p750
Let’s Put It All Together In Our Example-Cost Per Image for Linux Workloads (3 Yr TCO)
$105K
$248K
$30.5K$25.5K
No
standardization
No
standardizationWith standardization and
automation
Figure 18
Page 22 of 24
8/3/2019 IBM whitepaper: Building a Dynamic Infrastructure with IBM Power Systems: A Closer Look at Private Cloud TCO
http://slidepdf.com/reader/full/ibm-whitepaper-building-a-dynamic-infrastructure-with-ibm-power-systems-a 23/24
Summary
Escalating business requirements will continue to drive companies toward datacenter transformation.
This includes pursuing ways to take costs out of their existing infrastructure through the use of
virtualization, standardization, and automation. The labor model described in this paper can be used toestimate potential savings for a number of different deployment scenarios and technology choices. In
our example, we chose to highlight the advantages of using IBM Power Systems servers in conjunction
with Tivoli service management software as a means to deliver a cost-effective private cloud
environment. Some of the benefits that can be expected include:
• Private clouds built on IBM Power Systems servers and Tivoli service management software
can be up to 70-90% less expensive on a cost/image basis than stand-alone x86 servers or
public cloud alternatives
• The greater the consolidation you can achieve, the lower you can reduce total physical server
labor hours
• The more images you can standardize and clone, the lower you can reduce software image
labor hours
• The use of Tivoli Service Automation Manager can reduce labor hours for a unique software
image by up to 67% compared to manual deployment on an IBM Power Systems server
Page 23 of 24
8/3/2019 IBM whitepaper: Building a Dynamic Infrastructure with IBM Power Systems: A Closer Look at Private Cloud TCO
http://slidepdf.com/reader/full/ibm-whitepaper-building-a-dynamic-infrastructure-with-ibm-power-systems-a 24/24
Page 24 of 24
© Copyright IBM Corporation 2010
IBM Corporation
Software Group
Route 100
Somers, NY10589USA
Produced in the United States
March 2010
All Rights Reserved
IBM, the IBM logo, DB2 and WebSphere are trademarks or registered trademarks of International Business Machines Corporation in the
United States, other countries, or both.
Java and all Java-based trademarks are trademarks of Sun Microsystems, Inc. in the United States, other countries, or both.
Intel and Xeon are registered trademarks of the Intel Corporation in the United States and other countries.
Other company, product or service names may be trademarks or service marks of others.
The information contained in this documentation is provided for informational purposes only. While efforts were made to verify
the completeness and accuracy of the information contained in this documentation, it is provided “as is” without warranty of any
kind, express or implied. In addition, this information is based on IBM’s current product plans and strategy, which are subject to
change by IBM without notice. IBM shall not be responsible for any damages arising out of the use of, or otherwise related to,
this documentation or any other documentation. Nothing contained in this documentation is intended to, nor shall have the effect
of, creating any warranties or representations from IBM (or its suppliers or licensors), or altering the terms and conditions of the
applicable license agreement governing the use of IBM software.
References in these materials to IBM products, programs, or services do not imply that they will be available in all countries inwhich IBM operates. Product release dates and/or capabilities referenced in these materials may change at any time at IBM’s
sole discretion based on market opportunities or other factors, and are not intended to be a commitment to future product orfeature availability in any way.
POW03043USEN-00


![Application Server TCO comparison: WebSphere vs. JBosshosteddocs.ittoolbox.com/wp_WAS_JBoss_TCO_Analysis[1].pdf · IBM WebSphere ® vs. Application Server V8.5 . JBoss ® TCO Analysis](https://img.pdfslide.us/doc/110x75/5aa262ed7f8b9a46238d0472/application-server-tco-comparison-websphere-vs-1pdfibm-websphere-vs-application.jpg)