Embed Size (px)
Citation preview

IBM ILOG Solver
Debugger User’s Manual
June 2009

Copyright notice
© Copyright International Business Machines Corporation 1987, 2009.
US Government Users Restricted Rights - Use, duplication or disclosure restricted by GSA ADP Schedule Contract with IBM Corp.
Trademarks
IBM, the IBM logo, ibm.com, WebSphere, ILOG, the ILOG design, and CPLEX are trademarks or registered trademarks of International Business Machines Corp., registered in many jurisdictions worldwide. Other product and service names might be trademarks of IBM or other companies. A current list of IBM trademarks is available on the Web at "Copyright and trademark information" at http://www.ibm.com/legal/copytrade.shtml
Adobe, the Adobe logo, PostScript, and the PostScript logo are either registered trademarks or trademarks of Adobe Systems Incorporated in the United States, and/or other countries.
Linux is a registered trademark of Linus Torvalds in the United States, other countries, or both.
Microsoft, Windows, Windows NT, and the Windows logo are trademarks of Microsoft Corporation in the United States, other countries, or both.
Java and all Java-based trademarks and logos are trademarks of Sun Microsystems, Inc. in the United States, other countries, or both.
Other company, product, or service names may be trademarks or service marks of others.
C O N T E N T S
Contents
Preface Before You Begin . . . . . . . . . . . . . . . . . . . . . . . . . . . . . . . . . . . . . . . . . . . . . . . . . . . vii
About IBM ILOG Solver Debugger . . . . . . . . . . . . . . . . . . . . . . . . . . . . . . . . . . . . . . . . . . . . .vii
What You Need to Know . . . . . . . . . . . . . . . . . . . . . . . . . . . . . . . . . . . . . . . . . . . . . . . . . . . . .vii
What This Manual Contains . . . . . . . . . . . . . . . . . . . . . . . . . . . . . . . . . . . . . . . . . . . . . . . . . viii
Notation Used in This Manual. . . . . . . . . . . . . . . . . . . . . . . . . . . . . . . . . . . . . . . . . . . . . . . . viii
IBM software support handbook . . . . . . . . . . . . . . . . . . . . . . . . . . . . . . . . . . . . . . . . . . . . . viii
Accessing software support . . . . . . . . . . . . . . . . . . . . . . . . . . . . . . . . . . . . . . . . . . . . . . . . . . . .viii
Contact via web . . . . . . . . . . . . . . . . . . . . . . . . . . . . . . . . . . . . . . . . . . . . . . . . . . . . . . . . . . . . . ix
Contact via phone . . . . . . . . . . . . . . . . . . . . . . . . . . . . . . . . . . . . . . . . . . . . . . . . . . . . . . . . . . . ix
Chapter 1 Debugging and Performance Tuning for Solver-based Applications . . . . . . . . . 1
Installation . . . . . . . . . . . . . . . . . . . . . . . . . . . . . . . . . . . . . . . . . . . . . . . . . . . . . . . . . . . . . . . . .2
Prerequisites for Using Solver Debugger. . . . . . . . . . . . . . . . . . . . . . . . . . . . . . . . . . . . . . . . . . .2
The Distribution Directories . . . . . . . . . . . . . . . . . . . . . . . . . . . . . . . . . . . . . . . . . . . . . . . . . . . . .2
Examples Provided . . . . . . . . . . . . . . . . . . . . . . . . . . . . . . . . . . . . . . . . . . . . . . . . . . . . . . . . . . .3
Instrumenting Your Own Code . . . . . . . . . . . . . . . . . . . . . . . . . . . . . . . . . . . . . . . . . . . . . . . . .5
Customizing a Pure Solver C++ Application . . . . . . . . . . . . . . . . . . . . . . . . . . . . . . . . . . . . . . . .5
Customizing a Pure Scheduler C++ Application . . . . . . . . . . . . . . . . . . . . . . . . . . . . . . . . . . . . .6
Setting Up Solver Debugger . . . . . . . . . . . . . . . . . . . . . . . . . . . . . . . . . . . . . . . . . . . . . . . . . . .8
Launching the GUI . . . . . . . . . . . . . . . . . . . . . . . . . . . . . . . . . . . . . . . . . . . . . . . . . . . . . . . . . . . .8
Connecting an Application . . . . . . . . . . . . . . . . . . . . . . . . . . . . . . . . . . . . . . . . . . . . . . . . . . . . . .9
I B M I L O G S O L V E R D E B U G G E R U S E R ’ S M A N U A L iii

C O N T E N T S
Debugger Commands . . . . . . . . . . . . . . . . . . . . . . . . . . . . . . . . . . . . . . . . . . . . . . . . . . . . . . .11
Visualizing the Search . . . . . . . . . . . . . . . . . . . . . . . . . . . . . . . . . . . . . . . . . . . . . . . . . . . . . . .12
The Search Tree . . . . . . . . . . . . . . . . . . . . . . . . . . . . . . . . . . . . . . . . . . . . . . . . . . . . . . . . . . . .13
Monitoring Decisions . . . . . . . . . . . . . . . . . . . . . . . . . . . . . . . . . . . . . . . . . . . . . . . . . . . . . . . . .16
Monitoring Solution Restoring . . . . . . . . . . . . . . . . . . . . . . . . . . . . . . . . . . . . . . . . . . . . . . . . . .19
Monitoring Restart . . . . . . . . . . . . . . . . . . . . . . . . . . . . . . . . . . . . . . . . . . . . . . . . . . . . . . . . . . .19
Monitoring Local Search . . . . . . . . . . . . . . . . . . . . . . . . . . . . . . . . . . . . . . . . . . . . . . . . . . . . . .19
Monitoring Nested Search . . . . . . . . . . . . . . . . . . . . . . . . . . . . . . . . . . . . . . . . . . . . . . . . . . . . .20
Visualizing Propagation . . . . . . . . . . . . . . . . . . . . . . . . . . . . . . . . . . . . . . . . . . . . . . . . . . . . .21
Events . . . . . . . . . . . . . . . . . . . . . . . . . . . . . . . . . . . . . . . . . . . . . . . . . . . . . . . . . . . . . . . . . . . .21
Using the Propagation Spy . . . . . . . . . . . . . . . . . . . . . . . . . . . . . . . . . . . . . . . . . . . . . . . . . . . .21
Tracing the Initial Propagation . . . . . . . . . . . . . . . . . . . . . . . . . . . . . . . . . . . . . . . . . . . . . . . . . .23
Tracing the Propagation at a Specific Node. . . . . . . . . . . . . . . . . . . . . . . . . . . . . . . . . . . . . . . .23
Visualizing Variable Domains. . . . . . . . . . . . . . . . . . . . . . . . . . . . . . . . . . . . . . . . . . . . . . . . . . .24
Visualizing Activity Domains (Scheduler-Specific) . . . . . . . . . . . . . . . . . . . . . . . . . . . . . . . . . . .27
Combining Search Tree Visualization and Propagation Information . . . . . . . . . . . . . . . . .29
Creating the Christmas Tree . . . . . . . . . . . . . . . . . . . . . . . . . . . . . . . . . . . . . . . . . . . . . . . . . . .29
Interpreting the Christmas Tree . . . . . . . . . . . . . . . . . . . . . . . . . . . . . . . . . . . . . . . . . . . . . . . . .30
Using the Constraint Profiler . . . . . . . . . . . . . . . . . . . . . . . . . . . . . . . . . . . . . . . . . . . . . . . . .30
Using the Drawing Board . . . . . . . . . . . . . . . . . . . . . . . . . . . . . . . . . . . . . . . . . . . . . . . . . . . .31
Basic Use of the Drawing Board . . . . . . . . . . . . . . . . . . . . . . . . . . . . . . . . . . . . . . . . . . . . . . . .32
Advanced Use of the Drawing Board . . . . . . . . . . . . . . . . . . . . . . . . . . . . . . . . . . . . . . . . . . . . .34
Improving your Application . . . . . . . . . . . . . . . . . . . . . . . . . . . . . . . . . . . . . . . . . . . . . . . . . .38
Analyzing Right Subtrees. . . . . . . . . . . . . . . . . . . . . . . . . . . . . . . . . . . . . . . . . . . . . . . . . . . . . .38
Tutorial: Tuning the Propagation in the debuggolomb Example . . . . . . . . . . . . . . . . . . . . . . . .40
Solver Debugger API . . . . . . . . . . . . . . . . . . . . . . . . . . . . . . . . . . . . . . . . . . . . . . . . . . . . . . . . . . . . 45
IlcAddOnDebugger. . . . . . . . . . . . . . . . . . . . . . . . . . . . . . . . . . . . . . . . . . . . . . . . . . . . . . . . . . .47
IlcDebugger . . . . . . . . . . . . . . . . . . . . . . . . . . . . . . . . . . . . . . . . . . . . . . . . . . . . . . . . . . . . . . . .49
IlcDrawingBoard . . . . . . . . . . . . . . . . . . . . . . . . . . . . . . . . . . . . . . . . . . . . . . . . . . . . . . . . . . . .53
IlcSchedulerDebugger . . . . . . . . . . . . . . . . . . . . . . . . . . . . . . . . . . . . . . . . . . . . . . . . . . . . . . . .63
IlcSolverDebugger . . . . . . . . . . . . . . . . . . . . . . . . . . . . . . . . . . . . . . . . . . . . . . . . . . . . . . . . . . .65
iv I B M I L O G S O L V E R D E B U G G E R U S E R ’ S M A N U A L

C O N T E N T S
IlcVisualizeOption. . . . . . . . . . . . . . . . . . . . . . . . . . . . . . . . . . . . . . . . . . . . . . . . . . . . . . . . . . . .69
Index . . . . . . . . . . . . . . . . . . . . . . . . . . . . . . . . . . . . . . . . . . . . . . . . . . . . . . . . . . . . . . . . . . . . . . . . . . 71
I B M I L O G S O L V E R D E B U G G E R U S E R ’ S M A N U A L v

C O N T E N T S
vi I B M I L O G S O L V E R D E B U G G E R U S E R ’ S M A N U A L
P R E F A C E
Before You Begin
This manual provides you with all the information you need to use IBM® ILOG® Solver Debugger.
About IBM ILOG Solver Debugger
The IBM® ILOG® Solver Debugger is composed of a GUI and a set of C++ libraries that enable you to debug and tune the performance of C++ applications written on top of IBM ILOG Solver and IBM ILOG Scheduler.
What You Need to Know
This manual assumes that you are familiar with the UNIX or PC environment in which you are going to use Solver Debugger, including its particular windowing system.
I B M I L O G S O L V E R D E B U G G E R U S E R ’ S M A N U A L vii
What This Manual Contains
Chapter 1, Debugging and Performance Tuning for Solver-based Applications, shows how you can use the graphical features of Solver Debugger to debug and tune the performance of C++ applications.
Notation Used in This Manual
The following typographic conventions apply throughout this manual:
◆ code extracts and file names are written in this typeface.
◆ entries to be made by the user are written <in angle brackets>
◆ commands appear as: File>Open.
IBM software support handbook
This guide contains important information on the procedures and practices followed in the service and support of your IBM products. It does not replace the contractual terms and conditions under which you acquired specific IBM Products or Services. Please review it carefully. You may want to bookmark the site so you can refer back as required to the latest information. We are interested in continuing to improve your IBM support experience, and encourage you to provide feedback by clicking the Feedback link in the left navigation bar on any page. The "IBM Software Support Handbook" can be found on the web at
http://www14.software.ibm.com/webapp/set2/sas/f/handbook/home.html
Accessing software support
When calling or submitting a problem to IBM Software Support about a particular service request, please have the following information ready:
IBM Customer Number
The machine type/model/serial number (for Subscription and Support calls)
Company name
Contact name
Preferred means of contact (voice or email)
Telephone number where you can be reached if request is voice
viii I B M I L O G S O L V E R D E B U G G E R U S E R ’ S M A N U A L
Related product and version information
Related operating system and database information
Detailed description of the issue
Severity of the issue in relationship to the impact of it affecting your business needs
Contact via web
Open service requests is a tool to help clients find the right place to open any problem, hardware or software, in any country where IBM does business. This is the starting place when it is not evident where to go to open a service request.
Service Request (SR) tool offers Passport Advantage clients for distributed platforms online problem management to open, edit and track open and closed PMRs by customer number. Timesaving options: create new PMRs with prefilled demographic fields; describe problems yourself and choose severity; submit PMRs directly to correct support queue; attach troubleshooting files directly to PMR; receive alerts when IBM updates PMR; view reports on open and closed PMRs.
You can find information about assistance for SR at http://www.ibm.com/software/support/help-contactus.html.
System Service Request (SSR) tool is similar to Electronic Service request in providing online problem management capability for clients with support offerings in place on System i, System p, System z, TotalStorage products, Linux, Windows, Dynix/PTX, Retail, OS/2, Isogon, Candle on OS/390 and Consul z/OS legacy products.
IBMLink - SoftwareXcel support contracts offer clients on the System z platform the IBMLink online problem management tool to open problem records and ask usage questions on System z software products. You can open, track, update, and close a defect or problem record; order corrective/preventive/toleration maintenance; search for known problems or technical support information: track applicable problem reports: receive alerts on high impact problems and fixes in error; and view planning information for new releases and preventive maintenance.
Contact via phone
If you have an active service contract maintenance agreement with IBM , or are covered by Program Services, you may contact customer support teams via telephone. For individual countries, please visit the Technical Support section of the IBM Directory of worldwide contacts via http://www.ibm.com/planetwide/.
I B M I L O G S O L V E R D E B U G G E R U S E R ’ S M A N U A L ix

x I B M I L O G S O L V E R D E B U G G E R U S E R ’ S M A N U A L
C H A P T E R
1
Debugging and Performance Tuningfor Solver-based Applications
The IBM® ILOG® Solver Debugger is composed of a GUI and a set of C++ libraries. The C++ libraries enable a C++ application written on top of IBM ILOG Solver or IBM ILOG Scheduler to connect to the Debugger GUI in order to monitor, trace, and debug its execution or tune its performance. Solver Debugger contains graphic facilities to monitor the search (Search Tree), the propagation (Propagation Spy and Variable Domains), and to combine search and propagation information (Christmas Tree). It provides a Constraint Profiler to obtain statistics, by constraint, about constraint calls and efficiency in terms of domain reduction. It also enables you to create your own 2D animated graphic representation of the problem being solved (Drawing Board).
This chapter explains how to connect and use Solver Debugger. It includes the following sections:
◆ Installation
◆ Instrumenting Your Own Code
◆ Visualizing the Search
◆ Visualizing Propagation
◆ Combining Search Tree Visualization and Propagation Information
◆ Using the Constraint Profiler
I B M I L O G S O L V E R D E B U G G E R U S E R ’ S M A N U A L 1
◆ Using the Drawing Board
◆ Improving your Application
Installation
In order to start using Solver Debugger, you need to know:
◆ Prerequisites for Using Solver Debugger
◆ The Distribution Directories
◆ Examples Provided
Prerequisites for Using Solver Debugger
To use the Debugger library, you need:
◆ IBM® ILOG® Solver
◆ IBM ILOG Concert
The only add-on for which specific features are supported is IBM ILOG Scheduler.
The Distribution Directories
The Solver Debugger and its add-on the Scheduler Debugger are to be installed in the same root directory as the Solver product and the Scheduler product respectively (typically ilog/solver and ilog/sched).
The distribution structure includes the following directories, where <solverdir> represents your Solver installation directory and <scheddir> your Scheduler installation:
◆ <solverdir>/bin/<platform>/<libformat>
contains the Solver Debugger GUI, debugger.exe
◆ <solverdir>/help
contains the online documentation
◆ <solverdir>/examples/<platform>/<libformat>/debug*
contains C++ examples based on Solver
◆ <solverdir>/examples/src/debug*
contains C++ source files for the examples
◆ <solverdir>/include/ilsolver
contains the additional include files needed for using the debugger with Solver
2 I B M I L O G S O L V E R D E B U G G E R U S E R ’ S M A N U A L
◆ <solverdir>/lib
contains the libraries ildebug.lib and ilsolverdebug.lib
◆ <scheddir>/examples/<platform>/<libformat>/debug*
contains C++ examples based on Scheduler
◆ <scheddir>/examples/src/debug*
contains C++ source files for the examples
◆ <scheddir>/include/ilsched
contains the additional include files needed for using the debugger with Scheduler
◆ <scheddir>/lib
contains the additional library ilschedulerdebug.lib
Examples Provided
Before using the Debugger facilities on your application, you can become familiar with them by testing the examples provided as part of the Solver Debugger distribution. All the examples contain Ilo objects.
To compile the examples on Solaris and Linux platforms, use the command:
make debuggersamples
in the directory:
<product>/examples/<platform>/<libformat>
Solver Examples
◆ debugnqueen
This is a pure Solver C++ example. This well-known problem involves placing n queens on a chessboard in such a way that none of them can capture any other using the conventional moves allowed to a queen. In other words, the problem is to select n squares on a chessboard so that any pair of selected squares is never aligned, either vertically or horizontally. This example uses a Drawing Board to represent the chessboard.
◆ debuggolomb
This example is well-suited to propagation analysis with different levels of pruning for the alldiff constraint. It is a good example of the use of the Christmas Tree and the Propagation Spy. The goal of the debuggolomb problem is to find a set of values representing the graduations of a rule such that the difference between each pair of graduations is always distinct, and such that the length of the rule is minimal.
◆ debuglsknight
I B M I L O G S O L V E R D E B U G G E R U S E R ’ S M A N U A L 3

This example shows how to use the Debugger with local search. It consists in placing as few knights as possible on a chessboard in such a way that each square is controlled—attacked or occupied—by at least one knight.
4 I B M I L O G S O L V E R D E B U G G E R U S E R ’ S M A N U A L
◆ debugpheasant
This example is useful for tracing the Initial Propagation. This problem consists in finding the number of pheasants and rabbits in a field, knowing that there are 20 heads and 56 legs overall.
Scheduler Example
◆ debugjobshopm
The aim of this problem is to schedule a number of jobs on a set of machines in order to minimize completion time, called makespan. Each job is a sequence of tasks and each task represents a machine. This example enables you to see the Activity Domains window, the Gantt chart and specific scheduling events in the Propagation Spy. In the code of debugjobshopm you will find examples of conditional breakpoints, Debugger disabling, and the automatic result display switched off.
Instrumenting Your Own Code
This section explains how to customize the Debugger for Solver or Scheduler applications.
◆ Customizing a Pure Solver C++ Application
◆ Customizing a Pure Scheduler C++ Application
Customizing a Pure Solver C++ Application
To customize the Debugger for a pure Solver C++ application, proceed as follows. You need one include file before the solver declaration:
#include <ilsolver/solverdebugger.h>
IloEnv env; try { IloSolver solver(env);
1. Instantiate the Debugger and let it connect your application to the GUI before model extraction.
IlcSolverDebugger debugger(solver);
2. State the model using Ilo modeling objects.
IloModel model(env);
3. Name your Ilo objects (setName API).
myVar.setName("myVar");
I B M I L O G S O L V E R D E B U G G E R U S E R ’ S M A N U A L 5
4. Register the variables you are interested in for model browsing, domain monitoring, etc. (Optional).
debugger.registerVariable(myVar);
If you want domain visualization, specify it.
debugger.registerVariable(myVar2, IloTrue, IloTrue, IlcVisualizeDomain);
5. Extract the model Ilo objects as Ilc objects.
solver.extract(model);
6. Initialize the Debugger for each running session and solve by placing your optimization loop inside the debugging loop.
while (debugger.initialize()) { // debugging loop solver.startNewSearch(myGoal); while (solver.next()) { // optimization loop ostrstream text; text << solver.getValue(makespan)<< endl << ends; debugger.sendSolution(text.str()); } solver.endSearch(); }
7. Close the connection to the GUI and release memory.
debugger.close(); } catch (IloException& ex) { cerr << "Error: " << ex << endl; } env.end();
Customizing a Pure Scheduler C++ Application
To customize the Debugger for a pure Scheduler C++ application, proceed as follows. You need two include files before the solver declaration:
#include <ilsolver/solverdebugger.h> #include <ilsched/schedulerdebugger.h>
try { IloEnv env; IloSolver solver(env);
1. Instantiate the Debugger.
IlcSolverDebugger debugger(solver);
6 I B M I L O G S O L V E R D E B U G G E R U S E R ’ S M A N U A L
2. State the model using Ilo modeling objects.
IloModel model(env); IloSchedulerEnv schedEnv(env); IloInt horizon = 0; IloInt k; for (k = 0; k < numberOfActivities; k++) horizon += durations[k];
3. Name your Ilo objects (setName API).
4. Create a Scheduler Debugger to handle specific panels.
IlcScheduler schedule(solver); IlcSchedulerDebugger schedDebug(debugger,schedule);
5. Register the Ilo objects with the Solver Debugger and the Scheduler Debugger.
debugger.registerVariable(makespan,IloTrue,IloTrue,IlcVisualizeDomain); schedDebug.registerActivity(activity,IloTrue,IloTrue,IlcVisualizeDomain);
6. Inform the Activity Panel of the horizon to display.
schedDebugger.setHorizon(horizon);
7. Extract the model Ilo objects as Ilc objects.
solver.extract(model);
8. Initialize the Debugger for each running session and solve by placing your optimization loop inside the debugging loop.
while (debugger.initialize()) { // debugging loop solver.startNewSearch(myGoal); while (solver.next()) { // optimization loop ostrstream text; text << solver.getValue(makespan)<< endl << ends; debugger.sendSolution(text.str()); } solver.endSearch(); } env.end();
9. Close the connection to the GUI and release memory.
debugger.close(); } catch (IloException& ex) { cerr << "Error: " << ex << endl; }
Warning: Make sure that you set the global horizon for every activity: schedEnv.setHorizon(horizon);
I B M I L O G S O L V E R D E B U G G E R U S E R ’ S M A N U A L 7
Setting Up Solver Debugger
In this section you will see how to launch the Debugger GUI and connect an application to it.
◆ Launching the GUI
◆ Connecting an Application
Launching the GUIIn a command prompt window, go to the bin subdirectory where Solver is installed and type:
debugger
On Windows you can use the shortcut provided in:
Start Menu>ILOG>ILOG Solver>ILOG Solver Debugger
By default, the port used for communication between the GUI and your application is 4011.
If you want to use a specific port number, pass, for example, -listensocket 8000 as an argument.
The GUI starts in initializing mode with a red patch in the bottom right corner of the window. Solver Debugger is waiting for your application to connect.
8 I B M I L O G S O L V E R D E B U G G E R U S E R ’ S M A N U A L
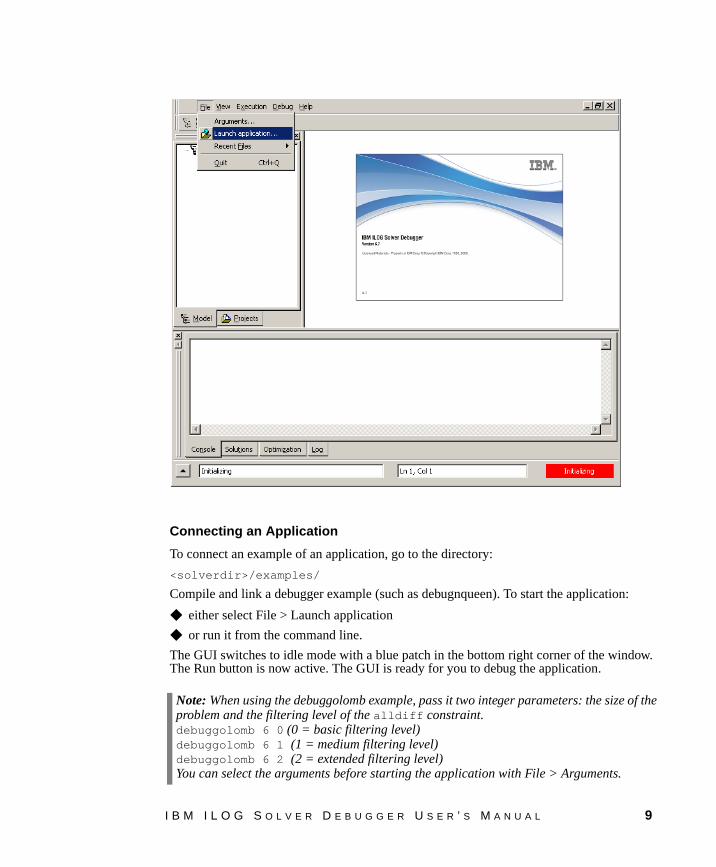
Connecting an Application
To connect an example of an application, go to the directory:
<solverdir>/examples/
Compile and link a debugger example (such as debugnqueen). To start the application:
◆ either select File > Launch application
◆ or run it from the command line.
The GUI switches to idle mode with a blue patch in the bottom right corner of the window. The Run button is now active. The GUI is ready for you to debug the application.
Note: When using the debuggolomb example, pass it two integer parameters: the size of the problem and the filtering level of the alldiff constraint.debuggolomb 6 0 (0 = basic filtering level)debuggolomb 6 1 (1 = medium filtering level)debuggolomb 6 2 (2 = extended filtering level)You can select the arguments before starting the application with File > Arguments.
I B M I L O G S O L V E R D E B U G G E R U S E R ’ S M A N U A L 9
Connecting Two Applications at the Same Time
To load two applications at the same time, proceed as follows:
1. Launch two Debugger GUIs with different socket port numbers, for example:
debugger -listensocket 5000 &
debugger -listensocket 5001 &
2. Connect each application to a different port number giving extra arguments to the constructor IlcSolverDebugger.
In one application, type:
IlcSolverDebugger debugger(solver, IloTrue, IloFalse, 1.0, 5000);
In the other application, type:
IlcSolverDebugger debugger(solver, IloTrue, IloFalse, 1.0, 5001);
Connecting an Application Remotely
To load an application remotely, give the machine name and the port number expected by the GUI to the constructor IlcSolverDebugger.
IlcSolverDebugger debugger(solver, IloTrue, IloFalse, 1.0, 4011,
"NameOfMachineOnWhichTheGUIisRunning");
Note: To activate or deactivate the Debugger without recompiling, pass IloTrue or IloFalse as a second argument to the IlcSolverDebugger constructor based on a command line argument of your application.
10 I B M I L O G S O L V E R D E B U G G E R U S E R ’ S M A N U A L
Debugger Commands
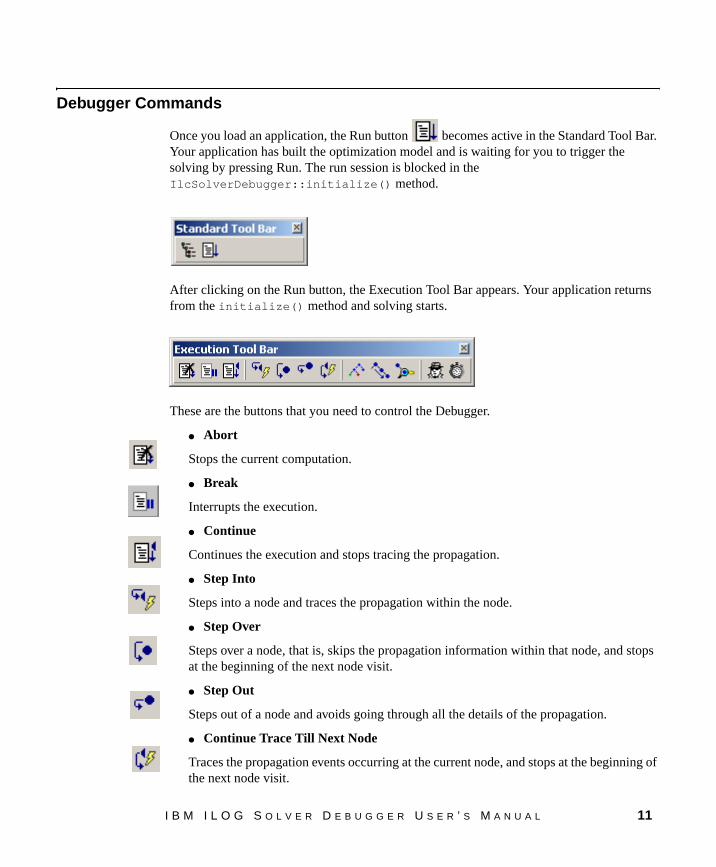
Once you load an application, the Run button becomes active in the Standard Tool Bar. Your application has built the optimization model and is waiting for you to trigger the solving by pressing Run. The run session is blocked in the IlcSolverDebugger::initialize() method.
After clicking on the Run button, the Execution Tool Bar appears. Your application returns from the initialize() method and solving starts.
These are the buttons that you need to control the Debugger.
● Abort
Stops the current computation.
● Break
Interrupts the execution.
● Continue
Continues the execution and stops tracing the propagation.
● Step Into
Steps into a node and traces the propagation within the node.
● Step Over
Steps over a node, that is, skips the propagation information within that node, and stops at the beginning of the next node visit.
● Step Out
Steps out of a node and avoids going through all the details of the propagation.
● Continue Trace Till Next Node
Traces the propagation events occurring at the current node, and stops at the beginning of the next node visit.
I B M I L O G S O L V E R D E B U G G E R U S E R ’ S M A N U A L 11

● View Search Tree
Displays a graphic representation of the search, allowing you to visualize each step of the execution.
● Decision Stack
Inspects the list of decisions taken, starting from the root node to the selected node.
● Inspect Current Node
Inspects the current choice point in the execution.
● Propagation Spy
Displays the trace of propagation events and the result of the propagation.
● View Constraint Profiler
Computes profiling statistics and displays the Constraint Profiler for the current state of computation.
Visualizing the Search
Solver Debugger provides you with a graphic representation of the search, called the Search Tree. The Search Tree allows you to visualize each step of the execution of your application. This section covers the following points:
◆ The Search Tree
◆ Monitoring Decisions
◆ Monitoring Solution Restoring
◆ Monitoring Restart
◆ Monitoring Local Search
◆ Monitoring Nested Search
12 I B M I L O G S O L V E R D E B U G G E R U S E R ’ S M A N U A L

The Search Tree
When you first launch an execution, a drawing of the tree appears node by node in the Search Tree viewer. If necessary, interrupt the execution with the Break button. The Debugger will stop at the beginning of a node visit.
If you previously closed the search tree views you can redisplay them by selecting the menu item View > View Search Tree, or by clicking on the corresponding button in the tool bar.
Figure 1.1
Figure 1.1 The Search Tree for the debuggolomb problem with 5 collapsed subtrees
I B M I L O G S O L V E R D E B U G G E R U S E R ’ S M A N U A L 13
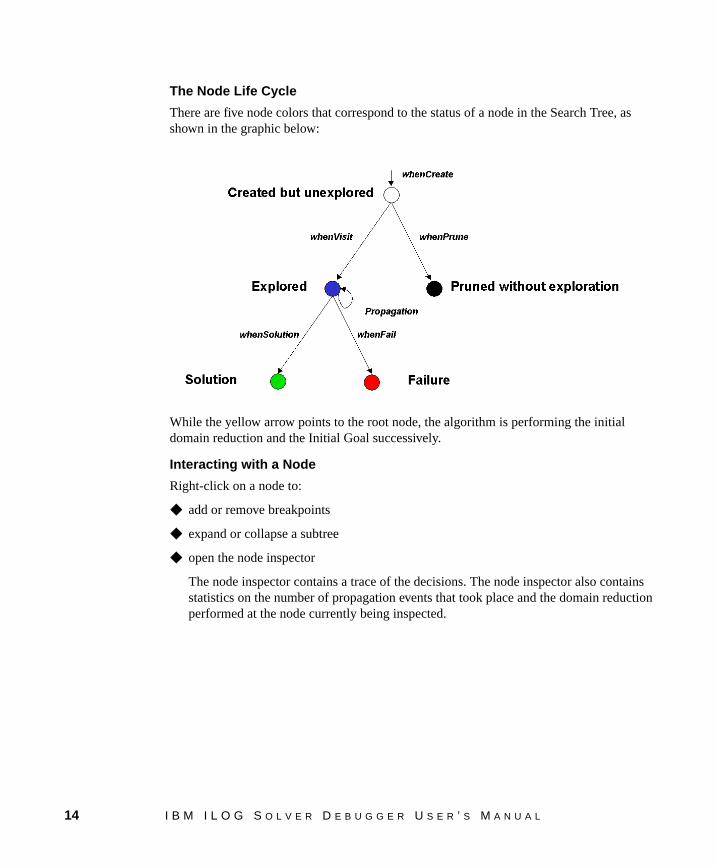
The Node Life Cycle
There are five node colors that correspond to the status of a node in the Search Tree, as shown in the graphic below:
While the yellow arrow points to the root node, the algorithm is performing the initial domain reduction and the Initial Goal successively.
Interacting with a Node
Right-click on a node to:
◆ add or remove breakpoints
◆ expand or collapse a subtree
◆ open the node inspector
The node inspector contains a trace of the decisions. The node inspector also contains statistics on the number of propagation events that took place and the domain reduction performed at the node currently being inspected.
14 I B M I L O G S O L V E R D E B U G G E R U S E R ’ S M A N U A L

Search Tree Mode Selectors
Use Search Tree mode selectors to choose the view you want for the Search Tree.
● Selection mode
Click on the arrow button, then double-click on a node belonging to the current branch.
● Elastic zoom mode
Click on this button then, with the left mouse button, trace a rectangle around the element(s) you want to enlarge. When you release the mouse button, the enlarged image fills the window.
● Zoom in
Click on the button with a + sign, then click in the Search Tree window. The image is increased by a factor of 2 each time you click.
● Zoom out
Click on the button with a – sign, then click in the Search Tree main window. The image is decreased by a factor of 2 each time you click.
● View whole content
Click on this button then click in the Search Tree window. The whole tree becomes visible.
● Create new window
Click on this button, then trace a rectangle around the element(s) you want to view in another window. A new dockable window is created, with a zoom level defined by the rectangle.
I B M I L O G S O L V E R D E B U G G E R U S E R ’ S M A N U A L 15

Monitoring Decisions
You can use several visualization tools to monitor the decisions within your application: the Node Inspector, the Propagation Spy, the Decision Stack, or a tooltip on the Search Tree.
Figure 1.2
Figure 1.2 Decision and propagation at a search tree node for the debugnqueen problem
The interface shown above contains the elements used to monitor the decisions taken at each node in the search tree:
Current Node Inspector
Search Tree
Propagation Spy
16 I B M I L O G S O L V E R D E B U G G E R U S E R ’ S M A N U A L
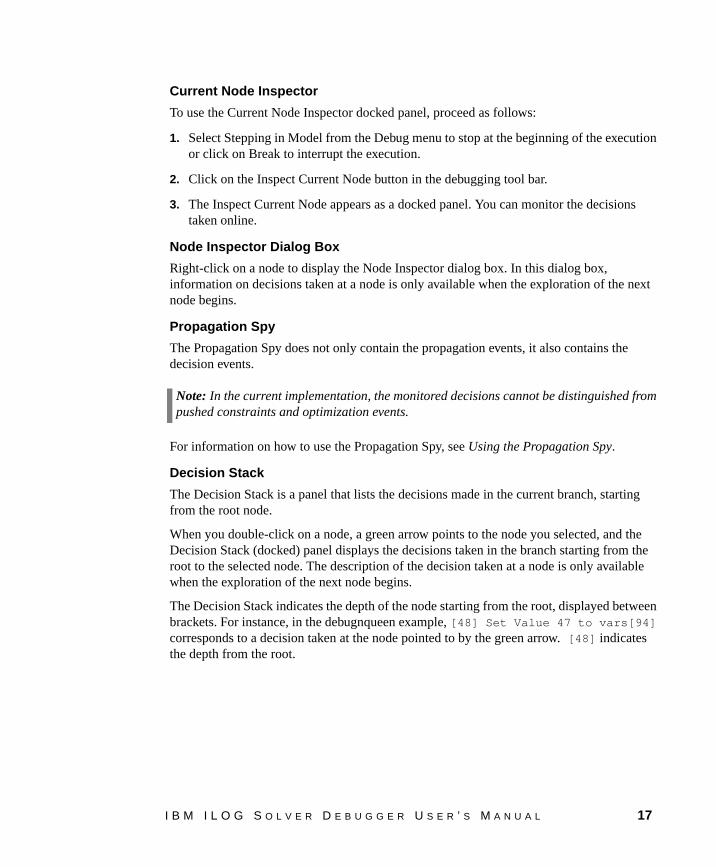
Current Node Inspector
To use the Current Node Inspector docked panel, proceed as follows:
1. Select Stepping in Model from the Debug menu to stop at the beginning of the execution or click on Break to interrupt the execution.
2. Click on the Inspect Current Node button in the debugging tool bar.
3. The Inspect Current Node appears as a docked panel. You can monitor the decisions taken online.
Node Inspector Dialog Box
Right-click on a node to display the Node Inspector dialog box. In this dialog box, information on decisions taken at a node is only available when the exploration of the next node begins.
Propagation Spy
The Propagation Spy does not only contain the propagation events, it also contains the decision events.
For information on how to use the Propagation Spy, see Using the Propagation Spy.
Decision Stack
The Decision Stack is a panel that lists the decisions made in the current branch, starting from the root node.
When you double-click on a node, a green arrow points to the node you selected, and the Decision Stack (docked) panel displays the decisions taken in the branch starting from the root to the selected node. The description of the decision taken at a node is only available when the exploration of the next node begins.
The Decision Stack indicates the depth of the node starting from the root, displayed between brackets. For instance, in the debugnqueen example, [48] Set Value 47 to vars[94] corresponds to a decision taken at the node pointed to by the green arrow. [48] indicates the depth from the root.
Note: In the current implementation, the monitored decisions cannot be distinguished from pushed constraints and optimization events.
I B M I L O G S O L V E R D E B U G G E R U S E R ’ S M A N U A L 17
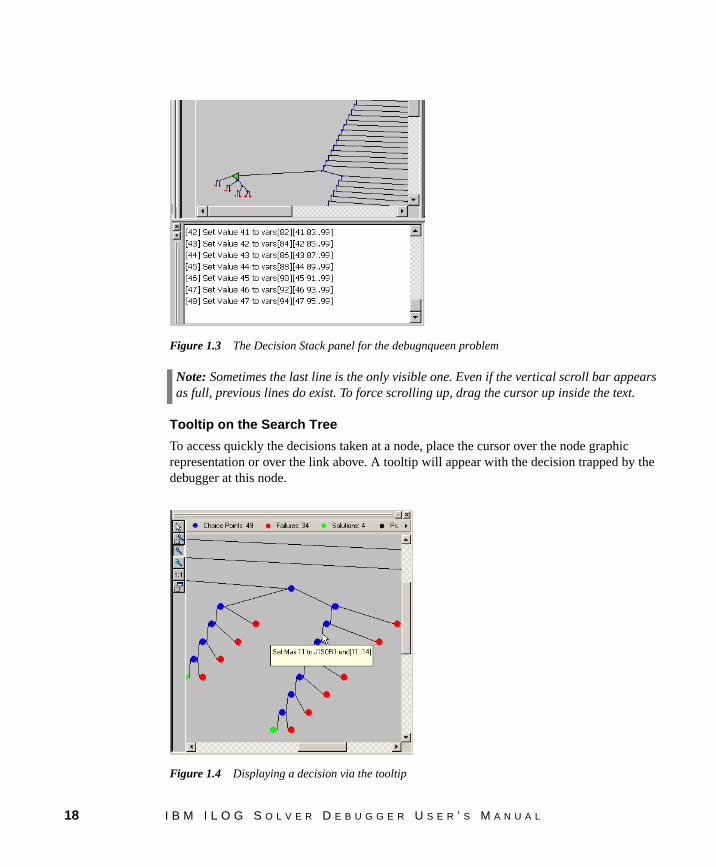
Figure 1.3
Figure 1.3 The Decision Stack panel for the debugnqueen problem
Tooltip on the Search Tree
To access quickly the decisions taken at a node, place the cursor over the node graphic representation or over the link above. A tooltip will appear with the decision trapped by the debugger at this node.
Figure 1.4
Figure 1.4 Displaying a decision via the tooltip
Note: Sometimes the last line is the only visible one. Even if the vertical scroll bar appears as full, previous lines do exist. To force scrolling up, drag the cursor up inside the text.
18 I B M I L O G S O L V E R D E B U G G E R U S E R ’ S M A N U A L
Monitoring Solution Restoring
To obtain a new Search Tree view when restoring a solution, type:
debugger.newSearchTreeView(); solver.solve(IloRestoreSolution(env, best));
To prevent the Debugger from displaying the Gantt chart automatically at each intermediate solution, type: debugger.setAutomaticDisplay(IloFalse);
Then call debugger.displayresult() when the optimal solution is restored.
Monitoring Restart
To obtain a new Search Tree view at restart, type:
while(debugger.initialize()) { solver.startNewSearch(myGoal); if (solver.next()) { ostrstream text; text << solver.getValue(makespan)<< endl << ends; debugger.sendSolution(text.str()); debugger.newSearchTreeView(); solver.restartSearch(); if (solver.next()) { ostrstream text; text << solver.getValue(makespan)<< endl << ends; debugger.sendSolution(text.str()); } } solver.endSearch(); }
You can also choose to reuse the same Search Tree view. In that case, the root node will have four branches.
Monitoring Local Search
To obtain a new Search Tree for each move, proceed as follows:
1. Type:
IlcSolverDebugger debugger(solver); solver.extract(model); while (debugger.initialize()) {
2. Create the initial solution:
solver.solve(IloGenerate(env, knightArr) && IloStoreSolution(env, sol)); do {
I B M I L O G S O L V E R D E B U G G E R U S E R ’ S M A N U A L 19
3. While there are iterations, create a new Search Tree view and start a new search for each iteration:
while (--iter >= 0 && debugger.newSearchTreeView() && solver.solve(move)) { moves++;
4. Store the new best solution if there is one, and display it:
if (sol.getObjectiveValue() < best.getObjectiveValue()) { ostrstream txt; txt << "Move " << moves << ", Knights = " << sol.getObjectiveValue() << endl<< ends; debugger.sendSolution(txt.str()); best.copy(sol); } }
5. If iterations are still left, ask tabu if it is complete:
} while (iter > 0 && !tabu.complete());
6. Restore the best solution found:
debugger.sendConsole("Restoring solution...\n"); debugger.newSearchTreeView(); solver.solve(IloRestoreSolution(env, best)); }
See the debuglsknight example for details on local search.
Monitoring Nested Search
To monitor nested search, type the following:
IlcSolverDebugger debugger(solver,IloTrue,IloFalse,1.0,4005,0,IloTrue); ILCGOAL2(MyIlcGoal,IlcIntVarArray, a, IlcSolverDebugger, debugger) { debugger.beginNestedSearchTreeView(); a.getManager().solve(IlcGenerate(a)); debugger.endNestedSearchTreeView(); return 0; } ILOCPGOALWRAPPER2(MyIloGoal, solver, IloIntVarArray, a, IlcSolverDebugger, debugger) { return MyIlcGoal(solver.getManager(),solver.getIntVarArray(a),debugger); }
20 I B M I L O G S O L V E R D E B U G G E R U S E R ’ S M A N U A L
Visualizing Propagation
Solver Debugger provides you with three tools that allow you to display the propagation in the GUI:
◆ the Propagation Spy to trace events, described in Using the Propagation Spy
◆ the Variable Domains notebook pages in the Output window, described in Visualizing Variable Domains
◆ the Activity Domains window for Scheduler applications, described in Visualizing Activity Domains (Scheduler-Specific)
Events
Events can take place:
◆ during the Initial Propagation
◆ during the Initial Goal before the first OR
◆ inside a Search Tree node
Events can be triggered as a direct consequence of:
◆ a constraint propagation triggered by a demon becoming active
◆ a constraint propagation coming from a pushed constraint
◆ a decision taken during the search
◆ an optimization event coming from the minimization or maximization of an objective function
Using the Propagation Spy
The Propagation Spy is a means of displaying the trace of events and the result of the propagation in terms of domain reduction. The Propagation Spy provides a graphical representation of events trapped by the IlcTrace and IlcSchedulerTrace mechanisms.
See the IBM® ILOG® Solver and IBM ILOG Scheduler documentation for details on these two classes.
The Propagation Spy is a special hierarchical sheet containing a tree hierarchy in the first column. Each column contains the impact on one variable. Time is represented vertically, from top to bottom. The textual description of the events is displayed in the first column. When double-clicking on an event line, the columns are rearranged so that a variable of interest is displayed first.
I B M I L O G S O L V E R D E B U G G E R U S E R ’ S M A N U A L 21
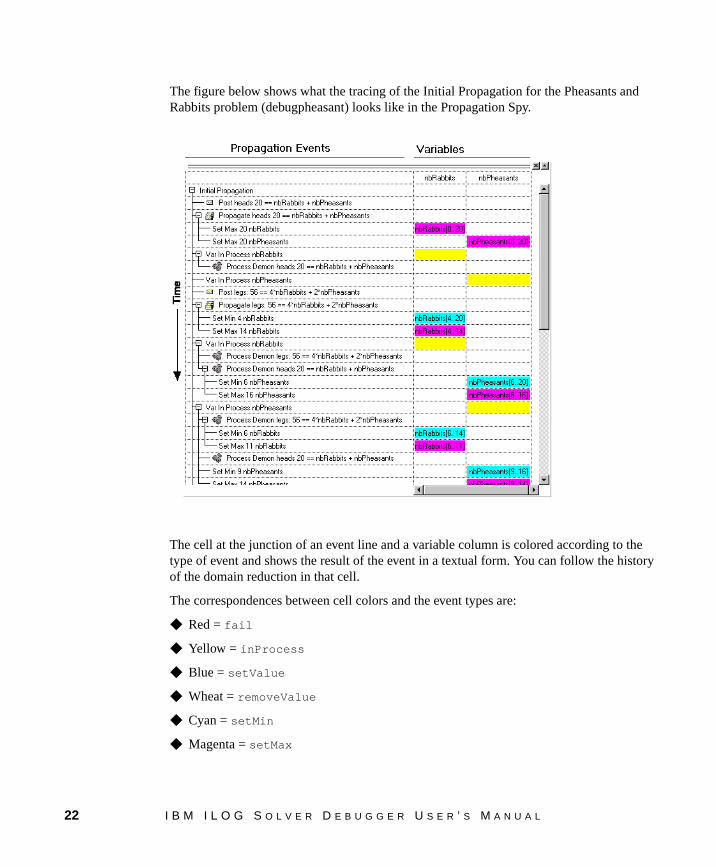
The figure below shows what the tracing of the Initial Propagation for the Pheasants and Rabbits problem (debugpheasant) looks like in the Propagation Spy.
The cell at the junction of an event line and a variable column is colored according to the type of event and shows the result of the event in a textual form. You can follow the history of the domain reduction in that cell.
The correspondences between cell colors and the event types are:
◆ Red = fail
◆ Yellow = inProcess
◆ Blue = setValue
◆ Wheat = removeValue
◆ Cyan = setMin
◆ Magenta = setMax
22 I B M I L O G S O L V E R D E B U G G E R U S E R ’ S M A N U A L
Tracing the Initial Propagation
To trace the Initial Propagation of your application, proceed as follows:
1. Select “Stop At Initial Propagation” from the Debug menu. With this option, the execution will be interrupted at the beginning of the Initial Propagation.
2. Click on the Run button.
3. The Initial Propagation is now displayed in the Propagation Spy window. The following options are available:
● To enter the propagation detail, click on the Step In button.
- Trace all the Initial Propagation events without stopping at each event by clicking on the Continue Trace Till Next Node button.
- Trace the Initial Propagation and stop at each event by clicking on the Step In button.
- Leave the propagation detail at that point by clicking on the Step Out button.
● To skip the Initial Propagation, click on the Step Over button.
4. The Debugger stops at the first search node (the first child of the root). The following options are available:
● To visualize the decisions and the propagation events triggered within the first search node in the Propagation Spy, click on the Step In button.
● To go to the beginning of the next node, click on the Step Over button.
● To continue and interrupt the execution when you decide to, click on the Continue Run button and then on the Break button.
● To abort the execution, click on the Abort button.
Tracing the Propagation at a Specific Node
Because of the nondeterministic nature of the search, it is not possible to draw the tree in advance. A second run is necessary to focus on a segment of the tree.
You can access statistical information about the Initial Propagation through the Search Tree root.
Tracing the Propagation at a Specific Node in the Search Tree
To trace the propagation at a specific node, proceed as follows:
1. Run the Debugger a first time. Skip the Initial Propagation. Wait until the end of the solving or Abort if the solving process takes a long time.
I B M I L O G S O L V E R D E B U G G E R U S E R ’ S M A N U A L 23
2. Add a breakpoint on a specific node by right-clicking on the node (you can also include conditional breakpoints in your code).
3. Run the execution a second time. The tree nodes become white and are progressively re-colored.
4. Step into the node to display the propagation events.
Adding Breakpoints in Your Code
You can register conditional breakpoints in your code so that as soon as a condition becomes true, the execution is interrupted. You can use three types of conditional breakpoints:
◆ Interrupt the execution as soon as the minimum of a variable domain is greater than or equal to a value.
◆ Interrupt the execution as soon as the maximum of a variable domain is lower than or equal to a value.
◆ Interrupt the execution as soon as a variable is bound to a specific value.
For example, in the debugjobshopm example, uncomment the following line:
debugger.breakIfDomainMaxLe(_makespan),60);
The execution will be interrupted when the maximum of the makespan domain is lower than or equal to the value 60.
Conditional breakpoints are extracted by the initialize member function. So make sure you set the conditional breakpoints before the call to the member function IlcSolverDebugger::initialize().
You can also call the member function IlcSolverDebugger::breakExecution() in your own goals.
Visualizing Variable Domains
You can set visualization options to follow the domains of the variables during the execution in the Output window located at the bottom of the Solver Debugger GUI.
Setting Visualization Options
To follow the domains of the variables, you can put graphical demons on your variables by passing a fourth argument to the member function registerVariable().
debugger.registerVariable(ilovars,IloTrue,IloTrue, IlcVisualizeDomain | IlcVisualizeInterval | IlcVisualizeValue | IlcVisualizeBoolean, "queens");
24 I B M I L O G S O L V E R D E B U G G E R U S E R ’ S M A N U A L
◆ To visualize the domain of an integer variable or an array of integer variables, use IlcVisualizeDomain.
◆ To visualize the lower and upper bounds of a variable or an array of variables, use IlcVisualizeInterval.
◆ To visualize the value of a variable or an array of variables, use IlcVisualizeValue.
◆ To display colored squares for Boolean variables (integer variables containing 0 in their domain), use IlcVisualizeBoolean.
◆ To disable visualization, use IlcVisualizeDisabled.Visualization is disabled by default.
These displays are available as notebook pages in the Output window of the Solver Debugger GUI.
Visualizing Variable Domains in the Output Window
The following variable visualization examples are taken from the debugnqueen problem.
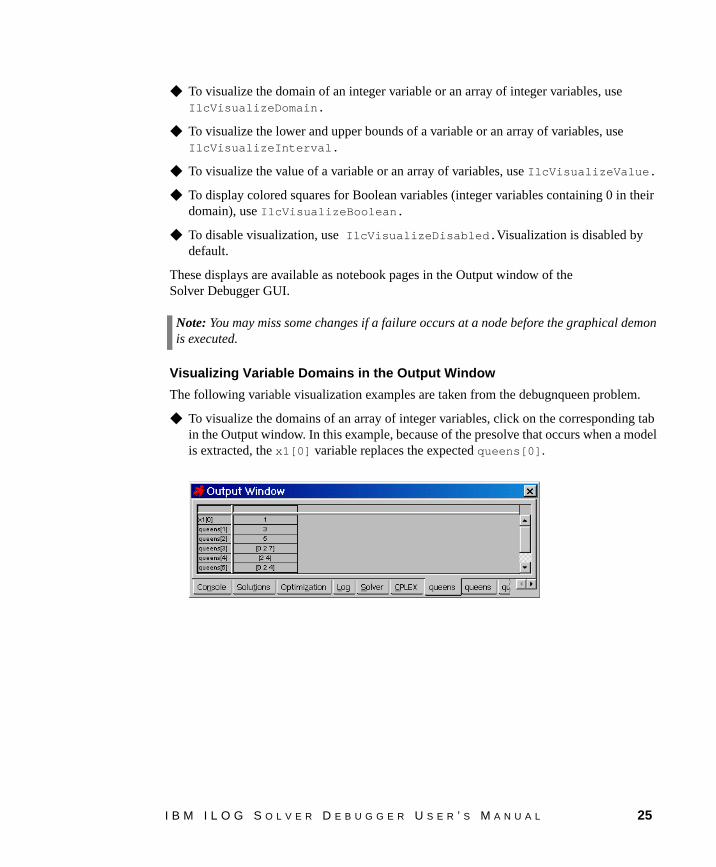
◆ To visualize the domains of an array of integer variables, click on the corresponding tab in the Output window. In this example, because of the presolve that occurs when a model is extracted, the x1[0] variable replaces the expected queens[0].
Note: You may miss some changes if a failure occurs at a node before the graphical demon is executed.
I B M I L O G S O L V E R D E B U G G E R U S E R ’ S M A N U A L 25
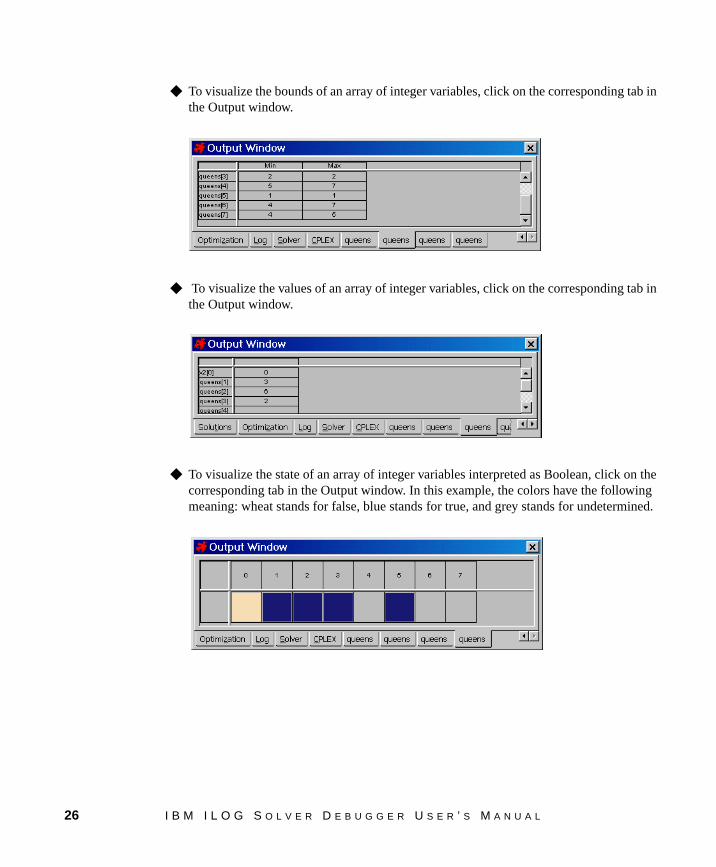
◆ To visualize the bounds of an array of integer variables, click on the corresponding tab in the Output window.
◆ To visualize the values of an array of integer variables, click on the corresponding tab in the Output window.
◆ To visualize the state of an array of integer variables interpreted as Boolean, click on the corresponding tab in the Output window. In this example, the colors have the following meaning: wheat stands for false, blue stands for true, and grey stands for undetermined.
26 I B M I L O G S O L V E R D E B U G G E R U S E R ’ S M A N U A L
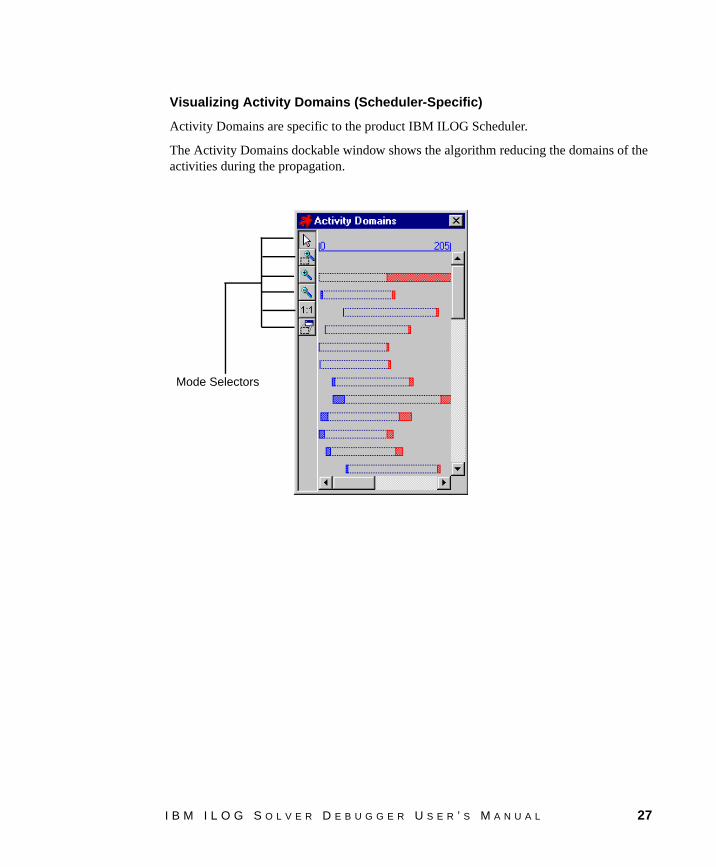
Visualizing Activity Domains (Scheduler-Specific)
Activity Domains are specific to the product IBM ILOG Scheduler.
The Activity Domains dockable window shows the algorithm reducing the domains of the activities during the propagation.
Mode Selectors
I B M I L O G S O L V E R D E B U G G E R U S E R ’ S M A N U A L 27
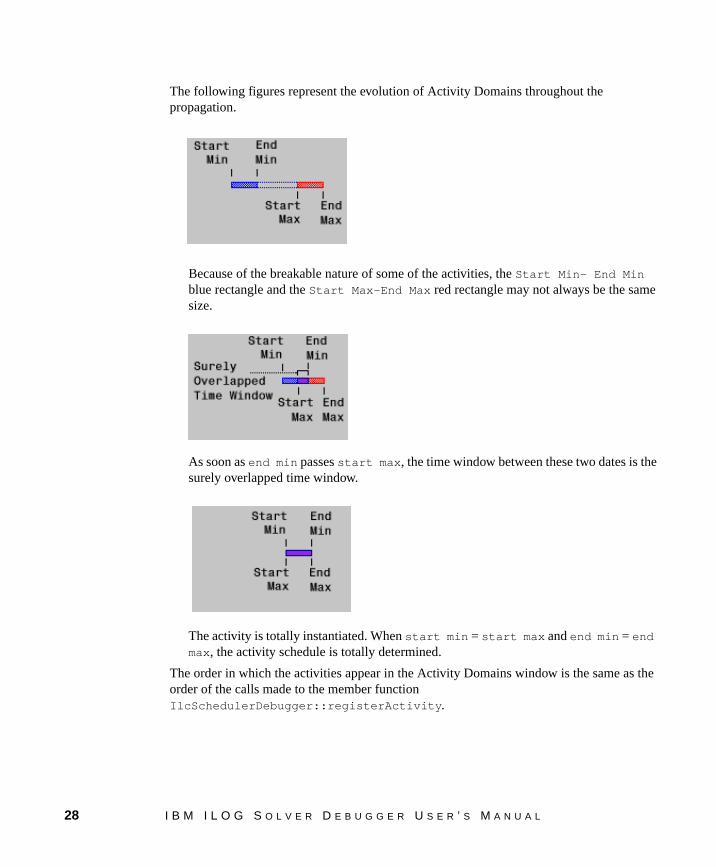
The following figures represent the evolution of Activity Domains throughout the propagation.
Because of the breakable nature of some of the activities, the Start Min- End Min blue rectangle and the Start Max-End Max red rectangle may not always be the same size.
As soon as end min passes start max, the time window between these two dates is the surely overlapped time window.
The activity is totally instantiated. When start min = start max and end min = end max, the activity schedule is totally determined.
The order in which the activities appear in the Activity Domains window is the same as the order of the calls made to the member function IlcSchedulerDebugger::registerActivity.
28 I B M I L O G S O L V E R D E B U G G E R U S E R ’ S M A N U A L

Combining Search Tree Visualization and Propagation Information
The representation of a tree combining search information and statistics on propagation events looks like a tree decorated with big and small balls. For this reason, it is called the Christmas Tree. This section deals with
◆ Creating the Christmas Tree
◆ Interpreting the Christmas Tree
Creating the Christmas Tree
You can change the representation of the Search Tree to visualize propagation statistics by changing the color and size of the nodes. To do so:
1. Right-click in the search tree background on a node. A context-sensitive menu appears. Select the “Tree Inspector...” menu item.
2. Select Type and Domain Reduction for Node color and Propagation Events for Node size.
3. The Christmas Tree appears in the Search Tree view.
To obtain statistics on domain reduction, you must register the variables you are interested in with IloSolverDebugger::registerVariable for pure Solver variables and
I B M I L O G S O L V E R D E B U G G E R U S E R ’ S M A N U A L 29
IlcSchedulerDebugger::registerActivity for Scheduler activities, and pass IloTrue as a third argument.
Interpreting the Christmas Tree
The information added to the Search Tree includes the number of propagation events and the effective global domain reduction at each node:
◆ The size of the nodes becomes proportional to the number of propagation events fired at each node (which is highly correlated with the time spent at each node).
◆ The meaning of the colors remains unchanged, except that the color is lighter or darker depending on the effective domain reduction obtained during the propagation at this node.
The statistical information about the Initial Propagation is concentrated in the tree root. All nodes are not equal. You can detect if, in failure nodes (red or pink nodes), the failure is discovered early (small node) or late (large node).
It is important to distinguish between the number of propagation events and the global domain reduction because many propagation events can be triggered with little impact on the domain reduction.
Using the Constraint Profiler
You can access the current state of statistics at any moment during the search or the initial propagation by selecting the menu item View > Constraint Profiler, or by clicking on the Constraint Profiler button in the tool bar.
30 I B M I L O G S O L V E R D E B U G G E R U S E R ’ S M A N U A L
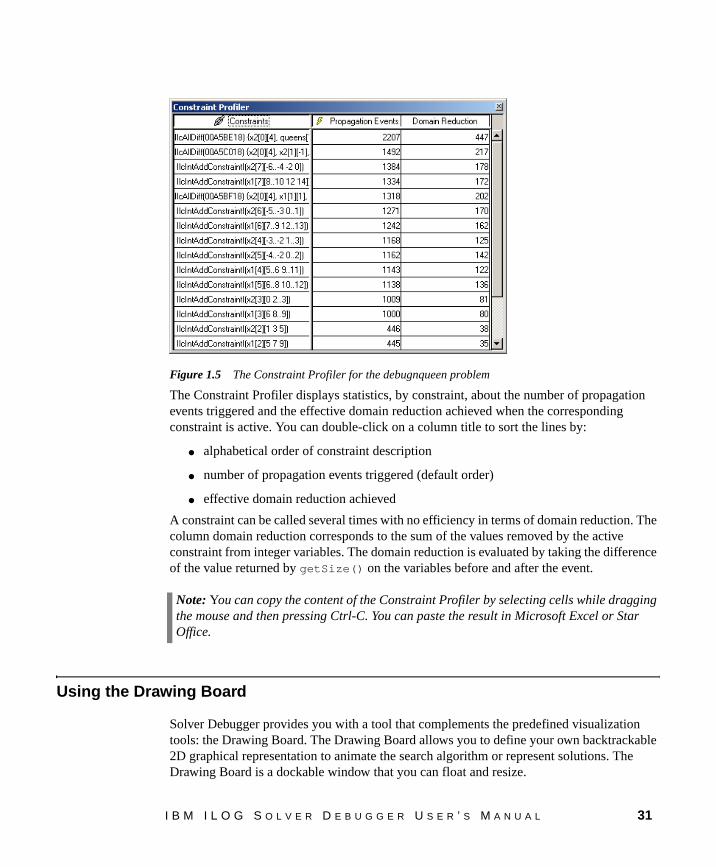
Figure 1.5
Figure 1.5 The Constraint Profiler for the debugnqueen problem
The Constraint Profiler displays statistics, by constraint, about the number of propagation events triggered and the effective domain reduction achieved when the corresponding constraint is active. You can double-click on a column title to sort the lines by:
● alphabetical order of constraint description
● number of propagation events triggered (default order)
● effective domain reduction achieved
A constraint can be called several times with no efficiency in terms of domain reduction. The column domain reduction corresponds to the sum of the values removed by the active constraint from integer variables. The domain reduction is evaluated by taking the difference of the value returned by getSize() on the variables before and after the event.
Using the Drawing Board
Solver Debugger provides you with a tool that complements the predefined visualization tools: the Drawing Board. The Drawing Board allows you to define your own backtrackable 2D graphical representation to animate the search algorithm or represent solutions. The Drawing Board is a dockable window that you can float and resize.
Note: You can copy the content of the Constraint Profiler by selecting cells while dragging the mouse and then pressing Ctrl-C. You can paste the result in Microsoft Excel or Star Office.
I B M I L O G S O L V E R D E B U G G E R U S E R ’ S M A N U A L 31
To create a Drawing Board, instantiate an IlcDrawingBoard object and pass the IlcSolverDebugger instance as an argument.
IlcDrawingBoard drawingBoard(debugger);
You can create several instances of the class IlcDrawingBoard, which will result in the creation of several Drawing Board docked windows in the GUI.
The Drawing Board contains two sets of member functions:
◆ a set that allows you to use the Drawing Board with graphic objects that are automatically backtrackable
◆ a set that allows you to draw 2D graphic objects yourself in the Drawing Board without any automatic support for backtracking.
Basic Use of the Drawing Board
The first set of member functions enables you to connect your Ilc variables to parameters of the graphic object.
When all the parameters needed by a graphic object are known, that is, when the variables are bound, the graphic object is drawn. Upon backtracking, the graphic object is cleared automatically.
The member functions begin with makeXXXX and take Ilc objects as arguments (makeRectangle, makeFilledPolygon, or makeLabel for instance). Because this set of member functions requires Ilc and not Ilo objects, call them in a goal, for instance in the initial goal.
In the following example, an IlcGoal (IlcChessBoard) is wrapped in an IloGoal (IloChessBoard) and anIloAndGoal is performed on IloChessBoard and the ordinary IloGenerate goal.
Example: Drawing the Chessboard for the debugnqueen Problem
Let’s call IloChessBoard a user-defined goal whose role is to initialize a grid representing a chessboard and ellipses indicating the locations of the queens. Here is an example of an IlcGoal wrapped as IloGoal:
ILCGOAL3(IlcChessBoard, IlcInt, nqueen, IlcIntVarArray, queens,IlcDrawingBoard, drawingBoard) { drawingBoard.clean(); drawingBoard.makeGrid( drawingBoard.constantInt(0), drawingBoard.constantInt(0), drawingBoard.constantInt(nqueen*10), drawingBoard.constantInt(nqueen*10),
Note: If you previously closed a drawing board panel, you can redisplay it by selecting the menu item View > View Drawing Board.
32 I B M I L O G S O L V E R D E B U G G E R U S E R ’ S M A N U A L
drawingBoard.constantInt(nqueen), drawingBoard.constantInt(nqueen), drawingBoard.constantInt(1)); for(int i=0; i < nqueen; ++i) { IlcIntExp exp = queens[i]*10; drawingBoard.makeFilledEllipse(drawingBoard.constantInt(i*10), exp, drawingBoard.constantInt(10), drawingBoard.constantInt(10), "red", drawingBoard.constantInt(1)); } return 0; }
ILOCPGOALWRAPPER3(IloChessBoard, solver, IloInt, nqueen, IloIntVarArray, queens, IlcDrawingBoard, drawingBoard){
return IlcChessBoard(solver, nqueen, solver.getIntVarArray(queens),drawingBoard);
}
I B M I L O G S O L V E R D E B U G G E R U S E R ’ S M A N U A L 33
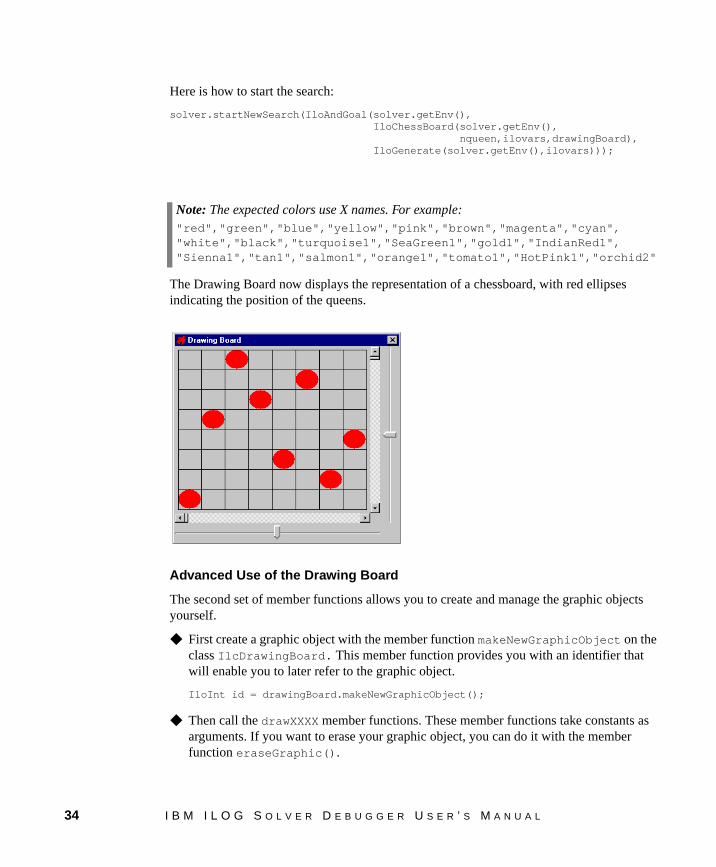
Here is how to start the search:
solver.startNewSearch(IloAndGoal(solver.getEnv(), IloChessBoard(solver.getEnv(), nqueen,ilovars,drawingBoard), IloGenerate(solver.getEnv(),ilovars)));
The Drawing Board now displays the representation of a chessboard, with red ellipses indicating the position of the queens.
Advanced Use of the Drawing Board
The second set of member functions allows you to create and manage the graphic objects yourself.
◆ First create a graphic object with the member function makeNewGraphicObject on the class IlcDrawingBoard. This member function provides you with an identifier that will enable you to later refer to the graphic object.
IloInt id = drawingBoard.makeNewGraphicObject();
◆ Then call the drawXXXX member functions. These member functions take constants as arguments. If you want to erase your graphic object, you can do it with the member function eraseGraphic().
Note: The expected colors use X names. For example:"red","green","blue","yellow","pink","brown","magenta","cyan","white","black","turquoise1","SeaGreen1","gold1","IndianRed1","Sienna1","tan1","salmon1","orange1","tomato1","HotPink1","orchid2"
34 I B M I L O G S O L V E R D E B U G G E R U S E R ’ S M A N U A L

Example: Creating a New Algorithm Animation for a Scheduling Application
In the following snippet of code, the code of the debugjobshopm example is changed in order to represent the minimum and maximum values of the variables in a 2D representation.
The x-axis indicates the value of the minimum of the domain. The y-axis indicates the value of the maximum of the domain. Thus, the range of the variable domain can be represented by a 2D arrow.
When the arrow is on the diagonal, min equals max, which means that the variable is bound. A colored arrow is created between the start and end variables of a set of activities. Backtracking is handled by using reversible actions. When searching for a solution, the arrows start moving towards the diagonal. Sometimes an arrow takes a negative slope, which indicates that the domain of the start variable is no longer compatible with the domain of the end variable of the corresponding activity. A failure then occurs and the algorithm backtracks.
The following figure represents a user-defined animation of the search for a Scheduler application. The red arrow at the bottom left takes a negative slope. This arrow represents the activity responsible for a failure: its end max is strictly lower than its start max.
I B M I L O G S O L V E R D E B U G G E R U S E R ’ S M A N U A L 35
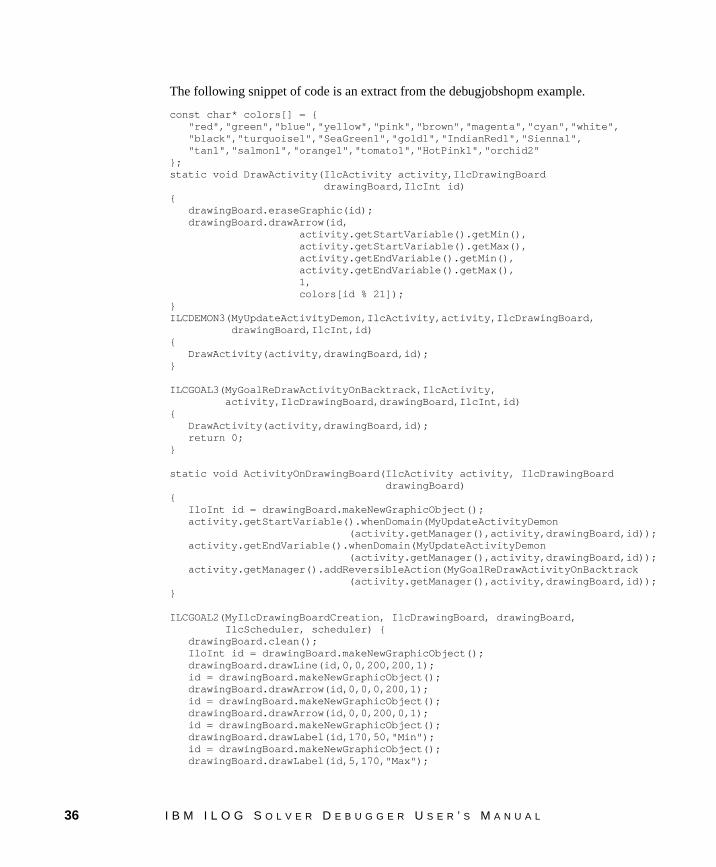
The following snippet of code is an extract from the debugjobshopm example.
const char* colors[] = { "red","green","blue","yellow","pink","brown","magenta","cyan","white", "black","turquoise1","SeaGreen1","gold1","IndianRed1","Sienna1", "tan1","salmon1","orange1","tomato1","HotPink1","orchid2"};static void DrawActivity(IlcActivity activity,IlcDrawingBoard drawingBoard,IlcInt id){ drawingBoard.eraseGraphic(id); drawingBoard.drawArrow(id, activity.getStartVariable().getMin(), activity.getStartVariable().getMax(), activity.getEndVariable().getMin(), activity.getEndVariable().getMax(), 1, colors[id % 21]);}ILCDEMON3(MyUpdateActivityDemon,IlcActivity,activity,IlcDrawingBoard, drawingBoard,IlcInt,id){ DrawActivity(activity,drawingBoard,id);}
ILCGOAL3(MyGoalReDrawActivityOnBacktrack,IlcActivity, activity,IlcDrawingBoard,drawingBoard,IlcInt,id) { DrawActivity(activity,drawingBoard,id); return 0;}
static void ActivityOnDrawingBoard(IlcActivity activity, IlcDrawingBoard drawingBoard){ IloInt id = drawingBoard.makeNewGraphicObject(); activity.getStartVariable().whenDomain(MyUpdateActivityDemon (activity.getManager(),activity,drawingBoard,id)); activity.getEndVariable().whenDomain(MyUpdateActivityDemon (activity.getManager(),activity,drawingBoard,id)); activity.getManager().addReversibleAction(MyGoalReDrawActivityOnBacktrack (activity.getManager(),activity,drawingBoard,id));}
ILCGOAL2(MyIlcDrawingBoardCreation, IlcDrawingBoard, drawingBoard, IlcScheduler, scheduler) { drawingBoard.clean(); IloInt id = drawingBoard.makeNewGraphicObject(); drawingBoard.drawLine(id,0,0,200,200,1); id = drawingBoard.makeNewGraphicObject(); drawingBoard.drawArrow(id,0,0,0,200,1); id = drawingBoard.makeNewGraphicObject(); drawingBoard.drawArrow(id,0,0,200,0,1); id = drawingBoard.makeNewGraphicObject(); drawingBoard.drawLabel(id,170,50,"Min"); id = drawingBoard.makeNewGraphicObject(); drawingBoard.drawLabel(id,5,170,"Max");
36 I B M I L O G S O L V E R D E B U G G E R U S E R ’ S M A N U A L
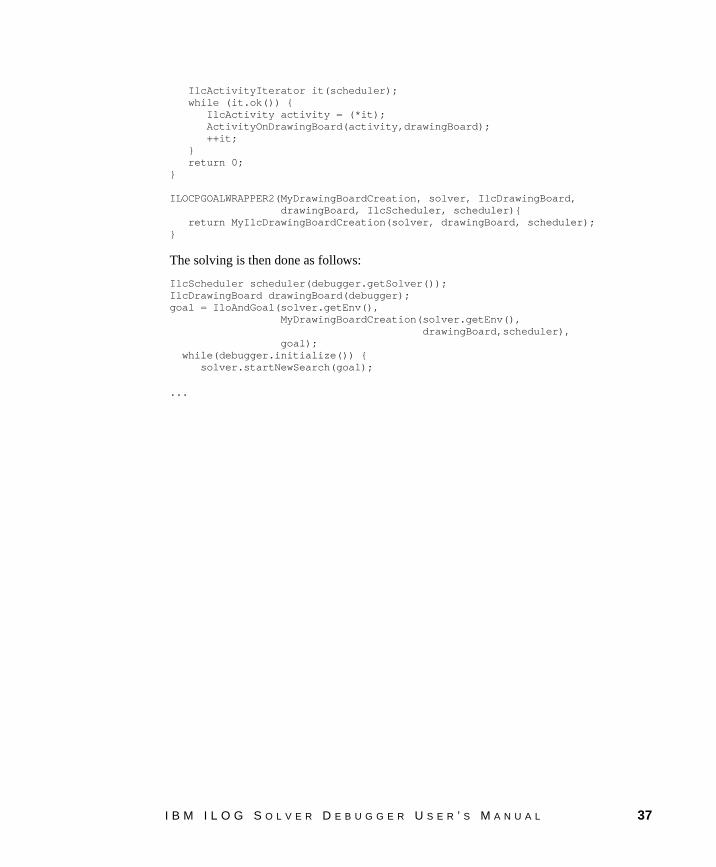
IlcActivityIterator it(scheduler); while (it.ok()) { IlcActivity activity = (*it); ActivityOnDrawingBoard(activity,drawingBoard); ++it; } return 0;}
ILOCPGOALWRAPPER2(MyDrawingBoardCreation, solver, IlcDrawingBoard, drawingBoard, IlcScheduler, scheduler){ return MyIlcDrawingBoardCreation(solver, drawingBoard, scheduler);}
The solving is then done as follows:
IlcScheduler scheduler(debugger.getSolver());IlcDrawingBoard drawingBoard(debugger);goal = IloAndGoal(solver.getEnv(), MyDrawingBoardCreation(solver.getEnv(), drawingBoard,scheduler), goal); while(debugger.initialize()) { solver.startNewSearch(goal);
...
I B M I L O G S O L V E R D E B U G G E R U S E R ’ S M A N U A L 37
Improving your Application
This section provides you with an example on how to improve an optimization application. This application contains an objective function, and uses IBM® ILOG Solver with the Depth First Search exploration order.
If your own application corresponds to these criteria, you can use the following visualization methodology to improve the search and the propagation. In this section, you will learn how to analyze right subtrees in your Search Tree and follow a tutorial to see how the propagation can be improved.
◆ Analyzing Right Subtrees
◆ Tutorial: Tuning the Propagation in the debuggolomb Example
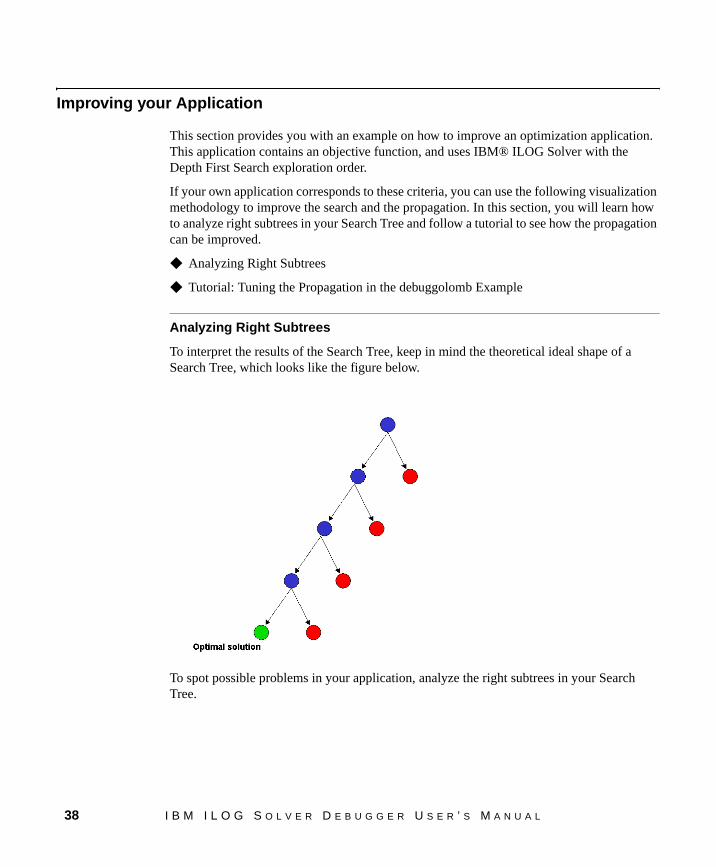
Analyzing Right Subtrees
To interpret the results of the Search Tree, keep in mind the theoretical ideal shape of a Search Tree, which looks like the figure below.
To spot possible problems in your application, analyze the right subtrees in your Search Tree.
38 I B M I L O G S O L V E R D E B U G G E R U S E R ’ S M A N U A L
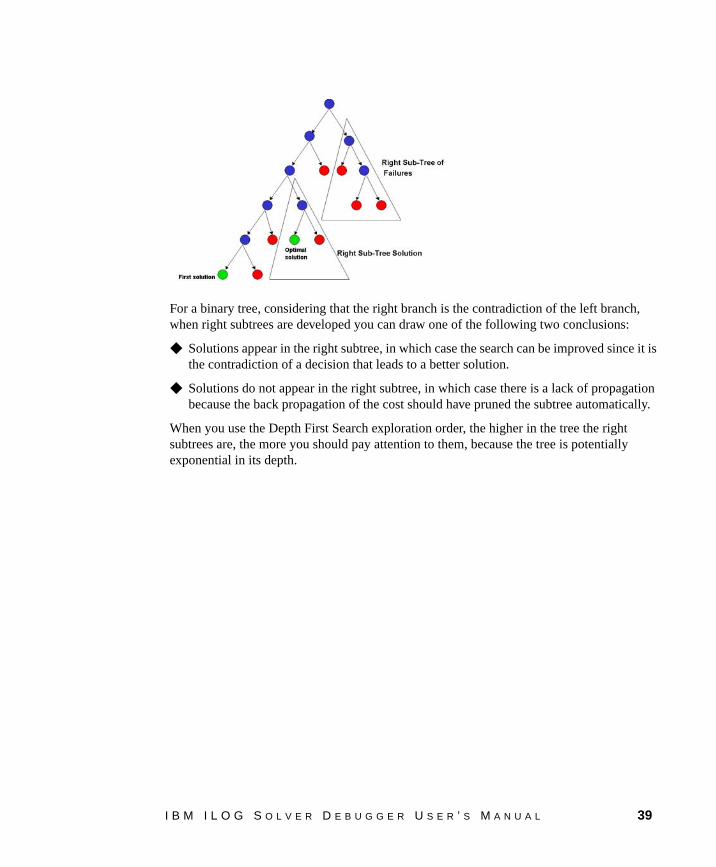
For a binary tree, considering that the right branch is the contradiction of the left branch, when right subtrees are developed you can draw one of the following two conclusions:
◆ Solutions appear in the right subtree, in which case the search can be improved since it is the contradiction of a decision that leads to a better solution.
◆ Solutions do not appear in the right subtree, in which case there is a lack of propagation because the back propagation of the cost should have pruned the subtree automatically.
When you use the Depth First Search exploration order, the higher in the tree the right subtrees are, the more you should pay attention to them, because the tree is potentially exponential in its depth.
I B M I L O G S O L V E R D E B U G G E R U S E R ’ S M A N U A L 39

Tutorial: Tuning the Propagation in the debuggolomb Example
This section is based on the debuggolomb example. It shows you how Solver Debugger can be used to tune the propagation of a Solver application.
Filter levels
In order to tune the propagation in the debuggolomb example, we will use the alldiff global constraint of Solver with two different levels of propagation.
◆ When using the basic filter level of this constraint, Solver guarantees that, at any computation point, the specified variables do not have the values of the already-assigned variables inside their domain.
◆ When using the extended filter level, Solver reasons on the domains instead of the values and guarantees that, for each value in the domain of any given variable, there exist values in the domains of the remaining variables such that the constraint is satisfied.
Using the Search Tree
Visualize the Search Trees corresponding to the basic and extended filter levels. The following figure represents the Search Trees corresponding to the two filter levels.
In the Search Tree, the extended level enforces a stronger pruning than the basic one, while the basic filter level produces a bigger tree with additional right subtrees.
These right subtrees have only failure leaves, which is a sign of lack of propagation. By setting the filter level to the extended level these right subtrees are pruned.
Reminder: When connecting to the debuggolomb example, pass two integer parameters: the size of the problem and the filtering level of the alldiff constraint.
debuggolomb 6 0 (0 = basic filtering level)
debuggolomb 6 1 (1 = medium filtering level)
debuggolomb 6 2 (2 = extended filtering level)
40 I B M I L O G S O L V E R D E B U G G E R U S E R ’ S M A N U A L
Using the Christmas Tree
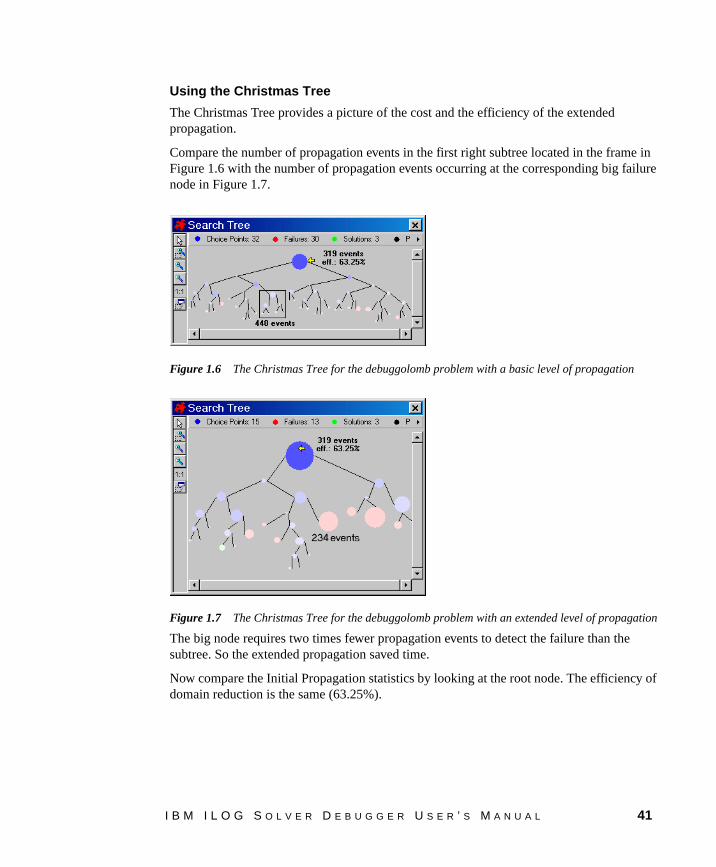
The Christmas Tree provides a picture of the cost and the efficiency of the extended propagation.
Compare the number of propagation events in the first right subtree located in the frame in Figure 1.6 with the number of propagation events occurring at the corresponding big failure node in Figure 1.7.
Figure 1.6
Figure 1.6 The Christmas Tree for the debuggolomb problem with a basic level of propagation
Figure 1.7
Figure 1.7 The Christmas Tree for the debuggolomb problem with an extended level of propagation
The big node requires two times fewer propagation events to detect the failure than the subtree. So the extended propagation saved time.
Now compare the Initial Propagation statistics by looking at the root node. The efficiency of domain reduction is the same (63.25%).
I B M I L O G S O L V E R D E B U G G E R U S E R ’ S M A N U A L 41
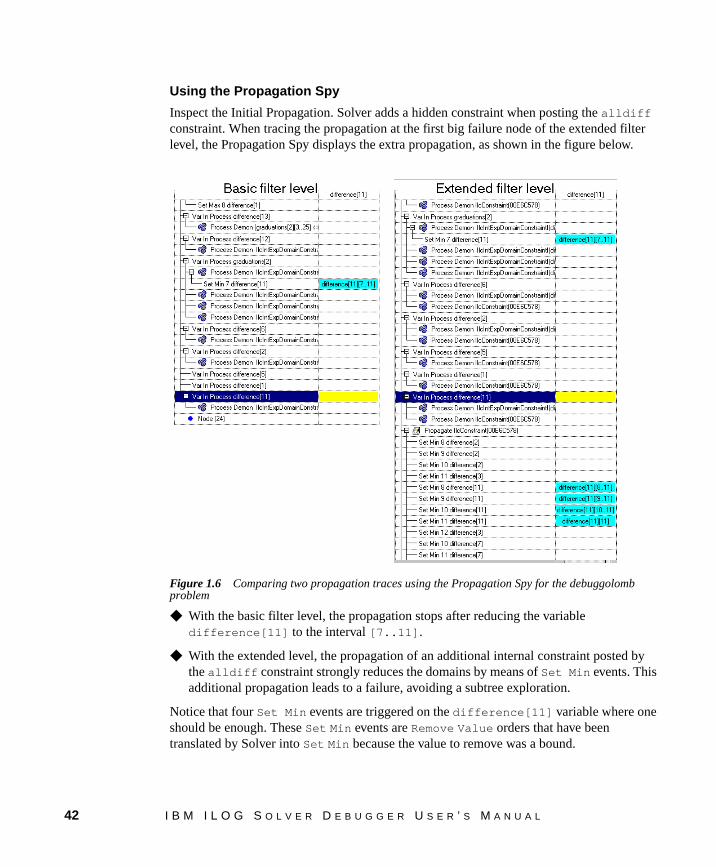
Using the Propagation Spy
Inspect the Initial Propagation. Solver adds a hidden constraint when posting the alldiff constraint. When tracing the propagation at the first big failure node of the extended filter level, the Propagation Spy displays the extra propagation, as shown in the figure below.
Figure 1.8
Figure 1.6 Comparing two propagation traces using the Propagation Spy for the debuggolomb problem
◆ With the basic filter level, the propagation stops after reducing the variable difference[11] to the interval [7..11].
◆ With the extended level, the propagation of an additional internal constraint posted by the alldiff constraint strongly reduces the domains by means of Set Min events. This additional propagation leads to a failure, avoiding a subtree exploration.
Notice that four Set Min events are triggered on the difference[11] variable where one should be enough. These Set Min events are Remove Value orders that have been translated by Solver into Set Min because the value to remove was a bound.
42 I B M I L O G S O L V E R D E B U G G E R U S E R ’ S M A N U A L
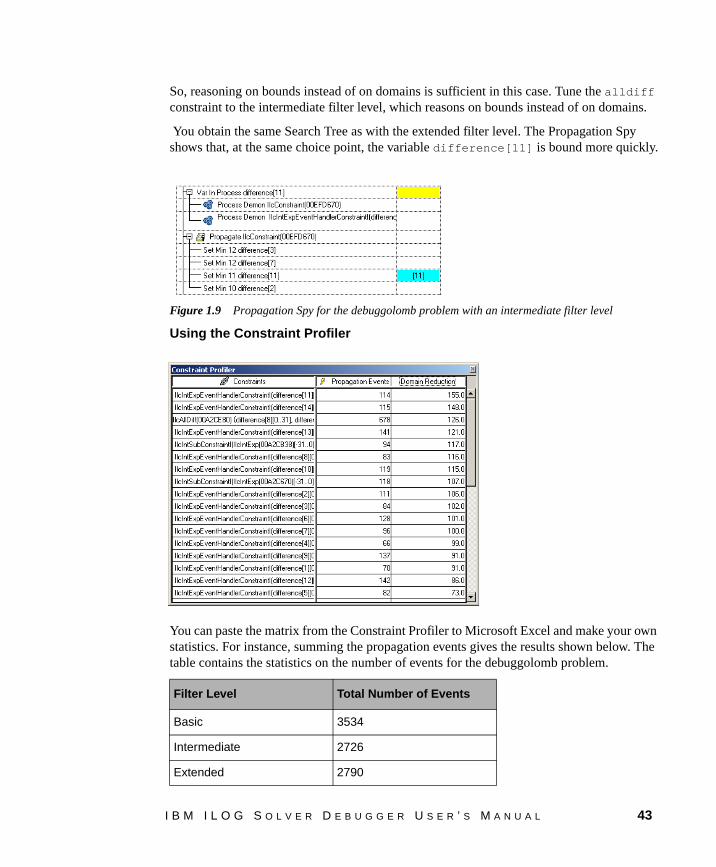
So, reasoning on bounds instead of on domains is sufficient in this case. Tune the alldiff constraint to the intermediate filter level, which reasons on bounds instead of on domains.
You obtain the same Search Tree as with the extended filter level. The Propagation Spy shows that, at the same choice point, the variable difference[11] is bound more quickly.
Figure 1.9
Figure 1.9 Propagation Spy for the debuggolomb problem with an intermediate filter level
Using the Constraint Profiler
You can paste the matrix from the Constraint Profiler to Microsoft Excel and make your own statistics. For instance, summing the propagation events gives the results shown below. The table contains the statistics on the number of events for the debuggolomb problem.
Filter Level Total Number of Events
Basic 3534
Intermediate 2726
Extended 2790
I B M I L O G S O L V E R D E B U G G E R U S E R ’ S M A N U A L 43

44 I B M I L O G S O L V E R D E B U G G E R U S E R ’ S M A N U A L

Solver Debugger API
This section contains the C++ API for the IBM® ILOG Solver Debugger.
I B M I L O G S O L V E R D E B U G G E R U S E R ’ S M A N U A L 45

46 I B M I L O G S O L V E R D E B U G G E R U S E R ’ S M A N U A L
IlcAddOnDebugger
Category C++ class
Description The class IlcAddOnDebugger is the base class for the Debugger classes specialized in debugging an application based on an add-on for IBM® ILOG® Solver.
Include File <ilsolver/addondebugger.h>
Synopsis class IlcAddOnDebugger {public: IlcAddOnDebugger(IlcAddOnDebuggerI* impl=0); IloBool displayResult() const; IlcAddOnDebuggerI* getImpl() const; };#endif
Constructor IlcAddOnDebugger(IlcAddOnDebuggerI* impl=0);
Creates a new handle class on the same implementation object.
Member FunctionsIloBool displayResult() const;
Displays the result graphically. In the current implementation, by default, this member function is automatically called at each solution. In Scheduler applications it displays a Gantt chart with precedences.
IlcAddOnDebuggerI* getImpl() const;
Returns the implementation object.
I B M I L O G S O L V E R D E B U G G E R U S E R ’ S M A N U A L 47

48 I B M I L O G S O L V E R D E B U G G E R U S E R ’ S M A N U A L
IlcDebugger
Category C++ class
Description The class IlcDebugger is a handle class on an instance of the implementation class IlcDebuggerI. This class manages the debugging protocol with the Debugger GUI so that an external application or a specific engine can connect to the GUI.
Include File <ilsolver/debugger.h>
Synopsis class IlcDebugger {public: IlcDebugger(IlcDebuggerI* impl = 0); int beginNestedSearchTreeView(); void breakExecution(); void browseAll(); void close(); IloBool displayResult() const; int endNestedSearchTreeView(); IlcDebuggerI* getImpl() const {return _impl;} IloBool isActive() const; IloBool isAutomaticBrowse() const; IloBool isAutomaticDisplay() const; IloBool isConnected() const; IloBool isTextual() const; int newSearchTreeView(); void sendConsole(const char* text); void sendSolution(const char* text); void setAutomaticBrowse(IloBool automaticBrowse); void setAutomaticDisplay(IloBool automatic); };
Constructor IlcDebugger(IlcDebuggerI* impl = 0);
Creates a new handle class on the same implementation object.
Member Functionsint beginNestedSearchTreeView();
Creates a new Search Tree view in Solver Debugger. Sends notification of the next node created to the new Search Tree. Goes back to the previous Search Tree whenever endNestedSearch is called.
void breakExecution();
Interrupts the execution.
void browseAll();
Forces the Debugger to browse the model.
I B M I L O G S O L V E R D E B U G G E R U S E R ’ S M A N U A L 49
void close();
Closes the connection between the user application and the GUI server and releases the memory.
IloBool displayResult() const;
Displays the result graphically. In the current implementation, by default, this member function is automatically called at each solution. In Scheduler applications it displays a Gantt chart with precedences.
int endNestedSearchTreeView();
Goes back to the parent Search Tree. Considers the current Search Tree as terminated. Returns the identification of the parent Search Tree.
IlcDebuggerI* getImpl() const;
Returns the underlying implementation object.
IloBool isActive() const;
Returns true if the Debugger was set to active upon creation.
IloBool isAutomaticBrowse() const;
Returns true if the Debugger is in automatic browse mode.
IloBool isAutomaticDisplay() const;
Returns true if the Debugger is set to the automatic display mode for the result.
IloBool isConnected() const;
Returns true if the connection with the GUI server is still active.
IloBool isTextual() const;
Returns true if the Debugger was set to textual upon creation.
int newSearchTreeView();
Creates a new Search Tree view in Solver Debugger. Sends notification of the next node created to the new Search Tree. Considers the previous Search Tree as terminated. Returns the identification of the Search Tree view to be created.
void sendConsole(const char* text);
Sends a message to the Debugger Console Notebook Page.
void sendSolution(const char* text);
Sends a message to the Debugger Notebook Page.
void setAutomaticBrowse(IloBool automaticBrowse);
Tells the Debugger to switch on or off the automatic model browsing.
50 I B M I L O G S O L V E R D E B U G G E R U S E R ’ S M A N U A L

void setAutomaticDisplay(IloBool automatic);
Tells the Debugger to switch on or off the automatic display mode for the result. If the Debugger is set to the automatic display mode, add-on debuggers display a specific graphic representation of the solution, such as a Gantt chart for the Scheduler Debugger.
I B M I L O G S O L V E R D E B U G G E R U S E R ’ S M A N U A L 51

52 I B M I L O G S O L V E R D E B U G G E R U S E R ’ S M A N U A L
IlcDrawingBoard
Category C++ class
Description The class IlcDrawingBoard provides a 2D representation of the search algorithm.
Include File <ilsolver/drawingboard.h>
Synopsis class IlcDrawingBoard { public: IlcDrawingBoard(IlcSolverDebugger debugger, IloInt width = 100, IloInt height = 100, IloNum scaleH = 1.0, IloNum scaleV = 1.0); IlcDrawingBoard(IlcDrawingBoardI* impl = 0); void clean(); IlcIntExp constantInt(IloInt value) const; IlcFloatExp constantNum(IloNum value) const; void drawArc(IloInt id, IloInt xLowerLeft, IloInt yLowerLeft, IloInt rectWidth, IloInt rectHeight, IlcFloat startAngle, IlcFloat angleRange, IloInt th); void drawArrow(IloInt id, IloInt x1, IloInt y1, IloInt x2, IloInt y2, IloInt th, const char* col = "black"); void drawEllipse(IloInt id, IloInt xLowerLeft, IloInt yLowerLeft, IloInt rectWidth, IloInt rectHeight, IloInt th); void drawFilledArc(IloInt id, IloInt xLowerLeft, IloInt yLowerLeft, IloInt rectWidth, IloInt rectHeight, IlcFloat startAngle, IlcFloat angleRange, const char* col, IloInt th); void drawFilledEllipse(IloInt id, IloInt xLowerLeft, IloInt yLowerLeft, IloInt rectWidth, IloInt rectHeight, const char* col, IloInt th); void drawFilledLabel(IloInt id, IloInt x, IloInt y, const char* str, const char* col); void drawFilledPolygon(IloInt id, IloInt x[], IloInt y[], IloInt count, const char* col, IloInt th, IloInt fillRule); void drawFilledRectangle(IloInt id, IloInt xLowerLeft, IloInt yLowerLeft, IloInt rectWidth, IloInt rectHeight, const char* col, IloInt th);
I B M I L O G S O L V E R D E B U G G E R U S E R ’ S M A N U A L 53
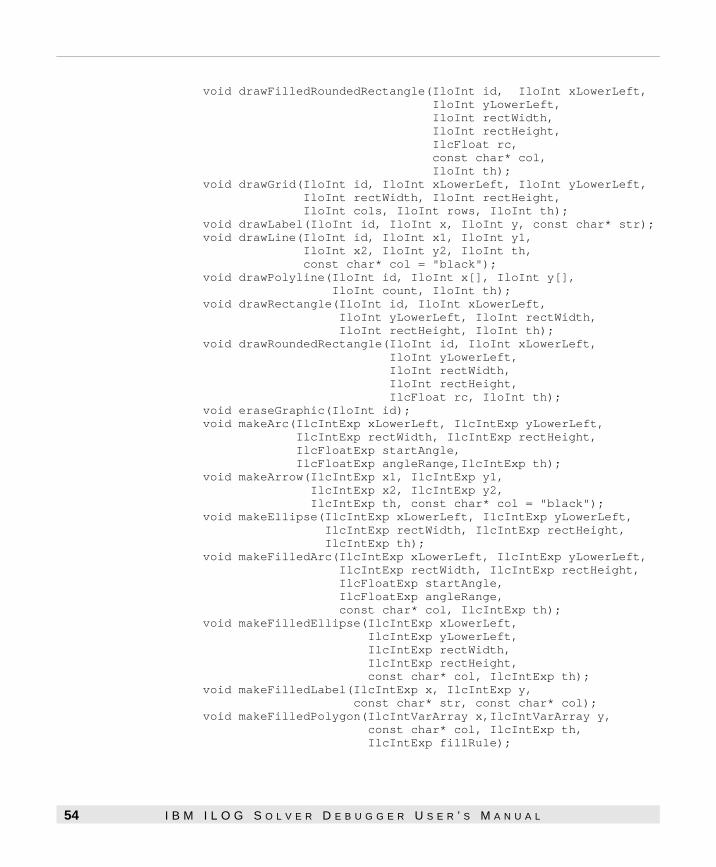
void drawFilledRoundedRectangle(IloInt id, IloInt xLowerLeft, IloInt yLowerLeft, IloInt rectWidth, IloInt rectHeight, IlcFloat rc, const char* col, IloInt th); void drawGrid(IloInt id, IloInt xLowerLeft, IloInt yLowerLeft, IloInt rectWidth, IloInt rectHeight, IloInt cols, IloInt rows, IloInt th); void drawLabel(IloInt id, IloInt x, IloInt y, const char* str); void drawLine(IloInt id, IloInt x1, IloInt y1, IloInt x2, IloInt y2, IloInt th, const char* col = "black"); void drawPolyline(IloInt id, IloInt x[], IloInt y[], IloInt count, IloInt th); void drawRectangle(IloInt id, IloInt xLowerLeft, IloInt yLowerLeft, IloInt rectWidth, IloInt rectHeight, IloInt th); void drawRoundedRectangle(IloInt id, IloInt xLowerLeft, IloInt yLowerLeft, IloInt rectWidth, IloInt rectHeight, IlcFloat rc, IloInt th); void eraseGraphic(IloInt id); void makeArc(IlcIntExp xLowerLeft, IlcIntExp yLowerLeft, IlcIntExp rectWidth, IlcIntExp rectHeight, IlcFloatExp startAngle, IlcFloatExp angleRange,IlcIntExp th); void makeArrow(IlcIntExp x1, IlcIntExp y1, IlcIntExp x2, IlcIntExp y2, IlcIntExp th, const char* col = "black"); void makeEllipse(IlcIntExp xLowerLeft, IlcIntExp yLowerLeft, IlcIntExp rectWidth, IlcIntExp rectHeight, IlcIntExp th); void makeFilledArc(IlcIntExp xLowerLeft, IlcIntExp yLowerLeft, IlcIntExp rectWidth, IlcIntExp rectHeight, IlcFloatExp startAngle, IlcFloatExp angleRange, const char* col, IlcIntExp th); void makeFilledEllipse(IlcIntExp xLowerLeft, IlcIntExp yLowerLeft, IlcIntExp rectWidth, IlcIntExp rectHeight, const char* col, IlcIntExp th); void makeFilledLabel(IlcIntExp x, IlcIntExp y, const char* str, const char* col); void makeFilledPolygon(IlcIntVarArray x,IlcIntVarArray y, const char* col, IlcIntExp th, IlcIntExp fillRule);
54 I B M I L O G S O L V E R D E B U G G E R U S E R ’ S M A N U A L
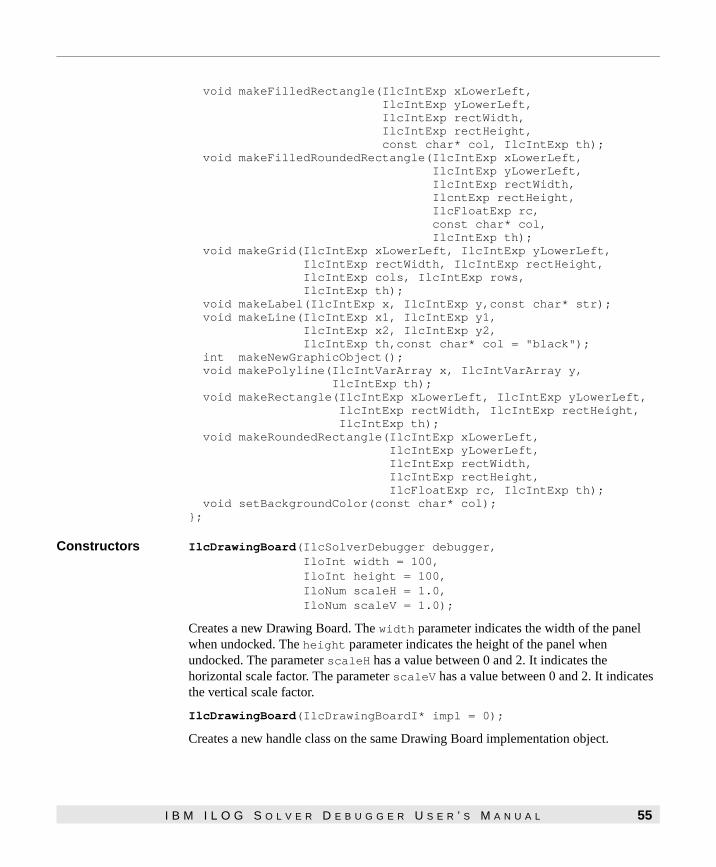
void makeFilledRectangle(IlcIntExp xLowerLeft, IlcIntExp yLowerLeft, IlcIntExp rectWidth, IlcIntExp rectHeight, const char* col, IlcIntExp th); void makeFilledRoundedRectangle(IlcIntExp xLowerLeft, IlcIntExp yLowerLeft, IlcIntExp rectWidth, IlcntExp rectHeight, IlcFloatExp rc, const char* col, IlcIntExp th); void makeGrid(IlcIntExp xLowerLeft, IlcIntExp yLowerLeft, IlcIntExp rectWidth, IlcIntExp rectHeight, IlcIntExp cols, IlcIntExp rows, IlcIntExp th); void makeLabel(IlcIntExp x, IlcIntExp y,const char* str); void makeLine(IlcIntExp x1, IlcIntExp y1, IlcIntExp x2, IlcIntExp y2, IlcIntExp th,const char* col = "black"); int makeNewGraphicObject(); void makePolyline(IlcIntVarArray x, IlcIntVarArray y, IlcIntExp th); void makeRectangle(IlcIntExp xLowerLeft, IlcIntExp yLowerLeft, IlcIntExp rectWidth, IlcIntExp rectHeight, IlcIntExp th); void makeRoundedRectangle(IlcIntExp xLowerLeft, IlcIntExp yLowerLeft, IlcIntExp rectWidth, IlcIntExp rectHeight, IlcFloatExp rc, IlcIntExp th); void setBackgroundColor(const char* col); };
Constructors IlcDrawingBoard(IlcSolverDebugger debugger, IloInt width = 100, IloInt height = 100, IloNum scaleH = 1.0, IloNum scaleV = 1.0);
Creates a new Drawing Board. The width parameter indicates the width of the panel when undocked. The height parameter indicates the height of the panel when undocked. The parameter scaleH has a value between 0 and 2. It indicates the horizontal scale factor. The parameter scaleV has a value between 0 and 2. It indicates the vertical scale factor.
IlcDrawingBoard(IlcDrawingBoardI* impl = 0);
Creates a new handle class on the same Drawing Board implementation object.
I B M I L O G S O L V E R D E B U G G E R U S E R ’ S M A N U A L 55
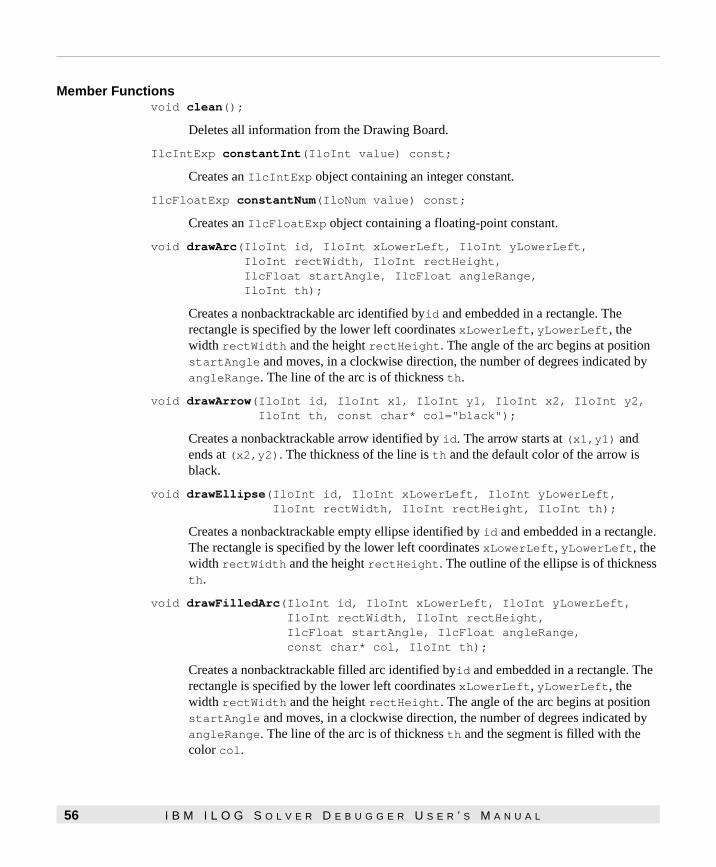
Member Functionsvoid clean();
Deletes all information from the Drawing Board.
IlcIntExp constantInt(IloInt value) const;
Creates an IlcIntExp object containing an integer constant.
IlcFloatExp constantNum(IloNum value) const;
Creates an IlcFloatExp object containing a floating-point constant.
void drawArc(IloInt id, IloInt xLowerLeft, IloInt yLowerLeft, IloInt rectWidth, IloInt rectHeight, IlcFloat startAngle, IlcFloat angleRange, IloInt th);
Creates a nonbacktrackable arc identified byid and embedded in a rectangle. The rectangle is specified by the lower left coordinates xLowerLeft, yLowerLeft, the width rectWidth and the height rectHeight. The angle of the arc begins at position startAngle and moves, in a clockwise direction, the number of degrees indicated by angleRange. The line of the arc is of thickness th.
void drawArrow(IloInt id, IloInt x1, IloInt y1, IloInt x2, IloInt y2, IloInt th, const char* col="black");
Creates a nonbacktrackable arrow identified by id. The arrow starts at (x1,y1) and ends at (x2,y2). The thickness of the line is th and the default color of the arrow is black.
void drawEllipse(IloInt id, IloInt xLowerLeft, IloInt yLowerLeft, IloInt rectWidth, IloInt rectHeight, IloInt th);
Creates a nonbacktrackable empty ellipse identified by id and embedded in a rectangle. The rectangle is specified by the lower left coordinates xLowerLeft, yLowerLeft, the width rectWidth and the height rectHeight. The outline of the ellipse is of thickness th.
void drawFilledArc(IloInt id, IloInt xLowerLeft, IloInt yLowerLeft, IloInt rectWidth, IloInt rectHeight, IlcFloat startAngle, IlcFloat angleRange, const char* col, IloInt th);
Creates a nonbacktrackable filled arc identified byid and embedded in a rectangle. The rectangle is specified by the lower left coordinates xLowerLeft, yLowerLeft, the width rectWidth and the height rectHeight. The angle of the arc begins at position startAngle and moves, in a clockwise direction, the number of degrees indicated by angleRange. The line of the arc is of thickness th and the segment is filled with the color col.
56 I B M I L O G S O L V E R D E B U G G E R U S E R ’ S M A N U A L
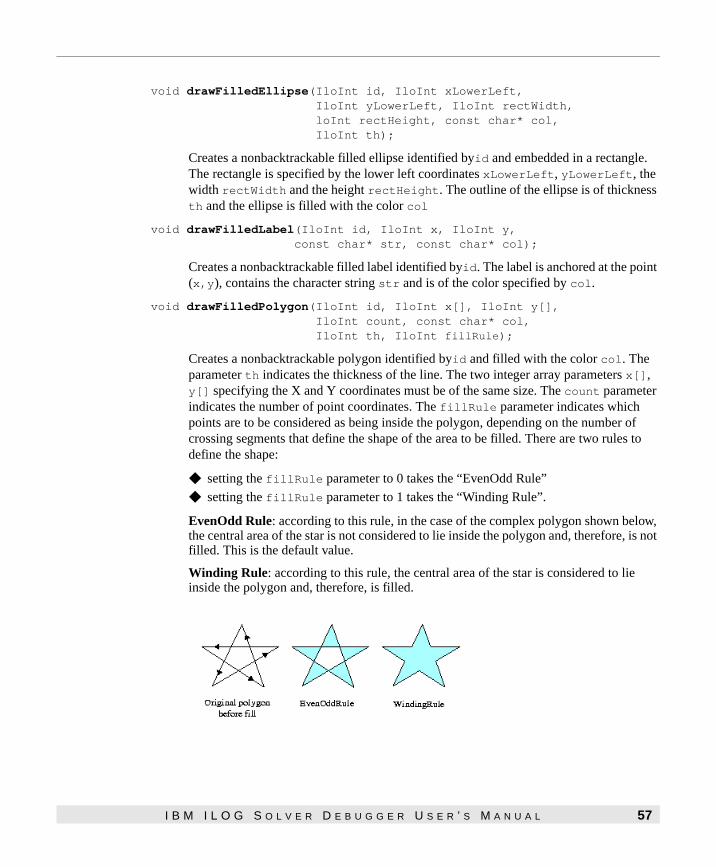
void drawFilledEllipse(IloInt id, IloInt xLowerLeft, IloInt yLowerLeft, IloInt rectWidth, loInt rectHeight, const char* col, IloInt th);
Creates a nonbacktrackable filled ellipse identified byid and embedded in a rectangle. The rectangle is specified by the lower left coordinates xLowerLeft, yLowerLeft, the width rectWidth and the height rectHeight. The outline of the ellipse is of thickness th and the ellipse is filled with the color col
void drawFilledLabel(IloInt id, IloInt x, IloInt y, const char* str, const char* col);
Creates a nonbacktrackable filled label identified byid. The label is anchored at the point (x,y), contains the character string str and is of the color specified by col.
void drawFilledPolygon(IloInt id, IloInt x[], IloInt y[], IloInt count, const char* col, IloInt th, IloInt fillRule);
Creates a nonbacktrackable polygon identified byid and filled with the color col. The parameter th indicates the thickness of the line. The two integer array parameters x[], y[] specifying the X and Y coordinates must be of the same size. The count parameter indicates the number of point coordinates. The fillRule parameter indicates which points are to be considered as being inside the polygon, depending on the number of crossing segments that define the shape of the area to be filled. There are two rules to define the shape:
◆ setting the fillRule parameter to 0 takes the “EvenOdd Rule”
◆ setting the fillRule parameter to 1 takes the “Winding Rule”.
EvenOdd Rule: according to this rule, in the case of the complex polygon shown below, the central area of the star is not considered to lie inside the polygon and, therefore, is not filled. This is the default value.
Winding Rule: according to this rule, the central area of the star is considered to lie inside the polygon and, therefore, is filled.
I B M I L O G S O L V E R D E B U G G E R U S E R ’ S M A N U A L 57

void drawFilledRectangle(IloInt id, IloInt xLowerLeft, IloInt yLowerLeft, IloInt rectWidth, IloInt rectHeight, const char* col, IloInt th);
Creates a nonbacktrackable rectangle identified byid and filled with the color col. The rectangle is anchored at the point (xLowerLeft, yLowerLeft) and its dimensions are rectWidth, rectHeight. The outline of the rectangle is of thickness th.
void drawFilledRoundedRectangle(IloInt id, IloInt xLowerLeft, IloInt yLowerLeft, IloInt rectWidth, IloInt rectHeight, IlcFloat rc, const char* col, IloInt th);
Creates a nonbacktrackable rectangle with rounded corners and filled with the color col. The rectangle is identified byid. The parameters are similar to those of drawFilledRectangle above, except for rc, which specifies the amplitude of the arc used for the rounded corners.
void drawGrid(IloInt id, IloInt xLowerLeft, IloInt yLowerLeft, IloInt rectWidth, IloInt rectHeight, IloInt cols, IloInt rows, IloInt th);
Creates a nonbacktrackable grid identified byid and embedded in a rectangle. The rectangle is specified by the anchor points xLowerLeft, yLowerLeft, and the dimensions rectWidth, rectHeight. The columns and rows in the grid are specified by the integers cols and rows. The lines of the grid are of thickness th.
void drawLabel(IloInt id, IloInt x, IloInt y, const char* str);
Creates a nonbacktrackable label identified byid. The label is anchored at the point (x,y) and contains the character string str.
void drawLine(IloInt id, IloInt x1, IloInt y1, IloInt x2, IloInt y2, IloInt th, const char* col = "black");
Creates a nonbacktrackable line identified byid. The line, drawn between the two points (x1,y1) and (x2,y2), is of thickness th and default color black.
void drawPolyline(IloInt id, IlcInt x[], IlcInt y[], IlcInt count, IlcInt th);
Creates a nonbacktrackable polyline identified byid. The two integer array parameters x[], y[] specifying the X and Y coordinates must be of the same size. The count parameter indicates the number of point coordinates. The th parameter indicates the thickness of the line. To obtain an empty polygon, give the same value to the first X and last X and to the first Y and last Y.
58 I B M I L O G S O L V E R D E B U G G E R U S E R ’ S M A N U A L
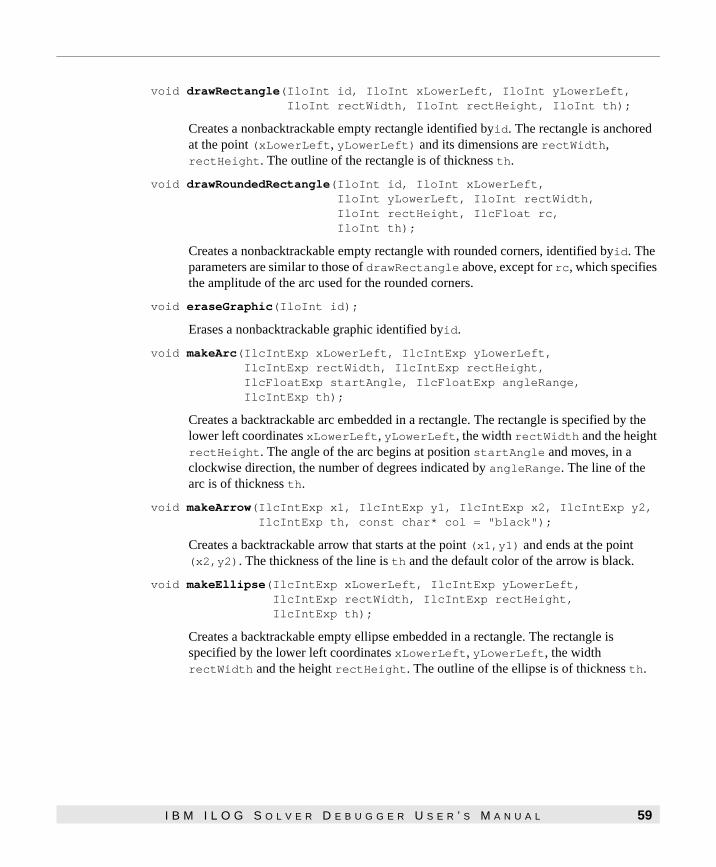
void drawRectangle(IloInt id, IloInt xLowerLeft, IloInt yLowerLeft, IloInt rectWidth, IloInt rectHeight, IloInt th);
Creates a nonbacktrackable empty rectangle identified byid. The rectangle is anchored at the point (xLowerLeft, yLowerLeft) and its dimensions are rectWidth, rectHeight. The outline of the rectangle is of thickness th.
void drawRoundedRectangle(IloInt id, IloInt xLowerLeft, IloInt yLowerLeft, IloInt rectWidth, IloInt rectHeight, IlcFloat rc, IloInt th);
Creates a nonbacktrackable empty rectangle with rounded corners, identified byid. The parameters are similar to those of drawRectangle above, except for rc, which specifies the amplitude of the arc used for the rounded corners.
void eraseGraphic(IloInt id);
Erases a nonbacktrackable graphic identified byid.
void makeArc(IlcIntExp xLowerLeft, IlcIntExp yLowerLeft, IlcIntExp rectWidth, IlcIntExp rectHeight, IlcFloatExp startAngle, IlcFloatExp angleRange, IlcIntExp th);
Creates a backtrackable arc embedded in a rectangle. The rectangle is specified by the lower left coordinates xLowerLeft, yLowerLeft, the width rectWidth and the height rectHeight. The angle of the arc begins at position startAngle and moves, in a clockwise direction, the number of degrees indicated by angleRange. The line of the arc is of thickness th.
void makeArrow(IlcIntExp x1, IlcIntExp y1, IlcIntExp x2, IlcIntExp y2, IlcIntExp th, const char* col = "black");
Creates a backtrackable arrow that starts at the point (x1,y1) and ends at the point (x2,y2). The thickness of the line is th and the default color of the arrow is black.
void makeEllipse(IlcIntExp xLowerLeft, IlcIntExp yLowerLeft, IlcIntExp rectWidth, IlcIntExp rectHeight, IlcIntExp th);
Creates a backtrackable empty ellipse embedded in a rectangle. The rectangle is specified by the lower left coordinates xLowerLeft, yLowerLeft, the width rectWidth and the height rectHeight. The outline of the ellipse is of thickness th.
I B M I L O G S O L V E R D E B U G G E R U S E R ’ S M A N U A L 59
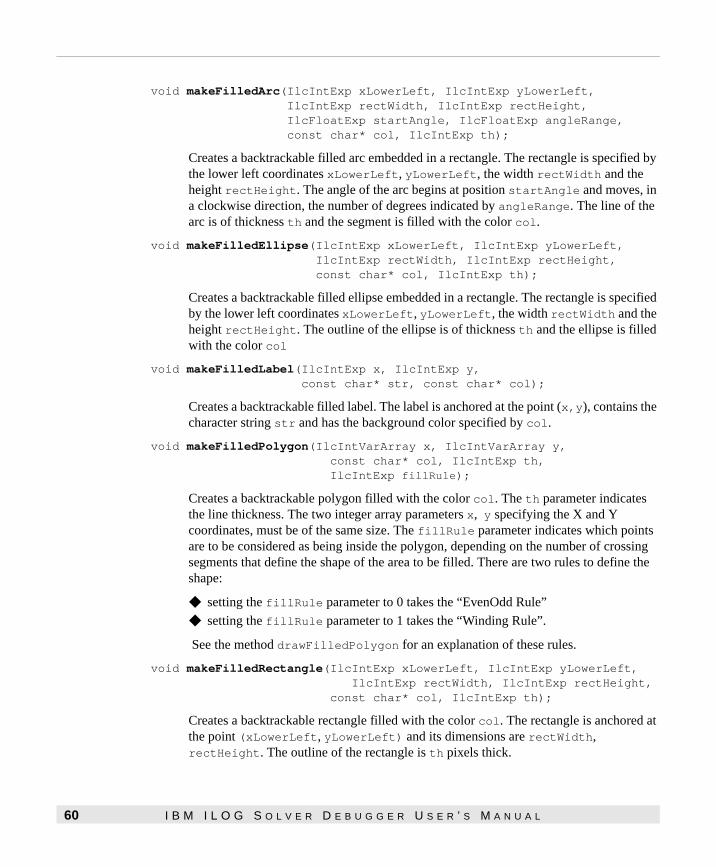
void makeFilledArc(IlcIntExp xLowerLeft, IlcIntExp yLowerLeft, IlcIntExp rectWidth, IlcIntExp rectHeight, IlcFloatExp startAngle, IlcFloatExp angleRange, const char* col, IlcIntExp th);
Creates a backtrackable filled arc embedded in a rectangle. The rectangle is specified by the lower left coordinates xLowerLeft, yLowerLeft, the width rectWidth and the height rectHeight. The angle of the arc begins at position startAngle and moves, in a clockwise direction, the number of degrees indicated by angleRange. The line of the arc is of thickness th and the segment is filled with the color col.
void makeFilledEllipse(IlcIntExp xLowerLeft, IlcIntExp yLowerLeft, IlcIntExp rectWidth, IlcIntExp rectHeight, const char* col, IlcIntExp th);
Creates a backtrackable filled ellipse embedded in a rectangle. The rectangle is specified by the lower left coordinates xLowerLeft, yLowerLeft, the width rectWidth and the height rectHeight. The outline of the ellipse is of thickness th and the ellipse is filled with the color col
void makeFilledLabel(IlcIntExp x, IlcIntExp y, const char* str, const char* col);
Creates a backtrackable filled label. The label is anchored at the point (x,y), contains the character string str and has the background color specified by col.
void makeFilledPolygon(IlcIntVarArray x, IlcIntVarArray y, const char* col, IlcIntExp th, IlcIntExp fillRule);
Creates a backtrackable polygon filled with the color col. The th parameter indicates the line thickness. The two integer array parameters x, y specifying the X and Y coordinates, must be of the same size. The fillRule parameter indicates which points are to be considered as being inside the polygon, depending on the number of crossing segments that define the shape of the area to be filled. There are two rules to define the shape:
◆ setting the fillRule parameter to 0 takes the “EvenOdd Rule”
◆ setting the fillRule parameter to 1 takes the “Winding Rule”.
See the method drawFilledPolygon for an explanation of these rules.
void makeFilledRectangle(IlcIntExp xLowerLeft, IlcIntExp yLowerLeft, IlcIntExp rectWidth, IlcIntExp rectHeight, const char* col, IlcIntExp th);
Creates a backtrackable rectangle filled with the color col. The rectangle is anchored at the point (xLowerLeft, yLowerLeft) and its dimensions are rectWidth, rectHeight. The outline of the rectangle is th pixels thick.
60 I B M I L O G S O L V E R D E B U G G E R U S E R ’ S M A N U A L
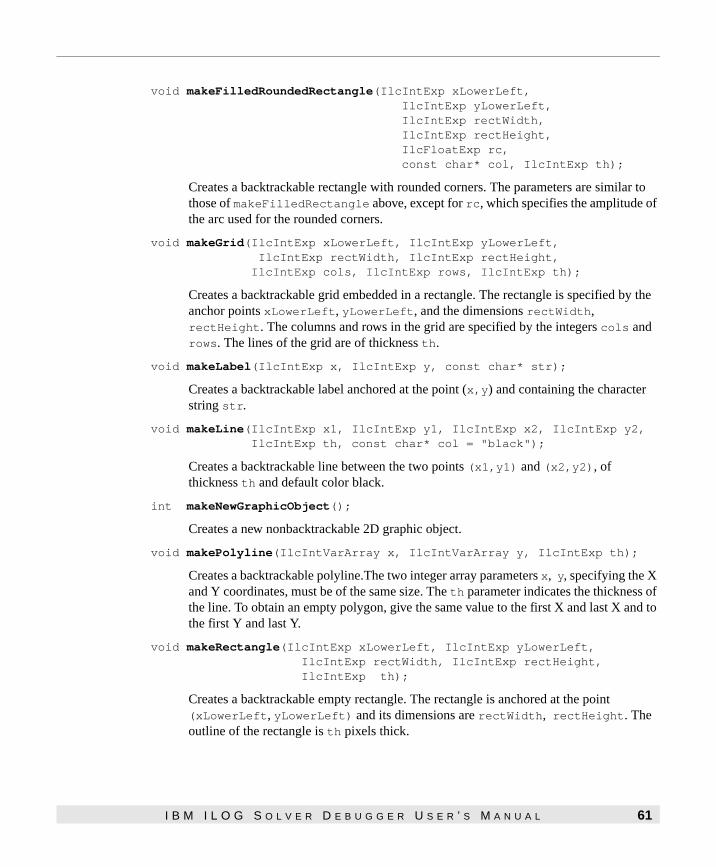
void makeFilledRoundedRectangle(IlcIntExp xLowerLeft, IlcIntExp yLowerLeft, IlcIntExp rectWidth, IlcIntExp rectHeight, IlcFloatExp rc, const char* col, IlcIntExp th);
Creates a backtrackable rectangle with rounded corners. The parameters are similar to those of makeFilledRectangle above, except for rc, which specifies the amplitude of the arc used for the rounded corners.
void makeGrid(IlcIntExp xLowerLeft, IlcIntExp yLowerLeft, IlcIntExp rectWidth, IlcIntExp rectHeight, IlcIntExp cols, IlcIntExp rows, IlcIntExp th);
Creates a backtrackable grid embedded in a rectangle. The rectangle is specified by the anchor points xLowerLeft, yLowerLeft, and the dimensions rectWidth, rectHeight. The columns and rows in the grid are specified by the integers cols and rows. The lines of the grid are of thickness th.
void makeLabel(IlcIntExp x, IlcIntExp y, const char* str);
Creates a backtrackable label anchored at the point (x,y) and containing the character string str.
void makeLine(IlcIntExp x1, IlcIntExp y1, IlcIntExp x2, IlcIntExp y2, IlcIntExp th, const char* col = "black");
Creates a backtrackable line between the two points (x1,y1) and (x2,y2), of thickness th and default color black.
int makeNewGraphicObject();
Creates a new nonbacktrackable 2D graphic object.
void makePolyline(IlcIntVarArray x, IlcIntVarArray y, IlcIntExp th);
Creates a backtrackable polyline.The two integer array parameters x, y, specifying the X and Y coordinates, must be of the same size. The th parameter indicates the thickness of the line. To obtain an empty polygon, give the same value to the first X and last X and to the first Y and last Y.
void makeRectangle(IlcIntExp xLowerLeft, IlcIntExp yLowerLeft, IlcIntExp rectWidth, IlcIntExp rectHeight, IlcIntExp th);
Creates a backtrackable empty rectangle. The rectangle is anchored at the point (xLowerLeft, yLowerLeft) and its dimensions are rectWidth, rectHeight. The outline of the rectangle is th pixels thick.
I B M I L O G S O L V E R D E B U G G E R U S E R ’ S M A N U A L 61

void makeRoundedRectangle(IlcIntExp xLowerLeft, IlcIntExp yLowerLeft, IlcIntExp rectWidth, IlcIntExp rectHeight, IlcFloatExp rc, IlcIntExp th);
Creates a backtrackable empty rectangle with rounded corners. The parameters are similar to those of makeRectangle above, except for rc, which specifies the amplitude of the arc used for the rounded corners.
void setBackgroundColor(const char* col);
The parameter col sets the background color for the Drawing Board.
62 I B M I L O G S O L V E R D E B U G G E R U S E R ’ S M A N U A L
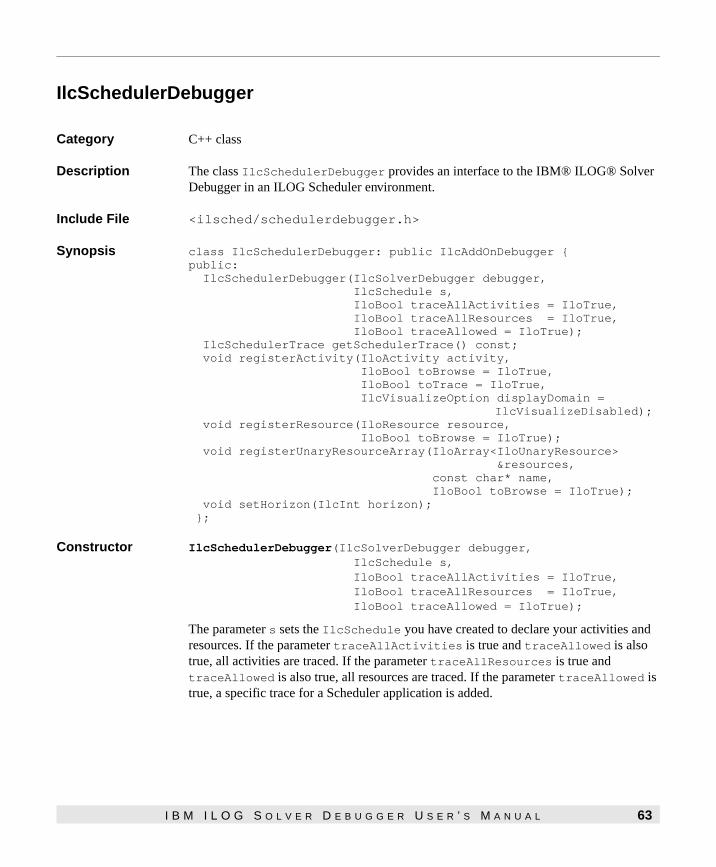
IlcSchedulerDebugger
Category C++ class
Description The class IlcSchedulerDebugger provides an interface to the IBM® ILOG® Solver Debugger in an ILOG Scheduler environment.
Include File <ilsched/schedulerdebugger.h>
Synopsis class IlcSchedulerDebugger: public IlcAddOnDebugger { public: IlcSchedulerDebugger(IlcSolverDebugger debugger, IlcSchedule s, IloBool traceAllActivities = IloTrue, IloBool traceAllResources = IloTrue, IloBool traceAllowed = IloTrue); IlcSchedulerTrace getSchedulerTrace() const; void registerActivity(IloActivity activity, IloBool toBrowse = IloTrue, IloBool toTrace = IloTrue, IlcVisualizeOption displayDomain = IlcVisualizeDisabled); void registerResource(IloResource resource, IloBool toBrowse = IloTrue); void registerUnaryResourceArray(IloArray<IloUnaryResource> &resources, const char* name, IloBool toBrowse = IloTrue); void setHorizon(IlcInt horizon); };
Constructor IlcSchedulerDebugger(IlcSolverDebugger debugger, IlcSchedule s, IloBool traceAllActivities = IloTrue, IloBool traceAllResources = IloTrue, IloBool traceAllowed = IloTrue);
The parameter s sets the IlcSchedule you have created to declare your activities and resources. If the parameter traceAllActivities is true and traceAllowed is also true, all activities are traced. If the parameter traceAllResources is true and traceAllowed is also true, all resources are traced. If the parameter traceAllowed is true, a specific trace for a Scheduler application is added.
I B M I L O G S O L V E R D E B U G G E R U S E R ’ S M A N U A L 63
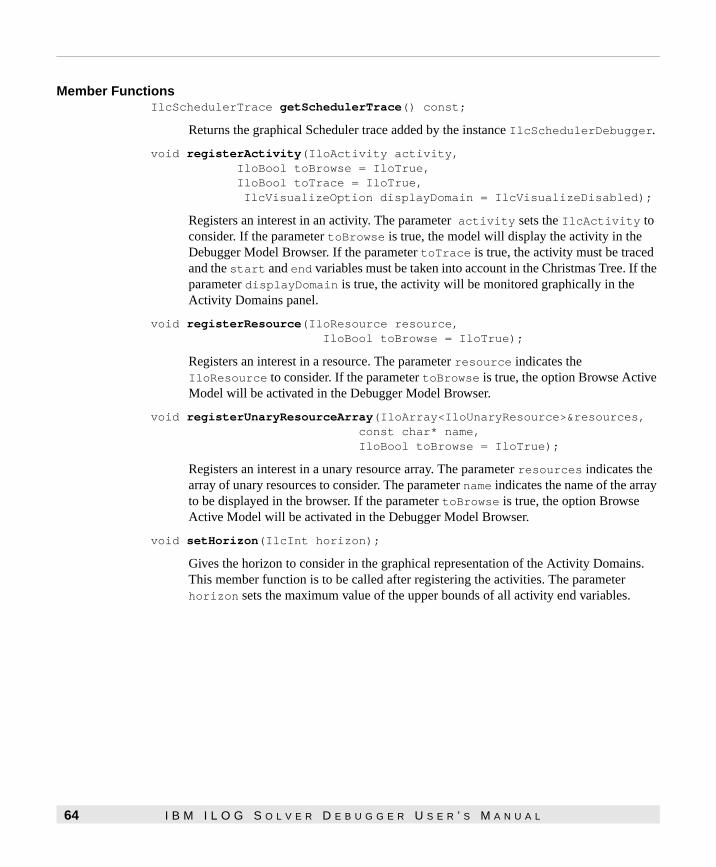
Member FunctionsIlcSchedulerTrace getSchedulerTrace() const;
Returns the graphical Scheduler trace added by the instance IlcSchedulerDebugger.
void registerActivity(IloActivity activity, IloBool toBrowse = IloTrue, IloBool toTrace = IloTrue, IlcVisualizeOption displayDomain = IlcVisualizeDisabled);
Registers an interest in an activity. The parameter activity sets the IlcActivity to consider. If the parameter toBrowse is true, the model will display the activity in the Debugger Model Browser. If the parameter toTrace is true, the activity must be traced and the start and end variables must be taken into account in the Christmas Tree. If the parameter displayDomain is true, the activity will be monitored graphically in the Activity Domains panel.
void registerResource(IloResource resource, IloBool toBrowse = IloTrue);
Registers an interest in a resource. The parameter resource indicates the IloResource to consider. If the parameter toBrowse is true, the option Browse Active Model will be activated in the Debugger Model Browser.
void registerUnaryResourceArray(IloArray<IloUnaryResource>&resources, const char* name, IloBool toBrowse = IloTrue);
Registers an interest in a unary resource array. The parameter resources indicates the array of unary resources to consider. The parameter name indicates the name of the array to be displayed in the browser. If the parameter toBrowse is true, the option Browse Active Model will be activated in the Debugger Model Browser.
void setHorizon(IlcInt horizon);
Gives the horizon to consider in the graphical representation of the Activity Domains. This member function is to be called after registering the activities. The parameter horizon sets the maximum value of the upper bounds of all activity end variables.
64 I B M I L O G S O L V E R D E B U G G E R U S E R ’ S M A N U A L
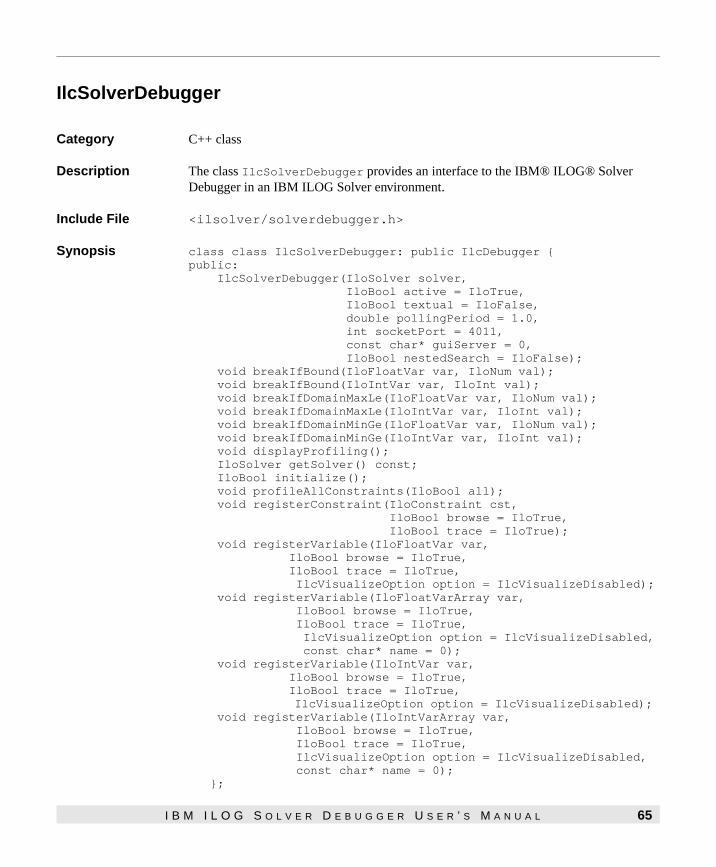
IlcSolverDebugger
Category C++ class
Description The class IlcSolverDebugger provides an interface to the IBM® ILOG® Solver Debugger in an IBM ILOG Solver environment.
Include File <ilsolver/solverdebugger.h>
Synopsis class class IlcSolverDebugger: public IlcDebugger { public: IlcSolverDebugger(IloSolver solver, IloBool active = IloTrue, IloBool textual = IloFalse, double pollingPeriod = 1.0, int socketPort = 4011, const char* guiServer = 0, IloBool nestedSearch = IloFalse); void breakIfBound(IloFloatVar var, IloNum val); void breakIfBound(IloIntVar var, IloInt val); void breakIfDomainMaxLe(IloFloatVar var, IloNum val); void breakIfDomainMaxLe(IloIntVar var, IloInt val); void breakIfDomainMinGe(IloFloatVar var, IloNum val); void breakIfDomainMinGe(IloIntVar var, IloInt val); void displayProfiling(); IloSolver getSolver() const; IloBool initialize(); void profileAllConstraints(IloBool all); void registerConstraint(IloConstraint cst, IloBool browse = IloTrue, IloBool trace = IloTrue); void registerVariable(IloFloatVar var, IloBool browse = IloTrue, IloBool trace = IloTrue, IlcVisualizeOption option = IlcVisualizeDisabled); void registerVariable(IloFloatVarArray var, IloBool browse = IloTrue, IloBool trace = IloTrue, IlcVisualizeOption option = IlcVisualizeDisabled, const char* name = 0); void registerVariable(IloIntVar var, IloBool browse = IloTrue, IloBool trace = IloTrue, IlcVisualizeOption option = IlcVisualizeDisabled); void registerVariable(IloIntVarArray var, IloBool browse = IloTrue, IloBool trace = IloTrue, IlcVisualizeOption option = IlcVisualizeDisabled, const char* name = 0); };
I B M I L O G S O L V E R D E B U G G E R U S E R ’ S M A N U A L 65
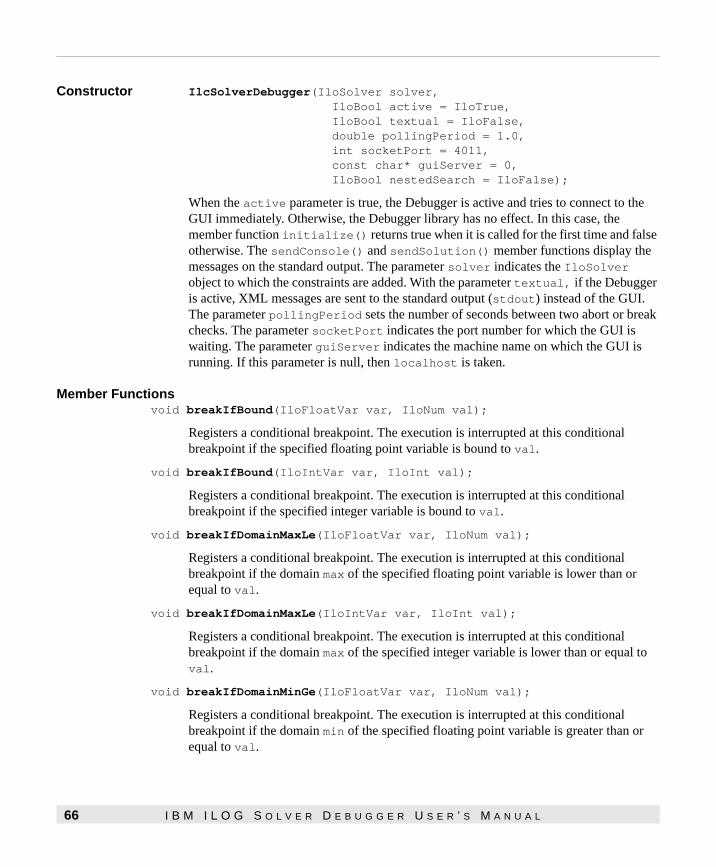
Constructor IlcSolverDebugger(IloSolver solver, IloBool active = IloTrue, IloBool textual = IloFalse, double pollingPeriod = 1.0, int socketPort = 4011, const char* guiServer = 0, IloBool nestedSearch = IloFalse);
When the active parameter is true, the Debugger is active and tries to connect to the GUI immediately. Otherwise, the Debugger library has no effect. In this case, the member function initialize() returns true when it is called for the first time and false otherwise. The sendConsole() and sendSolution() member functions display the messages on the standard output. The parameter solver indicates the IloSolver object to which the constraints are added. With the parameter textual, if the Debugger is active, XML messages are sent to the standard output (stdout) instead of the GUI. The parameter pollingPeriod sets the number of seconds between two abort or break checks. The parameter socketPort indicates the port number for which the GUI is waiting. The parameter guiServer indicates the machine name on which the GUI is running. If this parameter is null, then localhost is taken.
Member Functionsvoid breakIfBound(IloFloatVar var, IloNum val);
Registers a conditional breakpoint. The execution is interrupted at this conditional breakpoint if the specified floating point variable is bound to val.
void breakIfBound(IloIntVar var, IloInt val);
Registers a conditional breakpoint. The execution is interrupted at this conditional breakpoint if the specified integer variable is bound to val.
void breakIfDomainMaxLe(IloFloatVar var, IloNum val);
Registers a conditional breakpoint. The execution is interrupted at this conditional breakpoint if the domain max of the specified floating point variable is lower than or equal to val.
void breakIfDomainMaxLe(IloIntVar var, IloInt val);
Registers a conditional breakpoint. The execution is interrupted at this conditional breakpoint if the domain max of the specified integer variable is lower than or equal to val.
void breakIfDomainMinGe(IloFloatVar var, IloNum val);
Registers a conditional breakpoint. The execution is interrupted at this conditional breakpoint if the domain min of the specified floating point variable is greater than or equal to val.
66 I B M I L O G S O L V E R D E B U G G E R U S E R ’ S M A N U A L

void breakIfDomainMinGe(IloIntVar var, IloInt val);
Registers a conditional breakpoint. The execution is interrupted at this conditional breakpoint if the domain min of the specified integer variable is greater than or equal to val.
void displayProfiling();
Creates and displays the Constraint Profiler window from code. (Equivalent to clicking on the Constraint Profiler button from the GUI).
IloSolver getSolver() const;
Returns the same IloSolver instance as the one passed to the constructor.
IloBool initialize();
Initializes a running session. Returns false if a Quit order comes from the GUI.
void profileAllConstraints(IloBool all);
By default all constraints are profiled. To restrict the list of monitored constraints, use profileAllConstraints(IloFalse) and call the registerConstraint method on the constraints your are interested in.
void registerConstraint(IloConstraint cst, IloBool browse = IloTrue, IloBool trace = IloTrue);
Registers an interest in the constraint cst. The parameter cst indicates the constraint to consider. If the parameter browse is true, the model should be displayed in the Debugger Model Browser. If the parameter trace is true, the variables must be traced.
void registerVariable(IloFloatVar var, IloBool browse = IloTrue, IloBool trace = IloTrue, IlcVisualizeOption option = IlcVisualizeDisabled);
Registers an interest in the float variable var. The parameter var indicates the variable to consider. If the parameter browse is true, the model should be displayed in the Debugger Model Browser. If the parameter trace is true, the variables must be traced. The parameter option gives access to a graphical monitoring of the variable (displaying its range or value).
I B M I L O G S O L V E R D E B U G G E R U S E R ’ S M A N U A L 67

void registerVariable(IloFloatVarArray var, IloBool browse = IloTrue, IloBool trace =IloTrue, IlcVisualizeOption option = IlcVisualizeDisabled, const char* name = 0);
Registers an interest in the array of float variables var. The parameter var indicates the array of variables to consider. If the parameter browse is true, the model should be displayed in the Debugger Model Browser. If the parameter trace is true, the variables must be traced. The parameter option gives access to a graphical monitoring of the variable (displaying its range or value).
void registerVariable(IloIntVar var, IloBool trace =IloTrue, IloBool browse = IloTrue, IlcVisualizeOption option = IlcVisualizeDisabled);
Registers an interest in the integer variable var. The parameter var indicates the Ilovar to consider. If the parameter browse is true, then if the model is browsed it will be displayed in the Debugger Model Browser. If the parameter trace is true, variables must be traced and taken into account in the Christmas Tree. The parameter option gives access to a graphical monitoring of the variable (displaying its range or value).
void registerVariable(IloIntVarArray var, IloBool browse = IloTrue, IloBool trace = IloTrue, IlcVisualizeOption option = IlcVisualizeDisabled, const char* name = 0);
Registers an interest in the array of integer variables var. The parameter var indicates the array of variables to consider. If the parameter browse is true, the model should be displayed in the Debugger Model Browser. If the parameter trace is true, the variables must be traced and taken into account in the Christmas Tree. The parameter option gives access to a graphical monitoring of the variable (displaying its domain, range, and value).
68 I B M I L O G S O L V E R D E B U G G E R U S E R ’ S M A N U A L
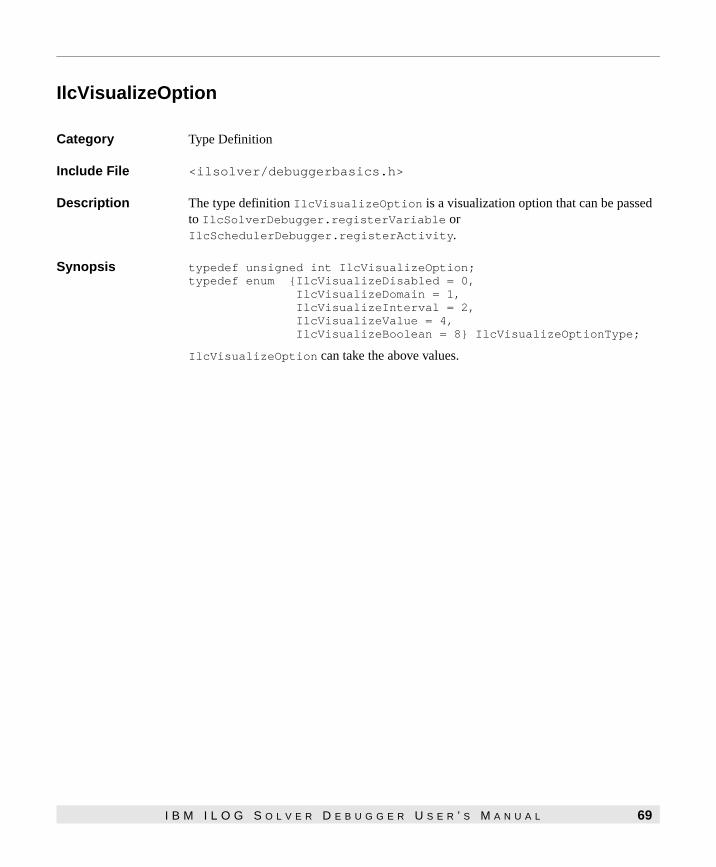
IlcVisualizeOption
Category Type Definition
Include File <ilsolver/debuggerbasics.h>
Description The type definition IlcVisualizeOption is a visualization option that can be passed to IlcSolverDebugger.registerVariable or IlcSchedulerDebugger.registerActivity.
Synopsis typedef unsigned int IlcVisualizeOption;typedef enum {IlcVisualizeDisabled = 0, IlcVisualizeDomain = 1, IlcVisualizeInterval = 2, IlcVisualizeValue = 4, IlcVisualizeBoolean = 8} IlcVisualizeOptionType;
IlcVisualizeOption can take the above values.
I B M I L O G S O L V E R D E B U G G E R U S E R ’ S M A N U A L 69

70 I B M I L O G S O L V E R D E B U G G E R U S E R ’ S M A N U A L
I N D E X
Index
A
Abort button 11Activity Domains 27adding breakpoints in your code 24application
connecting 9connecting remotely 10connecting two at the same time 10customizing 5, 6improving 38
B
backtracking 32beginNestedSearchTreeView member function
IlcDebugger Debugger C++ class 49boolean variable, displaying 25Break button 11breakExecution member function
IlcDebugger Debugger C++ class 49breakIfBound(IloFloatVar...) member function
IlcSolverDebugger Debugger C++ class 66breakIfBound(IloIntVar...) member function
IlcSolverDebugger Debugger C++ class 66breakIfDomainMaxLe(IloFloatVar...)
IlcSolverDebugger Debugger C++ class 66breakIfDomainMaxLe(IloIntVar...)
IlcSolverDebugger Debugger C++ class 66breakIfDomainMinGe(IloFloatVar...)
IlcSolverDebugger Debugger C++ class 66breakIfDomainMinGe(IloIntVar...)
IlcSolverDebugger Debugger C++ class 67breakpoints 14buttons
Abort 11Break 11Continue 11Continue Trace Till Next Node 11Decision Stack 12Inspect Current Node 12Propagation Spy 12Run 9, 11Step Into 11Step Out 11Step Over 11View Constraint Profiler 12View Search Tree 12
C
choice point 12, 43Christmas Tree
creating 29domain reduction 30interpreting 30number of propagation events 30visualizing 29
clean member functionIlcDrawingBoard C++ class 56
I B M I L O G S O L V E R D E B U G G E R U S E R ’ S M A N U A L 71

close member functionIlcDebugger Debugger C++ class 50
colorsDrawing Board 34event types 22node types 14Propagation Spy 22Variable Domains 26
commands to control the Debugger 11conditional breakpoints 24connecting
an application 9an application remotely 10two applications 10
constantInt member functionIlcDrawingBoard C++ class 56
constantNum member functionIlcDrawingBoard C++ class 56
Constraint Profilerdescription 30using 43
constraint statistics 31Continue button 11Continue Trace Till Next Node button 11customer support viiicustomizing your application
Scheduler C++ application 6Solver C++ application 5
D
Debuggercommands 11examples directory 2, 3Tree Inspector 29
debuggolomb exampledescription 3filter levels 9, 40Search Tree 13
debugjobshopm example 5, 35debuglsknight example 3debugnqueen example
Decision Stack 18description 3Drawing Board 32
Variable Domains 25debugpheasant example
description 5Initial Propagation 22
Decision Stack button 12Decision Stack docked panel 17decisions taken at a node 18displayResult member function
IlcAddOnDebugger Debugger C++ class 47IlcDebugger Debugger C++ class 50
distribution directories 2domain reduction 31drawArc member function
IlcDrawingBoard C++ class 56drawArrow member function
IlcDrawingBoard C++ class 56drawEllipse member function
IlcDrawingBoard C++ class 56drawFilledArc member function
IlcDrawingBoard C++ class 56drawFilledEllipse member function
IlcDrawingBoard C++ class 57drawFilledLabel member function
IlcDrawingBoard C++ class 57drawFilledPolygon member function
IlcDrawingBoard C++ class 57drawFilledRectangle member function
IlcDrawingBoard C++ class 58drawFilledRoundedRectangle member function
IlcDrawingBoard C++ class 58drawGrid member function
IlcDrawingBoard C++ class 58Drawing Board
advanced use 34basic use 32customizing colors 34example 35
Drawing Board class 53drawLabel member function
IlcDrawingBoard C++ class 58drawLine member function
IlcDrawingBoard C++ class 58drawPolyline member function
IlcDrawingBoard C++ class 58drawRectangle member function
72 I B M I L O G S O L V E R D E B U G G E R U S E R ’ S M A N U A L

IlcDrawingBoard C++ class 59drawRoundedRectangle member function
IlcDrawingBoard C++ class 59
E
endNestedSearchTreeView member functionIlcDebugger Debugger C++ class 50
eraseGraphic member functionIlcDrawingBoard C++ class 59
event types, colors 22examples
debuggolomb 3, 9, 13, 40debugjobshopm 5, 35debuglsknight 3debugnqueen 3, 18, 25, 32debugpheasant 5, 22description 3
examples directory 2, 3
G
Gantt chart 5, 19getImpl member function
IlcAddOnDebugger Debugger C++ class 47IlcDebugger Debugger C++ class 50
getSchedulerTrace member functionIlcSchedulerDebugger Debugger C++ class 64
getSolver member functionIlcSolverDebugger Debugger C++ class 67
GUIidle mode 9initializing mode 8
GUI installation 2
I
idle mode, Debugger GUI 9IlcAddOnDebugger Debugger C++ class
constructor 47, 49displayResult 47getImpl 47
IlcDebugger Debugger C++ class 49beginNestedSearchTreeView 49breakExecution 49
close 50constructor 49displayResult 50endNestedSearchTreeView 50getImpl 50isActive 50isAutomaticDisplay 50isConnected 50isTextual 50newSearchTreeView 50sendConsole 50sendSolution 50setAutomaticDisplay 51
IlcDrawingBoard C++ class 53clean 56constantInt 56constantNum 56constructor 55drawArc 56drawArrow 56drawEllipse 56drawFilledArc 56drawFilledEllipse 57drawFilledLabel 57drawFilledPolygon 57drawFilledRectangle 58drawFilledRoundedRectangle 58drawGrid 58drawLabel 58drawLine 58drawPolyline 58drawRectangle 59drawRoundedRectangle 59eraseGraphic 59makeArc 59makeArrow 59makeEllipse 59makeFilledArc 60makeFilledEllipse 60makeFilledLabel 60makeFilledPolygon 60makeFilledRectangle 60makeFilledRoundedRectangle 61makeGrid 61makeLabel 61
I B M I L O G S O L V E R D E B U G G E R U S E R ’ S M A N U A L 73
makeLine 61makeNewGraphicObject 61makePolyline 61makeRectangle 61makeRoundedRectangle 62setBackgroundColor 62
IlcSchedulerDebugger Debugger C++ classconstructor 63getSchedulerTrace 64registerActivity 64registerResource 64registerUnaryResourceArray 64setHorizon 64
IlcSolverDebugger Debugger C++ classbreakIfBound(IloFloatVar..) 66breakIfBound(IloIntVar...) 66breakIfDomainMaxLe(IloFloatVar...) 66breakIfDomainMaxLe(IloIntVar...) 66breakIfDomainMinGe(IloFloatVar...) 66breakIfDomainMinGe(IloIntVar...) 67constructor 66getSolver 67initialize 67registerConstraint 67registerVariable(IloBool...) 68registerVariable(IloFloatVar...) 67registerVariable(IloFloatVarArray...)
68registerVariable(IloIntVarArray...) 68
IlcVisualizeOption type definition 69improving your application 38include files
for Debugger with Scheduler 3for Debugger with Solver 2Scheduler C++ application 6Solver C++ application 5
initial propagation 30Initial Propagation, tracing 23initialize member function
IlcSolverDebugger Debugger C++ class 67initializing mode, Debugger GUI 8Inspect Current Node button 12installation
Debugger GUI 2online documentation 2
Scheduler examples 3Solver examples 2
installation directories 2integer variable
bounds 25, 26domain 25state 26value 25, 26
interpretingChristmas Tree 30right subtrees 38
isActive member functionIlcDebugger Debugger C++ class 50
isAutomaticDisplay member functionIlcDebugger Debugger C++ class 50
isConnected member functionIlcDebugger Debugger C++ class 50
isTextual member functionIlcDebugger Debugger C++ class 50
L
local search 19
M
makeArc member functionIlcDrawingBoard C++ class 59
makeArrow member functionIlcDrawingBoard C++ class 59
makeEllipse member functionIlcDrawingBoard C++ class 59
makeFilledArc member functionIlcDrawingBoard C++ class 60
makeFilledEllipse member functionIlcDrawingBoard C++ class 60
makeFilledLabel member functionIlcDrawingBoard C++ class 60
makeFilledPolygon member functionIlcDrawingBoard C++ class 60
makeFilledRectangle member functionIlcDrawingBoard C++ class 60
makeFilledRoundedRectangle member functionIlcDrawingBoard C++ class 61
makeGrid member function
74 I B M I L O G S O L V E R D E B U G G E R U S E R ’ S M A N U A L
IlcDrawingBoard C++ class 61makeLabel member function
IlcDrawingBoard C++ class 61makeLine member function
IlcDrawingBoard C++ class 61makeNewGraphicObject member function
IlcDrawingBoard C++ class 61makePolyline member function
IlcDrawingBoard C++ class 61makeRectangle member function
IlcDrawingBoard C++ class 61makeRoundedRectangle member function
IlcDrawingBoard C++ class 62mode selectors 15monitoring
local search 19nested search 20restart 19solution restoring 19
monitoring decisions 16Current Node Inspector docked panel 17Decision Stack docked panel 17Node Inspector dialog box 17Propagation Spy 17
N
nested search 20newSearchTreeView member function
IlcDebugger Debugger C++ class 50Node Inspector dialog box 14, 17node life cycle 14node types
colors 14root node 14status 14
O
online documentation 2
P
propagationevents 21, 31
statistics 29tracing at a specific node 23visualizing 21
Propagation Spybutton 12colors 22description 17event types 22using 21, 42
R
registerActivity member functionIlcSchedulerDebugger Debugger C++ class 64
registerConstraint member functionIlcSolverDebugger Debugger C++ class 67
registerResource member functionIlcSchedulerDebugger Debugger C++ class 64
registerUnaryResourceArray member functionIlcSchedulerDebugger Debugger C++ class 64
registerVariable(IloFloatVar...) m.f.IlcSolverDebugger Debugger C++ class 67
registerVariable(IloFloatVarArray...) m.f.IlcSolverDebugger Debugger C++ class 68
registerVariable(IloIntVar...) m.f.IlcSolverDebugger Debugger C++ class 68
registerVariable(IloIntVarArray...) m.f.IlcSolverDebugger Debugger C++ class 68
remote connection 10restart 19right subtrees, interpreting 38root node 14Run button 9, 11
S
Search Treedescription 13ideal shape 38mode selectors 15node inspector 14, 17
sendConsole member functionIlcDebugger Debugger C++ class 50
sendSolution member functionIlcDebugger Debugger C++ class 50
I B M I L O G S O L V E R D E B U G G E R U S E R ’ S M A N U A L 75

setAutomaticDisplay member functionIlcDebugger Debugger C++ class 51
setBackgroundColor member functionIlcDrawingBoard C++ class 62
setHorizon member functionIlcSchedulerDebugger Debugger C++ class 64
solution restoring 19Solver Debugger
C++ libraries 1starting the GUI 8
starting Solver Debugger 8statistics
for a constraint 31propagation 29
Step Into button 11Step Out button 11Step Over button 11support
customer viii
T
tool barexecution 11standard 11
tracingInitial Propagation 23propagation at a specific node 23propagation events 21
Tree Inspector 29type definition IlcVisualizeOption 69
V
Variable Domainscolors 26disabling visualization 25displaying Boolean variables 25integer variable bounds 25, 26integer variable domain 25integer variable value 25, 26setting visualization options 24state of integer variable interpreted as Boolean 26visualizing 25
View Constraint Profiler button 12
View Search Tree button 12visualizing
Activity Domains 27both propagation events and search 29propagation 21search 12Variable Domains 25
76 I B M I L O G S O L V E R D E B U G G E R U S E R ’ S M A N U A L


![Model-Driven Constraint Programming · 2021. 1. 16. · (e.g. C++ in ILOG Solver [26] or Java in Gecode/J [12]) and even term rewriting [11]. It turns out that the programming task](https://img.pdfslide.us/doc/110x75/60dd7818bf9b3547cc043688/model-driven-constraint-programming-2021-1-16-eg-c-in-ilog-solver-26.jpg)


![Handbook of Constraint Programming - Uni Ulm...Ilog Solver [57] is a C++ library implementing a finite domain solver and is thus a natural example of an objec t-oriented embodiment](https://img.pdfslide.us/doc/110x75/60dd7fb0e6b69266b22de5b4/handbook-of-constraint-programming-uni-ilog-solver-57-is-a-c-library-implementing.jpg)