Embed Size (px)
Citation preview
ibm.com/redbooks
IBM Certification Study GuideAIX Performance andSystem Tuning
Thomas C. CederlöfAndré de KlerkThomas Herlin
Tomasz Ostaszewski
Developed specifically for the purpose of preparing for AIX certification
Makes an excellent companion to classroom education
For experienced AIX professionals

IBM Certification Study GuideAIX Performance andSystem Tuning
December 2000
SG24-6184-00
International Technical Support Organization
© Copyright International Business Machines Corporation 2000. All rights reserved.Note to U.S Government Users – Documentation related to restricted rights – Use, duplication or disclosure is subject to restrictions set forth in GSA ADP Schedule Contract with IBM Corp.
First Edition (December 2000)
This edition applies to AIX Version 4.3 (5765-C34) and subsequent releases running on an RS/6000 or pSeries server.
This document was updated on July 16, 2001.
Comments may be addressed to:IBM Corporation, International Technical Support OrganizationDept. JN9B Building 003 Internal Zip 283411400 Burnet RoadAustin, Texas 78758-3493
When you send information to IBM, you grant IBM a non-exclusive right to use or distribute the information in any way it believes appropriate without incurring any obligation to you.
Before using this information and the product it supports, be sure to read the general information in Appendix D, “Special notices” on page 263.
Take Note!
Contents
Figures . . . . . . . . . . . . . . . . . . . . . . . . . . . . . . . . . . . . . . . . . . . . . . . . . . . .ix
Tables. . . . . . . . . . . . . . . . . . . . . . . . . . . . . . . . . . . . . . . . . . . . . . . . . . . . .xi
Preface . . . . . . . . . . . . . . . . . . . . . . . . . . . . . . . . . . . . . . . . . . . . . . . . . . . xiiiThe team that wrote this redbook. . . . . . . . . . . . . . . . . . . . . . . . . . . . . . . . . . . xivComments welcome. . . . . . . . . . . . . . . . . . . . . . . . . . . . . . . . . . . . . . . . . . . . . xv
Chapter 1. Certification overview . . . . . . . . . . . . . . . . . . . . . . . . . . . . . . 11.1 IBM Certified Advanced Technical Expert - RS/6000 AIX . . . . . . . . . . . 1
1.1.1 Required prerequisite . . . . . . . . . . . . . . . . . . . . . . . . . . . . . . . . . . 11.1.2 Recommended prerequisite . . . . . . . . . . . . . . . . . . . . . . . . . . . . . 11.1.3 Registration for the certification exam. . . . . . . . . . . . . . . . . . . . . . 11.1.4 Core requirement (select three of the following tests) . . . . . . . . . . 2
1.2 Certification education courses . . . . . . . . . . . . . . . . . . . . . . . . . . . . . 161.3 Education on CD-ROM: IBM AIX Essentials . . . . . . . . . . . . . . . . . . . . 17
Chapter 2. Performance tuning - getting started . . . . . . . . . . . . . . . . . 192.1 Introduction to concepts . . . . . . . . . . . . . . . . . . . . . . . . . . . . . . . . . . . 192.2 CPU performance overview . . . . . . . . . . . . . . . . . . . . . . . . . . . . . . . . 212.3 Memory performance overview. . . . . . . . . . . . . . . . . . . . . . . . . . . . . . 272.4 Disk I/O performance overview. . . . . . . . . . . . . . . . . . . . . . . . . . . . . . 352.5 Network performance overview . . . . . . . . . . . . . . . . . . . . . . . . . . . . . 422.6 Summary . . . . . . . . . . . . . . . . . . . . . . . . . . . . . . . . . . . . . . . . . . . . . . 452.7 Quiz . . . . . . . . . . . . . . . . . . . . . . . . . . . . . . . . . . . . . . . . . . . . . . . . . . 46
2.7.1 Answers . . . . . . . . . . . . . . . . . . . . . . . . . . . . . . . . . . . . . . . . . . . 46
Chapter 3. CPU and memory performance monitoring tools . . . . . . . . 473.1 The sar command . . . . . . . . . . . . . . . . . . . . . . . . . . . . . . . . . . . . . . . 47
3.1.1 Examples of using the sar command . . . . . . . . . . . . . . . . . . . . . 473.1.2 The sar command summary . . . . . . . . . . . . . . . . . . . . . . . . . . . . 513.1.3 The sadc command . . . . . . . . . . . . . . . . . . . . . . . . . . . . . . . . . . 593.1.4 The sa1 and sa2 commands. . . . . . . . . . . . . . . . . . . . . . . . . . . . 59
3.2 The vmstat command . . . . . . . . . . . . . . . . . . . . . . . . . . . . . . . . . . . . . 603.3 The ps command . . . . . . . . . . . . . . . . . . . . . . . . . . . . . . . . . . . . . . . . 68
3.3.1 Use of the ps command in a CPU usage study . . . . . . . . . . . . . . 693.3.2 Use of the ps command in a memory usage study . . . . . . . . . . . 71
3.4 The tprof command . . . . . . . . . . . . . . . . . . . . . . . . . . . . . . . . . . . . . . 733.4.1 Using the tprof general report . . . . . . . . . . . . . . . . . . . . . . . . . . . 743.4.2 Using tprof on a program . . . . . . . . . . . . . . . . . . . . . . . . . . . . . . 76
3.5 The svmon command . . . . . . . . . . . . . . . . . . . . . . . . . . . . . . . . . . . . . 77
© Copyright IBM Corp. 2000 iii
3.5.1 The svmon global report . . . . . . . . . . . . . . . . . . . . . . . . . . . . . . . 773.5.2 The svmon user report . . . . . . . . . . . . . . . . . . . . . . . . . . . . . . . . 803.5.3 The svmon process report . . . . . . . . . . . . . . . . . . . . . . . . . . . . . 833.5.4 The svmon segment report . . . . . . . . . . . . . . . . . . . . . . . . . . . . . 853.5.5 The svmon detailed segment report . . . . . . . . . . . . . . . . . . . . . . 883.5.6 The svmon command report . . . . . . . . . . . . . . . . . . . . . . . . . . . . 903.5.7 The svmon Workload Manager class report . . . . . . . . . . . . . . . . 923.5.8 The svmon command flags . . . . . . . . . . . . . . . . . . . . . . . . . . . . . 94
3.6 The topas command. . . . . . . . . . . . . . . . . . . . . . . . . . . . . . . . . . . . . . 973.7 The emstat command. . . . . . . . . . . . . . . . . . . . . . . . . . . . . . . . . . . . 1003.8 Quiz . . . . . . . . . . . . . . . . . . . . . . . . . . . . . . . . . . . . . . . . . . . . . . . . . 102
3.8.1 Answers . . . . . . . . . . . . . . . . . . . . . . . . . . . . . . . . . . . . . . . . . . 1053.9 Exercises . . . . . . . . . . . . . . . . . . . . . . . . . . . . . . . . . . . . . . . . . . . . . 106
Chapter 4. Disk I/O performance monitoring tools . . . . . . . . . . . . . . . 1074.1 Overview . . . . . . . . . . . . . . . . . . . . . . . . . . . . . . . . . . . . . . . . . . . . . 1074.2 The iostat command . . . . . . . . . . . . . . . . . . . . . . . . . . . . . . . . . . . . . 108
4.2.1 Historical disk I/O . . . . . . . . . . . . . . . . . . . . . . . . . . . . . . . . . . . 1104.2.2 TTY and CPU utilization report . . . . . . . . . . . . . . . . . . . . . . . . . 1114.2.3 The iostat command on SMP systems . . . . . . . . . . . . . . . . . . . 1134.2.4 Disk utilization report . . . . . . . . . . . . . . . . . . . . . . . . . . . . . . . . 113
4.3 The lockstat command . . . . . . . . . . . . . . . . . . . . . . . . . . . . . . . . . . . 1154.4 LVM performance analysis using lslv . . . . . . . . . . . . . . . . . . . . . . . . 118
4.4.1 Logical volume attributes . . . . . . . . . . . . . . . . . . . . . . . . . . . . . 1184.4.2 Logical volume fragmentation . . . . . . . . . . . . . . . . . . . . . . . . . . 1224.4.3 Logical volume allocation . . . . . . . . . . . . . . . . . . . . . . . . . . . . . 1234.4.4 Highest LVM performance . . . . . . . . . . . . . . . . . . . . . . . . . . . . 125
4.5 LVM and file system monitoring . . . . . . . . . . . . . . . . . . . . . . . . . . . . 1254.5.1 The filemon command . . . . . . . . . . . . . . . . . . . . . . . . . . . . . . . 1254.5.2 Report analysis. . . . . . . . . . . . . . . . . . . . . . . . . . . . . . . . . . . . . 1274.5.3 Typical AIX system behavior. . . . . . . . . . . . . . . . . . . . . . . . . . . 133
4.6 File system performance . . . . . . . . . . . . . . . . . . . . . . . . . . . . . . . . . 1344.6.1 AIX file system organization . . . . . . . . . . . . . . . . . . . . . . . . . . . 1344.6.2 The fileplace command. . . . . . . . . . . . . . . . . . . . . . . . . . . . . . . 1354.6.3 File system de-fragmentation . . . . . . . . . . . . . . . . . . . . . . . . . . 138
4.7 General recommendations on I/O performance . . . . . . . . . . . . . . . . 1384.8 Overhead of using performance tools . . . . . . . . . . . . . . . . . . . . . . . . 1404.9 Command summary . . . . . . . . . . . . . . . . . . . . . . . . . . . . . . . . . . . . . 141
4.9.1 The filemon command . . . . . . . . . . . . . . . . . . . . . . . . . . . . . . . 1414.9.2 The fileplace command. . . . . . . . . . . . . . . . . . . . . . . . . . . . . . . 1424.9.3 The lslv command . . . . . . . . . . . . . . . . . . . . . . . . . . . . . . . . . . 142
4.10 Quiz . . . . . . . . . . . . . . . . . . . . . . . . . . . . . . . . . . . . . . . . . . . . . . . . 1434.10.1 Answers . . . . . . . . . . . . . . . . . . . . . . . . . . . . . . . . . . . . . . . . . 147
iv IBM Certification Study Guide AIX Performance and System Tuning
4.11 Exercises . . . . . . . . . . . . . . . . . . . . . . . . . . . . . . . . . . . . . . . . . . . . 147
Chapter 5. Network performance tools . . . . . . . . . . . . . . . . . . . . . . . . 1495.1 Overview . . . . . . . . . . . . . . . . . . . . . . . . . . . . . . . . . . . . . . . . . . . . . 1495.2 Adapter transmit and receive queue tuning . . . . . . . . . . . . . . . . . . . 1515.3 Protocols tuning . . . . . . . . . . . . . . . . . . . . . . . . . . . . . . . . . . . . . . . . 1535.4 Network performance monitoring tools . . . . . . . . . . . . . . . . . . . . . . . 155
5.4.1 The vmstat command . . . . . . . . . . . . . . . . . . . . . . . . . . . . . . . . 1555.4.2 The ping command . . . . . . . . . . . . . . . . . . . . . . . . . . . . . . . . . . 1565.4.3 The traceroute command . . . . . . . . . . . . . . . . . . . . . . . . . . . . . 1565.4.4 The netstat command . . . . . . . . . . . . . . . . . . . . . . . . . . . . . . . . 1565.4.5 The netpmon command . . . . . . . . . . . . . . . . . . . . . . . . . . . . . . 1595.4.6 The tcpdump and iptrace commands . . . . . . . . . . . . . . . . . . . . 161
5.5 Network performance management tools . . . . . . . . . . . . . . . . . . . . . 1635.6 Name resolution . . . . . . . . . . . . . . . . . . . . . . . . . . . . . . . . . . . . . . . . 1655.7 NFS performance tuning . . . . . . . . . . . . . . . . . . . . . . . . . . . . . . . . . 165
5.7.1 NFS server-side performance . . . . . . . . . . . . . . . . . . . . . . . . . . 1655.7.2 NFS client-side performance . . . . . . . . . . . . . . . . . . . . . . . . . . 1685.7.3 Mount options. . . . . . . . . . . . . . . . . . . . . . . . . . . . . . . . . . . . . . 168
5.8 Command summary . . . . . . . . . . . . . . . . . . . . . . . . . . . . . . . . . . . . . 1695.8.1 The netstat command . . . . . . . . . . . . . . . . . . . . . . . . . . . . . . . . 1695.8.2 The tcpdump command . . . . . . . . . . . . . . . . . . . . . . . . . . . . . . 1705.8.3 The iptrace command . . . . . . . . . . . . . . . . . . . . . . . . . . . . . . . . 1715.8.4 The ipreport command . . . . . . . . . . . . . . . . . . . . . . . . . . . . . . . 171
5.9 Quiz . . . . . . . . . . . . . . . . . . . . . . . . . . . . . . . . . . . . . . . . . . . . . . . . . 1715.9.1 Answers . . . . . . . . . . . . . . . . . . . . . . . . . . . . . . . . . . . . . . . . . . 174
5.10 Exercises . . . . . . . . . . . . . . . . . . . . . . . . . . . . . . . . . . . . . . . . . . . . 174
Chapter 6. Performance management tools . . . . . . . . . . . . . . . . . . . . 1776.1 The AIX scheduler . . . . . . . . . . . . . . . . . . . . . . . . . . . . . . . . . . . . . . 177
6.1.1 Priority calculation on AIX versions prior to 4.3.2 . . . . . . . . . . . 1796.1.2 Priority calculation on AIX Version 4.3.2 and later . . . . . . . . . . 182
6.2 Multiple run queues with load balancing in AIX Version 4.3.3 . . . . . . 1846.2.1 Initial load balancing . . . . . . . . . . . . . . . . . . . . . . . . . . . . . . . . . 1856.2.2 Idle load balancing . . . . . . . . . . . . . . . . . . . . . . . . . . . . . . . . . . 1856.2.3 Frequent periodic load balancing . . . . . . . . . . . . . . . . . . . . . . . 1866.2.4 Infrequent periodic load balancing . . . . . . . . . . . . . . . . . . . . . . 186
6.3 Scheduler performance management . . . . . . . . . . . . . . . . . . . . . . . . 1866.3.1 The schedtune command . . . . . . . . . . . . . . . . . . . . . . . . . . . . . 1866.3.2 The nice and renice commands . . . . . . . . . . . . . . . . . . . . . . . . 189
6.4 The bindprocessor command . . . . . . . . . . . . . . . . . . . . . . . . . . . . . . 1926.5 The vmtune command . . . . . . . . . . . . . . . . . . . . . . . . . . . . . . . . . . . 1936.6 Workload Manager . . . . . . . . . . . . . . . . . . . . . . . . . . . . . . . . . . . . . . 198
v
6.7 Quiz . . . . . . . . . . . . . . . . . . . . . . . . . . . . . . . . . . . . . . . . . . . . . . . . . 1996.7.1 Answers . . . . . . . . . . . . . . . . . . . . . . . . . . . . . . . . . . . . . . . . . . 200
6.8 Exercise . . . . . . . . . . . . . . . . . . . . . . . . . . . . . . . . . . . . . . . . . . . . . . 200
Chapter 7. Performance scenario walkthroughs . . . . . . . . . . . . . . . . 2017.1 CPU performance scenario . . . . . . . . . . . . . . . . . . . . . . . . . . . . . . . 201
7.1.1 Data collection . . . . . . . . . . . . . . . . . . . . . . . . . . . . . . . . . . . . . 2017.1.2 Data analysis . . . . . . . . . . . . . . . . . . . . . . . . . . . . . . . . . . . . . . 2027.1.3 Recommendation . . . . . . . . . . . . . . . . . . . . . . . . . . . . . . . . . . . 203
7.2 I/O performance scenario . . . . . . . . . . . . . . . . . . . . . . . . . . . . . . . . . 2047.2.1 Data collection . . . . . . . . . . . . . . . . . . . . . . . . . . . . . . . . . . . . . 2047.2.2 Data analysis . . . . . . . . . . . . . . . . . . . . . . . . . . . . . . . . . . . . . . 2067.2.3 Recommendation . . . . . . . . . . . . . . . . . . . . . . . . . . . . . . . . . . . 207
7.3 Additional I/O scenarios . . . . . . . . . . . . . . . . . . . . . . . . . . . . . . . . . . 2077.3.1 CPU and kernel thread I/O wait bottleneck scenario . . . . . . . . . 2077.3.2 I/O distribution bottleneck scenario . . . . . . . . . . . . . . . . . . . . . . 2097.3.3 Logical volume fragmentation scenario. . . . . . . . . . . . . . . . . . . 2107.3.4 Monitoring scenario using filemon . . . . . . . . . . . . . . . . . . . . . . 2117.3.5 Logical volume allocation scenario . . . . . . . . . . . . . . . . . . . . . . 212
7.4 Paging performance scenario . . . . . . . . . . . . . . . . . . . . . . . . . . . . . . 2157.4.1 Data collection . . . . . . . . . . . . . . . . . . . . . . . . . . . . . . . . . . . . . 2157.4.2 Data analysis . . . . . . . . . . . . . . . . . . . . . . . . . . . . . . . . . . . . . . 2217.4.3 Recommendation . . . . . . . . . . . . . . . . . . . . . . . . . . . . . . . . . . . 224
Chapter 8. Scenario assessment quiz . . . . . . . . . . . . . . . . . . . . . . . . . 2258.1 Scenario one . . . . . . . . . . . . . . . . . . . . . . . . . . . . . . . . . . . . . . . . . . 225
8.1.1 Answers . . . . . . . . . . . . . . . . . . . . . . . . . . . . . . . . . . . . . . . . . . 2268.2 Scenario two . . . . . . . . . . . . . . . . . . . . . . . . . . . . . . . . . . . . . . . . . . 227
8.2.1 Answers . . . . . . . . . . . . . . . . . . . . . . . . . . . . . . . . . . . . . . . . . . 236
Appendix A. The error log . . . . . . . . . . . . . . . . . . . . . . . . . . . . . . . . . . . . 237A.1 Overview . . . . . . . . . . . . . . . . . . . . . . . . . . . . . . . . . . . . . . . . . . . . . . . . . 237A.2 Managing the error log . . . . . . . . . . . . . . . . . . . . . . . . . . . . . . . . . . . . . . 238
A.2.1 Configuring error log . . . . . . . . . . . . . . . . . . . . . . . . . . . . . . . . . . . . 238A.2.2 Clearing the error log . . . . . . . . . . . . . . . . . . . . . . . . . . . . . . . . . . . 239
A.3 Reading error logs in details . . . . . . . . . . . . . . . . . . . . . . . . . . . . . . . . . . 240A.3.1 The errpt command output . . . . . . . . . . . . . . . . . . . . . . . . . . . . . . . 241A.3.2 Formatted output from errpt command . . . . . . . . . . . . . . . . . . . . . . 242
A.4 Command summary . . . . . . . . . . . . . . . . . . . . . . . . . . . . . . . . . . . . . . . . 244A.4.1 The errpt command . . . . . . . . . . . . . . . . . . . . . . . . . . . . . . . . . . . . 244
A.5 Quiz. . . . . . . . . . . . . . . . . . . . . . . . . . . . . . . . . . . . . . . . . . . . . . . . . . . . . 246A.5.1 Answers . . . . . . . . . . . . . . . . . . . . . . . . . . . . . . . . . . . . . . . . . . . . . 246
A.6 Exercises . . . . . . . . . . . . . . . . . . . . . . . . . . . . . . . . . . . . . . . . . . . . . . . . 246
vi IBM Certification Study Guide AIX Performance and System Tuning
Appendix B. Installing the performance tools . . . . . . . . . . . . . . . . . . . . 247B.1 Command summary . . . . . . . . . . . . . . . . . . . . . . . . . . . . . . . . . . . . . . . . 254
B.1.1 The installp command. . . . . . . . . . . . . . . . . . . . . . . . . . . . . . . . . . . 254B.1.2 The lslpp command . . . . . . . . . . . . . . . . . . . . . . . . . . . . . . . . . . . . 256B.1.3 The lppchk command . . . . . . . . . . . . . . . . . . . . . . . . . . . . . . . . . . . 256
B.2 Quiz. . . . . . . . . . . . . . . . . . . . . . . . . . . . . . . . . . . . . . . . . . . . . . . . . . . . . 257B.2.1 Answers . . . . . . . . . . . . . . . . . . . . . . . . . . . . . . . . . . . . . . . . . . . . . 259
B.3 Exercises . . . . . . . . . . . . . . . . . . . . . . . . . . . . . . . . . . . . . . . . . . . . . . . . 259
Appendix C. Using the additional material . . . . . . . . . . . . . . . . . . . . . . 261C.1 Locating the additional material on the Internet . . . . . . . . . . . . . . . . . . . 261C.2 Using the Web material . . . . . . . . . . . . . . . . . . . . . . . . . . . . . . . . . . . . . 261
C.2.1 System requirements for downloading the Web material . . . . . . . . 261C.2.2 How to use the Web material . . . . . . . . . . . . . . . . . . . . . . . . . . . . . 261
Appendix D. Special notices . . . . . . . . . . . . . . . . . . . . . . . . . . . . . . . . . . 263
Appendix E. Related publications . . . . . . . . . . . . . . . . . . . . . . . . . . . . . . 267E.1 IBM Redbooks . . . . . . . . . . . . . . . . . . . . . . . . . . . . . . . . . . . . . . . . . . . . 267E.2 IBM Redbooks collections. . . . . . . . . . . . . . . . . . . . . . . . . . . . . . . . . . . . 267E.3 Other resources . . . . . . . . . . . . . . . . . . . . . . . . . . . . . . . . . . . . . . . . . . . 268E.4 Referenced Web sites. . . . . . . . . . . . . . . . . . . . . . . . . . . . . . . . . . . . . . . 268
How to get IBM Redbooks . . . . . . . . . . . . . . . . . . . . . . . . . . . . . . . . . . 271IBM Redbooks fax order form . . . . . . . . . . . . . . . . . . . . . . . . . . . . . . . . . . . . 272
Abbreviations and acronyms . . . . . . . . . . . . . . . . . . . . . . . . . . . . . . . . 273
Index . . . . . . . . . . . . . . . . . . . . . . . . . . . . . . . . . . . . . . . . . . . . . . . . . . . 279
IBM Redbooks review . . . . . . . . . . . . . . . . . . . . . . . . . . . . . . . . . . . . . . 289
vii

viii IBM Certification Study Guide AIX Performance and System Tuning
Figures
1. AIX and UNIX education roadmap. . . . . . . . . . . . . . . . . . . . . . . . . . . . . . . 162. Certification roadmaps . . . . . . . . . . . . . . . . . . . . . . . . . . . . . . . . . . . . . . . . 173. General performance tuning flowchart. . . . . . . . . . . . . . . . . . . . . . . . . . . . 214. Process state . . . . . . . . . . . . . . . . . . . . . . . . . . . . . . . . . . . . . . . . . . . . . . . 225. VMM segments from a client perspective . . . . . . . . . . . . . . . . . . . . . . . . . 276. VMM segments from a process perspective . . . . . . . . . . . . . . . . . . . . . . . 297. VMM memory registers . . . . . . . . . . . . . . . . . . . . . . . . . . . . . . . . . . . . . . . 308. Logical volume device driver . . . . . . . . . . . . . . . . . . . . . . . . . . . . . . . . . . . 369. Dependencies in a volume group . . . . . . . . . . . . . . . . . . . . . . . . . . . . . . . 3710. Network parameters. . . . . . . . . . . . . . . . . . . . . . . . . . . . . . . . . . . . . . . . . . 4311. Performance tuning flowchart . . . . . . . . . . . . . . . . . . . . . . . . . . . . . . . . . . 4512. topas command output . . . . . . . . . . . . . . . . . . . . . . . . . . . . . . . . . . . . . . . 9813. Disk, LVM and file system levels . . . . . . . . . . . . . . . . . . . . . . . . . . . . . . . 10714. SMIT screen for changing characteristics of operating system . . . . . . . . 11015. LVM intra-disk positions. . . . . . . . . . . . . . . . . . . . . . . . . . . . . . . . . . . . . . 12116. JFS organization . . . . . . . . . . . . . . . . . . . . . . . . . . . . . . . . . . . . . . . . . . . 13517. UDP/TCP/IP data flow . . . . . . . . . . . . . . . . . . . . . . . . . . . . . . . . . . . . . . . 15118. Run queue prior to AIX Version 4.3.3 . . . . . . . . . . . . . . . . . . . . . . . . . . . 18019. AIX Version 4, 128 run queues . . . . . . . . . . . . . . . . . . . . . . . . . . . . . . . . 18120. Run queue on AIX Version 4.3.3 . . . . . . . . . . . . . . . . . . . . . . . . . . . . . . . 18421. CPU penalty example . . . . . . . . . . . . . . . . . . . . . . . . . . . . . . . . . . . . . . . 18822. The ps command output . . . . . . . . . . . . . . . . . . . . . . . . . . . . . . . . . . . . . 22723. The vmstat command output . . . . . . . . . . . . . . . . . . . . . . . . . . . . . . . . . . 22824. The iostat command output . . . . . . . . . . . . . . . . . . . . . . . . . . . . . . . . . . . 22825. The netstat command output . . . . . . . . . . . . . . . . . . . . . . . . . . . . . . . . . . 22926. The vmstat and iostat command outputs . . . . . . . . . . . . . . . . . . . . . . . . . 23127. smitty errpt output . . . . . . . . . . . . . . . . . . . . . . . . . . . . . . . . . . . . . . . . . . 24028. smitty list_software output . . . . . . . . . . . . . . . . . . . . . . . . . . . . . . . . . . . . 25129. smitty install_all . . . . . . . . . . . . . . . . . . . . . . . . . . . . . . . . . . . . . . . . . . . . 252
© Copyright IBM Corp. 2000 ix

x IBM Certification Study Guide AIX Performance and System Tuning
Tables
1. Hardware resources and logical resources . . . . . . . . . . . . . . . . . . . . . . . . 202. Processes and threads . . . . . . . . . . . . . . . . . . . . . . . . . . . . . . . . . . . . . . . 233. VMM related output from the vmstat command . . . . . . . . . . . . . . . . . . . . . 334. Commonly used flags of the sar command . . . . . . . . . . . . . . . . . . . . . . . . 525. CPU related ps output . . . . . . . . . . . . . . . . . . . . . . . . . . . . . . . . . . . . . . . . 696. Memory related ps output . . . . . . . . . . . . . . . . . . . . . . . . . . . . . . . . . . . . . 717. Commonly used flags of the svmon command . . . . . . . . . . . . . . . . . . . . . 948. Commonly used flags of the iostat command . . . . . . . . . . . . . . . . . . . . . 1089. Commonly used flags of the lockstat command . . . . . . . . . . . . . . . . . . . 11610. Commonly used flags of the filemon command . . . . . . . . . . . . . . . . . . . . 14111. Commonly used flags of the fileplace command . . . . . . . . . . . . . . . . . . . 14212. Commonly used flags of the filemon command . . . . . . . . . . . . . . . . . . . . 14313. Commonly used flags of the netstat command . . . . . . . . . . . . . . . . . . . . 17014. Commonly used flags of the tcpdump command. . . . . . . . . . . . . . . . . . . 17015. Commonly used flags of the iptrace command . . . . . . . . . . . . . . . . . . . . 17116. Commonly used flags of the ipreport command . . . . . . . . . . . . . . . . . . . 17117. Commonly used flags of the schedtune command . . . . . . . . . . . . . . . . . 18918. Commonly used flags of the nice command . . . . . . . . . . . . . . . . . . . . . . 19219. Commonly used flags of the renice command. . . . . . . . . . . . . . . . . . . . . 19220. Commonly used flags of the vmtune command . . . . . . . . . . . . . . . . . . . 19521. Commonly used flags of the errpt command . . . . . . . . . . . . . . . . . . . . . . 24522. Performance tools overview. . . . . . . . . . . . . . . . . . . . . . . . . . . . . . . . . . . 24723. Performance toolbox releases . . . . . . . . . . . . . . . . . . . . . . . . . . . . . . . . . 24824. General installp summary . . . . . . . . . . . . . . . . . . . . . . . . . . . . . . . . . . . . 25525. Commonly used flags of the lslpp command . . . . . . . . . . . . . . . . . . . . . . 25626. Commonly used flags of the lppchk command . . . . . . . . . . . . . . . . . . . . 256
© Copyright IBM Corp. 2000 xi

xii IBM Certification Study Guide AIX Performance and System Tuning
Preface
The AIX and RS/6000 certifications, offered through the Professional Certification Program from IBM are designed to validate the skills required of technical professionals who work in the powerful, and often complex, environments of the AIX operating system and RS/6000 and pSeries servers. A complete set of professional certifications are available. They include:
• IBM Certified AIX User • IBM Certified Specialist - AIX System Administration • IBM Certified Specialist - AIX System Support • IBM Certified Specialist - AIX HACMP • IBM Certified Specialist - Business Intelligence for RS/6000 • IBM Certified Specialist - Domino for RS/6000 • IBM Certified Specialist - RS/6000 Solution Sales • IBM Certified Specialist - RS/6000 SP and PSSP V3 • IBM Certified Specialist - RS/6000 SP • RS/6000 SP - Sales Qualification • IBM Certified Specialist - Web Server for RS/6000 • IBM Certified Advanced Technical Expert - RS/6000 AIX
Each certification is developed by following a thorough and rigorous process to ensure the exam is applicable to the job role and is a meaningful and appropriate assessment of skill. Subject matter experts who successfully perform the job participate throughout the entire development process. They bring a wealth of experience into the development process, making the exams much more meaningful than the typical test that only captures classroom knowledge and ensuring the exams are relevant to the real world. Thanks to their effort, the test content is both useful and valid. The result of this certification is the value of appropriate measurements of the skills required to perform the job role.
This IBM Redbook is designed as a study guide for professionals wishing to prepare for the AIX Performance and System Tuning certification exam as a selected course of study in order to achieve the IBM Certified Advanced Technical Expert - RS/6000 AIX certification.
This IBM Redbook is designed to provide a combination of theory and practical experience needed for a general understanding of the subject matter. It also provides sample questions that will help in the evaluation of personal progress and provide familiarity with the types of questions that will be encountered in the exam.
© Copyright IBM Corp. 2000 xiii
This publication does not replace practical experience or is designed to be a stand-alone guide for any subject. Instead, it is an effective tool that, when combined with education activities and experience, can be a very useful preparation guide for the exam.
For additional information about certification and instructions on How to Register for an exam, call IBM at 1-800-426-8322 or visit the Web site at: http://www.ibm.com/certify
The team that wrote this redbook
This redbook was produced by a team of specialists from around the world working at the International Technical Support Organization, Austin Center.
Thomas C. Cederlöf is an Education Specialist at IBM Learning Services in Sweden. After working various professions, he was hired as a System Support Specialist in April 1997 at the Nordic AIX Competence Center. After earning his Advanced Technical Expert Certification in 1998, he worked with level 2 support in Scandinavia and the Baltic States and also participated in the itrans program in 1999. Since January 2000, he has been the main instructor for the AIX curriculum in Sweden.
André de Klerk is a Senior IT Specialist at IBM Global Services in South Africa. He has been working for IBM since May 1996. He started his career as a field technician in 1991 and has performed various support roles, including application support and customer consulting. Currently, he is team leader for the Midrange UNIX team at IGS SA.
Thomas Herlin is an Advisory IT Specialist at IBM Global Services in Denmark. He has been working for IBM since May 1998. Before joining IBM, he worked as a Software Engineer designing and developing programs on UNIX platforms. His areas of expertise include system architecture and system integration of AIX-based solutions. He is also a certified SAP technical consultant.
Tomasz Ostaszewski is a computer network architect. He works for Prokom Software SA in Poland - IBM Business Partner. Prokom is the largest IT solution provider in Poland. They offer total solutions, which include application development or third party vendor support. He has three years of experience in RS/6000 and AIX. Currently, he is working on a network project for an insurance company.
xiv IBM Certification Study Guide AIX Performance and System Tuning
The project that produced this publication was managed by:
Scott Vetter IBM Austin
Special thanks to:
Darin Hartman Program Manager, AIX Certification
Thanks to the following people for their invaluable contributions to this project:
Jesse Alcantar IBM Austin
Greg Althaus IBM Austin
Stephen Atkins IBM U.K.
Karl Borman ILS Austin
Larry Brenner IBM Austin
Malin Cederberg ILS Sweden
Greg Flaig IBM Austin
John Hance IBM Australia
Adnan Ikram IBM Pakistan
Peter Mayes IBM U.K.
Shawn Mullen IBM Austin
Brian Nicholls IBM Austin
Robert Olsson ILS Sweden
Michelle Page-Rivera IBM Atlanta
Christopher Snell IBM Raleigh
Tony Steel IBM Australia
Wade Wallace IBM Austin
Comments welcome
Your comments are important to us!
We want our redbooks to be as helpful as possible. Please send us your comments about this or other redbooks in one of the following ways:
• Fax the evaluation form found in “IBM Redbooks review” on page 289 to the fax number shown on the form.
• Use the online evaluation form found at ibm.com/redbooks
xv

• Send your comments in an Internet note to [email protected]
xvi IBM Certification Study Guide AIX Performance and System Tuning
Chapter 1. Certification overview
This chapter provides an overview of the skill requirements needed to obtain an IBM AIX Specialist certification. The following chapters are designed to provide a comprehensive review of specific topics that are essential for obtaining the certification.
1.1 IBM Certified Advanced Technical Expert - RS/6000 AIX
This level certifies an advanced level of AIX knowledge and understanding, both in breadth and depth. It verifies the ability to perform in-depth analysis, apply complex AIX concepts, and provide resolution to critical problems, all in a variety of areas within RS/6000 AIX.
To attain the IBM Certified Advanced Technical Expert - RS/6000 AIX certification, you must pass four tests.
One test is the prerequisite in either AIX System Administration or AIX System Support. The other three tests are selected from a variety of AIX and RS/6000 topics. These requirements are explained in greater detail in the sections that follow.
1.1.1 Required prerequisite Prior to attaining the IBM Certified Advanced Technical Expert - RS/6000 AIX certification, you must be certified as either an:
• IBM Certified Specialist - AIX System Administration
or
• IBM Certified Specialist - AIX System Support
1.1.2 Recommended prerequisite A minimum of six to twelve months experience in performing in-depth analysis and applying complex AIX concepts in a variety of areas within RS/6000 AIX is a recommended prerequisite.
1.1.3 Registration for the certification examFor information about How to Register for the certification exam, visit the following Web site:
http://www.ibm.com/certify
© Copyright IBM Corp. 2000 1
1.1.4 Core requirement (select three of the following tests) You will receive a Certificate of Proficiency for tests when passed.
1.1.4.1 AIX Installation and System Recovery The following objectives were used as a basis when the certification test 183 was developed. Some of these topics have been regrouped to provide better organization when discussed in this publication.
Preparation for this exam is the topic of IBM Certification Study Guide - AIX Installation and System Recovery, SG24-6183.
Section 1 - Installation and software maintenance • Install or migrate the operating system.
• Install a licensed program product.
• Remove an LPP from the system.
• Update a system.
• Apply a selective fix.
• Identify and resolve network install problems
Section 2 - System backup and restore • Perform a complete backup of the system.
• Implement backup using relative and absolute paths.
• Create a mksysb.
• Understand advanced mksysb concepts.
• Restore files.
Section 3 - System initialization (boot) failures • Understand concepts of system initialization.
• Diagnose the cause of a system initialization failure.
• Resolve a system initialization failure.
Section 4 - File systems and LVM recovery • Perform problem determination on a file system.
• Determine a suitable procedure for replacing a disk.
• Resolve problems caused by incorrect actions taken to change a disk drive.
• Create a new volume group.
• Create a logical volume.
2 IBM Certification Study Guide AIX Performance and System Tuning
• Understand LVM concepts.
• Resolve a complex LVM problem.
1.1.4.2 AIX Performance and System TuningThe following objectives were used as a basis when the certification test 184 was developed.
Preparation for this exam is the topic of this publication.
Section 1 - Performance tools and techniques • Use the iostat command.
• Use the filemon command.
• Use the tprof command.
• Use the netpmon command.
• Interpret iostat output.
• Interpret lsps output.
• Interpret netstat output.
• Interpret vmstat output.
• Know about perfpmr.
• Know about performance diagnostic tool.
• Look at run queue.
• Look at system calls.
Section 2 - Correcting performance problems • Correct disk bottlenecks.
• Correct NFS bottlenecks.
• Correct network bottlenecks.
• Correct communications adapter bottlenecks.
• Understand random write-behind concepts.
• Understand async I/O performance concepts.
• Understand VMM I/O pacing.
• Understand file fragmentation.
• Understand logical volume fragmentation.
Chapter 1. Certification overview 3
Section 3 - VMM • Identify and correct VMM performance problems.
• Correct paging problems.
• Know about tuning file memory usage.
• Know about memory load control.
• Understand page space allocation issues.
Section 4 - Multiprocessor and process scheduling • Know SMP commands.
• Use the bindprocessor command.
• Enable, disable, and show status of processors.
• List CPU utilization per processor.
• Know about ps command and threads.
• Understand locking issues in SMP.
• Know about process scheduling.
• Understand priority calculations.
• Understand the effect of schedtune on priorities.
Section 5 - Tuning and customization • Tune a system for optimum performance.
• Use the no command.
• Customize a LV for optimum performance.
• Configure system parameters.
• Tune network parameters.
• Determine when application tuning is needed.
• Understand real-time tuning.
• Understand disk striping.
• Tune I/O performance with vmtune.
• Understand RAID performance issues.
• Perform capacity planning.
• Understand memory usage.
4 IBM Certification Study Guide AIX Performance and System Tuning
1.1.4.3 AIX Problem Determination Tools and Techniques The following objectives were used as a basis when the certification test 185 was developed.
Preparation for this exam is the topic of IBM Certification Study Guide - AIX Problem Determination Tools and Techniques, SG24-6185.
Section 1 - System dumps • Create a system dump.
• Understand valid system dump devices.
• Determine the location of system dump data.
• Identify the status of a system dump by the LED codes.
• Identify appropriate action to take after a system dump.
• Determine if a system dump is successful.
• Use the snap command.
Section 2 - Crash • Understand the use and purpose of the crash command.
• Verify the state of a system dump.
• Show the stack trace using crash.
• Use the stat subcommand in crash.
• Manipulate data in the process table.
• Interpret crash stack trace output.
• Interpret crash process output.
• Interpret crash TTY output.
Section 3 - Trace • Start and stop trace.
• Run trace.
• Report trace information.
• Interpret trace output.
• Use trace to debug process problems.
Section 4 - File system and performance PD tools • Use tools to identify and correct corrupted file systems.
• Understand file system characteristics.
Chapter 1. Certification overview 5
• Resolve file system mounting problems.
• Repair corrupted file systems.
• Use vmstat command.
• Use iostat command.
• Use filemon command.
Section 5 - Network problem determination • Use PD tools to identify network problems.
• Resolve a network performance problem.
• Correct problems with host name resolution.
• Diagnose the cause of a problem with NFS mounts.
• Diagnose the cause of a routing problem.
• Resolve a router problem.
Section 6 - Error logs and diagnostics • Use error logging.
• Interpret error reports.
• Invoke and use diagnostic programs.
Section 7 - Other problem determination tools • Set breakpoints using dbx.
• Step through a program using dbx.
• Run a program with arguments using dbx.
• Read core files and locate traceback.
• Debug problem using core files.
• Read shell scripts.
• Debug shell script problems.
1.1.4.4 AIX Communications The following objectives were used as a basis when the certification test 186 was developed.
Preparation for this exam is the topic of IBM Certification Study Guide - AIX Communications, SG24-6186.
Section 1 - TCP/IP implementation • Know TCP/IP concepts.
6 IBM Certification Study Guide AIX Performance and System Tuning
• Understand TCP/IP broadcast packets.
• Use and implement name resolution.
• Understand TCP/IP protocols.
• Know IP address classes.
• Use interfaces available in LAN communications.
• Understand the relationship between an IP address and the network interface.
• Log into remote hosts using telnet and rologin.
• Construct /etc/hosts.equiv and ~/.rhosts for trusted users.
• Transfer files between systems using ftp or tftp.
• Run commands on remote machines.
Section 2 - TCP/IP: DNS implementation • Set up a primary name server.
• Set up a secondary name server.
• Set up a client in a domain network.
Section 3 - Routing: implementation • Apply knowledge of the IP routing algorithm.
• Set up and use the routing table and routes.
• Implement and use subnet masking.
Section 4 - NFS: implementation • Manipulate local and remote mounts using the automounter.
• Understand NFS daemons and their roles.
• Configure and tune an NFS server.
• Configure and tune an NFS client.
• Set up a file system for mounting.
• Understand the /etc/exports file.
• Invoke a predefined mount.
Section 5 - NIS: implementation • Understand the various NIS daemons.
• Implement NIS escapes.
• Create NIS map files.
Chapter 1. Certification overview 7
• Transfer NIS maps.
Section 6 - Network problem determination • Diagnose and resolve TCP/IP problems.
• Diagnose and resolve NFS problems.
• Diagnose and resolve NIS problems.
Section 7 - Hardware related PD (modems) • Determine appropriate diagnostic approach to resolve a modem
connection problem.
• Resolve communication configuration problems.
1.1.4.5 HACMP for AIX V4.2 The following objectives were used as a basis when the certification test 167 was developed.
Preparation for this exam is the topic of IBM Certification Study Guide - AIX HACMP, SG24-5131.
Section 1 - Pre-installation • Conduct a planning session.
- Set customer expectations at the beginning of the planning session.
- Gather customer's availability requirements.
- Articulate trade-offs of different HA configurations.
- Assist customer in identifying HA applications.
• Evaluate customer environment and tailorable components.
- Evaluate configuration and identify Single Points of Failure (SPOF).
- Define and analyze NFS requirements.
- Identify components affecting HACMP.
- Identify HACMP event logic customizations.
• Plan for installation.
- Develop disk management modification plan.
- Understand issues regarding single adapter solutions.
- Produce a test plan.
Section 2 - HACMP implementation • Configure HACMP solutions.
8 IBM Certification Study Guide AIX Performance and System Tuning
- Install HACMP code.
- Configure IP Address Takeover (IPAT).
- Configure non-IP heartbeat paths.
- Configure network adapter.
- Customize and tailor AIX.
- Set up shared disk (SSA).
- Set up shared disk (SCSI).
- Verify a cluster configuration.
- Create an application server.
• Set up event notification.
- Set up event notification and pre/post event scripts.
- Set up error notification.
• Post configuration activities.
- Configure client notification and ARP update.
- Implement a test plan.
- Create a snapshot.
- Create a customization document.
• Testing and Troubleshooting.
- Troubleshoot failed IPAT failover.
- Troubleshoot failed shared volume groups.
- Troubleshoot failed network configuration.
- Troubleshoot failed shared disk tests.
- Troubleshoot failed application.
- Troubleshoot failed pre/post event scripts.
- Troubleshoot failed error notifications.
- Troubleshoot errors reported by cluster verification.
Section 3 - System management • Communicate with customer.
- Conduct turnover session.
- Provide hands-on customer education.
- Set customer expectations of their HACMP solution's capabilities.
Chapter 1. Certification overview 9
• Perform systems maintenance.
- Perform HACMP maintenance tasks (PTFs, adding products, replacing disks, adapters).
- Perform AIX maintenance tasks.
- Dynamically update cluster configuration.
- Perform testing and troubleshooting as a result of changes.
1.1.4.6 RS/6000 SP and PSSP V2.4The following objectives were used as a basis when the certification test 178 was developed.
Preparation for this exam is the topic of IBM Certification Study Guide - RS/6000 SP, SG24-5348.
Section 1 - Implementation and planning • Validate software/hardware capability and configuration
- Determine required software levels (for example: version, release, and modification level).
- Determine the size, model, and location of the control workstation.
- Define disk, memory, and I/O (including disk placement).
- Determine disk space requirements.
- Understand multi-frame requirements and switch partitioning.
- Determine the number and type of nodes needed (including features).
- Determine the number of types of I/O devices (for example: SCSI, RAID, SSA, and so on) needed.
- Configure external I/O connections.
- Determine additional network connections required.
- Create the logical plan for connecting into networks outside the SP.
- Identify the purpose and bandwidth of connections.
• Plan implementation of key aspects of TCP/IP networking in the SP environment.
- Create specific host names (both fully qualified and aliases) and TCP/IP address.
- Netmask value and default routes.
- Determine the mechanism (for example, /etc/hosts, NIS, DNS) by which name resolution will be made across the system.
10 IBM Certification Study Guide AIX Performance and System Tuning
- Choose the IP name/address resolver.
• Determine the appropriate common, distributed, and local files/file systems.
- Determine the physical locations of the file system and home directories.
- Determine the number of types of I/O devices (for example, SCSI, RAID, SSA, and so on) needed.
- Configure internal I/O.
- Determine the mechanism (for example, NFS, AFS, DFS, local) by which file systems will be made across the system.
• Configure and administer the Kerberos Authentication subsystem and manage user IDs on the SP system.
- Define administrative functions.
- Determine the Kerberos administration ID.
- Define administrative functions.
- Understand the options of end-user management.
- Understand how to administer authenticated users and instances.
• Define a backup/recovery strategy for the SP which supports node images, control workstation images, applications, and data.
- Determine backup strategy and understand the implications of multiple unique mksysb images.
Section 2 - Installation and configuration • Configure an RS/6000 as an SP control workstation.
- Verify the control workstation system configuration.
- Configure the TCP/IP network on the control workstation.
- Install PSSP.
- Load the SDR with SP configuration information.
- Configure the SP System Data Repository.
- Verify control workstation software.
- Configure TCP/IP name resolution (for example, /etc/hosts, DNS, NIS).
• Perform network installation of images on nodes, using any combination of boot/install servers.
- Install the images on the nodes.
Chapter 1. Certification overview 11
- Create boot/install servers
• Exercise the SP system resources to verify the correct operation of all required subsystems.
- Verify all network connections.
- Verify internal and external I/O connections.
- Verify switch operations
Section 3 - Application enablement • Determine whether LoadLeveler would be beneficial to a given SP system
configuration.
- Understand the function of LoadLeveler.
• Define and implement application-specific FSs, VGs, and VSDs for a parallel application.
- Define application-specific file systems, logical volumes, volume groups, or VSDs.
- Implement application-specific file systems, logical volumes, volume groups, or VSDs.
• Install and configure problem management tools (for example: event manager, problem manager and perspectives)
- Install and Configure user-management tools.
Section 4 - Support • Utilize Problem Determination methodologies (for example,
HOSTRESPONDS, SWITCHRESPONDS, error report, log files, DAEMONS, GUIs).
- Handle resolution of critical problems.
- Conduct SP-specific problem diagnosis.
- Interpret error logs that are unique to SP.
• Isolate causes of degraded SP performance, and tune the system accordingly.
- Understand performance analysis and tuning requirements
1.1.4.7 RS/6000 SP and PSSP V3The following objectives were used as a basis when the certification test 188 was developed.
12 IBM Certification Study Guide AIX Performance and System Tuning
Preparation for this exam is the topic of IBM Certification Study Guide - RS/6000 SP, SG24-5348.
Section 1 - Implementation planning • Validate software/hardware capability and configuration
- Determine required software levels (for example, version, release, and modification level)
- Determine the size, model, and location of the control workstation.
- Define disk, memory, and I/O (including disk replacement).
- Define disk space requirements.
- Understand multi-frame requirements and switch partitioning.
- Determine the number and types of nodes needed (including features).
- Determine the number and types of I/O devices (for example, SCSI, RAID, SSA, and so on) needed.
- Configure external I/O connections.
- Determine what additional network connections are required.
- Create the logical plan for connecting into networks outside the SP.
- Identify the purpose and bandwidth of connections.
- Determine if boot/install servers are needed and, if needed, where they are located.
• Implement key aspects of TCP/IP networking in the SP environment.
- Create specific host names (both fully qualified and aliases), TCP/IP address, netmask value and default routes.
- Determine the mechanism (for example, /etc/hosts, NIS, DNS) by which name resolution will be made across the system.
- Determine SP Ethernet topology (segmentation, routing).
- Determine TCP/IP addressing for switch network.
• Determine the appropriate common, distributed, or local files and file systems.
- Determine the physical locations of the file system and home directories.
- Determine the mechanism (for example, NFS, AFS, DFS, local) by which file systems will be made across the system.
• Define a backup/recovery strategy for the SP which supports node image(s), control workstation images, applications, and data.
Chapter 1. Certification overview 13
- Determine backup strategy, including node and CWS images.
- Determine backup strategy and tools for application data.
Section 2 - Installation and configuration • Configure an RS/6000 as an SP control workstation.
- Verify the control workstation system configuration.
- Configure TCP/IP network on the control workstation.
- Install PSSP.
- Configure the SDR with SP configuration information.
- Verify control workstation software.
• Perform network installation of images on nodes, using any combination of boot/install servers.
- Install the images on the nodes.
- Define and configure boot/install servers.
- Check SDR information.
- Check RSCT daemons (hats, hags, and haem).
• Thoroughly exercise the SP system resources to verify correct information of all required subsystems.
- Verify all network connections.
- Verify switch operations.
• Configure and administer the Kerberos Authentication subsystem and manage user IDs.
- Plan and configure Kerberos functions and procedures.
- Configure the Kerberos administration ID.
- Understand and use the options of end-user management.
• Define and configure system partition and perform switch installation.
Section 3 - Application enablement • Determine whether additional SP-related products (for example,
Loadleveler, PTPE, HACWS, NetTAPE, CLIOS) would be beneficial.
• Understand the function of additional SP-related products.
• Define and implement application-specific file systems, logical volumes, VGs and VSDs.
• Install and configure problem management tools (for example, event manager, problem manager, and perspectives).
14 IBM Certification Study Guide AIX Performance and System Tuning
• Define and manage monitors.
Section 4 - Ongoing support • Perform software maintenance.
- Perform system software recovery.
- Upgrade and migrate system software (applying PTFs and migration).
• Perform SP reconfiguration.
- Add frames.
- Add nodes.
- Migrate nodes.
- Add/replace switch.
• Utilize Problem Determination methodologies (for example, HOSTRESPONDS, SWITCHRESPONDS, error report, log files, DAEMONS, GUIs).
- Interpret error logs that are unique to the SP.
- Diagnose networking problems.
- Diagnose host response problems.
- Diagnose switch-specific problems.
• Isolate cause of degraded SP performance and tune the system accordingly.
- Understand performance analysis and tuning requirements.
Chapter 1. Certification overview 15
1.2 Certification education courses
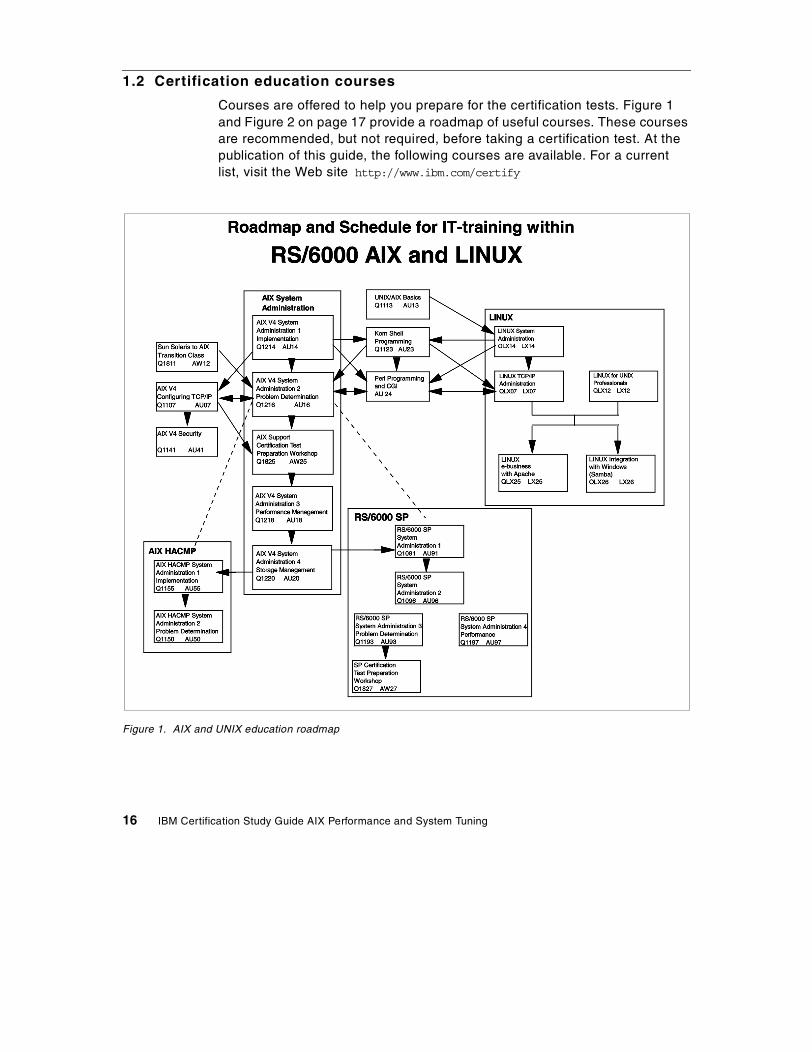
Courses are offered to help you prepare for the certification tests. Figure 1 and Figure 2 on page 17 provide a roadmap of useful courses. These courses are recommended, but not required, before taking a certification test. At the publication of this guide, the following courses are available. For a current list, visit the Web site http://www.ibm.com/certify
Figure 1. AIX and UNIX education roadmap
16 IBM Certification Study Guide AIX Performance and System Tuning
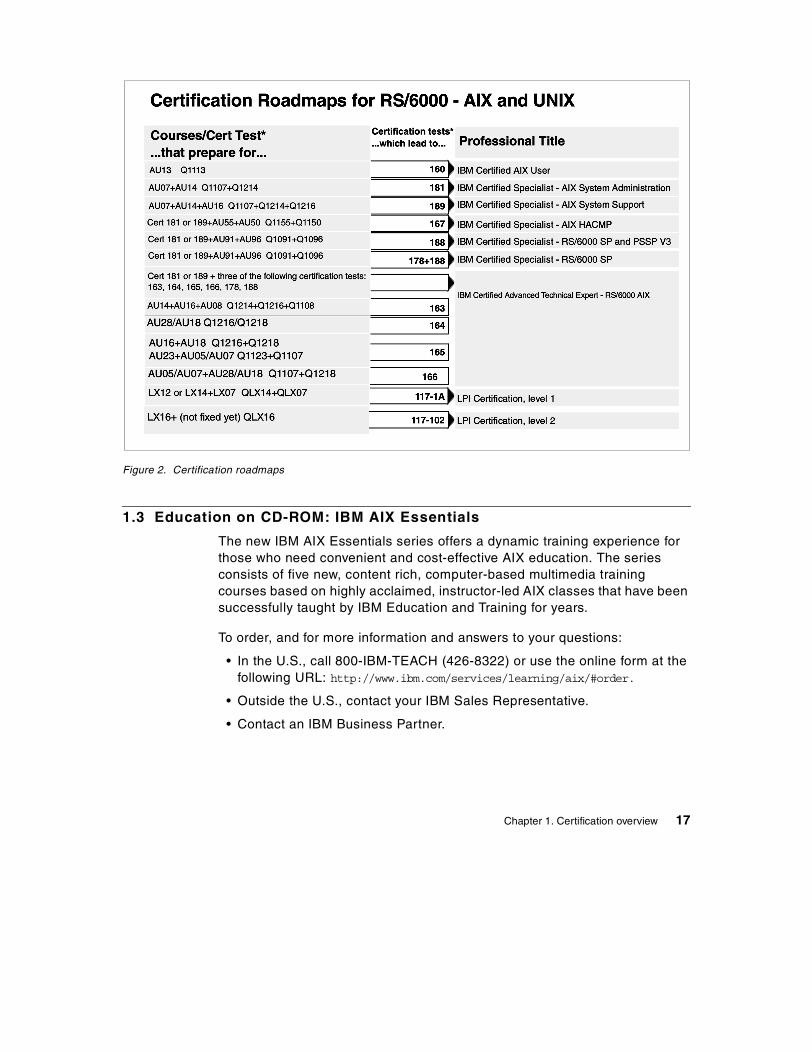
Figure 2. Certification roadmaps
1.3 Education on CD-ROM: IBM AIX Essentials
The new IBM AIX Essentials series offers a dynamic training experience for those who need convenient and cost-effective AIX education. The series consists of five new, content rich, computer-based multimedia training courses based on highly acclaimed, instructor-led AIX classes that have been successfully taught by IBM Education and Training for years.
To order, and for more information and answers to your questions:
• In the U.S., call 800-IBM-TEACH (426-8322) or use the online form at the following URL: http://www.ibm.com/services/learning/aix/#order.
• Outside the U.S., contact your IBM Sales Representative.
• Contact an IBM Business Partner.
Chapter 1. Certification overview 17

18 IBM Certification Study Guide AIX Performance and System Tuning
Chapter 2. Performance tuning - getting started
In this chapter, the following topics are covered:
• Introduction to concepts and tools
• Performance tuning flowchart
In general, the performance tuning issues can be divided into two areas:
• System management
• Application development
The application developer will usually view performance more from a user’s perspective than a system perspective, for example, the user response time and system interactions are the concerns addressed during the design phase, not the overall system performance. This aspect of performance tuning, optimization of code, is outside the scope of this publication. This publication focuses on the system management aspects.
Many of the commands introduced in this chapter are discussed in detail throughout this publication (as referenced).
2.1 Introduction to concepts
Performance management, from a system management point of view, is usually concentrated on the allocation of existing resources, but also includes allocation of additional resources and establishing system policies. Therefore, performance tuning can be defined as the application and allocation of resources to best meet the defined requirements and goals.
From this definition of performance tuning, the following list provides a set of tasks that are part of performance tuning:
1. Identifying the workload.
If the system to tune is a workstation, then the most probable goal is fast response time.
If the system is a multiuser environment, the goal is to maximize throughput within a given response time or minimize response time under a consistent workload.
If the system is a server, maximizing throughput for a given response time is usually the goal.
© Copyright IBM Corp. 2000 19
2. Defining and prioritizing goals.
Before starting a tuning exercise, you need to have clear goals in mind. In other words, how will you know when you have finished tuning the system? Bear in mind that response time and throughput are not the same thing and that you need to focus on one or the other for each application. It is also important to realize that tuning is a process of compromise - that you will likely be taking resources away from one application to give another. A clear understanding of the relative priorities that operate in your environment is also an essential pre-requisite to tuning your system.
3. Identify the required resources.
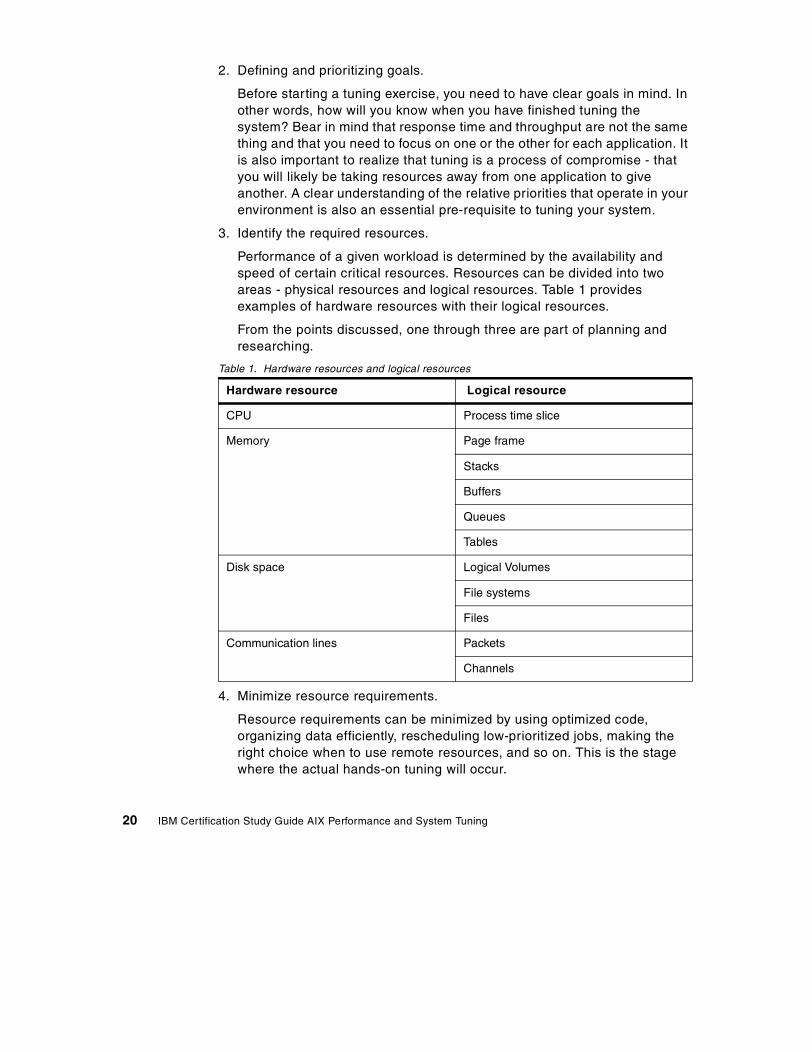
Performance of a given workload is determined by the availability and speed of certain critical resources. Resources can be divided into two areas - physical resources and logical resources. Table 1 provides examples of hardware resources with their logical resources.
From the points discussed, one through three are part of planning and researching.
Table 1. Hardware resources and logical resources
4. Minimize resource requirements.
Resource requirements can be minimized by using optimized code, organizing data efficiently, rescheduling low-prioritized jobs, making the right choice when to use remote resources, and so on. This is the stage where the actual hands-on tuning will occur.
Hardware resource Logical resource
CPU Process time slice
Memory Page frame
Stacks
Buffers
Queues
Tables
Disk space Logical Volumes
File systems
Files
Communication lines Packets
Channels
20 IBM Certification Study Guide AIX Performance and System Tuning
5. Controlling allocation of resources.
Resources to control include disk space and process priority control. Disk space for users, or groups of users, can easily be managed with a quota, and process priority can be handled with the Workload Manager or by manipulating the scheduler.
6. Repeat steps three to five as necessary.
7. Add additional resources as required.
In the following section, a common performance tuning flowchart will be briefly discussed.
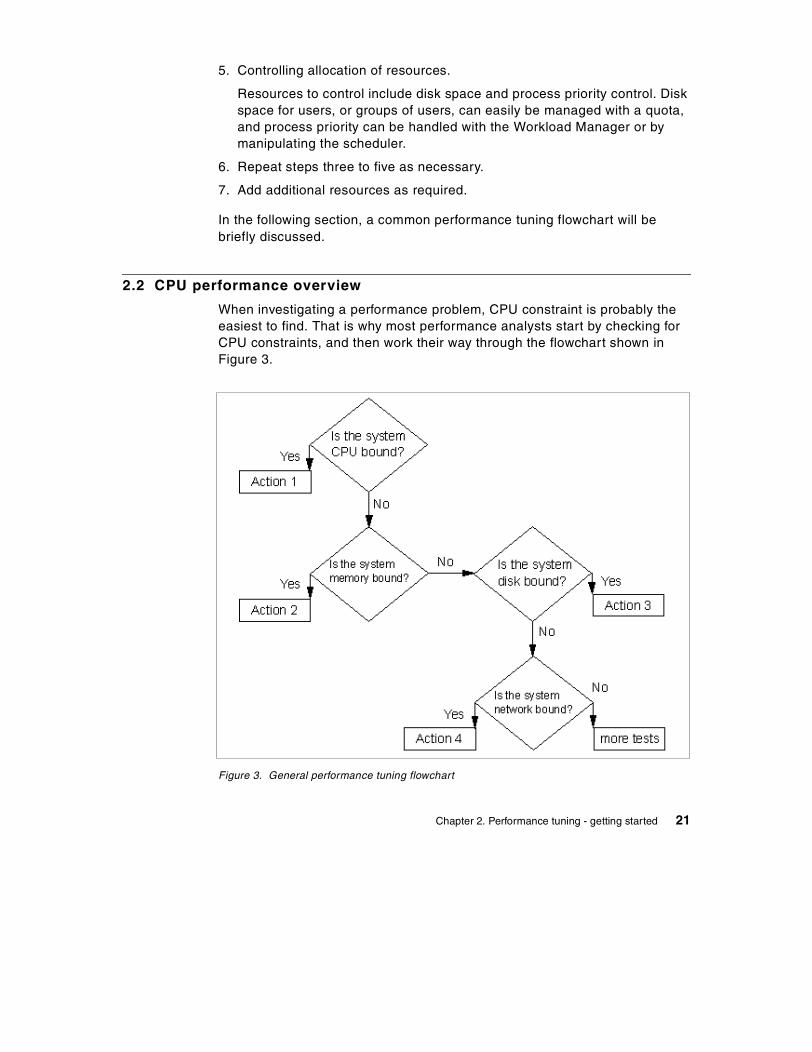
2.2 CPU performance overview
When investigating a performance problem, CPU constraint is probably the easiest to find. That is why most performance analysts start by checking for CPU constraints, and then work their way through the flowchart shown in Figure 3.
Figure 3. General performance tuning flowchart
Chapter 2. Performance tuning - getting started 21
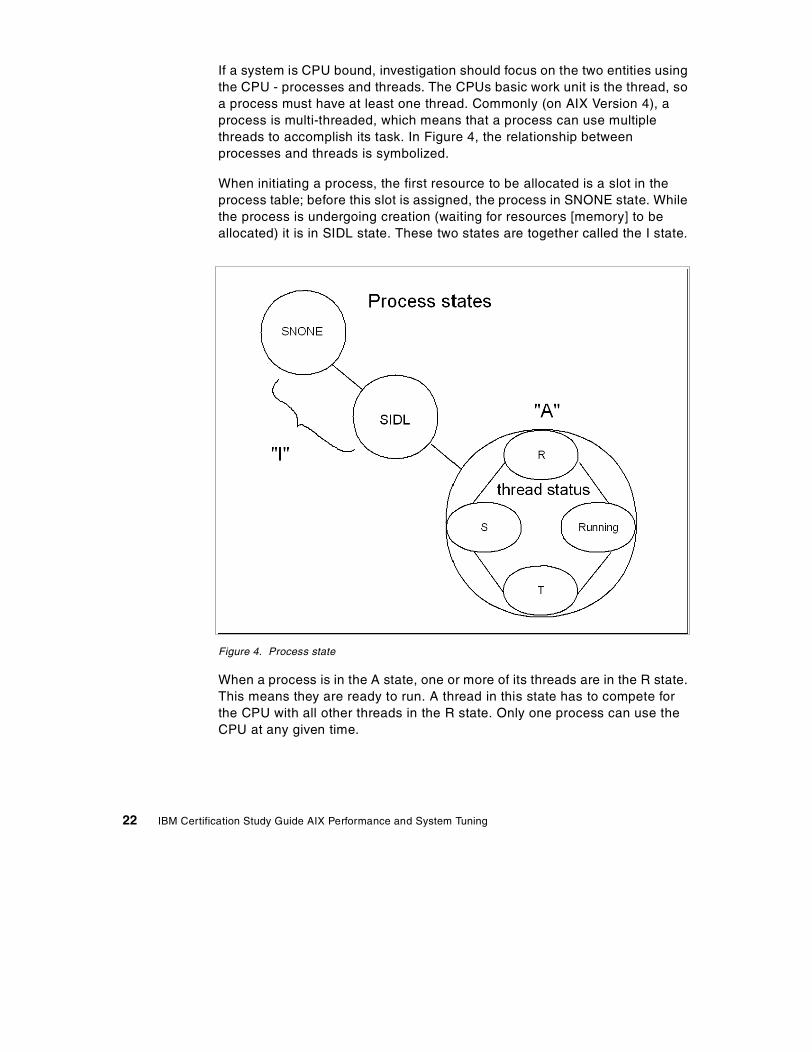
If a system is CPU bound, investigation should focus on the two entities using the CPU - processes and threads. The CPUs basic work unit is the thread, so a process must have at least one thread. Commonly (on AIX Version 4), a process is multi-threaded, which means that a process can use multiple threads to accomplish its task. In Figure 4, the relationship between processes and threads is symbolized.
When initiating a process, the first resource to be allocated is a slot in the process table; before this slot is assigned, the process in SNONE state. While the process is undergoing creation (waiting for resources [memory] to be allocated) it is in SIDL state. These two states are together called the I state.
Figure 4. Process state
When a process is in the A state, one or more of its threads are in the R state. This means they are ready to run. A thread in this state has to compete for the CPU with all other threads in the R state. Only one process can use the CPU at any given time.
22 IBM Certification Study Guide AIX Performance and System Tuning
If a thread is waiting for an event or for I/O, the thread is said to be sleeping, or in the S state. When the I/O is complete, the thread is awakened and placed in the ready to run queue.
If a thread is stopped with the SIGSTOP signal (to be awakened with the SIGCONT signal), it is in the T state while suspended.
Manipulating the run queue, the process and thread dispatcher, and priority calculation are all ways to tune (and misstune, if not carefully done) the CPU. The run queue and how to decide which thread is to be prioritized is discussed in Chapter 6, “Performance management tools” on page 177.
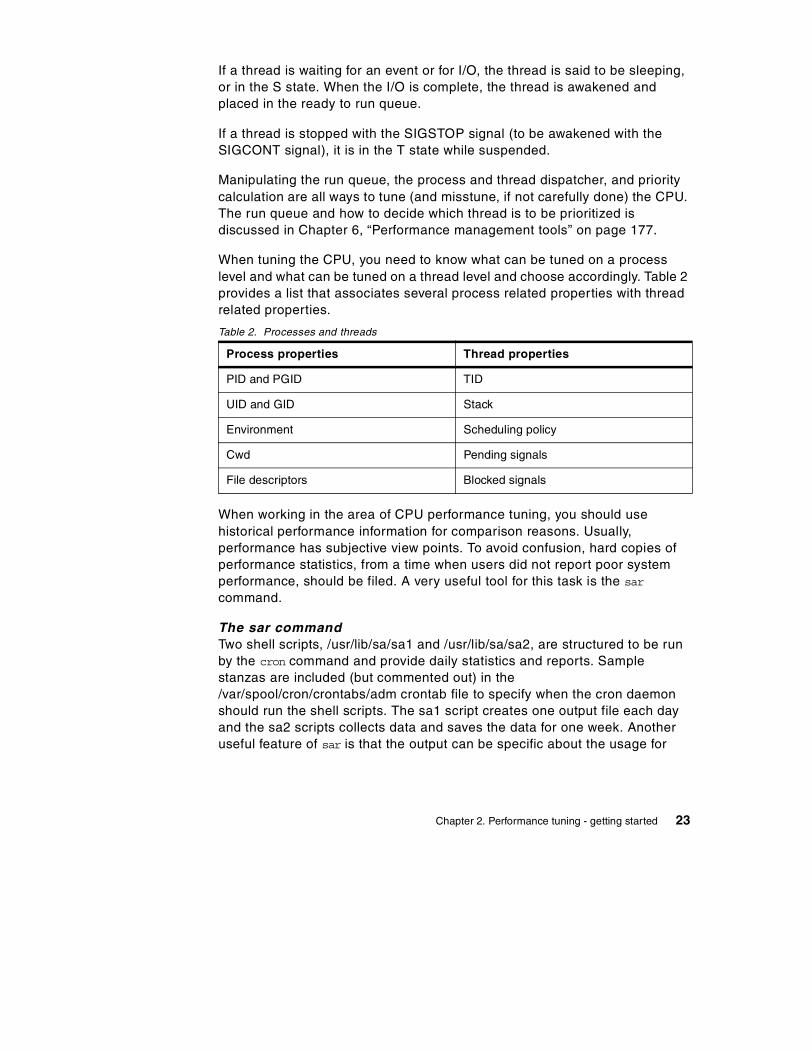
When tuning the CPU, you need to know what can be tuned on a process level and what can be tuned on a thread level and choose accordingly. Table 2 provides a list that associates several process related properties with thread related properties.
Table 2. Processes and threads
When working in the area of CPU performance tuning, you should use historical performance information for comparison reasons. Usually, performance has subjective view points. To avoid confusion, hard copies of performance statistics, from a time when users did not report poor system performance, should be filed. A very useful tool for this task is the sar command.
The sar commandTwo shell scripts, /usr/lib/sa/sa1 and /usr/lib/sa/sa2, are structured to be run by the cron command and provide daily statistics and reports. Sample stanzas are included (but commented out) in the /var/spool/cron/crontabs/adm crontab file to specify when the cron daemon should run the shell scripts. The sa1 script creates one output file each day and the sa2 scripts collects data and saves the data for one week. Another useful feature of sar is that the output can be specific about the usage for
Process properties Thread properties
PID and PGID TID
UID and GID Stack
Environment Scheduling policy
Cwd Pending signals
File descriptors Blocked signals
Chapter 2. Performance tuning - getting started 23
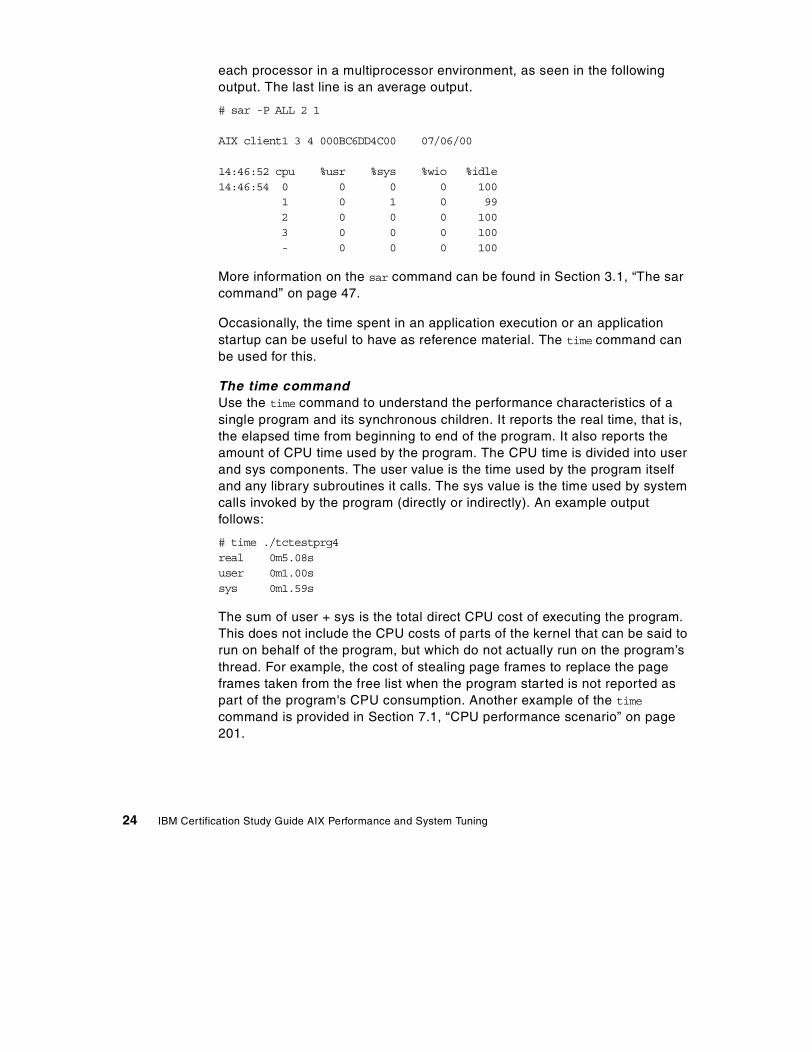
each processor in a multiprocessor environment, as seen in the following output. The last line is an average output.
# sar -P ALL 2 1
AIX client1 3 4 000BC6DD4C00 07/06/00
14:46:52 cpu %usr %sys %wio %idle14:46:54 0 0 0 0 100
1 0 1 0 992 0 0 0 1003 0 0 0 100- 0 0 0 100
More information on the sar command can be found in Section 3.1, “The sar command” on page 47.
Occasionally, the time spent in an application execution or an application startup can be useful to have as reference material. The time command can be used for this.
The time commandUse the time command to understand the performance characteristics of a single program and its synchronous children. It reports the real time, that is, the elapsed time from beginning to end of the program. It also reports the amount of CPU time used by the program. The CPU time is divided into user and sys components. The user value is the time used by the program itself and any library subroutines it calls. The sys value is the time used by system calls invoked by the program (directly or indirectly). An example output follows:
# time ./tctestprg4real 0m5.08suser 0m1.00ssys 0m1.59s
The sum of user + sys is the total direct CPU cost of executing the program. This does not include the CPU costs of parts of the kernel that can be said to run on behalf of the program, but which do not actually run on the program’s thread. For example, the cost of stealing page frames to replace the page frames taken from the free list when the program started is not reported as part of the program's CPU consumption. Another example of the time command is provided in Section 7.1, “CPU performance scenario” on page 201.
24 IBM Certification Study Guide AIX Performance and System Tuning
When starting to analyze a performance problem, most analysts start with thevmstat command, because it provides a brief overall picture of both CPU and memory usage.
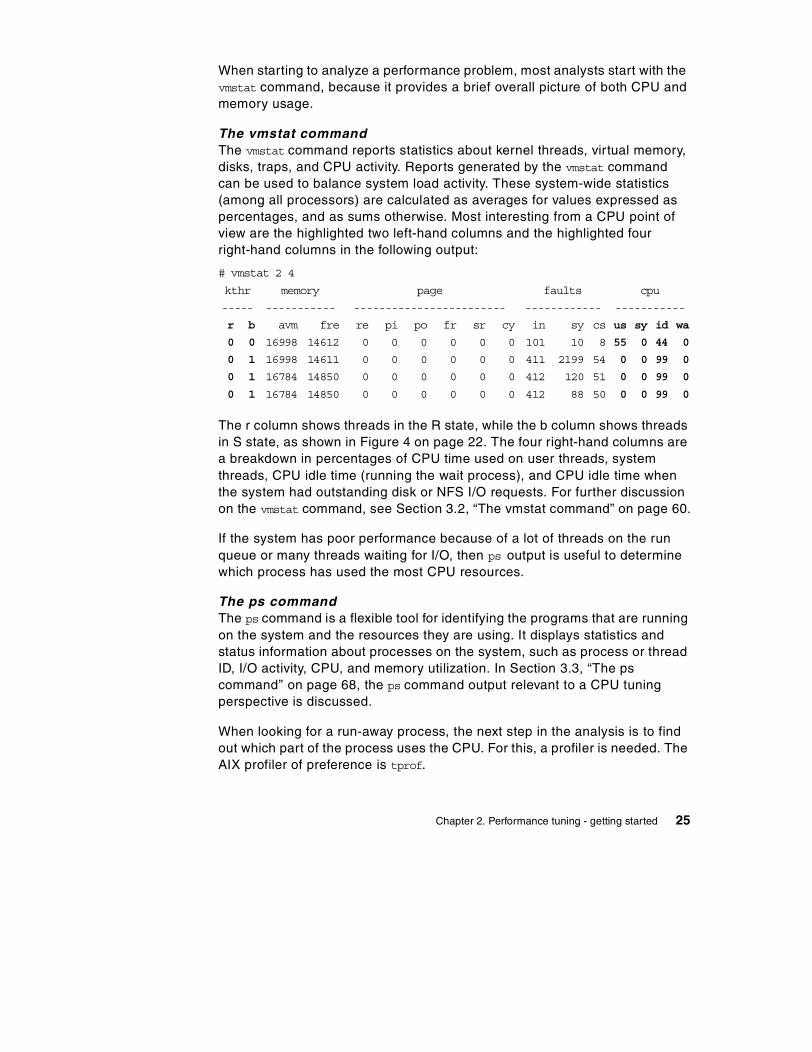
The vmstat commandThe vmstat command reports statistics about kernel threads, virtual memory, disks, traps, and CPU activity. Reports generated by the vmstat command can be used to balance system load activity. These system-wide statistics (among all processors) are calculated as averages for values expressed as percentages, and as sums otherwise. Most interesting from a CPU point of view are the highlighted two left-hand columns and the highlighted four right-hand columns in the following output:
# vmstat 2 4
The r column shows threads in the R state, while the b column shows threads in S state, as shown in Figure 4 on page 22. The four right-hand columns are a breakdown in percentages of CPU time used on user threads, system threads, CPU idle time (running the wait process), and CPU idle time when the system had outstanding disk or NFS I/O requests. For further discussion on the vmstat command, see Section 3.2, “The vmstat command” on page 60.
If the system has poor performance because of a lot of threads on the run queue or many threads waiting for I/O, then ps output is useful to determine which process has used the most CPU resources.
The ps commandThe ps command is a flexible tool for identifying the programs that are running on the system and the resources they are using. It displays statistics and status information about processes on the system, such as process or thread ID, I/O activity, CPU, and memory utilization. In Section 3.3, “The ps command” on page 68, the ps command output relevant to a CPU tuning perspective is discussed.
When looking for a run-away process, the next step in the analysis is to find out which part of the process uses the CPU. For this, a profiler is needed. The AIX profiler of preference is tprof.
kthr memory page faults cpu
----- ----------- ------------------------ ------------ -----------
r b avm fre re pi po fr sr cy in sy cs us sy id wa
0 0 16998 14612 0 0 0 0 0 0 101 10 8 55 0 44 0
0 1 16998 14611 0 0 0 0 0 0 411 2199 54 0 0 99 0
0 1 16784 14850 0 0 0 0 0 0 412 120 51 0 0 99 0
0 1 16784 14850 0 0 0 0 0 0 412 88 50 0 0 99 0
Chapter 2. Performance tuning - getting started 25
The tprof commandThe tprof command can be runned over a time period to trace the activity of the CPU. The CPU utilization is divided into kernel, user, shared, and other to show how many clock timer ticks were spent in each respective address space. If the user column shows high values, application tuning may be necessary. More information about the tprof command can be found in Section 3.4, “The tprof command” on page 73.
When finding a process that cannot be optimized, another way to tune the process is to lessen its priority in the run queue. This can be accomplished by grouping processes together to be handled by AIX Version 4.3 Workload Manager or by use of the nice and renice commands.
The nice and renice commandsThe nice command can run a process at a priority lower than the process’ normal priority. You must have root user authority to run a process at a higher priority. The priority of a process is often called its nice value, but while the priority of a process is recalculated at every clock timer tick, the nice value is stable and manipulated with the nice or renice commands. The nice value can range from 0 to 39, with 39 being the lowest priority. For example, if a process normally runs with a default nice value of 20, resetting the nice value with an increment of 5 runs the process at a lower priority, 25, and the process may run slower. More information about the priorities and nice values can be found in Section 6.1.1, “Priority calculation on AIX versions prior to 4.3.2” on page 179, Section 6.1.2, “Priority calculation on AIX Version 4.3.2 and later” on page 182, and Section 6.3.2, “The nice and renice commands” on page 189.
Finally, in the list of common performance tools, there is the schedtune command. This command is mentioned last for a reason: do not manipulate the scheduler without thorough knowledge of the scheduler mechanism.
The schedtune commandThe priority of most user processes varies with the amount of CPU time the process has used recently. The CPU scheduler's priority calculations are based on two variables, SCHED_R (the weighting factor) and SCHED_D (the decay factor). More information about the scheduler and the schedtune command is covered in Section 6.1, “The AIX scheduler” on page 177 and in Section 6.3.1, “The schedtune command” on page 186.
26 IBM Certification Study Guide AIX Performance and System Tuning
2.3 Memory performance overview
Memory in AIX is handled by the Virtual Memory Manager (VMM). The Virtual Memory Manager is a facility that makes real memory appear larger than its physical size. The virtual memory system is composed of real memory plus physical disk space where portions of memory that are not currently in use are stored.
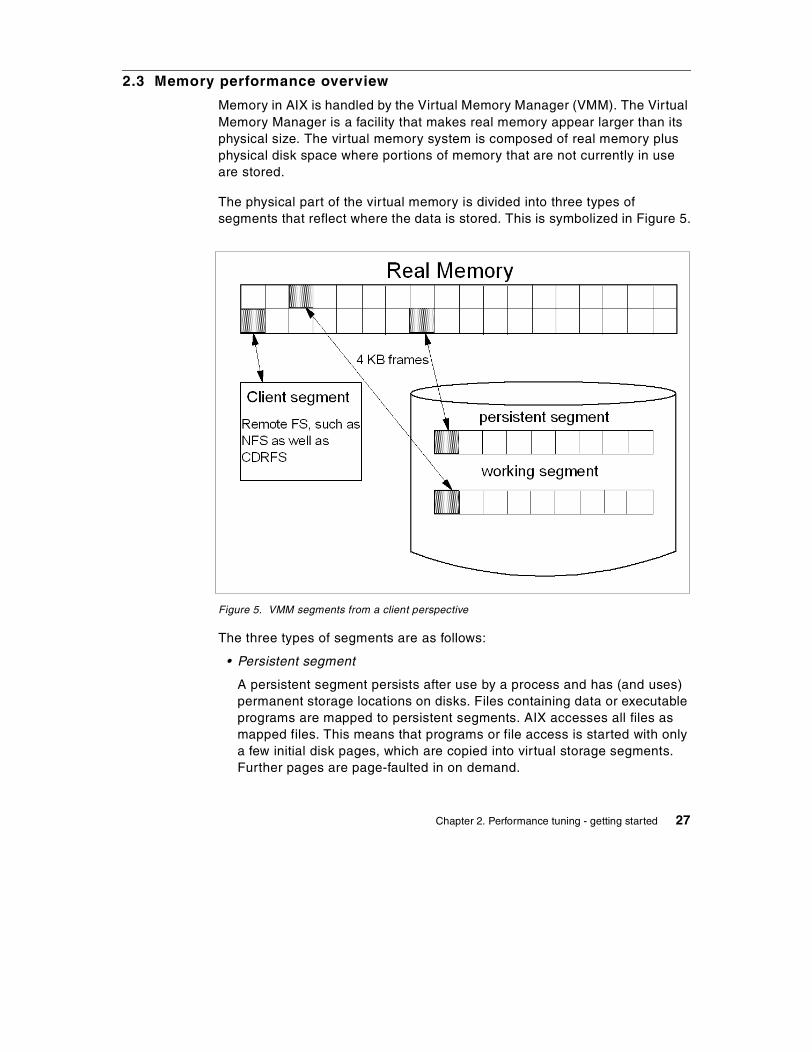
The physical part of the virtual memory is divided into three types of segments that reflect where the data is stored. This is symbolized in Figure 5.
Figure 5. VMM segments from a client perspective
The three types of segments are as follows:
• Persistent segment
A persistent segment persists after use by a process and has (and uses) permanent storage locations on disks. Files containing data or executable programs are mapped to persistent segments. AIX accesses all files as mapped files. This means that programs or file access is started with only a few initial disk pages, which are copied into virtual storage segments. Further pages are page-faulted in on demand.
Chapter 2. Performance tuning - getting started 27
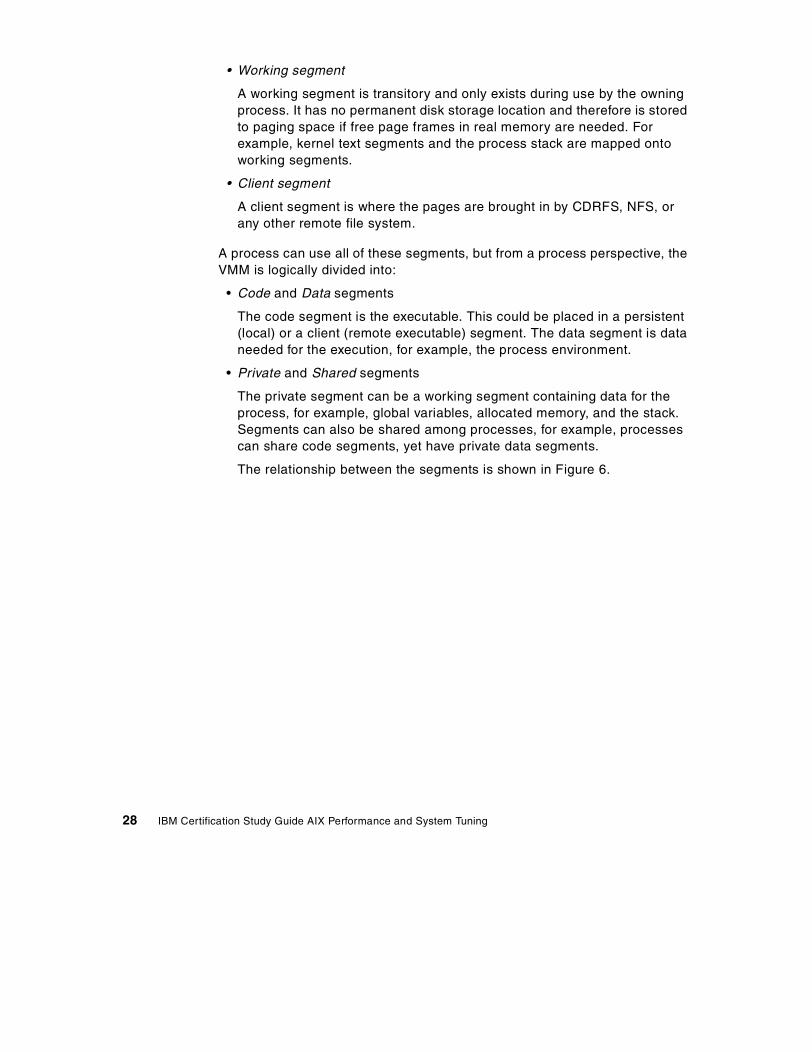
• Working segment
A working segment is transitory and only exists during use by the owning process. It has no permanent disk storage location and therefore is stored to paging space if free page frames in real memory are needed. For example, kernel text segments and the process stack are mapped onto working segments.
• Client segment
A client segment is where the pages are brought in by CDRFS, NFS, or any other remote file system.
A process can use all of these segments, but from a process perspective, the VMM is logically divided into:
• Code and Data segments
The code segment is the executable. This could be placed in a persistent (local) or a client (remote executable) segment. The data segment is data needed for the execution, for example, the process environment.
• Private and Shared segments
The private segment can be a working segment containing data for the process, for example, global variables, allocated memory, and the stack. Segments can also be shared among processes, for example, processes can share code segments, yet have private data segments.
The relationship between the segments is shown in Figure 6.
28 IBM Certification Study Guide AIX Performance and System Tuning
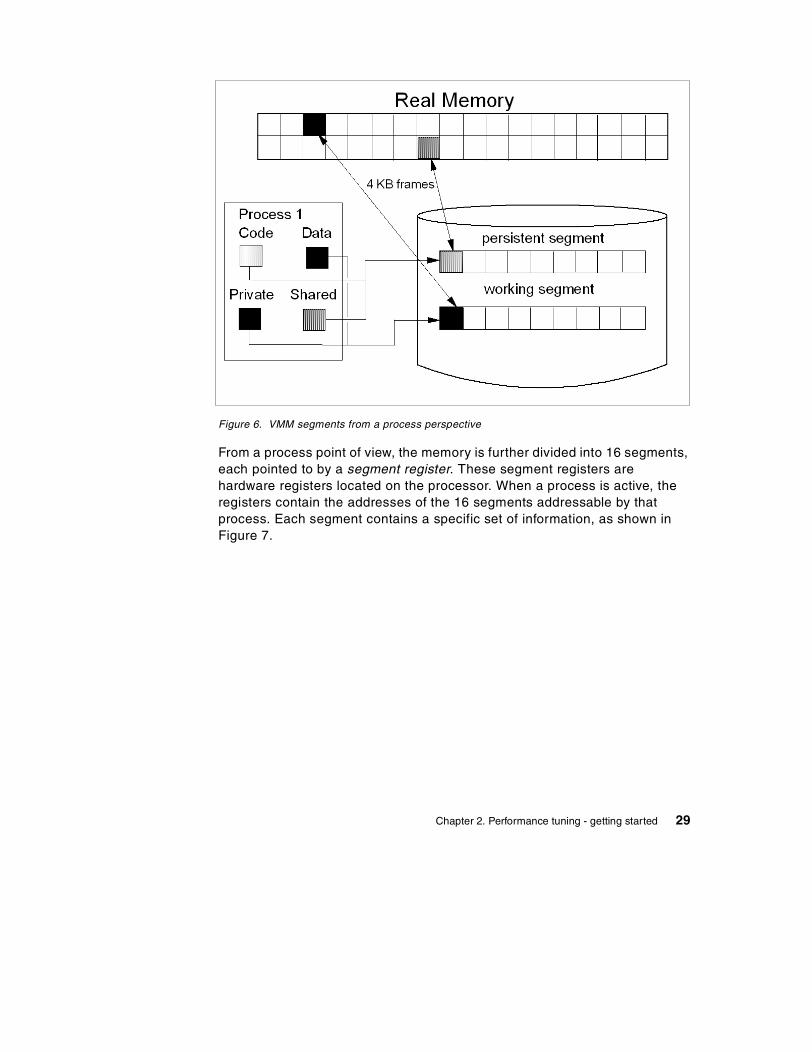
Figure 6. VMM segments from a process perspective
From a process point of view, the memory is further divided into 16 segments, each pointed to by a segment register. These segment registers are hardware registers located on the processor. When a process is active, the registers contain the addresses of the 16 segments addressable by that process. Each segment contains a specific set of information, as shown in Figure 7.
Chapter 2. Performance tuning - getting started 29
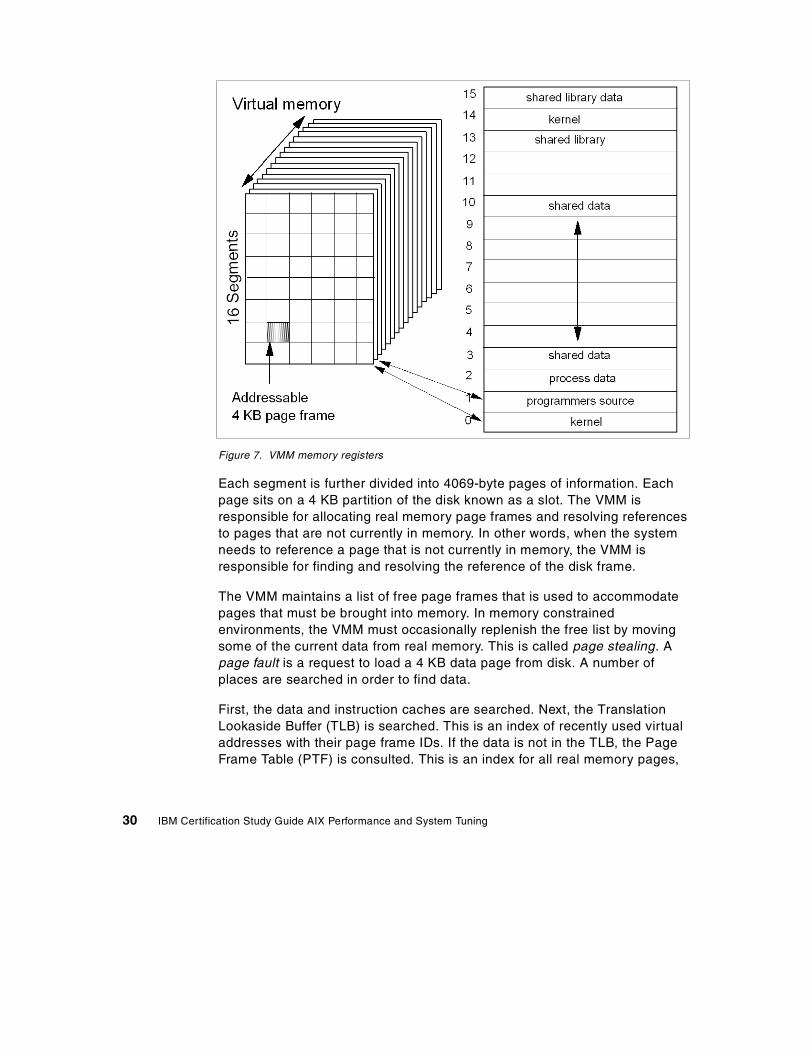
Figure 7. VMM memory registers
Each segment is further divided into 4069-byte pages of information. Each page sits on a 4 KB partition of the disk known as a slot. The VMM is responsible for allocating real memory page frames and resolving references to pages that are not currently in memory. In other words, when the system needs to reference a page that is not currently in memory, the VMM is responsible for finding and resolving the reference of the disk frame.
The VMM maintains a list of free page frames that is used to accommodate pages that must be brought into memory. In memory constrained environments, the VMM must occasionally replenish the free list by moving some of the current data from real memory. This is called page stealing. A page fault is a request to load a 4 KB data page from disk. A number of places are searched in order to find data.
First, the data and instruction caches are searched. Next, the Translation Lookaside Buffer (TLB) is searched. This is an index of recently used virtual addresses with their page frame IDs. If the data is not in the TLB, the Page Frame Table (PTF) is consulted. This is an index for all real memory pages,
30 IBM Certification Study Guide AIX Performance and System Tuning
and this index is held in pinned memory. The table is large; therefore, there are indexes to this index. The Hash Anchor Table (HAT) links pages of related segments, in order to get a faster entry point to the main PTF.
To the page stealer, memory is divided into Computational memory and File memory.
• Computational memory are pages that belong to the working segment or program text segment.
• File memory consists of the remaining pages. These are usually pages from the permanent data file in persistent memory.
The page stealer tries to balance these two types of memory usage when stealing pages. The page replacement algorithm can be manipulated.
When starting a process, a slot is assigned, and when a process references a virtual memory page that is on the disk, the referenced page must be paged in and probably one or more pages must be paged out, creating I/O traffic and delaying the start up of the process. AIX attempts to steal real memory pages that are unlikely to be referenced in the near future, using a page replacement algorithm. If the system has too little memory, no RAM pages are good candidates to be paged out, as they will be reused in the near future. When this happens, continuous pagein and pageout occurs. This condition is called thrashing.
When discussing memory, the allocation algorithm is commonly mentioned. The following is a discussion from System Management Concepts: Operating System and Devices, SC23-4311, on the allocation algorithm:
The operating system uses the PSALLOC environment variable to determine the mechanism used for memory and paging space allocation. If the PSALLOC environment variable is not set, is set to null, or is set to any value other than early, the system uses the default late allocation algorithm.
The late allocation algorithm does not reserve paging space when a memory request is made; it approves the request and assigns paging space when pages are touched. Some programs allocate large amounts of virtual memory and then use only a fraction of the memory. Examples of such programs are technical applications that use sparse vectors or matrices as data structures. The late allocation algorithm is also more efficient for a real-time, demand-paged kernel such as the one in the operating system.
For Version 4.3.2 and later, the late allocation algorithm is modified to further delay the allocation of paging space. As mentioned previously,
Chapter 2. Performance tuning - getting started 31
before Version 4.3.2, paging space was allocated when a page was touched. However, this paging space may never be used, especially on systems with large real memory where paging is rare. Therefore, the allocation of paging space is delayed until it is necessary to page out the page, which results in no wasted paging space allocation. This does result, however, in additional overcommitment of paging space. On a system where enough virtual memory is accessed that paging is necessary, the amount of paging space required may be as much as was required on previous releases.
It is possible to overcommit resources when using the late allocation algorithm for paging space allocation. In this case, when one process gets the resource before another, a failure results. The operating system attempts to avoid complete system failure by killing processes affected by the resource overcommitment. The SIGDANGER signal is sent to notify processes that the amount of free paging space is low. If the paging space situation reaches an even more critical state, selected processes that did not receive the SIGDANGER signal are sent a SIGKILL signal.
The user can use the PSALLOC environment variable to switch to an early allocation algorithm for memory and paging space allocation. The early allocation mechanism allocates paging space for the executing process at the time the memory is requested. If there is insufficient paging space available at the time of the request, the early allocation mechanism fails the memory request.
The new paging space allocation algorithm introduced with Version 4.3.2 is also named Deferred Page Space Allocation (DPSA). After a page has been paged out to paging space, the disk block is reserved for that page if that page is paged back into RAM. Therefore, the paging space percentage-used value may not necessarily reflect the number of pages only in the paging space, because some of them may be back in the RAM. If the page that was paged back in is the working storage of a thread, and if the thread releases the memory associated with that page or if the thread exits, then the disk block for that page is released. This affects the output for the ps command and the svmon commands on Version 4.3.3. For more information on the differences between Version 4.3.2 and Version 4.3.3 refer to Commands Reference - Volume 5, SBOF-1877 and System Management Concepts: Operating System and Devices, SC23-4311.
When working with memory performance tuning, the first command to use is usually vmstat.
32 IBM Certification Study Guide AIX Performance and System Tuning
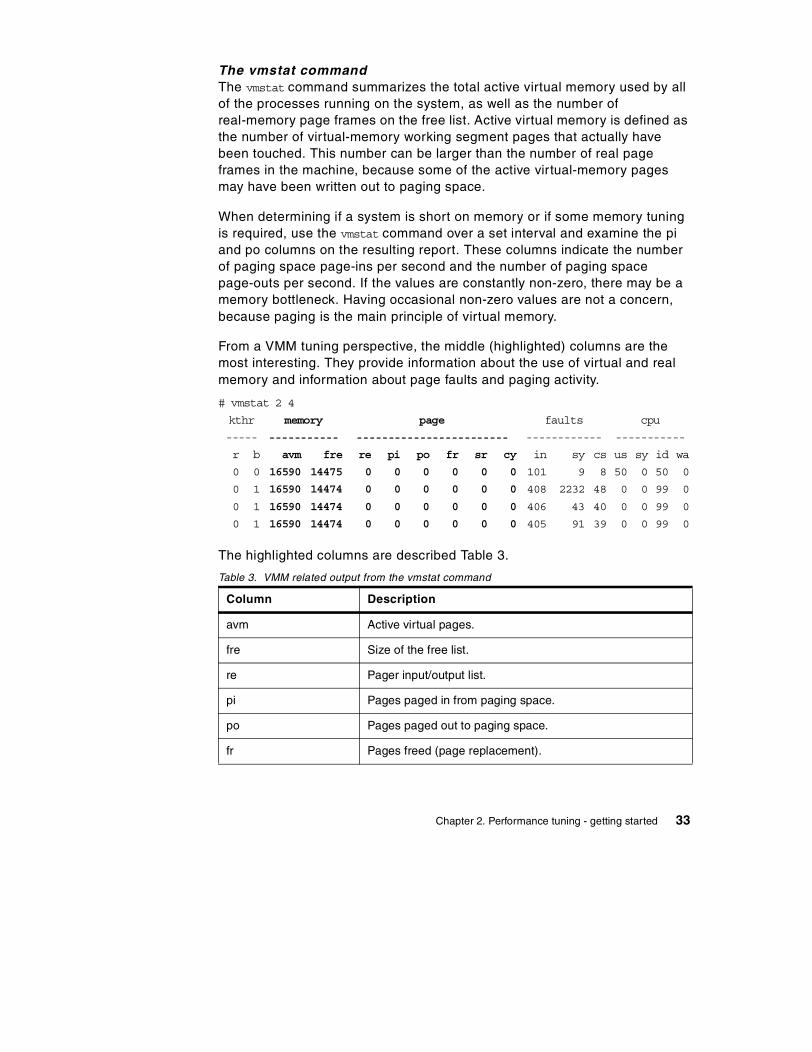
The vmstat commandThe vmstat command summarizes the total active virtual memory used by all of the processes running on the system, as well as the number of real-memory page frames on the free list. Active virtual memory is defined as the number of virtual-memory working segment pages that actually have been touched. This number can be larger than the number of real page frames in the machine, because some of the active virtual-memory pages may have been written out to paging space.
When determining if a system is short on memory or if some memory tuning is required, use the vmstat command over a set interval and examine the pi and po columns on the resulting report. These columns indicate the number of paging space page-ins per second and the number of paging space page-outs per second. If the values are constantly non-zero, there may be a memory bottleneck. Having occasional non-zero values are not a concern, because paging is the main principle of virtual memory.
From a VMM tuning perspective, the middle (highlighted) columns are the most interesting. They provide information about the use of virtual and real memory and information about page faults and paging activity.
# vmstat 2 4
The highlighted columns are described Table 3.
Table 3. VMM related output from the vmstat command
kthr memory page faults cpu
----- ----------- ------------------------ ------------ -----------
r b avm fre re pi po fr sr cy in sy cs us sy id wa
0 0 16590 14475 0 0 0 0 0 0 101 9 8 50 0 50 0
0 1 16590 14474 0 0 0 0 0 0 408 2232 48 0 0 99 0
0 1 16590 14474 0 0 0 0 0 0 406 43 40 0 0 99 0
0 1 16590 14474 0 0 0 0 0 0 405 91 39 0 0 99 0
Column Description
avm Active virtual pages.
fre Size of the free list.
re Pager input/output list.
pi Pages paged in from paging space.
po Pages paged out to paging space.
fr Pages freed (page replacement).
Chapter 2. Performance tuning - getting started 33
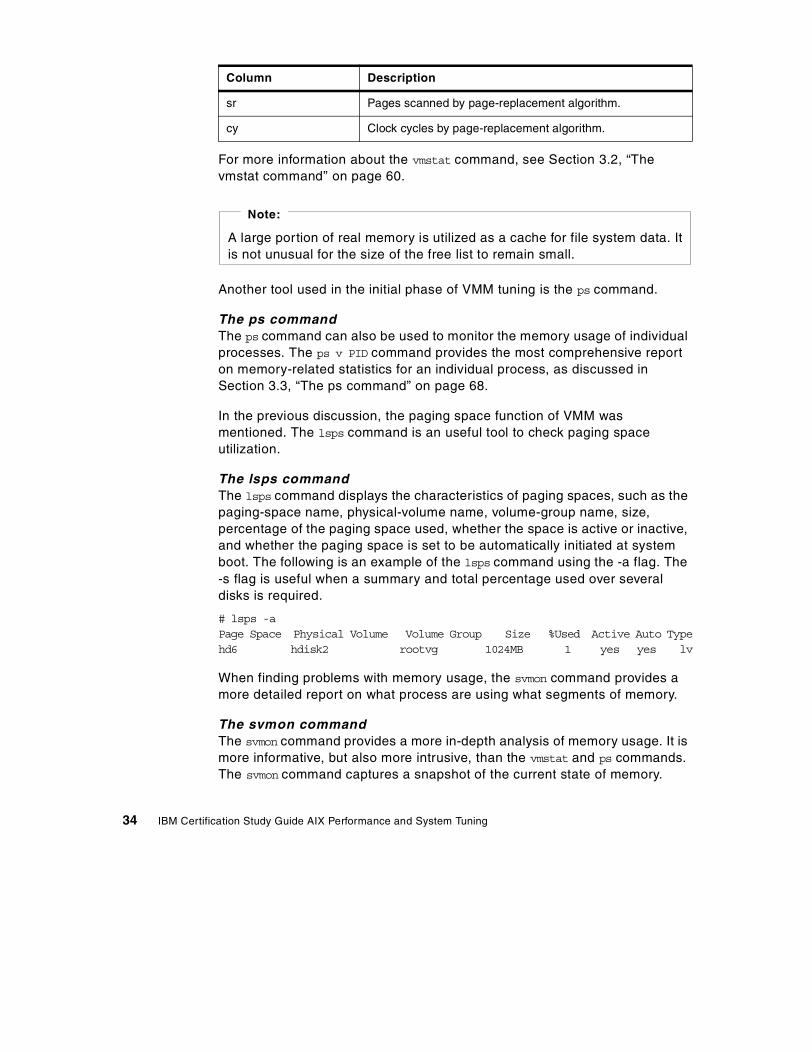
For more information about the vmstat command, see Section 3.2, “The vmstat command” on page 60.
Another tool used in the initial phase of VMM tuning is the ps command.
The ps commandThe ps command can also be used to monitor the memory usage of individual processes. The ps v PID command provides the most comprehensive report on memory-related statistics for an individual process, as discussed in Section 3.3, “The ps command” on page 68.
In the previous discussion, the paging space function of VMM was mentioned. The lsps command is an useful tool to check paging space utilization.
The lsps commandThe lsps command displays the characteristics of paging spaces, such as the paging-space name, physical-volume name, volume-group name, size, percentage of the paging space used, whether the space is active or inactive, and whether the paging space is set to be automatically initiated at system boot. The following is an example of the lsps command using the -a flag. The -s flag is useful when a summary and total percentage used over several disks is required.
# lsps -aPage Space Physical Volume Volume Group Size %Used Active Auto Typehd6 hdisk2 rootvg 1024MB 1 yes yes lv
When finding problems with memory usage, the svmon command provides a more detailed report on what process are using what segments of memory.
The svmon commandThe svmon command provides a more in-depth analysis of memory usage. It is more informative, but also more intrusive, than the vmstat and ps commands. The svmon command captures a snapshot of the current state of memory.
sr Pages scanned by page-replacement algorithm.
cy Clock cycles by page-replacement algorithm.
Column Description
A large portion of real memory is utilized as a cache for file system data. It is not unusual for the size of the free list to remain small.
Note:
34 IBM Certification Study Guide AIX Performance and System Tuning
There are some significant changes in the flags and in the output from the svmon command between AIX Version 4.3.2 and Version 4.3.3. This is discussed in more detail in Section 3.5, “The svmon command” on page 77.
The command to use when tuning memory management is vmtune.
The vmtune commandThe memory management algorithm tries to keep the size of the free list and the percentage of real memory occupied by persistent segment pages within specified bounds. These bounds can be altered with the vmtune command, which can only be run by the root user. Changes made by this tool remain in effect until the next system reboot. More information on the vmtune command can be found in Section 6.5, “The vmtune command” on page 193.
To test how much (or, perhaps, little) memory is needed for a certain server load, use the rmss command.
The rmss commandThe rmss command simulates a system with various sizes of real memory, without having to extract and replace memory boards. By running an application at several memory sizes and collecting performance statistics, you can determine the memory needed to run an application with acceptable performance. The rmss command can be invoked for the following purposes.
• To change the memory size and then exit. This lets you experiment freely with a given memory size.
• To function as a driver program. In this mode, the rmss command executes a specified command multiple times over a range of memory sizes, and displays important statistics describing command performance at each memory size. The command can be an executable or shell script file, with or without command line arguments.
2.4 Disk I/O performance overview
The set of operating system commands, library subroutines, and other tools that allow you to establish and control logical volume storage is called the Logical Volume Manager (LVM). The LVM controls disk resources by mapping data between simple and flexible logical views of storage space and the physical disks. The LVM does this using a layer of device driver code that runs above traditional disk device drivers.
The LVM consists of the logical volume device driver (LVDD) and the LVM subroutine interface library. The logical volume device driver is a pseudo-device driver that manages and processes all I/O. It translates logical
Chapter 2. Performance tuning - getting started 35
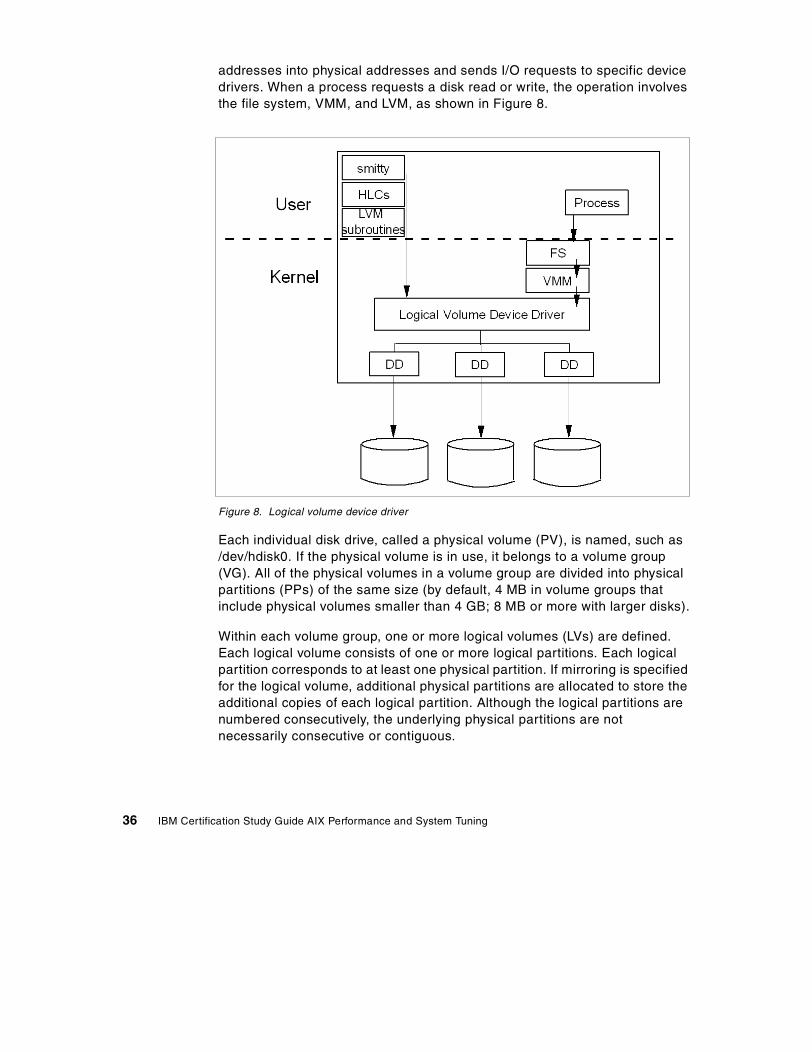
addresses into physical addresses and sends I/O requests to specific device drivers. When a process requests a disk read or write, the operation involves the file system, VMM, and LVM, as shown in Figure 8.
Figure 8. Logical volume device driver
Each individual disk drive, called a physical volume (PV), is named, such as /dev/hdisk0. If the physical volume is in use, it belongs to a volume group (VG). All of the physical volumes in a volume group are divided into physical partitions (PPs) of the same size (by default, 4 MB in volume groups that include physical volumes smaller than 4 GB; 8 MB or more with larger disks).
Within each volume group, one or more logical volumes (LVs) are defined. Each logical volume consists of one or more logical partitions. Each logical partition corresponds to at least one physical partition. If mirroring is specified for the logical volume, additional physical partitions are allocated to store the additional copies of each logical partition. Although the logical partitions are numbered consecutively, the underlying physical partitions are not necessarily consecutive or contiguous.
36 IBM Certification Study Guide AIX Performance and System Tuning
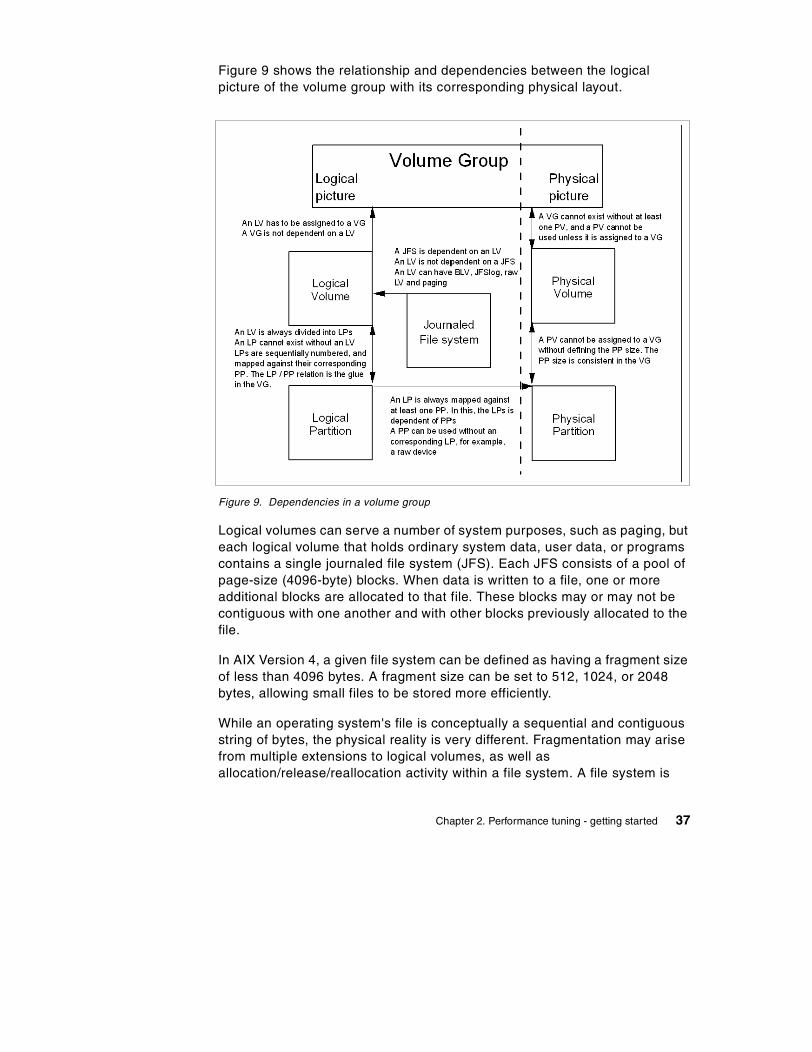
Figure 9 shows the relationship and dependencies between the logical picture of the volume group with its corresponding physical layout.
Figure 9. Dependencies in a volume group
Logical volumes can serve a number of system purposes, such as paging, but each logical volume that holds ordinary system data, user data, or programs contains a single journaled file system (JFS). Each JFS consists of a pool of page-size (4096-byte) blocks. When data is written to a file, one or more additional blocks are allocated to that file. These blocks may or may not be contiguous with one another and with other blocks previously allocated to the file.
In AIX Version 4, a given file system can be defined as having a fragment size of less than 4096 bytes. A fragment size can be set to 512, 1024, or 2048 bytes, allowing small files to be stored more efficiently.
While an operating system's file is conceptually a sequential and contiguous string of bytes, the physical reality is very different. Fragmentation may arise from multiple extensions to logical volumes, as well as allocation/release/reallocation activity within a file system. A file system is
Chapter 2. Performance tuning - getting started 37
fragmented when its available space consists of large numbers of small chunks of space, making it impossible to write out a new file in contiguous blocks.
Access to files in a highly fragmented file system may result in a large number of seeks and longer I/O response times (seek latency dominates I/O response time). For example, if the file is accessed sequentially, a file placement that consists of many widely separated chunks requires more seeks than a placement that consists of one or a few large contiguous chunks.
If the file is accessed randomly, a placement that is widely dispersed requires longer seeks than a placement where the file's blocks are close together.
The VMM tries to anticipate the future need for pages of a sequential file by observing the pattern a program uses to access the file. When the program accesses two successive pages of the file, the VMM assumes that the program will continue to access the file sequentially, and the VMM schedules additional sequential reads of the file. This is called Sequential-Access Read Ahead. These reads are overlapped with the program processing, and will make the data available to the program sooner than if the VMM had waited for the program to access the next page before initiating the I/O. The number of pages to be read ahead is determined by two VMM thresholds:
minpgahead A number of pages read ahead when the VMM first detects the sequential access pattern. If the program continues to access the file sequentially, the next read ahead will be for 2 x minpgahead, the next for 4 x minpgahead, and so on until the number of pages reaches maxpgahead.
maxpgahead A maximum number of pages the VMM will read ahead in a sequential file.
If the program deviates from the sequential-access pattern and accesses a page of the file out of order, sequential read ahead is terminated. It will be resumed with minpgahead pages if the VMM detects a resumption of sequential access by the program. The values of minpgahead and maxpgahead can be set with the vmtune command. More information on the vmtune command can be found in Section 6.5, “The vmtune command” on page 193.
To increase write performance, limit the number of dirty file pages in memory, reduce system overhead, and minimize disk fragmentation, the file system divides each file into 16 KB partitions. The pages of a given partition are not written to disk until the program writes the first byte of the next 16 KB
38 IBM Certification Study Guide AIX Performance and System Tuning
partition. At that point, the file system forces the four dirty pages of the first partition to be written to disk. The pages of data remain in memory until their frames are reused. If a program accesses any of the pages before their frames are reused, no I/O is required.
If a large number of dirty file pages remain in memory and do not get reused, the sync daemon writes them to disk, which may result in abnormal disk utilization. To distribute the I/O activity more efficiently across the workload, write-behind can be turned on to tell the system how many pages to keep in memory before writing them to disk. The write-behind threshold is on a per-file basis, which causes pages to be written to disk before the sync daemon runs. The I/O is spread more evenly throughout the workload.
There are two types of write-behind: sequential and random. The size of the write-behind partitions and the write-behind threshold can be changed with the vmtune command.
Normal files are automatically mapped to segments to provide mapped files. This means that normal file access bypasses traditional kernel buffers and block I/O routines, allowing files to use more memory when the extra memory is available (file caching is not limited to the declared kernel buffer area).
Because most writes are asynchronous, FIFO I/O queues of several megabytes can build up, which can take several seconds to complete. The performance of an interactive process is severely impacted if every disk read spends several seconds working its way through the queue. In response to this problem, the VMM has an option called I/O pacing to control writes.
I/O pacing does not change the interface or processing logic of I/O. It simply limits the number of I/Os that can be outstanding against a file. When a process tries to exceed that limit, it is suspended until enough outstanding requests have been processed to reach a lower threshold.
Disk-I/O pacing is intended to prevent programs that generate very large amounts of output from saturating the system's I/O facilities and causing the response times of less-demanding programs to deteriorate. Disk-I/O pacing enforces per-segment (which effectively means per-file) high- and low-water marks on the sum of all pending I/Os. When a process tries to write to a file that already has high-water mark pending writes, the process is put to sleep until enough I/Os have completed to make the number of pending writes less than or equal to the low-water mark. The logic of I/O-request handling does not change. The output from high-volume processes is slowed down somewhat.
Chapter 2. Performance tuning - getting started 39
When gathering information on I/O performance, the first command to use is iostat.
The iostat commandThe iostat command is used for monitoring system input/output device loading by observing the time the physical disks are active in relation to their average transfer rates. This command generates reports that can be used to change the system configuration to better balance the input/output load between physical disks and adapters. The iostat command gathers its information on the protocol layer.
AIX Version 4.3.3 and later contain enhancements to the method used to compute the percentage of CPU time spent waiting on disk I/O (wio time). The method used in AIX Version 4.3.2 and earlier versions of the operating system can, under certain circumstances, give an inflated view of wio time on SMPs. The wio time is reported by the commands sar (%wio), vmstat (wa), and iostat (% iowait).
In AIX Version 4.3.2 and earlier, at each clock timer tick interrupt on each processor (100 times a second per processor), a determination is made as to which of the four categories (usr/sys/wio/idle) to place the last 10 ms of time. If the CPU was busy in usr mode at the time of the clock interrupt, then usr gets the clock tick added into its category. If the CPU was busy in kernel mode at the time of the clock interrupt, then the sys category gets the tick. If the CPU was not busy, a check is made to see if any I/O to disk is in progress. If it is in progress, the wio category is incremented. If no disk I/O is in progress and the CPU is not busy, the idle category gets the tick.
The inflated view of wio time results from all idle CPUs being categorized as wio regardless of the number of threads waiting on I/O. For example, systems with just one thread doing I/O could report over 90 percent wio time, regardless of the number of CPUs it has.
The change in AIX Version 4.3.3 is to mark only an idle CPU as wio if an outstanding I/O was started on that CPU. This method can report much lower wio times when just a few threads are doing I/O and the system is otherwise idle. For example, a system with four CPUs and one thread doing I/O will report a maximum of 25 percent wio time. A system with 12 CPUs and one thread doing I/O will report a maximum of 8.3 percent wio time.
Also, NFS now goes through the buffer cache and waits in those routines are accounted for in the wa statistics.
40 IBM Certification Study Guide AIX Performance and System Tuning
Another change is that the wa column details the percentage of time the CPU was idle with pending disk I/O to not only local, but also NFS-mounted disks.
More information about the iostat command can be found in Section 4.2, “The iostat command” on page 108.
When experiencing performance problems due to disk I/O, the next step is to find the file system causing the problem. This can be done with the filemon command.
The filemon commandThe filemon command uses the trace facility to obtain a detailed picture of I/O activity during a time interval on the various layers of file system utilization, including the logical file system, virtual memory segments, LVM, and physical disk layers. Both summary and detailed reports are generated. More information about the filemon command can be found in Section 4.5.1, “The filemon command” on page 125.
If a file is identified as the problem, the fileplace command can be used to see how the file is stored.
The fileplace commandThe fileplace command displays the placement of a specified file within the logical or physical volumes containing the file. By default, the fileplace command lists, to standard output, the ranges of logical volume fragments allocated to the specified file. More information about the fileplace command can be found in Section 4.6.2, “The fileplace command” on page 135.
If a logical volume is identified as a problem, the lslv command can provide useful information.
The lslv commandThe lslv command shows, among other information, the logical volume fragmentation. If the workload shows a significant degree of I/O dependency, you can use the lslv command to investigate the physical placement of the files on the disk to determine if reorganization at some level would yield an improvement. More information about the lslv command can be found in Section 4.4.2, “Logical volume fragmentation” on page 122 and Section 4.9.3, “The lslv command” on page 142.
Chapter 2. Performance tuning - getting started 41
2.5 Network performance overview
When performance problems arise and you look for the cause, your local system may not have a problem, while the real problem is buildings away. An easy way to tell if the network is affecting overall performance is to compare those operations that involve the network with those that do not. If you are running a program that does a considerable amount of remote reads and writes and it is running slowly, but everything else seems to be running normally, then it is probably a network problem. Some of the potential network bottlenecks can be caused by the following:
• Client-network interface
• Network bandwidth
• Network topology
• Server network interface
• Server CPU load
• Server memory usage
• Server bandwidth
• Inefficient configuration
A large part of network tuning involves tuning TCP/IP to achieve maximum throughput. With the high bandwidth interfaces such as FIDDI and Gigabit Ethernet, this has become even more important. Before attempting to tune network parameters, it helps to understand their use in the processing layer they affect. Figure 10 on page 43 shows the layers involved in a read or write activity across TCP/IP and provides the network parameters used in each layer.
42 IBM Certification Study Guide AIX Performance and System Tuning
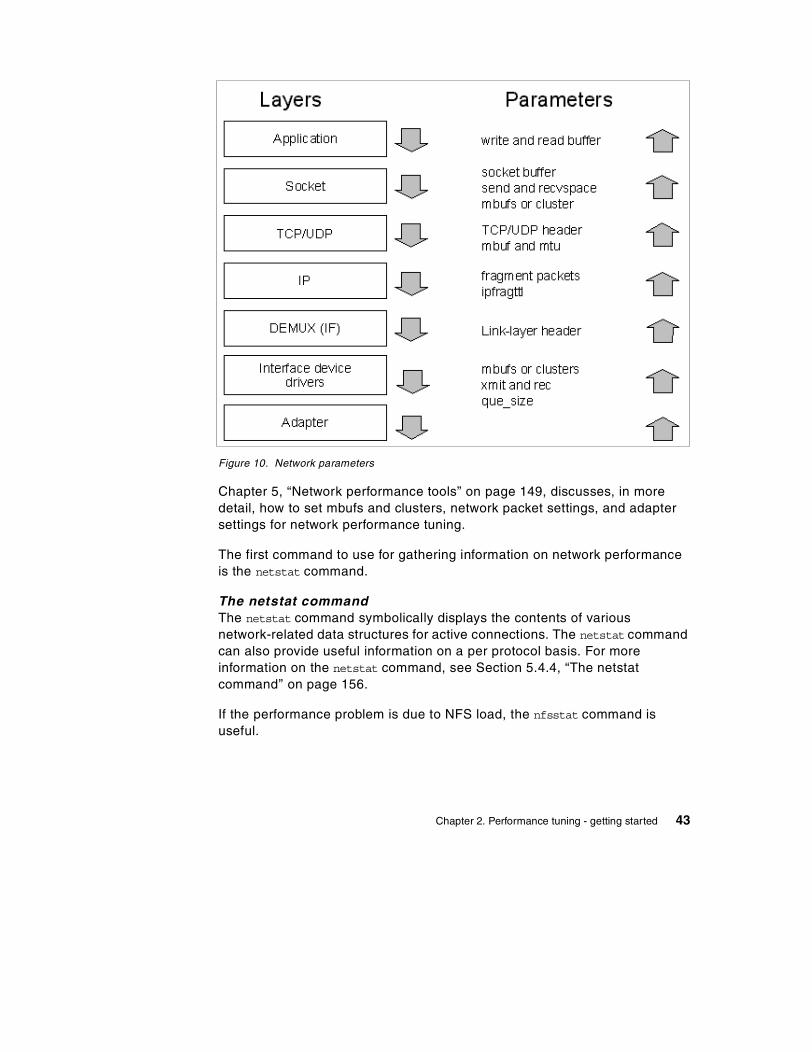
Figure 10. Network parameters
Chapter 5, “Network performance tools” on page 149, discusses, in more detail, how to set mbufs and clusters, network packet settings, and adapter settings for network performance tuning.
The first command to use for gathering information on network performance is the netstat command.
The netstat commandThe netstat command symbolically displays the contents of various network-related data structures for active connections. The netstat command can also provide useful information on a per protocol basis. For more information on the netstat command, see Section 5.4.4, “The netstat command” on page 156.
If the performance problem is due to NFS load, the nfsstat command is useful.
Chapter 2. Performance tuning - getting started 43
The nfsstat commandNFS gathers statistics on types of NFS operations performed, along with error information and performance indicators. You can use the nfsstatcommand to identify network problems and observe the type of NFS operations taking place on your system. The nfsstat command displays statistical information about the NFS and Remote Procedure Call (RPC) interfaces to the kernel. The nfsstat command splits its information into server and client parts. For example, use the command:
• netstat -r to see how an application uses NFS
The output is divided into server connection- and connectionless-oriented, as well as client connection- and connectionless-oriented.
• nfsstat -s to see the server report
The NFS server displays the number of NFS calls received (calls) and rejected (badcalls) due to authentication, as well as the counts and percentages for the various kinds of calls made.
• nfsstat -c to see the client part
The NFS client displays the number of calls sent and rejected, as well as the number of times a client handle was received (clgets) and a count of the various kinds of calls and their respective percentages. For performance monitoring, the nfsstat -c command provides information on whether the network is dropping UDP packets. A network may drop a packet if it cannot handle it. Dropped packets can be the result of the response time of the network hardware or software or an overloaded CPU on the server. Dropped packets are not actually lost, because a replacement request is issued for them.
A high badxid count implies that requests are reaching the various NFS servers, but the servers are too loaded to send replies before the client's RPC calls time out and are retransmitted. The badxid value is incremented each time a duplicate reply is received for a transmitted request (an RPC request retains its XID through all transmission cycles). Excessive retransmissions place an additional strain on the server, further degrading response time.
The retrans column displays the number of times requests were retransmitted due to a time-out while waiting for a response. This situation is related to dropped UDP packets. If the retrans number consistently exceeds five percent of the total calls in column one, it indicates a problem with the server keeping up with demand.
For more information on the nfsstat command, see Performance Management Guide and Commands Reference - Volume 4, SBOF-1877.
44 IBM Certification Study Guide AIX Performance and System Tuning
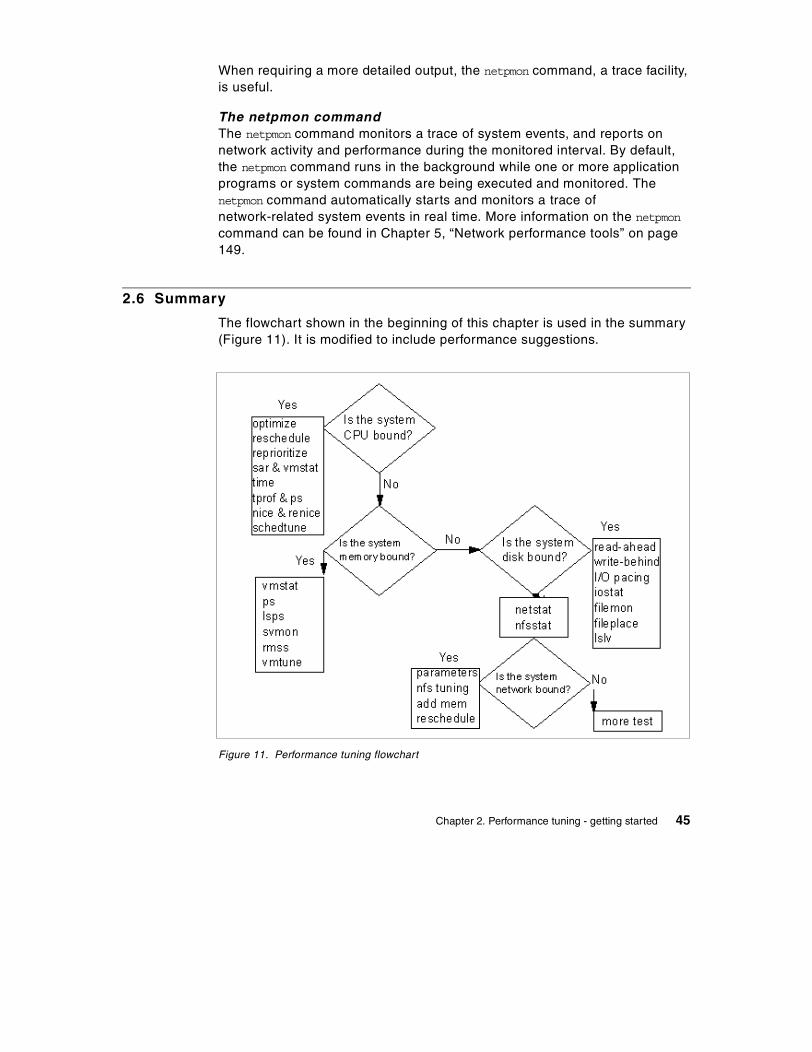
When requiring a more detailed output, the netpmon command, a trace facility, is useful.
The netpmon commandThe netpmon command monitors a trace of system events, and reports on network activity and performance during the monitored interval. By default, the netpmon command runs in the background while one or more application programs or system commands are being executed and monitored. The netpmon command automatically starts and monitors a trace of network-related system events in real time. More information on the netpmon command can be found in Chapter 5, “Network performance tools” on page 149.
2.6 Summary
The flowchart shown in the beginning of this chapter is used in the summary (Figure 11). It is modified to include performance suggestions.
Figure 11. Performance tuning flowchart
Chapter 2. Performance tuning - getting started 45
2.7 Quiz
The following assessment question helps verify your understanding of the topics discussed in this chapter.
1. When paging, cache, and Translation Lookaside Buffer (TLB) metrics or statistics are analyzed for performance, which of the following resources is being analyzed?
A. CPU
B. Memory
C. Disk I/O
D. Network I/O
2.7.1 AnswersThe following is the preferred answer to the question provided in this section.
1. B
46 IBM Certification Study Guide AIX Performance and System Tuning
Chapter 3. CPU and memory performance monitoring tools
This chapter takes a detailed look at several CPU and memory performance monitoring tools. The provided examples will assist you in culling the valuable information from the verbose output generated by these tools.
3.1 The sar command
The sar (System Activity Report) command can be used in two ways to collect data: one is to view system data in real time, and the other is to view data previously captured.
The sar command is one of the first performance monitors to be used by an administrator. Although the sar command does give useful information on most system functions, it should be noted that there are other tools that will give more accurate system utilization reports on specific sections within the environment.
3.1.1 Examples of using the sar commandThe sar command, without any flags, will give an output of every line in the file for the current day as collected by the sa1 command. The time slice can be set up in the crontab file and, in the following example, it uses the default in the /var/spool/cron/crontabs/adm file:
# sar
08:00:00 %usr %sys %wio %idle08:20:00 0 0 0 10008:40:00 0 0 0 10009:00:00 0 0 0 100
Average 0 0 0 100
The sar command, using only interval and number flags, will have the output shown in the following example. This is the same as running the sar -u 1 10 command. The 1 specifies the interval in seconds and the 10 specifies the number of times the data is captured.
# sar 1 10
AIX server2 3 4 000FA17D4C00 06/30/00
09:14:57 %usr %sys %wio %idle09:14:58 54 18 28 0
© Copyright IBM Corp. 2000 47
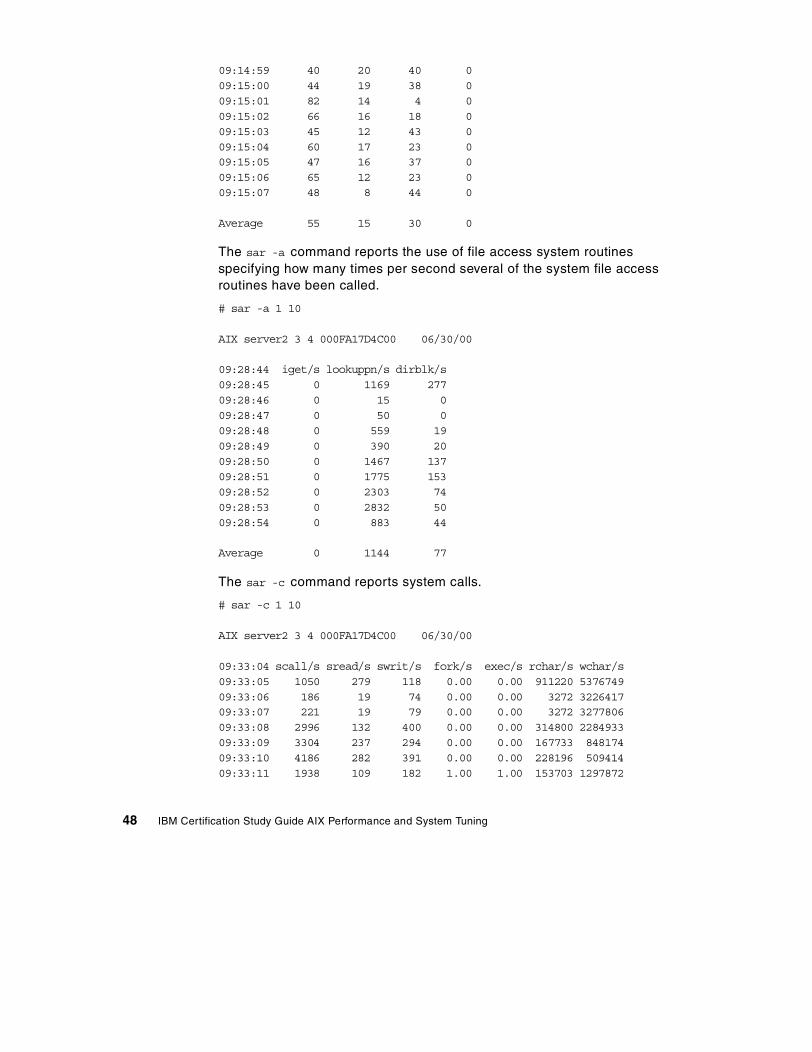
09:14:59 40 20 40 009:15:00 44 19 38 009:15:01 82 14 4 009:15:02 66 16 18 009:15:03 45 12 43 009:15:04 60 17 23 009:15:05 47 16 37 009:15:06 65 12 23 009:15:07 48 8 44 0
Average 55 15 30 0
The sar -a command reports the use of file access system routines specifying how many times per second several of the system file access routines have been called.
# sar -a 1 10
AIX server2 3 4 000FA17D4C00 06/30/00
09:28:44 iget/s lookuppn/s dirblk/s09:28:45 0 1169 27709:28:46 0 15 009:28:47 0 50 009:28:48 0 559 1909:28:49 0 390 2009:28:50 0 1467 13709:28:51 0 1775 15309:28:52 0 2303 7409:28:53 0 2832 5009:28:54 0 883 44
Average 0 1144 77
The sar -c command reports system calls.
# sar -c 1 10
AIX server2 3 4 000FA17D4C00 06/30/00
09:33:04 scall/s sread/s swrit/s fork/s exec/s rchar/s wchar/s09:33:05 1050 279 118 0.00 0.00 911220 537674909:33:06 186 19 74 0.00 0.00 3272 322641709:33:07 221 19 79 0.00 0.00 3272 327780609:33:08 2996 132 400 0.00 0.00 314800 228493309:33:09 3304 237 294 0.00 0.00 167733 84817409:33:10 4186 282 391 0.00 0.00 228196 50941409:33:11 1938 109 182 1.00 1.00 153703 1297872
48 IBM Certification Study Guide AIX Performance and System Tuning
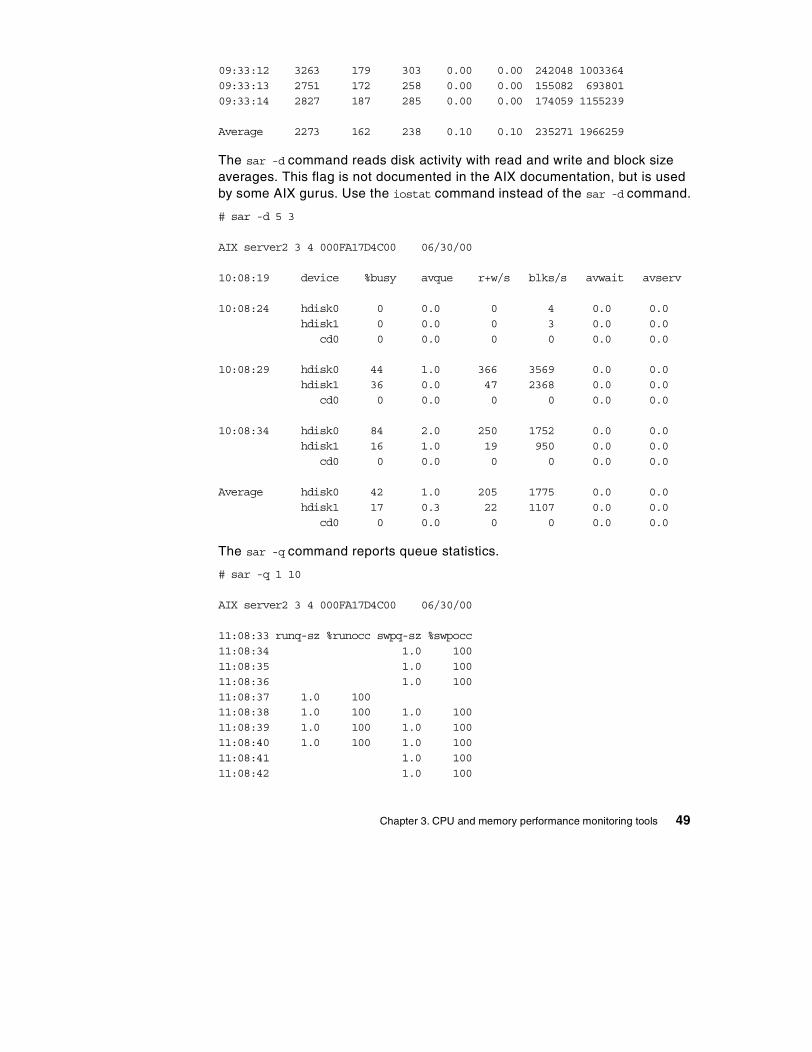
09:33:12 3263 179 303 0.00 0.00 242048 100336409:33:13 2751 172 258 0.00 0.00 155082 69380109:33:14 2827 187 285 0.00 0.00 174059 1155239
Average 2273 162 238 0.10 0.10 235271 1966259
The sar -d command reads disk activity with read and write and block size averages. This flag is not documented in the AIX documentation, but is used by some AIX gurus. Use the iostat command instead of the sar -d command.
# sar -d 5 3
AIX server2 3 4 000FA17D4C00 06/30/00
10:08:19 device %busy avque r+w/s blks/s avwait avserv
10:08:24 hdisk0 0 0.0 0 4 0.0 0.0hdisk1 0 0.0 0 3 0.0 0.0
cd0 0 0.0 0 0 0.0 0.0
10:08:29 hdisk0 44 1.0 366 3569 0.0 0.0hdisk1 36 0.0 47 2368 0.0 0.0
cd0 0 0.0 0 0 0.0 0.0
10:08:34 hdisk0 84 2.0 250 1752 0.0 0.0hdisk1 16 1.0 19 950 0.0 0.0
cd0 0 0.0 0 0 0.0 0.0
Average hdisk0 42 1.0 205 1775 0.0 0.0hdisk1 17 0.3 22 1107 0.0 0.0
cd0 0 0.0 0 0 0.0 0.0
The sar -q command reports queue statistics.
# sar -q 1 10
AIX server2 3 4 000FA17D4C00 06/30/00
11:08:33 runq-sz %runocc swpq-sz %swpocc11:08:34 1.0 10011:08:35 1.0 10011:08:36 1.0 10011:08:37 1.0 10011:08:38 1.0 100 1.0 10011:08:39 1.0 100 1.0 10011:08:40 1.0 100 1.0 10011:08:41 1.0 10011:08:42 1.0 100
Chapter 3. CPU and memory performance monitoring tools 49
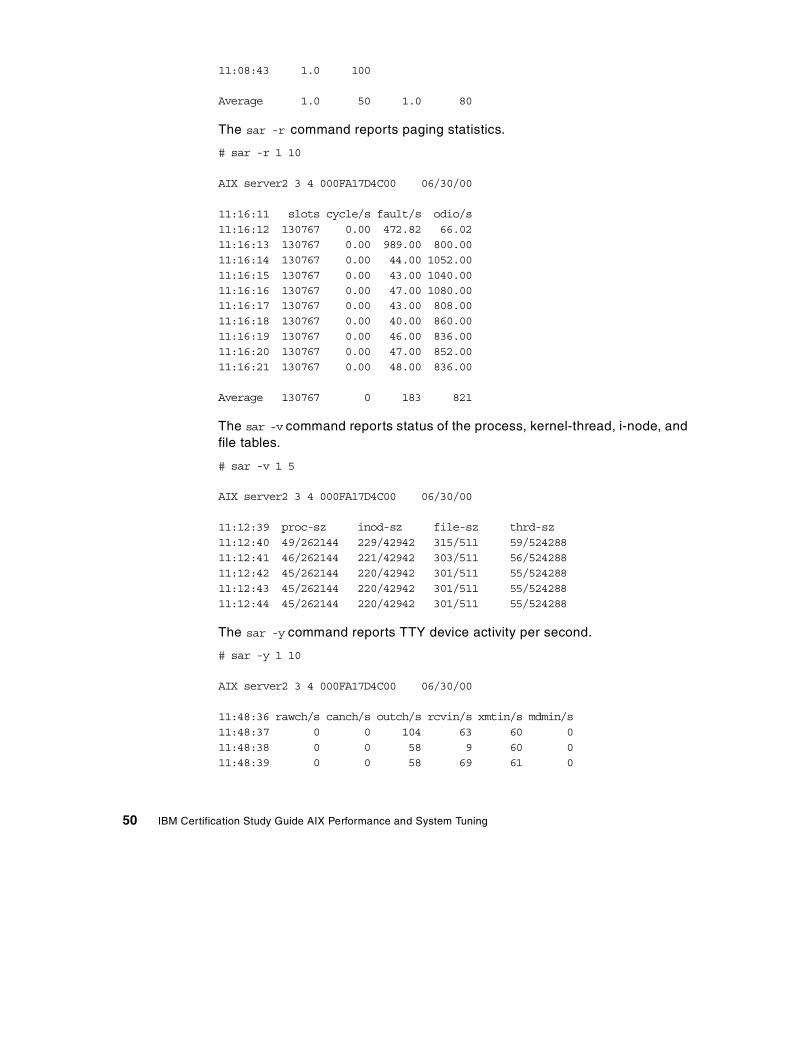
11:08:43 1.0 100
Average 1.0 50 1.0 80
The sar -r command reports paging statistics.
# sar -r 1 10
AIX server2 3 4 000FA17D4C00 06/30/00
11:16:11 slots cycle/s fault/s odio/s11:16:12 130767 0.00 472.82 66.0211:16:13 130767 0.00 989.00 800.0011:16:14 130767 0.00 44.00 1052.0011:16:15 130767 0.00 43.00 1040.0011:16:16 130767 0.00 47.00 1080.0011:16:17 130767 0.00 43.00 808.0011:16:18 130767 0.00 40.00 860.0011:16:19 130767 0.00 46.00 836.0011:16:20 130767 0.00 47.00 852.0011:16:21 130767 0.00 48.00 836.00
Average 130767 0 183 821
The sar -v command reports status of the process, kernel-thread, i-node, and file tables.
# sar -v 1 5
AIX server2 3 4 000FA17D4C00 06/30/00
11:12:39 proc-sz inod-sz file-sz thrd-sz11:12:40 49/262144 229/42942 315/511 59/52428811:12:41 46/262144 221/42942 303/511 56/52428811:12:42 45/262144 220/42942 301/511 55/52428811:12:43 45/262144 220/42942 301/511 55/52428811:12:44 45/262144 220/42942 301/511 55/524288
The sar -y command reports TTY device activity per second.
# sar -y 1 10
AIX server2 3 4 000FA17D4C00 06/30/00
11:48:36 rawch/s canch/s outch/s rcvin/s xmtin/s mdmin/s11:48:37 0 0 104 63 60 011:48:38 0 0 58 9 60 011:48:39 0 0 58 69 61 0
50 IBM Certification Study Guide AIX Performance and System Tuning
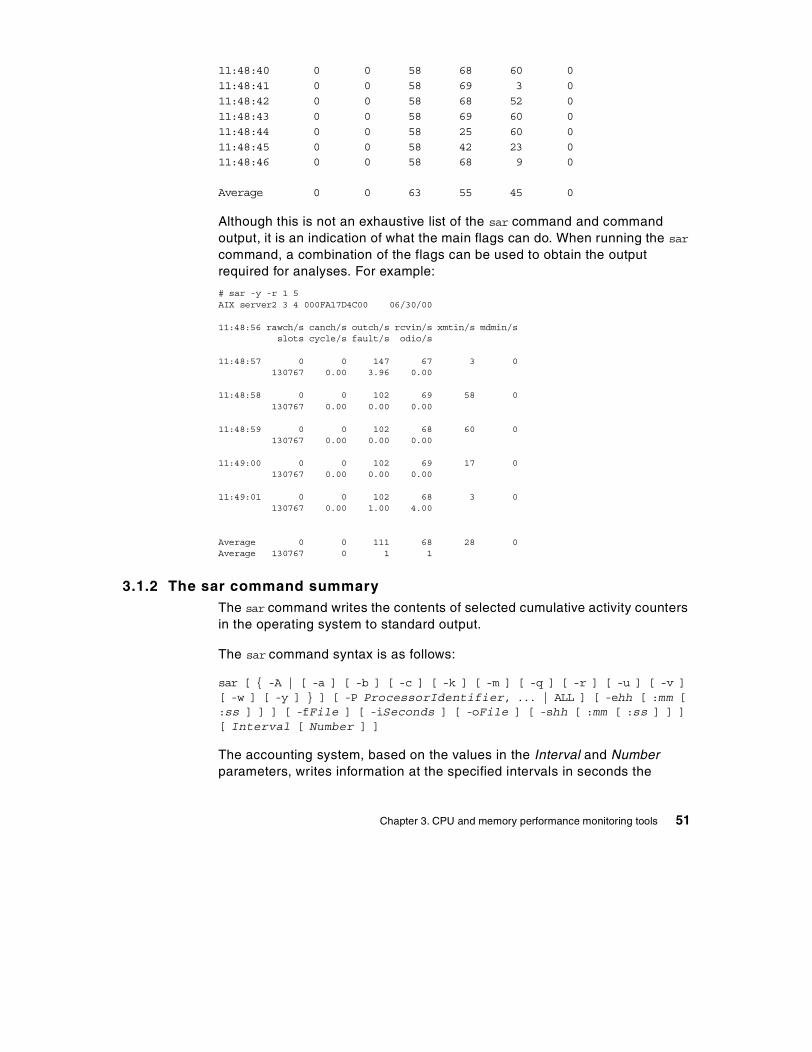
11:48:40 0 0 58 68 60 011:48:41 0 0 58 69 3 011:48:42 0 0 58 68 52 011:48:43 0 0 58 69 60 011:48:44 0 0 58 25 60 011:48:45 0 0 58 42 23 011:48:46 0 0 58 68 9 0
Average 0 0 63 55 45 0
Although this is not an exhaustive list of the sar command and command output, it is an indication of what the main flags can do. When running the sar command, a combination of the flags can be used to obtain the output required for analyses. For example:
# sar -y -r 1 5AIX server2 3 4 000FA17D4C00 06/30/00
11:48:56 rawch/s canch/s outch/s rcvin/s xmtin/s mdmin/sslots cycle/s fault/s odio/s
11:48:57 0 0 147 67 3 0130767 0.00 3.96 0.00
11:48:58 0 0 102 69 58 0130767 0.00 0.00 0.00
11:48:59 0 0 102 68 60 0130767 0.00 0.00 0.00
11:49:00 0 0 102 69 17 0130767 0.00 0.00 0.00
11:49:01 0 0 102 68 3 0130767 0.00 1.00 4.00
Average 0 0 111 68 28 0Average 130767 0 1 1
3.1.2 The sar command summaryThe sar command writes the contents of selected cumulative activity counters in the operating system to standard output.
The sar command syntax is as follows:
sar [ { -A | [ -a ] [ -b ] [ -c ] [ -k ] [ -m ] [ -q ] [ -r ] [ -u ] [ -v ][ -w ] [ -y ] } ] [ -P ProcessorIdentifier, ... | ALL ] [ -ehh [ :mm [:ss ] ] ] [ -fFile ] [ -iSeconds ] [ -oFile ] [ -shh [ :mm [ :ss ] ] ][ Interval [ Number ] ]
The accounting system, based on the values in the Interval and Number parameters, writes information at the specified intervals in seconds the
Chapter 3. CPU and memory performance monitoring tools 51
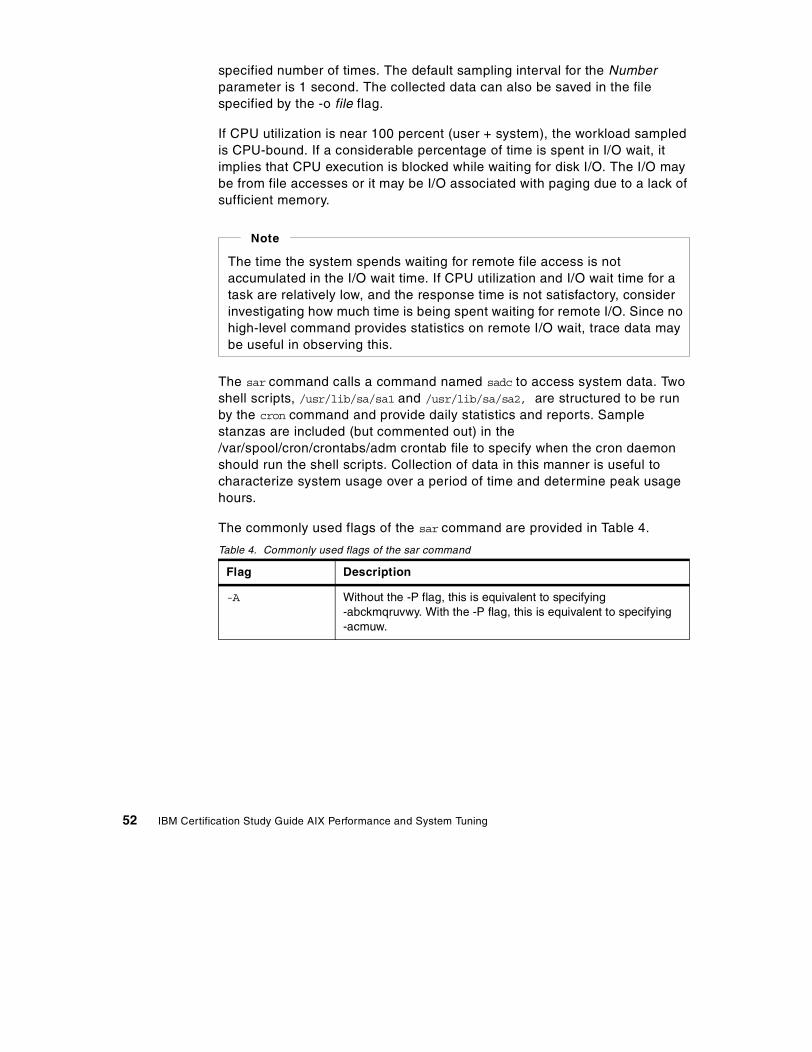
specified number of times. The default sampling interval for the Number parameter is 1 second. The collected data can also be saved in the file specified by the -o file flag.
If CPU utilization is near 100 percent (user + system), the workload sampled is CPU-bound. If a considerable percentage of time is spent in I/O wait, it implies that CPU execution is blocked while waiting for disk I/O. The I/O may be from file accesses or it may be I/O associated with paging due to a lack of sufficient memory.
The sar command calls a command named sadc to access system data. Two shell scripts, /usr/lib/sa/sa1 and /usr/lib/sa/sa2, are structured to be run by the cron command and provide daily statistics and reports. Sample stanzas are included (but commented out) in the /var/spool/cron/crontabs/adm crontab file to specify when the cron daemon should run the shell scripts. Collection of data in this manner is useful to characterize system usage over a period of time and determine peak usage hours.
The commonly used flags of the sar command are provided in Table 4.
Table 4. Commonly used flags of the sar command
Flag Description
-A Without the -P flag, this is equivalent to specifying -abckmqruvwy. With the -P flag, this is equivalent to specifying -acmuw.
The time the system spends waiting for remote file access is not accumulated in the I/O wait time. If CPU utilization and I/O wait time for a task are relatively low, and the response time is not satisfactory, consider investigating how much time is being spent waiting for remote I/O. Since no high-level command provides statistics on remote I/O wait, trace data may be useful in observing this.
Note
52 IBM Certification Study Guide AIX Performance and System Tuning
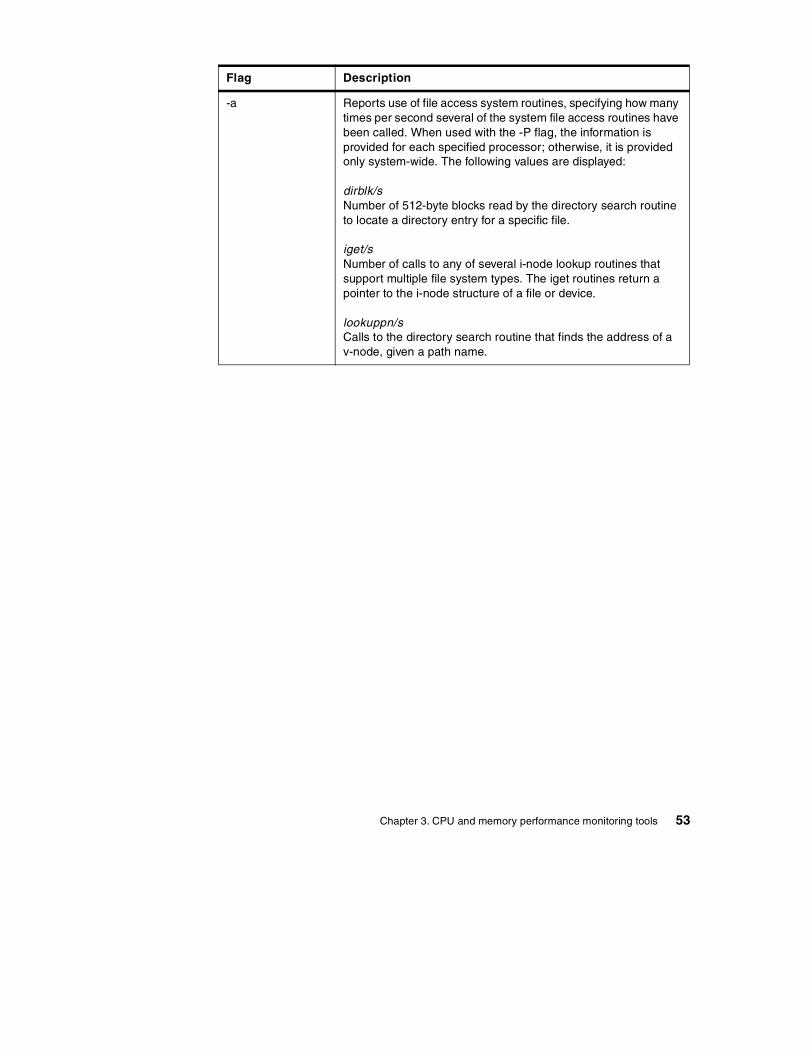
-a Reports use of file access system routines, specifying how many times per second several of the system file access routines have been called. When used with the -P flag, the information is provided for each specified processor; otherwise, it is provided only system-wide. The following values are displayed:
dirblk/s Number of 512-byte blocks read by the directory search routine to locate a directory entry for a specific file.
iget/s Number of calls to any of several i-node lookup routines that support multiple file system types. The iget routines return a pointer to the i-node structure of a file or device.
lookuppn/s Calls to the directory search routine that finds the address of a v-node, given a path name.
Flag Description
Chapter 3. CPU and memory performance monitoring tools 53
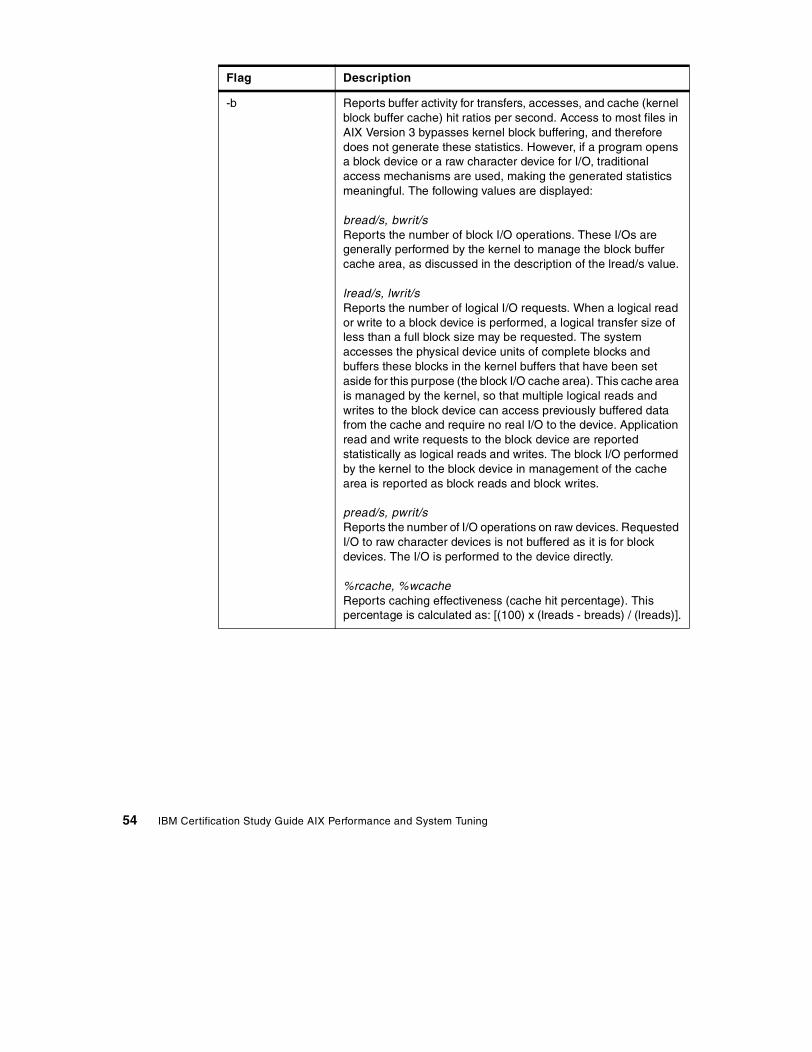
-b Reports buffer activity for transfers, accesses, and cache (kernel block buffer cache) hit ratios per second. Access to most files in AIX Version 3 bypasses kernel block buffering, and therefore does not generate these statistics. However, if a program opens a block device or a raw character device for I/O, traditional access mechanisms are used, making the generated statistics meaningful. The following values are displayed:
bread/s, bwrit/s Reports the number of block I/O operations. These I/Os are generally performed by the kernel to manage the block buffer cache area, as discussed in the description of the lread/s value.
lread/s, lwrit/s Reports the number of logical I/O requests. When a logical read or write to a block device is performed, a logical transfer size of less than a full block size may be requested. The system accesses the physical device units of complete blocks and buffers these blocks in the kernel buffers that have been set aside for this purpose (the block I/O cache area). This cache area is managed by the kernel, so that multiple logical reads and writes to the block device can access previously buffered data from the cache and require no real I/O to the device. Application read and write requests to the block device are reported statistically as logical reads and writes. The block I/O performed by the kernel to the block device in management of the cache area is reported as block reads and block writes.
pread/s, pwrit/s Reports the number of I/O operations on raw devices. Requested I/O to raw character devices is not buffered as it is for block devices. The I/O is performed to the device directly.
%rcache, %wcache Reports caching effectiveness (cache hit percentage). This percentage is calculated as: [(100) x (lreads - breads) / (lreads)].
Flag Description
54 IBM Certification Study Guide AIX Performance and System Tuning
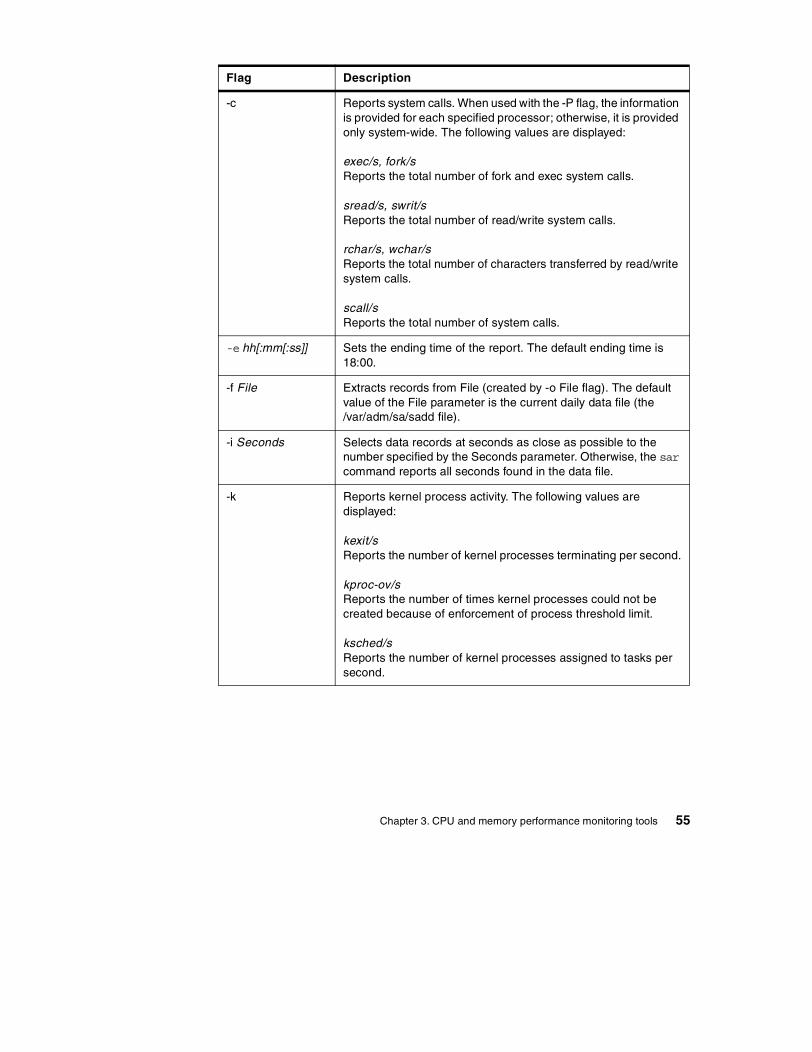
-c Reports system calls. When used with the -P flag, the information is provided for each specified processor; otherwise, it is provided only system-wide. The following values are displayed:
exec/s, fork/s Reports the total number of fork and exec system calls.
sread/s, swrit/s Reports the total number of read/write system calls.
rchar/s, wchar/s Reports the total number of characters transferred by read/write system calls.
scall/s Reports the total number of system calls.
-e hh[:mm[:ss]] Sets the ending time of the report. The default ending time is 18:00.
-f File Extracts records from File (created by -o File flag). The default value of the File parameter is the current daily data file (the /var/adm/sa/sadd file).
-i Seconds Selects data records at seconds as close as possible to the number specified by the Seconds parameter. Otherwise, the sar command reports all seconds found in the data file.
-k Reports kernel process activity. The following values are displayed:
kexit/s Reports the number of kernel processes terminating per second.
kproc-ov/s Reports the number of times kernel processes could not be created because of enforcement of process threshold limit.
ksched/s Reports the number of kernel processes assigned to tasks per second.
Flag Description
Chapter 3. CPU and memory performance monitoring tools 55
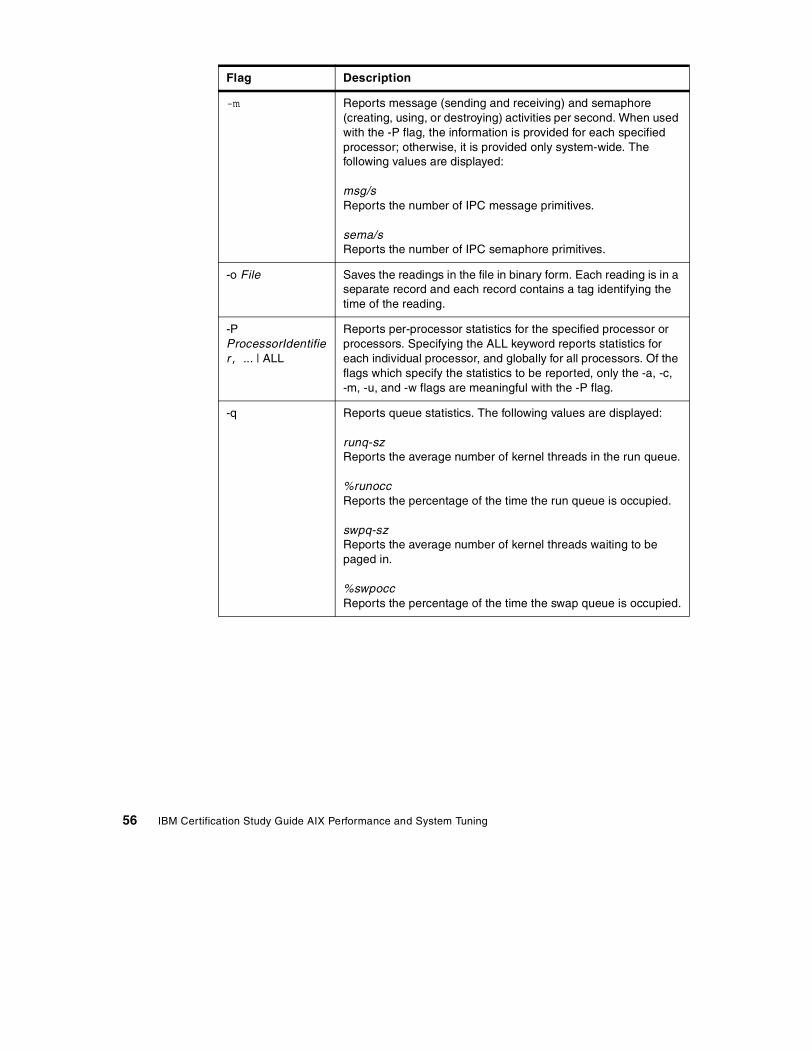
-m Reports message (sending and receiving) and semaphore (creating, using, or destroying) activities per second. When used with the -P flag, the information is provided for each specified processor; otherwise, it is provided only system-wide. The following values are displayed:
msg/s Reports the number of IPC message primitives.
sema/s Reports the number of IPC semaphore primitives.
-o File Saves the readings in the file in binary form. Each reading is in a separate record and each record contains a tag identifying the time of the reading.
-P ProcessorIdentifier, ... | ALL
Reports per-processor statistics for the specified processor or processors. Specifying the ALL keyword reports statistics for each individual processor, and globally for all processors. Of the flags which specify the statistics to be reported, only the -a, -c, -m, -u, and -w flags are meaningful with the -P flag.
-q Reports queue statistics. The following values are displayed:
runq-sz Reports the average number of kernel threads in the run queue.
%runocc Reports the percentage of the time the run queue is occupied.
swpq-sz Reports the average number of kernel threads waiting to be paged in.
%swpocc Reports the percentage of the time the swap queue is occupied.
Flag Description
56 IBM Certification Study Guide AIX Performance and System Tuning
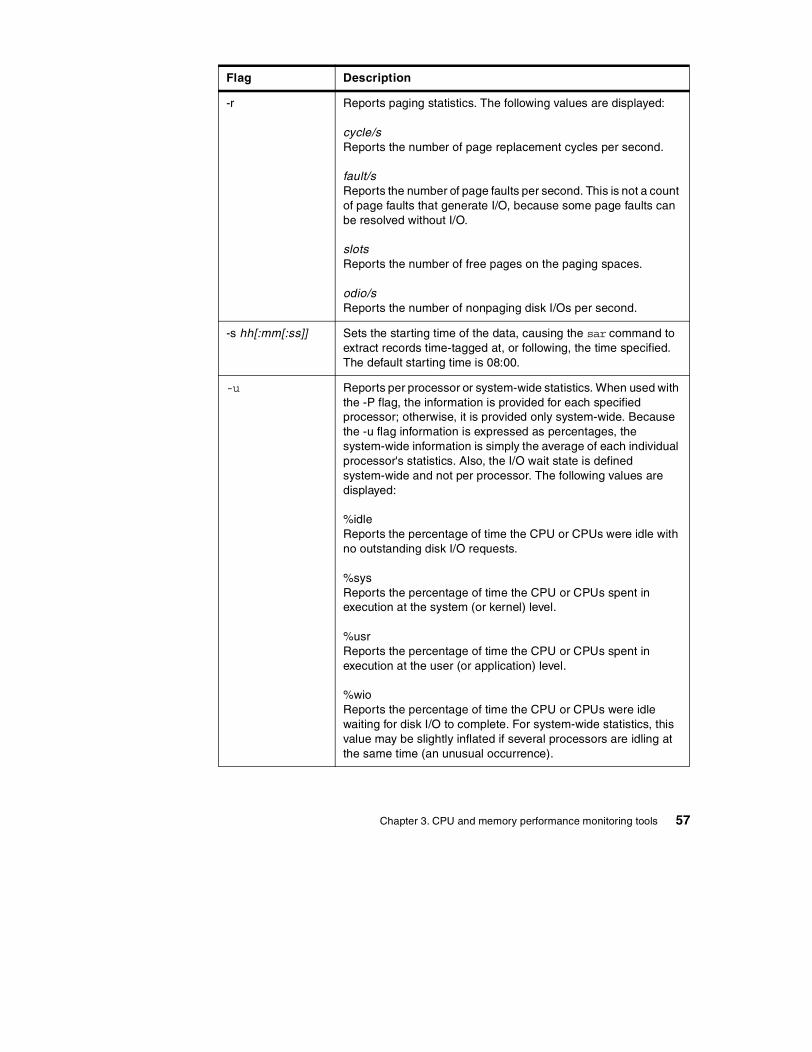
-r Reports paging statistics. The following values are displayed:
cycle/s Reports the number of page replacement cycles per second.
fault/s Reports the number of page faults per second. This is not a count of page faults that generate I/O, because some page faults can be resolved without I/O.
slots Reports the number of free pages on the paging spaces.
odio/s Reports the number of nonpaging disk I/Os per second.
-s hh[:mm[:ss]] Sets the starting time of the data, causing the sar command to extract records time-tagged at, or following, the time specified. The default starting time is 08:00.
-u Reports per processor or system-wide statistics. When used with the -P flag, the information is provided for each specified processor; otherwise, it is provided only system-wide. Because the -u flag information is expressed as percentages, the system-wide information is simply the average of each individual processor's statistics. Also, the I/O wait state is defined system-wide and not per processor. The following values are displayed:
%idle Reports the percentage of time the CPU or CPUs were idle with no outstanding disk I/O requests.
%sys Reports the percentage of time the CPU or CPUs spent in execution at the system (or kernel) level.
%usr Reports the percentage of time the CPU or CPUs spent in execution at the user (or application) level.
%wio Reports the percentage of time the CPU or CPUs were idle waiting for disk I/O to complete. For system-wide statistics, this value may be slightly inflated if several processors are idling at the same time (an unusual occurrence).
Flag Description
Chapter 3. CPU and memory performance monitoring tools 57
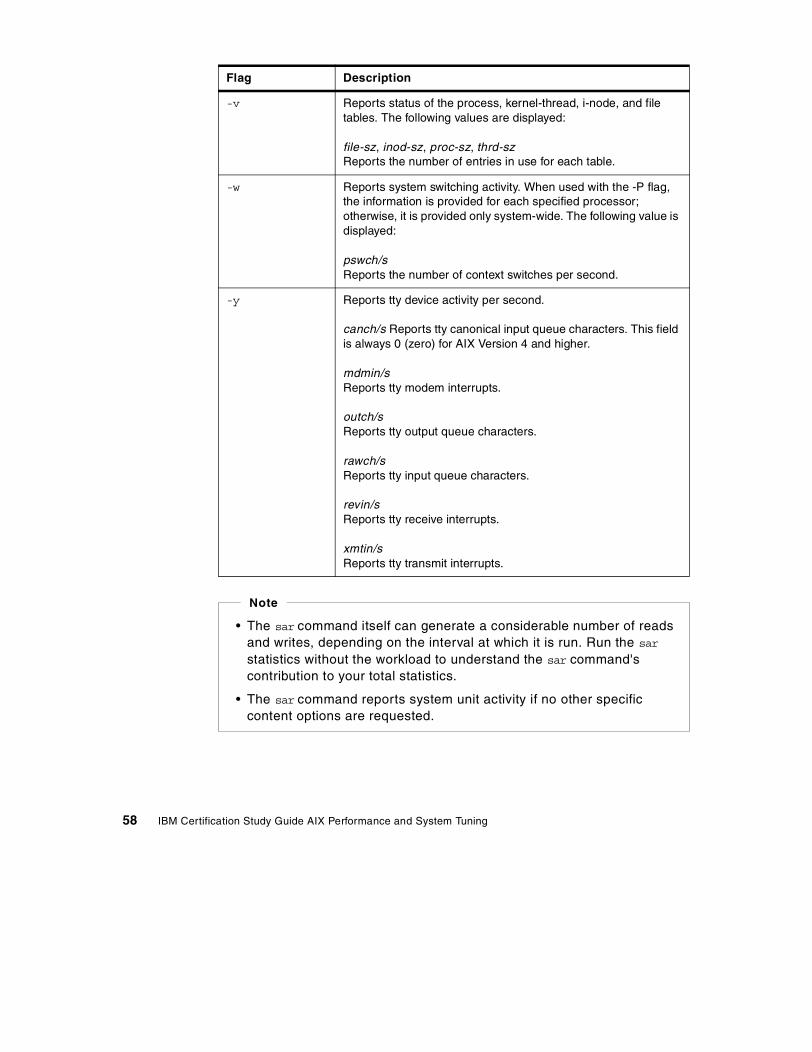
-v Reports status of the process, kernel-thread, i-node, and file tables. The following values are displayed:
file-sz, inod-sz, proc-sz, thrd-sz Reports the number of entries in use for each table.
-w Reports system switching activity. When used with the -P flag, the information is provided for each specified processor; otherwise, it is provided only system-wide. The following value is displayed:
pswch/s Reports the number of context switches per second.
-y Reports tty device activity per second.
canch/s Reports tty canonical input queue characters. This field is always 0 (zero) for AIX Version 4 and higher.
mdmin/s Reports tty modem interrupts.
outch/s Reports tty output queue characters.
rawch/s Reports tty input queue characters.
revin/s Reports tty receive interrupts.
xmtin/s Reports tty transmit interrupts.
Flag Description
• The sar command itself can generate a considerable number of reads and writes, depending on the interval at which it is run. Run the sar statistics without the workload to understand the sar command's contribution to your total statistics.
• The sar command reports system unit activity if no other specific content options are requested.
Note
58 IBM Certification Study Guide AIX Performance and System Tuning
3.1.3 The sadc commandThe sadc command provides a system data collector report.
The syntax for the sadc command is as follows:
sadc [ Interval Number ] [ Outfile ]
It samples system data a specified interval measured in seconds (Interval) at a specified number of times (Number). It writes in binary format to the specified file (Outfile) or to the standard output. When both Interval and Number are not specified, a dummy record, which is used at system startup to mark the time when the counter restarts from 0, will be written. The sadc command is intended to be used as a backend to the sar command.
AIX contains a number of counters that are increased as various system actions occur. The various system actions include:
• System unit utilization counters
• Buffer usage counters
• Disk and tape I/O activity counters
• TTY device activity counters
• Switching and subroutine counters
• File access counters
• Queue activity counters
• Interprocess communication counters
3.1.4 The sa1 and sa2 commandsThe sa1 command is a shell procedure variant of the sadc command and handles all of the flags and parameters of that command. The sa1 command collects and stores binary data in the /var/adm/sa/sadd file, where dd is the day of the month.
The syntax for the sa1 command is as follows:
sa1 [ Interval Number ]
The Interval and Number parameters specify that the record should be written number times at interval seconds. If you do not specify these parameters, a single record is written.
The sa1 command is designed to be started automatically by the cron command. If the sa1 command is not run daily from the cron command, the
Chapter 3. CPU and memory performance monitoring tools 59
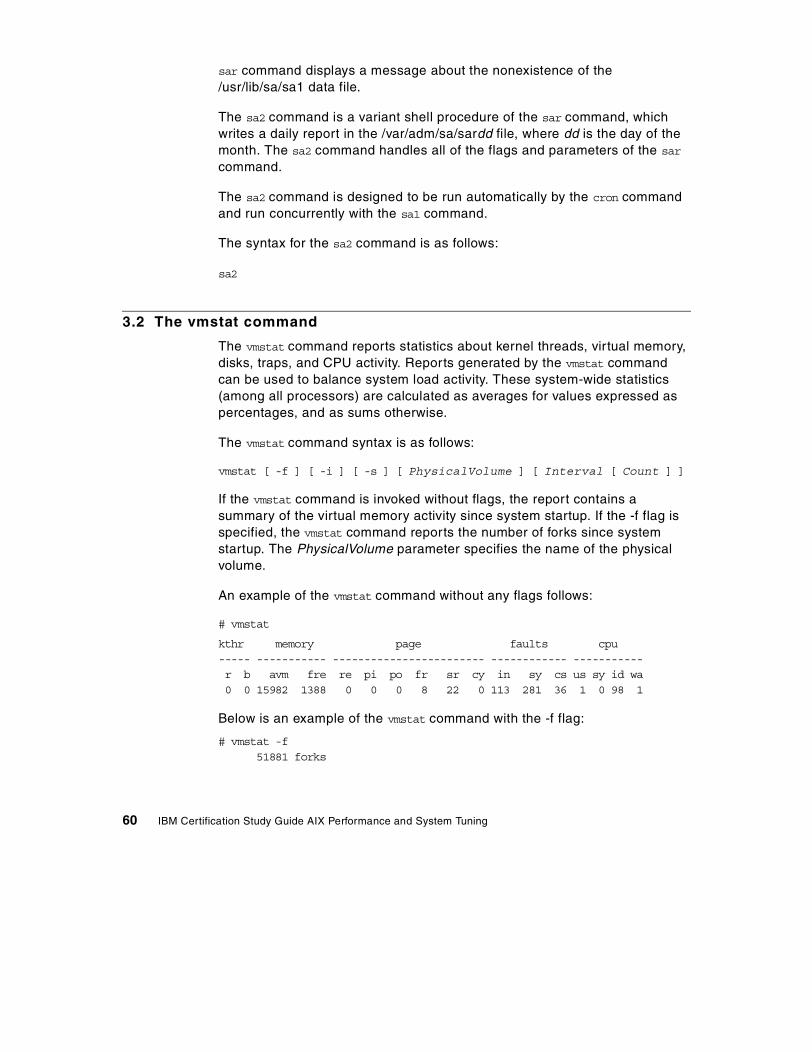
sar command displays a message about the nonexistence of the /usr/lib/sa/sa1 data file.
The sa2 command is a variant shell procedure of the sar command, which writes a daily report in the /var/adm/sa/sardd file, where dd is the day of the month. The sa2 command handles all of the flags and parameters of the sar command.
The sa2 command is designed to be run automatically by the cron command and run concurrently with the sa1 command.
The syntax for the sa2 command is as follows:
sa2
3.2 The vmstat command
The vmstat command reports statistics about kernel threads, virtual memory, disks, traps, and CPU activity. Reports generated by the vmstat command can be used to balance system load activity. These system-wide statistics (among all processors) are calculated as averages for values expressed as percentages, and as sums otherwise.
The vmstat command syntax is as follows:
vmstat [ -f ] [ -i ] [ -s ] [ PhysicalVolume ] [ Interval [ Count ] ]
If the vmstat command is invoked without flags, the report contains a summary of the virtual memory activity since system startup. If the -f flag is specified, the vmstat command reports the number of forks since system startup. The PhysicalVolume parameter specifies the name of the physical volume.
An example of the vmstat command without any flags follows:
# vmstat
kthr memory page faults cpu----- ----------- ------------------------ ------------ -----------r b avm fre re pi po fr sr cy in sy cs us sy id wa0 0 15982 1388 0 0 0 8 22 0 113 281 36 1 0 98 1
Below is an example of the vmstat command with the -f flag:
# vmstat -f51881 forks
60 IBM Certification Study Guide AIX Performance and System Tuning
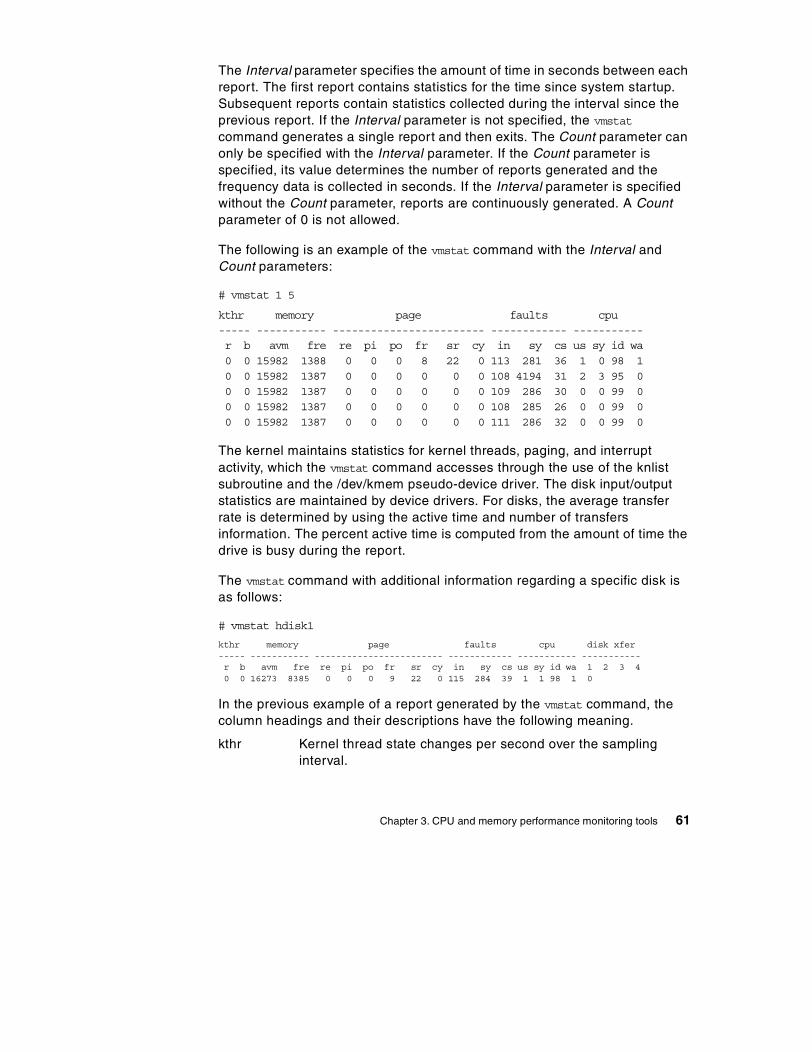
The Interval parameter specifies the amount of time in seconds between each report. The first report contains statistics for the time since system startup. Subsequent reports contain statistics collected during the interval since the previous report. If the Interval parameter is not specified, the vmstat command generates a single report and then exits. The Count parameter can only be specified with the Interval parameter. If the Count parameter is specified, its value determines the number of reports generated and the frequency data is collected in seconds. If the Interval parameter is specified without the Count parameter, reports are continuously generated. A Count parameter of 0 is not allowed.
The following is an example of the vmstat command with the Interval and Count parameters:
# vmstat 1 5
kthr memory page faults cpu----- ----------- ------------------------ ------------ -----------r b avm fre re pi po fr sr cy in sy cs us sy id wa0 0 15982 1388 0 0 0 8 22 0 113 281 36 1 0 98 10 0 15982 1387 0 0 0 0 0 0 108 4194 31 2 3 95 00 0 15982 1387 0 0 0 0 0 0 109 286 30 0 0 99 00 0 15982 1387 0 0 0 0 0 0 108 285 26 0 0 99 00 0 15982 1387 0 0 0 0 0 0 111 286 32 0 0 99 0
The kernel maintains statistics for kernel threads, paging, and interrupt activity, which the vmstat command accesses through the use of the knlist subroutine and the /dev/kmem pseudo-device driver. The disk input/output statistics are maintained by device drivers. For disks, the average transfer rate is determined by using the active time and number of transfers information. The percent active time is computed from the amount of time the drive is busy during the report.
The vmstat command with additional information regarding a specific disk is as follows:
# vmstat hdisk1
kthr memory page faults cpu disk xfer----- ----------- ------------------------ ------------ ----------- -----------r b avm fre re pi po fr sr cy in sy cs us sy id wa 1 2 3 40 0 16273 8385 0 0 0 9 22 0 115 284 39 1 1 98 1 0
In the previous example of a report generated by the vmstat command, the column headings and their descriptions have the following meaning.
kthr Kernel thread state changes per second over the sampling interval.
Chapter 3. CPU and memory performance monitoring tools 61
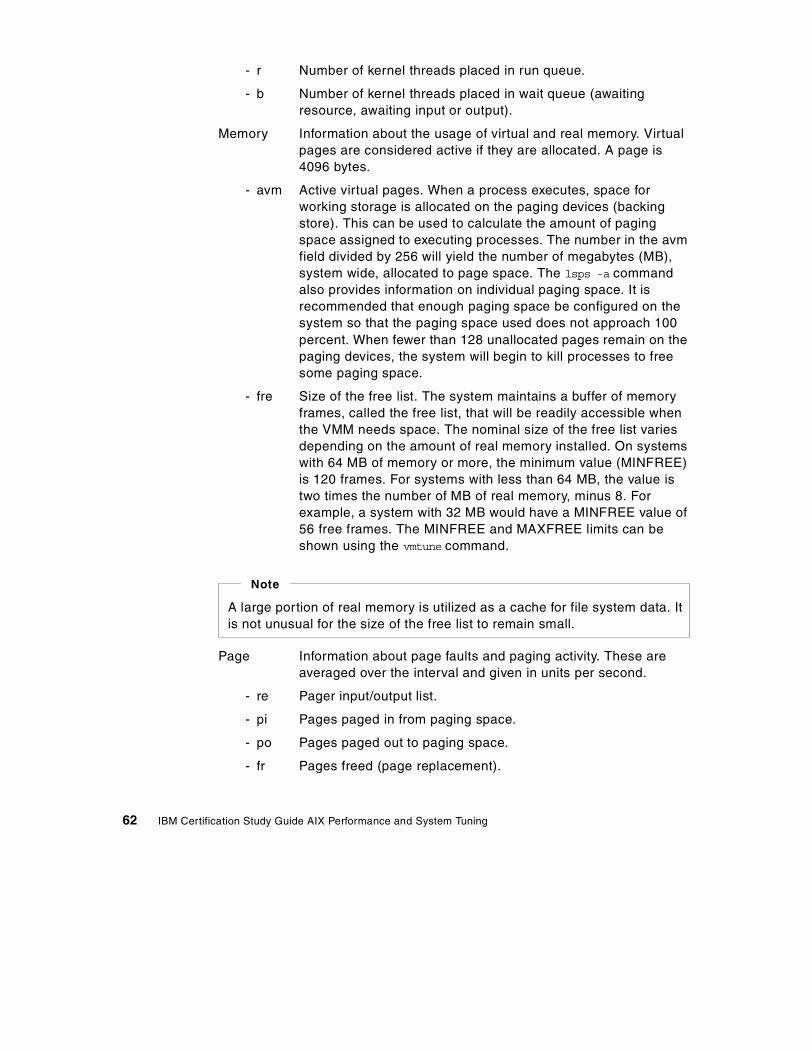
- r Number of kernel threads placed in run queue.
- b Number of kernel threads placed in wait queue (awaiting resource, awaiting input or output).
Memory Information about the usage of virtual and real memory. Virtual pages are considered active if they are allocated. A page is 4096 bytes.
- avm Active virtual pages. When a process executes, space for working storage is allocated on the paging devices (backing store). This can be used to calculate the amount of paging space assigned to executing processes. The number in the avm field divided by 256 will yield the number of megabytes (MB), system wide, allocated to page space. The lsps -a command also provides information on individual paging space. It is recommended that enough paging space be configured on the system so that the paging space used does not approach 100 percent. When fewer than 128 unallocated pages remain on the paging devices, the system will begin to kill processes to free some paging space.
- fre Size of the free list. The system maintains a buffer of memory frames, called the free list, that will be readily accessible when the VMM needs space. The nominal size of the free list varies depending on the amount of real memory installed. On systems with 64 MB of memory or more, the minimum value (MINFREE) is 120 frames. For systems with less than 64 MB, the value is two times the number of MB of real memory, minus 8. For example, a system with 32 MB would have a MINFREE value of 56 free frames. The MINFREE and MAXFREE limits can be shown using the vmtune command.
Page Information about page faults and paging activity. These are averaged over the interval and given in units per second.
- re Pager input/output list.
- pi Pages paged in from paging space.
- po Pages paged out to paging space.
- fr Pages freed (page replacement).
A large portion of real memory is utilized as a cache for file system data. It is not unusual for the size of the free list to remain small.
Note
62 IBM Certification Study Guide AIX Performance and System Tuning
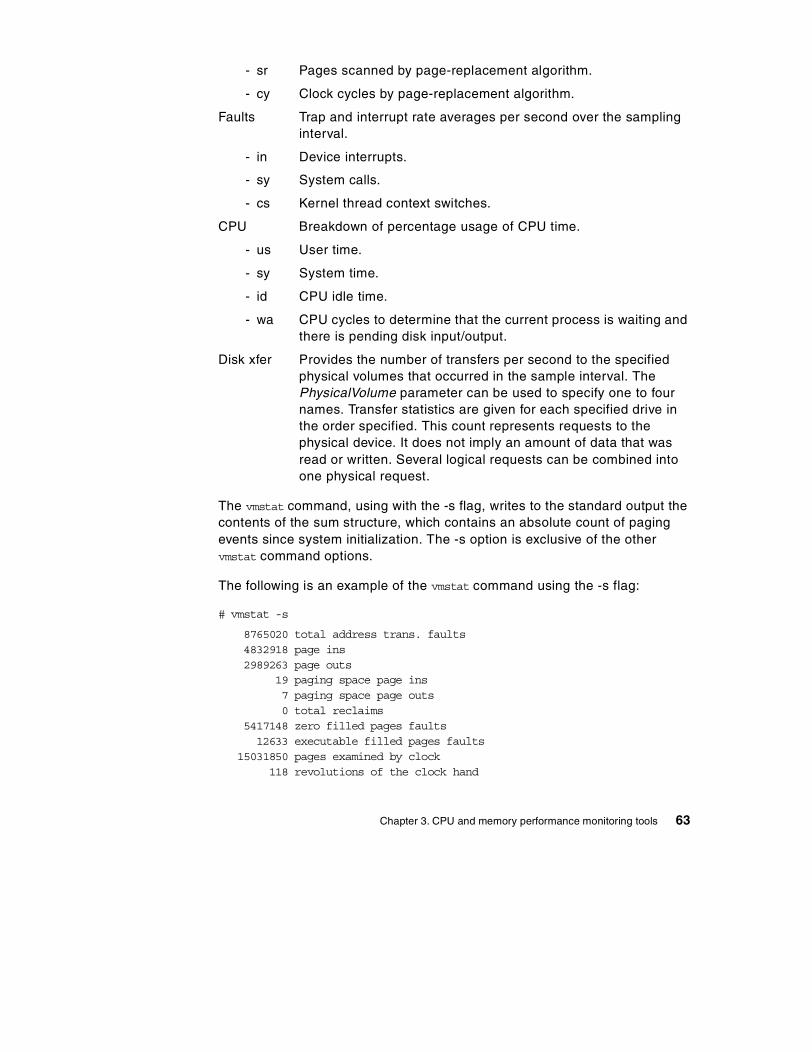
- sr Pages scanned by page-replacement algorithm.
- cy Clock cycles by page-replacement algorithm.
Faults Trap and interrupt rate averages per second over the sampling interval.
- in Device interrupts.
- sy System calls.
- cs Kernel thread context switches.
CPU Breakdown of percentage usage of CPU time.
- us User time.
- sy System time.
- id CPU idle time.
- wa CPU cycles to determine that the current process is waiting and there is pending disk input/output.
Disk xfer Provides the number of transfers per second to the specified physical volumes that occurred in the sample interval. The PhysicalVolume parameter can be used to specify one to four names. Transfer statistics are given for each specified drive in the order specified. This count represents requests to the physical device. It does not imply an amount of data that was read or written. Several logical requests can be combined into one physical request.
The vmstat command, using with the -s flag, writes to the standard output the contents of the sum structure, which contains an absolute count of paging events since system initialization. The -s option is exclusive of the other vmstat command options.
The following is an example of the vmstat command using the -s flag:
# vmstat -s
8765020 total address trans. faults4832918 page ins2989263 page outs
19 paging space page ins7 paging space page outs0 total reclaims
5417148 zero filled pages faults12633 executable filled pages faults
15031850 pages examined by clock118 revolutions of the clock hand
Chapter 3. CPU and memory performance monitoring tools 63
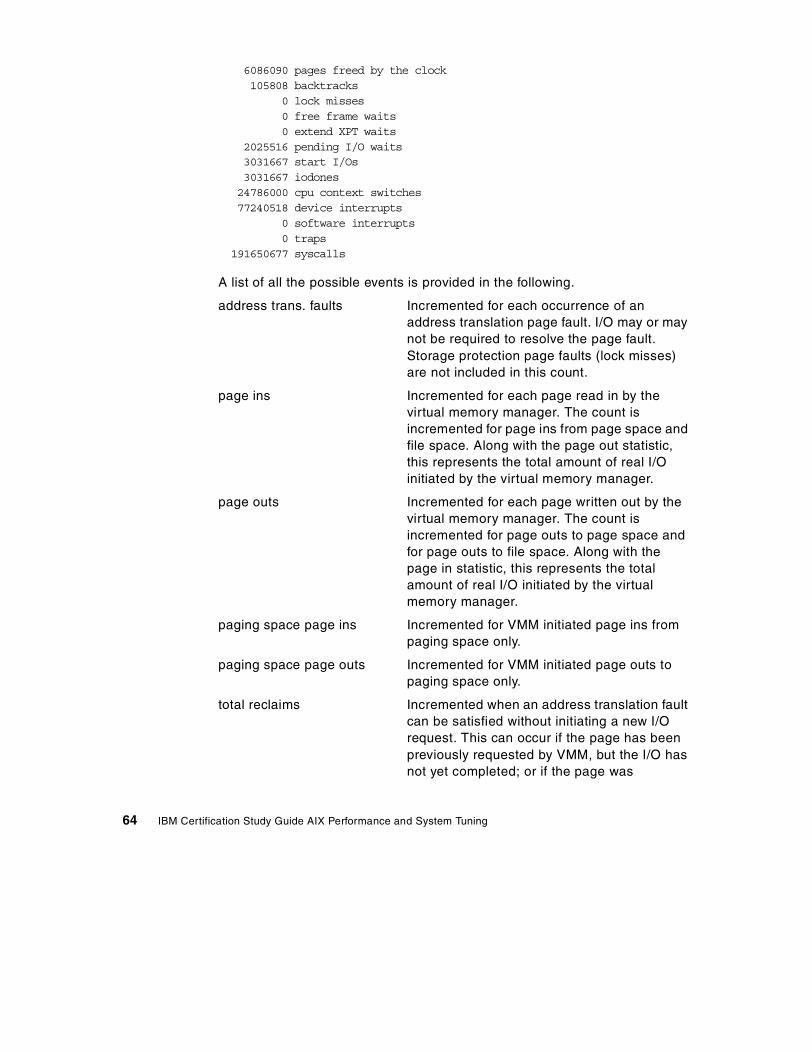
6086090 pages freed by the clock105808 backtracks
0 lock misses0 free frame waits0 extend XPT waits
2025516 pending I/O waits3031667 start I/Os3031667 iodones24786000 cpu context switches77240518 device interrupts
0 software interrupts0 traps
191650677 syscalls
A list of all the possible events is provided in the following.
address trans. faults Incremented for each occurrence of an address translation page fault. I/O may or may not be required to resolve the page fault. Storage protection page faults (lock misses) are not included in this count.
page ins Incremented for each page read in by the virtual memory manager. The count is incremented for page ins from page space and file space. Along with the page out statistic, this represents the total amount of real I/O initiated by the virtual memory manager.
page outs Incremented for each page written out by the virtual memory manager. The count is incremented for page outs to page space and for page outs to file space. Along with the page in statistic, this represents the total amount of real I/O initiated by the virtual memory manager.
paging space page ins Incremented for VMM initiated page ins from paging space only.
paging space page outs Incremented for VMM initiated page outs to paging space only.
total reclaims Incremented when an address translation fault can be satisfied without initiating a new I/O request. This can occur if the page has been previously requested by VMM, but the I/O has not yet completed; or if the page was
64 IBM Certification Study Guide AIX Performance and System Tuning
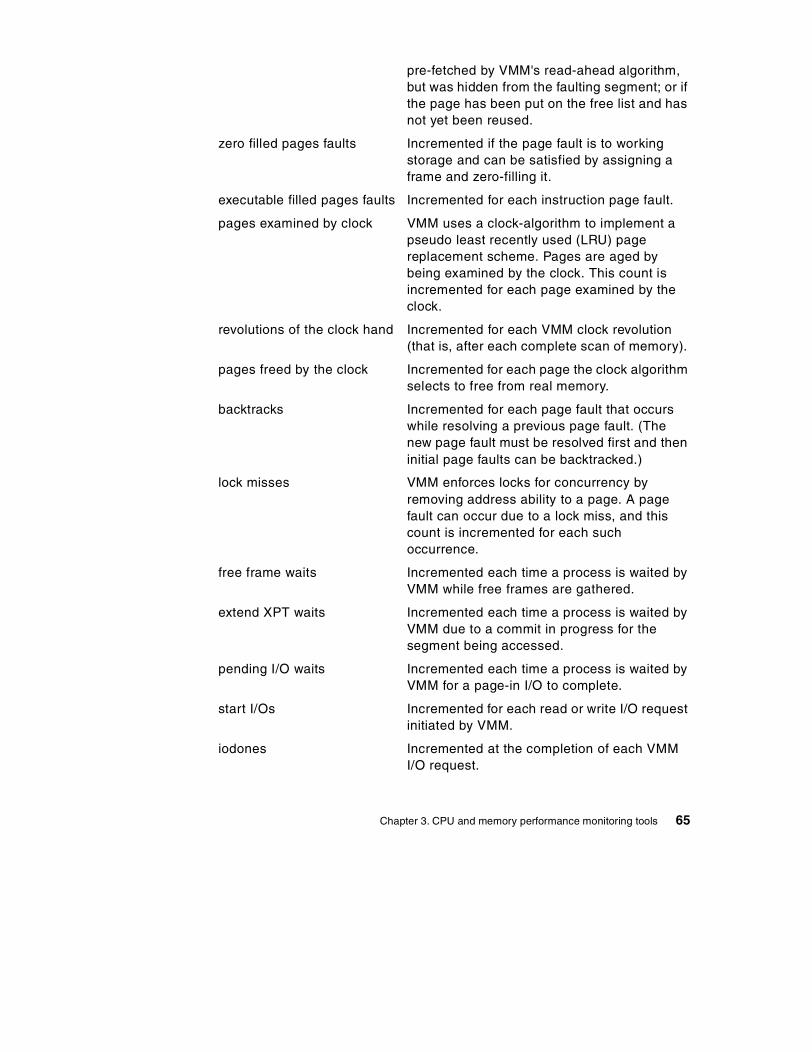
pre-fetched by VMM's read-ahead algorithm, but was hidden from the faulting segment; or if the page has been put on the free list and has not yet been reused.
zero filled pages faults Incremented if the page fault is to working storage and can be satisfied by assigning a frame and zero-filling it.
executable filled pages faults Incremented for each instruction page fault.
pages examined by clock VMM uses a clock-algorithm to implement a pseudo least recently used (LRU) page replacement scheme. Pages are aged by being examined by the clock. This count is incremented for each page examined by the clock.
revolutions of the clock hand Incremented for each VMM clock revolution (that is, after each complete scan of memory).
pages freed by the clock Incremented for each page the clock algorithm selects to free from real memory.
backtracks Incremented for each page fault that occurs while resolving a previous page fault. (The new page fault must be resolved first and then initial page faults can be backtracked.)
lock misses VMM enforces locks for concurrency by removing address ability to a page. A page fault can occur due to a lock miss, and this count is incremented for each such occurrence.
free frame waits Incremented each time a process is waited by VMM while free frames are gathered.
extend XPT waits Incremented each time a process is waited by VMM due to a commit in progress for the segment being accessed.
pending I/O waits Incremented each time a process is waited by VMM for a page-in I/O to complete.
start I/Os Incremented for each read or write I/O request initiated by VMM.
iodones Incremented at the completion of each VMM I/O request.
Chapter 3. CPU and memory performance monitoring tools 65
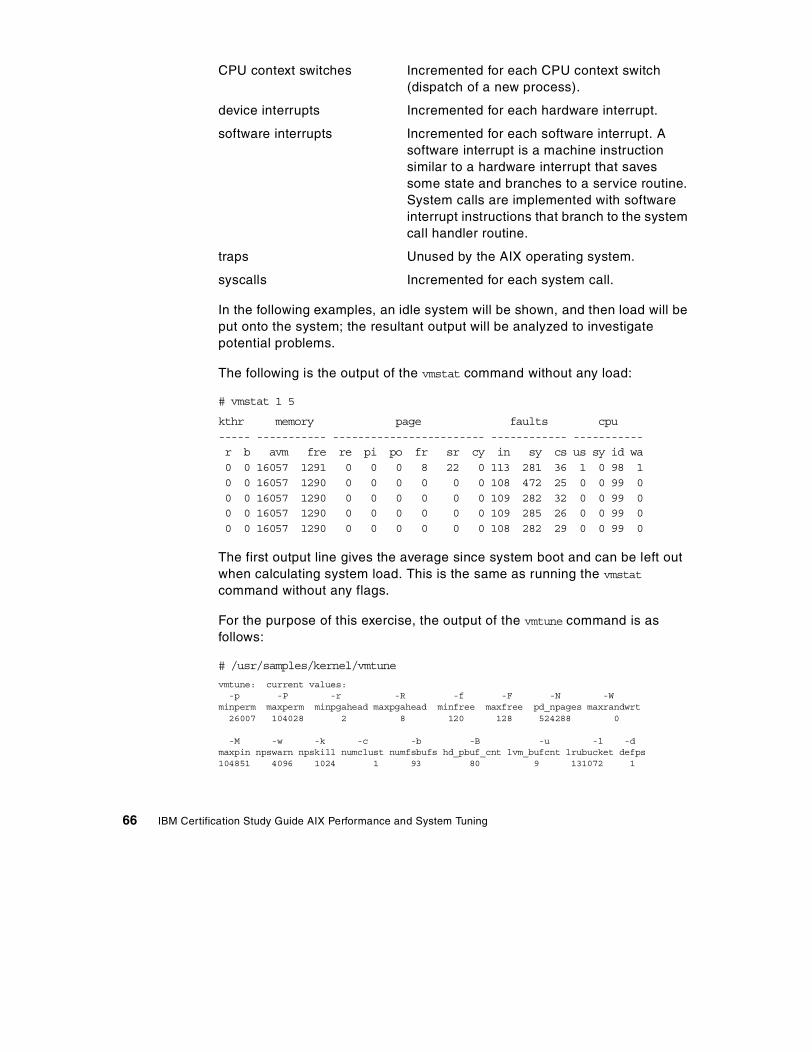
CPU context switches Incremented for each CPU context switch (dispatch of a new process).
device interrupts Incremented for each hardware interrupt.
software interrupts Incremented for each software interrupt. A software interrupt is a machine instruction similar to a hardware interrupt that saves some state and branches to a service routine. System calls are implemented with software interrupt instructions that branch to the system call handler routine.
traps Unused by the AIX operating system.
syscalls Incremented for each system call.
In the following examples, an idle system will be shown, and then load will be put onto the system; the resultant output will be analyzed to investigate potential problems.
The following is the output of the vmstat command without any load:
# vmstat 1 5
kthr memory page faults cpu----- ----------- ------------------------ ------------ -----------r b avm fre re pi po fr sr cy in sy cs us sy id wa0 0 16057 1291 0 0 0 8 22 0 113 281 36 1 0 98 10 0 16057 1290 0 0 0 0 0 0 108 472 25 0 0 99 00 0 16057 1290 0 0 0 0 0 0 109 282 32 0 0 99 00 0 16057 1290 0 0 0 0 0 0 109 285 26 0 0 99 00 0 16057 1290 0 0 0 0 0 0 108 282 29 0 0 99 0
The first output line gives the average since system boot and can be left out when calculating system load. This is the same as running the vmstat command without any flags.
For the purpose of this exercise, the output of the vmtune command is as follows:
# /usr/samples/kernel/vmtune
vmtune: current values:-p -P -r -R -f -F -N -W
minperm maxperm minpgahead maxpgahead minfree maxfree pd_npages maxrandwrt26007 104028 2 8 120 128 524288 0
-M -w -k -c -b -B -u -l -dmaxpin npswarn npskill numclust numfsbufs hd_pbuf_cnt lvm_bufcnt lrubucket defps104851 4096 1024 1 93 80 9 131072 1
66 IBM Certification Study Guide AIX Performance and System Tuning
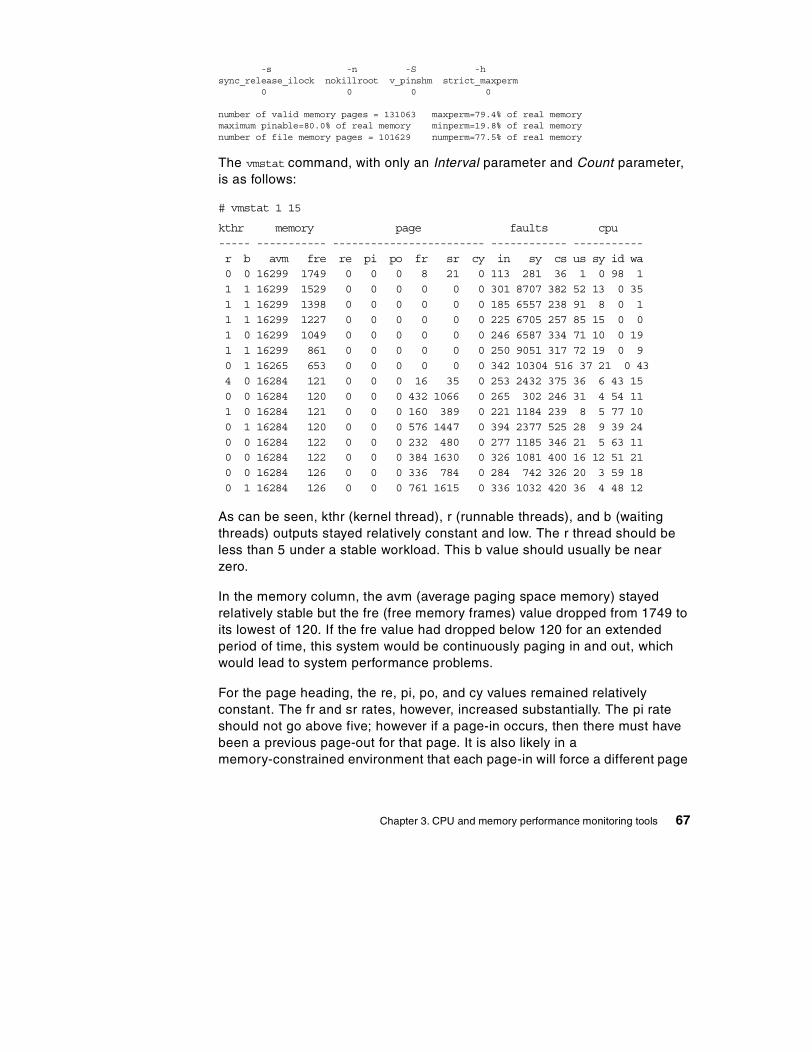
-s -n -S -hsync_release_ilock nokillroot v_pinshm strict_maxperm
0 0 0 0
number of valid memory pages = 131063 maxperm=79.4% of real memorymaximum pinable=80.0% of real memory minperm=19.8% of real memorynumber of file memory pages = 101629 numperm=77.5% of real memory
The vmstat command, with only an Interval parameter and Count parameter, is as follows:
# vmstat 1 15
kthr memory page faults cpu----- ----------- ------------------------ ------------ -----------r b avm fre re pi po fr sr cy in sy cs us sy id wa0 0 16299 1749 0 0 0 8 21 0 113 281 36 1 0 98 11 1 16299 1529 0 0 0 0 0 0 301 8707 382 52 13 0 351 1 16299 1398 0 0 0 0 0 0 185 6557 238 91 8 0 11 1 16299 1227 0 0 0 0 0 0 225 6705 257 85 15 0 01 0 16299 1049 0 0 0 0 0 0 246 6587 334 71 10 0 191 1 16299 861 0 0 0 0 0 0 250 9051 317 72 19 0 90 1 16265 653 0 0 0 0 0 0 342 10304 516 37 21 0 434 0 16284 121 0 0 0 16 35 0 253 2432 375 36 6 43 150 0 16284 120 0 0 0 432 1066 0 265 302 246 31 4 54 111 0 16284 121 0 0 0 160 389 0 221 1184 239 8 5 77 100 1 16284 120 0 0 0 576 1447 0 394 2377 525 28 9 39 240 0 16284 122 0 0 0 232 480 0 277 1185 346 21 5 63 110 0 16284 122 0 0 0 384 1630 0 326 1081 400 16 12 51 210 0 16284 126 0 0 0 336 784 0 284 742 326 20 3 59 180 1 16284 126 0 0 0 761 1615 0 336 1032 420 36 4 48 12
As can be seen, kthr (kernel thread), r (runnable threads), and b (waiting threads) outputs stayed relatively constant and low. The r thread should be less than 5 under a stable workload. This b value should usually be near zero.
In the memory column, the avm (average paging space memory) stayed relatively stable but the fre (free memory frames) value dropped from 1749 to its lowest of 120. If the fre value had dropped below 120 for an extended period of time, this system would be continuously paging in and out, which would lead to system performance problems.
For the page heading, the re, pi, po, and cy values remained relatively constant. The fr and sr rates, however, increased substantially. The pi rate should not go above five; however if a page-in occurs, then there must have been a previous page-out for that page. It is also likely in a memory-constrained environment that each page-in will force a different page
Chapter 3. CPU and memory performance monitoring tools 67
to be stolen and, therefore, paged out. If the system is reading in a significant number of persistent pages, you may see an increase in po without corresponding increases in pi. This situation does not necessarily indicate thrashing, but may warrant investigation into data access patterns of the applications. The fr column represents the number of pages freed and the sr column represents the number of pages scanned by the page placement algorithm. With stable, unfragmented memory, the scan rate and free rate may be nearly equal. On systems with multiple processes using many different pages, the pages are more volatile and disjointed. In this scenario, the scan rate may greatly exceed the free rate.
For the faults heading, the in, sy, and cs values fluctuated at various intervals. There is no steadfast limit to these, as the overhead is minimal, and it is difficult to say what is excessive. The only thing to remember is that the in value will always be higher than 100.
For the cpu heading, the us, sy, id, and wa values also fluctuated dramatically. The output is in percent of CPU utilization. The us output is the amount of time spent by a process executing functions without having to use the system (kernel) mode. The sy time details the amount of time a process spends utilizing system (kernel) resources. Optimum use would have the CPU working 100 percent of the time. This holds true in the case of a single-user system with no need to share the CPU. Generally, if us + sy time is below 90 percent, a single-user system is not considered CPU constrained. However, if us + sy time on a multi-user system exceeds 80 percent, the processes may spend time waiting in the run queue. Response time and throughput might suffer. The id output is the CPU idle time. The wa output is idle time with pending local disk I/O. A wa value over 40 percent could indicate that the disk subsystem may not be balanced properly, or it may be the result of a disk-intensive workload. The four values added together will give a CPU utilization of 100 percent.
3.3 The ps command
In this section, the following topics are covered:
• Use of the ps command in CPU usage study
• Use of the ps command in memory usage study
The ps command determines which processes are running and the resources they use.
68 IBM Certification Study Guide AIX Performance and System Tuning
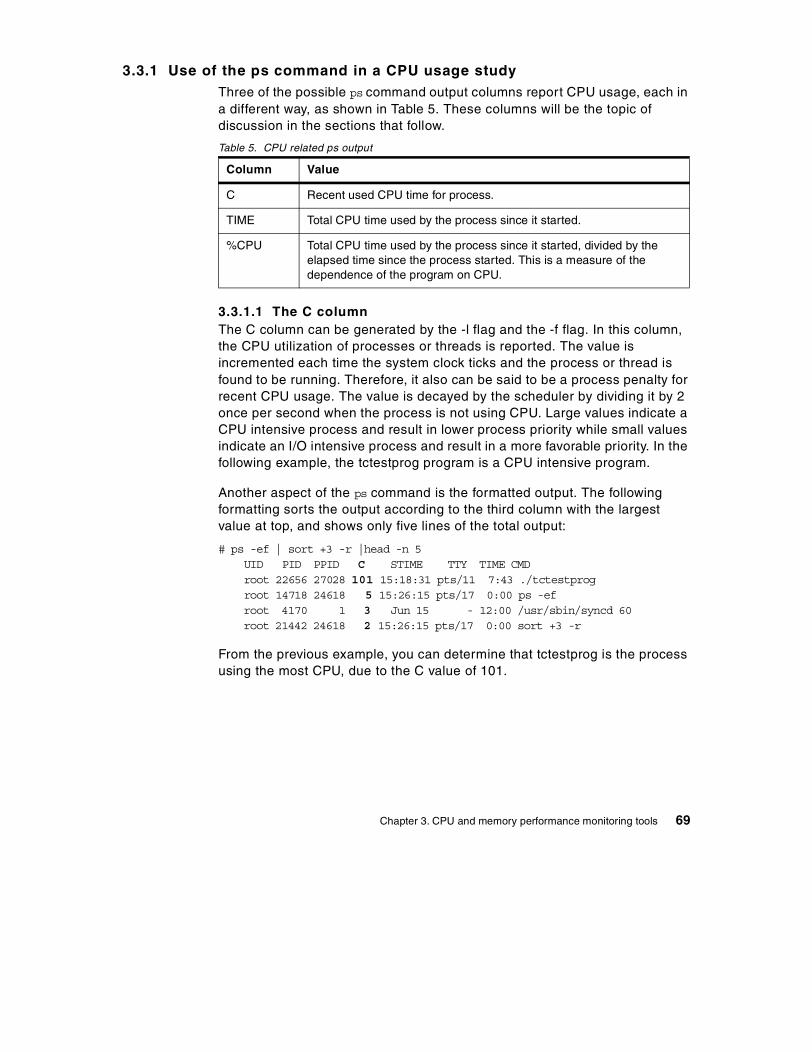
3.3.1 Use of the ps command in a CPU usage studyThree of the possible ps command output columns report CPU usage, each in a different way, as shown in Table 5. These columns will be the topic of discussion in the sections that follow.
Table 5. CPU related ps output
3.3.1.1 The C columnThe C column can be generated by the -l flag and the -f flag. In this column, the CPU utilization of processes or threads is reported. The value is incremented each time the system clock ticks and the process or thread is found to be running. Therefore, it also can be said to be a process penalty for recent CPU usage. The value is decayed by the scheduler by dividing it by 2 once per second when the process is not using CPU. Large values indicate a CPU intensive process and result in lower process priority while small values indicate an I/O intensive process and result in a more favorable priority. In the following example, the tctestprog program is a CPU intensive program.
Another aspect of the ps command is the formatted output. The following formatting sorts the output according to the third column with the largest value at top, and shows only five lines of the total output:
# ps -ef | sort +3 -r |head -n 5UID PID PPID C STIME TTY TIME CMDroot 22656 27028 101 15:18:31 pts/11 7:43 ./tctestprogroot 14718 24618 5 15:26:15 pts/17 0:00 ps -efroot 4170 1 3 Jun 15 - 12:00 /usr/sbin/syncd 60root 21442 24618 2 15:26:15 pts/17 0:00 sort +3 -r
From the previous example, you can determine that tctestprog is the process using the most CPU, due to the C value of 101.
Column Value
C Recent used CPU time for process.
TIME Total CPU time used by the process since it started.
%CPU Total CPU time used by the process since it started, divided by the elapsed time since the process started. This is a measure of the dependence of the program on CPU.
Chapter 3. CPU and memory performance monitoring tools 69
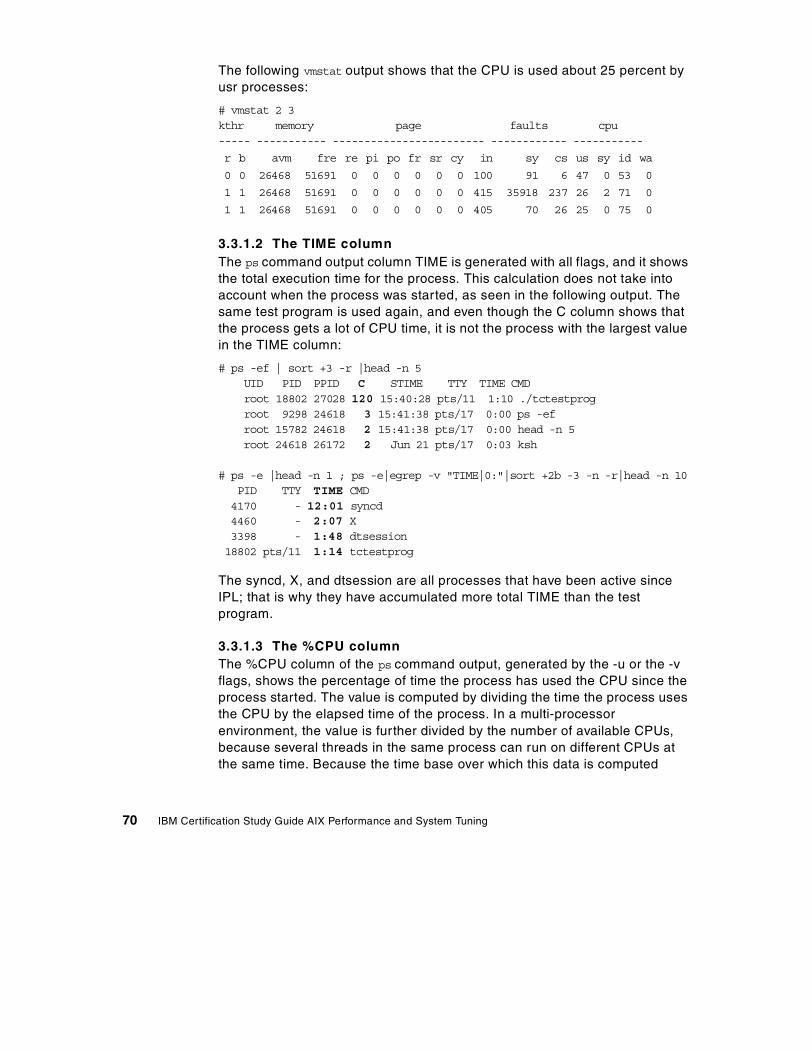
The following vmstat output shows that the CPU is used about 25 percent by usr processes:
# vmstat 2 3kthr memory page faults cpu----- ----------- ------------------------ ------------ -----------
3.3.1.2 The TIME columnThe ps command output column TIME is generated with all flags, and it shows the total execution time for the process. This calculation does not take into account when the process was started, as seen in the following output. The same test program is used again, and even though the C column shows that the process gets a lot of CPU time, it is not the process with the largest value in the TIME column:
# ps -ef | sort +3 -r |head -n 5UID PID PPID C STIME TTY TIME CMDroot 18802 27028 120 15:40:28 pts/11 1:10 ./tctestprogroot 9298 24618 3 15:41:38 pts/17 0:00 ps -efroot 15782 24618 2 15:41:38 pts/17 0:00 head -n 5root 24618 26172 2 Jun 21 pts/17 0:03 ksh
# ps -e |head -n 1 ; ps -e|egrep -v "TIME|0:"|sort +2b -3 -n -r|head -n 10PID TTY TIME CMD4170 - 12:01 syncd4460 - 2:07 X3398 - 1:48 dtsession18802 pts/11 1:14 tctestprog
The syncd, X, and dtsession are all processes that have been active since IPL; that is why they have accumulated more total TIME than the test program.
3.3.1.3 The %CPU columnThe %CPU column of the ps command output, generated by the -u or the -v flags, shows the percentage of time the process has used the CPU since the process started. The value is computed by dividing the time the process uses the CPU by the elapsed time of the process. In a multi-processor environment, the value is further divided by the number of available CPUs, because several threads in the same process can run on different CPUs at the same time. Because the time base over which this data is computed
r b avm fre re pi po fr sr cy in sy cs us sy id wa
0 0 26468 51691 0 0 0 0 0 0 100 91 6 47 0 53 0
1 1 26468 51691 0 0 0 0 0 0 415 35918 237 26 2 71 0
1 1 26468 51691 0 0 0 0 0 0 405 70 26 25 0 75 0
70 IBM Certification Study Guide AIX Performance and System Tuning
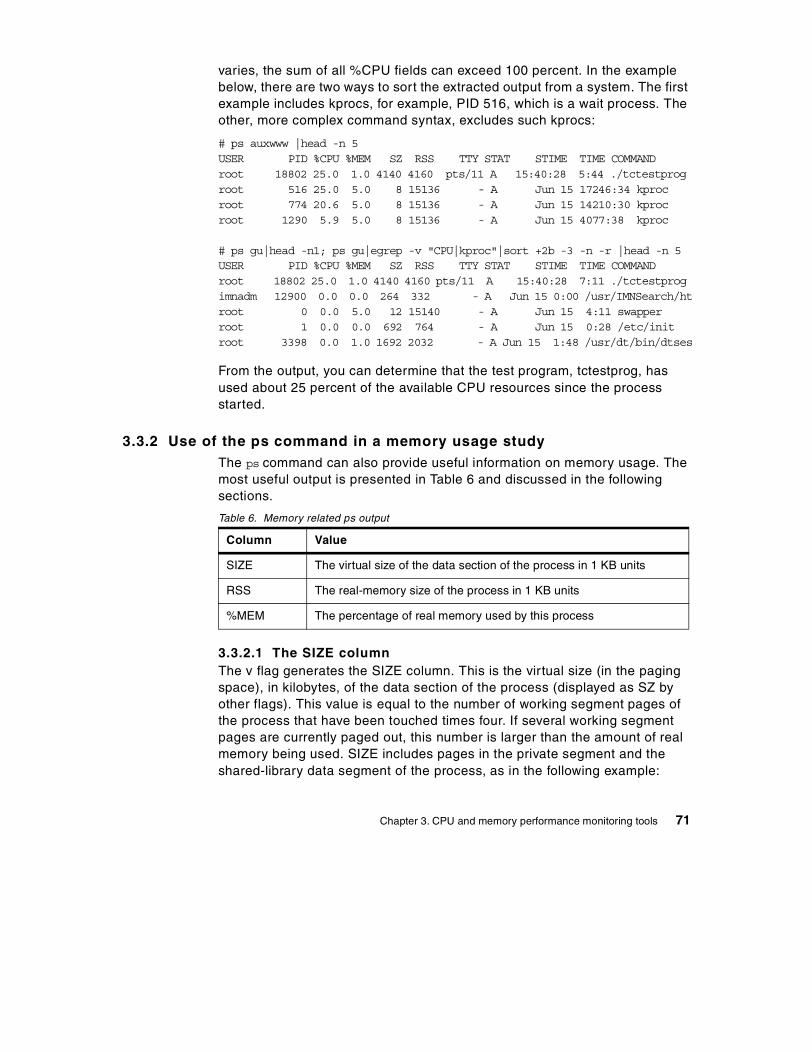
varies, the sum of all %CPU fields can exceed 100 percent. In the example below, there are two ways to sort the extracted output from a system. The first example includes kprocs, for example, PID 516, which is a wait process. The other, more complex command syntax, excludes such kprocs:
# ps auxwww |head -n 5USER PID %CPU %MEM SZ RSS TTY STAT STIME TIME COMMANDroot 18802 25.0 1.0 4140 4160 pts/11 A 15:40:28 5:44 ./tctestprogroot 516 25.0 5.0 8 15136 - A Jun 15 17246:34 kprocroot 774 20.6 5.0 8 15136 - A Jun 15 14210:30 kprocroot 1290 5.9 5.0 8 15136 - A Jun 15 4077:38 kproc
# ps gu|head -n1; ps gu|egrep -v "CPU|kproc"|sort +2b -3 -n -r |head -n 5USER PID %CPU %MEM SZ RSS TTY STAT STIME TIME COMMANDroot 18802 25.0 1.0 4140 4160 pts/11 A 15:40:28 7:11 ./tctestprogimnadm 12900 0.0 0.0 264 332 - A Jun 15 0:00 /usr/IMNSearch/htroot 0 0.0 5.0 12 15140 - A Jun 15 4:11 swapperroot 1 0.0 0.0 692 764 - A Jun 15 0:28 /etc/initroot 3398 0.0 1.0 1692 2032 - A Jun 15 1:48 /usr/dt/bin/dtses
From the output, you can determine that the test program, tctestprog, has used about 25 percent of the available CPU resources since the process started.
3.3.2 Use of the ps command in a memory usage studyThe ps command can also provide useful information on memory usage. The most useful output is presented in Table 6 and discussed in the following sections.
Table 6. Memory related ps output
3.3.2.1 The SIZE columnThe v flag generates the SIZE column. This is the virtual size (in the paging space), in kilobytes, of the data section of the process (displayed as SZ by other flags). This value is equal to the number of working segment pages of the process that have been touched times four. If several working segment pages are currently paged out, this number is larger than the amount of real memory being used. SIZE includes pages in the private segment and the shared-library data segment of the process, as in the following example:
Column Value
SIZE The virtual size of the data section of the process in 1 KB units
RSS The real-memory size of the process in 1 KB units
%MEM The percentage of real memory used by this process
Chapter 3. CPU and memory performance monitoring tools 71
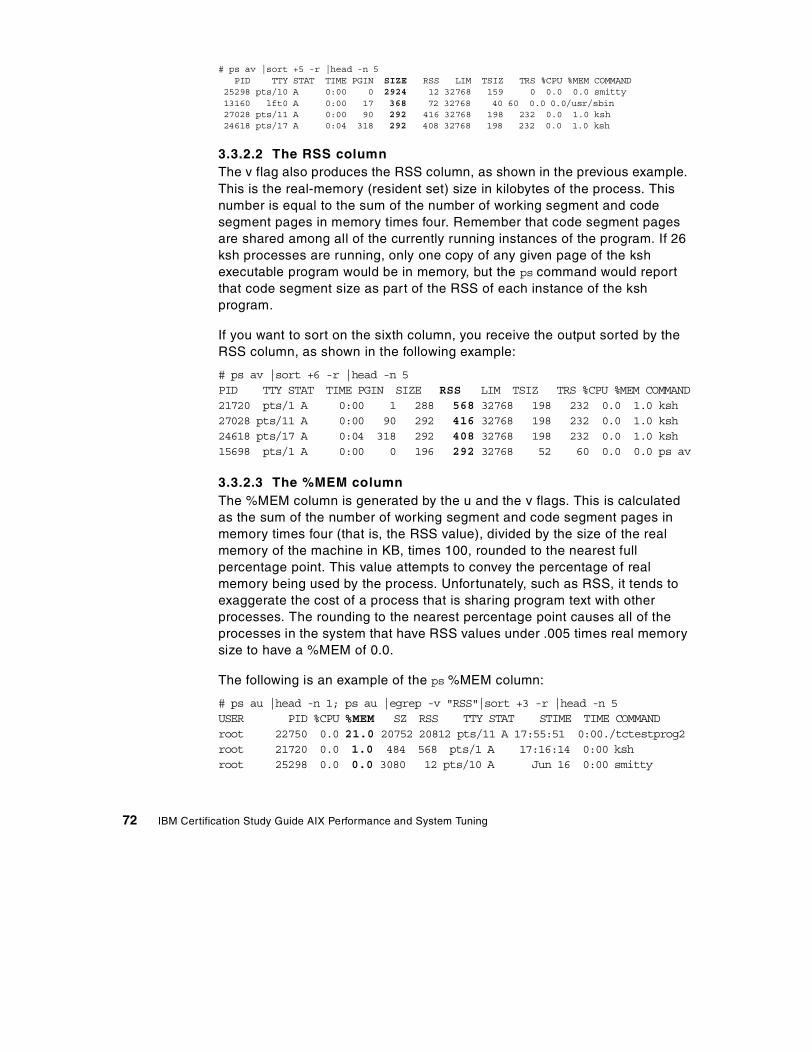
# ps av |sort +5 -r |head -n 5PID TTY STAT TIME PGIN SIZE RSS LIM TSIZ TRS %CPU %MEM COMMAND
25298 pts/10 A 0:00 0 2924 12 32768 159 0 0.0 0.0 smitty13160 lft0 A 0:00 17 368 72 32768 40 60 0.0 0.0/usr/sbin27028 pts/11 A 0:00 90 292 416 32768 198 232 0.0 1.0 ksh24618 pts/17 A 0:04 318 292 408 32768 198 232 0.0 1.0 ksh
3.3.2.2 The RSS columnThe v flag also produces the RSS column, as shown in the previous example. This is the real-memory (resident set) size in kilobytes of the process. This number is equal to the sum of the number of working segment and code segment pages in memory times four. Remember that code segment pages are shared among all of the currently running instances of the program. If 26 ksh processes are running, only one copy of any given page of the ksh executable program would be in memory, but the ps command would report that code segment size as part of the RSS of each instance of the ksh program.
If you want to sort on the sixth column, you receive the output sorted by the RSS column, as shown in the following example:
# ps av |sort +6 -r |head -n 5PID TTY STAT TIME PGIN SIZE RSS LIM TSIZ TRS %CPU %MEM COMMAND21720 pts/1 A 0:00 1 288 568 32768 198 232 0.0 1.0 ksh27028 pts/11 A 0:00 90 292 416 32768 198 232 0.0 1.0 ksh24618 pts/17 A 0:04 318 292 408 32768 198 232 0.0 1.0 ksh15698 pts/1 A 0:00 0 196 292 32768 52 60 0.0 0.0 ps av
3.3.2.3 The %MEM columnThe %MEM column is generated by the u and the v flags. This is calculated as the sum of the number of working segment and code segment pages in memory times four (that is, the RSS value), divided by the size of the real memory of the machine in KB, times 100, rounded to the nearest full percentage point. This value attempts to convey the percentage of real memory being used by the process. Unfortunately, such as RSS, it tends to exaggerate the cost of a process that is sharing program text with other processes. The rounding to the nearest percentage point causes all of the processes in the system that have RSS values under .005 times real memory size to have a %MEM of 0.0.
The following is an example of the ps %MEM column:
# ps au |head -n 1; ps au |egrep -v "RSS"|sort +3 -r |head -n 5USER PID %CPU %MEM SZ RSS TTY STAT STIME TIME COMMANDroot 22750 0.0 21.0 20752 20812 pts/11 A 17:55:51 0:00./tctestprog2root 21720 0.0 1.0 484 568 pts/1 A 17:16:14 0:00 kshroot 25298 0.0 0.0 3080 12 pts/10 A Jun 16 0:00 smitty
72 IBM Certification Study Guide AIX Performance and System Tuning
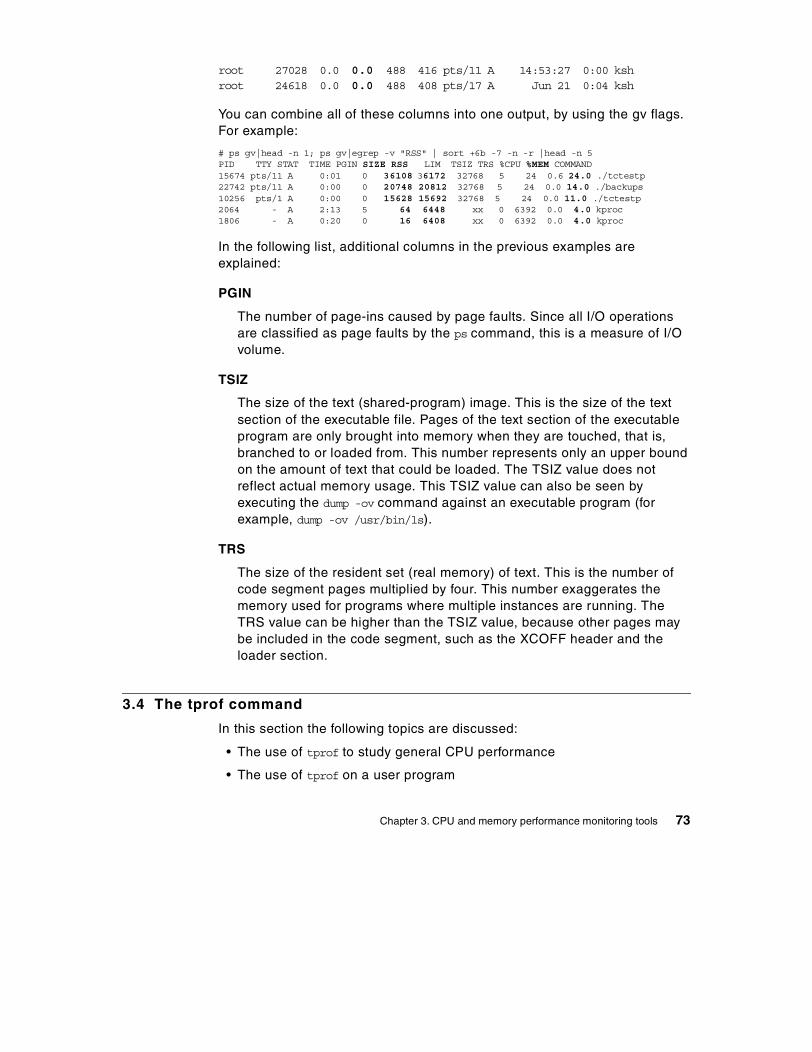
root 27028 0.0 0.0 488 416 pts/11 A 14:53:27 0:00 kshroot 24618 0.0 0.0 488 408 pts/17 A Jun 21 0:04 ksh
You can combine all of these columns into one output, by using the gv flags. For example:
# ps gv|head -n 1; ps gv|egrep -v "RSS" | sort +6b -7 -n -r |head -n 5PID TTY STAT TIME PGIN SIZE RSS LIM TSIZ TRS %CPU %MEM COMMAND15674 pts/11 A 0:01 0 36108 36172 32768 5 24 0.6 24.0 ./tctestp22742 pts/11 A 0:00 0 20748 20812 32768 5 24 0.0 14.0 ./backups10256 pts/1 A 0:00 0 15628 15692 32768 5 24 0.0 11.0 ./tctestp2064 - A 2:13 5 64 6448 xx 0 6392 0.0 4.0 kproc1806 - A 0:20 0 16 6408 xx 0 6392 0.0 4.0 kproc
In the following list, additional columns in the previous examples are explained:
PGIN
The number of page-ins caused by page faults. Since all I/O operations are classified as page faults by the ps command, this is a measure of I/O volume.
TSIZ
The size of the text (shared-program) image. This is the size of the text section of the executable file. Pages of the text section of the executable program are only brought into memory when they are touched, that is, branched to or loaded from. This number represents only an upper bound on the amount of text that could be loaded. The TSIZ value does not reflect actual memory usage. This TSIZ value can also be seen by executing the dump -ov command against an executable program (for example, dump -ov /usr/bin/ls).
TRS
The size of the resident set (real memory) of text. This is the number of code segment pages multiplied by four. This number exaggerates the memory used for programs where multiple instances are running. The TRS value can be higher than the TSIZ value, because other pages may be included in the code segment, such as the XCOFF header and the loader section.
3.4 The tprof command
In this section the following topics are discussed:
• The use of tprof to study general CPU performance
• The use of tprof on a user program
Chapter 3. CPU and memory performance monitoring tools 73
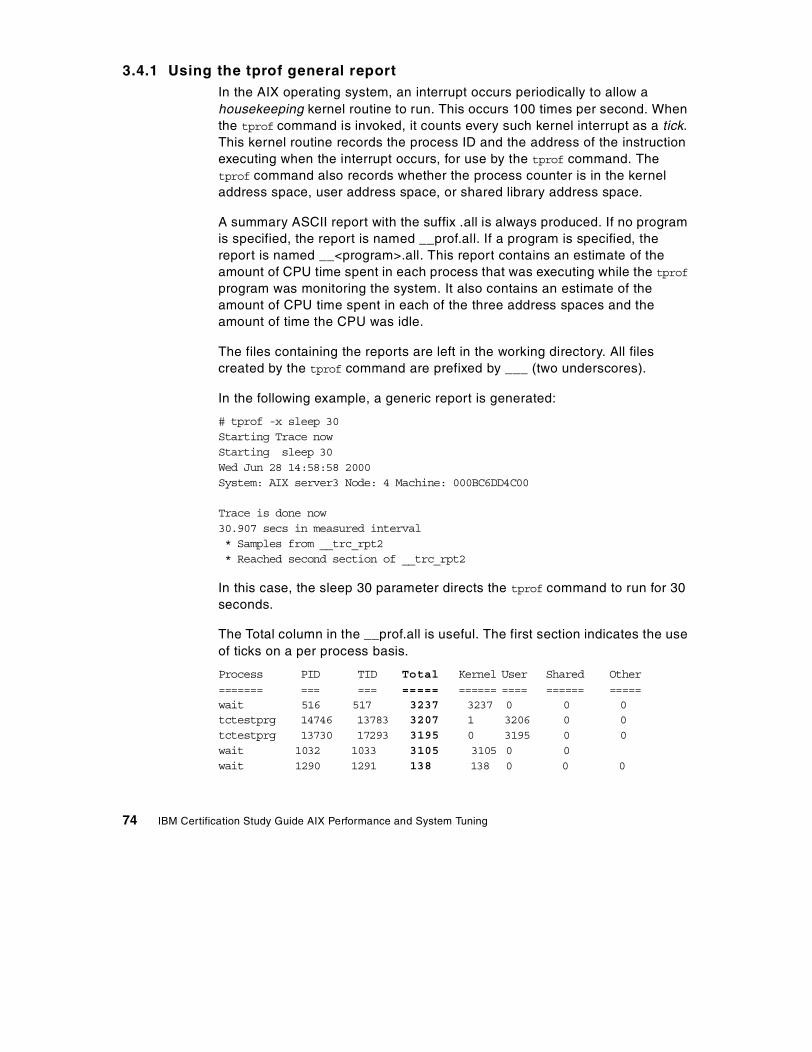
3.4.1 Using the tprof general reportIn the AIX operating system, an interrupt occurs periodically to allow a housekeeping kernel routine to run. This occurs 100 times per second. When the tprof command is invoked, it counts every such kernel interrupt as a tick. This kernel routine records the process ID and the address of the instruction executing when the interrupt occurs, for use by the tprof command. The tprof command also records whether the process counter is in the kernel address space, user address space, or shared library address space.
A summary ASCII report with the suffix .all is always produced. If no program is specified, the report is named __prof.all. If a program is specified, the report is named __<program>.all. This report contains an estimate of the amount of CPU time spent in each process that was executing while the tprof program was monitoring the system. It also contains an estimate of the amount of CPU time spent in each of the three address spaces and the amount of time the CPU was idle.
The files containing the reports are left in the working directory. All files created by the tprof command are prefixed by ___ (two underscores).
In the following example, a generic report is generated:
# tprof -x sleep 30Starting Trace nowStarting sleep 30Wed Jun 28 14:58:58 2000System: AIX server3 Node: 4 Machine: 000BC6DD4C00
Trace is done now30.907 secs in measured interval* Samples from __trc_rpt2* Reached second section of __trc_rpt2
In this case, the sleep 30 parameter directs the tprof command to run for 30 seconds.
The Total column in the __prof.all is useful. The first section indicates the use of ticks on a per process basis.
Process PID TID Total Kernel User Shared Other======= === === ===== ====== ==== ====== =====wait 516 517 3237 3237 0 0 0tctestprg 14746 13783 3207 1 3206 0 0tctestprg 13730 17293 3195 0 3195 0 0wait 1032 1033 3105 3105 0 0wait 1290 1291 138 138 0 0 0
74 IBM Certification Study Guide AIX Performance and System Tuning
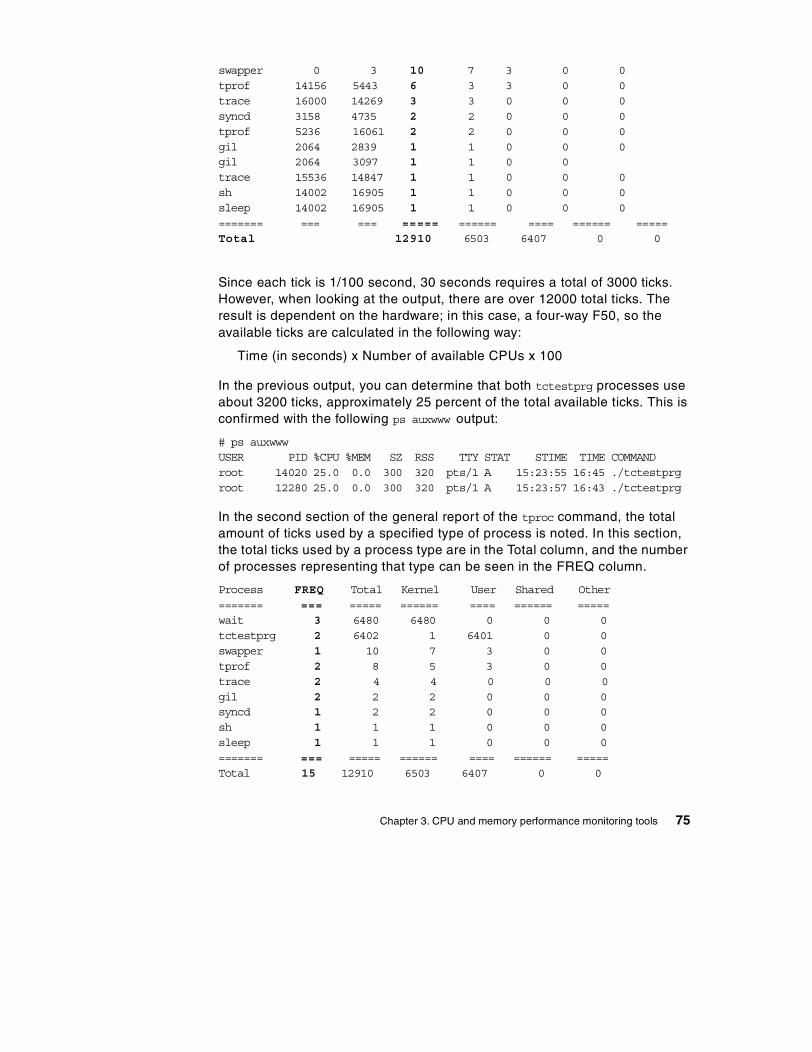
swapper 0 3 10 7 3 0 0tprof 14156 5443 6 3 3 0 0trace 16000 14269 3 3 0 0 0syncd 3158 4735 2 2 0 0 0tprof 5236 16061 2 2 0 0 0gil 2064 2839 1 1 0 0 0gil 2064 3097 1 1 0 0trace 15536 14847 1 1 0 0 0sh 14002 16905 1 1 0 0 0sleep 14002 16905 1 1 0 0 0======= === === ===== ====== ==== ====== =====Total 12910 6503 6407 0 0
Since each tick is 1/100 second, 30 seconds requires a total of 3000 ticks. However, when looking at the output, there are over 12000 total ticks. The result is dependent on the hardware; in this case, a four-way F50, so the available ticks are calculated in the following way:
Time (in seconds) x Number of available CPUs x 100
In the previous output, you can determine that both tctestprg processes use about 3200 ticks, approximately 25 percent of the total available ticks. This is confirmed with the following ps auxwww output:
# ps auxwwwUSER PID %CPU %MEM SZ RSS TTY STAT STIME TIME COMMANDroot 14020 25.0 0.0 300 320 pts/1 A 15:23:55 16:45 ./tctestprgroot 12280 25.0 0.0 300 320 pts/1 A 15:23:57 16:43 ./tctestprg
In the second section of the general report of the tproc command, the total amount of ticks used by a specified type of process is noted. In this section, the total ticks used by a process type are in the Total column, and the number of processes representing that type can be seen in the FREQ column.
Process FREQ Total Kernel User Shared Other======= === ===== ====== ==== ====== =====wait 3 6480 6480 0 0 0tctestprg 2 6402 1 6401 0 0swapper 1 10 7 3 0 0tprof 2 8 5 3 0 0trace 2 4 4 0 0 0gil 2 2 2 0 0 0syncd 1 2 2 0 0 0sh 1 1 1 0 0 0sleep 1 1 1 0 0 0======= === ===== ====== ==== ====== =====Total 15 12910 6503 6407 0 0
Chapter 3. CPU and memory performance monitoring tools 75
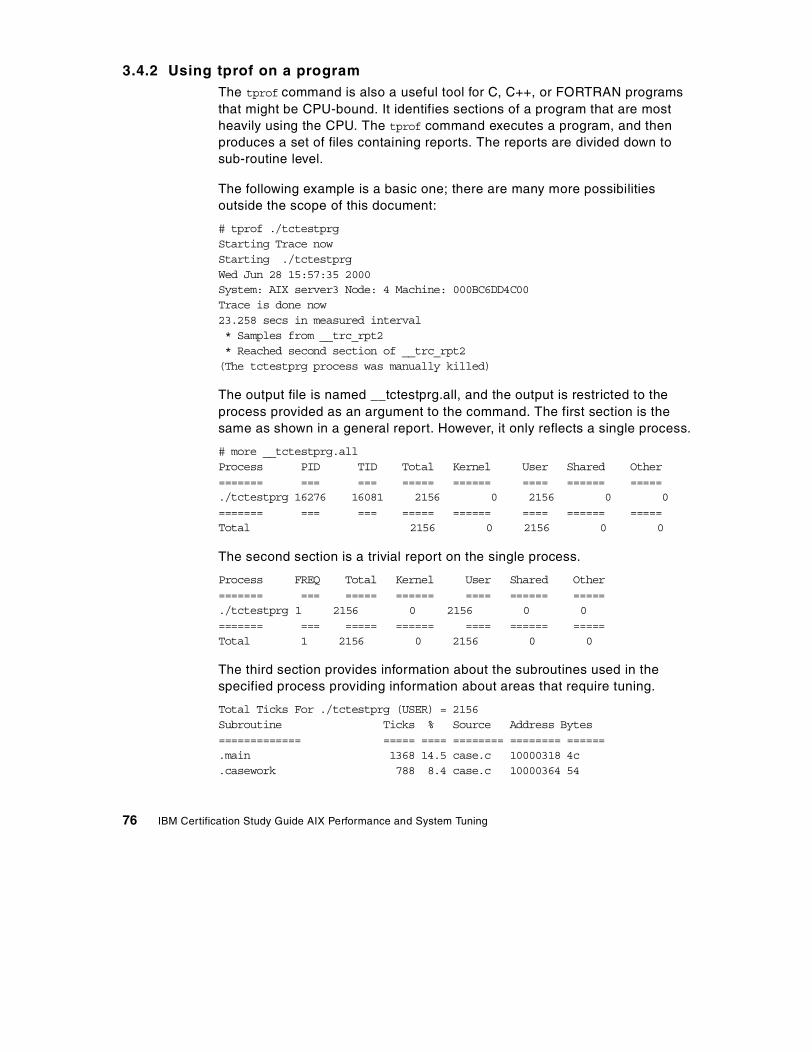
3.4.2 Using tprof on a programThe tprof command is also a useful tool for C, C++, or FORTRAN programs that might be CPU-bound. It identifies sections of a program that are most heavily using the CPU. The tprof command executes a program, and then produces a set of files containing reports. The reports are divided down to sub-routine level.
The following example is a basic one; there are many more possibilities outside the scope of this document:
# tprof ./tctestprgStarting Trace nowStarting ./tctestprgWed Jun 28 15:57:35 2000System: AIX server3 Node: 4 Machine: 000BC6DD4C00Trace is done now23.258 secs in measured interval* Samples from __trc_rpt2* Reached second section of __trc_rpt2(The tctestprg process was manually killed)
The output file is named __tctestprg.all, and the output is restricted to the process provided as an argument to the command. The first section is the same as shown in a general report. However, it only reflects a single process.
# more __tctestprg.allProcess PID TID Total Kernel User Shared Other======= === === ===== ====== ==== ====== =====./tctestprg 16276 16081 2156 0 2156 0 0======= === === ===== ====== ==== ====== =====Total 2156 0 2156 0 0
The second section is a trivial report on the single process.
Process FREQ Total Kernel User Shared Other======= === ===== ====== ==== ====== =====./tctestprg 1 2156 0 2156 0 0======= === ===== ====== ==== ====== =====Total 1 2156 0 2156 0 0
The third section provides information about the subroutines used in the specified process providing information about areas that require tuning.
Total Ticks For ./tctestprg (USER) = 2156Subroutine Ticks % Source Address Bytes============= ===== ==== ======== ======== ======.main 1368 14.5 case.c 10000318 4c.casework 788 8.4 case.c 10000364 54
76 IBM Certification Study Guide AIX Performance and System Tuning
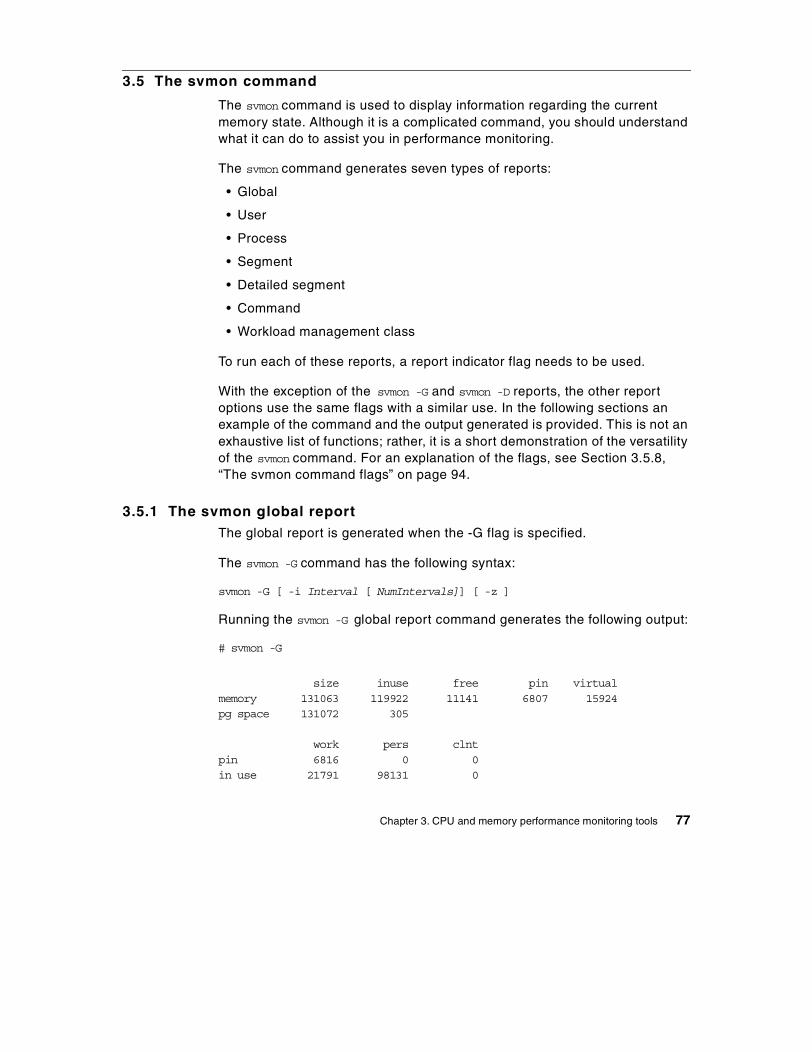
3.5 The svmon command
The svmon command is used to display information regarding the current memory state. Although it is a complicated command, you should understand what it can do to assist you in performance monitoring.
The svmon command generates seven types of reports:
• Global
• User
• Process
• Segment
• Detailed segment
• Command
• Workload management class
To run each of these reports, a report indicator flag needs to be used.
With the exception of the svmon -G and svmon -D reports, the other report options use the same flags with a similar use. In the following sections an example of the command and the output generated is provided. This is not an exhaustive list of functions; rather, it is a short demonstration of the versatility of the svmon command. For an explanation of the flags, see Section 3.5.8, “The svmon command flags” on page 94.
3.5.1 The svmon global reportThe global report is generated when the -G flag is specified.
The svmon -G command has the following syntax:
svmon -G [ -i Interval [ NumIntervals]] [ -z ]
Running the svmon -G global report command generates the following output:
# svmon -G
size inuse free pin virtualmemory 131063 119922 11141 6807 15924pg space 131072 305
work pers clntpin 6816 0 0in use 21791 98131 0
Chapter 3. CPU and memory performance monitoring tools 77
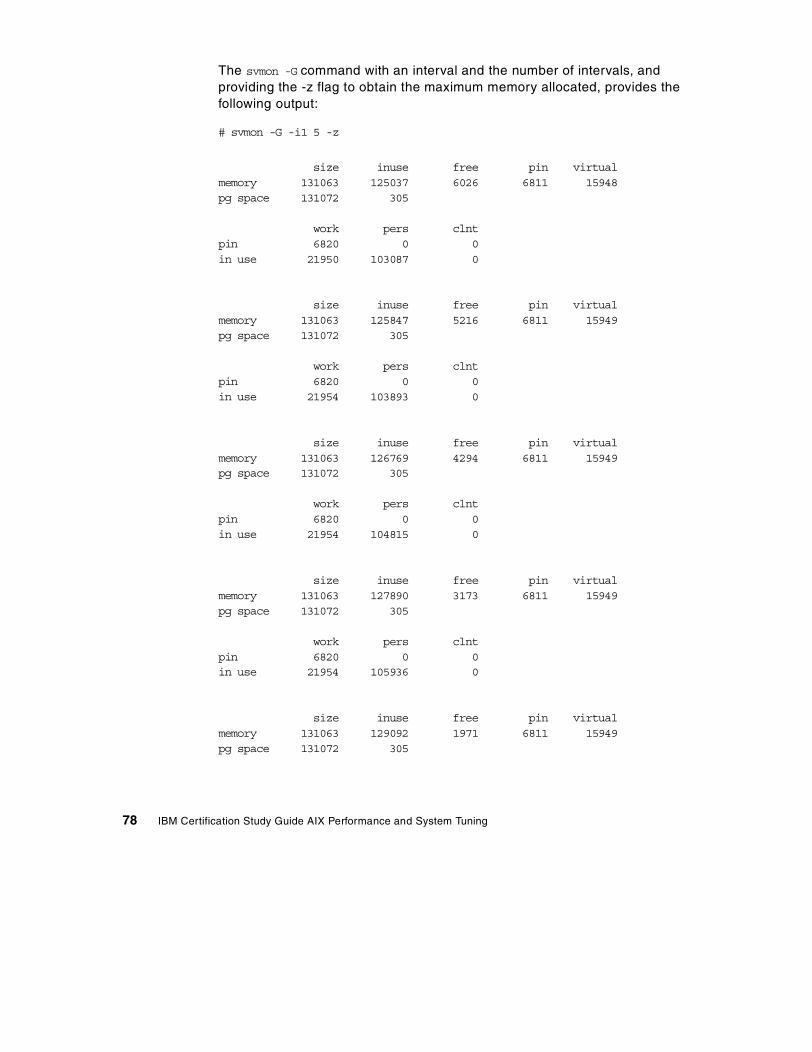
The svmon -G command with an interval and the number of intervals, and providing the -z flag to obtain the maximum memory allocated, provides the following output:
# svmon -G -i1 5 -z
size inuse free pin virtualmemory 131063 125037 6026 6811 15948pg space 131072 305
work pers clntpin 6820 0 0in use 21950 103087 0
size inuse free pin virtualmemory 131063 125847 5216 6811 15949pg space 131072 305
work pers clntpin 6820 0 0in use 21954 103893 0
size inuse free pin virtualmemory 131063 126769 4294 6811 15949pg space 131072 305
work pers clntpin 6820 0 0in use 21954 104815 0
size inuse free pin virtualmemory 131063 127890 3173 6811 15949pg space 131072 305
work pers clntpin 6820 0 0in use 21954 105936 0
size inuse free pin virtualmemory 131063 129092 1971 6811 15949pg space 131072 305
78 IBM Certification Study Guide AIX Performance and System Tuning
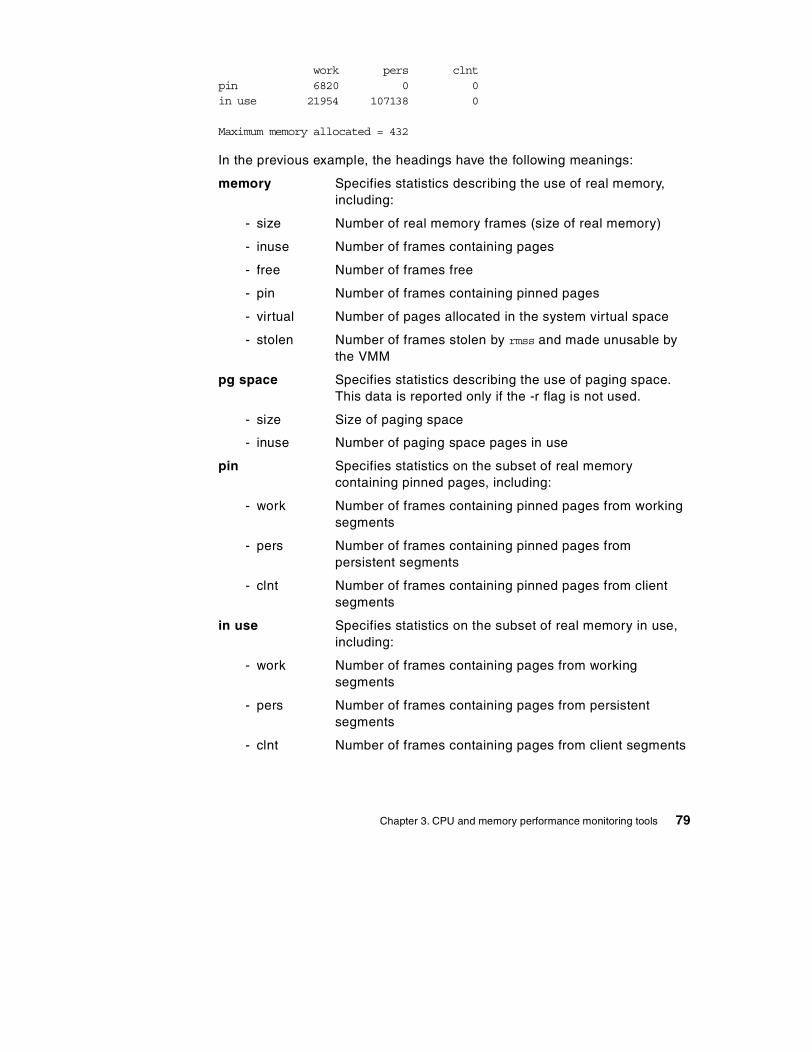
work pers clntpin 6820 0 0in use 21954 107138 0
Maximum memory allocated = 432
In the previous example, the headings have the following meanings:
memory Specifies statistics describing the use of real memory, including:
- size Number of real memory frames (size of real memory)
- inuse Number of frames containing pages
- free Number of frames free
- pin Number of frames containing pinned pages
- virtual Number of pages allocated in the system virtual space
- stolen Number of frames stolen by rmss and made unusable by the VMM
pg space Specifies statistics describing the use of paging space. This data is reported only if the -r flag is not used.
- size Size of paging space
- inuse Number of paging space pages in use
pin Specifies statistics on the subset of real memory containing pinned pages, including:
- work Number of frames containing pinned pages from working segments
- pers Number of frames containing pinned pages from persistent segments
- clnt Number of frames containing pinned pages from client segments
in use Specifies statistics on the subset of real memory in use, including:
- work Number of frames containing pages from working segments
- pers Number of frames containing pages from persistent segments
- clnt Number of frames containing pages from client segments
Chapter 3. CPU and memory performance monitoring tools 79
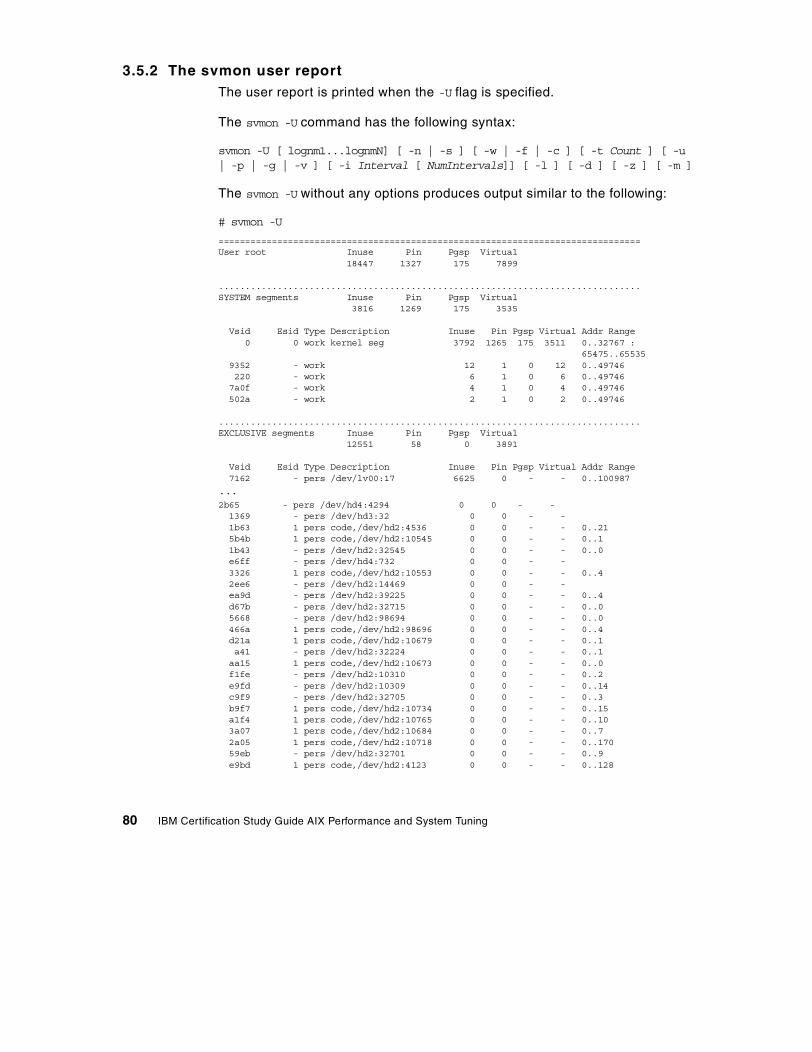
3.5.2 The svmon user reportThe user report is printed when the -U flag is specified.
The svmon -U command has the following syntax:
svmon -U [ lognm1...lognmN] [ -n | -s ] [ -w | -f | -c ] [ -t Count ] [ -u| -p | -g | -v ] [ -i Interval [ NumIntervals]] [ -l ] [ -d ] [ -z ] [ -m ]
The svmon -U without any options produces output similar to the following:
# svmon -U
===============================================================================User root Inuse Pin Pgsp Virtual
18447 1327 175 7899
...............................................................................SYSTEM segments Inuse Pin Pgsp Virtual
3816 1269 175 3535
Vsid Esid Type Description Inuse Pin Pgsp Virtual Addr Range0 0 work kernel seg 3792 1265 175 3511 0..32767 :
65475..655359352 - work 12 1 0 12 0..49746220 - work 6 1 0 6 0..497467a0f - work 4 1 0 4 0..49746502a - work 2 1 0 2 0..49746
...............................................................................EXCLUSIVE segments Inuse Pin Pgsp Virtual
12551 58 0 3891
Vsid Esid Type Description Inuse Pin Pgsp Virtual Addr Range7162 - pers /dev/lv00:17 6625 0 - - 0..100987
...2b65 - pers /dev/hd4:4294 0 0 - -1369 - pers /dev/hd3:32 0 0 - -1b63 1 pers code,/dev/hd2:4536 0 0 - - 0..215b4b 1 pers code,/dev/hd2:10545 0 0 - - 0..11b43 - pers /dev/hd2:32545 0 0 - - 0..0e6ff - pers /dev/hd4:732 0 0 - -3326 1 pers code,/dev/hd2:10553 0 0 - - 0..42ee6 - pers /dev/hd2:14469 0 0 - -ea9d - pers /dev/hd2:39225 0 0 - - 0..4d67b - pers /dev/hd2:32715 0 0 - - 0..05668 - pers /dev/hd2:98694 0 0 - - 0..0466a 1 pers code,/dev/hd2:98696 0 0 - - 0..4d21a 1 pers code,/dev/hd2:10679 0 0 - - 0..1a41 - pers /dev/hd2:32224 0 0 - - 0..1aa15 1 pers code,/dev/hd2:10673 0 0 - - 0..0f1fe - pers /dev/hd2:10310 0 0 - - 0..2e9fd - pers /dev/hd2:10309 0 0 - - 0..14c9f9 - pers /dev/hd2:32705 0 0 - - 0..3b9f7 1 pers code,/dev/hd2:10734 0 0 - - 0..15a1f4 1 pers code,/dev/hd2:10765 0 0 - - 0..103a07 1 pers code,/dev/hd2:10684 0 0 - - 0..72a05 1 pers code,/dev/hd2:10718 0 0 - - 0..17059eb - pers /dev/hd2:32701 0 0 - - 0..9e9bd 1 pers code,/dev/hd2:4123 0 0 - - 0..128
80 IBM Certification Study Guide AIX Performance and System Tuning
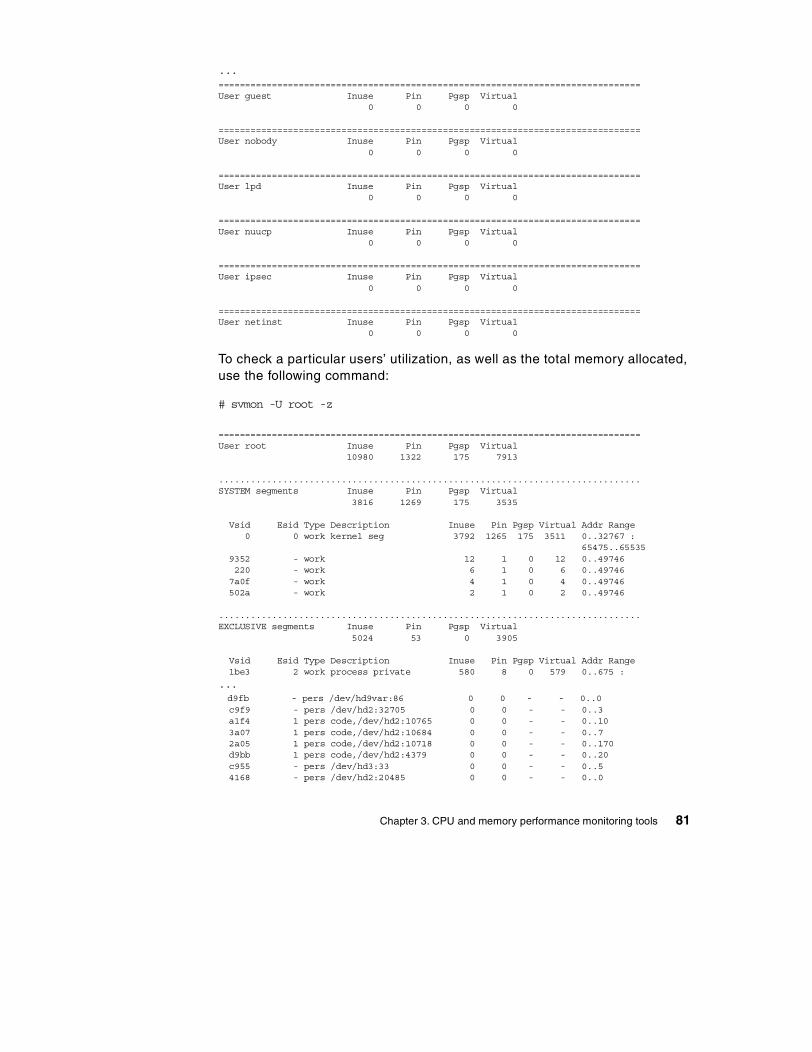
...===============================================================================User guest Inuse Pin Pgsp Virtual
0 0 0 0
===============================================================================User nobody Inuse Pin Pgsp Virtual
0 0 0 0
===============================================================================User lpd Inuse Pin Pgsp Virtual
0 0 0 0
===============================================================================User nuucp Inuse Pin Pgsp Virtual
0 0 0 0
===============================================================================User ipsec Inuse Pin Pgsp Virtual
0 0 0 0
===============================================================================User netinst Inuse Pin Pgsp Virtual
0 0 0 0
To check a particular users’ utilization, as well as the total memory allocated, use the following command:
# svmon -U root -z
===============================================================================User root Inuse Pin Pgsp Virtual
10980 1322 175 7913
...............................................................................SYSTEM segments Inuse Pin Pgsp Virtual
3816 1269 175 3535
Vsid Esid Type Description Inuse Pin Pgsp Virtual Addr Range0 0 work kernel seg 3792 1265 175 3511 0..32767 :
65475..655359352 - work 12 1 0 12 0..49746220 - work 6 1 0 6 0..497467a0f - work 4 1 0 4 0..49746502a - work 2 1 0 2 0..49746
...............................................................................EXCLUSIVE segments Inuse Pin Pgsp Virtual
5024 53 0 3905
Vsid Esid Type Description Inuse Pin Pgsp Virtual Addr Range1be3 2 work process private 580 8 0 579 0..675 :
...d9fb - pers /dev/hd9var:86 0 0 - - 0..0c9f9 - pers /dev/hd2:32705 0 0 - - 0..3a1f4 1 pers code,/dev/hd2:10765 0 0 - - 0..103a07 1 pers code,/dev/hd2:10684 0 0 - - 0..72a05 1 pers code,/dev/hd2:10718 0 0 - - 0..170d9bb 1 pers code,/dev/hd2:4379 0 0 - - 0..20c955 - pers /dev/hd3:33 0 0 - - 0..54168 - pers /dev/hd2:20485 0 0 - - 0..0
Chapter 3. CPU and memory performance monitoring tools 81
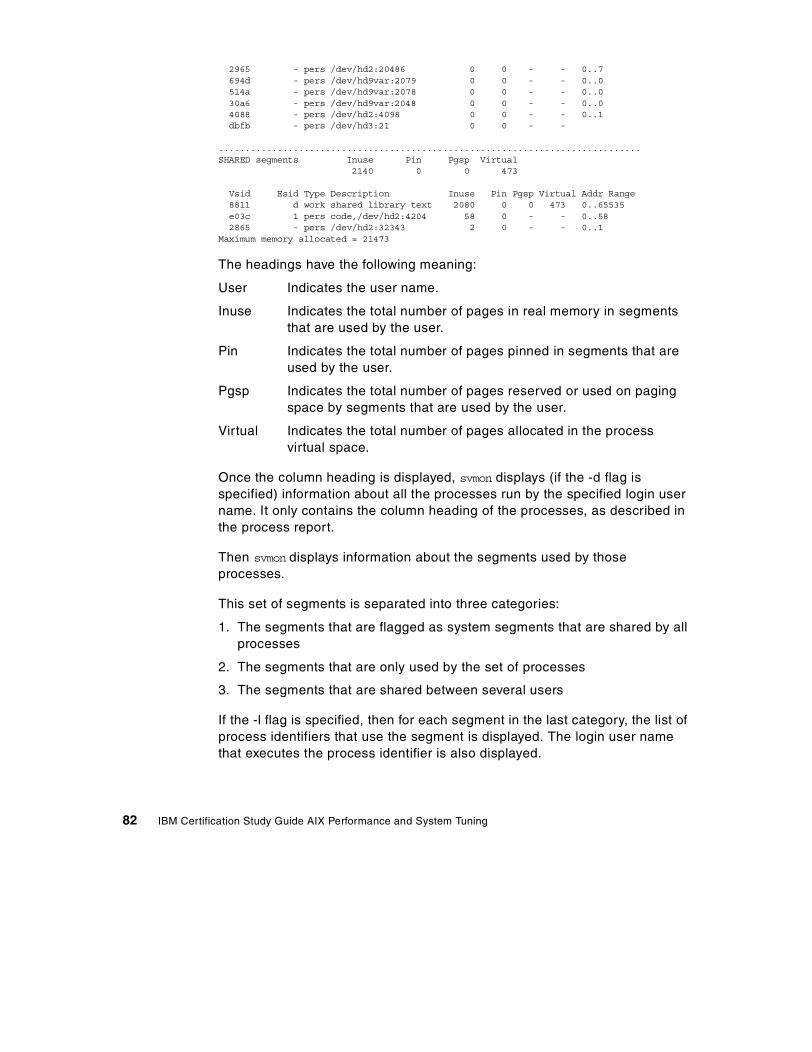
2965 - pers /dev/hd2:20486 0 0 - - 0..7694d - pers /dev/hd9var:2079 0 0 - - 0..0514a - pers /dev/hd9var:2078 0 0 - - 0..030a6 - pers /dev/hd9var:2048 0 0 - - 0..04088 - pers /dev/hd2:4098 0 0 - - 0..1dbfb - pers /dev/hd3:21 0 0 - -
...............................................................................SHARED segments Inuse Pin Pgsp Virtual
2140 0 0 473
Vsid Esid Type Description Inuse Pin Pgsp Virtual Addr Range8811 d work shared library text 2080 0 0 473 0..65535e03c 1 pers code,/dev/hd2:4204 58 0 - - 0..582865 - pers /dev/hd2:32343 2 0 - - 0..1
Maximum memory allocated = 21473
The headings have the following meaning:
User Indicates the user name.
Inuse Indicates the total number of pages in real memory in segments that are used by the user.
Pin Indicates the total number of pages pinned in segments that are used by the user.
Pgsp Indicates the total number of pages reserved or used on paging space by segments that are used by the user.
Virtual Indicates the total number of pages allocated in the process virtual space.
Once the column heading is displayed, svmon displays (if the -d flag is specified) information about all the processes run by the specified login user name. It only contains the column heading of the processes, as described in the process report.
Then svmon displays information about the segments used by those processes.
This set of segments is separated into three categories:
1. The segments that are flagged as system segments that are shared by all processes
2. The segments that are only used by the set of processes
3. The segments that are shared between several users
If the -l flag is specified, then for each segment in the last category, the list of process identifiers that use the segment is displayed. The login user name that executes the process identifier is also displayed.
82 IBM Certification Study Guide AIX Performance and System Tuning
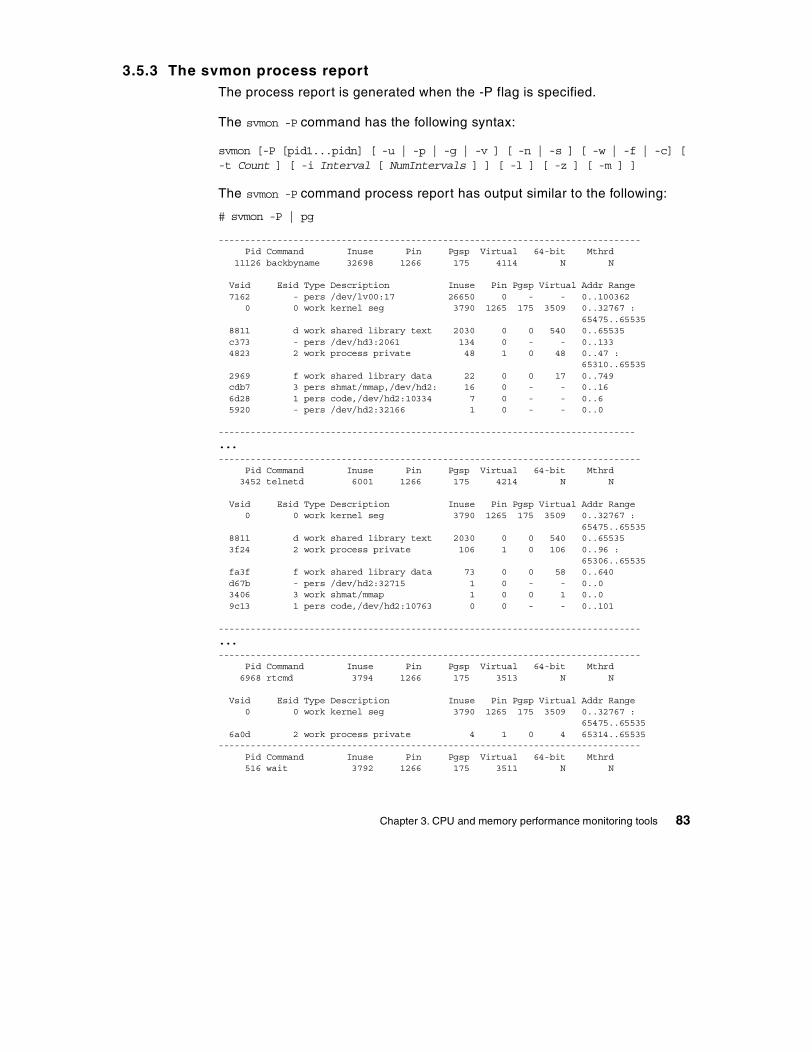
3.5.3 The svmon process reportThe process report is generated when the -P flag is specified.
The svmon -P command has the following syntax:
svmon [-P [pid1...pidn] [ -u | -p | -g | -v ] [ -n | -s ] [ -w | -f | -c] [-t Count ] [ -i Interval [ NumIntervals ] ] [ -l ] [ -z ] [ -m ] ]
The svmon -P command process report has output similar to the following:
# svmon -P | pg
-------------------------------------------------------------------------------Pid Command Inuse Pin Pgsp Virtual 64-bit Mthrd
11126 backbyname 32698 1266 175 4114 N N
Vsid Esid Type Description Inuse Pin Pgsp Virtual Addr Range7162 - pers /dev/lv00:17 26650 0 - - 0..100362
0 0 work kernel seg 3790 1265 175 3509 0..32767 :65475..65535
8811 d work shared library text 2030 0 0 540 0..65535c373 - pers /dev/hd3:2061 134 0 - - 0..1334823 2 work process private 48 1 0 48 0..47 :
65310..655352969 f work shared library data 22 0 0 17 0..749cdb7 3 pers shmat/mmap,/dev/hd2: 16 0 - - 0..166d28 1 pers code,/dev/hd2:10334 7 0 - - 0..65920 - pers /dev/hd2:32166 1 0 - - 0..0
------------------------------------------------------------------------------
...-------------------------------------------------------------------------------
Pid Command Inuse Pin Pgsp Virtual 64-bit Mthrd3452 telnetd 6001 1266 175 4214 N N
Vsid Esid Type Description Inuse Pin Pgsp Virtual Addr Range0 0 work kernel seg 3790 1265 175 3509 0..32767 :
65475..655358811 d work shared library text 2030 0 0 540 0..655353f24 2 work process private 106 1 0 106 0..96 :
65306..65535fa3f f work shared library data 73 0 0 58 0..640d67b - pers /dev/hd2:32715 1 0 - - 0..03406 3 work shmat/mmap 1 0 0 1 0..09c13 1 pers code,/dev/hd2:10763 0 0 - - 0..101
-------------------------------------------------------------------------------
...-------------------------------------------------------------------------------
Pid Command Inuse Pin Pgsp Virtual 64-bit Mthrd6968 rtcmd 3794 1266 175 3513 N N
Vsid Esid Type Description Inuse Pin Pgsp Virtual Addr Range0 0 work kernel seg 3790 1265 175 3509 0..32767 :
65475..655356a0d 2 work process private 4 1 0 4 65314..65535
-------------------------------------------------------------------------------Pid Command Inuse Pin Pgsp Virtual 64-bit Mthrd516 wait 3792 1266 175 3511 N N
Chapter 3. CPU and memory performance monitoring tools 83
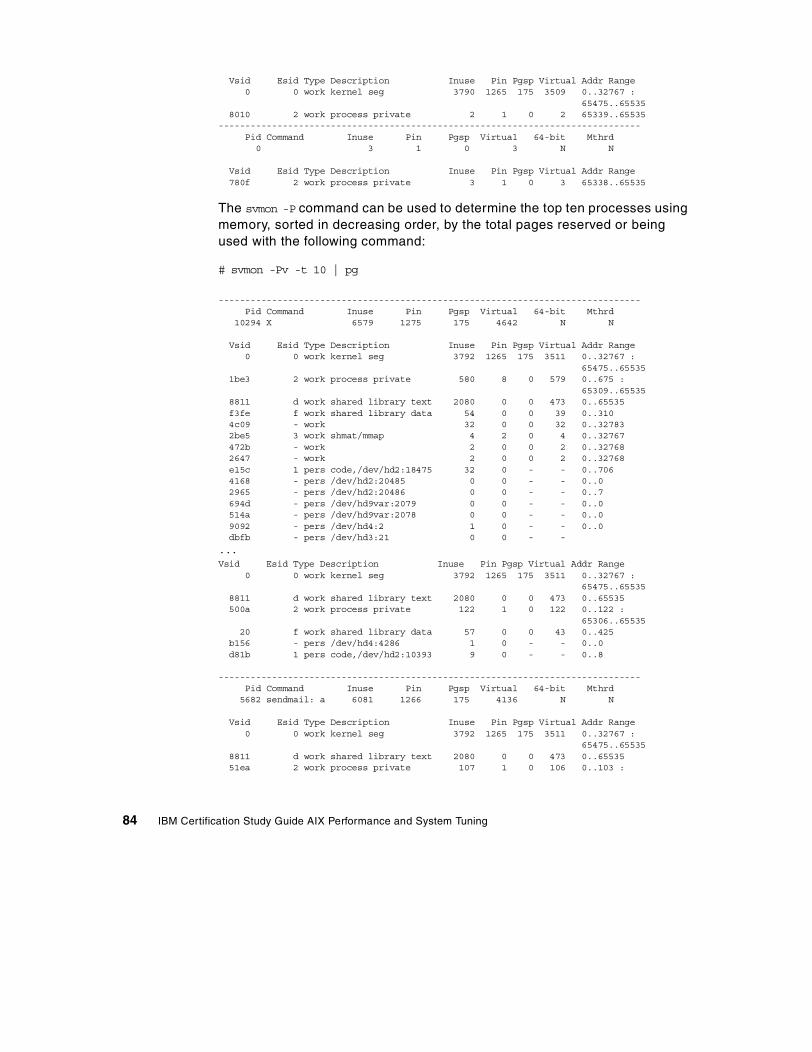
Vsid Esid Type Description Inuse Pin Pgsp Virtual Addr Range0 0 work kernel seg 3790 1265 175 3509 0..32767 :
65475..655358010 2 work process private 2 1 0 2 65339..65535
-------------------------------------------------------------------------------Pid Command Inuse Pin Pgsp Virtual 64-bit Mthrd0 3 1 0 3 N N
Vsid Esid Type Description Inuse Pin Pgsp Virtual Addr Range780f 2 work process private 3 1 0 3 65338..65535
The svmon -P command can be used to determine the top ten processes using memory, sorted in decreasing order, by the total pages reserved or being used with the following command:
# svmon -Pv -t 10 | pg
-------------------------------------------------------------------------------Pid Command Inuse Pin Pgsp Virtual 64-bit Mthrd
10294 X 6579 1275 175 4642 N N
Vsid Esid Type Description Inuse Pin Pgsp Virtual Addr Range0 0 work kernel seg 3792 1265 175 3511 0..32767 :
65475..655351be3 2 work process private 580 8 0 579 0..675 :
65309..655358811 d work shared library text 2080 0 0 473 0..65535f3fe f work shared library data 54 0 0 39 0..3104c09 - work 32 0 0 32 0..327832be5 3 work shmat/mmap 4 2 0 4 0..32767472b - work 2 0 0 2 0..327682647 - work 2 0 0 2 0..32768e15c 1 pers code,/dev/hd2:18475 32 0 - - 0..7064168 - pers /dev/hd2:20485 0 0 - - 0..02965 - pers /dev/hd2:20486 0 0 - - 0..7694d - pers /dev/hd9var:2079 0 0 - - 0..0514a - pers /dev/hd9var:2078 0 0 - - 0..09092 - pers /dev/hd4:2 1 0 - - 0..0dbfb - pers /dev/hd3:21 0 0 - -
...Vsid Esid Type Description Inuse Pin Pgsp Virtual Addr Range
0 0 work kernel seg 3792 1265 175 3511 0..32767 :65475..65535
8811 d work shared library text 2080 0 0 473 0..65535500a 2 work process private 122 1 0 122 0..122 :
65306..6553520 f work shared library data 57 0 0 43 0..425
b156 - pers /dev/hd4:4286 1 0 - - 0..0d81b 1 pers code,/dev/hd2:10393 9 0 - - 0..8
-------------------------------------------------------------------------------Pid Command Inuse Pin Pgsp Virtual 64-bit Mthrd5682 sendmail: a 6081 1266 175 4136 N N
Vsid Esid Type Description Inuse Pin Pgsp Virtual Addr Range0 0 work kernel seg 3792 1265 175 3511 0..32767 :
65475..655358811 d work shared library text 2080 0 0 473 0..6553551ea 2 work process private 107 1 0 106 0..103 :
84 IBM Certification Study Guide AIX Performance and System Tuning
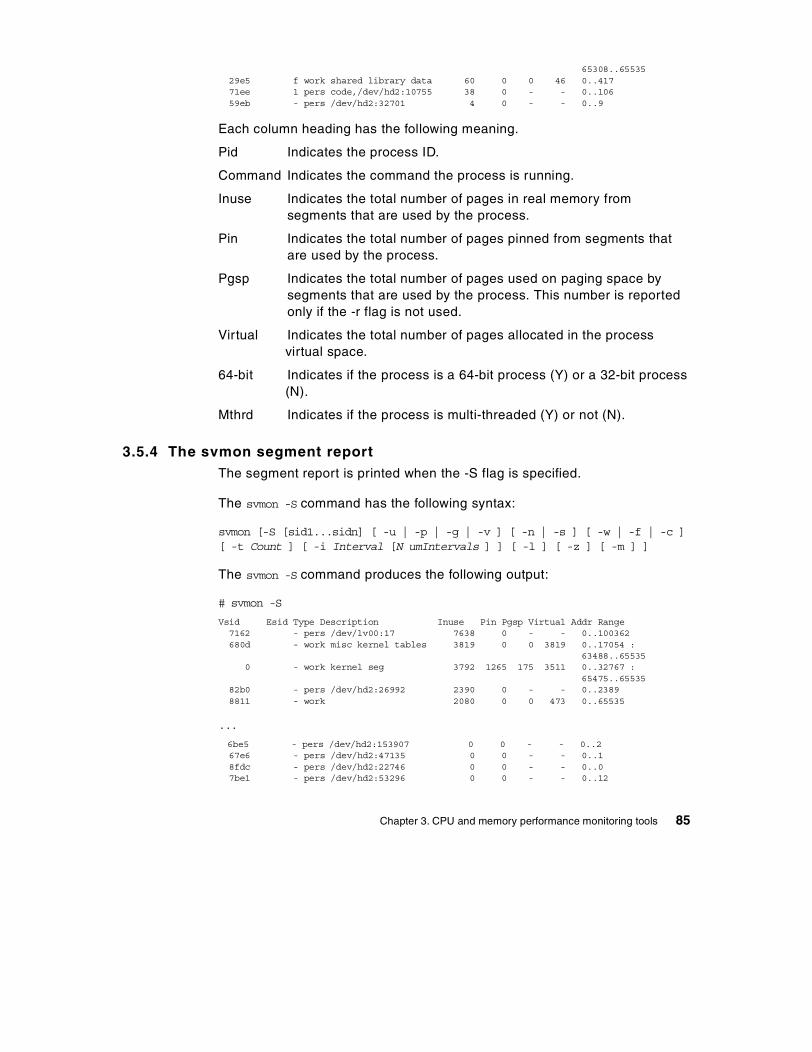
65308..6553529e5 f work shared library data 60 0 0 46 0..41771ee 1 pers code,/dev/hd2:10755 38 0 - - 0..10659eb - pers /dev/hd2:32701 4 0 - - 0..9
Each column heading has the following meaning.
Pid Indicates the process ID.
Command Indicates the command the process is running.
Inuse Indicates the total number of pages in real memory from segments that are used by the process.
Pin Indicates the total number of pages pinned from segments that are used by the process.
Pgsp Indicates the total number of pages used on paging space by segments that are used by the process. This number is reported only if the -r flag is not used.
Virtual Indicates the total number of pages allocated in the process virtual space.
64-bit Indicates if the process is a 64-bit process (Y) or a 32-bit process (N).
Mthrd Indicates if the process is multi-threaded (Y) or not (N).
3.5.4 The svmon segment reportThe segment report is printed when the -S flag is specified.
The svmon -S command has the following syntax:
svmon [-S [sid1...sidn] [ -u | -p | -g | -v ] [ -n | -s ] [ -w | -f | -c ][ -t Count ] [ -i Interval [N umIntervals ] ] [ -l ] [ -z ] [ -m ] ]
The svmon -S command produces the following output:
# svmon -S
Vsid Esid Type Description Inuse Pin Pgsp Virtual Addr Range7162 - pers /dev/lv00:17 7638 0 - - 0..100362680d - work misc kernel tables 3819 0 0 3819 0..17054 :
63488..655350 - work kernel seg 3792 1265 175 3511 0..32767 :
65475..6553582b0 - pers /dev/hd2:26992 2390 0 - - 0..23898811 - work 2080 0 0 473 0..65535
...
6be5 - pers /dev/hd2:153907 0 0 - - 0..267e6 - pers /dev/hd2:47135 0 0 - - 0..18fdc - pers /dev/hd2:22746 0 0 - - 0..07be1 - pers /dev/hd2:53296 0 0 - - 0..12
Chapter 3. CPU and memory performance monitoring tools 85
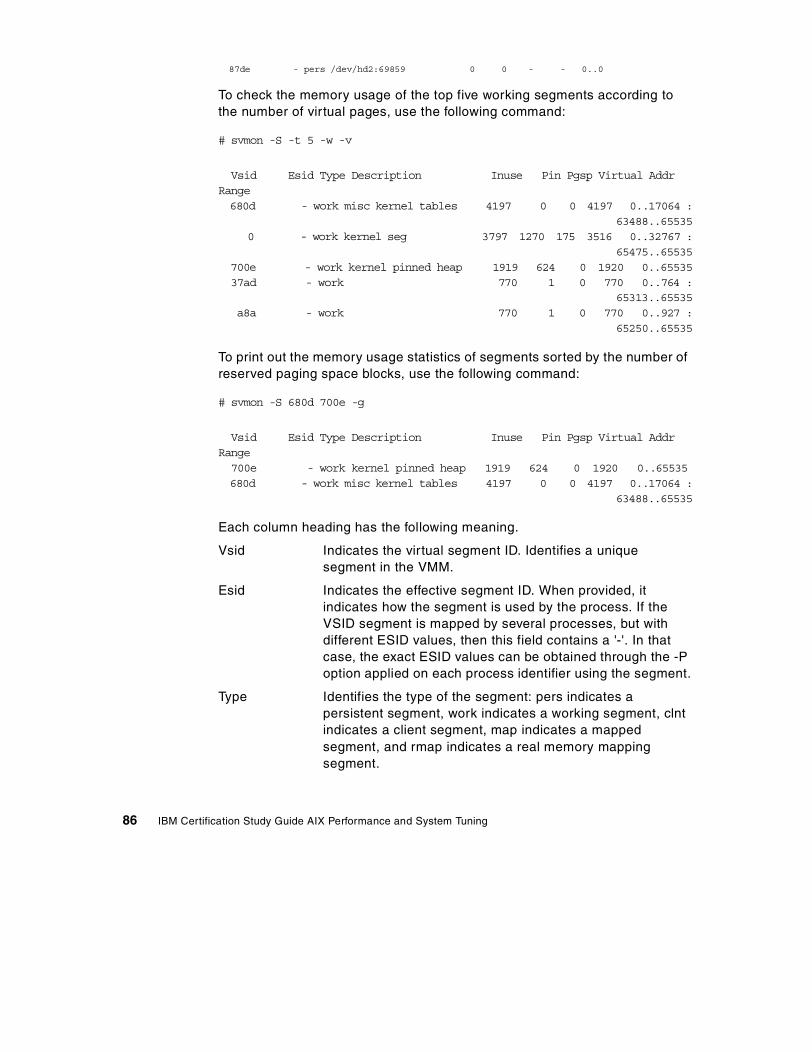
87de - pers /dev/hd2:69859 0 0 - - 0..0
To check the memory usage of the top five working segments according to the number of virtual pages, use the following command:
# svmon -S -t 5 -w -v
Vsid Esid Type Description Inuse Pin Pgsp Virtual AddrRange680d - work misc kernel tables 4197 0 0 4197 0..17064 :
63488..655350 - work kernel seg 3797 1270 175 3516 0..32767 :
65475..65535700e - work kernel pinned heap 1919 624 0 1920 0..6553537ad - work 770 1 0 770 0..764 :
65313..65535a8a - work 770 1 0 770 0..927 :
65250..65535
To print out the memory usage statistics of segments sorted by the number of reserved paging space blocks, use the following command:
# svmon -S 680d 700e -g
Vsid Esid Type Description Inuse Pin Pgsp Virtual AddrRange700e - work kernel pinned heap 1919 624 0 1920 0..65535680d - work misc kernel tables 4197 0 0 4197 0..17064 :
63488..65535
Each column heading has the following meaning.
Vsid Indicates the virtual segment ID. Identifies a unique segment in the VMM.
Esid Indicates the effective segment ID. When provided, it indicates how the segment is used by the process. If the VSID segment is mapped by several processes, but with different ESID values, then this field contains a '-'. In that case, the exact ESID values can be obtained through the -P option applied on each process identifier using the segment.
Type Identifies the type of the segment: pers indicates a persistent segment, work indicates a working segment, clnt indicates a client segment, map indicates a mapped segment, and rmap indicates a real memory mapping segment.
86 IBM Certification Study Guide AIX Performance and System Tuning
Description Specifies a textual description of the segment. The value of this column depends on the segment type. If the segment is a persistent segment and is not associated with a log, then the device name and i-node number of the associated file are displayed, separated by a colon. (The device name and i-node can be translated into a file name with the ncheck command.) If the segment is the primary segment of a large file, then the words large file are prepended to the description. If the segment is a persistent segment and is associated with a log, then the string log is displayed.
If the segment is a working segment, then the svmon command attempts to determine the role of the segment. For instance, special working segments, such as the kernel and shared library, are recognized by the svmon command. If the segment is the private data segment for a process, then private is printed out. If the segment is the code segment for a process, and the segment report is printed out in response to the -P flag, then the word code is prepended to the description.
If the segment is mapped by several processes and used in a different way (for example, a process private segment mapped as shared memory by another process), then the description is empty. The exact description can be obtained through -P flag applied on each process identifier using the segment.
If a segment description is too large to fit in the description space then the description is truncated. The truncated part can be obtained through the -S flag (without -l) on the given segment.
Inuse Indicates the number of pages in real memory in this segment.
Pin Indicates the number of pages pinned in this segment.
Pgsp Indicates the number of pages used on paging space by this segment. This field is relevant only for working segments.
Virtual Indicates the number of pages allocated for the virtual space of the segment. (Only for working segments.)
VMM manages this value for statistical purposes. It may not be updated. Then the value may be less than the inuse counters.
Chapter 3. CPU and memory performance monitoring tools 87
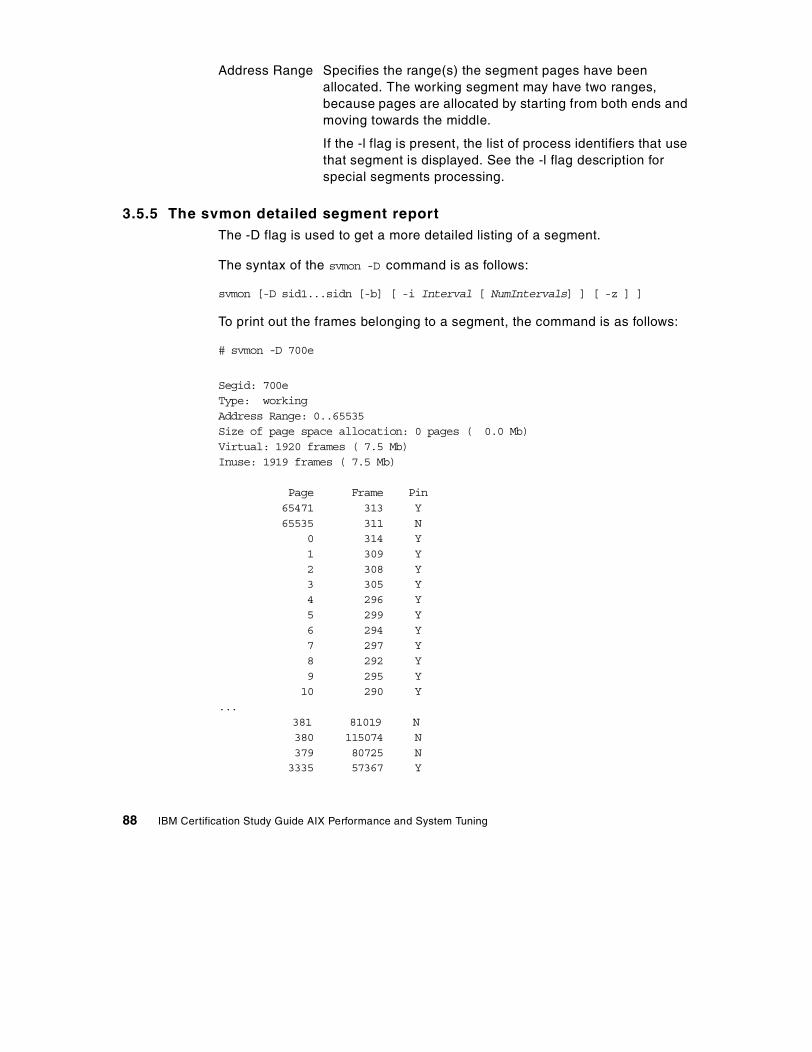
Address Range Specifies the range(s) the segment pages have been allocated. The working segment may have two ranges, because pages are allocated by starting from both ends and moving towards the middle.
If the -l flag is present, the list of process identifiers that use that segment is displayed. See the -l flag description for special segments processing.
3.5.5 The svmon detailed segment reportThe -D flag is used to get a more detailed listing of a segment.
The syntax of the svmon -D command is as follows:
svmon [-D sid1...sidn [-b] [ -i Interval [ NumIntervals] ] [ -z ] ]
To print out the frames belonging to a segment, the command is as follows:
# svmon -D 700e
Segid: 700eType: workingAddress Range: 0..65535Size of page space allocation: 0 pages ( 0.0 Mb)Virtual: 1920 frames ( 7.5 Mb)Inuse: 1919 frames ( 7.5 Mb)
Page Frame Pin65471 313 Y65535 311 N
0 314 Y1 309 Y2 308 Y3 305 Y4 296 Y5 299 Y6 294 Y7 297 Y8 292 Y9 295 Y10 290 Y
...381 81019 N380 115074 N379 80725 N3335 57367 Y
88 IBM Certification Study Guide AIX Performance and System Tuning
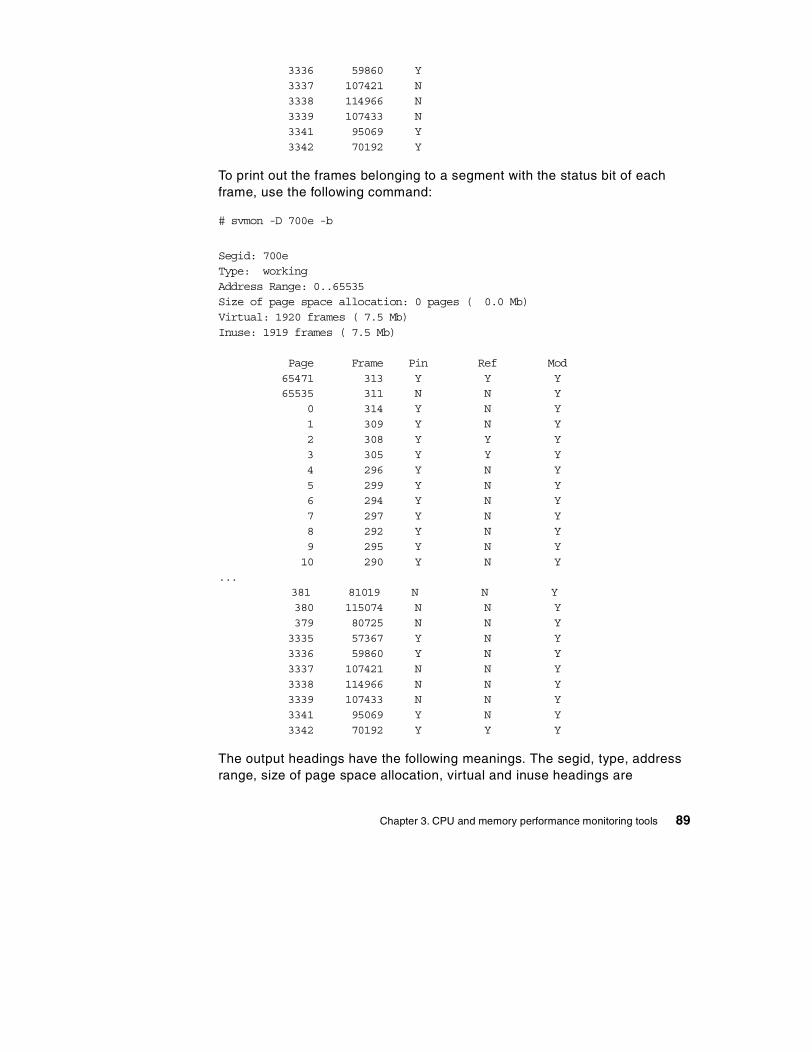
3336 59860 Y3337 107421 N3338 114966 N3339 107433 N3341 95069 Y3342 70192 Y
To print out the frames belonging to a segment with the status bit of each frame, use the following command:
# svmon -D 700e -b
Segid: 700eType: workingAddress Range: 0..65535Size of page space allocation: 0 pages ( 0.0 Mb)Virtual: 1920 frames ( 7.5 Mb)Inuse: 1919 frames ( 7.5 Mb)
Page Frame Pin Ref Mod65471 313 Y Y Y65535 311 N N Y
0 314 Y N Y1 309 Y N Y2 308 Y Y Y3 305 Y Y Y4 296 Y N Y5 299 Y N Y6 294 Y N Y7 297 Y N Y8 292 Y N Y9 295 Y N Y10 290 Y N Y
...381 81019 N N Y380 115074 N N Y379 80725 N N Y3335 57367 Y N Y3336 59860 Y N Y3337 107421 N N Y3338 114966 N N Y3339 107433 N N Y3341 95069 Y N Y3342 70192 Y Y Y
The output headings have the following meanings. The segid, type, address range, size of page space allocation, virtual and inuse headings are
Chapter 3. CPU and memory performance monitoring tools 89
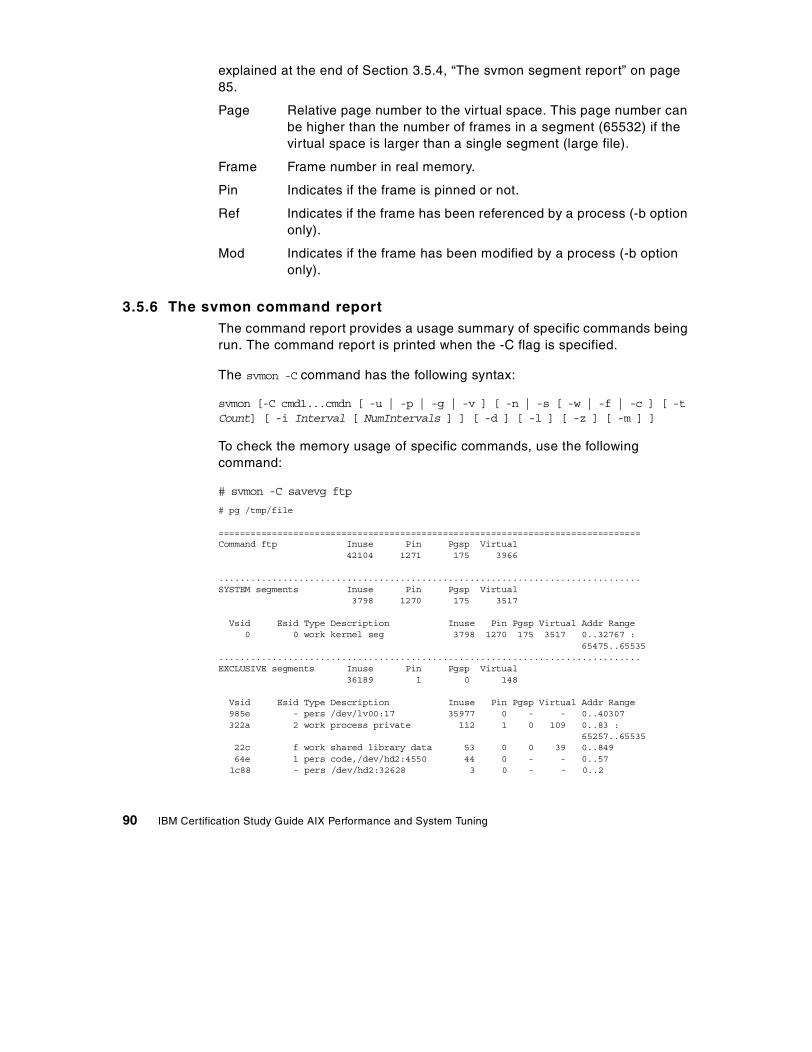
explained at the end of Section 3.5.4, “The svmon segment report” on page 85.
Page Relative page number to the virtual space. This page number can be higher than the number of frames in a segment (65532) if the virtual space is larger than a single segment (large file).
Frame Frame number in real memory.
Pin Indicates if the frame is pinned or not.
Ref Indicates if the frame has been referenced by a process (-b option only).
Mod Indicates if the frame has been modified by a process (-b option only).
3.5.6 The svmon command reportThe command report provides a usage summary of specific commands being run. The command report is printed when the -C flag is specified.
The svmon -C command has the following syntax:
svmon [-C cmd1...cmdn [ -u | -p | -g | -v ] [ -n | -s [ -w | -f | -c ] [ -tCount] [ -i Interval [ NumIntervals ] ] [ -d ] [ -l ] [ -z ] [ -m ] ]
To check the memory usage of specific commands, use the following command:
# svmon -C savevg ftp
# pg /tmp/file
===============================================================================Command ftp Inuse Pin Pgsp Virtual
42104 1271 175 3966
...............................................................................SYSTEM segments Inuse Pin Pgsp Virtual
3798 1270 175 3517
Vsid Esid Type Description Inuse Pin Pgsp Virtual Addr Range0 0 work kernel seg 3798 1270 175 3517 0..32767 :
65475..65535...............................................................................EXCLUSIVE segments Inuse Pin Pgsp Virtual
36189 1 0 148
Vsid Esid Type Description Inuse Pin Pgsp Virtual Addr Range985e - pers /dev/lv00:17 35977 0 - - 0..40307322a 2 work process private 112 1 0 109 0..83 :
65257..6553522c f work shared library data 53 0 0 39 0..84964e 1 pers code,/dev/hd2:4550 44 0 - - 0..571c88 - pers /dev/hd2:32628 3 0 - - 0..2
90 IBM Certification Study Guide AIX Performance and System Tuning
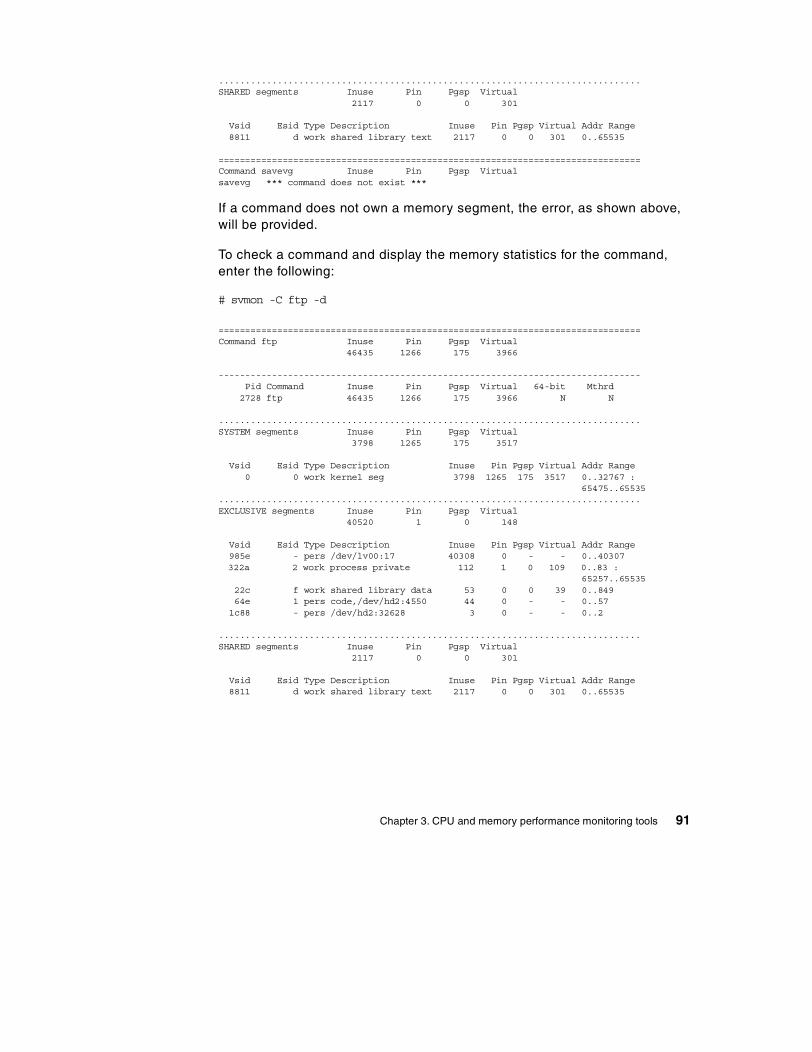
...............................................................................SHARED segments Inuse Pin Pgsp Virtual
2117 0 0 301
Vsid Esid Type Description Inuse Pin Pgsp Virtual Addr Range8811 d work shared library text 2117 0 0 301 0..65535
===============================================================================Command savevg Inuse Pin Pgsp Virtualsavevg *** command does not exist ***
If a command does not own a memory segment, the error, as shown above, will be provided.
To check a command and display the memory statistics for the command, enter the following:
# svmon -C ftp -d
===============================================================================Command ftp Inuse Pin Pgsp Virtual
46435 1266 175 3966
-------------------------------------------------------------------------------Pid Command Inuse Pin Pgsp Virtual 64-bit Mthrd2728 ftp 46435 1266 175 3966 N N
...............................................................................SYSTEM segments Inuse Pin Pgsp Virtual
3798 1265 175 3517
Vsid Esid Type Description Inuse Pin Pgsp Virtual Addr Range0 0 work kernel seg 3798 1265 175 3517 0..32767 :
65475..65535...............................................................................EXCLUSIVE segments Inuse Pin Pgsp Virtual
40520 1 0 148
Vsid Esid Type Description Inuse Pin Pgsp Virtual Addr Range985e - pers /dev/lv00:17 40308 0 - - 0..40307322a 2 work process private 112 1 0 109 0..83 :
65257..6553522c f work shared library data 53 0 0 39 0..84964e 1 pers code,/dev/hd2:4550 44 0 - - 0..571c88 - pers /dev/hd2:32628 3 0 - - 0..2
...............................................................................SHARED segments Inuse Pin Pgsp Virtual
2117 0 0 301
Vsid Esid Type Description Inuse Pin Pgsp Virtual Addr Range8811 d work shared library text 2117 0 0 301 0..65535
Chapter 3. CPU and memory performance monitoring tools 91
The column headings have the following meaning:
Command Indicates the command name.
Inuse Indicates the total number of pages in real memory in segments that are used by the command (all process running the command).
Pin Indicates the total number of pages pinned in segments that are used by the command (all process running the command).
Pgsp Indicates the total number of pages reserved or used on paging space by segments that are used by the command.
Virtual Indicates the total number of pages allocated in the virtual space of the command. Once this column heading is displayed, svmon displays (if the -d flag is specified) information about all the processes running the specified command. It only contains the column headings of the processes, as described in a process report. Then svmon displays information about the segments used by those processes.
This set of segments is separated into three categories:
•The segments that are flagged as system that are shared by all processes.
•The segments that are only used by the set of processes.
•The segments that are shared between several command names.
If the -l flag is specified, then for each segment in the last category, the list of process identifiers that use the segment is displayed. The command name that the process identifier runs is also displayed. See the -l flag description for special segments processing.
3.5.7 The svmon Workload Manager class reportThe workload class report is printed when the -W flag is specified. The svmon-W command has the following syntax:
svmon [ -W [class1...classn] [ -u | -p | - g | -v ] [ -n | -s ] [ -w | -f |-c ] [ -t Count ] [ -i Interval [ NumIntervals ] ] [ -l ] [ -z ] [ -m ] ]
The svmon -W command must run when Workload Manager must be started.
Note
92 IBM Certification Study Guide AIX Performance and System Tuning
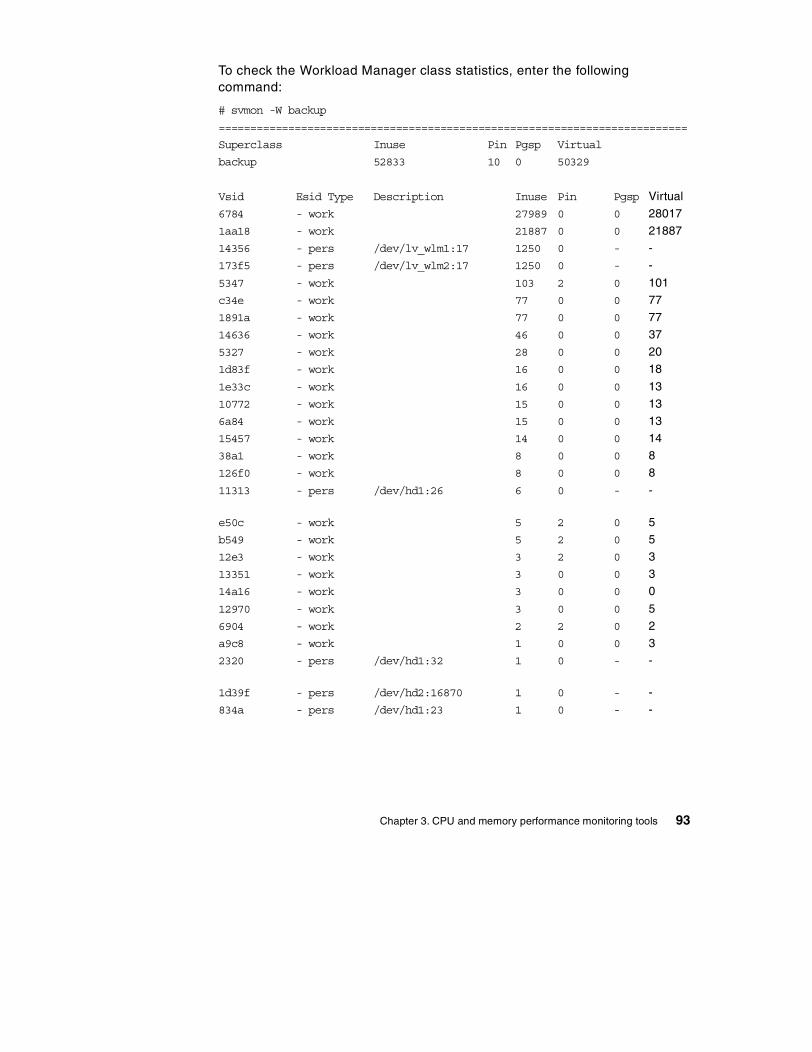
To check the Workload Manager class statistics, enter the following command:
# svmon -W backup
==========================================================================
Superclass Inuse Pin Pgsp Virtual
backup 52833 10 0 50329
Vsid Esid Type Description Inuse Pin Pgsp Virtual
6784 - work 27989 0 0 28017
1aa18 - work 21887 0 0 21887
14356 - pers /dev/lv_wlm1:17 1250 0 - -
173f5 - pers /dev/lv_wlm2:17 1250 0 - -
5347 - work 103 2 0 101
c34e - work 77 0 0 77
1891a - work 77 0 0 77
14636 - work 46 0 0 37
5327 - work 28 0 0 20
1d83f - work 16 0 0 18
1e33c - work 16 0 0 13
10772 - work 15 0 0 13
6a84 - work 15 0 0 13
15457 - work 14 0 0 14
38a1 - work 8 0 0 8
126f0 - work 8 0 0 8
11313 - pers /dev/hd1:26 6 0 - -
e50c - work 5 2 0 5
b549 - work 5 2 0 5
12e3 - work 3 2 0 3
13351 - work 3 0 0 3
14a16 - work 3 0 0 0
12970 - work 3 0 0 5
6904 - work 2 2 0 2
a9c8 - work 1 0 0 3
2320 - pers /dev/hd1:32 1 0 - -
1d39f - pers /dev/hd2:16870 1 0 - -
834a - pers /dev/hd1:23 1 0 - -
Chapter 3. CPU and memory performance monitoring tools 93
The column headings in a Workload Manager class report have the following meaning:
Class Indicates the workload class name.
Inuse Indicates the total number of pages in real memory in segments belonging to the workload class.
Pin Indicates the total number of pages pinned in segments belonging to the workload class.
Pgsp Indicates the total number of pages reserved or used on paging space by segments belonging to the workload class.
Virtual Indicates the total number of pages allocated in the virtual space of the workload class.
Once this columns heading is displayed, svmon displays information about the segments belonging to the workload class.
If -l option is specified, then for each segment, the list of process identifiers that use the segment is displayed. The workload class the process belongs to is also displayed. See the -l flag description for special segments processing.
3.5.8 The svmon command flagsThe same flags for svmon are used by the different report types, with the exception of the global and detailed segment reports.
Table 7. Commonly used flags of the svmon command
Flag Description
-G Displays a global report.
-P [ pid1... pidN] Displays memory usage statistics for process pid1...pidN. pid is a decimal value. If no list of process IDs (PIDs) is supplied, memory usage statistics are displayed for all active processes.
A process belongs to the workload class if its initial thread belongs to it.
Note
94 IBM Certification Study Guide AIX Performance and System Tuning
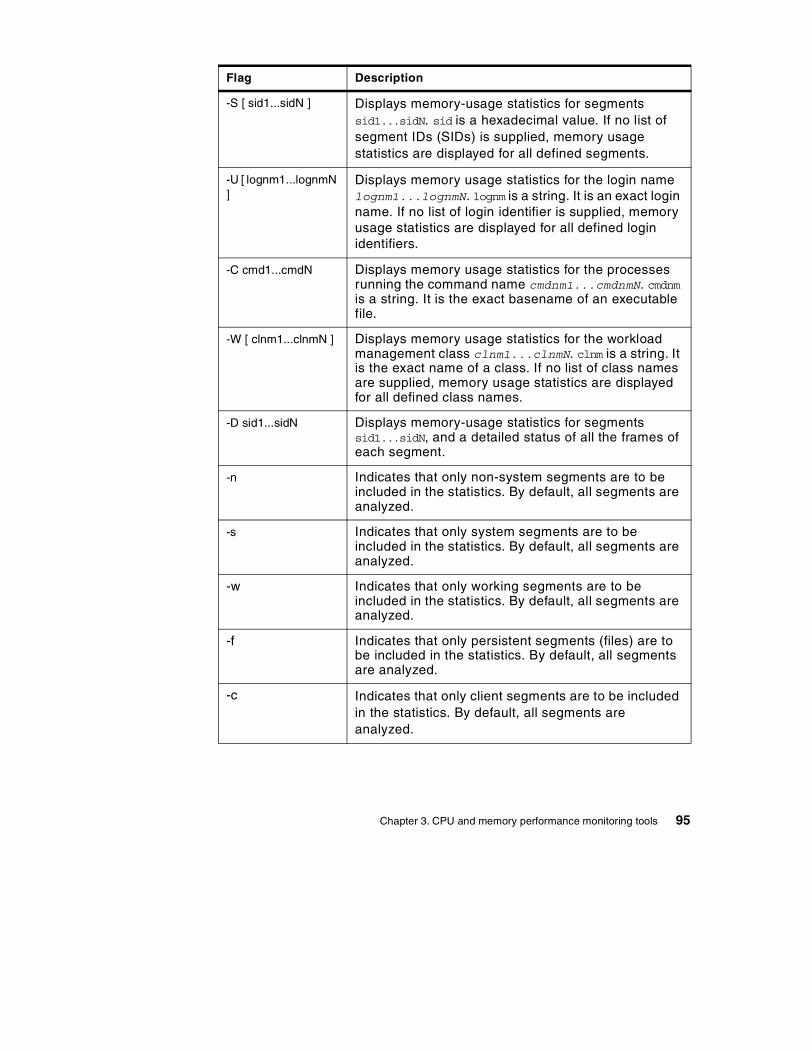
-S [ sid1...sidN ] Displays memory-usage statistics for segments sid1...sidN. sid is a hexadecimal value. If no list of segment IDs (SIDs) is supplied, memory usage statistics are displayed for all defined segments.
-U [ lognm1...lognmN ]
Displays memory usage statistics for the login name lognm1...lognmN. lognm is a string. It is an exact login name. If no list of login identifier is supplied, memory usage statistics are displayed for all defined login identifiers.
-C cmd1...cmdN Displays memory usage statistics for the processes running the command name cmdnm1...cmdnmN. cmdnm is a string. It is the exact basename of an executable file.
-W [ clnm1...clnmN ] Displays memory usage statistics for the workload management class clnm1...clnmN. clnm is a string. It is the exact name of a class. If no list of class names are supplied, memory usage statistics are displayed for all defined class names.
-D sid1...sidN Displays memory-usage statistics for segments sid1...sidN, and a detailed status of all the frames of each segment.
-n Indicates that only non-system segments are to be included in the statistics. By default, all segments are analyzed.
-s Indicates that only system segments are to be included in the statistics. By default, all segments are analyzed.
-w Indicates that only working segments are to be included in the statistics. By default, all segments are analyzed.
-f Indicates that only persistent segments (files) are to be included in the statistics. By default, all segments are analyzed.
-c Indicates that only client segments are to be included in the statistics. By default, all segments are analyzed.
Flag Description
Chapter 3. CPU and memory performance monitoring tools 95
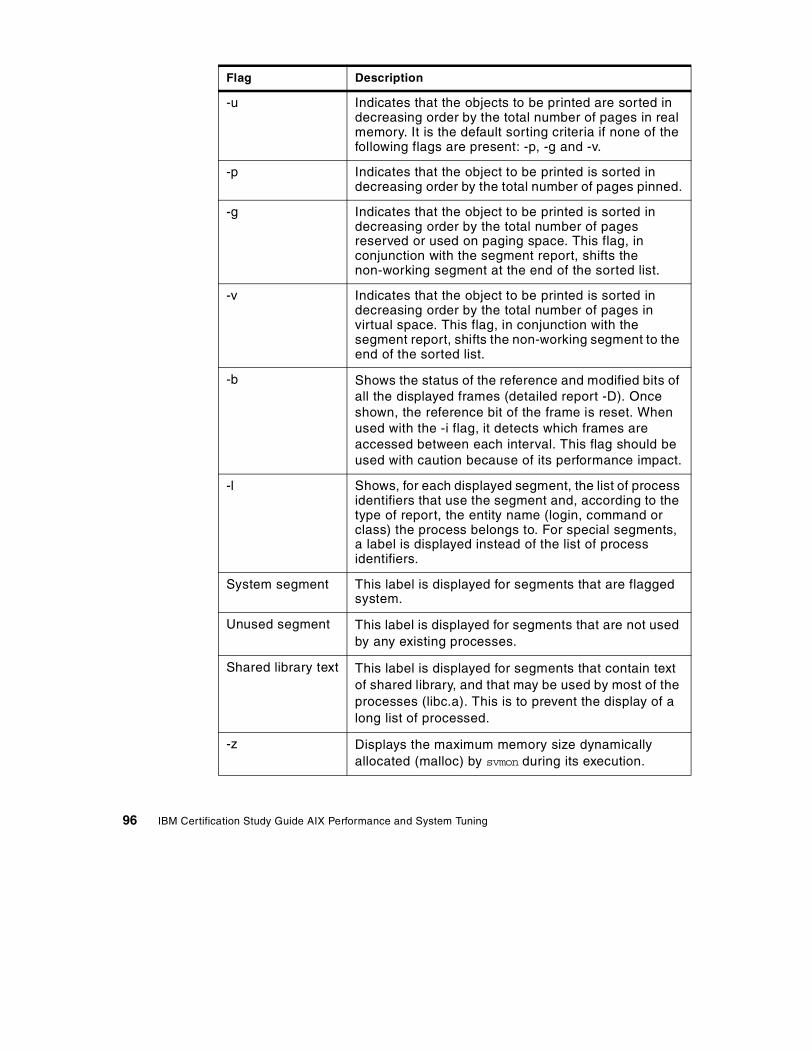
-u Indicates that the objects to be printed are sorted in decreasing order by the total number of pages in real memory. It is the default sorting criteria if none of the following flags are present: -p, -g and -v.
-p Indicates that the object to be printed is sorted in decreasing order by the total number of pages pinned.
-g Indicates that the object to be printed is sorted in decreasing order by the total number of pages reserved or used on paging space. This flag, in conjunction with the segment report, shifts the non-working segment at the end of the sorted list.
-v Indicates that the object to be printed is sorted in decreasing order by the total number of pages in virtual space. This flag, in conjunction with the segment report, shifts the non-working segment to the end of the sorted list.
-b Shows the status of the reference and modified bits of all the displayed frames (detailed report -D). Once shown, the reference bit of the frame is reset. When used with the -i flag, it detects which frames are accessed between each interval. This flag should be used with caution because of its performance impact.
-l Shows, for each displayed segment, the list of process identifiers that use the segment and, according to the type of report, the entity name (login, command or class) the process belongs to. For special segments, a label is displayed instead of the list of process identifiers.
System segment This label is displayed for segments that are flagged system.
Unused segment This label is displayed for segments that are not used by any existing processes.
Shared library text This label is displayed for segments that contain text of shared library, and that may be used by most of the processes (libc.a). This is to prevent the display of a long list of processed.
-z Displays the maximum memory size dynamically allocated (malloc) by svmon during its execution.
Flag Description
96 IBM Certification Study Guide AIX Performance and System Tuning
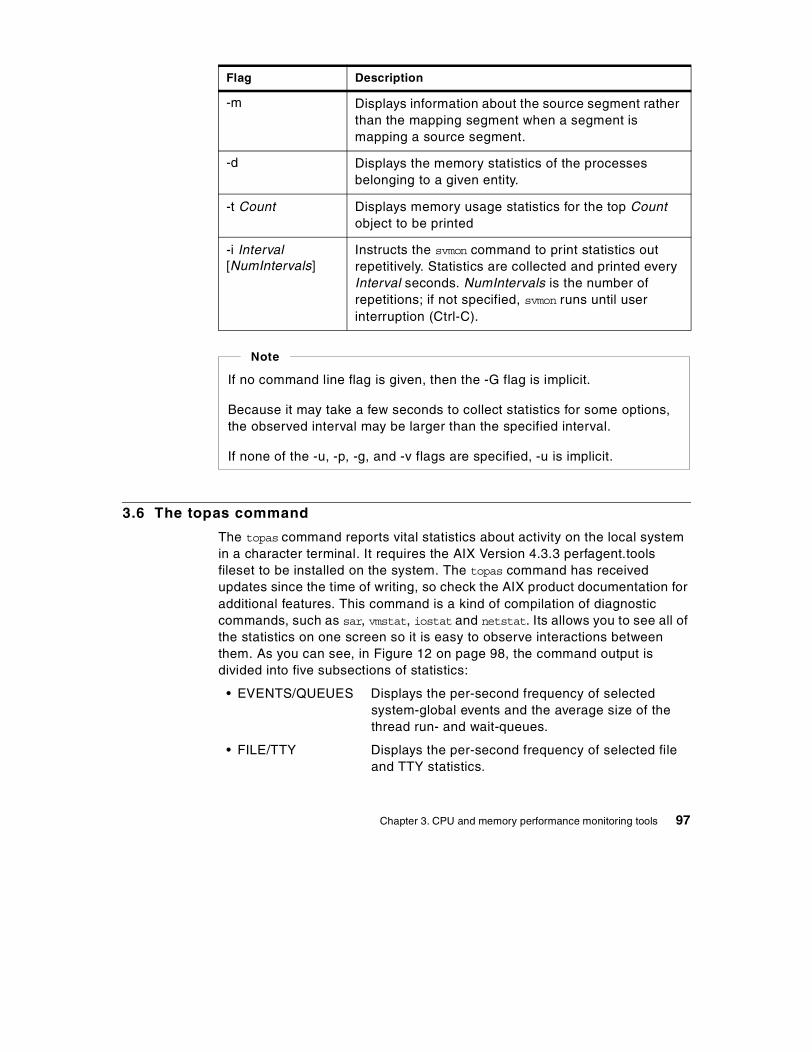
3.6 The topas command
The topas command reports vital statistics about activity on the local system in a character terminal. It requires the AIX Version 4.3.3 perfagent.tools fileset to be installed on the system. The topas command has received updates since the time of writing, so check the AIX product documentation for additional features. This command is a kind of compilation of diagnostic commands, such as sar, vmstat, iostat and netstat. Its allows you to see all of the statistics on one screen so it is easy to observe interactions between them. As you can see, in Figure 12 on page 98, the command output is divided into five subsections of statistics:
• EVENTS/QUEUES Displays the per-second frequency of selected system-global events and the average size of the thread run- and wait-queues.
• FILE/TTY Displays the per-second frequency of selected file and TTY statistics.
-m Displays information about the source segment rather than the mapping segment when a segment is mapping a source segment.
-d Displays the memory statistics of the processes belonging to a given entity.
-t Count Displays memory usage statistics for the top Count object to be printed
-i Interval [NumIntervals]
Instructs the svmon command to print statistics out repetitively. Statistics are collected and printed every Interval seconds. NumIntervals is the number of repetitions; if not specified, svmon runs until user interruption (Ctrl-C).
Flag Description
If no command line flag is given, then the -G flag is implicit.
Because it may take a few seconds to collect statistics for some options, the observed interval may be larger than the specified interval.
If none of the -u, -p, -g, and -v flags are specified, -u is implicit.
Note
Chapter 3. CPU and memory performance monitoring tools 97
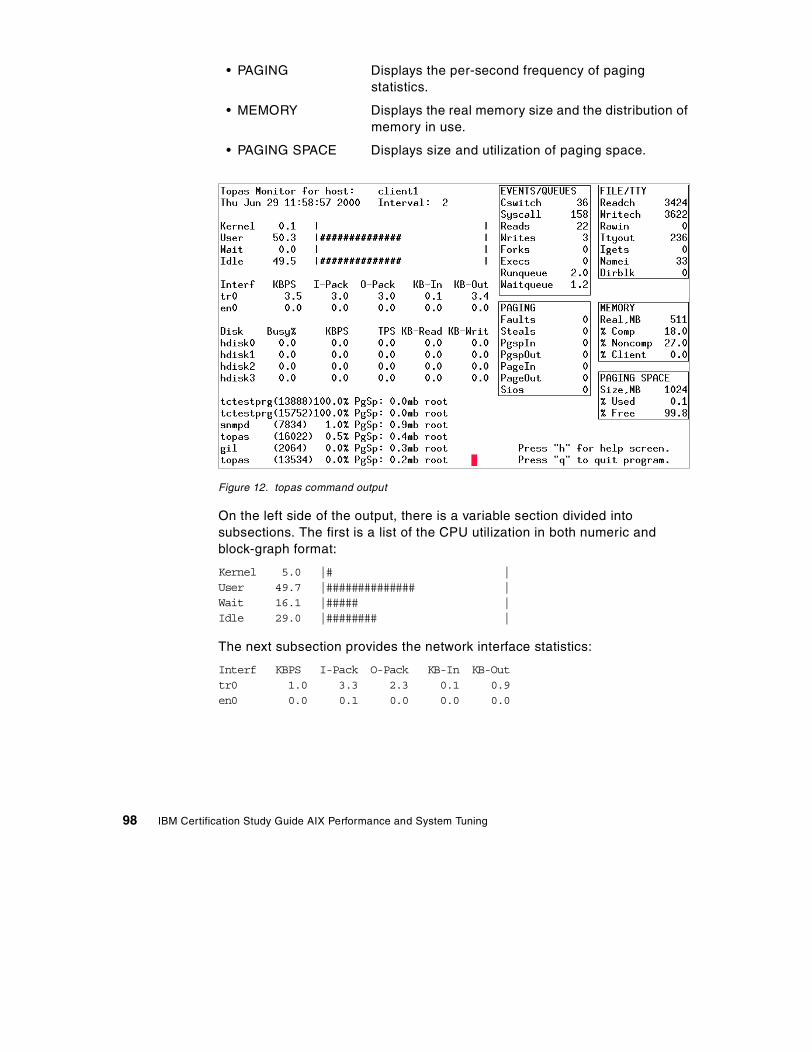
• PAGING Displays the per-second frequency of paging statistics.
• MEMORY Displays the real memory size and the distribution of memory in use.
• PAGING SPACE Displays size and utilization of paging space.
Figure 12. topas command output
On the left side of the output, there is a variable section divided into subsections. The first is a list of the CPU utilization in both numeric and block-graph format:
Kernel 5.0 |# |User 49.7 |############## |Wait 16.1 |##### |Idle 29.0 |######## |
The next subsection provides the network interface statistics:
Interf KBPS I-Pack O-Pack KB-In KB-Outtr0 1.0 3.3 2.3 0.1 0.9en0 0.0 0.1 0.0 0.0 0.0
98 IBM Certification Study Guide AIX Performance and System Tuning
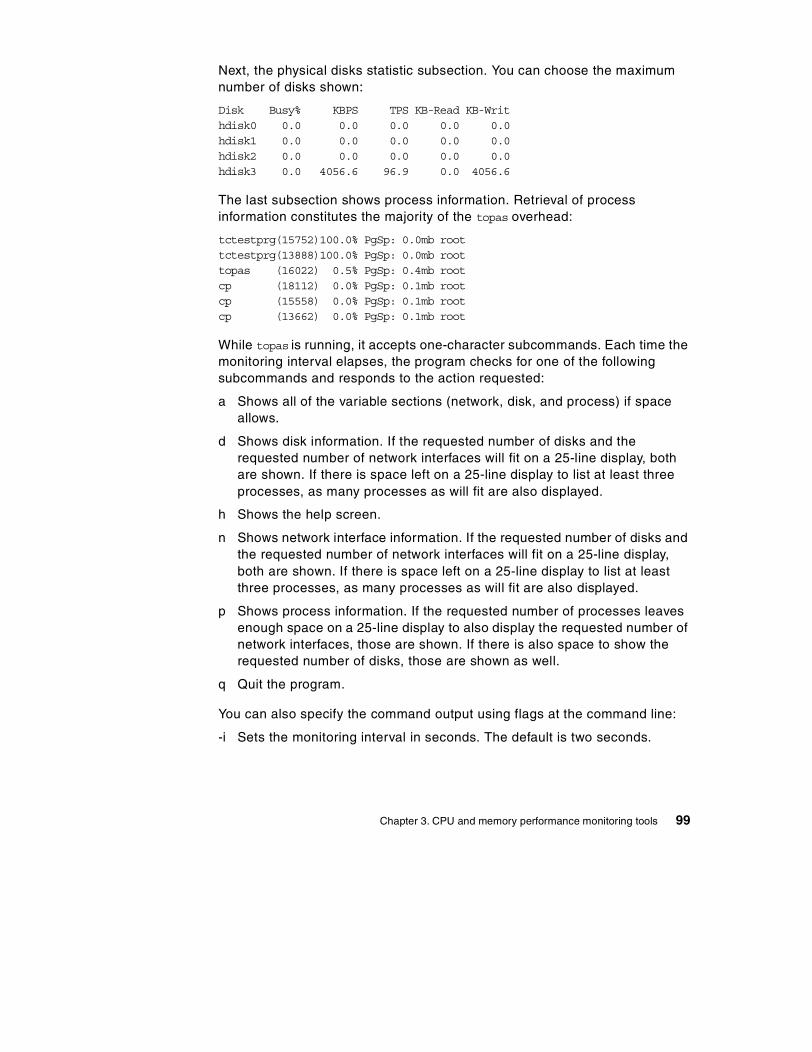
Next, the physical disks statistic subsection. You can choose the maximum number of disks shown:
Disk Busy% KBPS TPS KB-Read KB-Writhdisk0 0.0 0.0 0.0 0.0 0.0hdisk1 0.0 0.0 0.0 0.0 0.0hdisk2 0.0 0.0 0.0 0.0 0.0hdisk3 0.0 4056.6 96.9 0.0 4056.6
The last subsection shows process information. Retrieval of process information constitutes the majority of the topas overhead:
tctestprg(15752)100.0% PgSp: 0.0mb roottctestprg(13888)100.0% PgSp: 0.0mb roottopas (16022) 0.5% PgSp: 0.4mb rootcp (18112) 0.0% PgSp: 0.1mb rootcp (15558) 0.0% PgSp: 0.1mb rootcp (13662) 0.0% PgSp: 0.1mb root
While topas is running, it accepts one-character subcommands. Each time the monitoring interval elapses, the program checks for one of the following subcommands and responds to the action requested:
a Shows all of the variable sections (network, disk, and process) if space allows.
d Shows disk information. If the requested number of disks and the requested number of network interfaces will fit on a 25-line display, both are shown. If there is space left on a 25-line display to list at least three processes, as many processes as will fit are also displayed.
h Shows the help screen.
n Shows network interface information. If the requested number of disks and the requested number of network interfaces will fit on a 25-line display, both are shown. If there is space left on a 25-line display to list at least three processes, as many processes as will fit are also displayed.
p Shows process information. If the requested number of processes leaves enough space on a 25-line display to also display the requested number of network interfaces, those are shown. If there is also space to show the requested number of disks, those are shown as well.
q Quit the program.
You can also specify the command output using flags at the command line:
-i Sets the monitoring interval in seconds. The default is two seconds.
Chapter 3. CPU and memory performance monitoring tools 99
-n Specifies the maximum number of network interfaces shown. If a value of zero is specified, no network information will be displayed.
-p Specifies the maximum number of processes shown. If a value of zero is specified, no process information will be displayed.
Check the latest documentation for a full set of subcommands and command line options.
3.7 The emstat command
The PowerPC architecture no longer supports, in hardware, 35 POWER instructions. To maintain compatibility with older binaries (which may contain these deleted instructions), the AIX Version 4 kernel includes emulation routines that provide support for the deleted instructions. Attempting to execute a deleted instruction results in an illegal instruction exception. The kernel decodes the illegal instruction, and, if it is a deleted instruction, the kernel runs an emulation routine that functionally emulates the instruction.
The emstat command reports statistics regarding how many instructions the system must emulate. The emulated instruction count should be used to determine if an application needs to be recompiled to eliminate instructions that must be emulated on 601 PowerPC, 604 PowerPC, RS64, or other non-POWER processors. If an instruction must be emulated, more CPU cycles are required to execute this instruction than an instruction that does not have to be emulated.
Most emulation problems are seen on older PowerPC 604 systems. A typical example is a PowerPC 601 system that is upgraded to a 604 system. If performance slows down instead of improving, it is most likely due to emulation.
The solution to emulation is to recompile the application in common mode. The default architecture platform for compilations on AIX Version 4 is common architecture. However, the default architecture on AIX Version 3 was for POWER, POWER2, and PowerPC 601. If these binaries ran on a PowerPC 604, some instructions may be emulated.
To determine whether the emstat command is installed and available, run the following command:
# lslpp -l bos.adt.samples
100 IBM Certification Study Guide AIX Performance and System Tuning
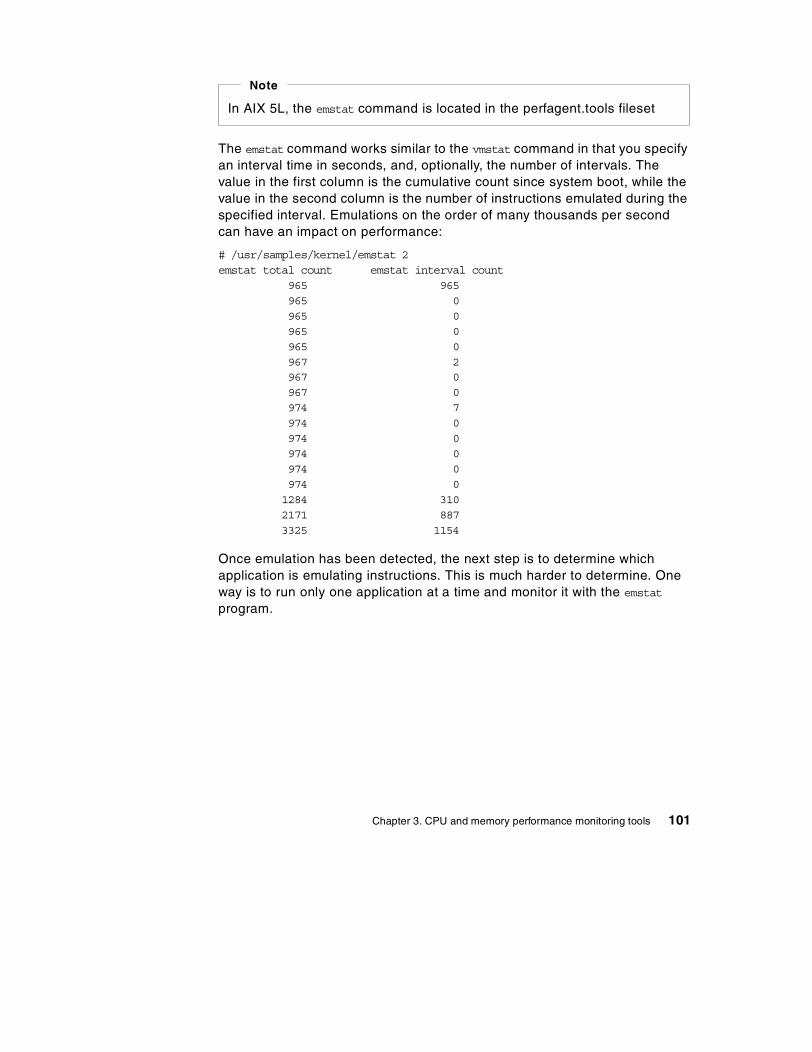
The emstat command works similar to the vmstat command in that you specify an interval time in seconds, and, optionally, the number of intervals. The value in the first column is the cumulative count since system boot, while the value in the second column is the number of instructions emulated during the specified interval. Emulations on the order of many thousands per second can have an impact on performance:
# /usr/samples/kernel/emstat 2emstat total count emstat interval count
965 965965 0965 0965 0965 0967 2967 0967 0974 7974 0974 0974 0974 0974 01284 3102171 8873325 1154
Once emulation has been detected, the next step is to determine which application is emulating instructions. This is much harder to determine. One way is to run only one application at a time and monitor it with the emstat program.
In AIX 5L, the emstat command is located in the perfagent.tools fileset
Note
Chapter 3. CPU and memory performance monitoring tools 101

3.8 Quiz
The following assessment questions help verify your understanding of the topics discussed in this chapter.
1. When monitoring a system with vmstat, which of the following values under the cpu heading would indicate that the system is probably CPU bound?
A. The value of wa greater than 70.
B. The value of id is greater than 70.
C. The sum of us and sy is consistently between 99 and 100.
D. The sum of id and wa is consistently between 99 and 100.
2. Which of the following commands should be used to show the number of system calls per second that are being executed?
A. pstat
B. vmstat
C. filemon
D. lockstat
3. When using vmstat with intervals, which of the following describes the values of the first line of statistics?
A. Averages since the system boot
B. Averages since the top of the hour
C. Averages since the beginning of the day
D. Averages since the beginning of the month
4. Using the report from vmstat -s, as shown in the exhibit, which of the following indicates how the paging statistics can be improved?
vmstat -s11228009 total address trans. faults1791982 page ins419439 page outs221142 paging space page ins231045 paging space page outs
0 total reclaims3461761 zero filled pages faults10630 executable filled pages faults
3298154 pages examined by clock52 revolutions of the clock hand
1199652 pages freed by the clock
102 IBM Certification Study Guide AIX Performance and System Tuning
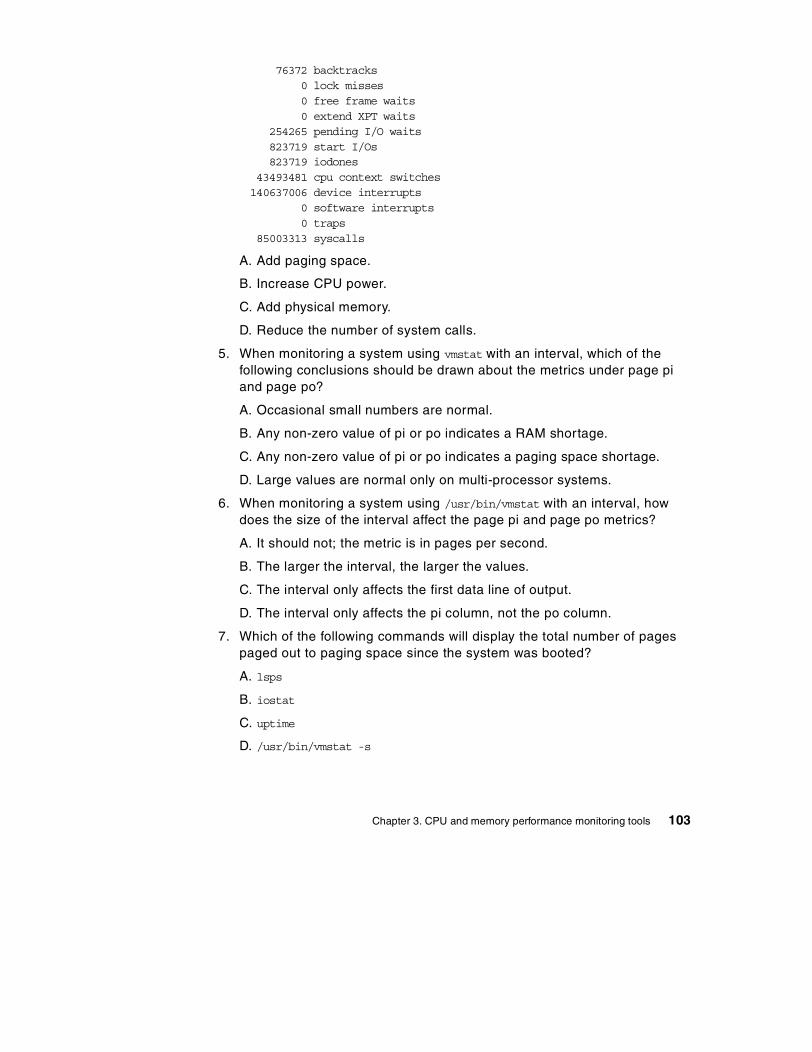
76372 backtracks0 lock misses0 free frame waits0 extend XPT waits
254265 pending I/O waits823719 start I/Os823719 iodones
43493481 cpu context switches140637006 device interrupts
0 software interrupts0 traps
85003313 syscalls
A. Add paging space.
B. Increase CPU power.
C. Add physical memory.
D. Reduce the number of system calls.
5. When monitoring a system using vmstat with an interval, which of the following conclusions should be drawn about the metrics under page pi and page po?
A. Occasional small numbers are normal.
B. Any non-zero value of pi or po indicates a RAM shortage.
C. Any non-zero value of pi or po indicates a paging space shortage.
D. Large values are normal only on multi-processor systems.
6. When monitoring a system using /usr/bin/vmstat with an interval, how does the size of the interval affect the page pi and page po metrics?
A. It should not; the metric is in pages per second.
B. The larger the interval, the larger the values.
C. The interval only affects the first data line of output.
D. The interval only affects the pi column, not the po column.
7. Which of the following commands will display the total number of pages paged out to paging space since the system was booted?
A. lsps
B. iostat
C. uptime
D. /usr/bin/vmstat -s
Chapter 3. CPU and memory performance monitoring tools 103
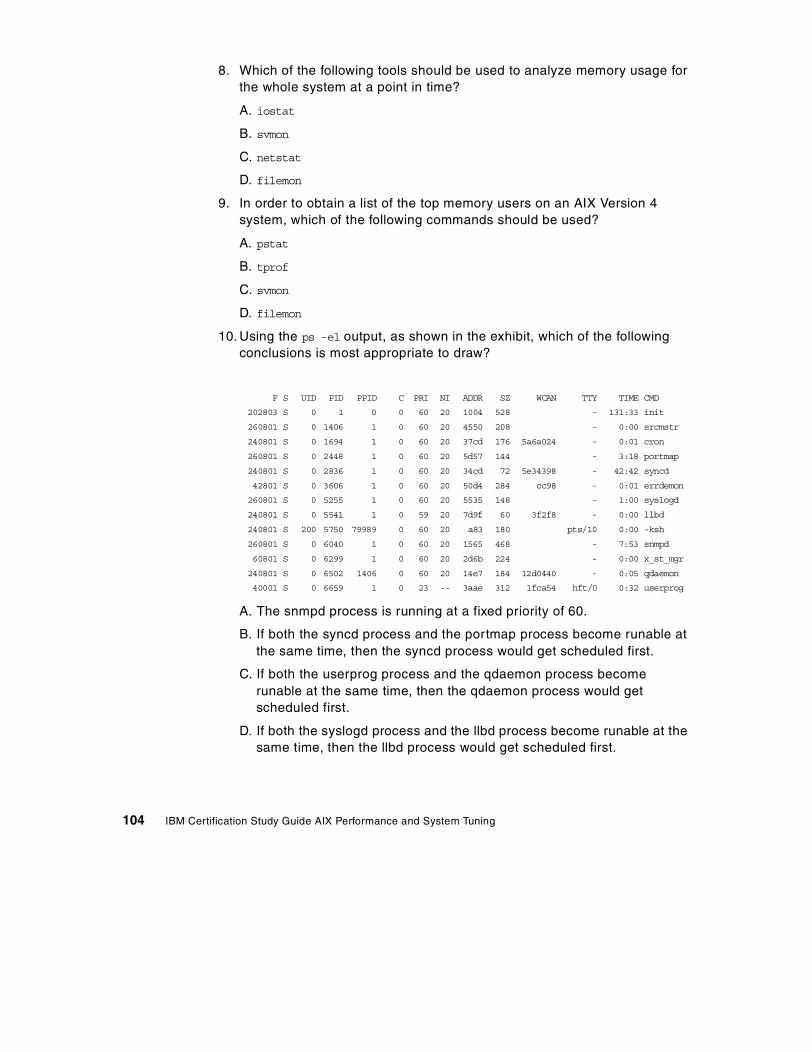
8. Which of the following tools should be used to analyze memory usage for the whole system at a point in time?
A. iostat
B. svmon
C. netstat
D. filemon
9. In order to obtain a list of the top memory users on an AIX Version 4 system, which of the following commands should be used?
A. pstat
B. tprof
C. svmon
D. filemon
10. Using the ps -el output, as shown in the exhibit, which of the following conclusions is most appropriate to draw?
A. The snmpd process is running at a fixed priority of 60.
B. If both the syncd process and the portmap process become runable at the same time, then the syncd process would get scheduled first.
C. If both the userprog process and the qdaemon process become runable at the same time, then the qdaemon process would get scheduled first.
D. If both the syslogd process and the llbd process become runable at the same time, then the llbd process would get scheduled first.
F S UID PID PPID C PRI NI ADDR SZ WCAN TTY TIME CMD
202803 S 0 1 0 0 60 20 1004 528 - 131:33 init
260801 S 0 1406 1 0 60 20 4550 208 - 0:00 srcmstr
240801 S 0 1694 1 0 60 20 37cd 176 5a6a024 - 0:01 cron
260801 S 0 2448 1 0 60 20 5d57 144 - 3:18 portmap
240801 S 0 2836 1 0 60 20 34cd 72 5e34398 - 42:42 syncd
42801 S 0 3606 1 0 60 20 50d4 284 cc98 - 0:01 errdemon
260801 S 0 5255 1 0 60 20 5535 148 - 1:00 syslogd
240801 S 0 5541 1 0 59 20 7d9f 60 3f2f8 - 0:00 llbd
240801 S 200 5750 79989 0 60 20 a83 180 pts/10 0:00 -ksh
260801 S 0 6040 1 0 60 20 1565 468 - 7:53 snmpd
60801 S 0 6299 1 0 60 20 2d6b 224 - 0:00 x_st_mgr
240801 S 0 6502 1406 0 60 20 14e7 184 12d0440 - 0:05 qdaemon
40001 S 0 6659 1 0 23 -- 3aae 312 1fca54 hft/0 0:32 userprog
104 IBM Certification Study Guide AIX Performance and System Tuning
11. Which of the following general operation techniques will best provide a measurable performance improvement of a system?
A. Attach SCSI devices in ID order.
B. Perform backups at regular intervals.
C. Perform regular preventative maintenance of devices with moving parts.
D. Reschedule the processing to balance the workload.
12. A developer tried to run a sar report and received the following error:
sar:0551-201 cannot open /usr/adm/sa/sa12
Which of the following procedures should be performed so that the developer can obtain sar reports?
A. Run bosboot -a -L
B. Edit inittab to collect data.
C. Edit crontab to start collecting data.
D. Run bosboot -ad /dev/ipldevice and then reboot.
13. After a migration from an older POWER server to a PowerPC-based server, users complain about decreased performance. Which of the following tools should be used to investigate the performance problem?
A. netstat
B. iostat
C. perfpmr
D. emstat
3.8.1 AnswersThe following are the preferred answers to the questions provided in this section.
1. C
2. B
3. A
4. C
5. A
6. A
Chapter 3. CPU and memory performance monitoring tools 105

7. D
8. B
9. C
10. D
11. D
12. C
13. D
3.9 Exercises
The following exercises provide sample topics for self study. They will help ensure comprehension of this chapter.
1. Describe how the sar command is set up to collect historical data.
2. Describe the differences between the sa1 and sa2 commands.
3. Describe how the crontab is modified to allow sar to collect data.
4. When running the vmstat command, there are either five or six measurement columns; describe all six and show the flag required for the sixth column.
5. Describe how a system could be described as CPU bound using the vmstat command. Also, what are the percentages for single and multi processor systems?
6. Name the seven types of reports the svmon command creates and a brief description of each.
7. Which svmon command flags are used to display a programs resource utilization?
8. Which svmon command flags are used to display a user resource utilization on the system?
106 IBM Certification Study Guide AIX Performance and System Tuning
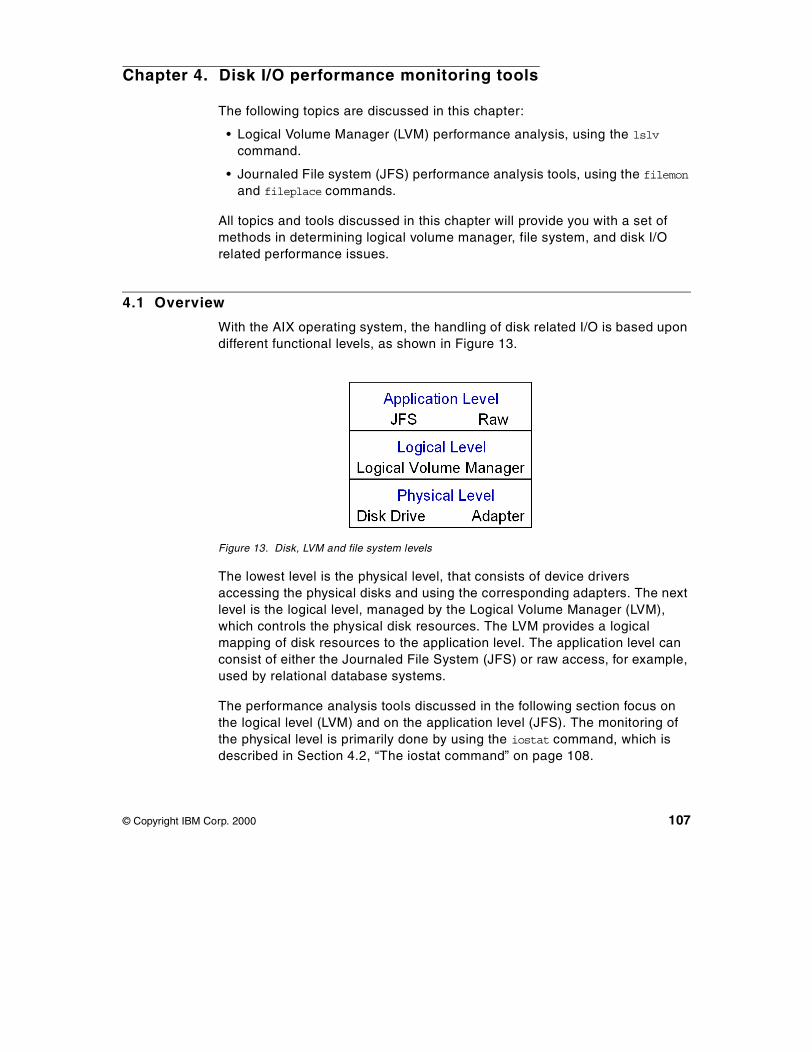
Chapter 4. Disk I/O performance monitoring tools
The following topics are discussed in this chapter:
• Logical Volume Manager (LVM) performance analysis, using the lslv command.
• Journaled File system (JFS) performance analysis tools, using the filemon and fileplace commands.
All topics and tools discussed in this chapter will provide you with a set of methods in determining logical volume manager, file system, and disk I/O related performance issues.
4.1 Overview
With the AIX operating system, the handling of disk related I/O is based upon different functional levels, as shown in Figure 13.
Figure 13. Disk, LVM and file system levels
The lowest level is the physical level, that consists of device drivers accessing the physical disks and using the corresponding adapters. The next level is the logical level, managed by the Logical Volume Manager (LVM), which controls the physical disk resources. The LVM provides a logical mapping of disk resources to the application level. The application level can consist of either the Journaled File System (JFS) or raw access, for example, used by relational database systems.
The performance analysis tools discussed in the following section focus on the logical level (LVM) and on the application level (JFS). The monitoring of the physical level is primarily done by using the iostat command, which is described in Section 4.2, “The iostat command” on page 108.
© Copyright IBM Corp. 2000 107
Covering the entire subject of the AIX Logical Volume Manager is beyond the scope of this publication. For more background information on the AIX Logical Volume Manager, refer to AIX Logical Volume Manager, from A to Z: Introduction and Concepts, SG24-5432, as well as the AIX Version 4.3 System Management Guide: Operating System and Devices, SC23-2525.
4.2 The iostat command
The iostat command is a useful tool that provides a first indication of I/O related performance problems. The iostat command is capable of reporting CPU statistics, terminal I/O statistics, and disk I/O statistics, that help identify the I/O load on individual components, such as hard disks.
The information from iostat reports can be used to modify system configurations to improve I/O load distribution between physical disks. The iostat command extracts data from AIX kernel I/O counters in the kernel address space, which are updated at every clock tick (1/100 second) for TTY as well as CPU and I/O subsystem activity.
The syntax of the iostat command is as follows:
iostat [-d | -t] [physicalVolume ...] [interval | count]
The commonly used flags are provided in Table 8.
Table 8. Commonly used flags of the iostat command
By using the physicalVolume parameter (by specifying the physical volume (PV) name of the individual disk or CD-ROM), iostat generates an I/O report only for the specified PVs. If no PVs are specified, the iostat command generates a report for all drives.
The interval parameter specifies the amount of time in seconds between each report. The count parameter specifies the number of I/O reports generated. If the interval parameter is specified without the count parameter, the iostat command generates reports continuously.
Flag Description
-d This flag displays only the disk utilization report. The -d flag is exclusive of the -t flag.
-t This flag displays only the TTY and CPU usage. The -t flag is exclusive of the -d flag.
108 IBM Certification Study Guide AIX Performance and System Tuning
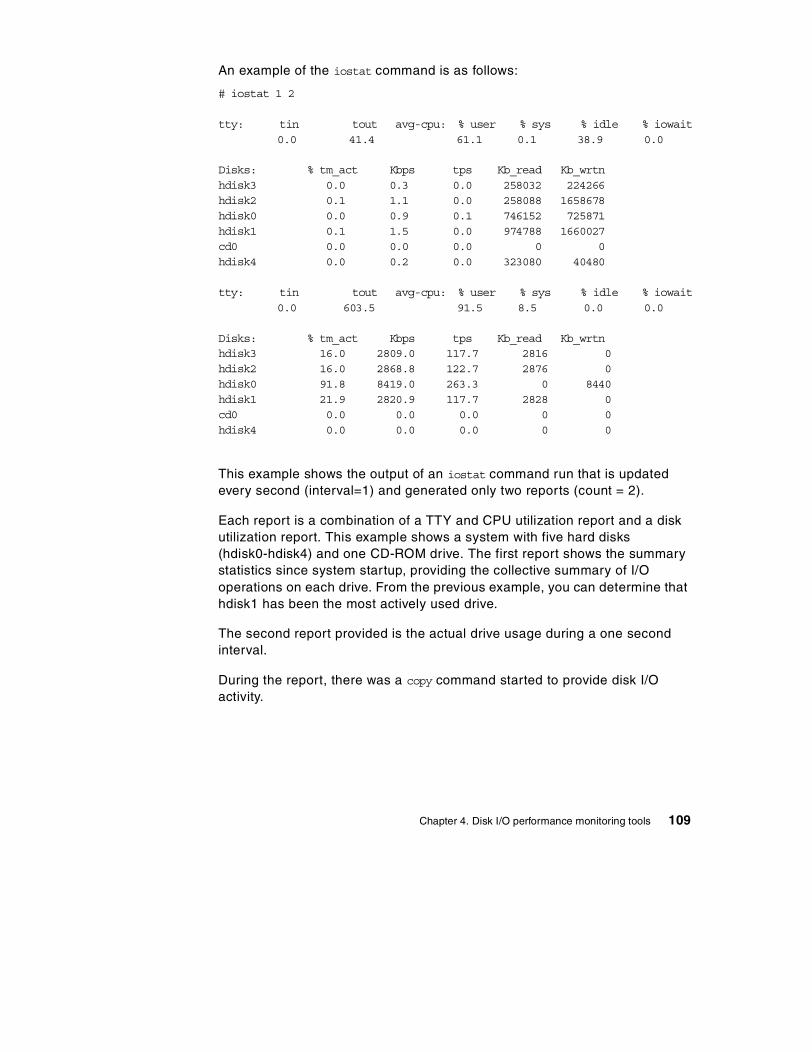
An example of the iostat command is as follows:
# iostat 1 2
tty: tin tout avg-cpu: % user % sys % idle % iowait0.0 41.4 61.1 0.1 38.9 0.0
Disks: % tm_act Kbps tps Kb_read Kb_wrtnhdisk3 0.0 0.3 0.0 258032 224266hdisk2 0.1 1.1 0.0 258088 1658678hdisk0 0.0 0.9 0.1 746152 725871hdisk1 0.1 1.5 0.0 974788 1660027cd0 0.0 0.0 0.0 0 0hdisk4 0.0 0.2 0.0 323080 40480
tty: tin tout avg-cpu: % user % sys % idle % iowait0.0 603.5 91.5 8.5 0.0 0.0
Disks: % tm_act Kbps tps Kb_read Kb_wrtnhdisk3 16.0 2809.0 117.7 2816 0hdisk2 16.0 2868.8 122.7 2876 0hdisk0 91.8 8419.0 263.3 0 8440hdisk1 21.9 2820.9 117.7 2828 0cd0 0.0 0.0 0.0 0 0hdisk4 0.0 0.0 0.0 0 0
This example shows the output of an iostat command run that is updated every second (interval=1) and generated only two reports (count = 2).
Each report is a combination of a TTY and CPU utilization report and a disk utilization report. This example shows a system with five hard disks (hdisk0-hdisk4) and one CD-ROM drive. The first report shows the summary statistics since system startup, providing the collective summary of I/O operations on each drive. From the previous example, you can determine that hdisk1 has been the most actively used drive.
The second report provided is the actual drive usage during a one second interval.
During the report, there was a copy command started to provide disk I/O activity.
Chapter 4. Disk I/O performance monitoring tools 109
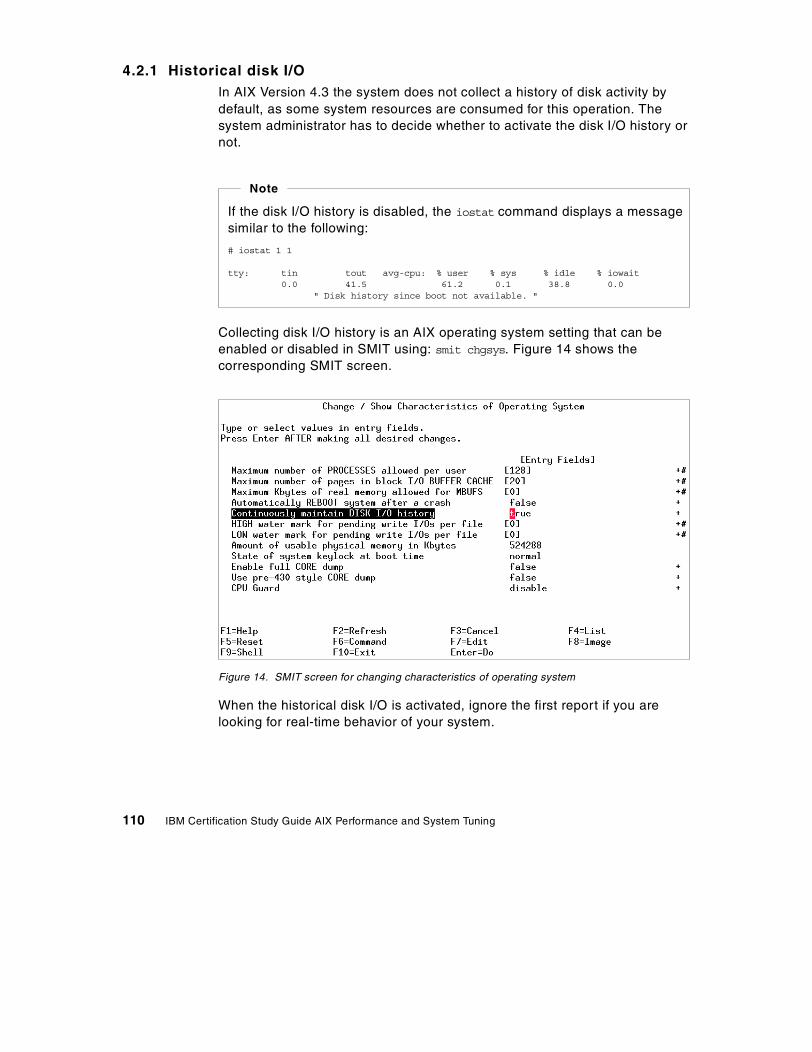
4.2.1 Historical disk I/OIn AIX Version 4.3 the system does not collect a history of disk activity by default, as some system resources are consumed for this operation. The system administrator has to decide whether to activate the disk I/O history or not.
Collecting disk I/O history is an AIX operating system setting that can be enabled or disabled in SMIT using: smit chgsys. Figure 14 shows the corresponding SMIT screen.
Figure 14. SMIT screen for changing characteristics of operating system
When the historical disk I/O is activated, ignore the first report if you are looking for real-time behavior of your system.
If the disk I/O history is disabled, the iostat command displays a message similar to the following:
# iostat 1 1
tty: tin tout avg-cpu: % user % sys % idle % iowait0.0 41.5 61.2 0.1 38.8 0.0
" Disk history since boot not available. "
Note
110 IBM Certification Study Guide AIX Performance and System Tuning
4.2.2 TTY and CPU utilization reportThe first report section displayed by the iostat command contains the TTY and CPU utilization report.
The following columns are displayed and their meanings provided:
tin Shows the total characters per second read by all TTY devices.
tout Indicates the total characters per second written to all TTY devices.
% user Shows the percentage of CPU utilization that occurred while executing at the user level (application).
% sys Shows the percentage of CPU utilization that occurred while executing at the system level (kernel).
% idle Shows the percentage of time that the CPU or CPUs were idle while the system did not have an outstanding disk I/O request.
% iowait Shows the percentage of time that the CPU or CPUs were idle during which the system had an outstanding disk I/O request.
The TTY information columns, tin and tout, show the number of characters read and written by all TTY devices. This includes both real and pseudo TTY devices. Real TTY devices are those connected to an asynchronous port, such as serial terminals, modems, FAX, and so on. Pseudo TTY devices are telnet sessions and xterm (or other X based terminal emulators, such as dtterm and aixterm).
Since the processing of character I/O consumes CPU resources, it is important to monitor the relation between increased TTY activity and CPU utilization. If such a relationship exists, the TTY devices, along with the applications using these TTY devices, should be analyzed. For example, a FAX application could be improved by enhancing the speed of the TTY port parameters so that a file transfer would become faster and more efficient. More information about TTY performance, especially when your system has multiport adapters (8-, 16-, or 64-port adapters) can be found in AIX Versions 3.2 and 4 Performance Tuning Guide, SC23-2365, in the chapter named Tuning Asynchronous Connections for High-Speed Transfers.
The CPU statistics columns, % user, % sys, % idle, and % iowait, provide information about the CPU usage. The same information is also reported in the vmstat command output in the columns us, sy, id, and wa.
In general, a high % iowait indicates that the system has a memory shortage, due to paging or an inefficient I/O subsystem configuration. Understanding
Chapter 4. Disk I/O performance monitoring tools 111
the I/O bottleneck and improving the efficiency of the I/O subsystem requires more data than iostat can provide.
When the iostat command report shows that a CPU-bound situation does not exist with a high % idle and a % iowait time greater than 25 percent, this might point to an I/O or disk-bound situation.
The following is an example extracted from an iostat command report:
...tty: tin tout avg-cpu: % user % sys % idle % iowait
0.0 223.5 0.2 4.2 70.0 25.5
Disks: % tm_act Kbps tps Kb_read Kb_wrtnhdisk3 2.7 163.2 20.4 1632 0hdisk2 2.8 170.8 21.9 1708 0hdisk0 0.0 0.0 0.0 0 0hdisk1 2.1 175.6 17.3 1756 0cd0 0.0 0.0 0.0 0 0hdisk4 99.1 715.6 125.0 0 7156
The preceding example shows a high % iowait due to an I/O bottleneck on hdisk4.
Depending on the actual system, a high % iowait time could also be caused by excessive paging, due to a lack of real memory. It could also be due to unbalanced disk load, fragmented data, or usage patterns.
For an unbalanced disk load, the same iostat report provides the necessary information. But for information about file systems or logical volumes (which are logical resources) you have to use an AIX-specific tool, such as filemon or fileplace. See Chapter 4, “Disk I/O performance monitoring tools” on page 107 for more information.
Alternatively, the iostat command can be used for determining that a performance problem is related to the CPU. Although vmstat should be the preferred tool for this analysis, in the absence of vmstat reports, iostat could be used. A good indication of a CPU bound problem is when % iowait time is zero and the system is not idle (% idle = 0).
To investigate if a system does not have a memory problem, verify that the physical volume that is used for swapping does not have an excessive load. Use the lsps -a command to determine the physical volume of the swap area.
112 IBM Certification Study Guide AIX Performance and System Tuning
4.2.3 The iostat command on SMP systemsThe calculation of I/O wait time on symmetrical multiprocessor (SMP) systems has been modified to provide a more accurate accounting of CPU utilization in commands such as vmstat and iostat.
Prior to AIX Version 4.3.3, the calculation of I/O wait time on SMP systems could result in inflated values (compared to uniprocessor (UP) systems). This was due to a statistical anomaly of the way AIX counted CPU time. The vmstat and iostat commands simply reported the CPU break down into the four categories of usr/sys/wio/idle as tabulated within the kernel. At each clock interrupt on each processor (100 times a second in AIX), a determination is made as to which of the four categories to place the last 10 ms of time. If the CPU is busy in user mode at the time of the clock interrupt, usr gets the clock tick added into its category. If the CPU is busy in kernel mode at the time of the clock interrupt, the sys category gets the tick. If the CPU is not busy, a check is made to see if any disk I/O is in progress. If any disk I/O is in progress, the wio category is incremented. If no disk I/O is in progress and the CPU is not busy, then the idle category gets the tick. Notice in the prior discussion that it does not matter which processor starts the I/O. This fact leads to higher wio times on SMP systems compared to UP systems in some situations.
Since AIX Version 4.3.3, the I/O wait time is no longer inflated; all CPUs are no longer attributed wait time when a disk is busy and the CPU is idle. The decision is based on whether a thread is awaiting an I/O on the CPU being measured. This method can report accurate wio times when just a few threads are doing I/O and the system is otherwise idle.
4.2.4 Disk utilization reportAny potential disk I/O performance problem should be analyzed with the iostat command first. To only report the disk I/O, use the iostat command -d flag. In addition, the disk statistics can be limited to the selected disks by listing the physical volume names.
The iostat disk utilization report displays the following columns:
Disks Shows the names of the physical volumes. They are either disk or CD-ROM, followed by a number. By default, all drives are displayed, unless the drives are specified in the command line.
% tm_act Indicates the percentage of time the physical disk was active. A drive is active during data transfer and command processing, such as seeking to a new location. An increase in the disk active time percentage implies a performance decrease and response
Chapter 4. Disk I/O performance monitoring tools 113
time increase. In general, when the utilization exceeds 40 percent, processes are waiting longer than necessary for I/O to complete, because most UNIX processes sleep while waiting for their I/O requests to complete.
Kbps Indicates the amount of data transferred (read or write) to the drive in KB per second. This is the sum of Kb_read plus Kb_wrtn, divided by the seconds in the reporting interval.
tps Indicates the number of transfers per second that were issued to the physical disk. A transfer is an I/O request at the device driver level to the physical disk. Multiple logical requests can be combined into a single I/O request to the disk. A transfer is of indeterminate size.
Kb_read Displays the total data (in KB) read from the physical volume during the measured interval.
Kb_wrtn Displays the amount of data (in KB) written to the physical volume during the measured interval.
When analyzing the drive utilization report and using the different data columns just described, it is important to notice the patterns and relationships between the data types.
There is normally a relationship between disk utilization %tm_act and data transfer rate tps. If the disk busy rate %tm_act is high, then the tps rate should also be high. However, if you get a high disk busy rate and a low disk transfer rate, you may have either a fragmented logical volume, file system, or individual file. Generally, you do need to be concerned about high disk busy when a disk is being used by a single AIX process (for example, a batch job). For example, if an application reads/writes sequentially, you should expect a high disk transfer rate (tps) and a high disk busy rate (%tm_act).
Kb_read and Kb_wrtn can confirm an understanding of an applications read/write behavior. However, they provide no information on the data access patterns.
An average physical volume utilization greater than 25 percent across all disks indicates an I/O bottleneck. The general conclusion on performance problems on disk, logical volume and file system is that the more drives you have on your system, the better the disk I/O performance.
However, there is a limit to the amount of data that can be handled by the SCSI adapter; hence, the SCSI adapter could become a bottleneck. Especially on RS/6000 systems with SCSI-1 and SCSI-2 adapters, this could
114 IBM Certification Study Guide AIX Performance and System Tuning
become an issue. To determine if a SCSI adapter is saturated, summarize all the KB/s values for disks located on the same adapter and compare the sum with the SCSI adapter throughput. In general, use 70 percent of the SCSI standard throughput rate. Examples of different SCSI types and their throughput is provided in the following:
• SCSI-1 throughput rate of 3.5 MB/s (70 percent of 5 MB/s)
• SCSI-2 throughput rate of 7 MB/s (70 percent of 10 MB/s)
• Ultra SCSI throughput rate of 28 MB/s (70 percent of 40 MB/s)
• Ultra2 SCSI throughput rate of 56 MB/s (70 percent of 80 MB/s)
If a saturated adapter is discovered, solve the problem by moving disks to other less used adapters already in the system or add an additional SCSI adapter.
For more information about improving disk I/O, refer to the AIX Versions 3.2 and 4 Performance Tuning Guide, SC23-2365, in the chapter named Monitoring and Tuning Disk I/O.
4.3 The lockstat command
The lockstat command displays lock-contention statistics on SMP systems.
The AIX kernel locks generated on the systems can be verified and possible contentions identified.
As with the vmstat command, iostat can only give a first indication about a performance bottleneck. The system administrator will have to use more in depth analysis tools such as filemon to identify the source of the slowdown. See also Chapter 4, “Disk I/O performance monitoring tools” on page 107 for more info.
Note
Before lockstat can be used, you must create, as root, a new boot image with the -L option to enable lock instrumentation:
# bosboot -a -d /dev/hdiskx -L
Where x is the number of the bootdisk.
Note
Chapter 4. Disk I/O performance monitoring tools 115
The lockstat command generates a report for each kernel lock that meets all specified conditions. When no conditions are specified, the default values are used.
The syntax of the lockstat command is as follows:
lockstat [ -a ] [ -c LockCount ] [ -b BlockRatio ] [ -n CheckCount ] [ -pLockRate ] [ -t MaxLocks ] [ Interval [ Count ] ]
The commonly used flags of the lockstat command are provided in Table 9.
Table 9. Commonly used flags of the lockstat command
If the lockstat command is executed with no options, an output similar to the following would be displayed.
# lockstatSubsys Name Ocn Ref/s %Ref %Block %Sleep-----------------------------------------------------------------PFS IRDWR_LOCK_CLASS 259 75356 37.49 9.44 0.21PROC PROC_INT_CLASS 1 12842 6.39 17.75 0.00
Flag Description
-c <LockCount> Specifies how many times a lock must be requested during an interval in order to be displayed. A lock request is a lock operation, which in some cases cannot be satisfied immediately. All lock requests are counted. The default is 200.
-b <BlockRatio> Specifies a block ratio. When a lock request is not satisfied, it is said to be blocked. A lock must have a block ratio that is higher than BlockRatio to appear in the list. The default of BlockRatio is 5 percent.
-n <CheckCount> Specifies the number of locks which are to be checked. The lockstat command sorts locks according to lock activity. This parameter determines how many of the most active locks will be subject to further checking. Limiting the number of locks that are checked maximizes system performance, particularly if lockstat is executed in intervals. The default value is 40.
-p <LockRate> Specifies a percentage of the activity of the most-requested lock in the kernel. Only locks that are more active than this will be listed. The default value is 2, which means that the only locks listed are those requested at least 2 percent as often as the most active lock.
-t <MaxLocks> Specifies the maximum number of locks to be displayed. The default is 10.
116 IBM Certification Study Guide AIX Performance and System Tuning
The lockstat command report contains the following data columns:
Subsys The subsystem to which the lock belongs.
Name The symbolic name of the lock class.
Ocn The occurrence number of the lock in its class.
Ref/s The reference rate, or number of lock requests per second.
%Ref The reference rate expressed as a percentage of all lock requests.
%Block The ratio of blocking lock requests to total lock requests. A block occurs whenever the lock cannot be taken immediately.
%Sleep The percentage of lock requests that cause the calling thread to sleep.
Some common subsystems are as follows:
PROC Scheduler, dispatcher, or interrupt handlers
VMM Pages, segment, and freelist
TCP Sockets, NFS
PFS Inodes, icache
The name of the lock class defined in AIX can be found in the file /usr/include/sys/lockname.h. Some common classes are:
TOD_LOCK_CLASS All interrupts that need the Time-of-Day (TOD) timer
PROC_INT_CLASS Interrupts for processes
U_TIMER_CLASS Per-process timer lock
The lockstat command can also be run in intervals similar to the iostat command, as shown in the following example:
# lockstat 10 100
The first number passed in the command line specifies the amount of time in seconds between each report. Each report contains statistics collected during the interval since the previous report. If no interval is specified, the system gives information covering an interval of one second and then exits. The second number determines the number of reports generated. It can only
Chapter 4. Disk I/O performance monitoring tools 117
be specified if an interval is given.
4.4 LVM performance analysis using lslv
There are various factors that affect logical volume (LV) performance; for example, the allocation position on the disk or the mirroring options. To obtain information about the logical volume, you can use the LVM lslv command, which provides information on:
LV attributes List of the current logical volume settings
LV allocation Placement map of the allocation of blocks on the disk
LV fragmentation Fragmentation of the LV blocks
4.4.1 Logical volume attributesUse the lslv command with no flags to view logical volume attributes, as shown in the following output:
# lslv mirrlvLOGICAL VOLUME: mirrlv VOLUME GROUP: stripevgLV IDENTIFIER: 000bc6fd1202118f.3 PERMISSION: read/writeVG STATE: active/complete LV STATE: closed/syncdTYPE: jfs WRITE VERIFY: onMAX LPs: 512 PP SIZE: 16 megabyte(s)COPIES: 2 SCHED POLICY: parallelLPs: 120 PPs: 240STALE PPs: 0 BB POLICY: relocatableINTER-POLICY: maximum RELOCATABLE: yesINTRA-POLICY: inner middle UPPER BOUND: 32MOUNT POINT: /u/mirrfs LABEL: NoneMIRROR WRITE CONSISTENCY: onEACH LP COPY ON A SEPARATE PV ?: yes
The previous example shows the LV attributes of a logical volume mirrlv, which is a mirrored logical volume located in the volume group stripevg.
The lockstat command can be CPU intensive because there is overhead involved with lock instrumentation. That is the reason why it is not turned on by default. The overhead of enabling lock instrumentation is typically 3 to 5 percent. Be aware that AIX trace buffers will fill up much quicker when using this option because there are a lot of locks being used.
Note
118 IBM Certification Study Guide AIX Performance and System Tuning
For performance issues, the following attributes have to be taken into account:
COPIES Indicates the number of physical copies. If copies equal 1, then the LV is un-mirrored. Values of 2 and 3 are used for mirrored LVs. The previous example has a copy value of 2.
INTER-POLICY The inter-physical volume allocation policy specifies which policy should be used for choosing physical devices to allocate the physical partitions of a logical volume.
INTRA-POLICY The intra-physical volume allocation policy specifies which strategy should be used for choosing physical partitions on a physical volume.
MIRROR WRITE CONSISTENCYThe mirror write consistency (MWC) ensures data consistency among mirrored copies of a logical volume during normal I/O processing. For every write to a logical volume, the LVM generates a write request to every mirrored copy. Mirror write consistency recovery should be performed for most mirrored logical volumes.
WRITE VERIFY Specifies whether to verify all writes to the logical volume with a follow-up read. This option enhances availability, but decreases performance.
SHED-POLICY Specifies one of the two types of scheduling policies used for logical volumes with multiple copies, sequential or parallel.
BB POLICY Specifies whether to use Bad Block Relocation, which redirects I/O requests from a bad disk block to a valid one.
RELOCATABLE Specifies whether to allow the relocation of the logical volume during volume group reorganization.
UPPER BOUND Specifies the maximum number of physical volumes for allocation.
Chapter 4. Disk I/O performance monitoring tools 119
4.4.1.1 MirroringTo enhance the availability of a logical volume, AIX supports data mirroring by providing multiple copies of the logical volumes on different disks.
When using mirroring, the write scheduling policies are:
Sequential The sequential write policy waits for the write operation to complete for the previous physical partition before starting the next write operation.
Parallel The parallel write policy starts the write operation for all the physical partitions of a logical partition at the same time. The write returns when the slowest write operation is completed.
The parallel write scheduling policy provides the best performance and is the preferred option when creating the mirrored LV.
In general, the following recommendations provides the highest LVM availability:
• Use three logical partition copies (mirror twice) and include at least three physical volumes.
• Write verify should be switched on.
• Inter disk policy should be set to minimum, which sets the mirroring copies equal to the number of physical volumes.
• Disk allocation policy should be set to strict, which establishes that no LP copies are on the same disk.
• The copies on the physical volumes should be attached to separate busses, adapters, and power supplies.
Providing the highest availability, however, can have a negative impact on LVM performance; therefore, some of the settings may need to be altered depending on your requirements.
4.4.1.2 Intra policyThe five LVM intra-allocation policies are: inner edge, inner middle, center, outer middle, outer edge. The corresponding intra disk positions allocation policies are illustrated in Figure 15 on page 121.
120 IBM Certification Study Guide AIX Performance and System Tuning
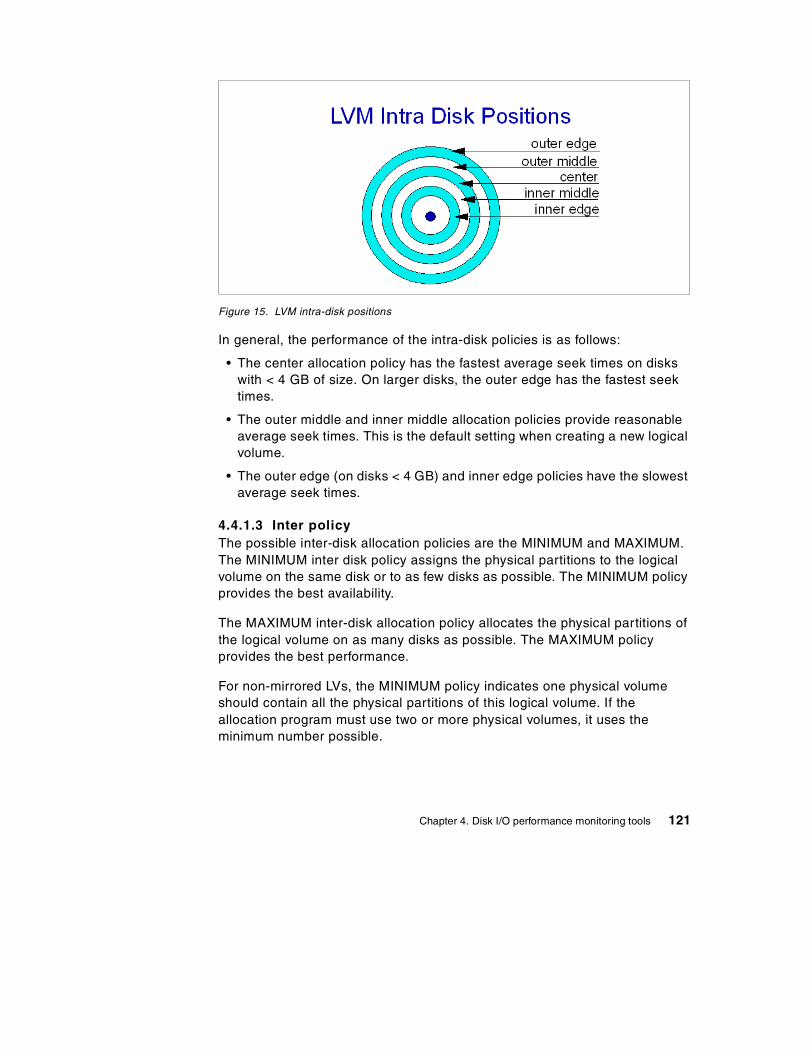
Figure 15. LVM intra-disk positions
In general, the performance of the intra-disk policies is as follows:
• The center allocation policy has the fastest average seek times on disks with < 4 GB of size. On larger disks, the outer edge has the fastest seek times.
• The outer middle and inner middle allocation policies provide reasonable average seek times. This is the default setting when creating a new logical volume.
• The outer edge (on disks < 4 GB) and inner edge policies have the slowest average seek times.
4.4.1.3 Inter policyThe possible inter-disk allocation policies are the MINIMUM and MAXIMUM. The MINIMUM inter disk policy assigns the physical partitions to the logical volume on the same disk or to as few disks as possible. The MINIMUM policy provides the best availability.
The MAXIMUM inter-disk allocation policy allocates the physical partitions of the logical volume on as many disks as possible. The MAXIMUM policy provides the best performance.
For non-mirrored LVs, the MINIMUM policy indicates one physical volume should contain all the physical partitions of this logical volume. If the allocation program must use two or more physical volumes, it uses the minimum number possible.
Chapter 4. Disk I/O performance monitoring tools 121
For mirrored LVs, the MINIMUM policy indicates that as many physical volumes as there are copies should be used. Otherwise, the minimum number of physical volumes possible are used to hold all the physical partitions.
4.4.1.4 StripingStriping is designed to increase the read/write performance of frequently accessed, large sequential files. When a striped LV is created, as many disks as possible should be used. Since AIX Version 4.3.3, mirroring of striped LVs is supported; therefore, the old conclusion that striping does not provide availability due to the lack of mirroring is no longer valid. For more information on this issue, see the AIX Version 4.3 Differences Guide, SG24-2014 (second edition).
When a striped logical volume is defined, then two additional LV attributes are displayed by the lslv command:
STRIPE WIDTH The number of stripes.
STRIPE SIZE The fixed size of each stripe block. Stripe size can be any power of 2 from 4 KB to 128 KB, but it is often set to 64 KB to get the highest levels of sequential I/O throughput.
4.4.2 Logical volume fragmentationTo check a logical volume for possible fragmentation, use the lslv flag -l, as shown in the following example:
# lslv -l mirrlvmirrlv:/u/mirrfsPV COPIES IN BAND DISTRIBUTIONhdisk2 120:000:000 90% 000:000:000:108:012hdisk1 120:000:000 69% 000:000:000:083:037
This example uses the same LV mirrlv as in the last section.
The PV column indicates that the physical volume uses two disks (hdisk1 and hdisk2).
The COPIES column indicates that the total number if logical partitions (LP) is 120, and since it is a mirrored LV, both disks have the same amount of physical partitions PPs allocated (240 in total).
The IN BAND column indicates the level of intra allocation policy as a percentage. If the LVM cannot meet the intra policy requirement, it chooses the best alternative. In the above example, the intra policy was inner middle,
122 IBM Certification Study Guide AIX Performance and System Tuning
but only 69 percent on hdisk1 and 90 percent on hdisk2 could follow this allocation request.
The DISTRIBUTION column shows how the physical partitions are allocated in each section of the intra policy, as shown in the following relationship:
(outer edge) : (outer middle) : (center) : (inner middle) : (inner edge)
In this example, hdisk1 has allocated 83 PPs on the requested inner middle and 37 on the outer edge. Disk hdisk2 allocates the intra policy request better, hence the higher IN BAND level.
4.4.3 Logical volume allocationTo see the logical volume allocation of placement on the physical volume, use the following command:
# lslv -p hdisk1 mirrlvhdisk1:mirrlv:/u/mirrfsFREE FREE FREE FREE FREE FREE FREE FREE FREE FREE 1-10FREE FREE FREE FREE FREE FREE FREE FREE FREE FREE 11-20FREE FREE FREE FREE FREE FREE FREE FREE FREE FREE 21-30FREE FREE FREE FREE FREE FREE FREE FREE FREE FREE 31-40FREE FREE FREE FREE FREE FREE FREE FREE FREE FREE 41-50FREE FREE FREE FREE FREE FREE FREE FREE FREE FREE 51-60FREE FREE FREE FREE FREE FREE FREE FREE FREE FREE 61-70FREE FREE FREE FREE FREE FREE FREE FREE FREE FREE 71-80FREE FREE FREE FREE FREE FREE FREE FREE FREE FREE 81-90FREE FREE FREE FREE FREE FREE FREE FREE FREE FREE 91-100FREE FREE FREE FREE FREE FREE FREE FREE USED 101-109
USED USED USED USED USED USED USED USED USED USED 110-119USED USED USED USED USED USED USED USED USED USED 120-129USED USED USED USED USED USED USED USED USED USED 130-139USED USED USED USED USED USED USED USED USED USED 140-149USED USED USED USED USED USED USED USED USED USED 150-159USED USED USED USED USED USED USED USED USED USED 160-169USED USED USED USED USED USED USED USED USED USED 170-179USED USED USED USED USED USED USED USED USED USED 180-189USED USED USED USED USED USED USED USED USED USED 190-199USED USED USED USED USED USED USED USED USED USED 200-209USED USED USED USED USED USED USED USED 210-217
USED USED USED USED USED USED USED USED USED USED 218-227USED USED USED USED USED USED USED USED USED USED 228-237USED USED USED USED USED USED FREE FREE FREE FREE 238-247FREE FREE FREE FREE FREE FREE FREE FREE FREE FREE 248-257FREE FREE FREE FREE FREE FREE FREE FREE FREE FREE 258-267FREE FREE FREE FREE FREE FREE FREE FREE FREE FREE 268-277FREE FREE FREE FREE FREE FREE FREE FREE FREE FREE 278-287FREE FREE FREE FREE FREE FREE FREE FREE FREE FREE 288-297FREE FREE FREE FREE FREE FREE FREE FREE FREE FREE 298-307FREE FREE FREE FREE FREE FREE FREE FREE FREE FREE 308-317FREE FREE FREE FREE FREE FREE FREE FREE 318-325
USED USED USED USED USED USED USED USED USED USED 326-335USED USED USED USED USED USED USED USED USED USED 336-345USED USED USED USED USED 0001 0002 0003 0004 0005 346-355
Chapter 4. Disk I/O performance monitoring tools 123
0006 0007 0008 0009 0010 0011 0012 0013 0014 0015 356-3650016 0017 0018 0019 0020 0021 0022 0023 0024 0025 366-3750026 0027 0028 0029 0030 0031 0032 0033 0034 0035 376-3850036 0037 0038 0039 0040 0041 0042 0043 0044 0045 386-3950046 0047 0048 0049 0050 0051 0052 0053 0054 0055 396-4050056 0057 0058 0059 0060 0061 0062 0063 0064 0065 406-4150066 0067 0068 0069 0070 0071 0072 0073 0074 0075 416-4250076 0077 0078 0079 0080 0081 0082 0083 426-433
0084 0085 0086 0087 0088 0089 0090 0091 0092 0093 434-4430094 0095 0096 0097 0098 0099 0100 0101 0102 0103 444-4530104 0105 0106 0107 0108 0109 0110 0111 0112 0113 454-4630114 0115 0116 0117 0118 0119 0120 FREE FREE FREE 464-473FREE FREE FREE FREE FREE FREE FREE FREE FREE FREE 474-483FREE FREE FREE FREE FREE FREE FREE FREE FREE FREE 484-493FREE FREE FREE FREE FREE FREE FREE FREE FREE FREE 494-503FREE FREE FREE FREE FREE FREE FREE FREE FREE FREE 504-513FREE FREE FREE FREE FREE FREE FREE FREE FREE FREE 514-523FREE FREE FREE FREE FREE FREE FREE FREE FREE FREE 524-533FREE FREE FREE FREE FREE FREE FREE FREE FREE 534-542
The output displays five sections which represent: outer edge, outer middle, center, inner middle, and inner edge.
Each physical partition is marked with either a number or a keyword, which are described in the following:
Number A number indicates the logical partition number of the LV.
USED This keyword indicates that the physical partition at this location is used by another logical volume.
FREE This keyword indicates that this physical partition is not used by any logical volume. Logical volume fragmentation occurs if logical partitions are not contiguous across the disk.
STALE Although not present in the previous example, the STALE keyword indicates a physical partition that cannot be used.
This example shows that the one copy of mirrlv located on hdisk1 is allocated contiguously. The logical partitions (LPs) from 01-83 are allocated in the inner middle section, while the LPs 84-120 are allocated in the inner edge section.
When logical volumes are deleted, the physical partitions are freed, and this enables the space for either new logical volumes or the possibility of reorganizing the logical volumes, so that the LV fragmentation is limited. The LVM command reorgvg can reorganize logical volumes so that they comply with the intra disk policies. By using reorgvg and providing both the volume group and the name of the logical volume, the highest priority is given to the listed volume group when performing the reorganization. During the reorganization, the volume group is locked and cannot be used.
124 IBM Certification Study Guide AIX Performance and System Tuning
4.4.4 Highest LVM performanceThe following general recommendations can be used for creating logical volumes with high performance demands. However, keep in mind that when a logical volume is tuned for better performance, the availability may be impacted.
• No mirroring, which means the number of copies equals one (1).
• If mirroring is required then:
- Write scheduling policy set to parallel.
- Allocation policy set to strict, which means each copy on separate physical volumes.
• Write verification set to no.
• Mirror write consistency (MWC) set to off.
• Intra policies:
- Center: for hot logical volumes
- Middle: for moderate logical volumes
- Edge: for cold logical volumes
• Inter disk allocation policy set to maximum, which mean that read/write operations are spread among physical volumes.
Additional performance improvement can be gained by creating a striped logical volume.
4.5 LVM and file system monitoring
To provide a more complete analysis of file system performance, AIX Version 4.3 provides a monitoring command, filemon. This provides information about a specific application or system I/O activity, assisting the problem determination process for performance tuning.
4.5.1 The filemon commandThe filemon command monitors and presents trace data on the following four levels of file system utilization:
Logical file system The monitored operations include all read, write, open, and lseek system calls, which may or may not result in actual physical I/O, depending on whether or not the files are already buffered in memory. I/O statistics are kept on a per-file basis.
Chapter 4. Disk I/O performance monitoring tools 125
Virtual memory system At this level, operations (that is, paging) between segments and their images on disk are monitored. I/O statistics are kept on a per-segment basis.
Logical volumes I/O statistics are kept on a per-logical-volume basis.
Physical volumes At this level, physical resource utilizations are obtained. I/O statistics are kept on a per-physical-volume basis.
4.5.1.1 Using the filemon commandThe filemon command is based on the AIX trace facility to monitor I/O activity during a certain time interval. Because of this, filemon can be run only by root and filemon can not be executed in parallel with other trace-based commands, such as tprof and netpmon.
Tracing is started implicitly by the filemon command, but the trace can be controlled by the normal trace utilities: trcstop, trcoff, and trcon.
When tracing is stopped with trcstop, filemon writes a report either to stdout or to a specified file.
To specify the levels of data collected on all the layers, or on specific layers, use the -O layer option. The default is to collect data on the VM, LVM, and physical layers. Both summary and detailed reports are both generated.
The following command sequence provides a simple example of filemon in action:
# filemon -o /tmp/filemonLF.out -O lf
Enter the "trcstop" command to complete filemon processing
# dd count=2048 if=/dev/zero of=/u/mirrfs/testMirrorFile2048+0 records in.2048+0 records out.# dd count=2048 of=/dev/null if=/u/mirrfs/testMirrorFile2048+0 records in.2048+0 records out.# trcstop
The filemon command will only collect data for those files opened after filemon was started, unless you specify the -u flag.
Note
126 IBM Certification Study Guide AIX Performance and System Tuning
[filemon: Reporting started][filemon: Reporting completed]
[filemon: 10.666 secs in measured interval]
# ls -l filemonLF.out-rw-r--r-- 1 root system 2627 Jul 07 12:51 filemonLF.out#
The filemon command is started with the flag -O, specifying that only the logical file system (lf) data to be monitored. This example uses two dd commands to write to a file and read from a file. The special devices /dev/zero and /dev/null are used to get clean read/write figures and make the reports more transparent. The output report of the filemon command in this example is placed in a dedicated file using the -o flag. The default is to write the report to the standard output.
4.5.2 Report analysisThe reports generated by filemon are dependent on the output level flag -O. The possible values for the output levels are:
lf Logical file levellv Logical volume levelpv Physical volume levelvm Virtual memory level
The default value of -O is all. However, if -O is specified without a level, then lv, pv, and vm are the default.
The following section explains the filemon output reports using the examples from Section 4.5.1, “The filemon command” on page 125.
4.5.2.1 Logical file-level reportThe logical file level report, as shown in the following example, provides two sections, the Most Active Files Report, for information on the active files during the trace, and the Detailed File Stats Report, for detailed statistics on the individual files.
# cat /tmp/filemonLF.outFri Jul 7 12:51:38 2000System: AIX server1 Node: 4 Machine: 000BC6FD4C00
Cpu utilization: 100.0%
Most Active Files------------------------------------------------------------------------#MBs #opns #rds #wrs file volume:inode
------------------------------------------------------------------------
Chapter 4. Disk I/O performance monitoring tools 127
2.0 2 2048 2048 testMirrorFile /dev/mirrlv:171.0 1 2048 0 zero1.0 1 0 2048 null0.0 3 6 0 ksh.cat /dev/hd2:230790.0 2 2 0 dd.cat /dev/hd2:229700.0 1 2 0 cmdtrace.cat /dev/hd2:22947
------------------------------------------------------------------------Detailed File Stats------------------------------------------------------------------------
FILE: /u/mirrfs/testMirrorFile volume: /dev/mirrlv inode: 17opens: 2total bytes xfrd: 2097152reads: 2048 (0 errs)read sizes (bytes): avg 512.0 min 512 max 512 sdev 0.0read times (msec): avg 0.003 min 0.000 max 0.084 sdev 0.005
writes: 2048 (0 errs)write sizes (bytes): avg 512.0 min 512 max 512 sdev 0.0write times (msec): avg 0.028 min 0.012 max 0.443 sdev 0.044
lseeks: 1FILE: /dev/zeroopens: 1total bytes xfrd: 1048576reads: 2048 (0 errs)read sizes (bytes): avg 512.0 min 512 max 512 sdev 0.0read times (msec): avg 0.007 min 0.006 max 0.076 sdev 0.003
FILE: /dev/nullopens: 1total bytes xfrd: 1048576writes: 2048 (0 errs)write sizes (bytes): avg 512.0 min 512 max 512 sdev 0.0write times (msec): avg 0.001 min 0.000 max 0.023 sdev 0.002
FILE: /usr/lib/nls/msg/en_US/ksh.cat volume: /dev/hd2 (/usr) inode: 23079opens: 3total bytes xfrd: 24576reads: 6 (0 errs)read sizes (bytes): avg 4096.0 min 4096 max 4096 sdev 0.0read times (msec): avg 0.033 min 0.000 max 0.085 sdev 0.036
lseeks: 15
FILE: /usr/lib/nls/msg/en_US/dd.cat volume: /dev/hd2 (/usr) inode: 22970opens: 2total bytes xfrd: 8192reads: 2 (0 errs)read sizes (bytes): avg 4096.0 min 4096 max 4096 sdev 0.0read times (msec): avg 4.380 min 0.000 max 8.760 sdev 4.380
lseeks: 10FILE: /usr/lib/nls/msg/en_US/cmdtrace.cat volume: /dev/hd2 (/usr) inode: 22947opens: 1total bytes xfrd: 8192reads: 2 (0 errs)read sizes (bytes): avg 4096.0 min 4096 max 4096 sdev 0.0read times (msec): avg 0.000 min 0.000 max 0.000 sdev 0.000
lseeks: 8
128 IBM Certification Study Guide AIX Performance and System Tuning
The Most Active Files Report contains summary information of the most frequently used files during the monitoring period, defined in the following list.
#MBS Total number of megabytes transferred to and from the file. The rows are sorted by this field, in decreasing order.
#opns Number of times the file was opened during the measurement period.
#rds Number of read system calls made against the file.
#wrs Number of write system calls made against the file.
file Name of the file (full path name is in the detailed report).
volume:inode Name of volume that contains the file, and the file's i-node number. This field can be used to associate a file with its corresponding persistent segment, shown in the virtual memory I/O reports. This field may be blank (for example, for temporary files created and deleted during execution).
The filemon example shows that the file testMirrorFile is the most active, with the 1 MB read and 1 MB write operations. Notice the read and write operations are made in 512 bytes units. This shows that the dd command used a 512 byte block size. The zero and null files do not have inodes because they are not connected to any file system, but are special device files.
From the filemon file-level report, it is very evident to see which files are generating the most I/O demand.
The Detailed File Stats Report provides information about every active file with the following details:
FILE Name of the file. The full path name is given, if possible.
volume Name of the logical volume/file system containing the file.
inode I-node number for the file within its file system.
opens Number of times the file was opened while monitored.
total bytes xfrd Total number of bytes read/written to/from the file.
reads Number of read calls against the file.
read sizes (bytes) The read transfer-size statistics (avg, min, max, and sdev), in bytes.
Chapter 4. Disk I/O performance monitoring tools 129
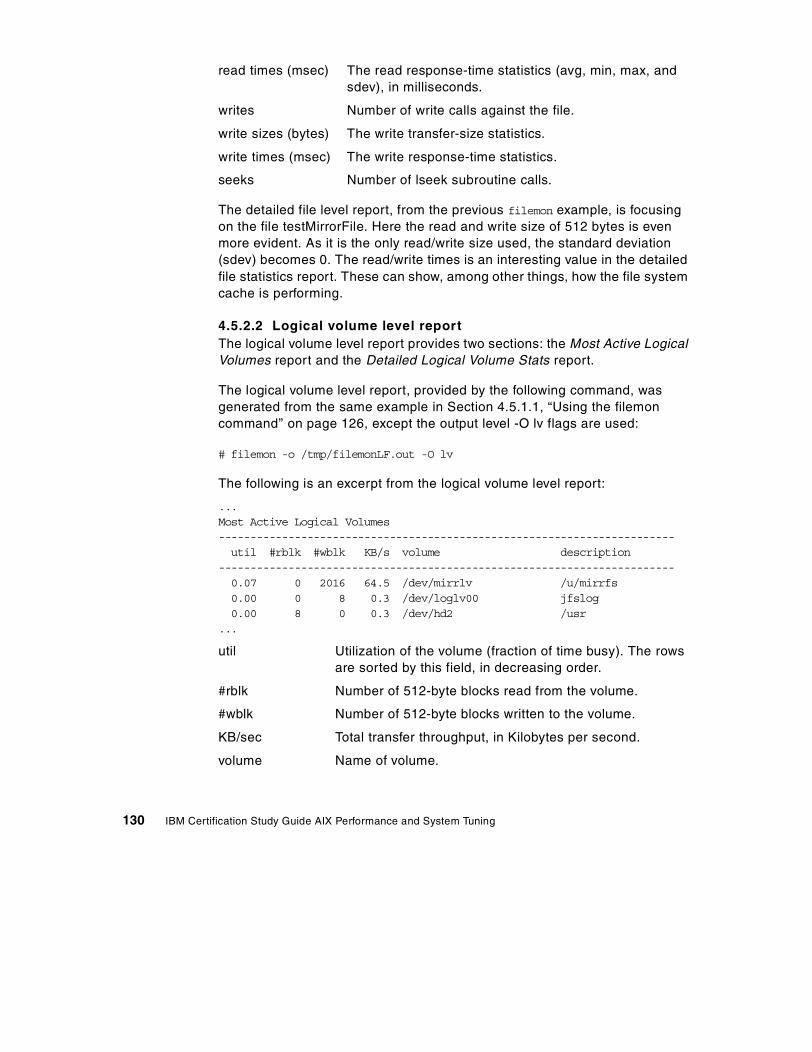
read times (msec) The read response-time statistics (avg, min, max, and sdev), in milliseconds.
writes Number of write calls against the file.
write sizes (bytes) The write transfer-size statistics.
write times (msec) The write response-time statistics.
seeks Number of lseek subroutine calls.
The detailed file level report, from the previous filemon example, is focusing on the file testMirrorFile. Here the read and write size of 512 bytes is even more evident. As it is the only read/write size used, the standard deviation (sdev) becomes 0. The read/write times is an interesting value in the detailed file statistics report. These can show, among other things, how the file system cache is performing.
4.5.2.2 Logical volume level reportThe logical volume level report provides two sections: the Most Active Logical Volumes report and the Detailed Logical Volume Stats report.
The logical volume level report, provided by the following command, was generated from the same example in Section 4.5.1.1, “Using the filemon command” on page 126, except the output level -O lv flags are used:
# filemon -o /tmp/filemonLF.out -O lv
The following is an excerpt from the logical volume level report:
...Most Active Logical Volumes------------------------------------------------------------------------util #rblk #wblk KB/s volume description
------------------------------------------------------------------------0.07 0 2016 64.5 /dev/mirrlv /u/mirrfs0.00 0 8 0.3 /dev/loglv00 jfslog0.00 8 0 0.3 /dev/hd2 /usr
...
util Utilization of the volume (fraction of time busy). The rows are sorted by this field, in decreasing order.
#rblk Number of 512-byte blocks read from the volume.
#wblk Number of 512-byte blocks written to the volume.
KB/sec Total transfer throughput, in Kilobytes per second.
volume Name of volume.
130 IBM Certification Study Guide AIX Performance and System Tuning
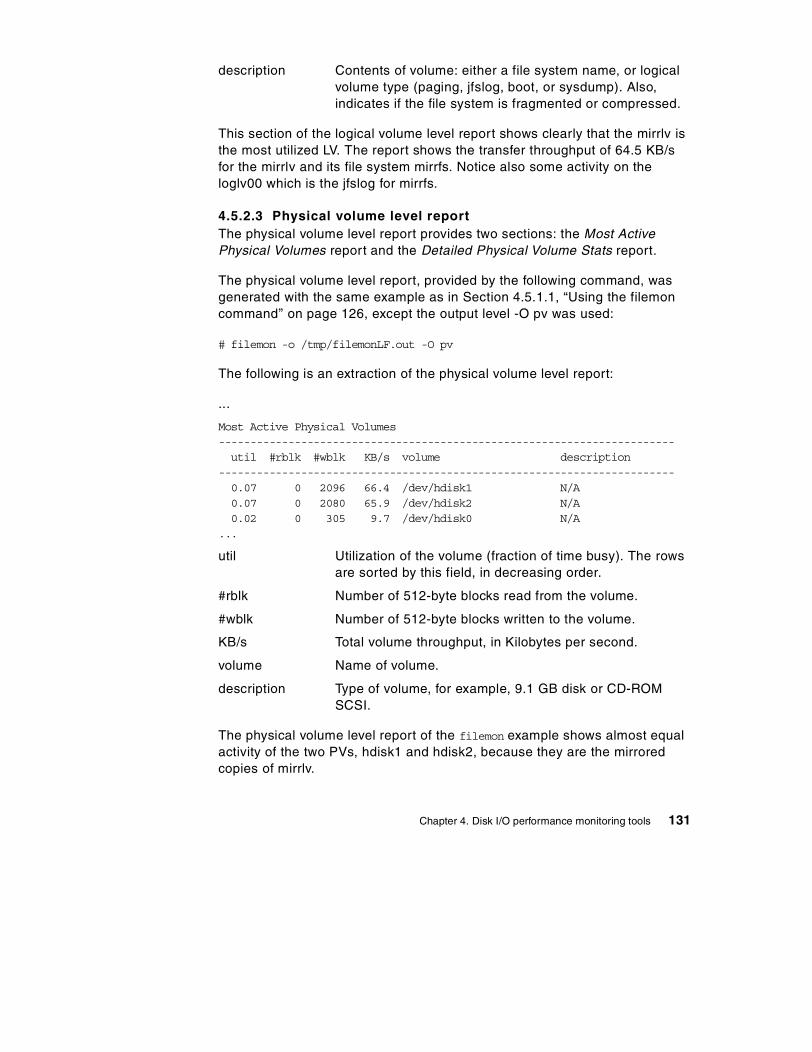
description Contents of volume: either a file system name, or logical volume type (paging, jfslog, boot, or sysdump). Also, indicates if the file system is fragmented or compressed.
This section of the logical volume level report shows clearly that the mirrlv is the most utilized LV. The report shows the transfer throughput of 64.5 KB/s for the mirrlv and its file system mirrfs. Notice also some activity on the loglv00 which is the jfslog for mirrfs.
4.5.2.3 Physical volume level reportThe physical volume level report provides two sections: the Most Active Physical Volumes report and the Detailed Physical Volume Stats report.
The physical volume level report, provided by the following command, was generated with the same example as in Section 4.5.1.1, “Using the filemon command” on page 126, except the output level -O pv was used:
# filemon -o /tmp/filemonLF.out -O pv
The following is an extraction of the physical volume level report:
...
Most Active Physical Volumes------------------------------------------------------------------------util #rblk #wblk KB/s volume description
------------------------------------------------------------------------0.07 0 2096 66.4 /dev/hdisk1 N/A0.07 0 2080 65.9 /dev/hdisk2 N/A0.02 0 305 9.7 /dev/hdisk0 N/A
...
util Utilization of the volume (fraction of time busy). The rows are sorted by this field, in decreasing order.
#rblk Number of 512-byte blocks read from the volume.
#wblk Number of 512-byte blocks written to the volume.
KB/s Total volume throughput, in Kilobytes per second.
volume Name of volume.
description Type of volume, for example, 9.1 GB disk or CD-ROM SCSI.
The physical volume level report of the filemon example shows almost equal activity of the two PVs, hdisk1 and hdisk2, because they are the mirrored copies of mirrlv.
Chapter 4. Disk I/O performance monitoring tools 131
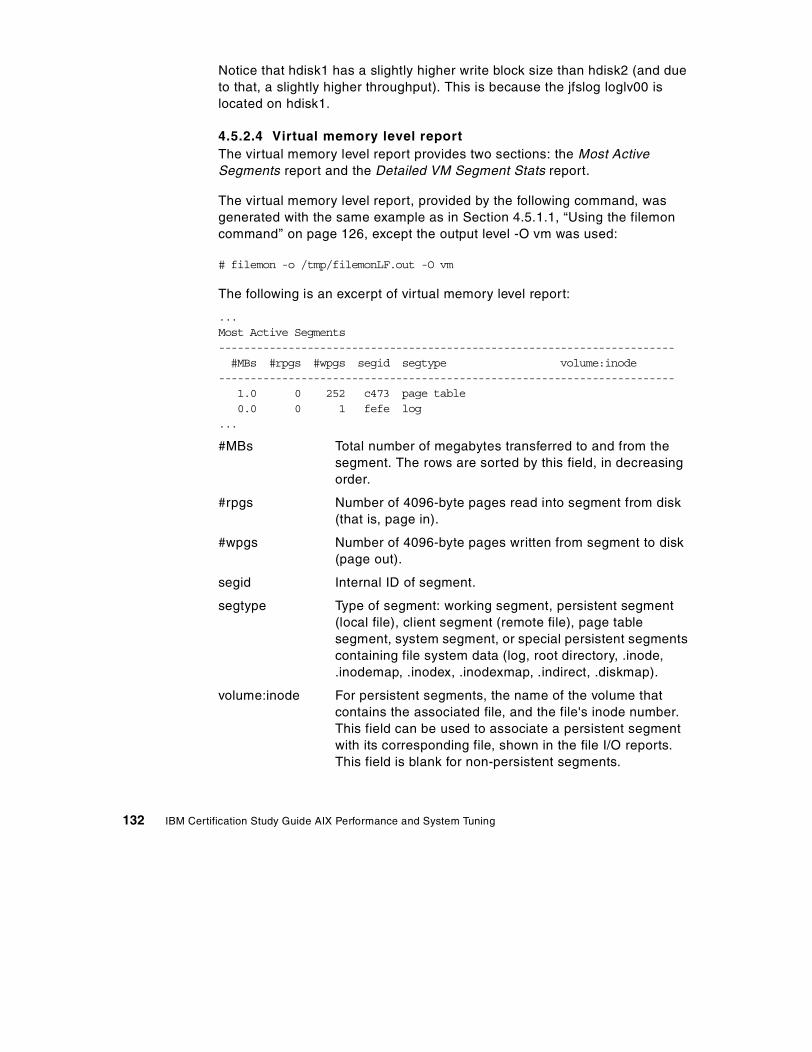
Notice that hdisk1 has a slightly higher write block size than hdisk2 (and due to that, a slightly higher throughput). This is because the jfslog loglv00 is located on hdisk1.
4.5.2.4 Virtual memory level reportThe virtual memory level report provides two sections: the Most Active Segments report and the Detailed VM Segment Stats report.
The virtual memory level report, provided by the following command, was generated with the same example as in Section 4.5.1.1, “Using the filemon command” on page 126, except the output level -O vm was used:
# filemon -o /tmp/filemonLF.out -O vm
The following is an excerpt of virtual memory level report:
...Most Active Segments------------------------------------------------------------------------#MBs #rpgs #wpgs segid segtype volume:inode
------------------------------------------------------------------------1.0 0 252 c473 page table0.0 0 1 fefe log
...
#MBs Total number of megabytes transferred to and from the segment. The rows are sorted by this field, in decreasing order.
#rpgs Number of 4096-byte pages read into segment from disk (that is, page in).
#wpgs Number of 4096-byte pages written from segment to disk (page out).
segid Internal ID of segment.
segtype Type of segment: working segment, persistent segment (local file), client segment (remote file), page table segment, system segment, or special persistent segments containing file system data (log, root directory, .inode, .inodemap, .inodex, .inodexmap, .indirect, .diskmap).
volume:inode For persistent segments, the name of the volume that contains the associated file, and the file's inode number. This field can be used to associate a persistent segment with its corresponding file, shown in the file I/O reports. This field is blank for non-persistent segments.
132 IBM Certification Study Guide AIX Performance and System Tuning
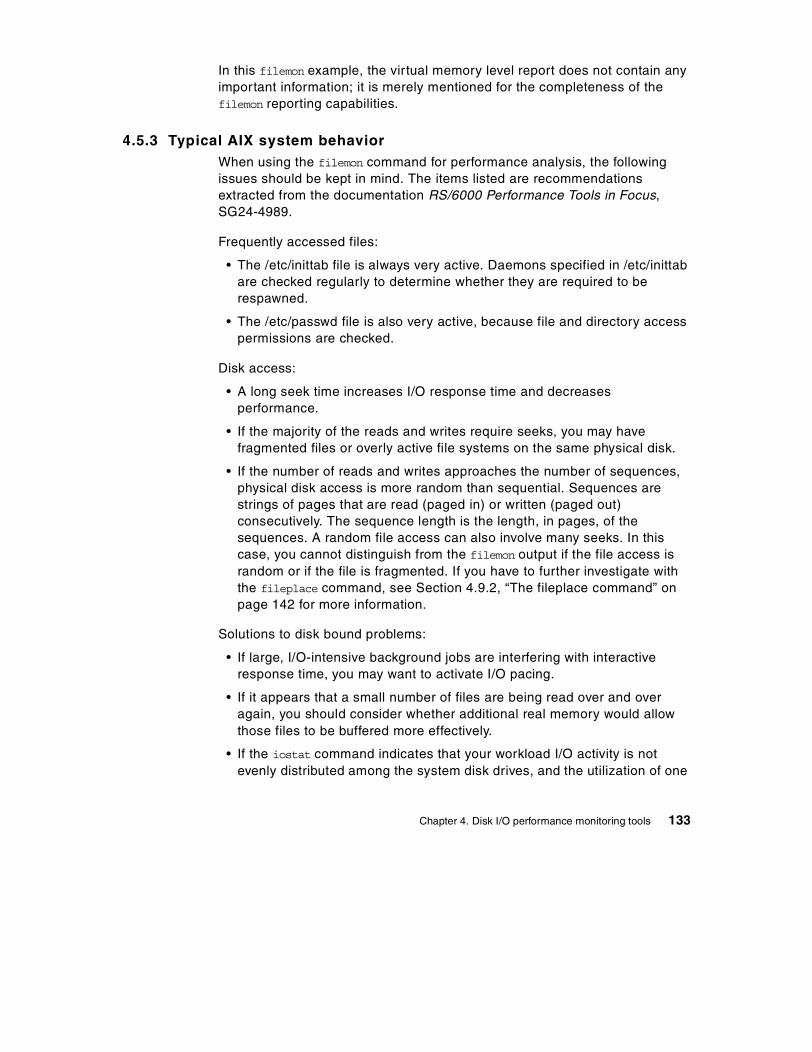
In this filemon example, the virtual memory level report does not contain any important information; it is merely mentioned for the completeness of the filemon reporting capabilities.
4.5.3 Typical AIX system behaviorWhen using the filemon command for performance analysis, the following issues should be kept in mind. The items listed are recommendations extracted from the documentation RS/6000 Performance Tools in Focus, SG24-4989.
Frequently accessed files:
• The /etc/inittab file is always very active. Daemons specified in /etc/inittab are checked regularly to determine whether they are required to be respawned.
• The /etc/passwd file is also very active, because file and directory access permissions are checked.
Disk access:
• A long seek time increases I/O response time and decreases performance.
• If the majority of the reads and writes require seeks, you may have fragmented files or overly active file systems on the same physical disk.
• If the number of reads and writes approaches the number of sequences, physical disk access is more random than sequential. Sequences are strings of pages that are read (paged in) or written (paged out) consecutively. The sequence length is the length, in pages, of the sequences. A random file access can also involve many seeks. In this case, you cannot distinguish from the filemon output if the file access is random or if the file is fragmented. If you have to further investigate with the fileplace command, see Section 4.9.2, “The fileplace command” on page 142 for more information.
Solutions to disk bound problems:
• If large, I/O-intensive background jobs are interfering with interactive response time, you may want to activate I/O pacing.
• If it appears that a small number of files are being read over and over again, you should consider whether additional real memory would allow those files to be buffered more effectively.
• If the iostat command indicates that your workload I/O activity is not evenly distributed among the system disk drives, and the utilization of one
Chapter 4. Disk I/O performance monitoring tools 133
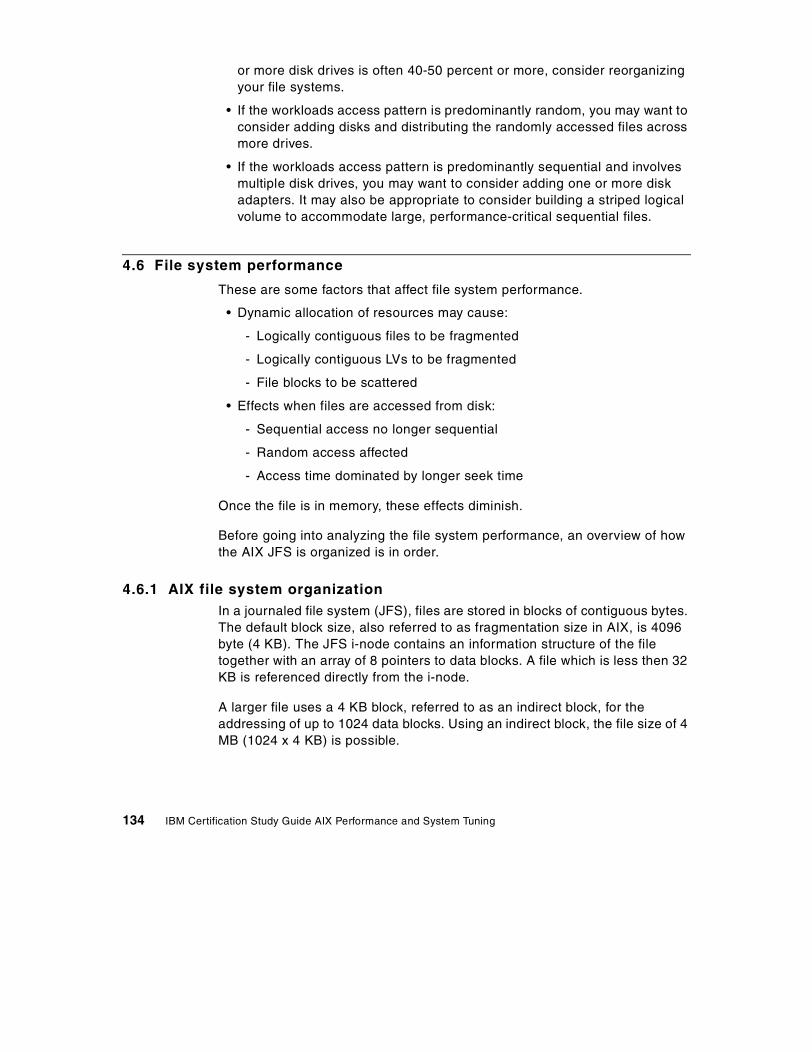
or more disk drives is often 40-50 percent or more, consider reorganizing your file systems.
• If the workloads access pattern is predominantly random, you may want to consider adding disks and distributing the randomly accessed files across more drives.
• If the workloads access pattern is predominantly sequential and involves multiple disk drives, you may want to consider adding one or more disk adapters. It may also be appropriate to consider building a striped logical volume to accommodate large, performance-critical sequential files.
4.6 File system performance
These are some factors that affect file system performance.
• Dynamic allocation of resources may cause:
- Logically contiguous files to be fragmented
- Logically contiguous LVs to be fragmented
- File blocks to be scattered
• Effects when files are accessed from disk:
- Sequential access no longer sequential
- Random access affected
- Access time dominated by longer seek time
Once the file is in memory, these effects diminish.
Before going into analyzing the file system performance, an overview of how the AIX JFS is organized is in order.
4.6.1 AIX file system organizationIn a journaled file system (JFS), files are stored in blocks of contiguous bytes. The default block size, also referred to as fragmentation size in AIX, is 4096 byte (4 KB). The JFS i-node contains an information structure of the file together with an array of 8 pointers to data blocks. A file which is less then 32 KB is referenced directly from the i-node.
A larger file uses a 4 KB block, referred to as an indirect block, for the addressing of up to 1024 data blocks. Using an indirect block, the file size of 4 MB (1024 x 4 KB) is possible.
134 IBM Certification Study Guide AIX Performance and System Tuning
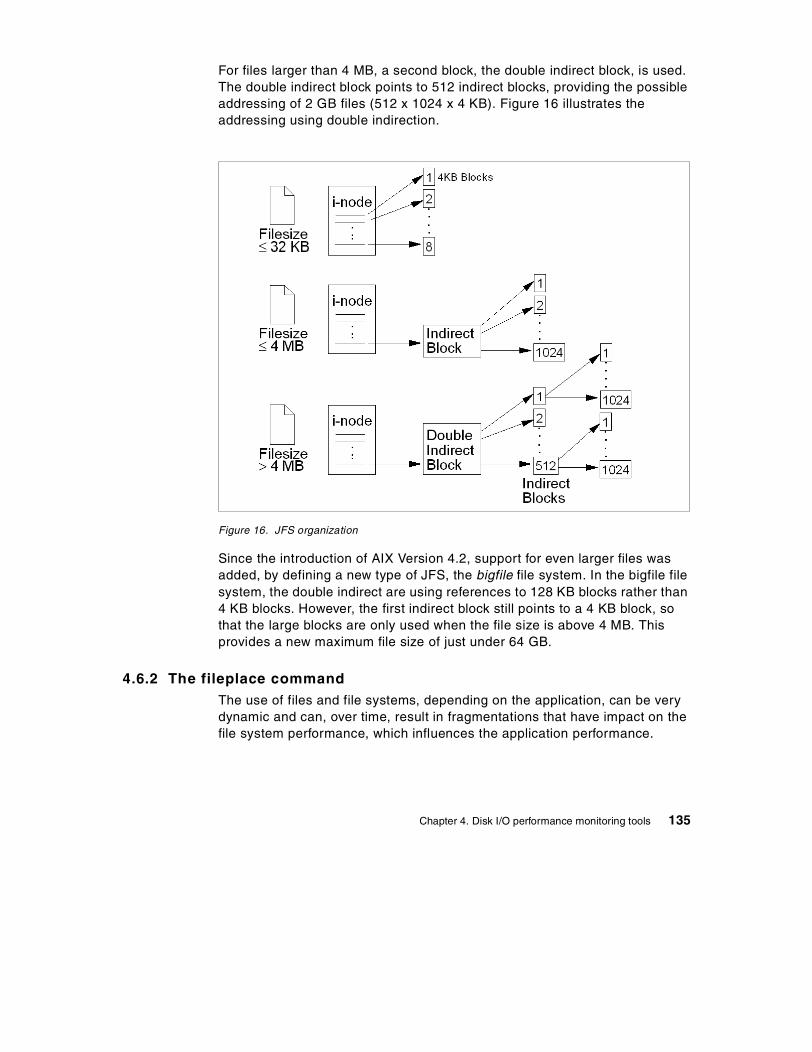
For files larger than 4 MB, a second block, the double indirect block, is used. The double indirect block points to 512 indirect blocks, providing the possible addressing of 2 GB files (512 x 1024 x 4 KB). Figure 16 illustrates the addressing using double indirection.
Figure 16. JFS organization
Since the introduction of AIX Version 4.2, support for even larger files was added, by defining a new type of JFS, the bigfile file system. In the bigfile file system, the double indirect are using references to 128 KB blocks rather than 4 KB blocks. However, the first indirect block still points to a 4 KB block, so that the large blocks are only used when the file size is above 4 MB. This provides a new maximum file size of just under 64 GB.
4.6.2 The fileplace commandThe use of files and file systems, depending on the application, can be very dynamic and can, over time, result in fragmentations that have impact on the file system performance, which influences the application performance.
Chapter 4. Disk I/O performance monitoring tools 135
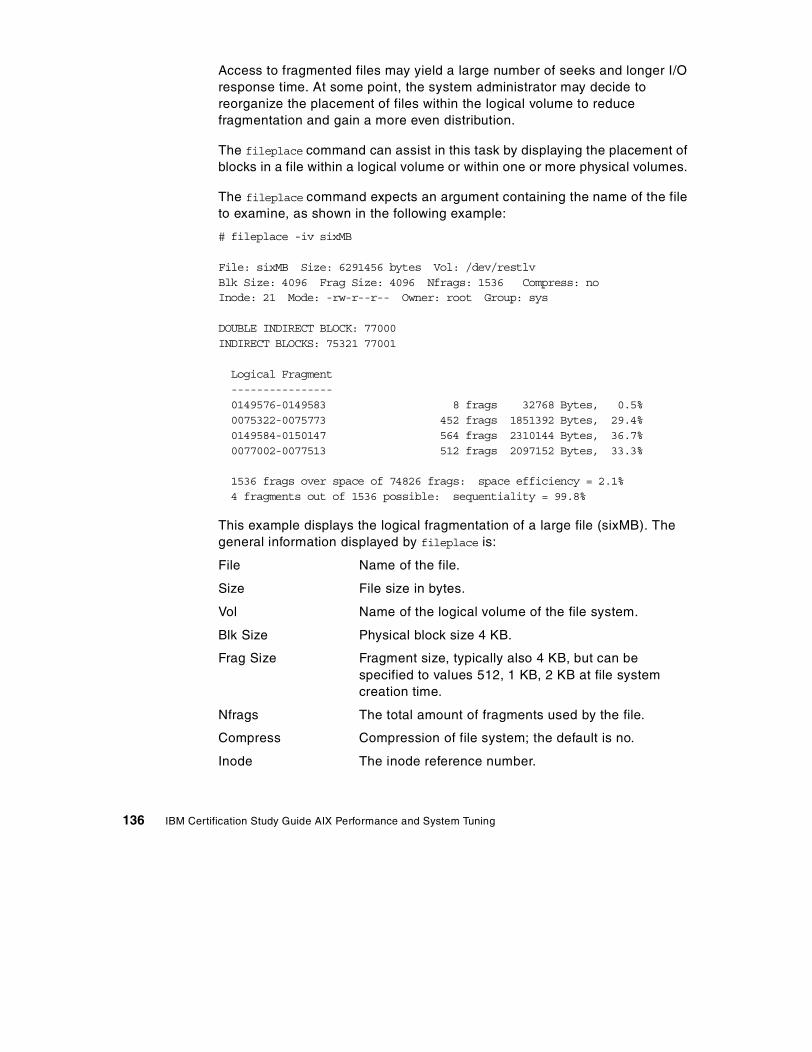
Access to fragmented files may yield a large number of seeks and longer I/O response time. At some point, the system administrator may decide to reorganize the placement of files within the logical volume to reduce fragmentation and gain a more even distribution.
The fileplace command can assist in this task by displaying the placement of blocks in a file within a logical volume or within one or more physical volumes.
The fileplace command expects an argument containing the name of the file to examine, as shown in the following example:
# fileplace -iv sixMB
File: sixMB Size: 6291456 bytes Vol: /dev/restlvBlk Size: 4096 Frag Size: 4096 Nfrags: 1536 Compress: noInode: 21 Mode: -rw-r--r-- Owner: root Group: sys
DOUBLE INDIRECT BLOCK: 77000INDIRECT BLOCKS: 75321 77001
Logical Fragment----------------0149576-0149583 8 frags 32768 Bytes, 0.5%0075322-0075773 452 frags 1851392 Bytes, 29.4%0149584-0150147 564 frags 2310144 Bytes, 36.7%0077002-0077513 512 frags 2097152 Bytes, 33.3%
1536 frags over space of 74826 frags: space efficiency = 2.1%4 fragments out of 1536 possible: sequentiality = 99.8%
This example displays the logical fragmentation of a large file (sixMB). The general information displayed by fileplace is:
File Name of the file.
Size File size in bytes.
Vol Name of the logical volume of the file system.
Blk Size Physical block size 4 KB.
Frag Size Fragment size, typically also 4 KB, but can be specified to values 512, 1 KB, 2 KB at file system creation time.
Nfrags The total amount of fragments used by the file.
Compress Compression of file system; the default is no.
Inode The inode reference number.
136 IBM Certification Study Guide AIX Performance and System Tuning
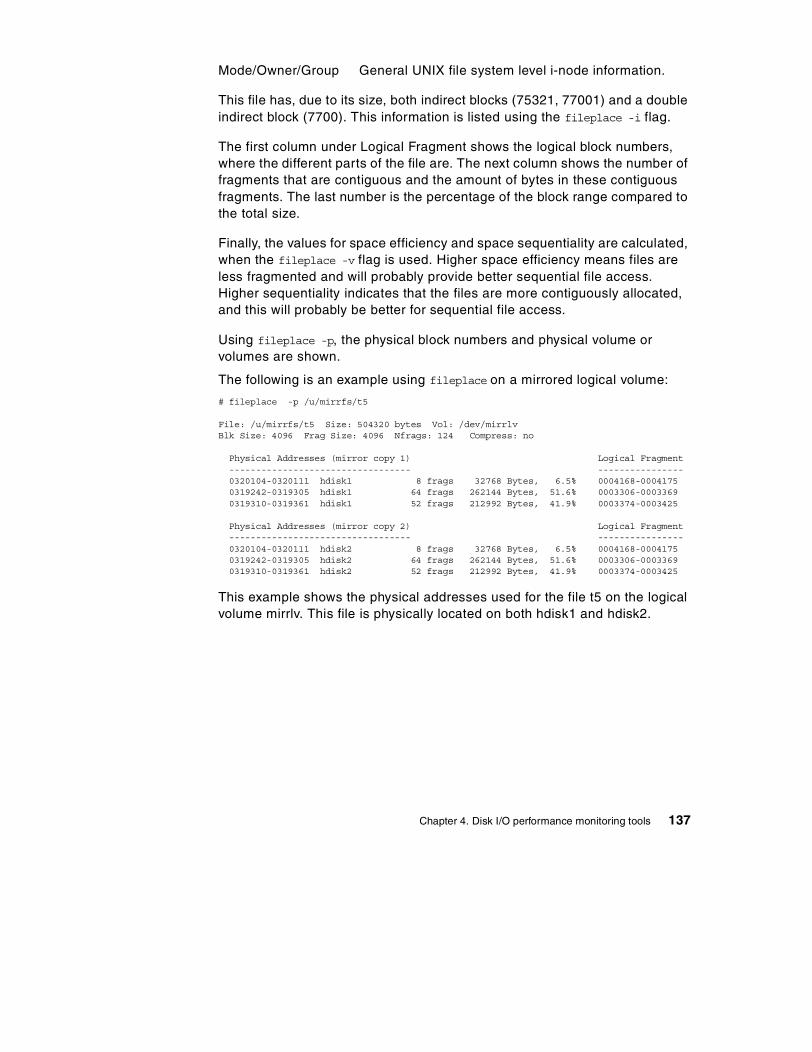
Mode/Owner/Group General UNIX file system level i-node information.
This file has, due to its size, both indirect blocks (75321, 77001) and a double indirect block (7700). This information is listed using the fileplace -i flag.
The first column under Logical Fragment shows the logical block numbers, where the different parts of the file are. The next column shows the number of fragments that are contiguous and the amount of bytes in these contiguous fragments. The last number is the percentage of the block range compared to the total size.
Finally, the values for space efficiency and space sequentiality are calculated, when the fileplace -v flag is used. Higher space efficiency means files are less fragmented and will probably provide better sequential file access. Higher sequentiality indicates that the files are more contiguously allocated, and this will probably be better for sequential file access.
Using fileplace -p, the physical block numbers and physical volume or volumes are shown.
The following is an example using fileplace on a mirrored logical volume:
# fileplace -p /u/mirrfs/t5
File: /u/mirrfs/t5 Size: 504320 bytes Vol: /dev/mirrlvBlk Size: 4096 Frag Size: 4096 Nfrags: 124 Compress: no
Physical Addresses (mirror copy 1) Logical Fragment---------------------------------- ----------------0320104-0320111 hdisk1 8 frags 32768 Bytes, 6.5% 0004168-00041750319242-0319305 hdisk1 64 frags 262144 Bytes, 51.6% 0003306-00033690319310-0319361 hdisk1 52 frags 212992 Bytes, 41.9% 0003374-0003425
Physical Addresses (mirror copy 2) Logical Fragment---------------------------------- ----------------0320104-0320111 hdisk2 8 frags 32768 Bytes, 6.5% 0004168-00041750319242-0319305 hdisk2 64 frags 262144 Bytes, 51.6% 0003306-00033690319310-0319361 hdisk2 52 frags 212992 Bytes, 41.9% 0003374-0003425
This example shows the physical addresses used for the file t5 on the logical volume mirrlv. This file is physically located on both hdisk1 and hdisk2.
Chapter 4. Disk I/O performance monitoring tools 137
4.6.3 File system de-fragmentationDuring the lifetime of a file system, a large number of files are created and deleted. This leaves, over time, a large number of gaps of free blocks. This fragmentation has a negative impact on the file system performance, as the newly created files become highly fragmented.
There is a simple way of organizing the free gaps in the file system. The defragfs command increases a file system's contiguous free space by reorganizing allocations to be contiguous rather than scattered across the disk. The defragfs command is intended for fragmented and compressed file systems. However, you can also use the defragfs command to increase contiguous free space in non fragmented file systems.
Another simple way of reorganizing the file system is to re-create the file system using a backup of the file system.
4.7 General recommendations on I/O performance
By using lslv, fileplace, filemon, and iostat, you can identify I/O, volume group, and logical volume problems. The following are general recommendations on how to achieve good LVM and file system performance and when to use the tools described in this chapter.
Logical volume organization for highest performance: • Allocate hot LVs to different PVs to reduce disk contention.
• Spread hot LVs across multiple PVs so that parallel access is possible.
• Place the hottest LVs in the center of PVs, the moderate LVs in the middle of PVs, and the coldest LVs on edges of PVs so that the hottest logical volumes have the fastest access time.
The fileplace command will not display NFS remote files. If a remote file is specified, the fileplace command returns an error message.
The fileplace command reads the file’s list of blocks directly from the logical volume on disk. If the file is newly created, extended, or truncated, the information may not be on disk yet. Use the sync command to flush the information to the logical volume.
Note
138 IBM Certification Study Guide AIX Performance and System Tuning
• Mirroring can improve performance for read-intensive applications but, as writes need to be performed several times, can impact the performance of other applications.
- If mirroring is needed, set the scheduling policy to parallel and the allocation policy to strict. Parallel scheduling policy will enable reading from the closest disk, and strict allocation policy allocates each copy on separate PVs.
• Make the LV contiguous to reduce access time.
• Set inter-policy to maximum. This will spread each logical volume across as many physical volumes as possible, allowing reads and writes to be shared among several physical volumes.
• Place frequently used logical volumes close together to reduce the seek time.
• Set write verify to no so that there is no follow-up read (similar to a parity check) performed following a write.
Logical volume striping: • Spread the logical volume across as many physical volumes as possible.
• Use as many adapters as possible for the physical volumes.
• Create a separate volume group for striped logical volumes.
Striping recommendations: • The stripe unit size should be equal to the max_coalesce, which is by
default 64 KB. The max_coalesce value is the largest request size (in terms of data transmitted) that the SCSI device driver will build.
• Use a minpghead value of 2: This will give the minimum number of pages where sequential read-ahead starts.
• Using a maxpgahead of 16 times, the number of disk drives causes the maximum pages to be read ahead to be done in units of the stripe size (64 KB) times the number of disk drives, resulting in the reading of one stripe unit from each disk for each read ahead. If possible, modify applications that use striped logical volumes to perform I/O in units of 64 KB.
• Limitations of striping
- Mirroring with striping prior to AIX Version 4.3.3 is not possible. On AIX 4.3.3, the mirroring of logical volume striping is possible using the superstrict physical allocation policy.
- Disk striping is mostly effective for sequential disk I/Os. With randomly accessed files, it is not as effective.
Chapter 4. Disk I/O performance monitoring tools 139
File system related performance issues: • Create an additional log logical volume to separate the log of the most
active file system from the default log. This will increase parallel resource usage.
An lslv usage scenario:
• Determine if hot file systems are better located on a physical drive or spread across multiple physical drives.
Some filemon usage scenarios:
• Determine if hot files are local or remote.
• Determine if paging space dominates disk utilization.
• Look for heavy physical volume utilization. Determine if the type of drive (SCSI-1, SCSI-2, tape, and so on) or SCSI adapter causing a bottleneck.
Some fileplace usage scenarios:
• Determine if the application performs a lot of synchronous (non-cached) file I/O.
• Look for file fragmentation. Determine if the hot files are heavily fragmented.
Paging space related disk performance issues: • Never add more than one paging space on the same physical volume.
• Reorganize or add paging space to several physical volumes.
4.8 Overhead of using performance tools
As in any performance measurement on a system, each measurement consumes some resources which is referred to as the overhead of the performance tools. The following information is from the AIX Performance Tuning Guide, Versions 3.2 and 4, SC23-2365:
lslv This command uses mainly CPU time.
filemon This command can consume some CPU power, use this tool with discretion, and analyze the system performance while taking into consideration the overhead involved in running the tool. In a CPU-saturated environment with a high disk-output rate, filemon slowed the writing program by about five percent.
140 IBM Certification Study Guide AIX Performance and System Tuning
fileplace Most variations of fileplace use fewer than 0.3 seconds of CPU time.
iostat The iostat command adds little overhead to the system. It uses about 20 milliseconds of CPU time for each report generated.
Note that the previous computing time measurements are from an RS/6000 Model 320.
4.9 Command summary
The following section provides a list of the key commands discussed in this chapter. For a complete reference of the following commands, consult the AIX product documentation.
4.9.1 The filemon commandThe filemon command monitors the performance of the file system, and reports the I/O activity on behalf of logical files, virtual memory segments, logical volumes, and physical volumes. The command has the following syntax:
filemon [ -d ] [ -i File ] [ -o File] [ -O Levels ] [ -P ] [ -T n] [ -u ][-v ]
The commonly used flags are provided in Table 10.
Table 10. Commonly used flags of the filemon command
Flag Description
-O Levels Monitors only the specified file system levels. Valid levelidentifiers are: lf (Logical file level), vm (Virtual memory level), lv (Logical volume level), pv (Physical volume level), all
all is a short for lf, vm, lv, pv
If no -O flag is specified, the vm, lv, and pv levels are implied by default.
-o File Name of the file where the output report is stored. If no flag is specified, the output is displayed on the standard output.
-u Reports on files that were opened prior to the start of the trace daemon. The process ID (PID) and the file descriptor (FD) are substituted for the file name.
Chapter 4. Disk I/O performance monitoring tools 141
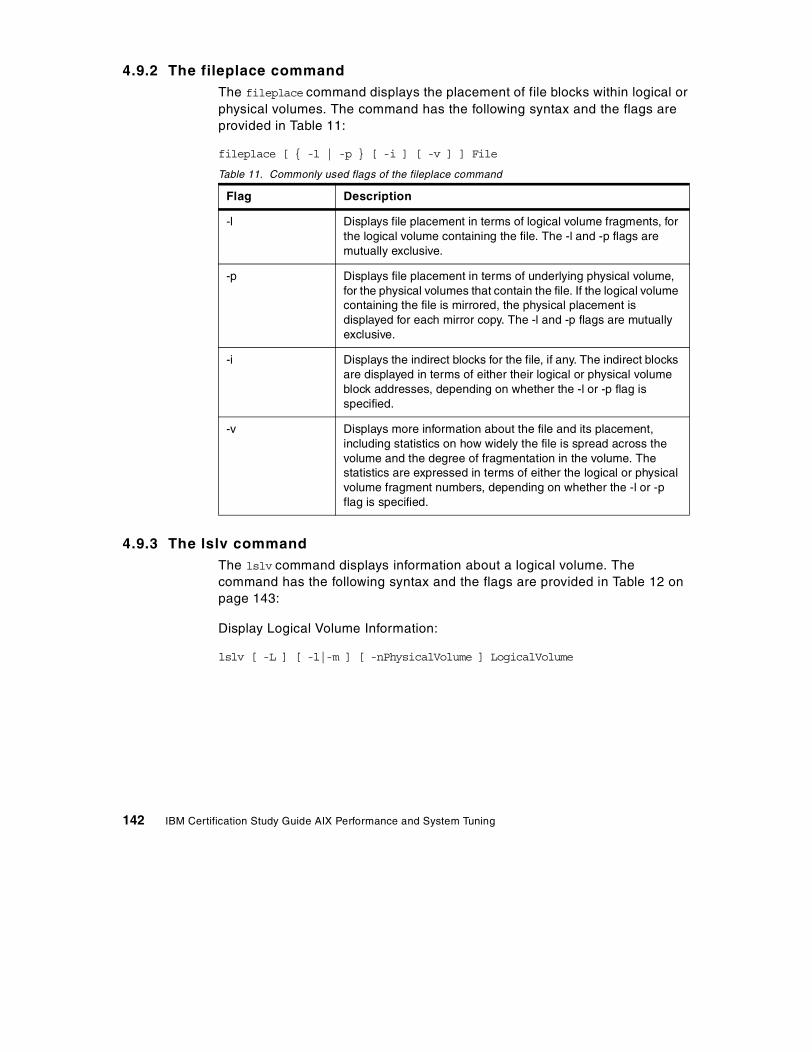
4.9.2 The fileplace commandThe fileplace command displays the placement of file blocks within logical or physical volumes. The command has the following syntax and the flags are provided in Table 11:
fileplace [ { -l | -p } [ -i ] [ -v ] ] File
Table 11. Commonly used flags of the fileplace command
4.9.3 The lslv commandThe lslv command displays information about a logical volume. The command has the following syntax and the flags are provided in Table 12 on page 143:
Display Logical Volume Information:
lslv [ -L ] [ -l|-m ] [ -nPhysicalVolume ] LogicalVolume
Flag Description
-l Displays file placement in terms of logical volume fragments, for the logical volume containing the file. The -l and -p flags are mutually exclusive.
-p Displays file placement in terms of underlying physical volume, for the physical volumes that contain the file. If the logical volume containing the file is mirrored, the physical placement is displayed for each mirror copy. The -l and -p flags are mutually exclusive.
-i Displays the indirect blocks for the file, if any. The indirect blocks are displayed in terms of either their logical or physical volume block addresses, depending on whether the -l or -p flag is specified.
-v Displays more information about the file and its placement, including statistics on how widely the file is spread across the volume and the degree of fragmentation in the volume. The statistics are expressed in terms of either the logical or physical volume fragment numbers, depending on whether the -l or -pflag is specified.
142 IBM Certification Study Guide AIX Performance and System Tuning
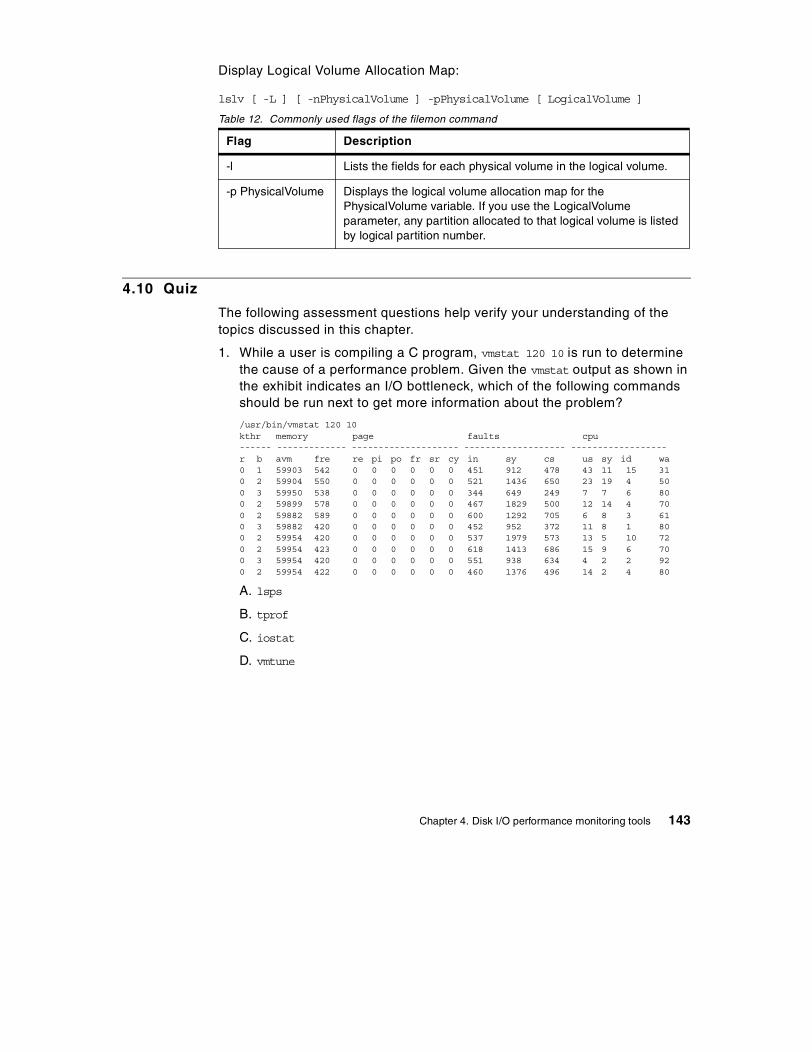
Display Logical Volume Allocation Map:
lslv [ -L ] [ -nPhysicalVolume ] -pPhysicalVolume [ LogicalVolume ]
Table 12. Commonly used flags of the filemon command
4.10 Quiz
The following assessment questions help verify your understanding of the topics discussed in this chapter.
1. While a user is compiling a C program, vmstat 120 10 is run to determine the cause of a performance problem. Given the vmstat output as shown in the exhibit indicates an I/O bottleneck, which of the following commands should be run next to get more information about the problem?
/usr/bin/vmstat 120 10kthr memory page faults cpu------ ------------- -------------------- ------------------- ------------------r b avm fre re pi po fr sr cy in sy cs us sy id wa0 1 59903 542 0 0 0 0 0 0 451 912 478 43 11 15 310 2 59904 550 0 0 0 0 0 0 521 1436 650 23 19 4 500 3 59950 538 0 0 0 0 0 0 344 649 249 7 7 6 800 2 59899 578 0 0 0 0 0 0 467 1829 500 12 14 4 700 2 59882 589 0 0 0 0 0 0 600 1292 705 6 8 3 610 3 59882 420 0 0 0 0 0 0 452 952 372 11 8 1 800 2 59954 420 0 0 0 0 0 0 537 1979 573 13 5 10 720 2 59954 423 0 0 0 0 0 0 618 1413 686 15 9 6 700 3 59954 420 0 0 0 0 0 0 551 938 634 4 2 2 920 2 59954 422 0 0 0 0 0 0 460 1376 496 14 2 4 80
A. lsps
B. tprof
C. iostat
D. vmtune
Flag Description
-l Lists the fields for each physical volume in the logical volume.
-p PhysicalVolume Displays the logical volume allocation map for the PhysicalVolume variable. If you use the LogicalVolume parameter, any partition allocated to that logical volume is listed by logical partition number.
Chapter 4. Disk I/O performance monitoring tools 143

2. Which of the following commands should be used to show the percentage of time that the CPU(s) are idle waiting for pending system I/Os to complete?
A. tprof
B. pstat
C. iostat
D. filemon
3. Which of the following commands should be used to monitor disk utilization during the time a system is experiencing an disk I/O performance problem?
A. pstat
B. iostat
C. vmstat
D. vmtune
4. Which of the following utilities should be used to determine which disk or set of disks is experiencing contention on a SCSI bus?
A. lspv
B. iostat
C. lsdev
D. vmstat
5. Which of the following metrics provided by the iostat report is used to initially determine if a system is I/O bound?
A. tin and tout
B. % user and % sys
C. % iowait and % tm_act
D. Kb_read and Kb_wrtn
6. If the filemon command is invoked, which of the following indicates how to stop the command so that the filemon reports can be generated?
A. Run trcstop
B. Run filemon -u
C. Perform a kill -15 on the filemon PID.
D. Perform a kill -SIGSTOP on the filemon PID.
144 IBM Certification Study Guide AIX Performance and System Tuning

7. Which of the following tools should be used to examine the details of a file’s indirect inode, assuming it uses indirect inodes?
A. df
B. istat
C. filemon
D. fileplace
8. Which of the following tools will report how much of a logical volume is following its intra-policy request?
A. df -k
B. lslv -l
C. lsvg -l
D. fileplace
9. Which of the following is TRUE of the fileplace command?
A. A file can be placed in a specific location.
B. The fragment distribution on a specified file is shown.
C. Fragmentation is removed by rearranging file fragments.
D. The distribution of all the files on a specified disk are shown.
10. Which of the following logical volume placement policies most likely provides the best performance for a logical volume which has Mirror Write Consistency Check turned on?
A. INTRA-POLICY set to 'edge'
B. INTRA-POLICY set to 'center'
C. INTRA-POLICY set to 'middle'
D. INTRA-POLICY set to 'inner middle'
Chapter 4. Disk I/O performance monitoring tools 145
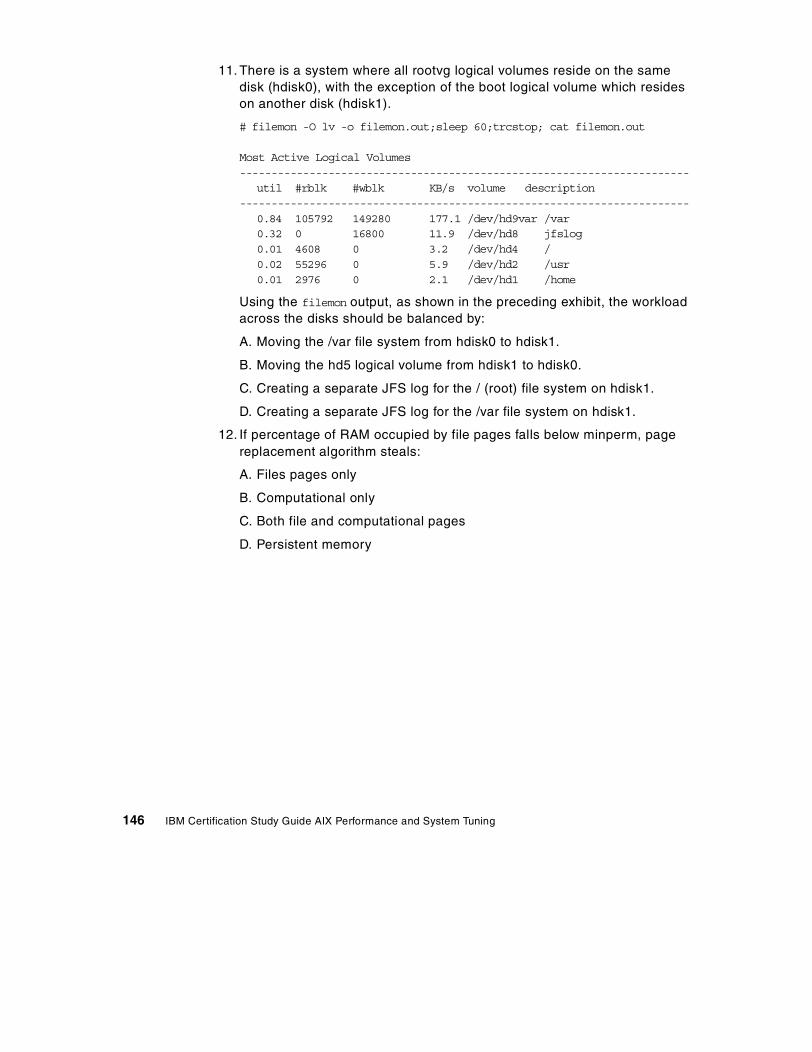
11. There is a system where all rootvg logical volumes reside on the same disk (hdisk0), with the exception of the boot logical volume which resides on another disk (hdisk1).
# filemon -O lv -o filemon.out;sleep 60;trcstop; cat filemon.out
Most Active Logical Volumes-----------------------------------------------------------------------
util #rblk #wblk KB/s volume description-----------------------------------------------------------------------
0.84 105792 149280 177.1 /dev/hd9var /var0.32 0 16800 11.9 /dev/hd8 jfslog0.01 4608 0 3.2 /dev/hd4 /0.02 55296 0 5.9 /dev/hd2 /usr0.01 2976 0 2.1 /dev/hd1 /home
Using the filemon output, as shown in the preceding exhibit, the workload across the disks should be balanced by:
A. Moving the /var file system from hdisk0 to hdisk1.
B. Moving the hd5 logical volume from hdisk1 to hdisk0.
C. Creating a separate JFS log for the / (root) file system on hdisk1.
D. Creating a separate JFS log for the /var file system on hdisk1.
12. If percentage of RAM occupied by file pages falls below minperm, page replacement algorithm steals:
A. Files pages only
B. Computational only
C. Both file and computational pages
D. Persistent memory
146 IBM Certification Study Guide AIX Performance and System Tuning
4.10.1 AnswersThe following are the preferred answers to the questions provided in this section.
1. C
2. C
3. B
4. B
5. C
6. A
7. D
8. B
9. B
10. A
11. A
12. C
4.11 Exercises
The following exercises provide sample topics for self study. They will help ensure comprehension of this chapter.
1. On a test system, with preferably two spare disks, create a testvg volume group. Create test logical volumes with the different parameters discussed in this chapter: mirrored LV, intra disk policy, inter disk policy, strict policy, striping.
2. Use the lslv command on the LVs created above and verify LV attributes, LV fragmentation and LV allocation.
3. Perform a filemon trace on your test system using the following command sequence:
# filemon -u -O lf,lv,pv -o /tmp/filemon.out ; sleep 30; tracestop
Identify the most active files, logical volume, and disk drive.
4. On an existing file system, create a large file. Verify its fragmentation as well as space efficiency and sequence with the fileplace command.
Chapter 4. Disk I/O performance monitoring tools 147

148 IBM Certification Study Guide AIX Performance and System Tuning
Chapter 5. Network performance tools
The following topics are discussed in this chapter:
• Network performance problems overview
• Network monitoring tools
• Network tuning tools
This chapter looks at network performance problems. It describes network examination and problem solving procedures.
5.1 Overview
The recommended network performance tools to use first are the ping and the netstat commands. Usually, they provide you with enough information to discover your problems; if not, this chapter provides you with more insight into the network performance topic.
To understand the performance characteristics of the network subsystem in AIX, you must first understand some of the underlying architecture. Figure 17 on page 151 shows the path of data from an application on one system to another application on a remote system. The following discussion matches the diagram:
• As an application writes to a socket, the data is copied from the user space into the socket send buffer in the kernel space. Depending on the amount of data being copied into the socket send buffer, the socket puts the data into either mbufs or clusters. The size of the buffers in virtual memory that are used by the input is limited by the values:
- udp_sendspace
- tcp_sendspace
• Once the data is copied into the socket send buffer, the socket layer calls the transport layer (either TCP or UDP), passing it a pointer to the linked list of mbufs (an mbuf chain).
• If the size of the data is larger than the maximum transfer unit (MTU) of the LAN, one of the following conditions are generally taken:
- TCP breaks the output into segments that comply with the MTU limit.
- UDP leaves the breaking up of the output to the IP layer.
© Copyright IBM Corp. 2000 149
• If IP receives a packet larger than the MTU of the interface, it fragments the packet and sends the fragments to the receiving system, which reassembles them into the original packet.
• When the interface layer receives a packet from IP, it attaches the link-layer header information to the beginning of the packet and calls the device driver write routine.
• At the device-driver layer, the mbuf chain containing the packet is enqueued on the transmit queue. The maximum total number of output buffers that can be queued is controlled by the system parameter tx_que_size.
• Arriving packets are placed on the device driver's receive queue, and pass through the Interface layer to IP. The maximum total number of input buffers that can be queued is controlled by the system parameter rx_que_size.
• If IP in the receiving system determines that IP in the sending system had fragmented a block of data, it coalesces the fragments into their original form and passes the data to TCP or UDP. If one of the fragments is lost in transmission, the incomplete packet is ultimately discarded by the receiver. The length of time IP waits for a missing fragment is controlled by the ipfragttl parameter.
- TCP reassembles the original segments and places the input in the socket receive buffer.
- UDP simply passes the input on to the socket receive buffer.
The maximum size of IP's queue of packets received from the network interface is controlled by the ipqmaxlen parameter, which is set and displayed with the no command. If the size of the input queue reaches this number, subsequent packets are dropped.
• When the application makes a read request, the appropriate data is copied from the socket receive buffer in kernel memory into the buffer in the application's working segment.
150 IBM Certification Study Guide AIX Performance and System Tuning
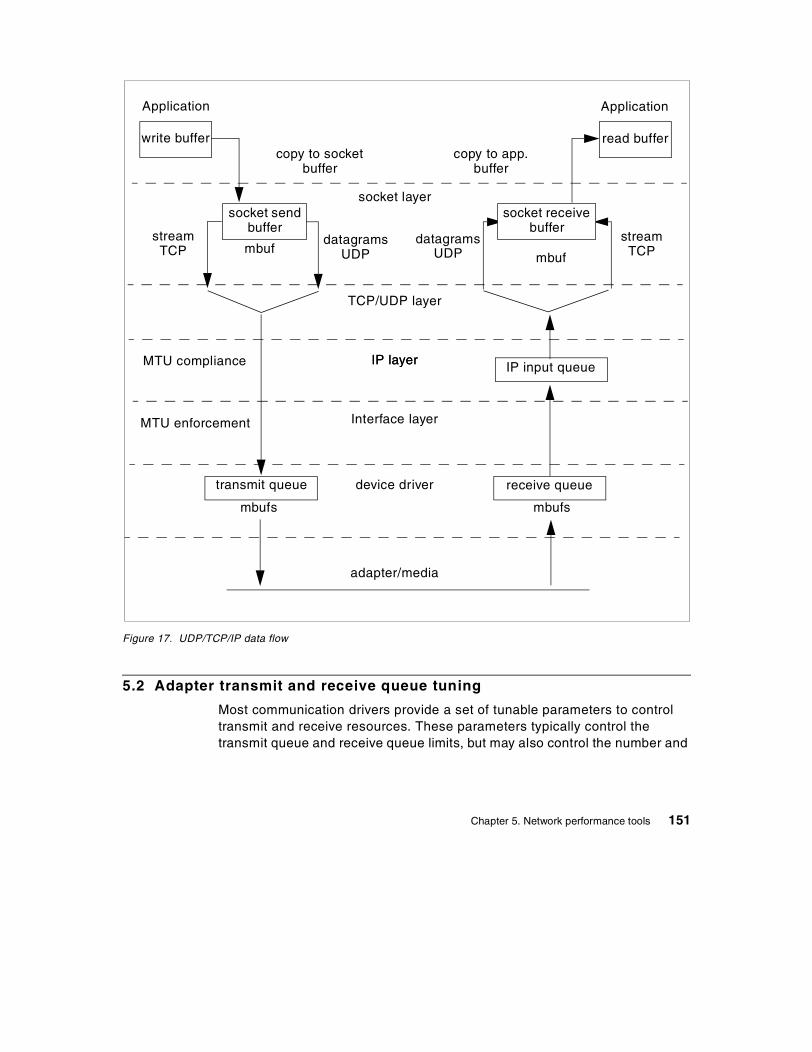
Figure 17. UDP/TCP/IP data flow
5.2 Adapter transmit and receive queue tuning
Most communication drivers provide a set of tunable parameters to control transmit and receive resources. These parameters typically control the transmit queue and receive queue limits, but may also control the number and
write buffer
Application
copy to socket buffer
socket send buffer
datagramsUDP
streamTCP
transmit queue
mbufs
mbuf
read buffer
Application
copy to app. buffer
datagramsUDP
streamTCP
receive queue
mbufs
mbuf
IP input queue
socket receive buffer
socket layer
TCP/UDP layer
IP layer
device driver
adapter/media
Interface layer
IP layerMTU compliance
MTU enforcement
Chapter 5. Network performance tools 151
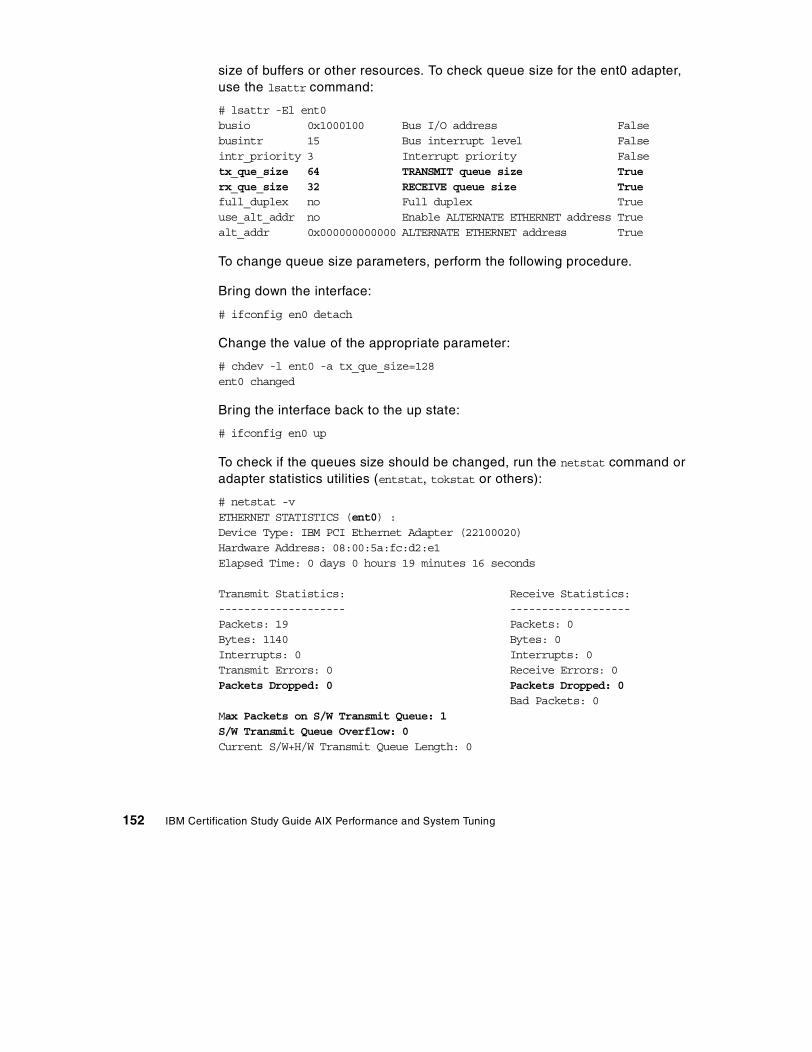
size of buffers or other resources. To check queue size for the ent0 adapter, use the lsattr command:
# lsattr -El ent0busio 0x1000100 Bus I/O address Falsebusintr 15 Bus interrupt level Falseintr_priority 3 Interrupt priority Falsetx_que_size 64 TRANSMIT queue size Truerx_que_size 32 RECEIVE queue size Truefull_duplex no Full duplex Trueuse_alt_addr no Enable ALTERNATE ETHERNET address Truealt_addr 0x000000000000 ALTERNATE ETHERNET address True
To change queue size parameters, perform the following procedure.
Bring down the interface:
# ifconfig en0 detach
Change the value of the appropriate parameter:
# chdev -l ent0 -a tx_que_size=128ent0 changed
Bring the interface back to the up state:
# ifconfig en0 up
To check if the queues size should be changed, run the netstat command or adapter statistics utilities (entstat, tokstat or others):
# netstat -vETHERNET STATISTICS (ent0) :Device Type: IBM PCI Ethernet Adapter (22100020)Hardware Address: 08:00:5a:fc:d2:e1Elapsed Time: 0 days 0 hours 19 minutes 16 seconds
Transmit Statistics: Receive Statistics:-------------------- -------------------Packets: 19 Packets: 0Bytes: 1140 Bytes: 0Interrupts: 0 Interrupts: 0Transmit Errors: 0 Receive Errors: 0Packets Dropped: 0 Packets Dropped: 0
Bad Packets: 0Max Packets on S/W Transmit Queue: 1S/W Transmit Queue Overflow: 0Current S/W+H/W Transmit Queue Length: 0
152 IBM Certification Study Guide AIX Performance and System Tuning
Broadcast Packets: 19 Broadcast Packets: 0Multicast Packets: 0 Multicast Packets: 0....
Two parameters should be checked:
• Max Packets on S/W Transmit Queue. This is the maximum number of outgoing packets ever queued to the software transmit queue. An indication of an inadequate queue size is if the maximal transmits queued equals the current queue size tx_que_size. This indicates that the queue was full at some point.
• S/W Transmit Queue Overflow. The number of outgoing packets that have overflowed the software transmit queue. A value other than zero indicates that the same actions needed if the Max Packets on S/W Transmit Queue reaches the tx_que_size should be taken. The transmit queue size has to be increased.
5.3 Protocols tuning
The main goal in network performance tuning is to balance demands of users against resource constraints to ensure acceptable network performance.
You can do this with the following steps:
• Characterize workload, configuration, and bandwidth.
• Measure performance.
- Run tools, identify bottlenecks.
- Useful tools are: netstat, tcpdump, iptrace.
• Tune network parameters.
- Make adjustments.
- Useful tuning parameters are: no, nfso, chdev, ifconfig.
AIX allocates virtual memory for various TCP/IP networking tasks. The network subsystem uses a memory management facility called an mbuf. Mbufs are mostly used to store data for incoming and outbound network traffic. Having mbuf pools of the right size can have a very positive effect on network performance. Heavy network load can be a reason for low memory for the system, but too little virtual memory for network use can cause packet dropping. The dropped packet, on the other hand, can reduce the effective transmission throughput because of retransmissions or time outs.
Chapter 5. Network performance tools 153
The AIX operating system offers the capability for run-time mbuf pool configuration. There are a few system parameters that you can tune for this purpose:
thewall Kernel variable, controls the maximum amount of RAM (in kilobytes) that the mbuf management facility can allocate from the VMM.
tcp_sendspace Kernel variable, sets default socket send buffer. It keeps an application from overflowing the socket send buffer and limits the number of mbufs used by an application. The default value for tcp_sendspace is 16384.
tcp_recvspace Kernel variable, used as the default socket receive buffer size when an application opens a TCP socket. The default value for tcp_recvspace is 16384.
udp_sendspace Kernel variable, sets the limit for the amount of memory that can be used by a single UDP socket for buffering out-going data. If a UDP application fills this buffer space, it must sleep until some of the data has passed on to the next layer of the protocol stack. The default value for udp_sendspace is 9216.
udp_recvspace Kernel variable, sets the size limit of the receive space buffer for any single UDP socket. The default value for udp_recvspace is 41920.
rfc1323 If the value of this variable is non-zero, it allows the TCP window size to be the maximum of 32 bits instead of 16 bits. What this means is that you can set tcp_recvspace and tcp_sendspace to be greater than 64 KB.
sb_max Kernel variable, controls the upper limit for any buffers.
ipqmaxlen Kernel variable, controls length of the IP input queue. The default is 100 packets long, which is sufficient for single-network device systems. You may increase this value for systems with multiple network devices. The penalty for insufficient queue length is dropped packets.
The values of the tcp or udp_sendspace and tcp or udp_recvspace variables must be less than or equal to the sb_max, so if you have reduced sb_max from its default, or want to use buffers larger than that default, you must also change the sb_max variable.
Note
154 IBM Certification Study Guide AIX Performance and System Tuning
A network application that sends data in large bursts, such as a backup over the network, can generate socket buffer overflows. Insufficient buffer space for TCP sockets will merely limit throughput, but not inhibit proper operation. The TCP window limits the amount of data pending to be acknowledged and effectively limits the throughput of the sockets. The tcp_recvspace controls the TCP window size, which can not be bigger than the socket buffer space. To increase performance of such an application, you have to remove the TCP window size limit by setting the parameter rfc1323 to 1 and increasing the tcp_sendspace and tcp_recvspace values.
5.4 Network performance monitoring tools
This section describes the most common monitoring tools used to isolate network performance problems.
5.4.1 The vmstat commandYou should invoke network monitoring tools in order to get more statistics for isolating a network bottleneck. When the vmstat command shows significant amounts of idle time that does not fit the problem, the system may be network bound. The following is a typical vmstat command report:
# vmstat 120 10kthr memory page faults cpu----- ----------- ------------------------ ------------ -----------r b avm fre re pi po fr sr cy in sy cs us sy id wa0 1 19331 824 0 0 0 0 0 0 636 1955 674 0 0 99 00 1 19803 996 0 0 0 0 0 0 533 7466 591 0 0 99 00 1 19974 860 0 0 0 0 0 0 822 4055 892 0 0 99 00 1 19815 860 0 0 0 0 0 0 535 4096 509 0 0 99 00 1 19816 855 0 0 0 0 0 0 577 4582 598 0 0 99 00 1 19816 737 0 0 0 0 0 0 602 2720 672 0 0 99 00 1 19895 724 0 0 0 0 0 0 616 3842 698 0 0 99 00 1 17147 724 0 0 0 0 0 0 649 6427 626 0 0 99 00 1 17065 720 0 0 0 0 0 0 516 3629 543 0 0 99 00 1 17163 720 0 0 0 0 0 0 614 9030 688 0 0 99 00 1 17343 720 0 0 0 0 0 0 420 8777 487 0 0 99 00 1 17579 712 0 0 0 0 0 0 466 2182 473 0 0 99 00 1 17647 712 0 0 0 0 0 0 497 3298 310 0 0 99 0
The disk I/O wait is in the wa column and the nondisk wait is in the id column. Nondisk wait includes network I/O wait or terminal I/O wait. If there is no terminal I/O wait, then the system is waiting for network I/O to complete. You should run one of the network monitoring tools to find out the reason for the network I/O wait.
Chapter 5. Network performance tools 155
5.4.2 The ping commandWhen you have connection problems, the first tool you should use is the ping command. It is used for investigating basic point-to-point network connectivity problems, answering questions about whether the remote host is attached to the network, and whether the network between the hosts is reliable. Additionally, ping can indicate whether a host name and IP address is consistent across several machines. To check if the host server3 is alive, enter the following command:
# ping server3PING server3: (9.3.240.58): 56 data bytes64 bytes from 9.3.240.58: icmp_seq=0 ttl=255 time=1 ms64 bytes from 9.3.240.58: icmp_seq=1 ttl=255 time=0 ms^C----server3 PING Statistics----2 packets transmitted, 2 packets received, 0% packet lossround-trip min/avg/max = 0/0/1 ms
This test checks round-trip times and packet loss statistics, as shown in the previous example.
5.4.3 The traceroute commandIf you can not reach a host which is in a different network, you can check the connection using the traceroute command. The traceroute output shows each gateway that the packet traverses on its way to find the target host, and the delay or network latency associated with that segment. If possible, examine the routing tables of the last machine shown in the traceroute output to check if a route exists to the destination from that host. The last machine shown is where the routing is going astray.
# traceroute 9.3.240.56traceroute to 9.3.240.56 (9.3.240.56), 30 hops max, 40 byte packets1 server4e (10.47.1.1) 1 ms 1 ms 0 ms2 server1 (9.3.240.56) 1 ms 1 ms 1 ms
If the connections are performing poorly, packet fragmentation may be a problem. AIX Version 4.3 has a service that allows automatic path MTU discovery. A fixed MTU size can also be set with the no command.
5.4.4 The netstat commandThe most common network monitoring tool is netstat. The netstat command is used to show the network status. It gives you an indication of the reliability of the local network interface. Traditionally, it is used more for problem determination than for performance measurement. It is useful in determining
156 IBM Certification Study Guide AIX Performance and System Tuning
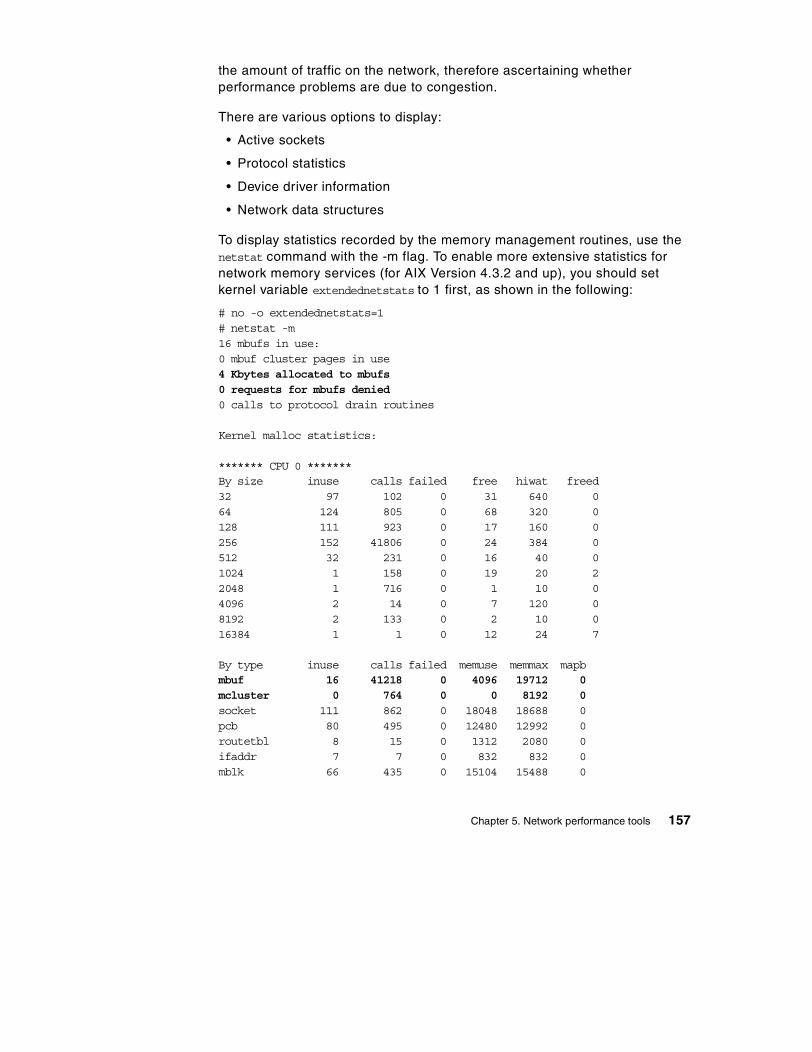
the amount of traffic on the network, therefore ascertaining whether performance problems are due to congestion.
There are various options to display:
• Active sockets
• Protocol statistics
• Device driver information
• Network data structures
To display statistics recorded by the memory management routines, use the netstat command with the -m flag. To enable more extensive statistics for network memory services (for AIX Version 4.3.2 and up), you should set kernel variable extendednetstats to 1 first, as shown in the following:
# no -o extendednetstats=1# netstat -m16 mbufs in use:0 mbuf cluster pages in use4 Kbytes allocated to mbufs0 requests for mbufs denied0 calls to protocol drain routines
Kernel malloc statistics:
******* CPU 0 *******By size inuse calls failed free hiwat freed32 97 102 0 31 640 064 124 805 0 68 320 0128 111 923 0 17 160 0256 152 41806 0 24 384 0512 32 231 0 16 40 01024 1 158 0 19 20 22048 1 716 0 1 10 04096 2 14 0 7 120 08192 2 133 0 2 10 016384 1 1 0 12 24 7
By type inuse calls failed memuse memmax mapbmbuf 16 41218 0 4096 19712 0mcluster 0 764 0 0 8192 0socket 111 862 0 18048 18688 0pcb 80 495 0 12480 12992 0routetbl 8 15 0 1312 2080 0ifaddr 7 7 0 832 832 0mblk 66 435 0 15104 15488 0
Chapter 5. Network performance tools 157
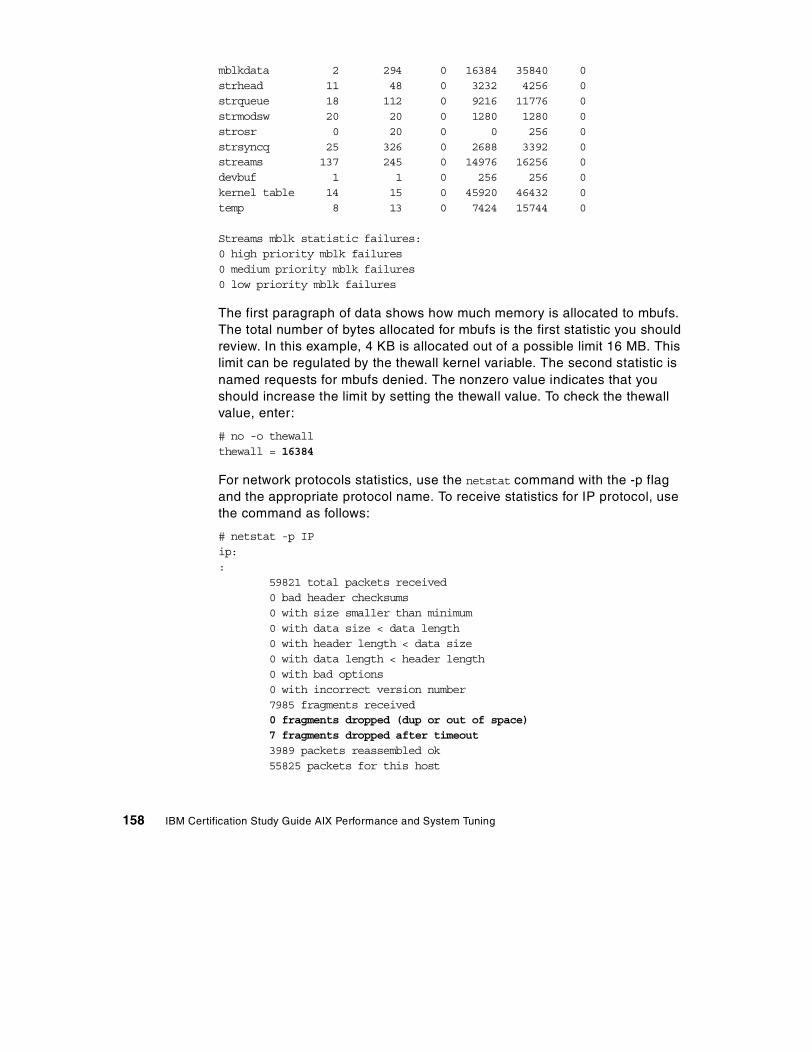
mblkdata 2 294 0 16384 35840 0strhead 11 48 0 3232 4256 0strqueue 18 112 0 9216 11776 0strmodsw 20 20 0 1280 1280 0strosr 0 20 0 0 256 0strsyncq 25 326 0 2688 3392 0streams 137 245 0 14976 16256 0devbuf 1 1 0 256 256 0kernel table 14 15 0 45920 46432 0temp 8 13 0 7424 15744 0
Streams mblk statistic failures:0 high priority mblk failures0 medium priority mblk failures0 low priority mblk failures
The first paragraph of data shows how much memory is allocated to mbufs. The total number of bytes allocated for mbufs is the first statistic you should review. In this example, 4 KB is allocated out of a possible limit 16 MB. This limit can be regulated by the thewall kernel variable. The second statistic is named requests for mbufs denied. The nonzero value indicates that you should increase the limit by setting the thewall value. To check the thewall value, enter:
# no -o thewallthewall = 16384
For network protocols statistics, use the netstat command with the -p flag and the appropriate protocol name. To receive statistics for IP protocol, use the command as follows:
# netstat -p IPip::
59821 total packets received0 bad header checksums0 with size smaller than minimum0 with data size < data length0 with header length < data size0 with data length < header length0 with bad options0 with incorrect version number7985 fragments received0 fragments dropped (dup or out of space)7 fragments dropped after timeout3989 packets reassembled ok55825 packets for this host
158 IBM Certification Study Guide AIX Performance and System Tuning
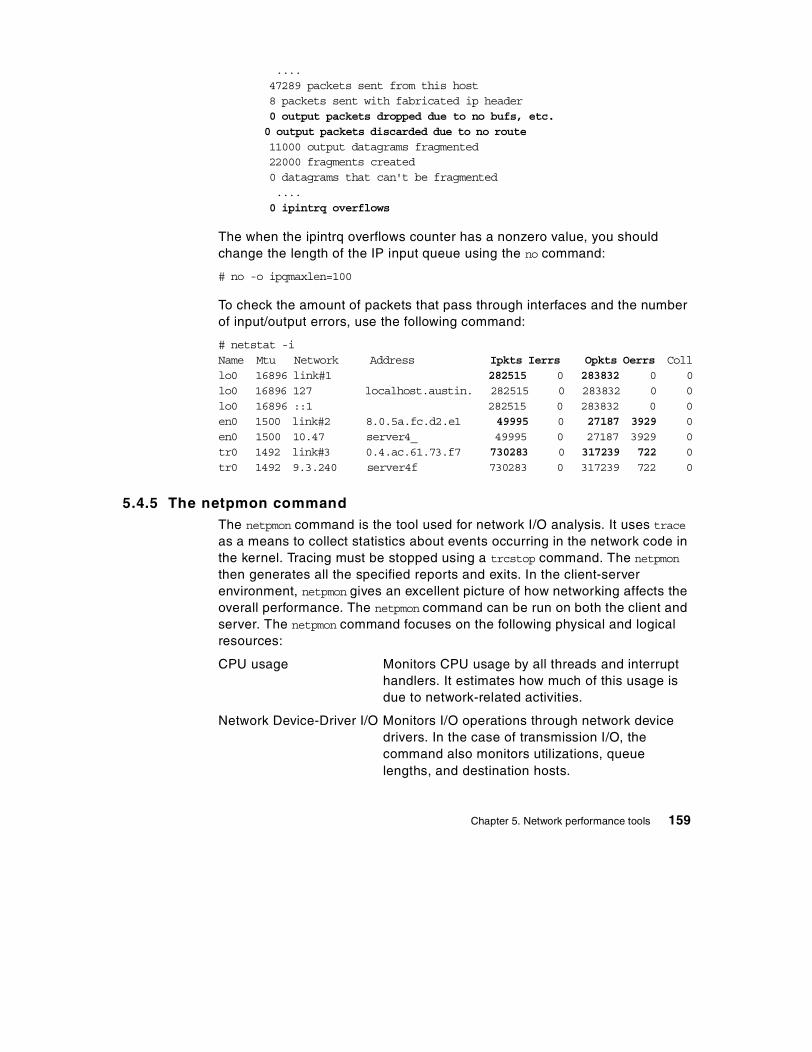
....47289 packets sent from this host8 packets sent with fabricated ip header0 output packets dropped due to no bufs, etc.0 output packets discarded due to no route11000 output datagrams fragmented22000 fragments created0 datagrams that can't be fragmented....0 ipintrq overflows
The when the ipintrq overflows counter has a nonzero value, you should change the length of the IP input queue using the no command:
# no -o ipqmaxlen=100
To check the amount of packets that pass through interfaces and the number of input/output errors, use the following command:
# netstat -iName Mtu Network Address Ipkts Ierrs Opkts Oerrs Colllo0 16896 link#1 282515 0 283832 0 0lo0 16896 127 localhost.austin. 282515 0 283832 0 0lo0 16896 ::1 282515 0 283832 0 0en0 1500 link#2 8.0.5a.fc.d2.e1 49995 0 27187 3929 0en0 1500 10.47 server4_ 49995 0 27187 3929 0tr0 1492 link#3 0.4.ac.61.73.f7 730283 0 317239 722 0tr0 1492 9.3.240 server4f 730283 0 317239 722 0
5.4.5 The netpmon commandThe netpmon command is the tool used for network I/O analysis. It uses trace as a means to collect statistics about events occurring in the network code in the kernel. Tracing must be stopped using a trcstop command. The netpmon then generates all the specified reports and exits. In the client-server environment, netpmon gives an excellent picture of how networking affects the overall performance. The netpmon command can be run on both the client and server. The netpmon command focuses on the following physical and logical resources:
CPU usage Monitors CPU usage by all threads and interrupt handlers. It estimates how much of this usage is due to network-related activities.
Network Device-Driver I/O Monitors I/O operations through network device drivers. In the case of transmission I/O, the command also monitors utilizations, queue lengths, and destination hosts.
Chapter 5. Network performance tools 159
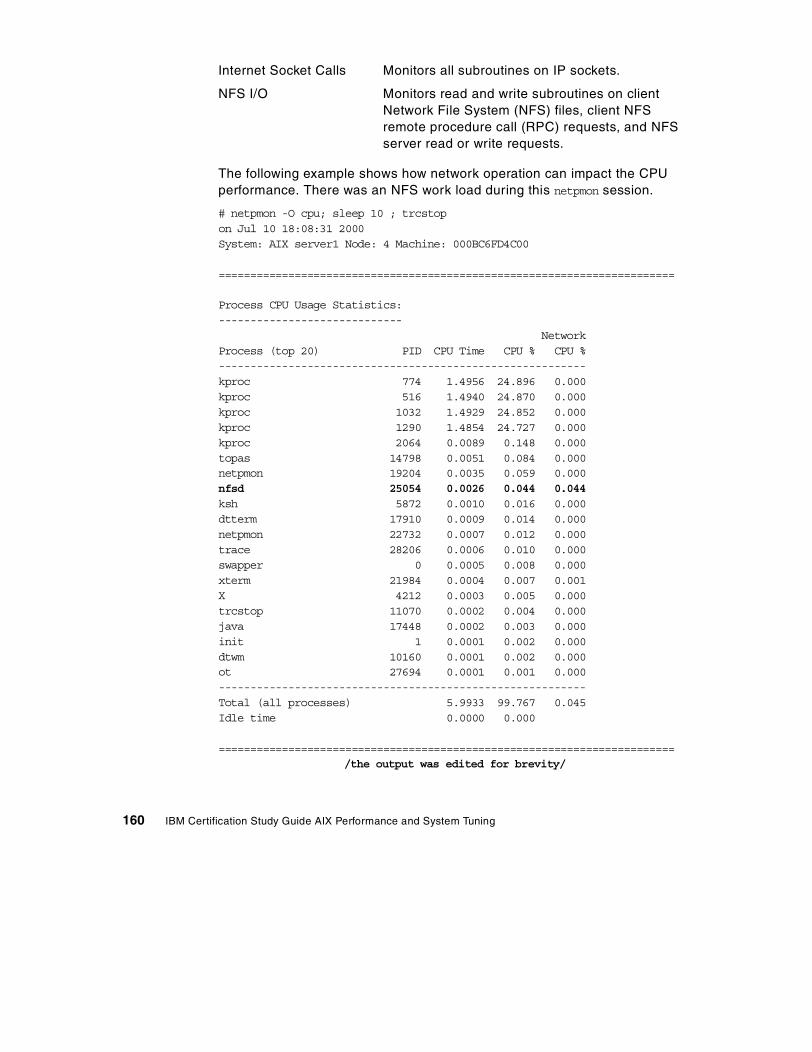
Internet Socket Calls Monitors all subroutines on IP sockets.
NFS I/O Monitors read and write subroutines on client Network File System (NFS) files, client NFS remote procedure call (RPC) requests, and NFS server read or write requests.
The following example shows how network operation can impact the CPU performance. There was an NFS work load during this netpmon session.
# netpmon -O cpu; sleep 10 ; trcstopon Jul 10 18:08:31 2000System: AIX server1 Node: 4 Machine: 000BC6FD4C00
========================================================================
Process CPU Usage Statistics:-----------------------------
NetworkProcess (top 20) PID CPU Time CPU % CPU %----------------------------------------------------------kproc 774 1.4956 24.896 0.000kproc 516 1.4940 24.870 0.000kproc 1032 1.4929 24.852 0.000kproc 1290 1.4854 24.727 0.000kproc 2064 0.0089 0.148 0.000topas 14798 0.0051 0.084 0.000netpmon 19204 0.0035 0.059 0.000nfsd 25054 0.0026 0.044 0.044ksh 5872 0.0010 0.016 0.000dtterm 17910 0.0009 0.014 0.000netpmon 22732 0.0007 0.012 0.000trace 28206 0.0006 0.010 0.000swapper 0 0.0005 0.008 0.000xterm 21984 0.0004 0.007 0.001X 4212 0.0003 0.005 0.000trcstop 11070 0.0002 0.004 0.000java 17448 0.0002 0.003 0.000init 1 0.0001 0.002 0.000dtwm 10160 0.0001 0.002 0.000ot 27694 0.0001 0.001 0.000----------------------------------------------------------Total (all processes) 5.9933 99.767 0.045Idle time 0.0000 0.000
========================================================================/the output was edited for brevity/
160 IBM Certification Study Guide AIX Performance and System Tuning
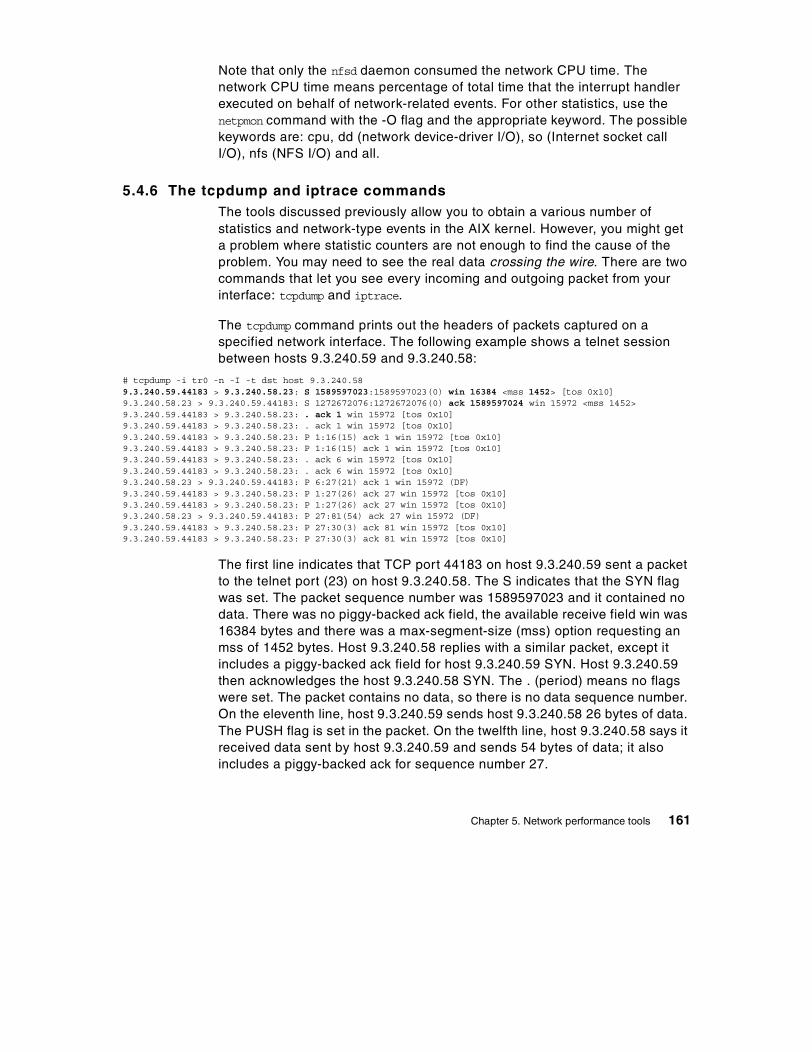
Note that only the nfsd daemon consumed the network CPU time. The network CPU time means percentage of total time that the interrupt handler executed on behalf of network-related events. For other statistics, use the netpmon command with the -O flag and the appropriate keyword. The possible keywords are: cpu, dd (network device-driver I/O), so (Internet socket call I/O), nfs (NFS I/O) and all.
5.4.6 The tcpdump and iptrace commandsThe tools discussed previously allow you to obtain a various number of statistics and network-type events in the AIX kernel. However, you might get a problem where statistic counters are not enough to find the cause of the problem. You may need to see the real data crossing the wire. There are two commands that let you see every incoming and outgoing packet from your interface: tcpdump and iptrace.
The tcpdump command prints out the headers of packets captured on a specified network interface. The following example shows a telnet session between hosts 9.3.240.59 and 9.3.240.58:
# tcpdump -i tr0 -n -I -t dst host 9.3.240.589.3.240.59.44183 > 9.3.240.58.23: S 1589597023:1589597023(0) win 16384 <mss 1452> [tos 0x10]9.3.240.58.23 > 9.3.240.59.44183: S 1272672076:1272672076(0) ack 1589597024 win 15972 <mss 1452>9.3.240.59.44183 > 9.3.240.58.23: . ack 1 win 15972 [tos 0x10]9.3.240.59.44183 > 9.3.240.58.23: . ack 1 win 15972 [tos 0x10]9.3.240.59.44183 > 9.3.240.58.23: P 1:16(15) ack 1 win 15972 [tos 0x10]9.3.240.59.44183 > 9.3.240.58.23: P 1:16(15) ack 1 win 15972 [tos 0x10]9.3.240.59.44183 > 9.3.240.58.23: . ack 6 win 15972 [tos 0x10]9.3.240.59.44183 > 9.3.240.58.23: . ack 6 win 15972 [tos 0x10]9.3.240.58.23 > 9.3.240.59.44183: P 6:27(21) ack 1 win 15972 (DF)9.3.240.59.44183 > 9.3.240.58.23: P 1:27(26) ack 27 win 15972 [tos 0x10]9.3.240.59.44183 > 9.3.240.58.23: P 1:27(26) ack 27 win 15972 [tos 0x10]9.3.240.58.23 > 9.3.240.59.44183: P 27:81(54) ack 27 win 15972 (DF)9.3.240.59.44183 > 9.3.240.58.23: P 27:30(3) ack 81 win 15972 [tos 0x10]9.3.240.59.44183 > 9.3.240.58.23: P 27:30(3) ack 81 win 15972 [tos 0x10]
The first line indicates that TCP port 44183 on host 9.3.240.59 sent a packet to the telnet port (23) on host 9.3.240.58. The S indicates that the SYN flag was set. The packet sequence number was 1589597023 and it contained no data. There was no piggy-backed ack field, the available receive field win was 16384 bytes and there was a max-segment-size (mss) option requesting an mss of 1452 bytes. Host 9.3.240.58 replies with a similar packet, except it includes a piggy-backed ack field for host 9.3.240.59 SYN. Host 9.3.240.59 then acknowledges the host 9.3.240.58 SYN. The . (period) means no flags were set. The packet contains no data, so there is no data sequence number. On the eleventh line, host 9.3.240.59 sends host 9.3.240.58 26 bytes of data. The PUSH flag is set in the packet. On the twelfth line, host 9.3.240.58 says it received data sent by host 9.3.240.59 and sends 54 bytes of data; it also includes a piggy-backed ack for sequence number 27.
Chapter 5. Network performance tools 161
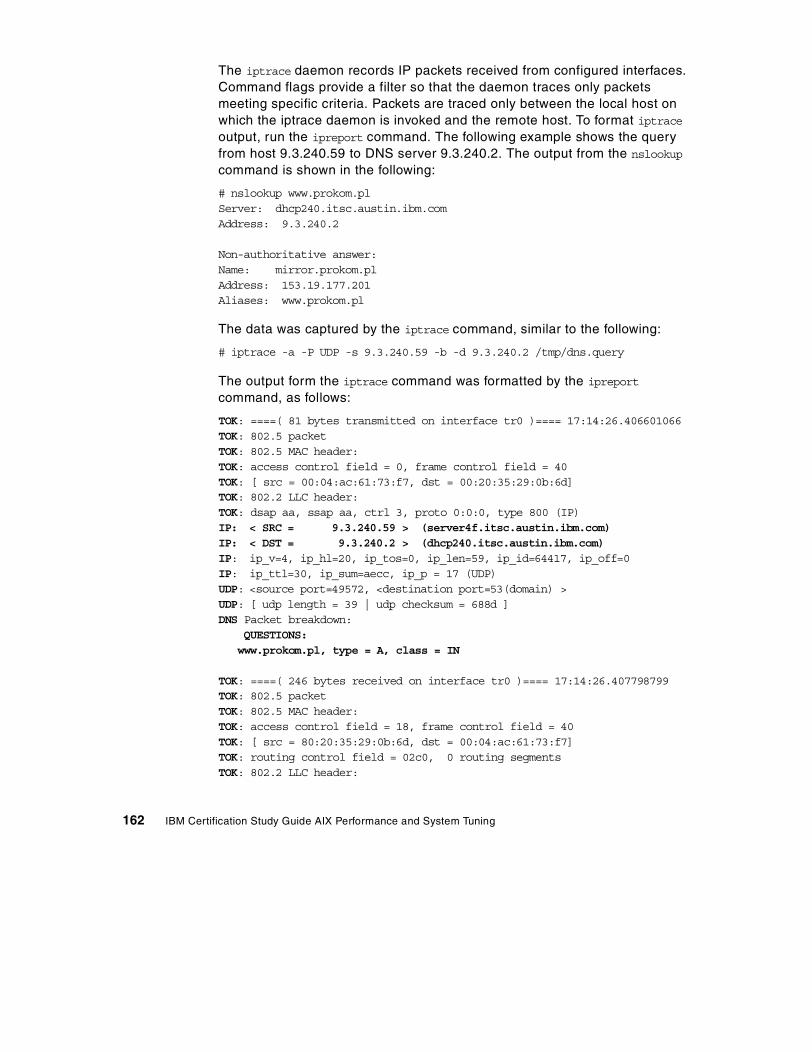
The iptrace daemon records IP packets received from configured interfaces. Command flags provide a filter so that the daemon traces only packets meeting specific criteria. Packets are traced only between the local host on which the iptrace daemon is invoked and the remote host. To format iptrace output, run the ipreport command. The following example shows the query from host 9.3.240.59 to DNS server 9.3.240.2. The output from the nslookup command is shown in the following:
# nslookup www.prokom.plServer: dhcp240.itsc.austin.ibm.comAddress: 9.3.240.2
Non-authoritative answer:Name: mirror.prokom.plAddress: 153.19.177.201Aliases: www.prokom.pl
The data was captured by the iptrace command, similar to the following:
# iptrace -a -P UDP -s 9.3.240.59 -b -d 9.3.240.2 /tmp/dns.query
The output form the iptrace command was formatted by the ipreport command, as follows:
TOK: ====( 81 bytes transmitted on interface tr0 )==== 17:14:26.406601066TOK: 802.5 packetTOK: 802.5 MAC header:TOK: access control field = 0, frame control field = 40TOK: [ src = 00:04:ac:61:73:f7, dst = 00:20:35:29:0b:6d]TOK: 802.2 LLC header:TOK: dsap aa, ssap aa, ctrl 3, proto 0:0:0, type 800 (IP)IP: < SRC = 9.3.240.59 > (server4f.itsc.austin.ibm.com)IP: < DST = 9.3.240.2 > (dhcp240.itsc.austin.ibm.com)IP: ip_v=4, ip_hl=20, ip_tos=0, ip_len=59, ip_id=64417, ip_off=0IP: ip_ttl=30, ip_sum=aecc, ip_p = 17 (UDP)UDP: <source port=49572, <destination port=53(domain) >UDP: [ udp length = 39 | udp checksum = 688d ]DNS Packet breakdown:
QUESTIONS:www.prokom.pl, type = A, class = IN
TOK: ====( 246 bytes received on interface tr0 )==== 17:14:26.407798799TOK: 802.5 packetTOK: 802.5 MAC header:TOK: access control field = 18, frame control field = 40TOK: [ src = 80:20:35:29:0b:6d, dst = 00:04:ac:61:73:f7]TOK: routing control field = 02c0, 0 routing segmentsTOK: 802.2 LLC header:
162 IBM Certification Study Guide AIX Performance and System Tuning
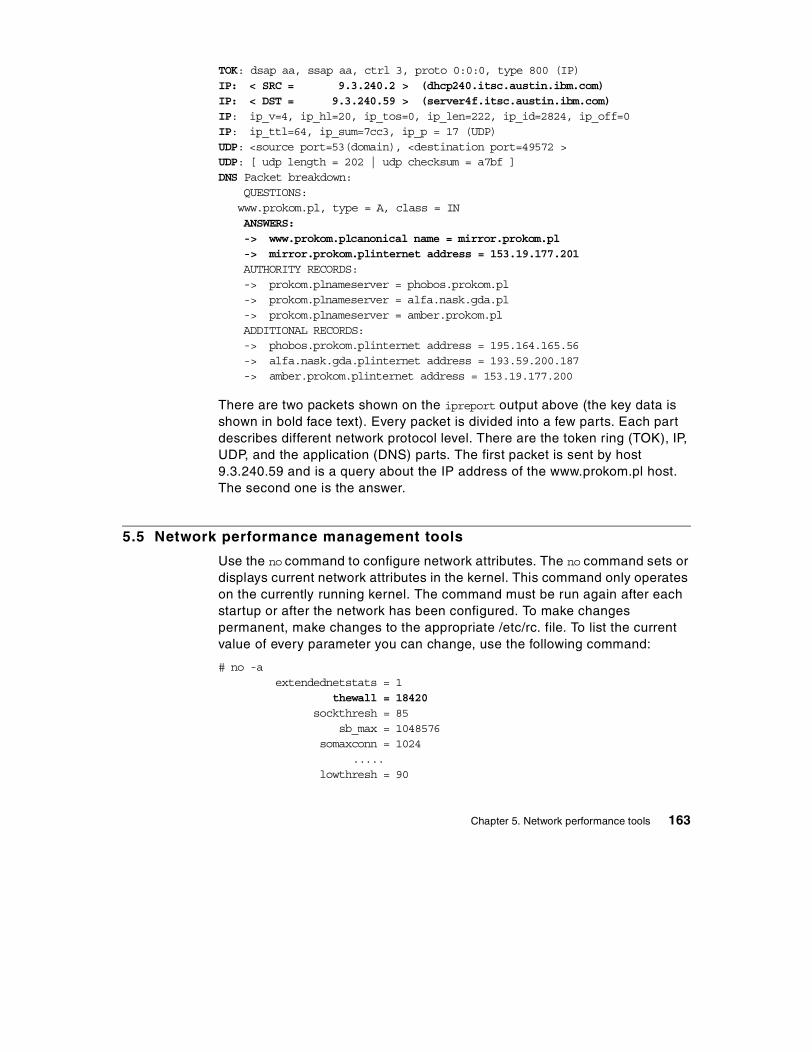
TOK: dsap aa, ssap aa, ctrl 3, proto 0:0:0, type 800 (IP)IP: < SRC = 9.3.240.2 > (dhcp240.itsc.austin.ibm.com)IP: < DST = 9.3.240.59 > (server4f.itsc.austin.ibm.com)IP: ip_v=4, ip_hl=20, ip_tos=0, ip_len=222, ip_id=2824, ip_off=0IP: ip_ttl=64, ip_sum=7cc3, ip_p = 17 (UDP)UDP: <source port=53(domain), <destination port=49572 >UDP: [ udp length = 202 | udp checksum = a7bf ]DNS Packet breakdown:
QUESTIONS:www.prokom.pl, type = A, class = INANSWERS:-> www.prokom.plcanonical name = mirror.prokom.pl-> mirror.prokom.plinternet address = 153.19.177.201AUTHORITY RECORDS:-> prokom.plnameserver = phobos.prokom.pl-> prokom.plnameserver = alfa.nask.gda.pl-> prokom.plnameserver = amber.prokom.plADDITIONAL RECORDS:-> phobos.prokom.plinternet address = 195.164.165.56-> alfa.nask.gda.plinternet address = 193.59.200.187-> amber.prokom.plinternet address = 153.19.177.200
There are two packets shown on the ipreport output above (the key data is shown in bold face text). Every packet is divided into a few parts. Each part describes different network protocol level. There are the token ring (TOK), IP, UDP, and the application (DNS) parts. The first packet is sent by host 9.3.240.59 and is a query about the IP address of the www.prokom.pl host. The second one is the answer.
5.5 Network performance management tools
Use the no command to configure network attributes. The no command sets or displays current network attributes in the kernel. This command only operates on the currently running kernel. The command must be run again after each startup or after the network has been configured. To make changes permanent, make changes to the appropriate /etc/rc. file. To list the current value of every parameter you can change, use the following command:
# no -aextendednetstats = 1
thewall = 18420sockthresh = 85
sb_max = 1048576somaxconn = 1024
.....lowthresh = 90
Chapter 5. Network performance tools 163
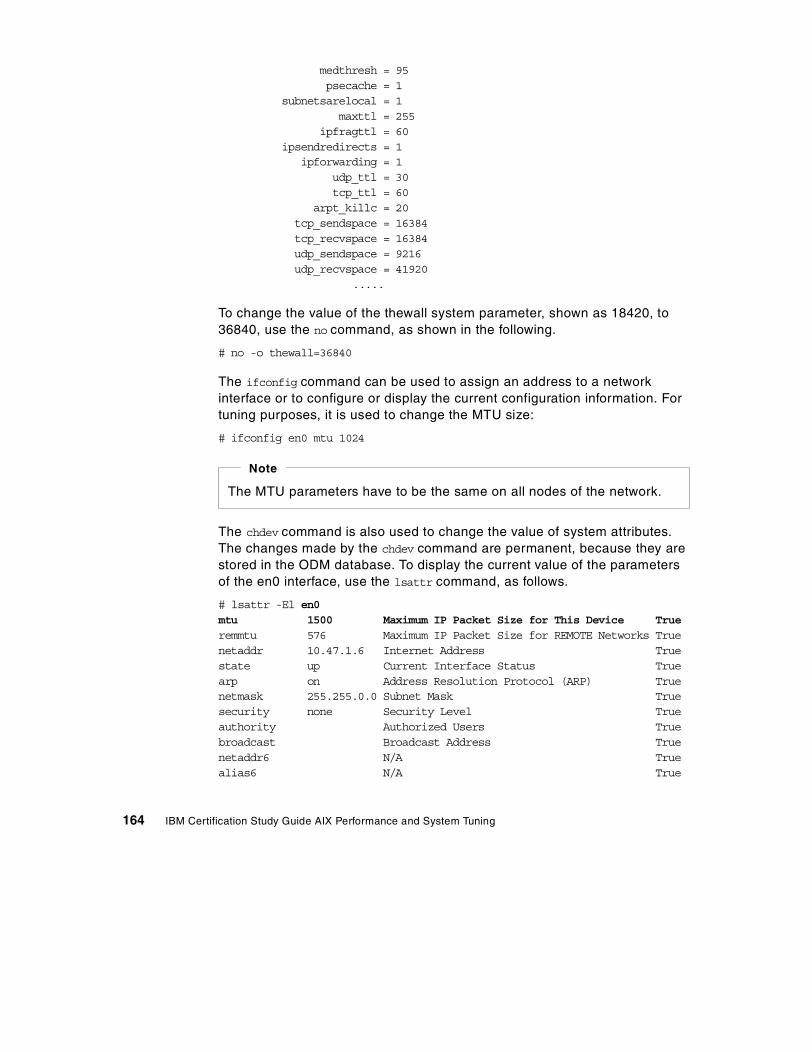
medthresh = 95psecache = 1
subnetsarelocal = 1maxttl = 255
ipfragttl = 60ipsendredirects = 1
ipforwarding = 1udp_ttl = 30tcp_ttl = 60
arpt_killc = 20tcp_sendspace = 16384tcp_recvspace = 16384udp_sendspace = 9216udp_recvspace = 41920
.....
To change the value of the thewall system parameter, shown as 18420, to 36840, use the no command, as shown in the following.
# no -o thewall=36840
The ifconfig command can be used to assign an address to a network interface or to configure or display the current configuration information. For tuning purposes, it is used to change the MTU size:
# ifconfig en0 mtu 1024
The chdev command is also used to change the value of system attributes. The changes made by the chdev command are permanent, because they are stored in the ODM database. To display the current value of the parameters of the en0 interface, use the lsattr command, as follows.
# lsattr -El en0mtu 1500 Maximum IP Packet Size for This Device Trueremmtu 576 Maximum IP Packet Size for REMOTE Networks Truenetaddr 10.47.1.6 Internet Address Truestate up Current Interface Status Truearp on Address Resolution Protocol (ARP) Truenetmask 255.255.0.0 Subnet Mask Truesecurity none Security Level Trueauthority Authorized Users Truebroadcast Broadcast Address Truenetaddr6 N/A Truealias6 N/A True
The MTU parameters have to be the same on all nodes of the network.
Note
164 IBM Certification Study Guide AIX Performance and System Tuning
prefixlen N/A Truealias4 N/A Truerfc1323 N/A Truetcp_nodelay N/A Truetcp_sendspace N/A Truetcp_recvspace N/A Truetcp_mssdflt N/A True
To permanently change value of the MTU parameter, enter:
# chdev -l en0 -a mtu=1024en0 changed
5.6 Name resolution
If a network connection seems inexplicably slow at times but reasonable at other times, you should check the name resolution configuration for your system. To perform a basic diagnostic for name resolving, you can use either the host command or the nslookup command.
# host dhcp240.itsc.austin.ibm.comdhcp240.itsc.austin.ibm.com is 9.3.240.2
The name resolution can be served through either the remote DNS server or the remote NIS server. If one of them is down, you have to wait until a TCP time-out occurs. The name can be resolved by an alternate source, which can be a secondary name server or the local /etc/hosts file.
First check the /etc/netsvc.conf file or NSORDER environment variable for your particular name resolution ordering. Then check the /etc/resolv.conf file for the IP address of the name server and try to ping it. If you can ping it, then it is up and reachable. If not, try a different name resolution ordering.
5.7 NFS performance tuning
This section discusses the NFS server and the NFS client performance issue.
5.7.1 NFS server-side performance When narrowing down the performance discussion on servers to the NFS specifics, the issue is often related to dropped packages. NFS servers may drop packets due to overloads.
One common place where a server will drop packets is the UDP socket buffer. The default for AIX Version 4.3 is TCP for data transfer, but UDP is
Chapter 5. Network performance tools 165
still used for mounting. Dropped packets here are counted by the UDP layer, and the statistics can be seen by using the netstat -p UDP command. For example:
# netstat -p UDPudp:
89827 datagrams received0 incomplete headers0 bad data length fields0 bad checksums329 dropped due to no socket77515 broadcast/multicast datagrams dropped due to no socket0 socket buffer overflows11983 delivered11663 datagrams output
(At the test system the buffer size was sufficient)
NFS packets will usually be dropped at the socket buffer only when a server has a lot of NFS write traffic. The NFS server uses a UDP and TCP socket attached to the NFS port, and all incoming data is buffered on those ports. The default size of this buffer is 60000 bytes. Dividing that number by the size of the default NFS Version 3 write packet (32765), you find that it will take only two simultaneous write packets to overflow that buffer. That could be done by just one NFS client (with the default configurations). It is not as easy as it sounds to overflow the buffer in normal system operation. As soon as the first packet reaches the socket, an nfsd will be awakened to start taking the data off.
One of two things has to happen for packets to be dropped. There must be high volume or a high burst of traffic on the socket. If there is high volume, a mixture of many writes plus other possibly non-write NFS traffic, there may not be enough nfsd daemons to take the data off the socket fast enough to keep up with the volume (It takes a dedicated nfsd to service each NFS call of any type). In the high burst case, there may be enough nfsds, but the speed at which packets arrive on the socket is such that the nfsd daemons cannot wake up fast enough to keep it from overflowing.
Each of the two situations has a different resolution. In the case of high volume, it may be sufficient to just increase the number of nfsd daemons running on the system. Since there is no significant penalty for running with more nfsd daemons on an AIX machine, this should be tried first.
This can be done with the following command:
# chnfs -n 16
166 IBM Certification Study Guide AIX Performance and System Tuning
This will stop the currently running daemons, modify the SRC database code to reflect the new number, and restart the daemons indicated.
In the case of a high burst of traffic, the only solution is to make the socket bigger in the hope that some reasonable size will be sufficiently large enough to give the nfsd daemons time catch up with the burst. Memory dedicated to this socket will not be available for any other use so it must be understood that making the socket larger may result in memory that will be under utilized the vast majority of the time. The cautious administrator will watch the socket buffer overflows statistic and correlate it with performance problems and make a determination on how big to make the socket buffer. To check the NFS kernel options, use the nfso command:
# nfso -aportcheck= 0udpchecksum= 1nfs_socketsize= 60000nfs_tcp_socketsize= 60000nfs_setattr_error= 0nfs_gather_threshold= 4096nfs_repeat_messages= 0nfs_udp_duplicate_cache_size= 0nfs_tcp_duplicate_cache_size= 5000nfs_server_base_priority= 0nfs_dynamic_retrans= 1nfs_iopace_pages= 0nfs_max_connections= 0nfs_max_threads= 8nfs_use_reserved_ports= 0nfs_device_specific_bufs= 1nfs_server_clread= 1nfs_rfc1323= 0nfs_max_write_size= 0nfs_max_read_size= 0nfs_allow_all_signals= 0
If you change the nfsbuffer sizes, you must verify that the kernel variable sb_max is greater then the NFS buffer values chosen. The default value of sb_max is 1048576 on AIX Version 4.3.3. If you need to increase the sb_max value, use the no command. Remember that everything changed with no or nfso is valid only until the next boot, unless these changes have been added to a boot script, for example, /etc/rc.nfs.
Chapter 5. Network performance tools 167
5.7.2 NFS client-side performance The NFS client performance topic often concentrates on the number of biod daemons used. For biod daemons, there is a default number of biod daemons (six for a NFS V2 mount, four for a NFS V3 mount) that may operate on any one remote mounted file system concurrently. The idea behind this limitation is that allowing more than a set number of biod daemons to operate against the server at one time may overload the server. Since this is Config_Rules on a per-mount basis on the client, adjustments can be made to configure client mounts by the server capabilities.
When evaluating how many biod daemons to run, you should consider the server capabilities as well as the typical NFS usage on the client machine. If there are multiple users or multiple process on the client that will need to perform NFS operations to the same NFS mounted file systems, you have to be aware that contention for biod services can occur with just two simultaneous read or write operations.
Up to six biod daemons can be working on reading a file in one NFS file system. If another read starts in another NFS mounted file system, both reads will be attempting to use all six biod daemons. In this case, presuming that the server(s) are not already overloaded, performance will likely improve by increasing the biod number to 12. This can be done using the chnfscommand:
# chnfs -b 12
On the other hand, suppose both file systems are mounted from the same server and the server is already operating at peak capacity. Adding another six biod daemons could dramatically worsen the response due to the server dropping packets and resulting in time-outs and retransmits.
5.7.3 Mount optionsThe mount command has several NFS specific options that may affect performance.
The most useful options are used to set the read and write sizes to some value that changes the read/write packet size that is sent to the server.
For NFS Version 3 mounts, the read/write sizes can be both increased and decreased. The default read/write sizes are 32 KB. The maximum possible on AIX at the time of publication is 61440 bytes (60 x 1024). Using 60 KB, read/write sizes may provide slight performance improvement in specialized environments. To increase the read/write sizes when both server and client are AIX machines requires modifying settings on both machines. On the
168 IBM Certification Study Guide AIX Performance and System Tuning
client, the mount must be performed by setting up the read/write sizes with the -o option. For example, -o rsize=61440,wsize=61440. On the server, the advertised maximum read/write size is configured through use of the nfso command using the nfs_max_write_size and nfs_max_read_size parameters. For example:
# nfso -o nfs_max_write_size=61440
NFS V3 uses TCP by default while NFS Version 2 uses UDP only. This means the initial client mount request using TCP will fail. To provide backwards compatibility, the mount is retried using UDP, but this only occurs after a time-out of some minutes. To avoid this problem, NFS V3 provided the proto and vers parameters with the mount command. These parameters are used with the -o option to hardwire the protocol and version for a specific mount. The following example forces the use of UDP and NFS V2 for the mount request:
# mount -o proto=udp,vers=2,soft,retry=1 server4:/tmp /mnt
5.8 Command summary
The following section provides a list of the key commands discussed in this chapter. For a complete reference of the following commands, consult the AIX product documentation.
5.8.1 The netstat commandThe syntax of the netstat command is:
To Display Active Sockets for Each Protocol or Routing Table Information:
/bin/netstat [ -n ] [ { -A -a } | { -r -i -I Interface } ] [ -fAddressFamily ] [ -p Protocol ] [ Interval ] [ System ]
To Display the Contents of a Network Data Structure:
/bin/netstat [ -m | -s | -ss | -u | -v ] [ -f AddressFamily ] [ -pProtocol ] [ Interval ] [ System ]
To Display the Packet Counts Throughout the Communications Subsystem:
/bin/netstat -D
To Display the Network Buffer Cache Statistics:
/bin/netstat -c
To Display the Data Link Provider Interface Statistics:
Chapter 5. Network performance tools 169
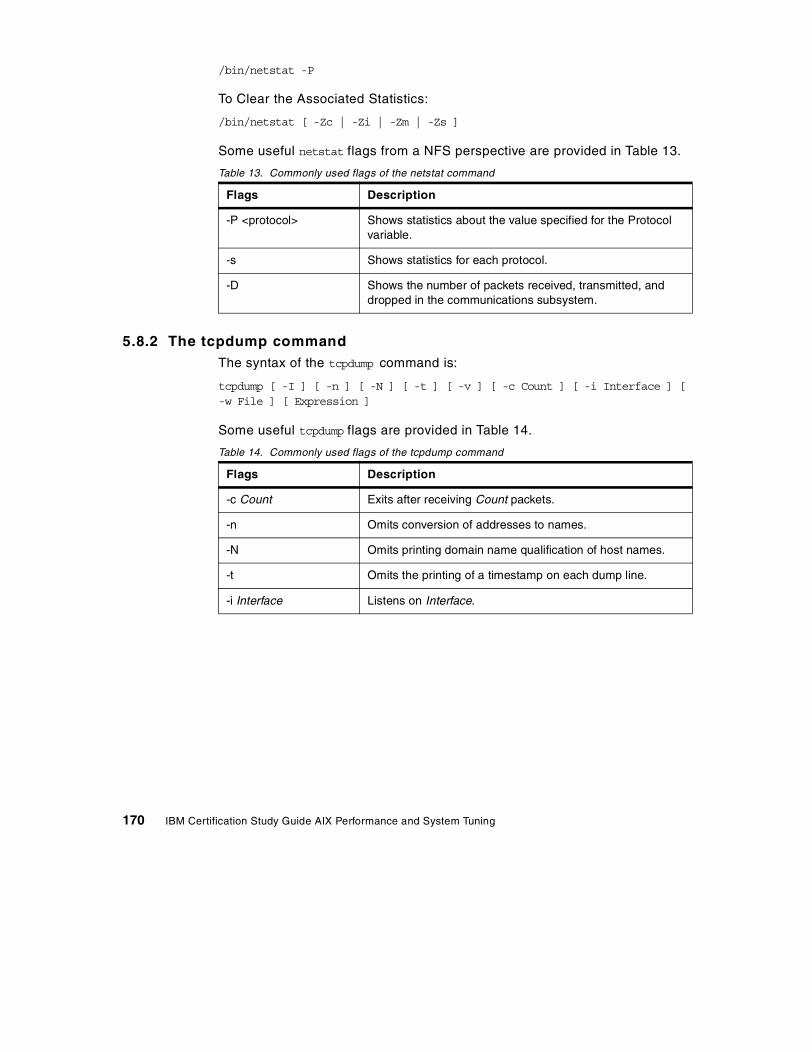
/bin/netstat -P
To Clear the Associated Statistics:
/bin/netstat [ -Zc | -Zi | -Zm | -Zs ]
Some useful netstat flags from a NFS perspective are provided in Table 13.
Table 13. Commonly used flags of the netstat command
5.8.2 The tcpdump commandThe syntax of the tcpdump command is:
tcpdump [ -I ] [ -n ] [ -N ] [ -t ] [ -v ] [ -c Count ] [ -i Interface ] [-w File ] [ Expression ]
Some useful tcpdump flags are provided in Table 14.
Table 14. Commonly used flags of the tcpdump command
Flags Description
-P <protocol> Shows statistics about the value specified for the Protocol variable.
-s Shows statistics for each protocol.
-D Shows the number of packets received, transmitted, and dropped in the communications subsystem.
Flags Description
-c Count Exits after receiving Count packets.
-n Omits conversion of addresses to names.
-N Omits printing domain name qualification of host names.
-t Omits the printing of a timestamp on each dump line.
-i Interface Listens on Interface.
170 IBM Certification Study Guide AIX Performance and System Tuning
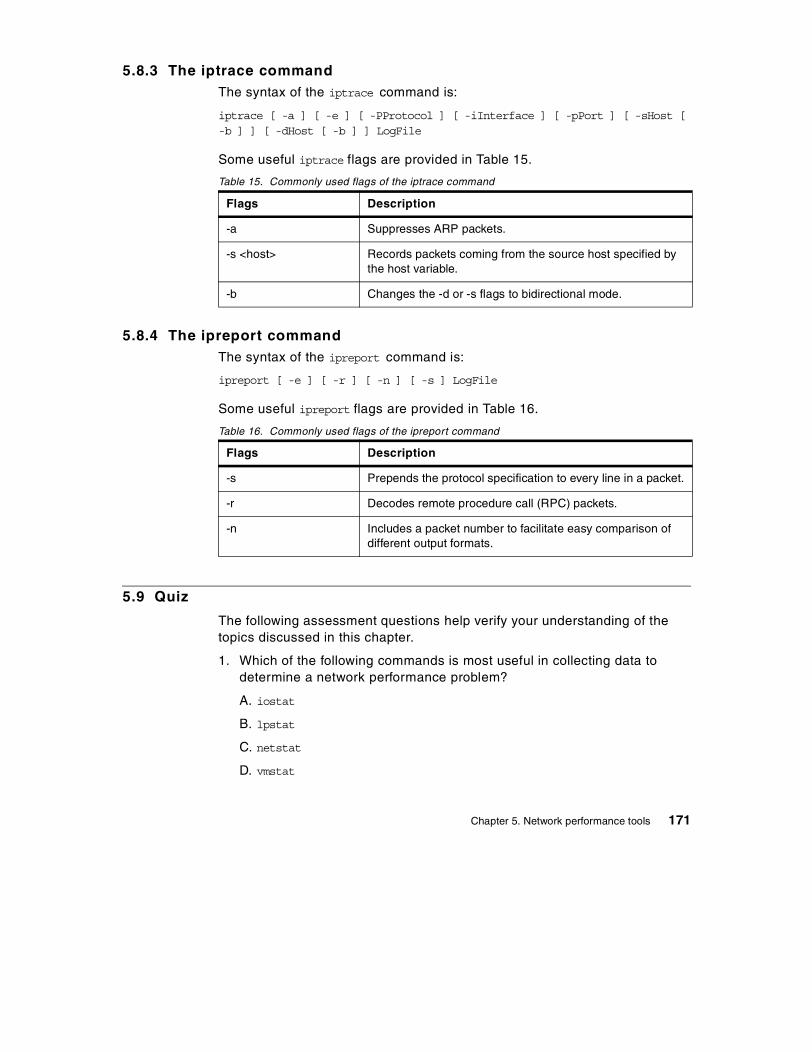
5.8.3 The iptrace commandThe syntax of the iptrace command is:
iptrace [ -a ] [ -e ] [ -PProtocol ] [ -iInterface ] [ -pPort ] [ -sHost [-b ] ] [ -dHost [ -b ] ] LogFile
Some useful iptrace flags are provided in Table 15.
Table 15. Commonly used flags of the iptrace command
5.8.4 The ipreport commandThe syntax of the ipreport command is:
ipreport [ -e ] [ -r ] [ -n ] [ -s ] LogFile
Some useful ipreport flags are provided in Table 16.
Table 16. Commonly used flags of the ipreport command
5.9 Quiz
The following assessment questions help verify your understanding of the topics discussed in this chapter.
1. Which of the following commands is most useful in collecting data to determine a network performance problem?
A. iostat
B. lpstat
C. netstat
D. vmstat
Flags Description
-a Suppresses ARP packets.
-s <host> Records packets coming from the source host specified by the host variable.
-b Changes the -d or -s flags to bidirectional mode.
Flags Description
-s Prepends the protocol specification to every line in a packet.
-r Decodes remote procedure call (RPC) packets.
-n Includes a packet number to facilitate easy comparison of different output formats.
Chapter 5. Network performance tools 171
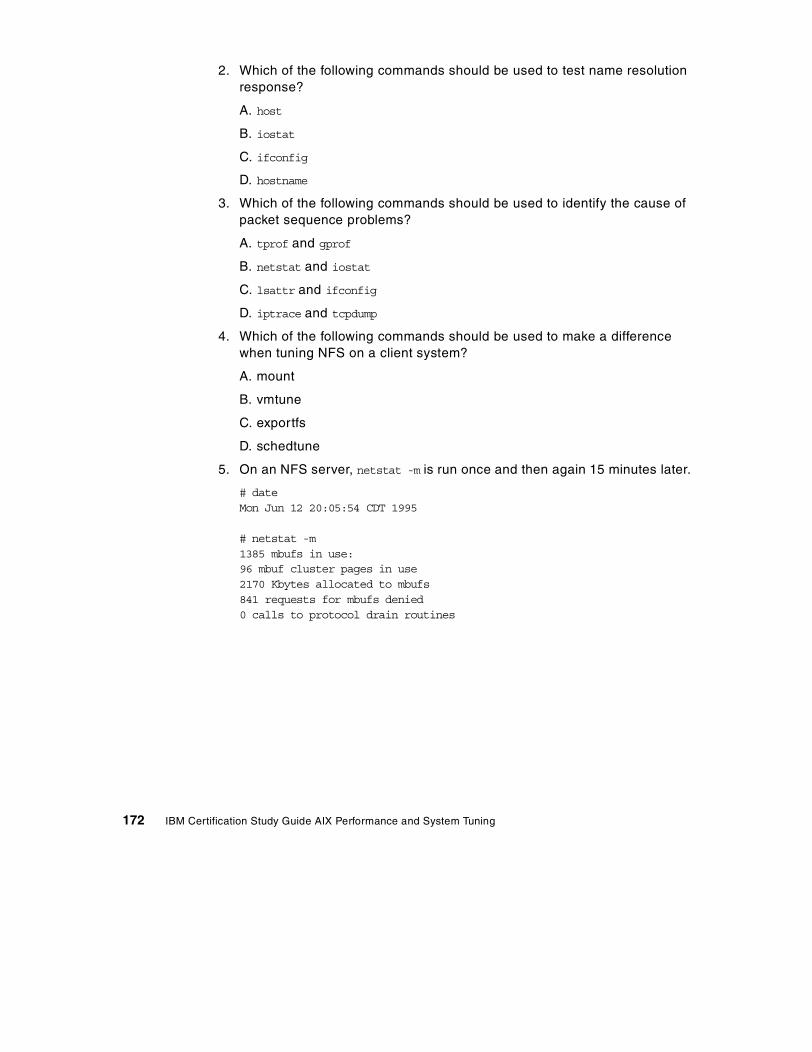
2. Which of the following commands should be used to test name resolution response?
A. host
B. iostat
C. ifconfig
D. hostname
3. Which of the following commands should be used to identify the cause of packet sequence problems?
A. tprof and gprof
B. netstat and iostat
C. lsattr and ifconfig
D. iptrace and tcpdump
4. Which of the following commands should be used to make a difference when tuning NFS on a client system?
A. mount
B. vmtune
C. exportfs
D. schedtune
5. On an NFS server, netstat -m is run once and then again 15 minutes later.
# dateMon Jun 12 20:05:54 CDT 1995
# netstat -m1385 mbufs in use:96 mbuf cluster pages in use2170 Kbytes allocated to mbufs841 requests for mbufs denied0 calls to protocol drain routines
172 IBM Certification Study Guide AIX Performance and System Tuning
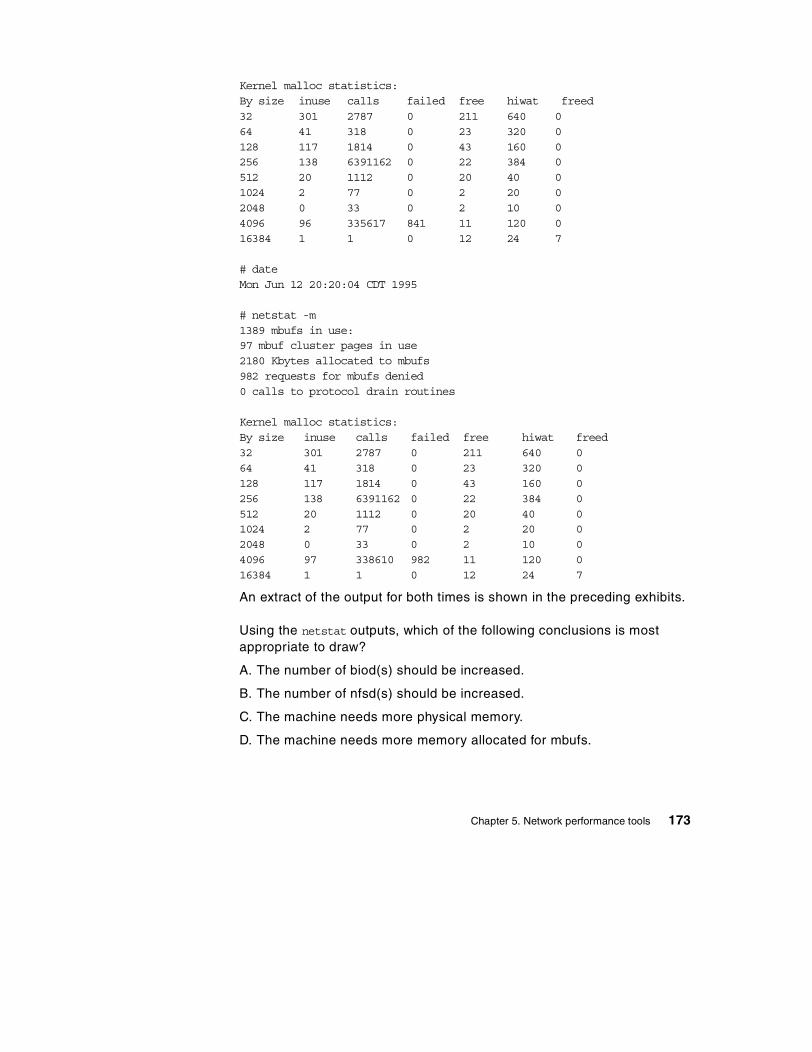
Kernel malloc statistics:By size inuse calls failed free hiwat freed32 301 2787 0 211 640 064 41 318 0 23 320 0128 117 1814 0 43 160 0256 138 6391162 0 22 384 0512 20 1112 0 20 40 01024 2 77 0 2 20 02048 0 33 0 2 10 04096 96 335617 841 11 120 016384 1 1 0 12 24 7
# dateMon Jun 12 20:20:04 CDT 1995
# netstat -m1389 mbufs in use:97 mbuf cluster pages in use2180 Kbytes allocated to mbufs982 requests for mbufs denied0 calls to protocol drain routines
Kernel malloc statistics:By size inuse calls failed free hiwat freed32 301 2787 0 211 640 064 41 318 0 23 320 0128 117 1814 0 43 160 0256 138 6391162 0 22 384 0512 20 1112 0 20 40 01024 2 77 0 2 20 02048 0 33 0 2 10 04096 97 338610 982 11 120 016384 1 1 0 12 24 7
An extract of the output for both times is shown in the preceding exhibits.
Using the netstat outputs, which of the following conclusions is most appropriate to draw?
A. The number of biod(s) should be increased.
B. The number of nfsd(s) should be increased.
C. The machine needs more physical memory.
D. The machine needs more memory allocated for mbufs.
Chapter 5. Network performance tools 173
6. There is a TCP/IP application that receives files from a remote machine. The application reads 32 kilobytes of data at a time to the socket, but has not issued a system call to set the window size. Which of the following procedures should be performed on the local machine to increase the throughput of the application?
A. Increase the size of thewall.
B. Increase the size of sb_max.
C. Increase the size of tcp_recvspace.
D. Increase the size of tcp_sendspace.
7. Which of the following tools should be used to determine network latency or delay?
A. arp
B. netstat
C. ifconfig
D. traceroute
5.9.1 AnswersThe following are the preferred answers to the questions provided in this section.
1. C
2. A
3. D
4. A
5. D
6. C
7. D
5.10 Exercises
The following exercises provide sample topics for self study. They will help ensure comprehension of this chapter.
1. Capture data from a telnet session using the tcpdump command.
2. Capture data from a telnet session using the iptrace command.
3. Compare outputs from previously captured sessions.
174 IBM Certification Study Guide AIX Performance and System Tuning

4. Using the no command, check current values of kernel variables.
5. Check protocol statistics using the netstat command using the -p flag.
Chapter 5. Network performance tools 175

176 IBM Certification Study Guide AIX Performance and System Tuning
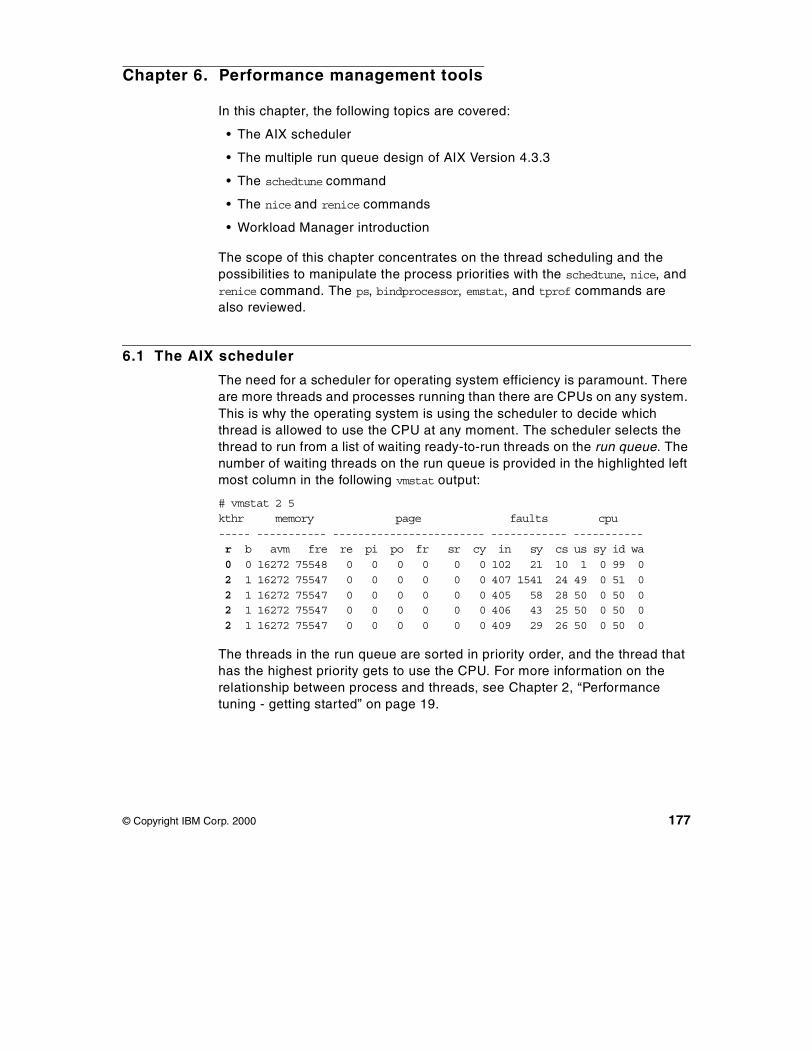
Chapter 6. Performance management tools
In this chapter, the following topics are covered:
• The AIX scheduler
• The multiple run queue design of AIX Version 4.3.3
• The schedtune command
• The nice and renice commands
• Workload Manager introduction
The scope of this chapter concentrates on the thread scheduling and the possibilities to manipulate the process priorities with the schedtune, nice, and renice command. The ps, bindprocessor, emstat, and tprof commands are also reviewed.
6.1 The AIX scheduler
The need for a scheduler for operating system efficiency is paramount. There are more threads and processes running than there are CPUs on any system. This is why the operating system is using the scheduler to decide which thread is allowed to use the CPU at any moment. The scheduler selects the thread to run from a list of waiting ready-to-run threads on the run queue. The number of waiting threads on the run queue is provided in the highlighted left most column in the following vmstat output:
# vmstat 2 5kthr memory page faults cpu----- ----------- ------------------------ ------------ -----------r b avm fre re pi po fr sr cy in sy cs us sy id wa0 0 16272 75548 0 0 0 0 0 0 102 21 10 1 0 99 02 1 16272 75547 0 0 0 0 0 0 407 1541 24 49 0 51 02 1 16272 75547 0 0 0 0 0 0 405 58 28 50 0 50 02 1 16272 75547 0 0 0 0 0 0 406 43 25 50 0 50 02 1 16272 75547 0 0 0 0 0 0 409 29 26 50 0 50 0
The threads in the run queue are sorted in priority order, and the thread that has the highest priority gets to use the CPU. For more information on the relationship between process and threads, see Chapter 2, “Performance tuning - getting started” on page 19.
© Copyright IBM Corp. 2000 177
In AIX Version 4, the five possible values for the thread scheduling policy are as follows:
SCHED_FIFO
This is a non-preemptive scheduling scheme. After a thread with this policy is scheduled, it runs to completion unless it is blocked, it voluntarily yields control of the CPU, or a higher-priority thread becomes dispatchable. Only fixed-priority threads can have a SCHED_FIFO scheduling policy.
SCHED_RR
The thread has a fixed priority. When a SCHED_RR thread has control at the end of the time slice, it moves to the tail of the queue of dispatchable threads of its priority. Only fixed-priority threads can have a SCHED_RR scheduling policy.
SCHED_OTHER
This policy is defined by POSIX Standard 1003.4a as implementation-defined. In AIX Version 4, this policy is defined to be equivalent to SCHED_RR, except that it applies to threads with nonfixed priority. The recalculation of the running thread's priority at each clock interrupt means that a thread may lose control because its priority has risen above that of another dispatchable thread.
SCHED_FIFO2
This policy is the same as for SCHED_OTHER, except that it allows a thread which has slept for only a short amount of time to be put at the head of its run queue when it is awakened. This policy is only available on AIX Version 4.3.3 or later.
SCHED_FIFO3
A thread whose scheduling policy is set to SCHED_FIFO3 is always put at the head of a run queue. To prevent a thread belonging to the SCHED_FIFO2 scheduling policy from being put ahead of SCHED_FIFO3, the run queue parameters are changed when a SCHED_FIFO3 thread is enqueued, so that no thread belonging to SCHED_FIFO2 will join the head of the run queue. This policy is only available on AIX Version 4.3.3 or later.
178 IBM Certification Study Guide AIX Performance and System Tuning
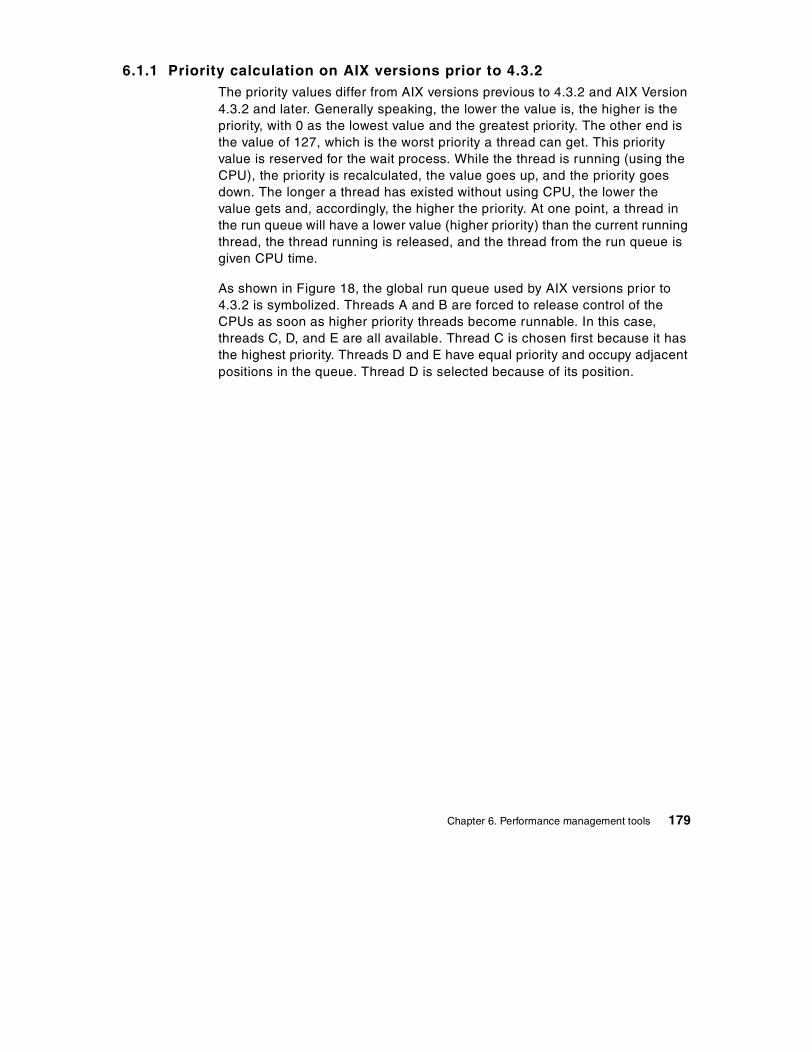
6.1.1 Priority calculation on AIX versions prior to 4.3.2The priority values differ from AIX versions previous to 4.3.2 and AIX Version 4.3.2 and later. Generally speaking, the lower the value is, the higher is the priority, with 0 as the lowest value and the greatest priority. The other end is the value of 127, which is the worst priority a thread can get. This priority value is reserved for the wait process. While the thread is running (using the CPU), the priority is recalculated, the value goes up, and the priority goes down. The longer a thread has existed without using CPU, the lower the value gets and, accordingly, the higher the priority. At one point, a thread in the run queue will have a lower value (higher priority) than the current running thread, the thread running is released, and the thread from the run queue is given CPU time.
As shown in Figure 18, the global run queue used by AIX versions prior to 4.3.2 is symbolized. Threads A and B are forced to release control of the CPUs as soon as higher priority threads become runnable. In this case, threads C, D, and E are all available. Thread C is chosen first because it has the highest priority. Threads D and E have equal priority and occupy adjacent positions in the queue. Thread D is selected because of its position.
Chapter 6. Performance management tools 179
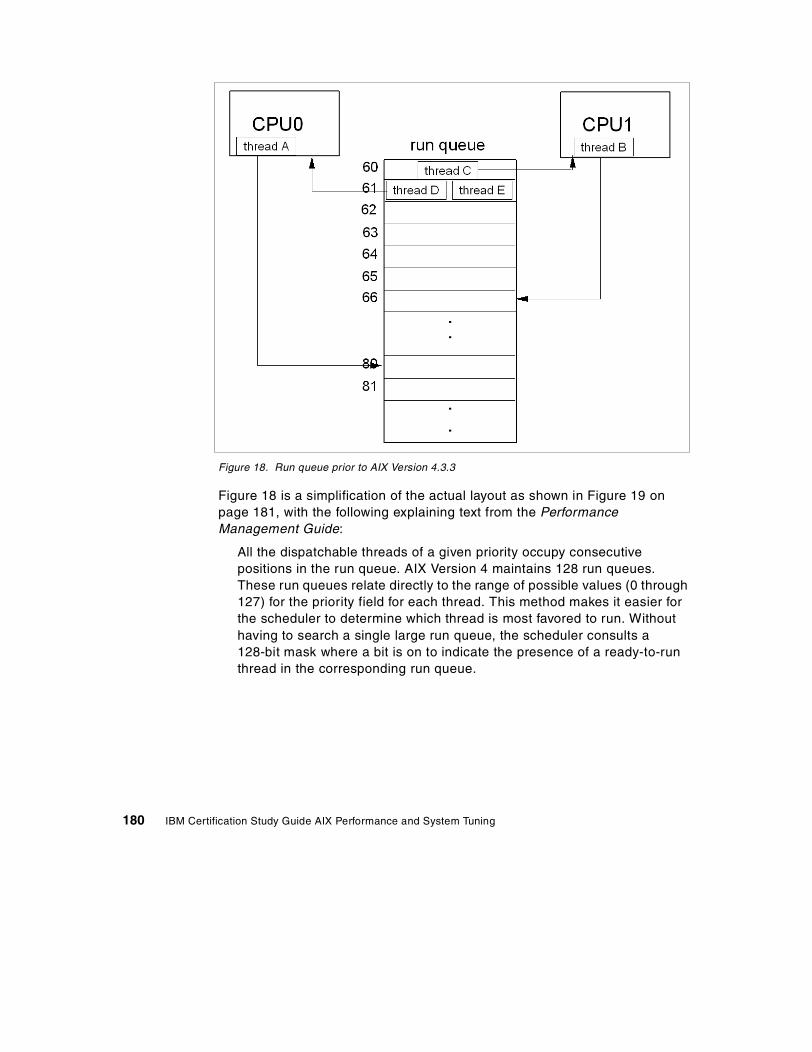
Figure 18. Run queue prior to AIX Version 4.3.3
Figure 18 is a simplification of the actual layout as shown in Figure 19 on page 181, with the following explaining text from the Performance Management Guide:
All the dispatchable threads of a given priority occupy consecutive positions in the run queue. AIX Version 4 maintains 128 run queues. These run queues relate directly to the range of possible values (0 through 127) for the priority field for each thread. This method makes it easier for the scheduler to determine which thread is most favored to run. Without having to search a single large run queue, the scheduler consults a 128-bit mask where a bit is on to indicate the presence of a ready-to-run thread in the corresponding run queue.
180 IBM Certification Study Guide AIX Performance and System Tuning
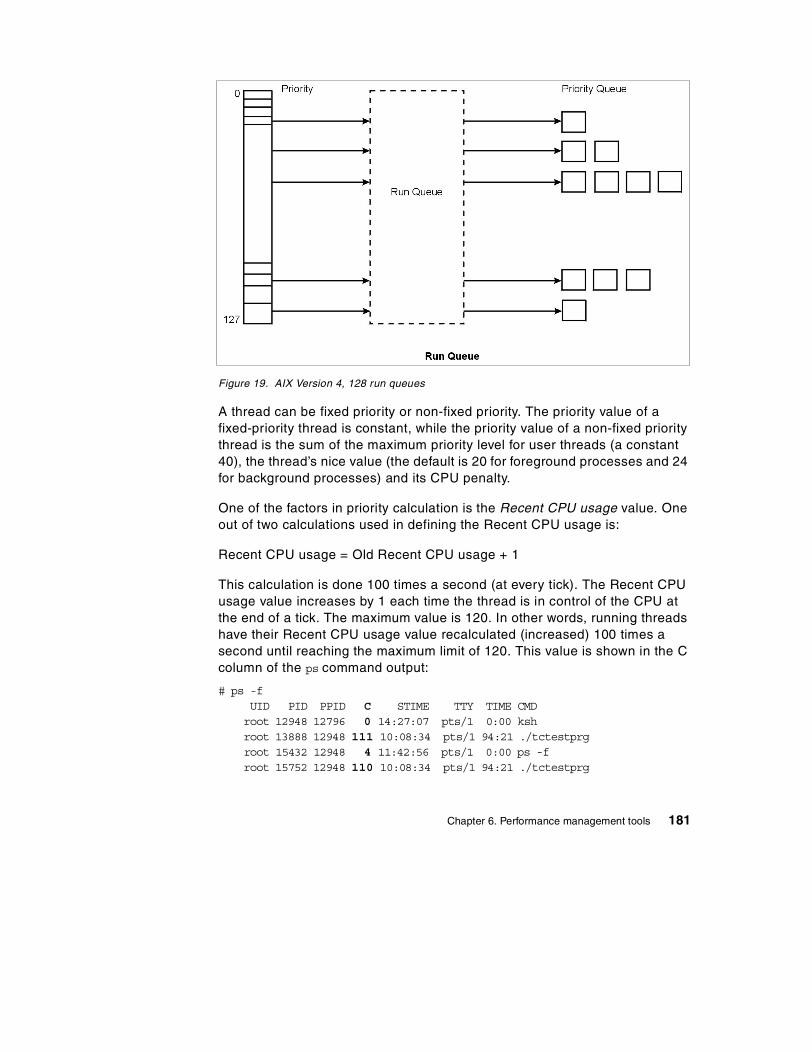
Figure 19. AIX Version 4, 128 run queues
A thread can be fixed priority or non-fixed priority. The priority value of a fixed-priority thread is constant, while the priority value of a non-fixed priority thread is the sum of the maximum priority level for user threads (a constant 40), the thread’s nice value (the default is 20 for foreground processes and 24 for background processes) and its CPU penalty.
One of the factors in priority calculation is the Recent CPU usage value. One out of two calculations used in defining the Recent CPU usage is:
Recent CPU usage = Old Recent CPU usage + 1
This calculation is done 100 times a second (at every tick). The Recent CPU usage value increases by 1 each time the thread is in control of the CPU at the end of a tick. The maximum value is 120. In other words, running threads have their Recent CPU usage value recalculated (increased) 100 times a second until reaching the maximum limit of 120. This value is shown in the C column of the ps command output:
# ps -fUID PID PPID C STIME TTY TIME CMDroot 12948 12796 0 14:27:07 pts/1 0:00 kshroot 13888 12948 111 10:08:34 pts/1 94:21 ./tctestprgroot 15432 12948 4 11:42:56 pts/1 0:00 ps -froot 15752 12948 110 10:08:34 pts/1 94:21 ./tctestprg
Chapter 6. Performance management tools 181
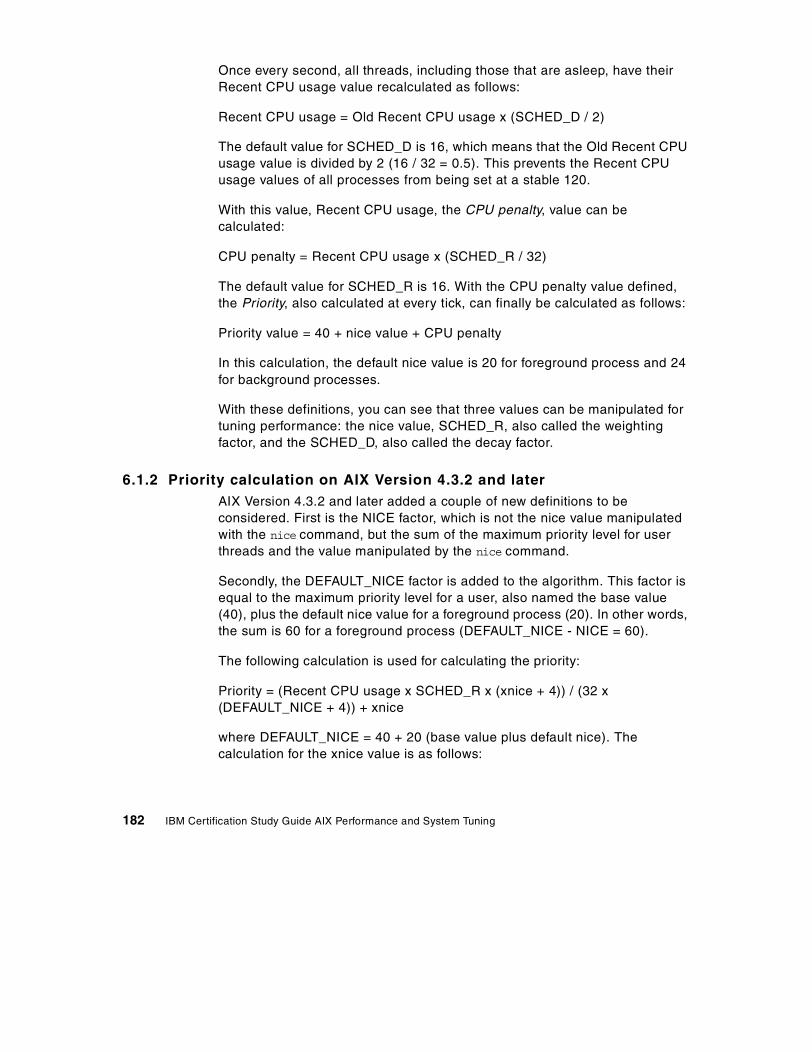
Once every second, all threads, including those that are asleep, have their Recent CPU usage value recalculated as follows:
Recent CPU usage = Old Recent CPU usage x (SCHED_D / 2)
The default value for SCHED_D is 16, which means that the Old Recent CPU usage value is divided by 2 (16 / 32 = 0.5). This prevents the Recent CPU usage values of all processes from being set at a stable 120.
With this value, Recent CPU usage, the CPU penalty, value can be calculated:
CPU penalty = Recent CPU usage x (SCHED_R / 32)
The default value for SCHED_R is 16. With the CPU penalty value defined, the Priority, also calculated at every tick, can finally be calculated as follows:
Priority value = 40 + nice value + CPU penalty
In this calculation, the default nice value is 20 for foreground process and 24 for background processes.
With these definitions, you can see that three values can be manipulated for tuning performance: the nice value, SCHED_R, also called the weighting factor, and the SCHED_D, also called the decay factor.
6.1.2 Priority calculation on AIX Version 4.3.2 and laterAIX Version 4.3.2 and later added a couple of new definitions to be considered. First is the NICE factor, which is not the nice value manipulated with the nice command, but the sum of the maximum priority level for user threads and the value manipulated by the nice command.
Secondly, the DEFAULT_NICE factor is added to the algorithm. This factor is equal to the maximum priority level for a user, also named the base value (40), plus the default nice value for a foreground process (20). In other words, the sum is 60 for a foreground process (DEFAULT_NICE - NICE = 60).
The following calculation is used for calculating the priority:
Priority = (Recent CPU usage x SCHED_R x (xnice + 4)) / (32 x (DEFAULT_NICE + 4)) + xnice
where DEFAULT_NICE = 40 + 20 (base value plus default nice). The calculation for the xnice value is as follows:
182 IBM Certification Study Guide AIX Performance and System Tuning

xnice = (NICE > DEFAULT_NICE) ? (2 * nice) - 60 : NICE
This means that if nice is smaller or equal to DEFAULT_NICE, then:
xnice = NICE
But if NICE is greater than DEFAULT_NICE, in other words, if you have manipulated the thread with the nice command to lessen its priority, then:
xnice = (2 x NICE) - 60
The nice value has a much greater impact on the priority of a thread. It is now included in the calculation as a multiple of the recent CPU usage, in addition to its use as a constant factor. To get greater granularity in the run queue(s), the DEFAULT_NICE is set to 60. Some artificial values will help show the calculation.
Recent CPU usage = 64SCHED_R = 16NICE = 64
Starting with the XNICE calculation:
xnice = (NICE > DEFAULT_NICE) ? (2 * NICE) - 60 : nice
Because NICE is greater then DEFAULT_NICE, then:
xnice = (2 x 64) - 60 = 68
By entering the values given and the XNICE value in the calculation:
Priority = (Recent CPU usage x SCHED_R x (xnice + 4)) / (32 x (DEFAULT_NICE+ 4)) + xnice
The calculation will look as follows:
P = (64 x 16 x (68 + 4)) / (32 x 64) + xniceP = (73728 / 2048) + 64P = 100
You still have three values to manipulate. The nice value (as in the example), SCHED_R, and SCHED_D (for recent CPU usage). In the following sections, the multiple run queue layout and the commands that are used to change these values are discussed.
Chapter 6. Performance management tools 183
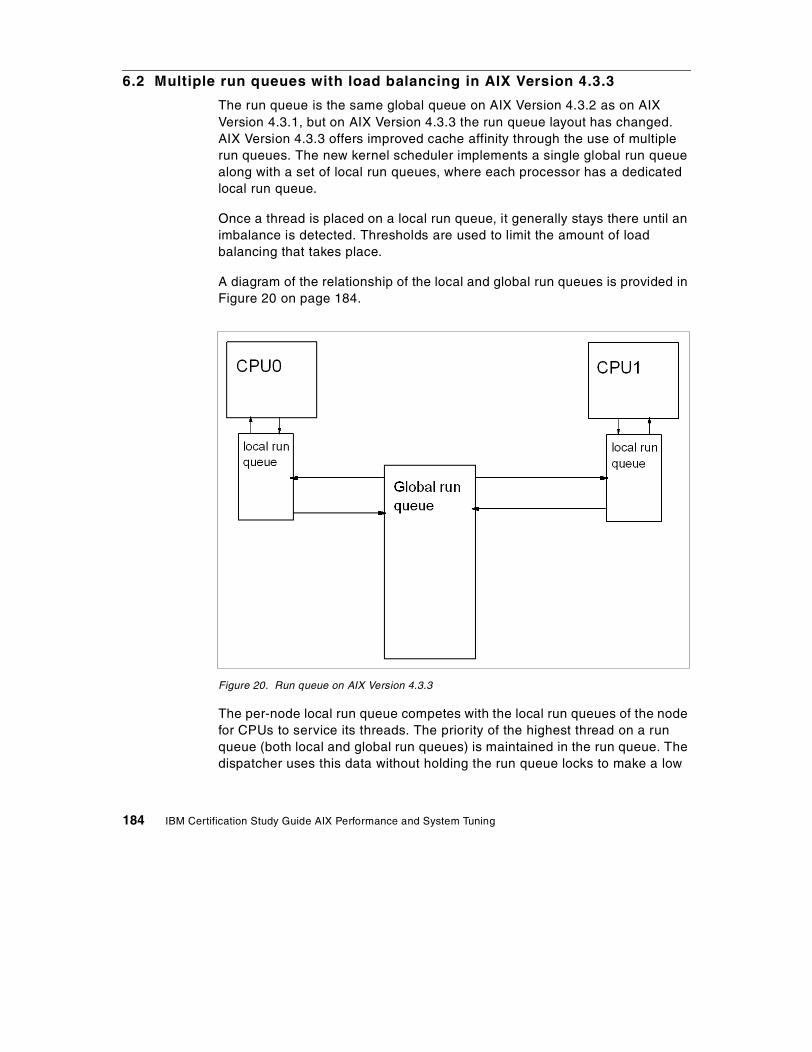
6.2 Multiple run queues with load balancing in AIX Version 4.3.3
The run queue is the same global queue on AIX Version 4.3.2 as on AIX Version 4.3.1, but on AIX Version 4.3.3 the run queue layout has changed. AIX Version 4.3.3 offers improved cache affinity through the use of multiple run queues. The new kernel scheduler implements a single global run queue along with a set of local run queues, where each processor has a dedicated local run queue.
Once a thread is placed on a local run queue, it generally stays there until an imbalance is detected. Thresholds are used to limit the amount of load balancing that takes place.
A diagram of the relationship of the local and global run queues is provided in Figure 20 on page 184.
Figure 20. Run queue on AIX Version 4.3.3
The per-node local run queue competes with the local run queues of the node for CPUs to service its threads. The priority of the highest thread on a run queue (both local and global run queues) is maintained in the run queue. The dispatcher uses this data without holding the run queue locks to make a low
184 IBM Certification Study Guide AIX Performance and System Tuning
overhead decision of which run queue to search. This mechanism allows the priorities of the two run queues to be honored most of the time. When both run queues have threads waiting at the same priority, the local run queue is chosen.
Usually, when initiated, threads get on the global run queue by means of the load balancing mechanism implemented. Once a CPU dispatches a thread from the global run queue, it does not generally return to the global run queue, but rather to the queue served by the CPU dispatching it.
The load balancing is handled by a number of algorithms designed to keep the various run queues of a system approximately equally utilized. There are four balancing algorithms, which are discussed in the following sections.
6.2.1 Initial load balancingInitial load balancing applies to newly created threads. When an unbound new thread is created as part of a new process (as well as a new thread for an existing process), it is placed on an idle CPU (if one exists). If an idle CPU cannot be found, the thread will be placed on the global queue.
6.2.2 Idle load balancingIdle load balancing applies when a process would otherwise go idle, running the waitproc thread (for example PID 516). When the dispatcher reaches this point in its logic, it does not just scan other run queues in an attempt to find work at any cost. It is actually beneficial to allow what appears to be unnecessary idle cycles rather than moving a thread and losing cache affinity. The steps taken by the idle load balancing method are:
• Before dispatching the waitproc, search other queues for available work. This is a stronger statement than work being on another queue. The search routine will look for a queue that:
- Contains the largest number of runnable threads.
- Contains more runnable threads than the current steal threshold.
- Contains at least one stealable (unbound) thread.
- Has not had steal_max threads already stolen from it over the current clock tick interval.
The search is done without holding those run queues’ locks
• To actually steal a thread, the chosen run queue’s lock must be obtained. This is done by a special call written to avoid interfering with another instance of the dispatcher. If no lock can be obtained, run the waitproc.
Chapter 6. Performance management tools 185
• After getting the lock, check that a stealable thread is still available. If there is no stealable thread, the waitproc is run.
• Change the threads run queue assignment and pointer.
6.2.3 Frequent periodic load balancingThis is performed every N clock ticks (at time of publication, 10). It attempts to balance the loads on the local queues of a node in much the same way that idle load balancing does. The idea is to move a thread from the most loaded to the least loaded run queue, but if the least loaded run queue has stolen a thread through idle load balancing in the last interval, nothing is done. The difference in load factors between the two run queues chosen for frequent periodic load balancing must be at least 1.5. Idle load balancing is less expensive, so the ideal situation is if frequent periodic load balancing does not have to interfere.
6.2.4 Infrequent periodic load balancingIf a thread has not received CPU time in the last N.5 (at time of publication 1.5) seconds, the thread is moved to the global run queue.
6.3 Scheduler performance management
AIX offers several ways to modify the default behavior of the scheduling system for threads and processes. This section describes the schedtue, nice, and renice commands.
6.3.1 The schedtune commandThe schedtune command allows you to specify the SCHED_R with the -r flag and the SCHED_D with the -d flag. When executing the schedtune command without flags, the current values will be shown:
# /usr/samples/kernel/schedtune
THRASH SUSP FORK SCHED-h -p -m -w -e -f -d -r -t -sSYS PROC MULTI WAIT GRACE TICKS SCHED_D SCHED_R TIMESLICE MAXSPIN0 4 2 1 2 10 16 16 1 16384
CLOCK-c
%usDELTA100
186 IBM Certification Study Guide AIX Performance and System Tuning
Tuning is accomplished through two flags of the schedtune command: -r and -d. Each flag specifies a parameter that is an integer from 0 through 32. The parameters are applied by multiplying the recent CPU usage value by the parameter value and then dividing by 32. The default SCHED_R and SCHED_D values are 16, as seen in the previous output. The following sections discuss different uses of the schedtune command.
6.3.1.1 Schedtune example oneThe following command will result in SCHED_R = 0 and SCHED_D = 0.5:
# /usr/samples/kernel/schedtune -r 0
This would mean that the CPU penalty was always 0, making priority absolute. No background process would get any CPU time unless there were no dispatchable foreground processes at all, as background processes in ksh are started with adding 4 to the nice value of the parent shell. The priority values of the threads would effectively be constant, although they would not technically be fixed-priority threads.
6.3.1.2 Schedtune example twoThe following command would result in an effective SCHED_R = 1 and SCHED_D = 1.
# /usr/samples/kernel/schedtune -r 32 -d 32
This would mean that long-running threads would reach a C value of 120 and remain there, contending on the basis of their nice values. New threads would have priority, regardless of their nice value, until they had accumulated enough time slices to bring them within the priority value range of the existing threads.
6.3.1.3 Schedtune example threeThe most likely reason to manipulate the values would be to make sure that background processes do not compete with foreground processes. By making SCHED_R smaller, you can restrict the range of possible priority values. For example:
# /usr/samples/kernel/schedtune -r 5
(SCHED_R = 0.15625, SCHED_D = 0.5) would mean that a foreground process would never have to compete with a background process started with the command nice -n 20. The limit of 120 CPU time slices accumulated would mean that the maximum CPU penalty for the foreground process would be 18. In Figure 21 on page 188, this relationship is graphically shown. Because the CPU penalty will get a maximum value of 18, the foreground process with
Chapter 6. Performance management tools 187
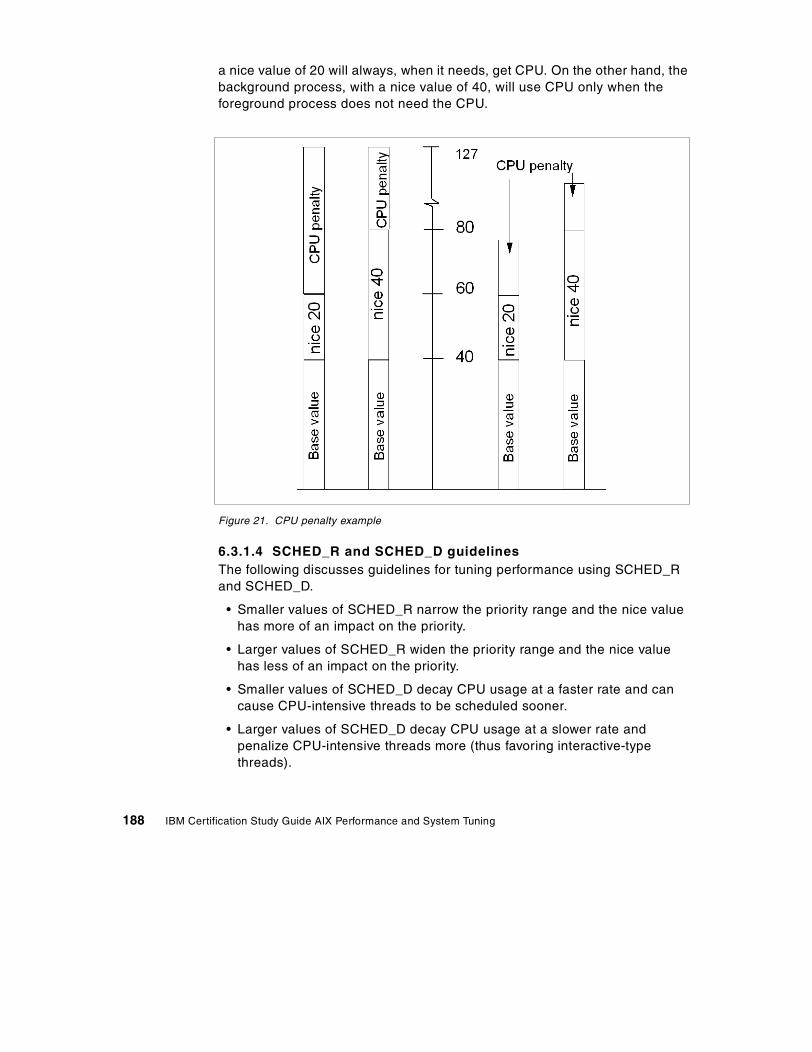
a nice value of 20 will always, when it needs, get CPU. On the other hand, the background process, with a nice value of 40, will use CPU only when the foreground process does not need the CPU.
Figure 21. CPU penalty example
6.3.1.4 SCHED_R and SCHED_D guidelinesThe following discusses guidelines for tuning performance using SCHED_R and SCHED_D.
• Smaller values of SCHED_R narrow the priority range and the nice value has more of an impact on the priority.
• Larger values of SCHED_R widen the priority range and the nice value has less of an impact on the priority.
• Smaller values of SCHED_D decay CPU usage at a faster rate and can cause CPU-intensive threads to be scheduled sooner.
• Larger values of SCHED_D decay CPU usage at a slower rate and penalize CPU-intensive threads more (thus favoring interactive-type threads).
188 IBM Certification Study Guide AIX Performance and System Tuning
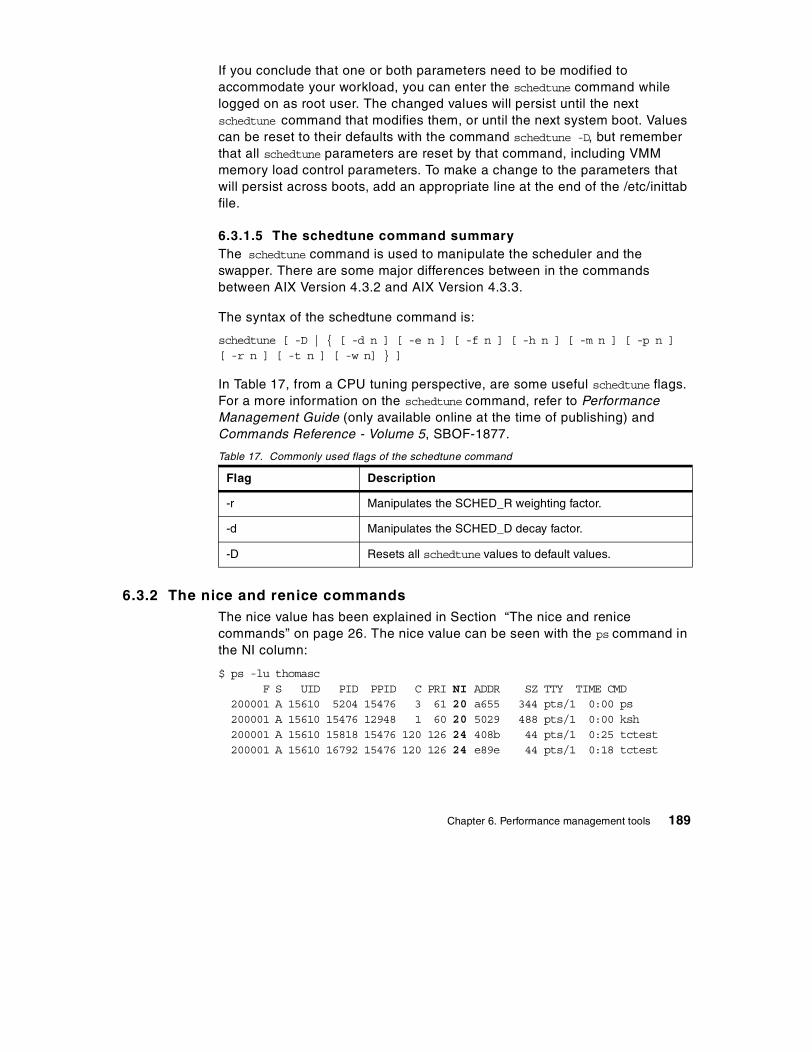
If you conclude that one or both parameters need to be modified to accommodate your workload, you can enter the schedtune command while logged on as root user. The changed values will persist until the next schedtune command that modifies them, or until the next system boot. Values can be reset to their defaults with the command schedtune -D, but remember that all schedtune parameters are reset by that command, including VMM memory load control parameters. To make a change to the parameters that will persist across boots, add an appropriate line at the end of the /etc/inittab file.
6.3.1.5 The schedtune command summaryThe schedtune command is used to manipulate the scheduler and the swapper. There are some major differences between in the commands between AIX Version 4.3.2 and AIX Version 4.3.3.
The syntax of the schedtune command is:
schedtune [ -D | { [ -d n ] [ -e n ] [ -f n ] [ -h n ] [ -m n ] [ -p n ][ -r n ] [ -t n ] [ -w n] } ]
In Table 17, from a CPU tuning perspective, are some useful schedtune flags. For a more information on the schedtune command, refer to Performance Management Guide (only available online at the time of publishing) and Commands Reference - Volume 5, SBOF-1877.
Table 17. Commonly used flags of the schedtune command
6.3.2 The nice and renice commandsThe nice value has been explained in Section “The nice and renice commands” on page 26. The nice value can be seen with the ps command in the NI column:
$ ps -lu thomascF S UID PID PPID C PRI NI ADDR SZ TTY TIME CMD
200001 A 15610 5204 15476 3 61 20 a655 344 pts/1 0:00 ps200001 A 15610 15476 12948 1 60 20 5029 488 pts/1 0:00 ksh200001 A 15610 15818 15476 120 126 24 408b 44 pts/1 0:25 tctest200001 A 15610 16792 15476 120 126 24 e89e 44 pts/1 0:18 tctest
Flag Description
-r Manipulates the SCHED_R weighting factor.
-d Manipulates the SCHED_D decay factor.
-D Resets all schedtune values to default values.
Chapter 6. Performance management tools 189
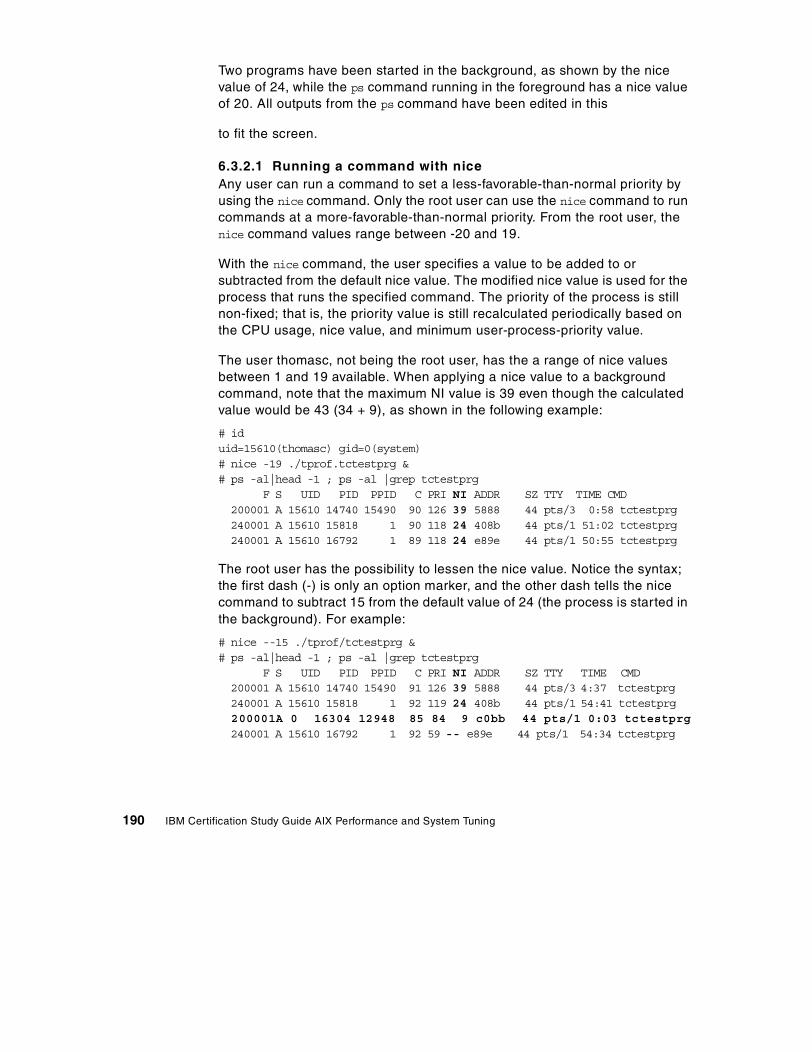
Two programs have been started in the background, as shown by the nice value of 24, while the ps command running in the foreground has a nice value of 20. All outputs from the ps command have been edited in this
to fit the screen.
6.3.2.1 Running a command with niceAny user can run a command to set a less-favorable-than-normal priority by using the nice command. Only the root user can use the nice command to run commands at a more-favorable-than-normal priority. From the root user, the nice command values range between -20 and 19.
With the nice command, the user specifies a value to be added to or subtracted from the default nice value. The modified nice value is used for the process that runs the specified command. The priority of the process is still non-fixed; that is, the priority value is still recalculated periodically based on the CPU usage, nice value, and minimum user-process-priority value.
The user thomasc, not being the root user, has the a range of nice values between 1 and 19 available. When applying a nice value to a background command, note that the maximum NI value is 39 even though the calculated value would be 43 (34 + 9), as shown in the following example:
# iduid=15610(thomasc) gid=0(system)# nice -19 ./tprof.tctestprg &# ps -al|head -1 ; ps -al |grep tctestprg
F S UID PID PPID C PRI NI ADDR SZ TTY TIME CMD200001 A 15610 14740 15490 90 126 39 5888 44 pts/3 0:58 tctestprg240001 A 15610 15818 1 90 118 24 408b 44 pts/1 51:02 tctestprg240001 A 15610 16792 1 89 118 24 e89e 44 pts/1 50:55 tctestprg
The root user has the possibility to lessen the nice value. Notice the syntax; the first dash (-) is only an option marker, and the other dash tells the nice command to subtract 15 from the default value of 24 (the process is started in the background). For example:
# nice --15 ./tprof/tctestprg &# ps -al|head -1 ; ps -al |grep tctestprg
F S UID PID PPID C PRI NI ADDR SZ TTY TIME CMD200001 A 15610 14740 15490 91 126 39 5888 44 pts/3 4:37 tctestprg240001 A 15610 15818 1 92 119 24 408b 44 pts/1 54:41 tctestprg200001A 0 16304 12948 85 84 9 c0bb 44 pts/1 0:03 tctestprg240001 A 15610 16792 1 92 59 -- e89e 44 pts/1 54:34 tctestprg
190 IBM Certification Study Guide AIX Performance and System Tuning
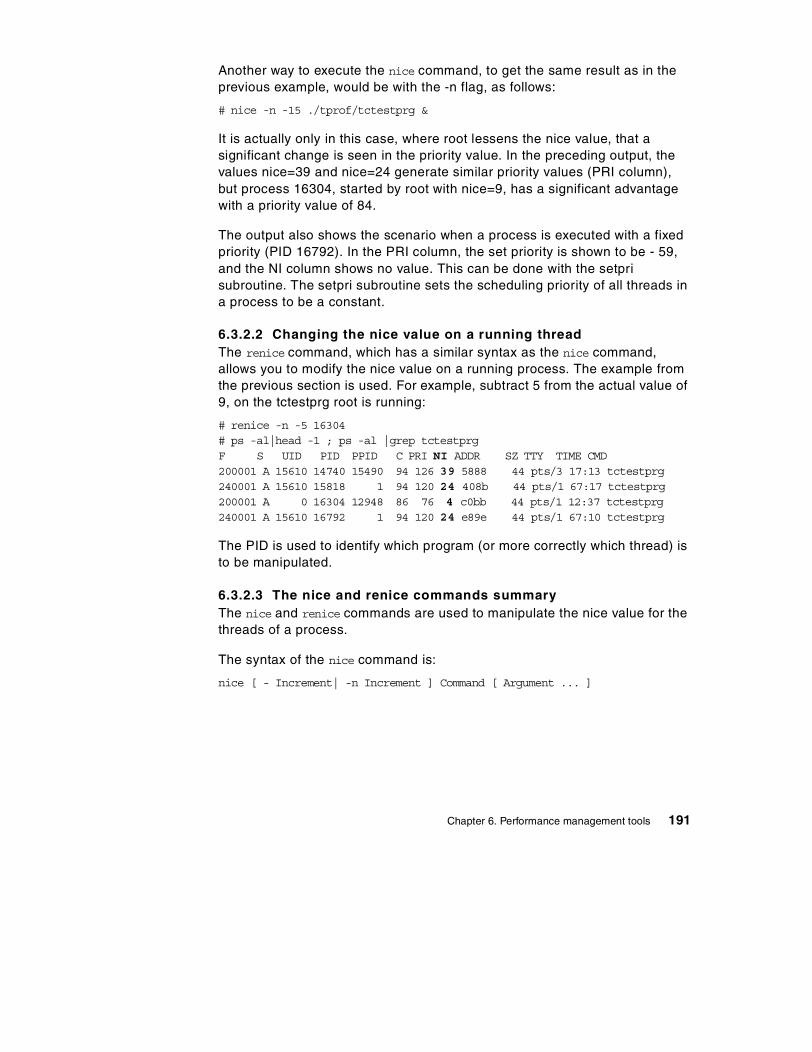
Another way to execute the nice command, to get the same result as in the previous example, would be with the -n flag, as follows:
# nice -n -15 ./tprof/tctestprg &
It is actually only in this case, where root lessens the nice value, that a significant change is seen in the priority value. In the preceding output, the values nice=39 and nice=24 generate similar priority values (PRI column), but process 16304, started by root with nice=9, has a significant advantage with a priority value of 84.
The output also shows the scenario when a process is executed with a fixed priority (PID 16792). In the PRI column, the set priority is shown to be - 59, and the NI column shows no value. This can be done with the setpri subroutine. The setpri subroutine sets the scheduling priority of all threads in a process to be a constant.
6.3.2.2 Changing the nice value on a running threadThe renice command, which has a similar syntax as the nice command, allows you to modify the nice value on a running process. The example from the previous section is used. For example, subtract 5 from the actual value of 9, on the tctestprg root is running:
# renice -n -5 16304# ps -al|head -1 ; ps -al |grep tctestprgF S UID PID PPID C PRI NI ADDR SZ TTY TIME CMD200001 A 15610 14740 15490 94 126 39 5888 44 pts/3 17:13 tctestprg240001 A 15610 15818 1 94 120 24 408b 44 pts/1 67:17 tctestprg200001 A 0 16304 12948 86 76 4 c0bb 44 pts/1 12:37 tctestprg240001 A 15610 16792 1 94 120 24 e89e 44 pts/1 67:10 tctestprg
The PID is used to identify which program (or more correctly which thread) is to be manipulated.
6.3.2.3 The nice and renice commands summaryThe nice and renice commands are used to manipulate the nice value for the threads of a process.
The syntax of the nice command is:
nice [ - Increment| -n Increment ] Command [ Argument ... ]
Chapter 6. Performance management tools 191
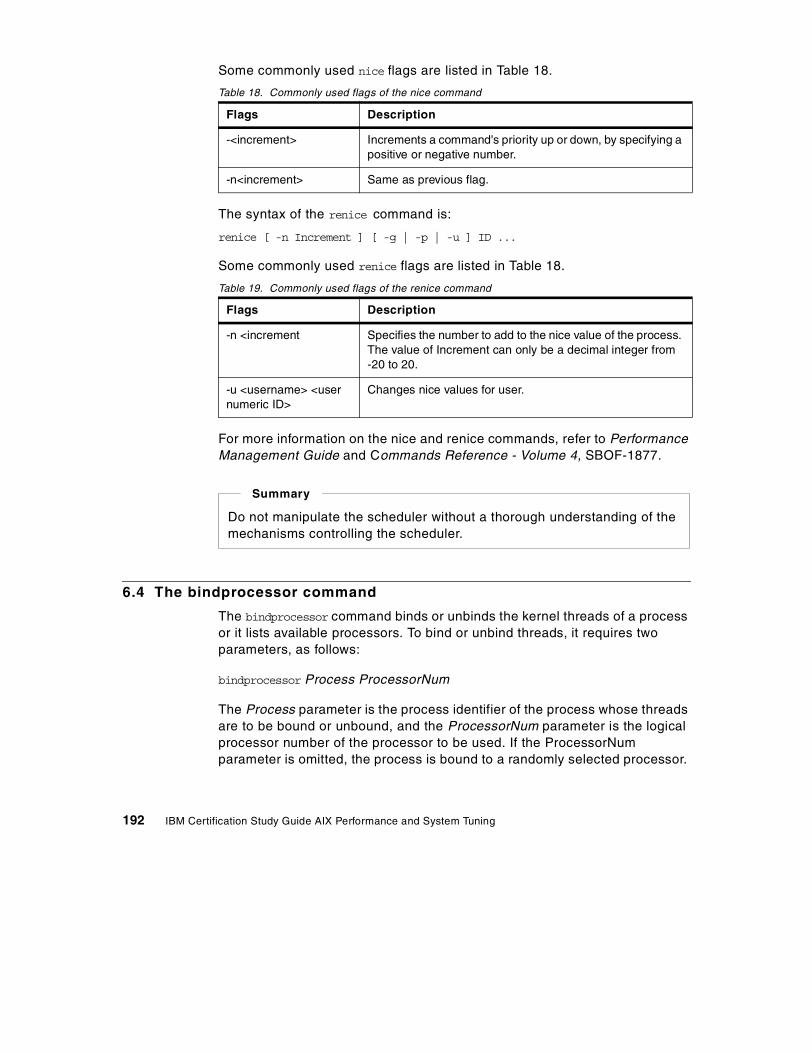
Some commonly used nice flags are listed in Table 18.
Table 18. Commonly used flags of the nice command
The syntax of the renice command is:
renice [ -n Increment ] [ -g | -p | -u ] ID ...
Some commonly used renice flags are listed in Table 18.
Table 19. Commonly used flags of the renice command
For more information on the nice and renice commands, refer to Performance Management Guide and Commands Reference - Volume 4, SBOF-1877.
6.4 The bindprocessor command
The bindprocessor command binds or unbinds the kernel threads of a process or it lists available processors. To bind or unbind threads, it requires two parameters, as follows:
bindprocessor Process ProcessorNum
The Process parameter is the process identifier of the process whose threads are to be bound or unbound, and the ProcessorNum parameter is the logical processor number of the processor to be used. If the ProcessorNum parameter is omitted, the process is bound to a randomly selected processor.
Flags Description
-<increment> Increments a command's priority up or down, by specifying a positive or negative number.
-n<increment> Same as previous flag.
Flags Description
-n <increment Specifies the number to add to the nice value of the process. The value of Increment can only be a decimal integer from -20 to 20.
-u <username> <user numeric ID>
Changes nice values for user.
Do not manipulate the scheduler without a thorough understanding of the mechanisms controlling the scheduler.
Summary
192 IBM Certification Study Guide AIX Performance and System Tuning
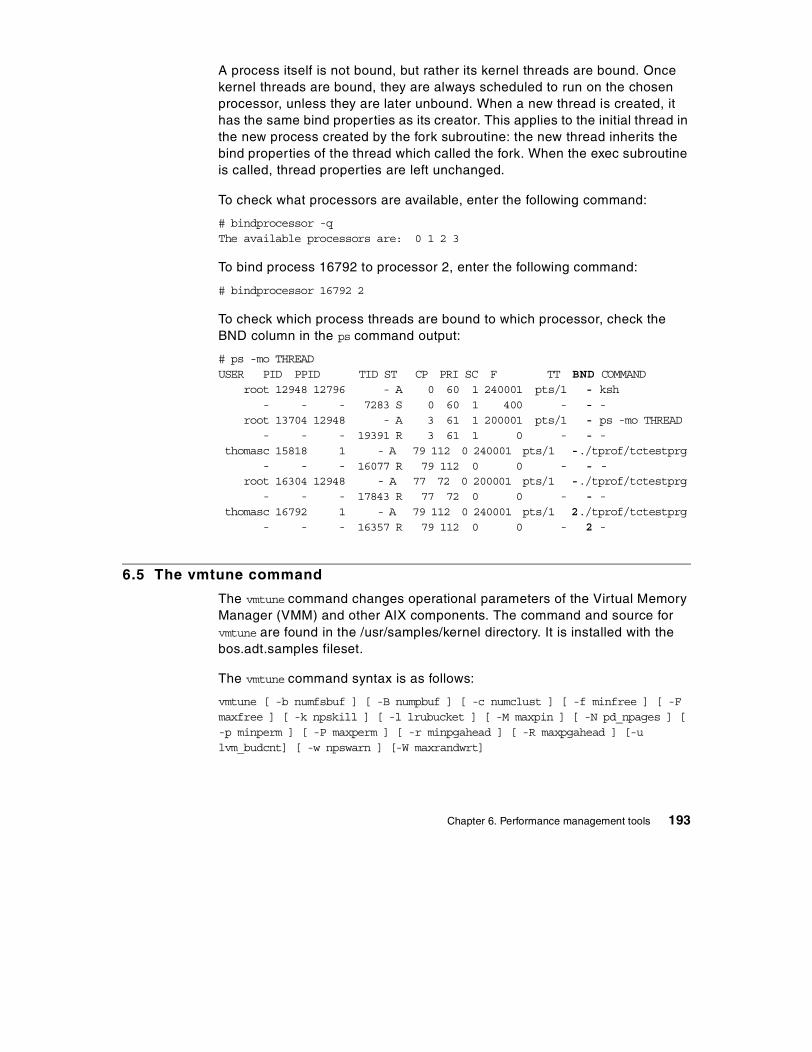
A process itself is not bound, but rather its kernel threads are bound. Once kernel threads are bound, they are always scheduled to run on the chosen processor, unless they are later unbound. When a new thread is created, it has the same bind properties as its creator. This applies to the initial thread in the new process created by the fork subroutine: the new thread inherits the bind properties of the thread which called the fork. When the exec subroutine is called, thread properties are left unchanged.
To check what processors are available, enter the following command:
# bindprocessor -qThe available processors are: 0 1 2 3
To bind process 16792 to processor 2, enter the following command:
# bindprocessor 16792 2
To check which process threads are bound to which processor, check the BND column in the ps command output:
# ps -mo THREADUSER PID PPID TID ST CP PRI SC F TT BND COMMAND
root 12948 12796 - A 0 60 1 240001 pts/1 - ksh- - - 7283 S 0 60 1 400 - - -
root 13704 12948 - A 3 61 1 200001 pts/1 - ps -mo THREAD- - - 19391 R 3 61 1 0 - - -
thomasc 15818 1 - A 79 112 0 240001 pts/1 -./tprof/tctestprg- - - 16077 R 79 112 0 0 - - -
root 16304 12948 - A 77 72 0 200001 pts/1 -./tprof/tctestprg- - - 17843 R 77 72 0 0 - - -
thomasc 16792 1 - A 79 112 0 240001 pts/1 2./tprof/tctestprg- - - 16357 R 79 112 0 0 - 2 -
6.5 The vmtune command
The vmtune command changes operational parameters of the Virtual Memory Manager (VMM) and other AIX components. The command and source for vmtune are found in the /usr/samples/kernel directory. It is installed with the bos.adt.samples fileset.
The vmtune command syntax is as follows:
vmtune [ -b numfsbuf ] [ -B numpbuf ] [ -c numclust ] [ -f minfree ] [ -Fmaxfree ] [ -k npskill ] [ -l lrubucket ] [ -M maxpin ] [ -N pd_npages ] [-p minperm ] [ -P maxperm ] [ -r minpgahead ] [ -R maxpgahead ] [-ulvm_budcnt] [ -w npswarn ] [-W maxrandwrt]
Chapter 6. Performance management tools 193
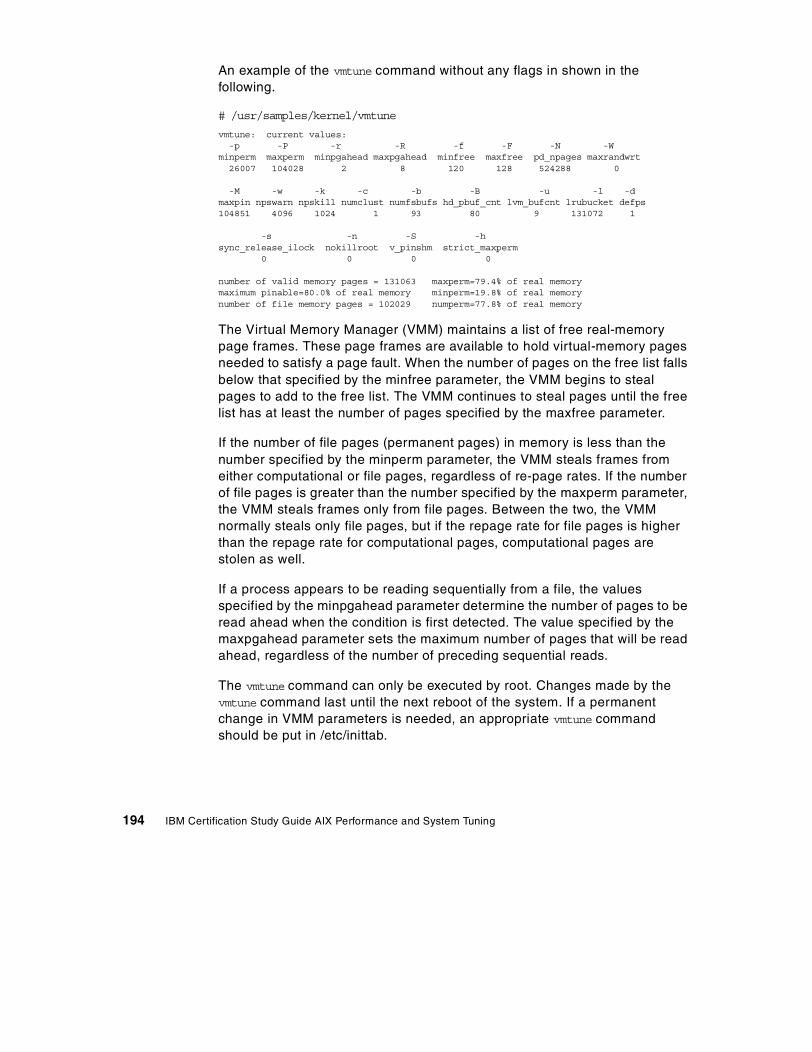
An example of the vmtune command without any flags in shown in the following.
# /usr/samples/kernel/vmtune
vmtune: current values:-p -P -r -R -f -F -N -W
minperm maxperm minpgahead maxpgahead minfree maxfree pd_npages maxrandwrt26007 104028 2 8 120 128 524288 0
-M -w -k -c -b -B -u -l -dmaxpin npswarn npskill numclust numfsbufs hd_pbuf_cnt lvm_bufcnt lrubucket defps104851 4096 1024 1 93 80 9 131072 1
-s -n -S -hsync_release_ilock nokillroot v_pinshm strict_maxperm
0 0 0 0
number of valid memory pages = 131063 maxperm=79.4% of real memorymaximum pinable=80.0% of real memory minperm=19.8% of real memorynumber of file memory pages = 102029 numperm=77.8% of real memory
The Virtual Memory Manager (VMM) maintains a list of free real-memory page frames. These page frames are available to hold virtual-memory pages needed to satisfy a page fault. When the number of pages on the free list falls below that specified by the minfree parameter, the VMM begins to steal pages to add to the free list. The VMM continues to steal pages until the free list has at least the number of pages specified by the maxfree parameter.
If the number of file pages (permanent pages) in memory is less than the number specified by the minperm parameter, the VMM steals frames from either computational or file pages, regardless of re-page rates. If the number of file pages is greater than the number specified by the maxperm parameter, the VMM steals frames only from file pages. Between the two, the VMM normally steals only file pages, but if the repage rate for file pages is higher than the repage rate for computational pages, computational pages are stolen as well.
If a process appears to be reading sequentially from a file, the values specified by the minpgahead parameter determine the number of pages to be read ahead when the condition is first detected. The value specified by the maxpgahead parameter sets the maximum number of pages that will be read ahead, regardless of the number of preceding sequential reads.
The vmtune command can only be executed by root. Changes made by the vmtune command last until the next reboot of the system. If a permanent change in VMM parameters is needed, an appropriate vmtune command should be put in /etc/inittab.
194 IBM Certification Study Guide AIX Performance and System Tuning
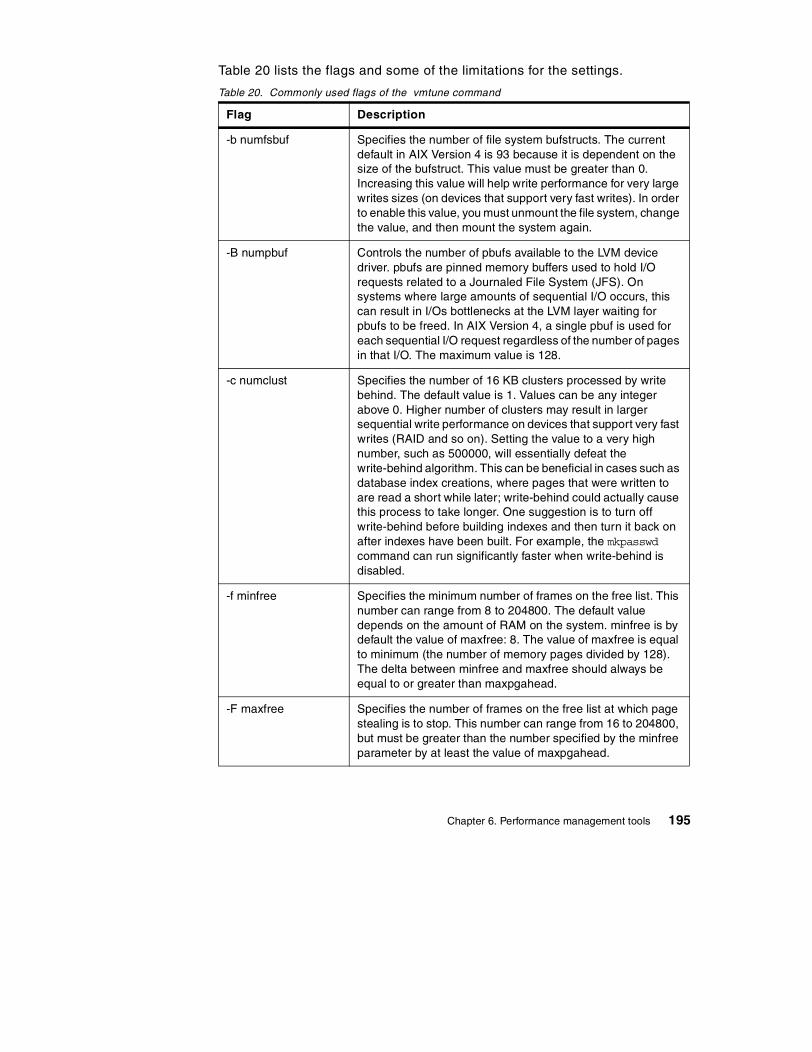
Table 20 lists the flags and some of the limitations for the settings.
Table 20. Commonly used flags of the vmtune command
Flag Description
-b numfsbuf Specifies the number of file system bufstructs. The current default in AIX Version 4 is 93 because it is dependent on the size of the bufstruct. This value must be greater than 0. Increasing this value will help write performance for very large writes sizes (on devices that support very fast writes). In order to enable this value, you must unmount the file system, change the value, and then mount the system again.
-B numpbuf Controls the number of pbufs available to the LVM device driver. pbufs are pinned memory buffers used to hold I/O requests related to a Journaled File System (JFS). On systems where large amounts of sequential I/O occurs, this can result in I/Os bottlenecks at the LVM layer waiting for pbufs to be freed. In AIX Version 4, a single pbuf is used for each sequential I/O request regardless of the number of pages in that I/O. The maximum value is 128.
-c numclust Specifies the number of 16 KB clusters processed by write behind. The default value is 1. Values can be any integer above 0. Higher number of clusters may result in larger sequential write performance on devices that support very fast writes (RAID and so on). Setting the value to a very high number, such as 500000, will essentially defeat the write-behind algorithm. This can be beneficial in cases such as database index creations, where pages that were written to are read a short while later; write-behind could actually cause this process to take longer. One suggestion is to turn off write-behind before building indexes and then turn it back on after indexes have been built. For example, the mkpasswd command can run significantly faster when write-behind is disabled.
-f minfree Specifies the minimum number of frames on the free list. This number can range from 8 to 204800. The default value depends on the amount of RAM on the system. minfree is by default the value of maxfree: 8. The value of maxfree is equal to minimum (the number of memory pages divided by 128). The delta between minfree and maxfree should always be equal to or greater than maxpgahead.
-F maxfree Specifies the number of frames on the free list at which page stealing is to stop. This number can range from 16 to 204800, but must be greater than the number specified by the minfree parameter by at least the value of maxpgahead.
Chapter 6. Performance management tools 195
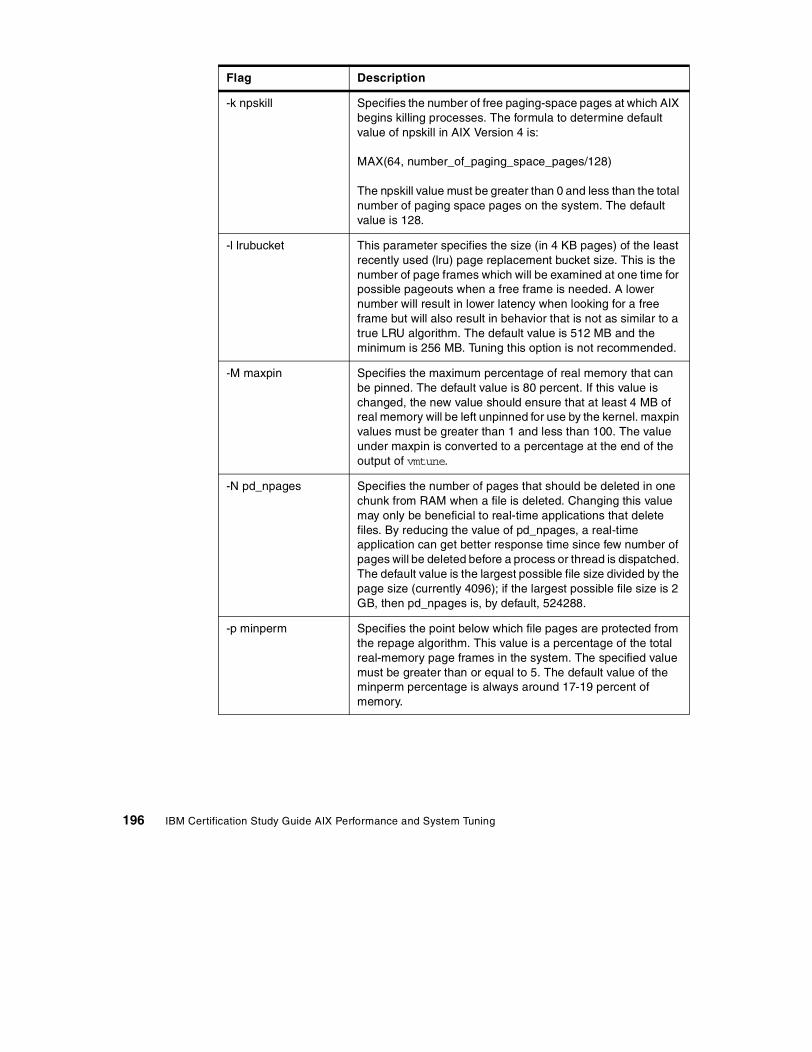
-k npskill Specifies the number of free paging-space pages at which AIX begins killing processes. The formula to determine default value of npskill in AIX Version 4 is:
MAX(64, number_of_paging_space_pages/128)
The npskill value must be greater than 0 and less than the total number of paging space pages on the system. The default value is 128.
-l lrubucket This parameter specifies the size (in 4 KB pages) of the least recently used (lru) page replacement bucket size. This is the number of page frames which will be examined at one time for possible pageouts when a free frame is needed. A lower number will result in lower latency when looking for a free frame but will also result in behavior that is not as similar to a true LRU algorithm. The default value is 512 MB and the minimum is 256 MB. Tuning this option is not recommended.
-M maxpin Specifies the maximum percentage of real memory that can be pinned. The default value is 80 percent. If this value is changed, the new value should ensure that at least 4 MB of real memory will be left unpinned for use by the kernel. maxpin values must be greater than 1 and less than 100. The value under maxpin is converted to a percentage at the end of the output of vmtune.
-N pd_npages Specifies the number of pages that should be deleted in one chunk from RAM when a file is deleted. Changing this value may only be beneficial to real-time applications that delete files. By reducing the value of pd_npages, a real-time application can get better response time since few number of pages will be deleted before a process or thread is dispatched. The default value is the largest possible file size divided by the page size (currently 4096); if the largest possible file size is 2 GB, then pd_npages is, by default, 524288.
-p minperm Specifies the point below which file pages are protected from the repage algorithm. This value is a percentage of the total real-memory page frames in the system. The specified value must be greater than or equal to 5. The default value of the minperm percentage is always around 17-19 percent of memory.
Flag Description
196 IBM Certification Study Guide AIX Performance and System Tuning
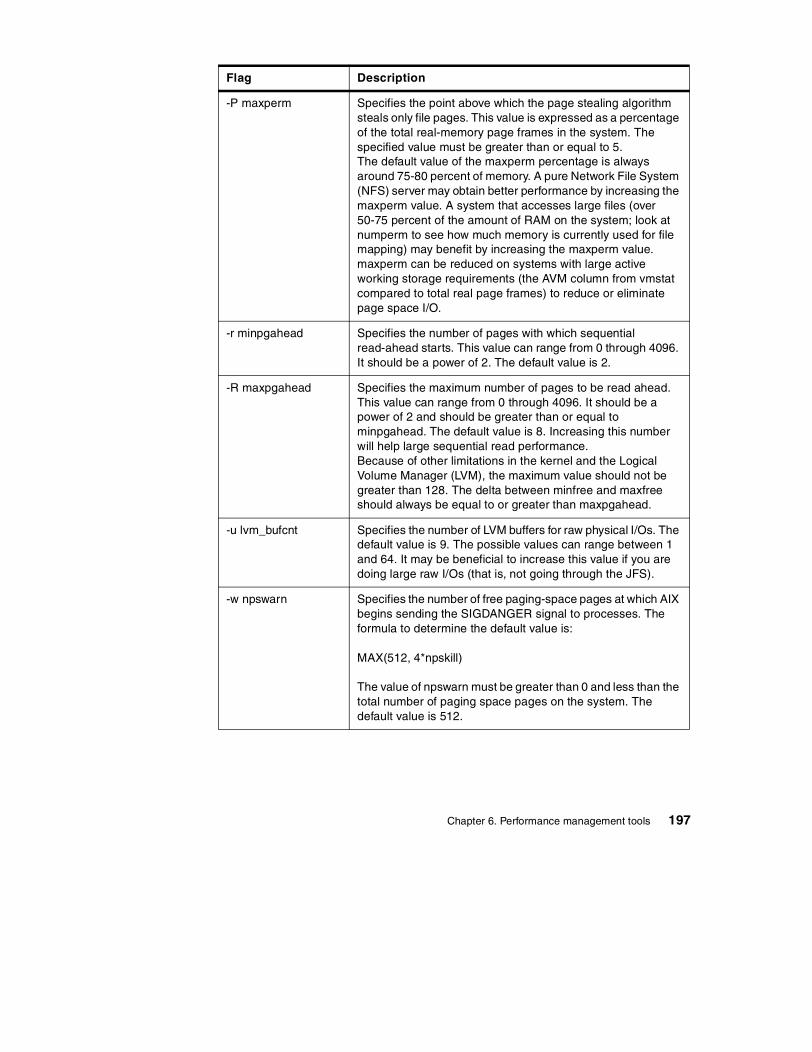
-P maxperm Specifies the point above which the page stealing algorithm steals only file pages. This value is expressed as a percentage of the total real-memory page frames in the system. The specified value must be greater than or equal to 5.The default value of the maxperm percentage is always around 75-80 percent of memory. A pure Network File System (NFS) server may obtain better performance by increasing the maxperm value. A system that accesses large files (over 50-75 percent of the amount of RAM on the system; look at numperm to see how much memory is currently used for file mapping) may benefit by increasing the maxperm value. maxperm can be reduced on systems with large active working storage requirements (the AVM column from vmstat compared to total real page frames) to reduce or eliminate page space I/O.
-r minpgahead Specifies the number of pages with which sequential read-ahead starts. This value can range from 0 through 4096. It should be a power of 2. The default value is 2.
-R maxpgahead Specifies the maximum number of pages to be read ahead. This value can range from 0 through 4096. It should be a power of 2 and should be greater than or equal to minpgahead. The default value is 8. Increasing this number will help large sequential read performance. Because of other limitations in the kernel and the Logical Volume Manager (LVM), the maximum value should not be greater than 128. The delta between minfree and maxfree should always be equal to or greater than maxpgahead.
-u lvm_bufcnt Specifies the number of LVM buffers for raw physical I/Os. The default value is 9. The possible values can range between 1 and 64. It may be beneficial to increase this value if you are doing large raw I/Os (that is, not going through the JFS).
-w npswarn Specifies the number of free paging-space pages at which AIX begins sending the SIGDANGER signal to processes. The formula to determine the default value is:
MAX(512, 4*npskill)
The value of npswarn must be greater than 0 and less than the total number of paging space pages on the system. The default value is 512.
Flag Description
Chapter 6. Performance management tools 197
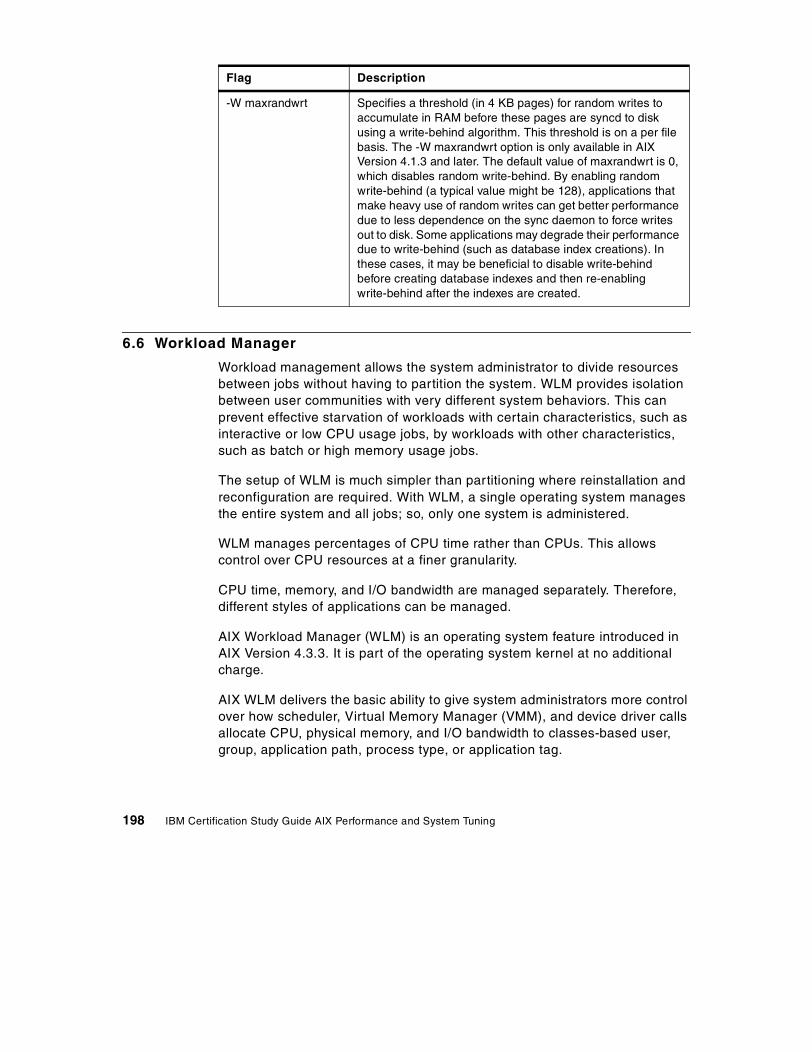
6.6 Workload Manager
Workload management allows the system administrator to divide resources between jobs without having to partition the system. WLM provides isolation between user communities with very different system behaviors. This can prevent effective starvation of workloads with certain characteristics, such as interactive or low CPU usage jobs, by workloads with other characteristics, such as batch or high memory usage jobs.
The setup of WLM is much simpler than partitioning where reinstallation and reconfiguration are required. With WLM, a single operating system manages the entire system and all jobs; so, only one system is administered.
WLM manages percentages of CPU time rather than CPUs. This allows control over CPU resources at a finer granularity.
CPU time, memory, and I/O bandwidth are managed separately. Therefore, different styles of applications can be managed.
AIX Workload Manager (WLM) is an operating system feature introduced in AIX Version 4.3.3. It is part of the operating system kernel at no additional charge.
AIX WLM delivers the basic ability to give system administrators more control over how scheduler, Virtual Memory Manager (VMM), and device driver calls allocate CPU, physical memory, and I/O bandwidth to classes-based user, group, application path, process type, or application tag.
-W maxrandwrt Specifies a threshold (in 4 KB pages) for random writes to accumulate in RAM before these pages are syncd to disk using a write-behind algorithm. This threshold is on a per file basis. The -W maxrandwrt option is only available in AIX Version 4.1.3 and later. The default value of maxrandwrt is 0, which disables random write-behind. By enabling random write-behind (a typical value might be 128), applications that make heavy use of random writes can get better performance due to less dependence on the sync daemon to force writes out to disk. Some applications may degrade their performance due to write-behind (such as database index creations). In these cases, it may be beneficial to disable write-behind before creating database indexes and then re-enabling write-behind after the indexes are created.
Flag Description
198 IBM Certification Study Guide AIX Performance and System Tuning
It allows a hierarchy of classes to be specified, processes to be automatically assigned to classes by the characteristics of a process, and manual assignment of processes to classes.
Classes can be superclasses or subclasses.
AIX WLM self-adjusts when there are no jobs in a class or when a class does not use all the resources that are allocated for it. The resources will automatically be distributed to other classes to match the policies of the system administrator.
Since the scheduling is done within a single AIX operating system, system management is less complex.
Unlike LPAR, workload management does not allow multiple operating systems that may be useful for testing and certification purposes on one hardware system.
For more information on Workload Manager, see AIX 5L AIX Workload Manager (WLM), SG24-5977.
6.7 Quiz
The following assessment questions help verify your understanding of the topics discussed in this chapter.
1. Which of the following should be implemented to balance available CPU/Memory resources between applications?
A. Loadleveler
B. Nice/Renice
C. Resource Manager
D. Workload Manager
2. A nice value for a process is shown as 80 in a ps listing. Which command is used to change this to a value of 100?
A. renice 100 PID
B. renice -n 20 PID
C. renice -20 PID
D. renice -n -100 PID
Chapter 6. Performance management tools 199
3. Which command changes operational parameters of the Virtual Memory Manager (VMM)?
A. nice
B. renice
C. schedtune
D. vmtune
6.7.1 AnswersThe following are the preferred answers to the questions provided in this section.
1. D
2. B
3. D
6.8 Exercise
The following exercises provide sample topics for self study. They will help ensure comprehension of this chapter.
1. Find a process with a recent high CPU usage value. Use the renice command to lessen its priority value. Follow the process CPU utilization. Restore the nice value.
2. On a test system, manipulate the SCHED_R value to prioritize foreground processes (for reference, see Figure 21 on page 188). Restore the default values.
200 IBM Certification Study Guide AIX Performance and System Tuning
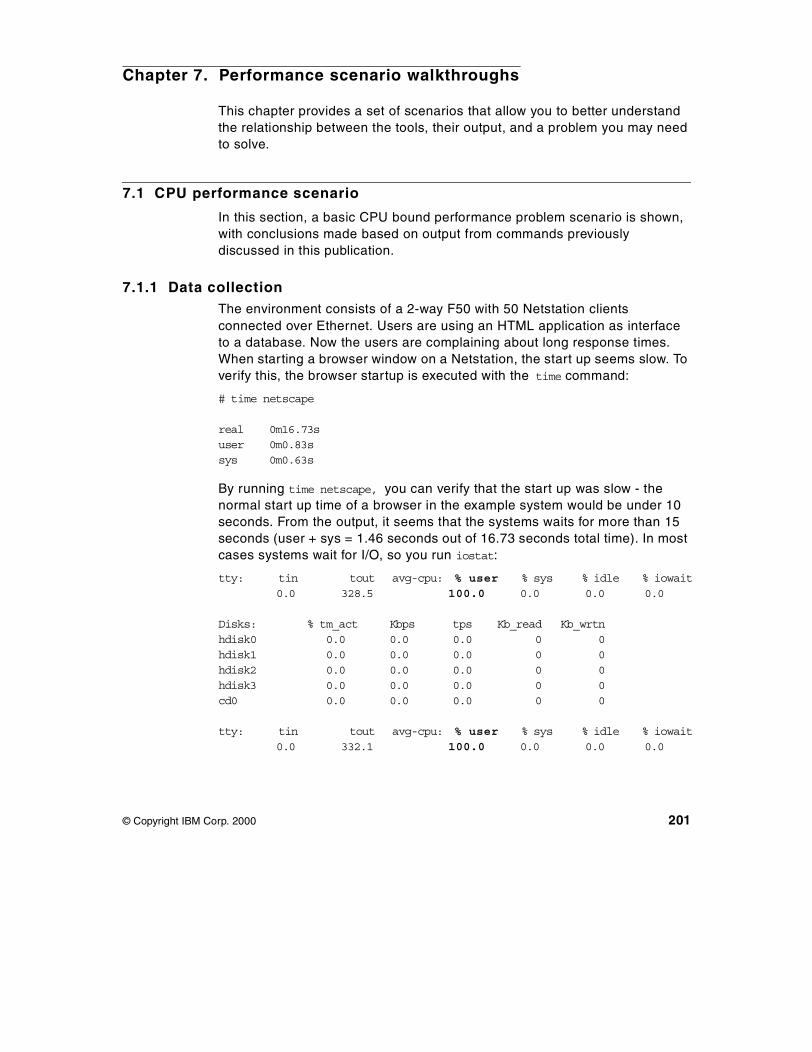
Chapter 7. Performance scenario walkthroughs
This chapter provides a set of scenarios that allow you to better understand the relationship between the tools, their output, and a problem you may need to solve.
7.1 CPU performance scenario
In this section, a basic CPU bound performance problem scenario is shown, with conclusions made based on output from commands previously discussed in this publication.
7.1.1 Data collectionThe environment consists of a 2-way F50 with 50 Netstation clients connected over Ethernet. Users are using an HTML application as interface to a database. Now the users are complaining about long response times. When starting a browser window on a Netstation, the start up seems slow. To verify this, the browser startup is executed with the time command:
# time netscape
real 0m16.73suser 0m0.83ssys 0m0.63s
By running time netscape, you can verify that the start up was slow - the normal start up time of a browser in the example system would be under 10 seconds. From the output, it seems that the systems waits for more than 15 seconds (user + sys = 1.46 seconds out of 16.73 seconds total time). In most cases systems wait for I/O, so you run iostat:
tty: tin tout avg-cpu: % user % sys % idle % iowait0.0 328.5 100.0 0.0 0.0 0.0
Disks: % tm_act Kbps tps Kb_read Kb_wrtnhdisk0 0.0 0.0 0.0 0 0hdisk1 0.0 0.0 0.0 0 0hdisk2 0.0 0.0 0.0 0 0hdisk3 0.0 0.0 0.0 0 0cd0 0.0 0.0 0.0 0 0
tty: tin tout avg-cpu: % user % sys % idle % iowait0.0 332.1 100.0 0.0 0.0 0.0
© Copyright IBM Corp. 2000 201
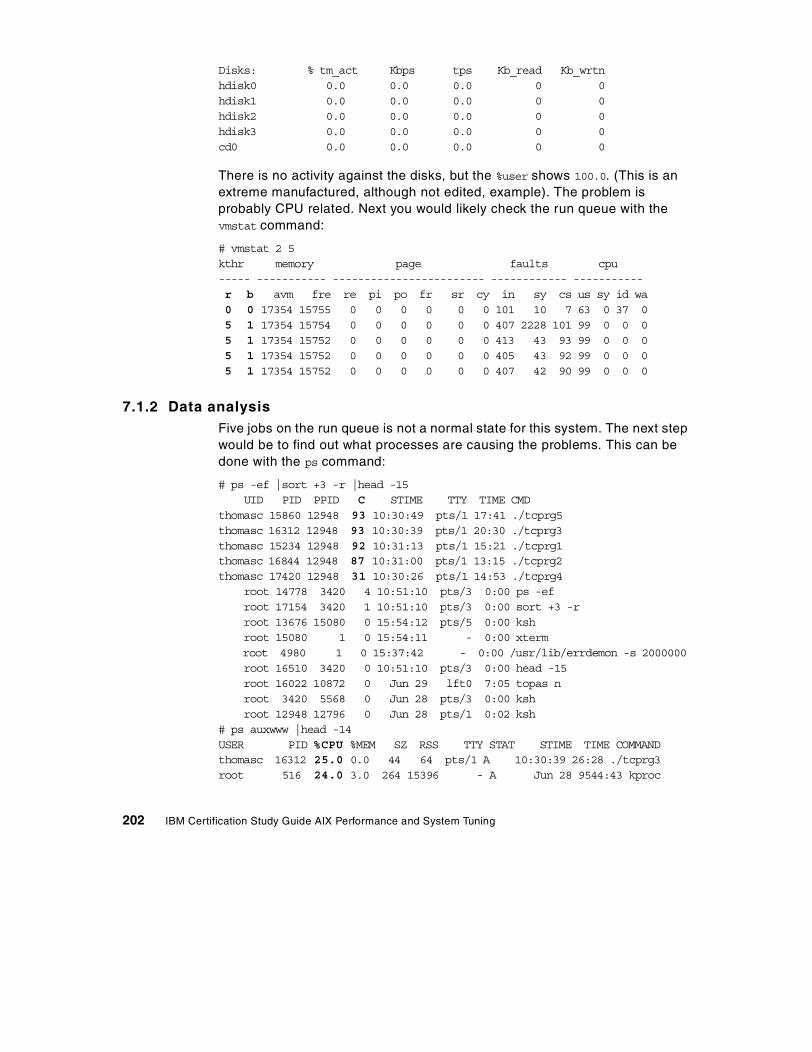
Disks: % tm_act Kbps tps Kb_read Kb_wrtnhdisk0 0.0 0.0 0.0 0 0hdisk1 0.0 0.0 0.0 0 0hdisk2 0.0 0.0 0.0 0 0hdisk3 0.0 0.0 0.0 0 0cd0 0.0 0.0 0.0 0 0
There is no activity against the disks, but the %user shows 100.0. (This is an extreme manufactured, although not edited, example). The problem is probably CPU related. Next you would likely check the run queue with the vmstat command:
# vmstat 2 5kthr memory page faults cpu----- ----------- ------------------------ ------------ -----------r b avm fre re pi po fr sr cy in sy cs us sy id wa0 0 17354 15755 0 0 0 0 0 0 101 10 7 63 0 37 05 1 17354 15754 0 0 0 0 0 0 407 2228 101 99 0 0 05 1 17354 15752 0 0 0 0 0 0 413 43 93 99 0 0 05 1 17354 15752 0 0 0 0 0 0 405 43 92 99 0 0 05 1 17354 15752 0 0 0 0 0 0 407 42 90 99 0 0 0
7.1.2 Data analysisFive jobs on the run queue is not a normal state for this system. The next step would be to find out what processes are causing the problems. This can be done with the ps command:
# ps -ef |sort +3 -r |head -15UID PID PPID C STIME TTY TIME CMD
thomasc 15860 12948 93 10:30:49 pts/1 17:41 ./tcprg5thomasc 16312 12948 93 10:30:39 pts/1 20:30 ./tcprg3thomasc 15234 12948 92 10:31:13 pts/1 15:21 ./tcprg1thomasc 16844 12948 87 10:31:00 pts/1 13:15 ./tcprg2thomasc 17420 12948 31 10:30:26 pts/1 14:53 ./tcprg4
root 14778 3420 4 10:51:10 pts/3 0:00 ps -efroot 17154 3420 1 10:51:10 pts/3 0:00 sort +3 -rroot 13676 15080 0 15:54:12 pts/5 0:00 kshroot 15080 1 0 15:54:11 - 0:00 xtermroot 4980 1 0 15:37:42 - 0:00 /usr/lib/errdemon -s 2000000root 16510 3420 0 10:51:10 pts/3 0:00 head -15root 16022 10872 0 Jun 29 lft0 7:05 topas nroot 3420 5568 0 Jun 28 pts/3 0:00 kshroot 12948 12796 0 Jun 28 pts/1 0:02 ksh
# ps auxwww |head -14USER PID %CPU %MEM SZ RSS TTY STAT STIME TIME COMMANDthomasc 16312 25.0 0.0 44 64 pts/1 A 10:30:39 26:28 ./tcprg3root 516 24.0 3.0 264 15396 - A Jun 28 9544:43 kproc
202 IBM Certification Study Guide AIX Performance and System Tuning
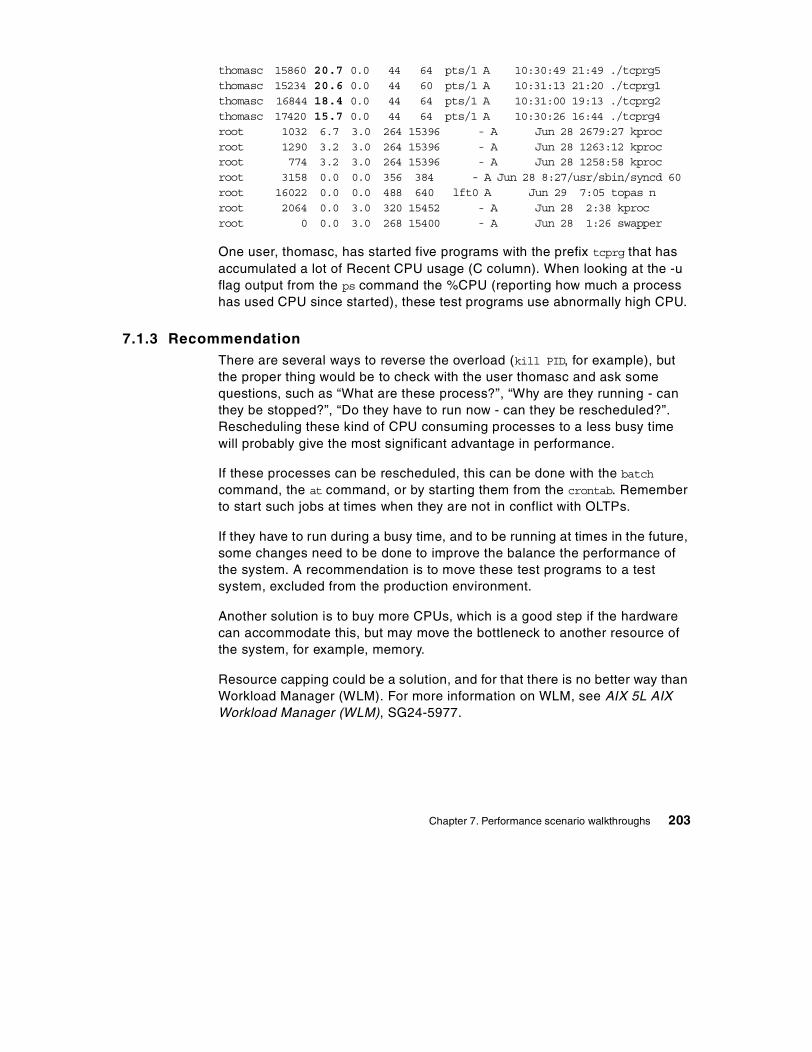
thomasc 15860 20.7 0.0 44 64 pts/1 A 10:30:49 21:49 ./tcprg5thomasc 15234 20.6 0.0 44 60 pts/1 A 10:31:13 21:20 ./tcprg1thomasc 16844 18.4 0.0 44 64 pts/1 A 10:31:00 19:13 ./tcprg2thomasc 17420 15.7 0.0 44 64 pts/1 A 10:30:26 16:44 ./tcprg4root 1032 6.7 3.0 264 15396 - A Jun 28 2679:27 kprocroot 1290 3.2 3.0 264 15396 - A Jun 28 1263:12 kprocroot 774 3.2 3.0 264 15396 - A Jun 28 1258:58 kprocroot 3158 0.0 0.0 356 384 - A Jun 28 8:27/usr/sbin/syncd 60root 16022 0.0 0.0 488 640 lft0 A Jun 29 7:05 topas nroot 2064 0.0 3.0 320 15452 - A Jun 28 2:38 kprocroot 0 0.0 3.0 268 15400 - A Jun 28 1:26 swapper
One user, thomasc, has started five programs with the prefix tcprg that has accumulated a lot of Recent CPU usage (C column). When looking at the -u flag output from the ps command the %CPU (reporting how much a process has used CPU since started), these test programs use abnormally high CPU.
7.1.3 RecommendationThere are several ways to reverse the overload (kill PID, for example), but the proper thing would be to check with the user thomasc and ask some questions, such as “What are these process?”, “Why are they running - can they be stopped?”, “Do they have to run now - can they be rescheduled?”. Rescheduling these kind of CPU consuming processes to a less busy time will probably give the most significant advantage in performance.
If these processes can be rescheduled, this can be done with the batch command, the at command, or by starting them from the crontab. Remember to start such jobs at times when they are not in conflict with OLTPs.
If they have to run during a busy time, and to be running at times in the future, some changes need to be done to improve the balance the performance of the system. A recommendation is to move these test programs to a test system, excluded from the production environment.
Another solution is to buy more CPUs, which is a good step if the hardware can accommodate this, but may move the bottleneck to another resource of the system, for example, memory.
Resource capping could be a solution, and for that there is no better way than Workload Manager (WLM). For more information on WLM, see AIX 5L AIX Workload Manager (WLM), SG24-5977.
Chapter 7. Performance scenario walkthroughs 203
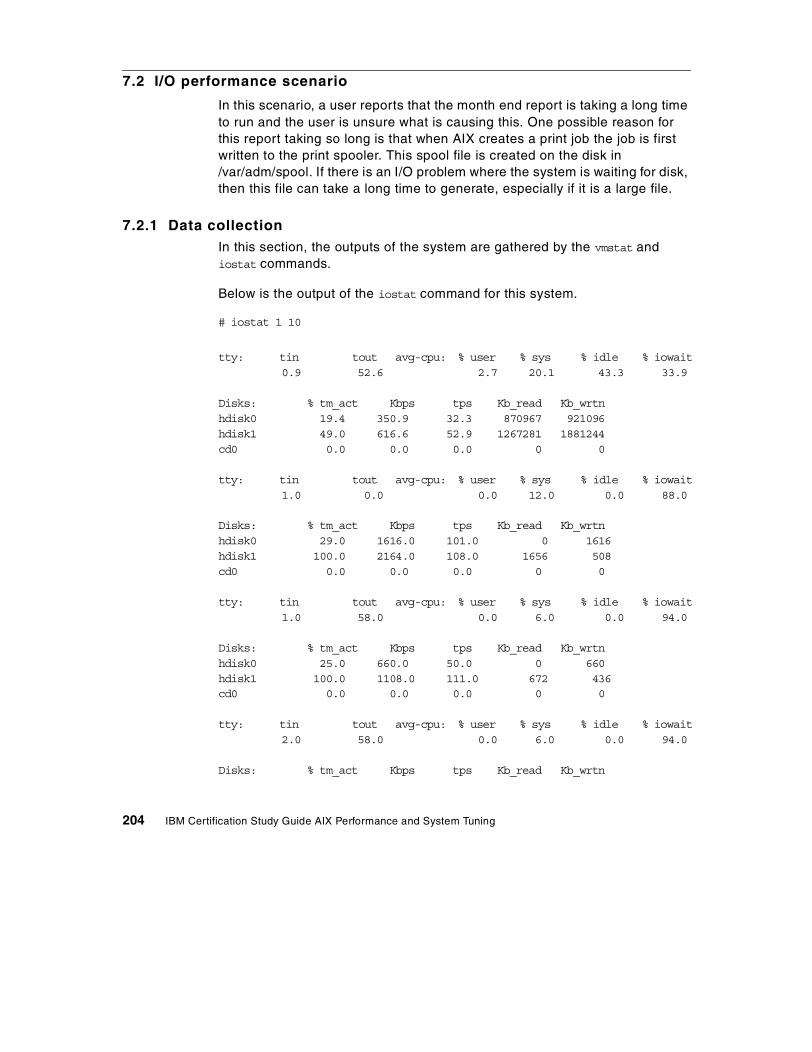
7.2 I/O performance scenario
In this scenario, a user reports that the month end report is taking a long time to run and the user is unsure what is causing this. One possible reason for this report taking so long is that when AIX creates a print job the job is first written to the print spooler. This spool file is created on the disk in /var/adm/spool. If there is an I/O problem where the system is waiting for disk, then this file can take a long time to generate, especially if it is a large file.
7.2.1 Data collectionIn this section, the outputs of the system are gathered by the vmstat and iostat commands.
Below is the output of the iostat command for this system.
# iostat 1 10
tty: tin tout avg-cpu: % user % sys % idle % iowait0.9 52.6 2.7 20.1 43.3 33.9
Disks: % tm_act Kbps tps Kb_read Kb_wrtnhdisk0 19.4 350.9 32.3 870967 921096hdisk1 49.0 616.6 52.9 1267281 1881244cd0 0.0 0.0 0.0 0 0
tty: tin tout avg-cpu: % user % sys % idle % iowait1.0 0.0 0.0 12.0 0.0 88.0
Disks: % tm_act Kbps tps Kb_read Kb_wrtnhdisk0 29.0 1616.0 101.0 0 1616hdisk1 100.0 2164.0 108.0 1656 508cd0 0.0 0.0 0.0 0 0
tty: tin tout avg-cpu: % user % sys % idle % iowait1.0 58.0 0.0 6.0 0.0 94.0
Disks: % tm_act Kbps tps Kb_read Kb_wrtnhdisk0 25.0 660.0 50.0 0 660hdisk1 100.0 1108.0 111.0 672 436cd0 0.0 0.0 0.0 0 0
tty: tin tout avg-cpu: % user % sys % idle % iowait2.0 58.0 0.0 6.0 0.0 94.0
Disks: % tm_act Kbps tps Kb_read Kb_wrtn
204 IBM Certification Study Guide AIX Performance and System Tuning
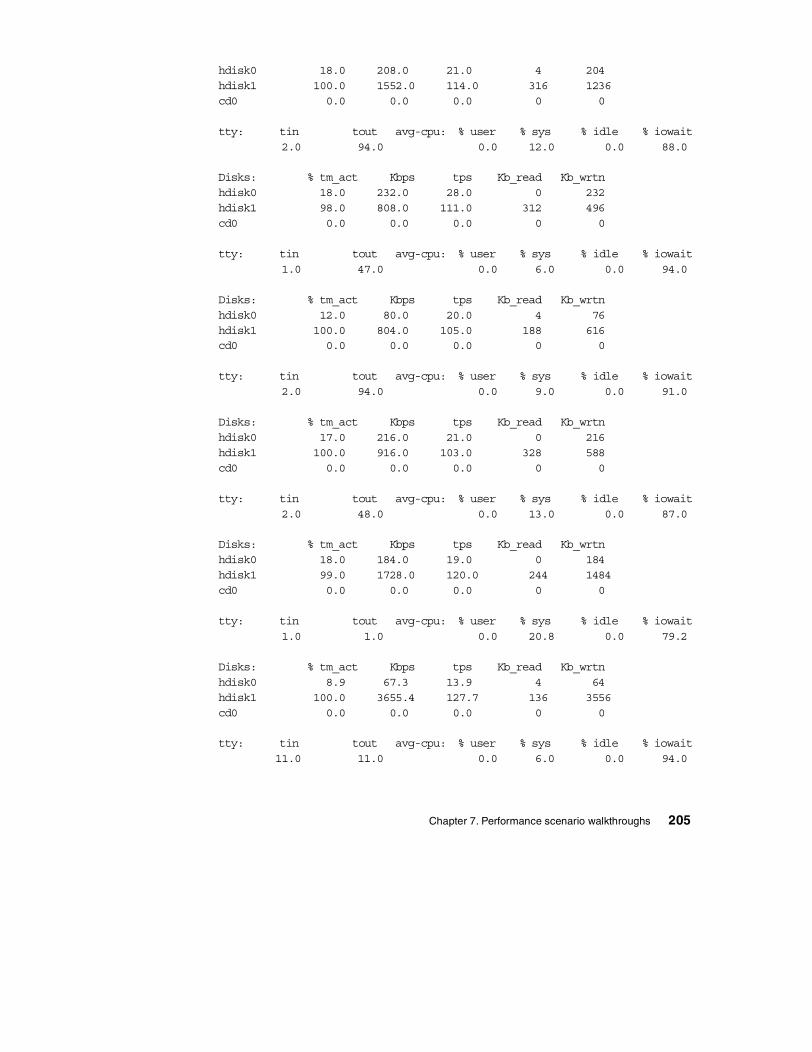
hdisk0 18.0 208.0 21.0 4 204hdisk1 100.0 1552.0 114.0 316 1236cd0 0.0 0.0 0.0 0 0
tty: tin tout avg-cpu: % user % sys % idle % iowait2.0 94.0 0.0 12.0 0.0 88.0
Disks: % tm_act Kbps tps Kb_read Kb_wrtnhdisk0 18.0 232.0 28.0 0 232hdisk1 98.0 808.0 111.0 312 496cd0 0.0 0.0 0.0 0 0
tty: tin tout avg-cpu: % user % sys % idle % iowait1.0 47.0 0.0 6.0 0.0 94.0
Disks: % tm_act Kbps tps Kb_read Kb_wrtnhdisk0 12.0 80.0 20.0 4 76hdisk1 100.0 804.0 105.0 188 616cd0 0.0 0.0 0.0 0 0
tty: tin tout avg-cpu: % user % sys % idle % iowait2.0 94.0 0.0 9.0 0.0 91.0
Disks: % tm_act Kbps tps Kb_read Kb_wrtnhdisk0 17.0 216.0 21.0 0 216hdisk1 100.0 916.0 103.0 328 588cd0 0.0 0.0 0.0 0 0
tty: tin tout avg-cpu: % user % sys % idle % iowait2.0 48.0 0.0 13.0 0.0 87.0
Disks: % tm_act Kbps tps Kb_read Kb_wrtnhdisk0 18.0 184.0 19.0 0 184hdisk1 99.0 1728.0 120.0 244 1484cd0 0.0 0.0 0.0 0 0
tty: tin tout avg-cpu: % user % sys % idle % iowait1.0 1.0 0.0 20.8 0.0 79.2
Disks: % tm_act Kbps tps Kb_read Kb_wrtnhdisk0 8.9 67.3 13.9 4 64hdisk1 100.0 3655.4 127.7 136 3556cd0 0.0 0.0 0.0 0 0
tty: tin tout avg-cpu: % user % sys % idle % iowait11.0 11.0 0.0 6.0 0.0 94.0
Chapter 7. Performance scenario walkthroughs 205
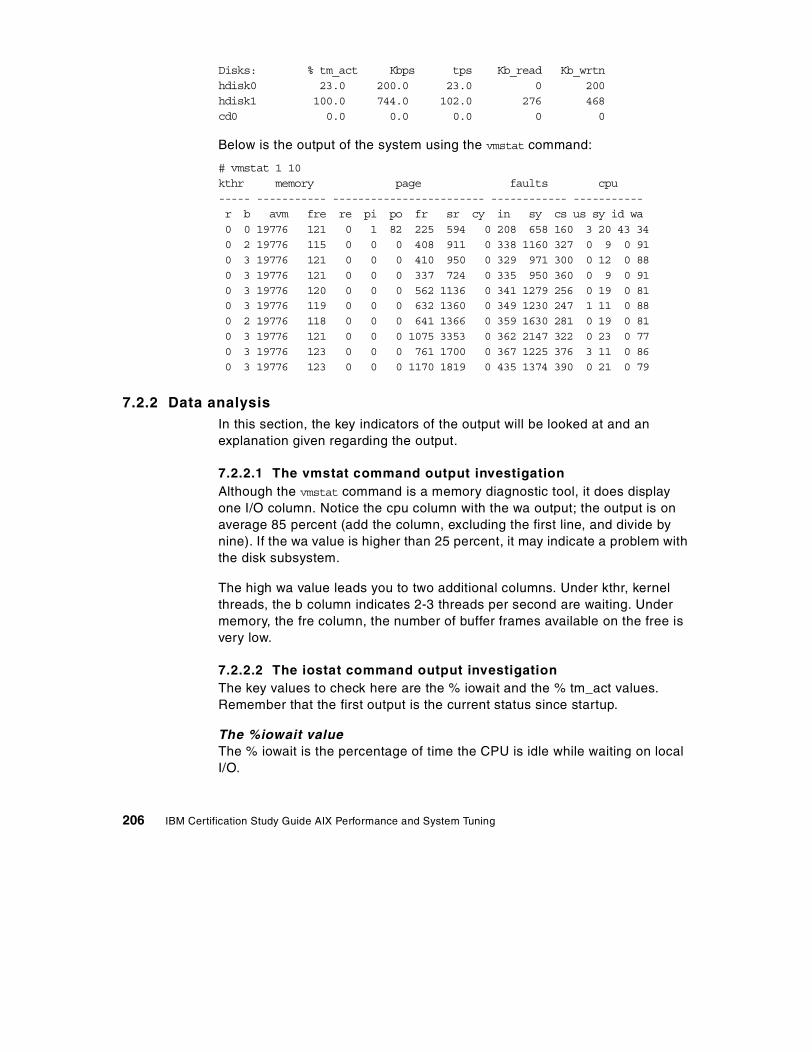
Disks: % tm_act Kbps tps Kb_read Kb_wrtnhdisk0 23.0 200.0 23.0 0 200hdisk1 100.0 744.0 102.0 276 468cd0 0.0 0.0 0.0 0 0
Below is the output of the system using the vmstat command:
# vmstat 1 10kthr memory page faults cpu----- ----------- ------------------------ ------------ -----------r b avm fre re pi po fr sr cy in sy cs us sy id wa0 0 19776 121 0 1 82 225 594 0 208 658 160 3 20 43 340 2 19776 115 0 0 0 408 911 0 338 1160 327 0 9 0 910 3 19776 121 0 0 0 410 950 0 329 971 300 0 12 0 880 3 19776 121 0 0 0 337 724 0 335 950 360 0 9 0 910 3 19776 120 0 0 0 562 1136 0 341 1279 256 0 19 0 810 3 19776 119 0 0 0 632 1360 0 349 1230 247 1 11 0 880 2 19776 118 0 0 0 641 1366 0 359 1630 281 0 19 0 810 3 19776 121 0 0 0 1075 3353 0 362 2147 322 0 23 0 770 3 19776 123 0 0 0 761 1700 0 367 1225 376 3 11 0 860 3 19776 123 0 0 0 1170 1819 0 435 1374 390 0 21 0 79
7.2.2 Data analysisIn this section, the key indicators of the output will be looked at and an explanation given regarding the output.
7.2.2.1 The vmstat command output investigationAlthough the vmstat command is a memory diagnostic tool, it does display one I/O column. Notice the cpu column with the wa output; the output is on average 85 percent (add the column, excluding the first line, and divide by nine). If the wa value is higher than 25 percent, it may indicate a problem with the disk subsystem.
The high wa value leads you to two additional columns. Under kthr, kernel threads, the b column indicates 2-3 threads per second are waiting. Under memory, the fre column, the number of buffer frames available on the free is very low.
7.2.2.2 The iostat command output investigationThe key values to check here are the % iowait and the % tm_act values. Remember that the first output is the current status since startup.
The %iowait valueThe % iowait is the percentage of time the CPU is idle while waiting on local I/O.
206 IBM Certification Study Guide AIX Performance and System Tuning
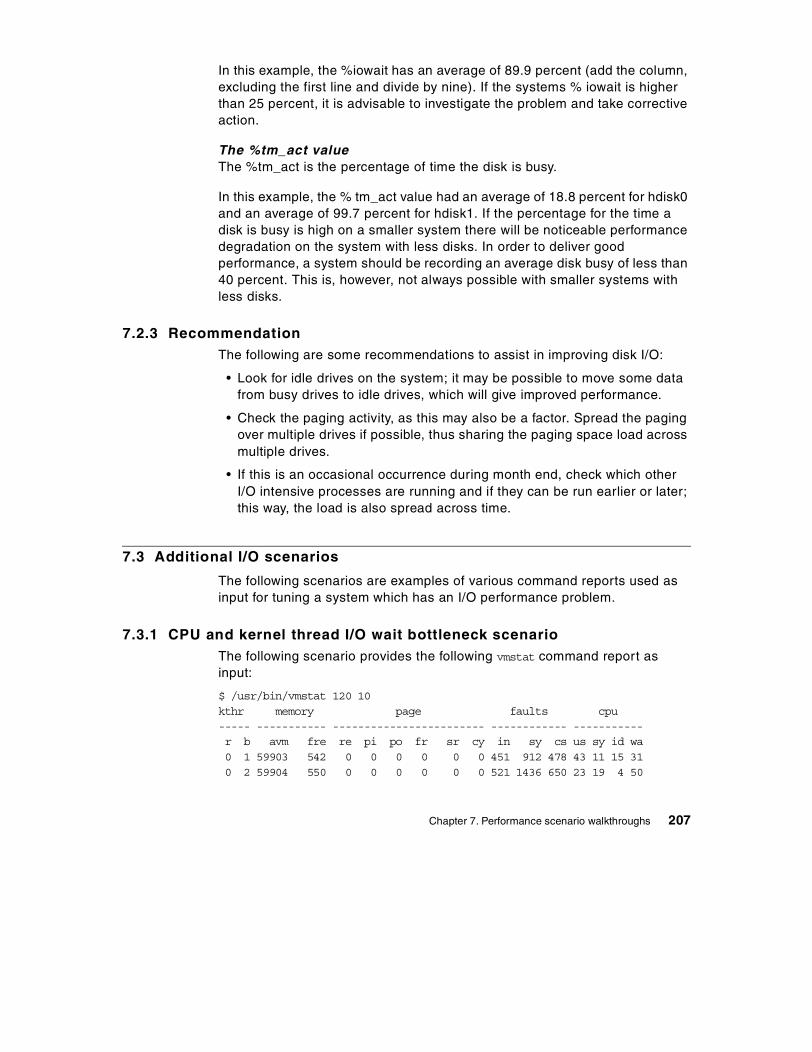
In this example, the %iowait has an average of 89.9 percent (add the column, excluding the first line and divide by nine). If the systems % iowait is higher than 25 percent, it is advisable to investigate the problem and take corrective action.
The %tm_act valueThe %tm_act is the percentage of time the disk is busy.
In this example, the % tm_act value had an average of 18.8 percent for hdisk0 and an average of 99.7 percent for hdisk1. If the percentage for the time a disk is busy is high on a smaller system there will be noticeable performance degradation on the system with less disks. In order to deliver good performance, a system should be recording an average disk busy of less than 40 percent. This is, however, not always possible with smaller systems with less disks.
7.2.3 RecommendationThe following are some recommendations to assist in improving disk I/O:
• Look for idle drives on the system; it may be possible to move some data from busy drives to idle drives, which will give improved performance.
• Check the paging activity, as this may also be a factor. Spread the paging over multiple drives if possible, thus sharing the paging space load across multiple drives.
• If this is an occasional occurrence during month end, check which other I/O intensive processes are running and if they can be run earlier or later; this way, the load is also spread across time.
7.3 Additional I/O scenarios
The following scenarios are examples of various command reports used as input for tuning a system which has an I/O performance problem.
7.3.1 CPU and kernel thread I/O wait bottleneck scenarioThe following scenario provides the following vmstat command report as input:
$ /usr/bin/vmstat 120 10kthr memory page faults cpu----- ----------- ------------------------ ------------ -----------r b avm fre re pi po fr sr cy in sy cs us sy id wa0 1 59903 542 0 0 0 0 0 0 451 912 478 43 11 15 310 2 59904 550 0 0 0 0 0 0 521 1436 650 23 19 4 50
Chapter 7. Performance scenario walkthroughs 207
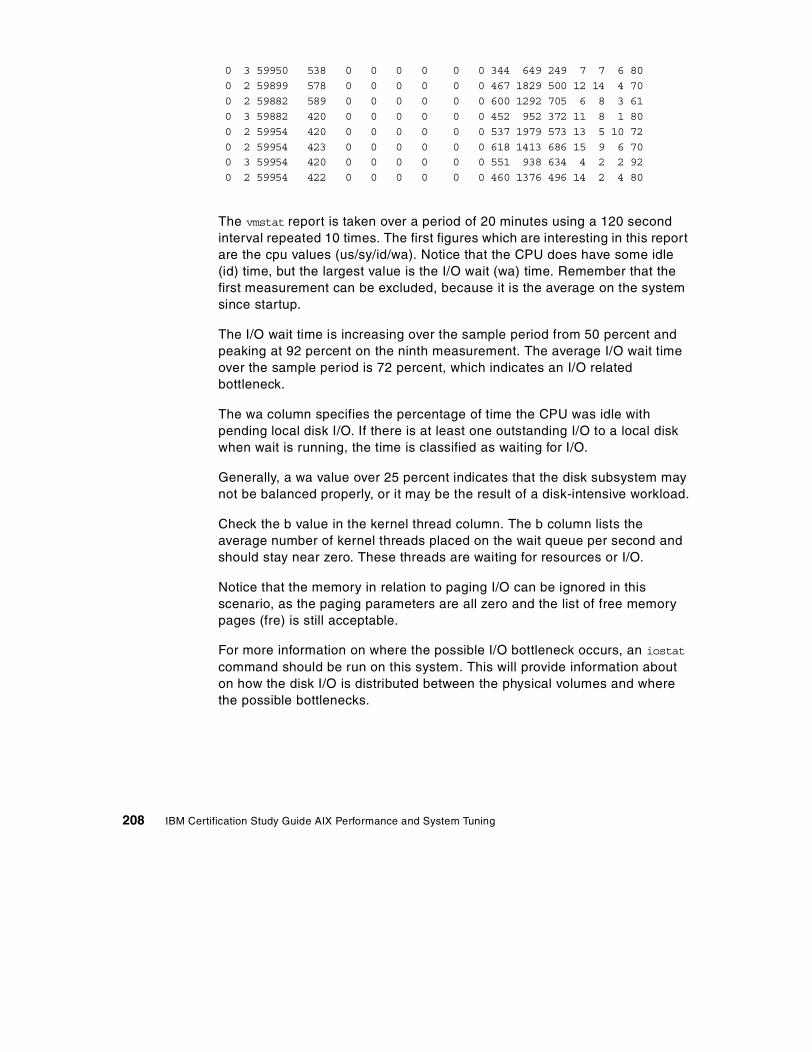
0 3 59950 538 0 0 0 0 0 0 344 649 249 7 7 6 800 2 59899 578 0 0 0 0 0 0 467 1829 500 12 14 4 700 2 59882 589 0 0 0 0 0 0 600 1292 705 6 8 3 610 3 59882 420 0 0 0 0 0 0 452 952 372 11 8 1 800 2 59954 420 0 0 0 0 0 0 537 1979 573 13 5 10 720 2 59954 423 0 0 0 0 0 0 618 1413 686 15 9 6 700 3 59954 420 0 0 0 0 0 0 551 938 634 4 2 2 920 2 59954 422 0 0 0 0 0 0 460 1376 496 14 2 4 80
The vmstat report is taken over a period of 20 minutes using a 120 second interval repeated 10 times. The first figures which are interesting in this report are the cpu values (us/sy/id/wa). Notice that the CPU does have some idle (id) time, but the largest value is the I/O wait (wa) time. Remember that the first measurement can be excluded, because it is the average on the system since startup.
The I/O wait time is increasing over the sample period from 50 percent and peaking at 92 percent on the ninth measurement. The average I/O wait time over the sample period is 72 percent, which indicates an I/O related bottleneck.
The wa column specifies the percentage of time the CPU was idle with pending local disk I/O. If there is at least one outstanding I/O to a local disk when wait is running, the time is classified as waiting for I/O.
Generally, a wa value over 25 percent indicates that the disk subsystem may not be balanced properly, or it may be the result of a disk-intensive workload.
Check the b value in the kernel thread column. The b column lists the average number of kernel threads placed on the wait queue per second and should stay near zero. These threads are waiting for resources or I/O.
Notice that the memory in relation to paging I/O can be ignored in this scenario, as the paging parameters are all zero and the list of free memory pages (fre) is still acceptable.
For more information on where the possible I/O bottleneck occurs, an iostat command should be run on this system. This will provide information about on how the disk I/O is distributed between the physical volumes and where the possible bottlenecks.
208 IBM Certification Study Guide AIX Performance and System Tuning
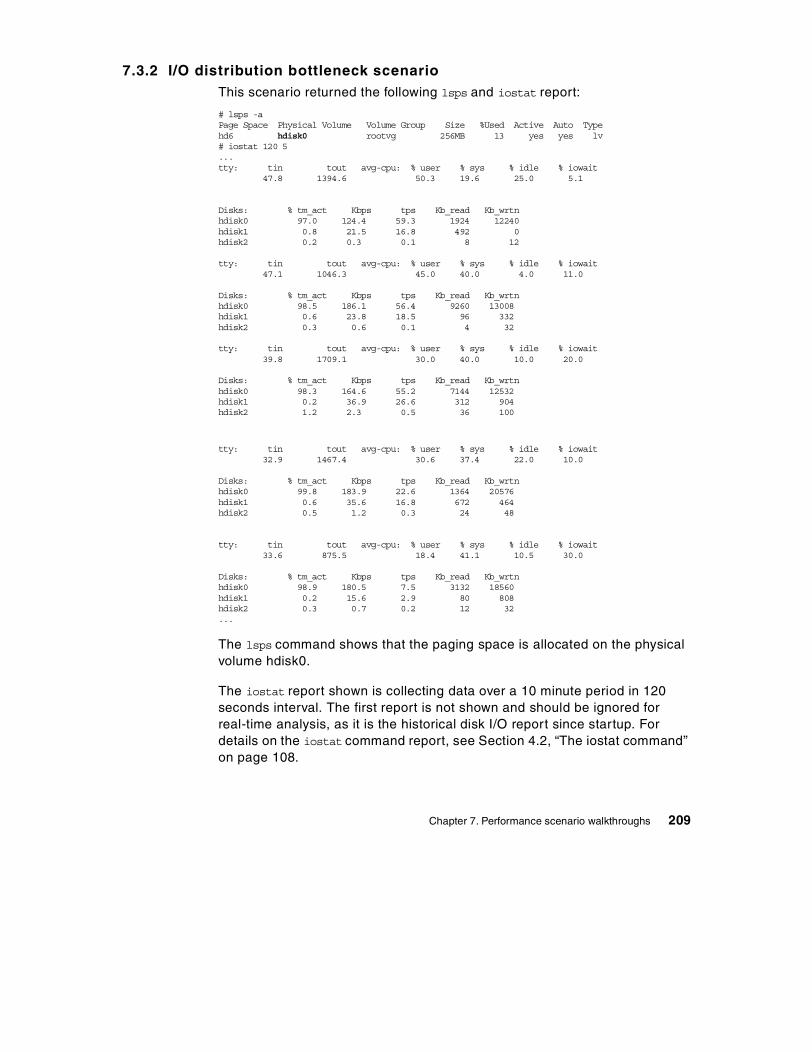
7.3.2 I/O distribution bottleneck scenarioThis scenario returned the following lsps and iostat report:
# lsps -aPage Space Physical Volume Volume Group Size %Used Active Auto Typehd6 hdisk0 rootvg 256MB 13 yes yes lv# iostat 120 5...tty: tin tout avg-cpu: % user % sys % idle % iowait
47.8 1394.6 50.3 19.6 25.0 5.1
Disks: % tm_act Kbps tps Kb_read Kb_wrtnhdisk0 97.0 124.4 59.3 1924 12240hdisk1 0.8 21.5 16.8 492 0hdisk2 0.2 0.3 0.1 8 12
tty: tin tout avg-cpu: % user % sys % idle % iowait47.1 1046.3 45.0 40.0 4.0 11.0
Disks: % tm_act Kbps tps Kb_read Kb_wrtnhdisk0 98.5 186.1 56.4 9260 13008hdisk1 0.6 23.8 18.5 96 332hdisk2 0.3 0.6 0.1 4 32
tty: tin tout avg-cpu: % user % sys % idle % iowait39.8 1709.1 30.0 40.0 10.0 20.0
Disks: % tm_act Kbps tps Kb_read Kb_wrtnhdisk0 98.3 164.6 55.2 7144 12532hdisk1 0.2 36.9 26.6 312 904hdisk2 1.2 2.3 0.5 36 100
tty: tin tout avg-cpu: % user % sys % idle % iowait32.9 1467.4 30.6 37.4 22.0 10.0
Disks: % tm_act Kbps tps Kb_read Kb_wrtnhdisk0 99.8 183.9 22.6 1364 20576hdisk1 0.6 35.6 16.8 672 464hdisk2 0.5 1.2 0.3 24 48
tty: tin tout avg-cpu: % user % sys % idle % iowait33.6 875.5 18.4 41.1 10.5 30.0
Disks: % tm_act Kbps tps Kb_read Kb_wrtnhdisk0 98.9 180.5 7.5 3132 18560hdisk1 0.2 15.6 2.9 80 808hdisk2 0.3 0.7 0.2 12 32...
The lsps command shows that the paging space is allocated on the physical volume hdisk0.
The iostat report shown is collecting data over a 10 minute period in 120 seconds interval. The first report is not shown and should be ignored for real-time analysis, as it is the historical disk I/O report since startup. For details on the iostat command report, see Section 4.2, “The iostat command” on page 108.
Chapter 7. Performance scenario walkthroughs 209
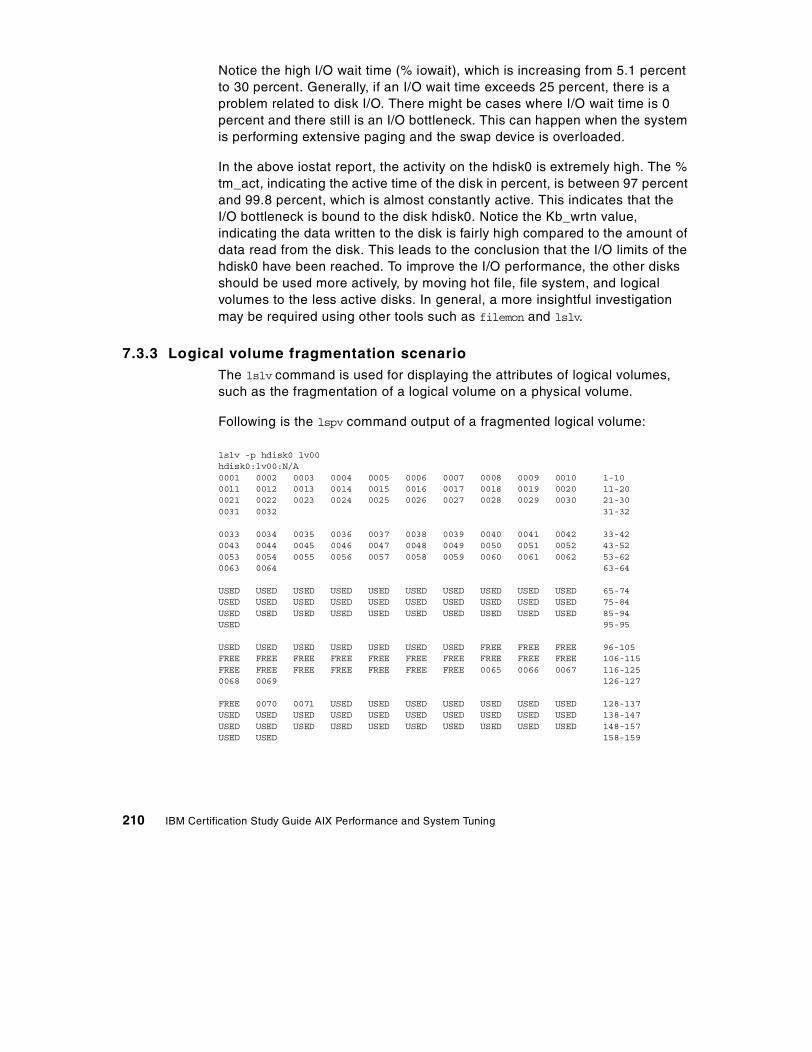
Notice the high I/O wait time (% iowait), which is increasing from 5.1 percent to 30 percent. Generally, if an I/O wait time exceeds 25 percent, there is a problem related to disk I/O. There might be cases where I/O wait time is 0 percent and there still is an I/O bottleneck. This can happen when the system is performing extensive paging and the swap device is overloaded.
In the above iostat report, the activity on the hdisk0 is extremely high. The % tm_act, indicating the active time of the disk in percent, is between 97 percent and 99.8 percent, which is almost constantly active. This indicates that the I/O bottleneck is bound to the disk hdisk0. Notice the Kb_wrtn value, indicating the data written to the disk is fairly high compared to the amount of data read from the disk. This leads to the conclusion that the I/O limits of the hdisk0 have been reached. To improve the I/O performance, the other disks should be used more actively, by moving hot file, file system, and logical volumes to the less active disks. In general, a more insightful investigation may be required using other tools such as filemon and lslv.
7.3.3 Logical volume fragmentation scenarioThe lslv command is used for displaying the attributes of logical volumes, such as the fragmentation of a logical volume on a physical volume.
Following is the lspv command output of a fragmented logical volume:
lslv -p hdisk0 lv00hdisk0:lv00:N/A0001 0002 0003 0004 0005 0006 0007 0008 0009 0010 1-100011 0012 0013 0014 0015 0016 0017 0018 0019 0020 11-200021 0022 0023 0024 0025 0026 0027 0028 0029 0030 21-300031 0032 31-32
0033 0034 0035 0036 0037 0038 0039 0040 0041 0042 33-420043 0044 0045 0046 0047 0048 0049 0050 0051 0052 43-520053 0054 0055 0056 0057 0058 0059 0060 0061 0062 53-620063 0064 63-64
USED USED USED USED USED USED USED USED USED USED 65-74USED USED USED USED USED USED USED USED USED USED 75-84USED USED USED USED USED USED USED USED USED USED 85-94USED 95-95
USED USED USED USED USED USED USED FREE FREE FREE 96-105FREE FREE FREE FREE FREE FREE FREE FREE FREE FREE 106-115FREE FREE FREE FREE FREE FREE FREE 0065 0066 0067 116-1250068 0069 126-127
FREE 0070 0071 USED USED USED USED USED USED USED 128-137USED USED USED USED USED USED USED USED USED USED 138-147USED USED USED USED USED USED USED USED USED USED 148-157USED USED 158-159
210 IBM Certification Study Guide AIX Performance and System Tuning
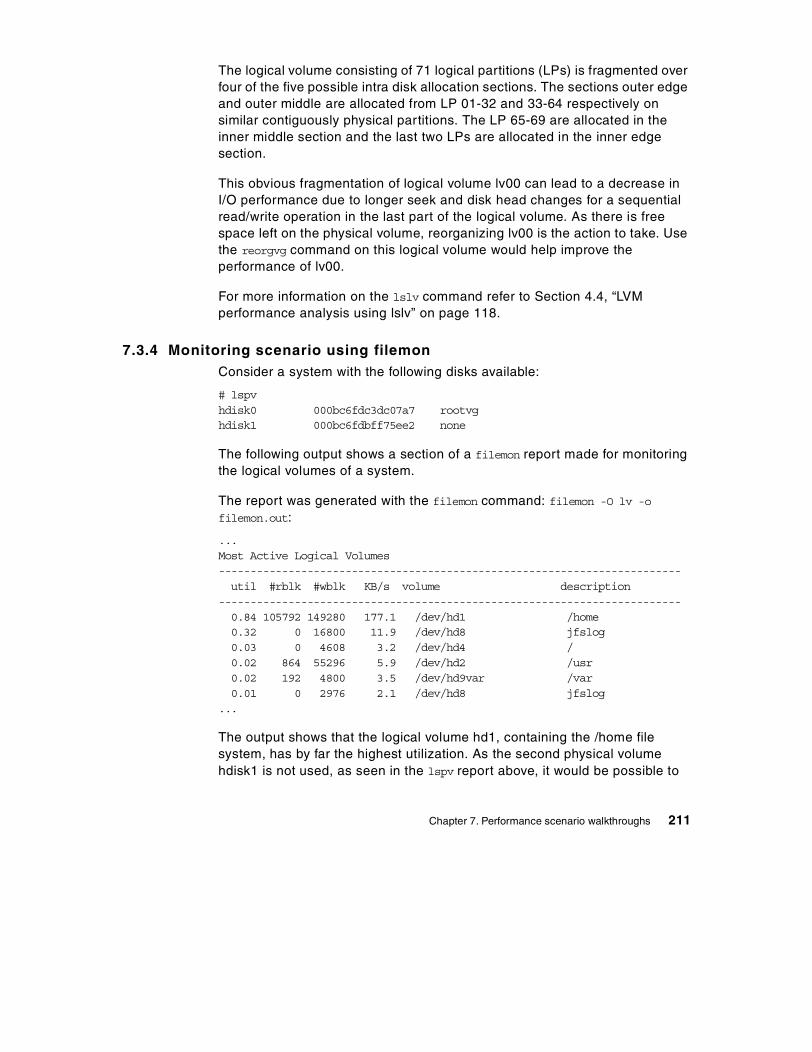
The logical volume consisting of 71 logical partitions (LPs) is fragmented over four of the five possible intra disk allocation sections. The sections outer edge and outer middle are allocated from LP 01-32 and 33-64 respectively on similar contiguously physical partitions. The LP 65-69 are allocated in the inner middle section and the last two LPs are allocated in the inner edge section.
This obvious fragmentation of logical volume lv00 can lead to a decrease in I/O performance due to longer seek and disk head changes for a sequential read/write operation in the last part of the logical volume. As there is free space left on the physical volume, reorganizing lv00 is the action to take. Use the reorgvg command on this logical volume would help improve the performance of lv00.
For more information on the lslv command refer to Section 4.4, “LVM performance analysis using lslv” on page 118.
7.3.4 Monitoring scenario using filemonConsider a system with the following disks available:
# lspvhdisk0 000bc6fdc3dc07a7 rootvghdisk1 000bc6fdbff75ee2 none
The following output shows a section of a filemon report made for monitoring the logical volumes of a system.
The report was generated with the filemon command: filemon -O lv -o
filemon.out:
...Most Active Logical Volumes-------------------------------------------------------------------------util #rblk #wblk KB/s volume description
-------------------------------------------------------------------------0.84 105792 149280 177.1 /dev/hd1 /home0.32 0 16800 11.9 /dev/hd8 jfslog0.03 0 4608 3.2 /dev/hd4 /0.02 864 55296 5.9 /dev/hd2 /usr0.02 192 4800 3.5 /dev/hd9var /var0.01 0 2976 2.1 /dev/hd8 jfslog
...
The output shows that the logical volume hd1, containing the /home file system, has by far the highest utilization. As the second physical volume hdisk1 is not used, as seen in the lspv report above, it would be possible to
Chapter 7. Performance scenario walkthroughs 211
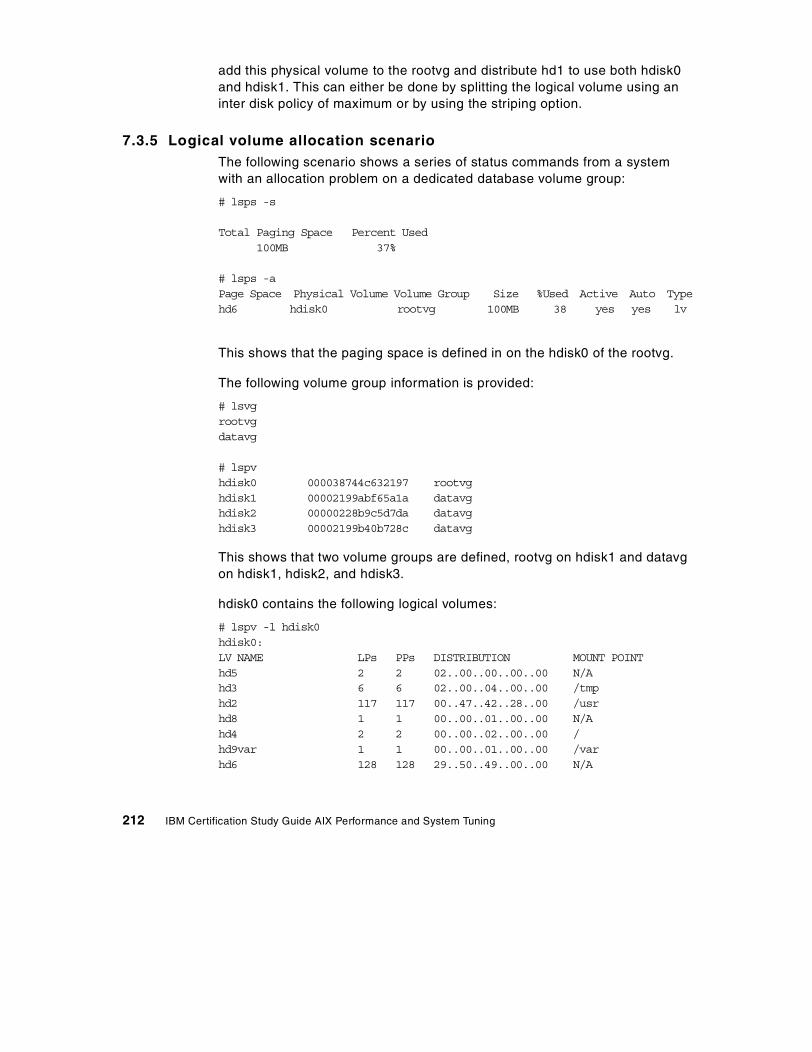
add this physical volume to the rootvg and distribute hd1 to use both hdisk0 and hdisk1. This can either be done by splitting the logical volume using an inter disk policy of maximum or by using the striping option.
7.3.5 Logical volume allocation scenarioThe following scenario shows a series of status commands from a system with an allocation problem on a dedicated database volume group:
# lsps -s
Total Paging Space Percent Used100MB 37%
# lsps -aPage Space Physical Volume Volume Group Size %Used Active Auto Typehd6 hdisk0 rootvg 100MB 38 yes yes lv
This shows that the paging space is defined in on the hdisk0 of the rootvg.
The following volume group information is provided:
# lsvgrootvgdatavg
# lspvhdisk0 000038744c632197 rootvghdisk1 00002199abf65a1a datavghdisk2 00000228b9c5d7da datavghdisk3 00002199b40b728c datavg
This shows that two volume groups are defined, rootvg on hdisk1 and datavg on hdisk1, hdisk2, and hdisk3.
hdisk0 contains the following logical volumes:
# lspv -l hdisk0hdisk0:LV NAME LPs PPs DISTRIBUTION MOUNT POINThd5 2 2 02..00..00..00..00 N/Ahd3 6 6 02..00..04..00..00 /tmphd2 117 117 00..47..42..28..00 /usrhd8 1 1 00..00..01..00..00 N/Ahd4 2 2 00..00..02..00..00 /hd9var 1 1 00..00..01..00..00 /varhd6 128 128 29..50..49..00..00 N/A
212 IBM Certification Study Guide AIX Performance and System Tuning
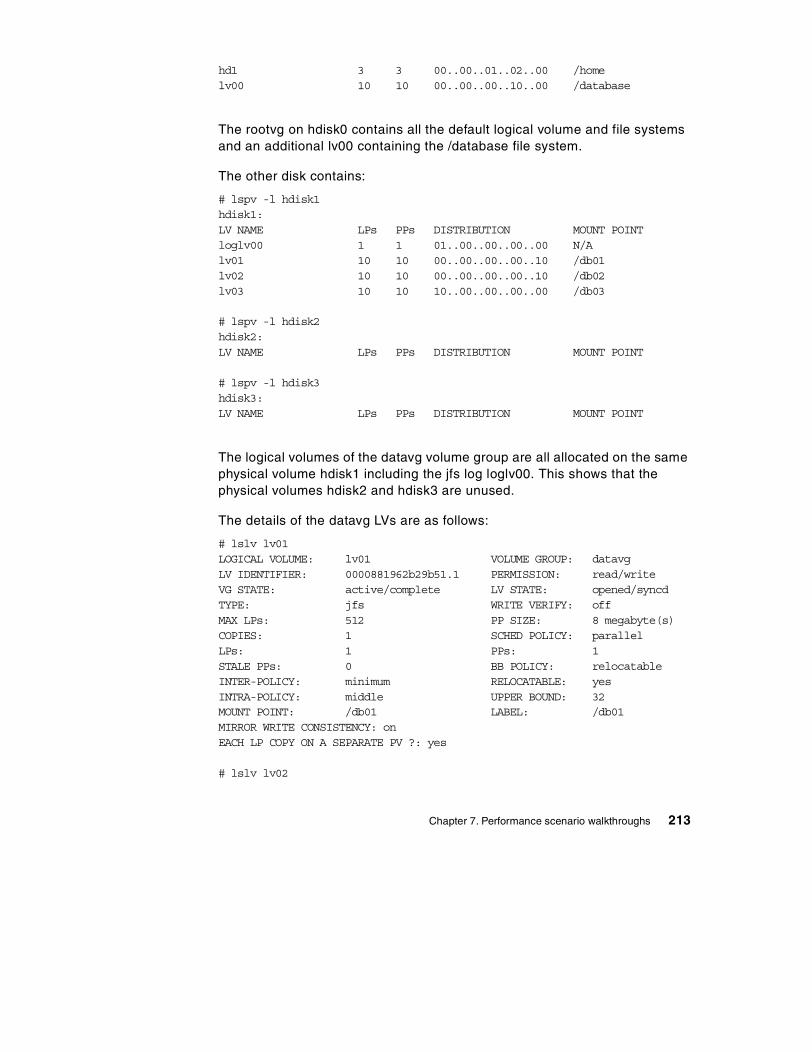
hd1 3 3 00..00..01..02..00 /homelv00 10 10 00..00..00..10..00 /database
The rootvg on hdisk0 contains all the default logical volume and file systems and an additional lv00 containing the /database file system.
The other disk contains:
# lspv -l hdisk1hdisk1:LV NAME LPs PPs DISTRIBUTION MOUNT POINTloglv00 1 1 01..00..00..00..00 N/Alv01 10 10 00..00..00..00..10 /db01lv02 10 10 00..00..00..00..10 /db02lv03 10 10 10..00..00..00..00 /db03
# lspv -l hdisk2hdisk2:LV NAME LPs PPs DISTRIBUTION MOUNT POINT
# lspv -l hdisk3hdisk3:LV NAME LPs PPs DISTRIBUTION MOUNT POINT
The logical volumes of the datavg volume group are all allocated on the same physical volume hdisk1 including the jfs log loglv00. This shows that the physical volumes hdisk2 and hdisk3 are unused.
The details of the datavg LVs are as follows:
# lslv lv01LOGICAL VOLUME: lv01 VOLUME GROUP: datavgLV IDENTIFIER: 0000881962b29b51.1 PERMISSION: read/writeVG STATE: active/complete LV STATE: opened/syncdTYPE: jfs WRITE VERIFY: offMAX LPs: 512 PP SIZE: 8 megabyte(s)COPIES: 1 SCHED POLICY: parallelLPs: 1 PPs: 1STALE PPs: 0 BB POLICY: relocatableINTER-POLICY: minimum RELOCATABLE: yesINTRA-POLICY: middle UPPER BOUND: 32MOUNT POINT: /db01 LABEL: /db01MIRROR WRITE CONSISTENCY: onEACH LP COPY ON A SEPARATE PV ?: yes
# lslv lv02
Chapter 7. Performance scenario walkthroughs 213
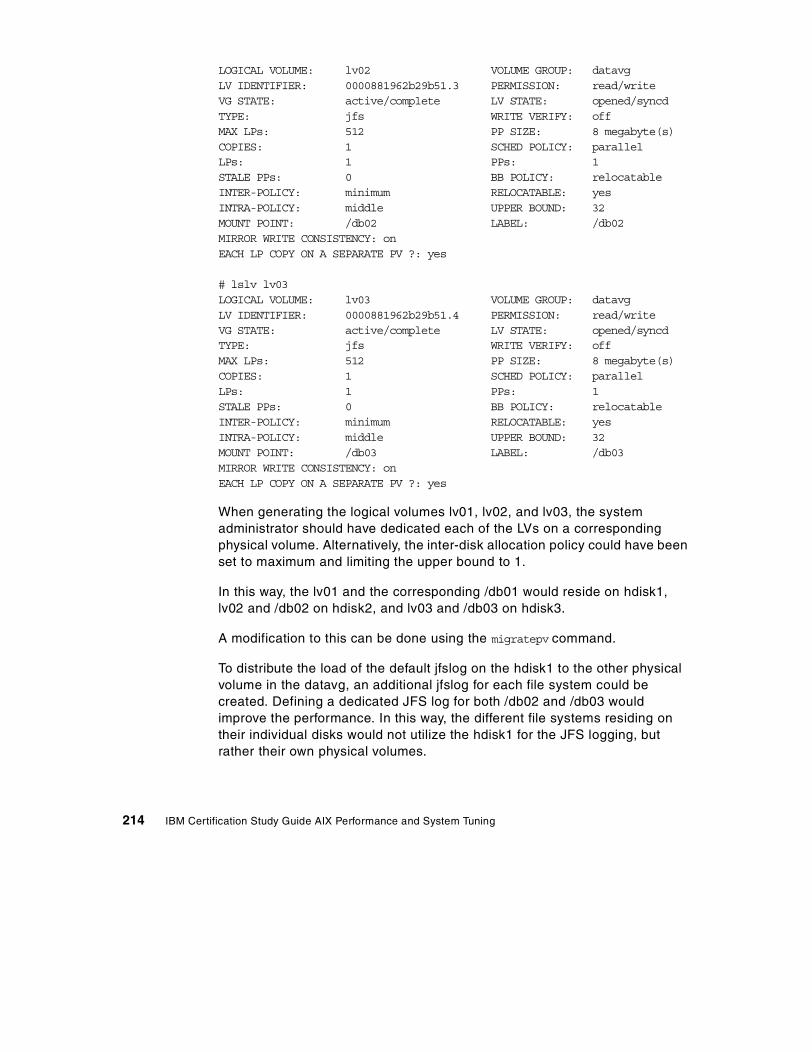
LOGICAL VOLUME: lv02 VOLUME GROUP: datavgLV IDENTIFIER: 0000881962b29b51.3 PERMISSION: read/writeVG STATE: active/complete LV STATE: opened/syncdTYPE: jfs WRITE VERIFY: offMAX LPs: 512 PP SIZE: 8 megabyte(s)COPIES: 1 SCHED POLICY: parallelLPs: 1 PPs: 1STALE PPs: 0 BB POLICY: relocatableINTER-POLICY: minimum RELOCATABLE: yesINTRA-POLICY: middle UPPER BOUND: 32MOUNT POINT: /db02 LABEL: /db02MIRROR WRITE CONSISTENCY: onEACH LP COPY ON A SEPARATE PV ?: yes
# lslv lv03LOGICAL VOLUME: lv03 VOLUME GROUP: datavgLV IDENTIFIER: 0000881962b29b51.4 PERMISSION: read/writeVG STATE: active/complete LV STATE: opened/syncdTYPE: jfs WRITE VERIFY: offMAX LPs: 512 PP SIZE: 8 megabyte(s)COPIES: 1 SCHED POLICY: parallelLPs: 1 PPs: 1STALE PPs: 0 BB POLICY: relocatableINTER-POLICY: minimum RELOCATABLE: yesINTRA-POLICY: middle UPPER BOUND: 32MOUNT POINT: /db03 LABEL: /db03MIRROR WRITE CONSISTENCY: onEACH LP COPY ON A SEPARATE PV ?: yes
When generating the logical volumes lv01, lv02, and lv03, the system administrator should have dedicated each of the LVs on a corresponding physical volume. Alternatively, the inter-disk allocation policy could have been set to maximum and limiting the upper bound to 1.
In this way, the lv01 and the corresponding /db01 would reside on hdisk1, lv02 and /db02 on hdisk2, and lv03 and /db03 on hdisk3.
A modification to this can be done using the migratepv command.
To distribute the load of the default jfslog on the hdisk1 to the other physical volume in the datavg, an additional jfslog for each file system could be created. Defining a dedicated JFS log for both /db02 and /db03 would improve the performance. In this way, the different file systems residing on their individual disks would not utilize the hdisk1 for the JFS logging, but rather their own physical volumes.
214 IBM Certification Study Guide AIX Performance and System Tuning
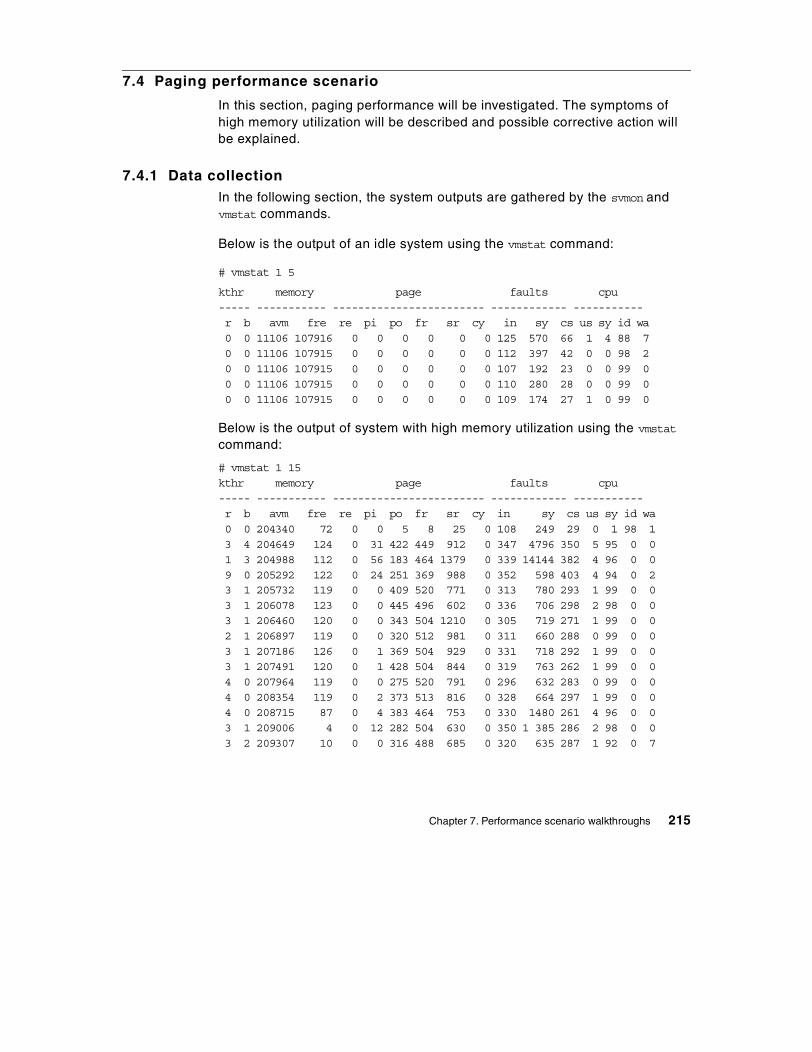
7.4 Paging performance scenario
In this section, paging performance will be investigated. The symptoms of high memory utilization will be described and possible corrective action will be explained.
7.4.1 Data collectionIn the following section, the system outputs are gathered by the svmon and vmstat commands.
Below is the output of an idle system using the vmstat command:
# vmstat 1 5
kthr memory page faults cpu----- ----------- ------------------------ ------------ -----------r b avm fre re pi po fr sr cy in sy cs us sy id wa0 0 11106 107916 0 0 0 0 0 0 125 570 66 1 4 88 70 0 11106 107915 0 0 0 0 0 0 112 397 42 0 0 98 20 0 11106 107915 0 0 0 0 0 0 107 192 23 0 0 99 00 0 11106 107915 0 0 0 0 0 0 110 280 28 0 0 99 00 0 11106 107915 0 0 0 0 0 0 109 174 27 1 0 99 0
Below is the output of system with high memory utilization using the vmstat command:
# vmstat 1 15kthr memory page faults cpu----- ----------- ------------------------ ------------ -----------r b avm fre re pi po fr sr cy in sy cs us sy id wa0 0 204340 72 0 0 5 8 25 0 108 249 29 0 1 98 13 4 204649 124 0 31 422 449 912 0 347 4796 350 5 95 0 01 3 204988 112 0 56 183 464 1379 0 339 14144 382 4 96 0 09 0 205292 122 0 24 251 369 988 0 352 598 403 4 94 0 23 1 205732 119 0 0 409 520 771 0 313 780 293 1 99 0 03 1 206078 123 0 0 445 496 602 0 336 706 298 2 98 0 03 1 206460 120 0 0 343 504 1210 0 305 719 271 1 99 0 02 1 206897 119 0 0 320 512 981 0 311 660 288 0 99 0 03 1 207186 126 0 1 369 504 929 0 331 718 292 1 99 0 03 1 207491 120 0 1 428 504 844 0 319 763 262 1 99 0 04 0 207964 119 0 0 275 520 791 0 296 632 283 0 99 0 04 0 208354 119 0 2 373 513 816 0 328 664 297 1 99 0 04 0 208715 87 0 4 383 464 753 0 330 1480 261 4 96 0 03 1 209006 4 0 12 282 504 630 0 350 1 385 286 2 98 0 03 2 209307 10 0 0 316 488 685 0 320 635 287 1 92 0 7
Chapter 7. Performance scenario walkthroughs 215
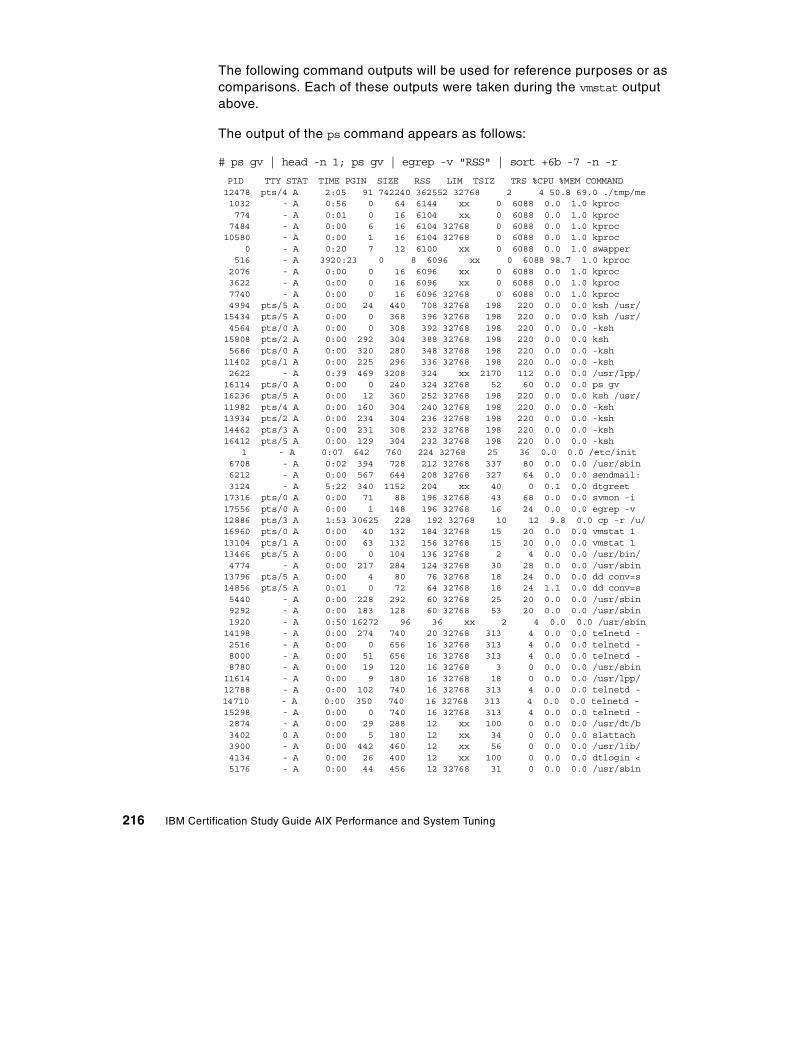
The following command outputs will be used for reference purposes or as comparisons. Each of these outputs were taken during the vmstat output above.
The output of the ps command appears as follows:
# ps gv | head -n 1; ps gv | egrep -v "RSS" | sort +6b -7 -n -r
PID TTY STAT TIME PGIN SIZE RSS LIM TSIZ TRS %CPU %MEM COMMAND12478 pts/4 A 2:05 91 742240 362552 32768 2 4 50.8 69.0 ./tmp/me1032 - A 0:56 0 64 6144 xx 0 6088 0.0 1.0 kproc774 - A 0:01 0 16 6104 xx 0 6088 0.0 1.0 kproc7484 - A 0:00 6 16 6104 32768 0 6088 0.0 1.0 kproc10580 - A 0:00 1 16 6104 32768 0 6088 0.0 1.0 kproc
0 - A 0:20 7 12 6100 xx 0 6088 0.0 1.0 swapper516 - A 3920:23 0 8 6096 xx 0 6088 98.7 1.0 kproc2076 - A 0:00 0 16 6096 xx 0 6088 0.0 1.0 kproc3622 - A 0:00 0 16 6096 xx 0 6088 0.0 1.0 kproc7740 - A 0:00 0 16 6096 32768 0 6088 0.0 1.0 kproc4994 pts/5 A 0:00 24 440 708 32768 198 220 0.0 0.0 ksh /usr/15434 pts/5 A 0:00 0 368 396 32768 198 220 0.0 0.0 ksh /usr/4564 pts/0 A 0:00 0 308 392 32768 198 220 0.0 0.0 -ksh15808 pts/2 A 0:00 292 304 388 32768 198 220 0.0 0.0 ksh5686 pts/0 A 0:00 320 280 348 32768 198 220 0.0 0.0 -ksh11402 pts/1 A 0:00 225 296 336 32768 198 220 0.0 0.0 -ksh2622 - A 0:39 469 3208 324 xx 2170 112 0.0 0.0 /usr/lpp/16114 pts/0 A 0:00 0 240 324 32768 52 60 0.0 0.0 ps gv16236 pts/5 A 0:00 12 360 252 32768 198 220 0.0 0.0 ksh /usr/11982 pts/4 A 0:00 160 304 240 32768 198 220 0.0 0.0 -ksh13934 pts/2 A 0:00 234 304 236 32768 198 220 0.0 0.0 -ksh14462 pts/3 A 0:00 231 308 232 32768 198 220 0.0 0.0 -ksh16412 pts/5 A 0:00 129 304 232 32768 198 220 0.0 0.0 -ksh
1 - A 0:07 642 760 224 32768 25 36 0.0 0.0 /etc/init6708 - A 0:02 394 728 212 32768 337 80 0.0 0.0 /usr/sbin6212 - A 0:00 567 644 208 32768 327 64 0.0 0.0 sendmail:3124 - A 5:22 340 1152 204 xx 40 0 0.1 0.0 dtgreet17316 pts/0 A 0:00 71 88 196 32768 43 68 0.0 0.0 svmon -i17556 pts/0 A 0:00 1 148 196 32768 16 24 0.0 0.0 egrep -v12886 pts/3 A 1:53 30625 228 192 32768 10 12 9.8 0.0 cp -r /u/16960 pts/0 A 0:00 40 132 184 32768 15 20 0.0 0.0 vmstat 113104 pts/1 A 0:00 63 132 156 32768 15 20 0.0 0.0 vmstat 113466 pts/5 A 0:00 0 104 136 32768 2 4 0.0 0.0 /usr/bin/4774 - A 0:00 217 284 124 32768 30 28 0.0 0.0 /usr/sbin13796 pts/5 A 0:00 4 80 76 32768 18 24 0.0 0.0 dd conv=s14856 pts/5 A 0:01 0 72 64 32768 18 24 1.1 0.0 dd conv=s5440 - A 0:00 228 292 60 32768 25 20 0.0 0.0 /usr/sbin9292 - A 0:00 183 128 60 32768 53 20 0.0 0.0 /usr/sbin1920 - A 0:50 16272 96 36 xx 2 4 0.0 0.0 /usr/sbin14198 - A 0:00 274 740 20 32768 313 4 0.0 0.0 telnetd -2516 - A 0:00 0 656 16 32768 313 4 0.0 0.0 telnetd -8000 - A 0:00 51 656 16 32768 313 4 0.0 0.0 telnetd -8780 - A 0:00 19 120 16 32768 3 0 0.0 0.0 /usr/sbin11614 - A 0:00 9 180 16 32768 18 0 0.0 0.0 /usr/lpp/12788 - A 0:00 102 740 16 32768 313 4 0.0 0.0 telnetd -14710 - A 0:00 350 740 16 32768 313 4 0.0 0.0 telnetd -15298 - A 0:00 0 740 16 32768 313 4 0.0 0.0 telnetd -2874 - A 0:00 29 288 12 xx 100 0 0.0 0.0 /usr/dt/b3402 0 A 0:00 5 180 12 xx 34 0 0.0 0.0 slattach3900 - A 0:00 442 460 12 xx 56 0 0.0 0.0 /usr/lib/4134 - A 0:00 26 400 12 xx 100 0 0.0 0.0 dtlogin <5176 - A 0:00 44 456 12 32768 31 0 0.0 0.0 /usr/sbin
216 IBM Certification Study Guide AIX Performance and System Tuning
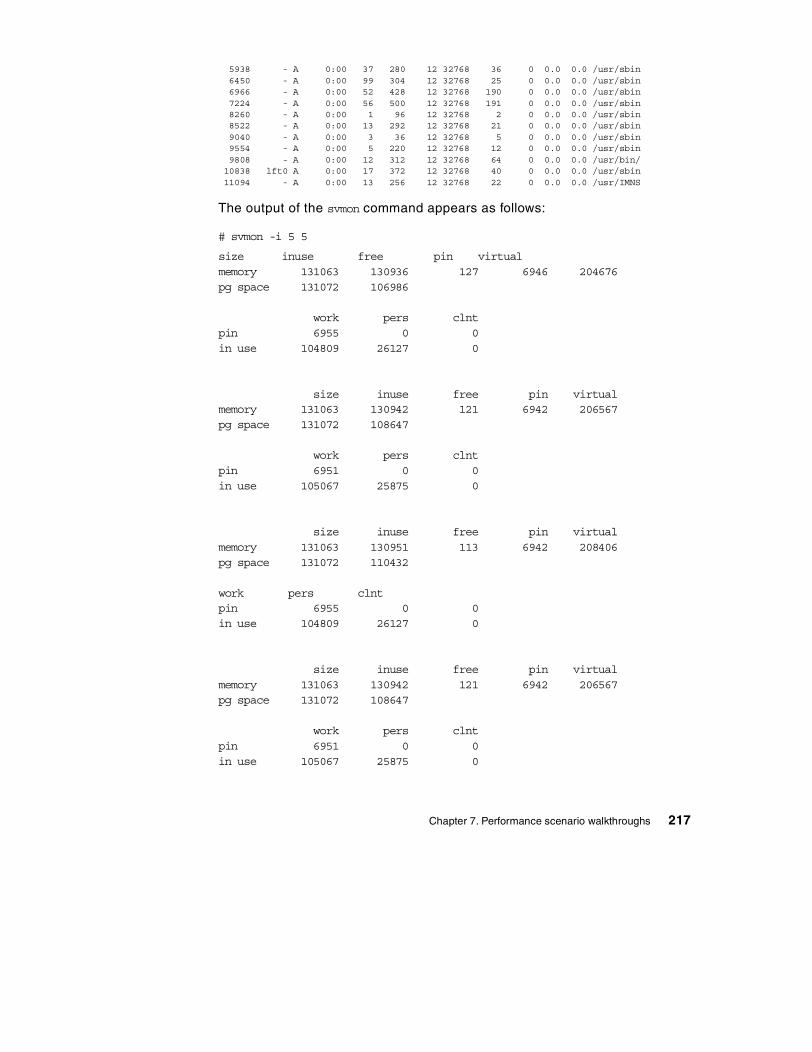
5938 - A 0:00 37 280 12 32768 36 0 0.0 0.0 /usr/sbin6450 - A 0:00 99 304 12 32768 25 0 0.0 0.0 /usr/sbin6966 - A 0:00 52 428 12 32768 190 0 0.0 0.0 /usr/sbin7224 - A 0:00 56 500 12 32768 191 0 0.0 0.0 /usr/sbin8260 - A 0:00 1 96 12 32768 2 0 0.0 0.0 /usr/sbin8522 - A 0:00 13 292 12 32768 21 0 0.0 0.0 /usr/sbin9040 - A 0:00 3 36 12 32768 5 0 0.0 0.0 /usr/sbin9554 - A 0:00 5 220 12 32768 12 0 0.0 0.0 /usr/sbin9808 - A 0:00 12 312 12 32768 64 0 0.0 0.0 /usr/bin/10838 lft0 A 0:00 17 372 12 32768 40 0 0.0 0.0 /usr/sbin11094 - A 0:00 13 256 12 32768 22 0 0.0 0.0 /usr/IMNS
The output of the svmon command appears as follows:
# svmon -i 5 5
size inuse free pin virtualmemory 131063 130936 127 6946 204676pg space 131072 106986
work pers clntpin 6955 0 0in use 104809 26127 0
size inuse free pin virtualmemory 131063 130942 121 6942 206567pg space 131072 108647
work pers clntpin 6951 0 0in use 105067 25875 0
size inuse free pin virtualmemory 131063 130951 113 6942 208406pg space 131072 110432
work pers clntpin 6955 0 0in use 104809 26127 0
size inuse free pin virtualmemory 131063 130942 121 6942 206567pg space 131072 108647
work pers clntpin 6951 0 0in use 105067 25875 0
Chapter 7. Performance scenario walkthroughs 217
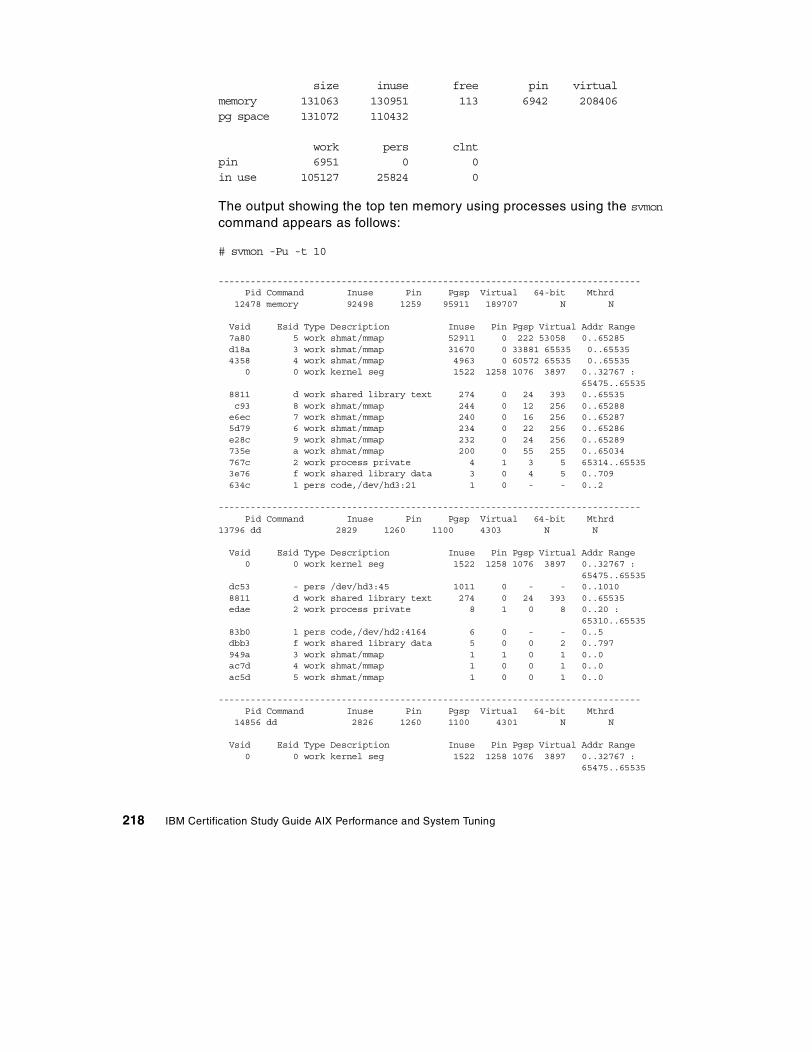
size inuse free pin virtualmemory 131063 130951 113 6942 208406pg space 131072 110432
work pers clntpin 6951 0 0in use 105127 25824 0
The output showing the top ten memory using processes using the svmon command appears as follows:
# svmon -Pu -t 10
-------------------------------------------------------------------------------Pid Command Inuse Pin Pgsp Virtual 64-bit Mthrd
12478 memory 92498 1259 95911 189707 N N
Vsid Esid Type Description Inuse Pin Pgsp Virtual Addr Range7a80 5 work shmat/mmap 52911 0 222 53058 0..65285d18a 3 work shmat/mmap 31670 0 33881 65535 0..655354358 4 work shmat/mmap 4963 0 60572 65535 0..65535
0 0 work kernel seg 1522 1258 1076 3897 0..32767 :65475..65535
8811 d work shared library text 274 0 24 393 0..65535c93 8 work shmat/mmap 244 0 12 256 0..65288e6ec 7 work shmat/mmap 240 0 16 256 0..652875d79 6 work shmat/mmap 234 0 22 256 0..65286e28c 9 work shmat/mmap 232 0 24 256 0..65289735e a work shmat/mmap 200 0 55 255 0..65034767c 2 work process private 4 1 3 5 65314..655353e76 f work shared library data 3 0 4 5 0..709634c 1 pers code,/dev/hd3:21 1 0 - - 0..2
-------------------------------------------------------------------------------Pid Command Inuse Pin Pgsp Virtual 64-bit Mthrd
13796 dd 2829 1260 1100 4303 N N
Vsid Esid Type Description Inuse Pin Pgsp Virtual Addr Range0 0 work kernel seg 1522 1258 1076 3897 0..32767 :
65475..65535dc53 - pers /dev/hd3:45 1011 0 - - 0..10108811 d work shared library text 274 0 24 393 0..65535edae 2 work process private 8 1 0 8 0..20 :
65310..6553583b0 1 pers code,/dev/hd2:4164 6 0 - - 0..5dbb3 f work shared library data 5 0 0 2 0..797949a 3 work shmat/mmap 1 1 0 1 0..0ac7d 4 work shmat/mmap 1 0 0 1 0..0ac5d 5 work shmat/mmap 1 0 0 1 0..0
-------------------------------------------------------------------------------Pid Command Inuse Pin Pgsp Virtual 64-bit Mthrd
14856 dd 2826 1260 1100 4301 N N
Vsid Esid Type Description Inuse Pin Pgsp Virtual Addr Range0 0 work kernel seg 1522 1258 1076 3897 0..32767 :
65475..65535
218 IBM Certification Study Guide AIX Performance and System Tuning
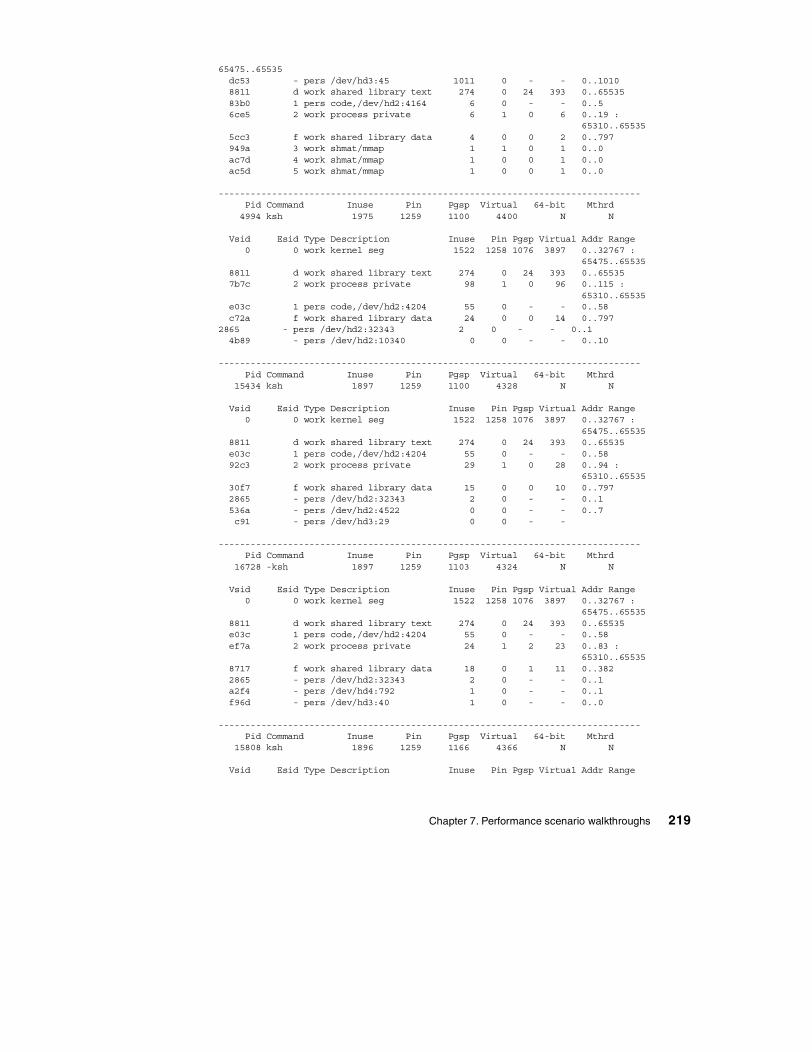
65475..65535dc53 - pers /dev/hd3:45 1011 0 - - 0..10108811 d work shared library text 274 0 24 393 0..6553583b0 1 pers code,/dev/hd2:4164 6 0 - - 0..56ce5 2 work process private 6 1 0 6 0..19 :
65310..655355cc3 f work shared library data 4 0 0 2 0..797949a 3 work shmat/mmap 1 1 0 1 0..0ac7d 4 work shmat/mmap 1 0 0 1 0..0ac5d 5 work shmat/mmap 1 0 0 1 0..0
-------------------------------------------------------------------------------Pid Command Inuse Pin Pgsp Virtual 64-bit Mthrd4994 ksh 1975 1259 1100 4400 N N
Vsid Esid Type Description Inuse Pin Pgsp Virtual Addr Range0 0 work kernel seg 1522 1258 1076 3897 0..32767 :
65475..655358811 d work shared library text 274 0 24 393 0..655357b7c 2 work process private 98 1 0 96 0..115 :
65310..65535e03c 1 pers code,/dev/hd2:4204 55 0 - - 0..58c72a f work shared library data 24 0 0 14 0..797
2865 - pers /dev/hd2:32343 2 0 - - 0..14b89 - pers /dev/hd2:10340 0 0 - - 0..10
-------------------------------------------------------------------------------Pid Command Inuse Pin Pgsp Virtual 64-bit Mthrd
15434 ksh 1897 1259 1100 4328 N N
Vsid Esid Type Description Inuse Pin Pgsp Virtual Addr Range0 0 work kernel seg 1522 1258 1076 3897 0..32767 :
65475..655358811 d work shared library text 274 0 24 393 0..65535e03c 1 pers code,/dev/hd2:4204 55 0 - - 0..5892c3 2 work process private 29 1 0 28 0..94 :
65310..6553530f7 f work shared library data 15 0 0 10 0..7972865 - pers /dev/hd2:32343 2 0 - - 0..1536a - pers /dev/hd2:4522 0 0 - - 0..7c91 - pers /dev/hd3:29 0 0 - -
-------------------------------------------------------------------------------Pid Command Inuse Pin Pgsp Virtual 64-bit Mthrd
16728 -ksh 1897 1259 1103 4324 N N
Vsid Esid Type Description Inuse Pin Pgsp Virtual Addr Range0 0 work kernel seg 1522 1258 1076 3897 0..32767 :
65475..655358811 d work shared library text 274 0 24 393 0..65535e03c 1 pers code,/dev/hd2:4204 55 0 - - 0..58ef7a 2 work process private 24 1 2 23 0..83 :
65310..655358717 f work shared library data 18 0 1 11 0..3822865 - pers /dev/hd2:32343 2 0 - - 0..1a2f4 - pers /dev/hd4:792 1 0 - - 0..1f96d - pers /dev/hd3:40 1 0 - - 0..0
-------------------------------------------------------------------------------Pid Command Inuse Pin Pgsp Virtual 64-bit Mthrd
15808 ksh 1896 1259 1166 4366 N N
Vsid Esid Type Description Inuse Pin Pgsp Virtual Addr Range
Chapter 7. Performance scenario walkthroughs 219
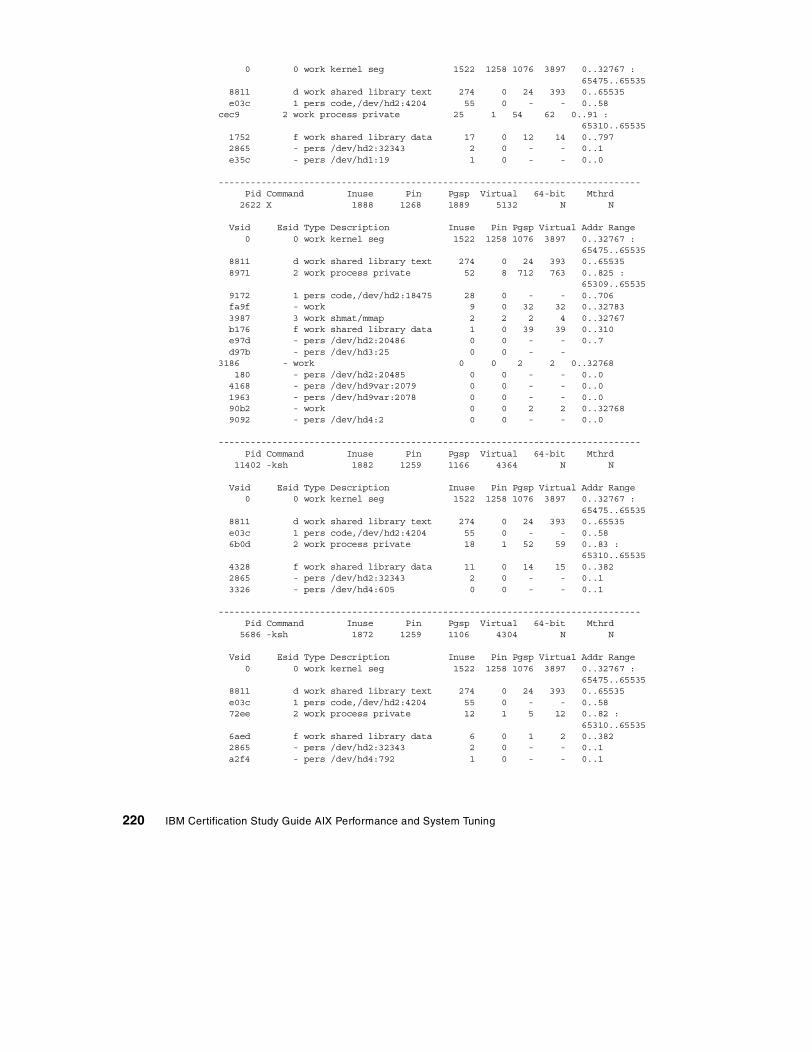
0 0 work kernel seg 1522 1258 1076 3897 0..32767 :65475..65535
8811 d work shared library text 274 0 24 393 0..65535e03c 1 pers code,/dev/hd2:4204 55 0 - - 0..58
cec9 2 work process private 25 1 54 62 0..91 :65310..65535
1752 f work shared library data 17 0 12 14 0..7972865 - pers /dev/hd2:32343 2 0 - - 0..1e35c - pers /dev/hd1:19 1 0 - - 0..0
-------------------------------------------------------------------------------Pid Command Inuse Pin Pgsp Virtual 64-bit Mthrd2622 X 1888 1268 1889 5132 N N
Vsid Esid Type Description Inuse Pin Pgsp Virtual Addr Range0 0 work kernel seg 1522 1258 1076 3897 0..32767 :
65475..655358811 d work shared library text 274 0 24 393 0..655358971 2 work process private 52 8 712 763 0..825 :
65309..655359172 1 pers code,/dev/hd2:18475 28 0 - - 0..706fa9f - work 9 0 32 32 0..327833987 3 work shmat/mmap 2 2 2 4 0..32767b176 f work shared library data 1 0 39 39 0..310e97d - pers /dev/hd2:20486 0 0 - - 0..7d97b - pers /dev/hd3:25 0 0 - -
3186 - work 0 0 2 2 0..32768180 - pers /dev/hd2:20485 0 0 - - 0..04168 - pers /dev/hd9var:2079 0 0 - - 0..01963 - pers /dev/hd9var:2078 0 0 - - 0..090b2 - work 0 0 2 2 0..327689092 - pers /dev/hd4:2 0 0 - - 0..0
-------------------------------------------------------------------------------Pid Command Inuse Pin Pgsp Virtual 64-bit Mthrd
11402 -ksh 1882 1259 1166 4364 N N
Vsid Esid Type Description Inuse Pin Pgsp Virtual Addr Range0 0 work kernel seg 1522 1258 1076 3897 0..32767 :
65475..655358811 d work shared library text 274 0 24 393 0..65535e03c 1 pers code,/dev/hd2:4204 55 0 - - 0..586b0d 2 work process private 18 1 52 59 0..83 :
65310..655354328 f work shared library data 11 0 14 15 0..3822865 - pers /dev/hd2:32343 2 0 - - 0..13326 - pers /dev/hd4:605 0 0 - - 0..1
-------------------------------------------------------------------------------Pid Command Inuse Pin Pgsp Virtual 64-bit Mthrd5686 -ksh 1872 1259 1106 4304 N N
Vsid Esid Type Description Inuse Pin Pgsp Virtual Addr Range0 0 work kernel seg 1522 1258 1076 3897 0..32767 :
65475..655358811 d work shared library text 274 0 24 393 0..65535e03c 1 pers code,/dev/hd2:4204 55 0 - - 0..5872ee 2 work process private 12 1 5 12 0..82 :
65310..655356aed f work shared library data 6 0 1 2 0..3822865 - pers /dev/hd2:32343 2 0 - - 0..1a2f4 - pers /dev/hd4:792 1 0 - - 0..1
220 IBM Certification Study Guide AIX Performance and System Tuning
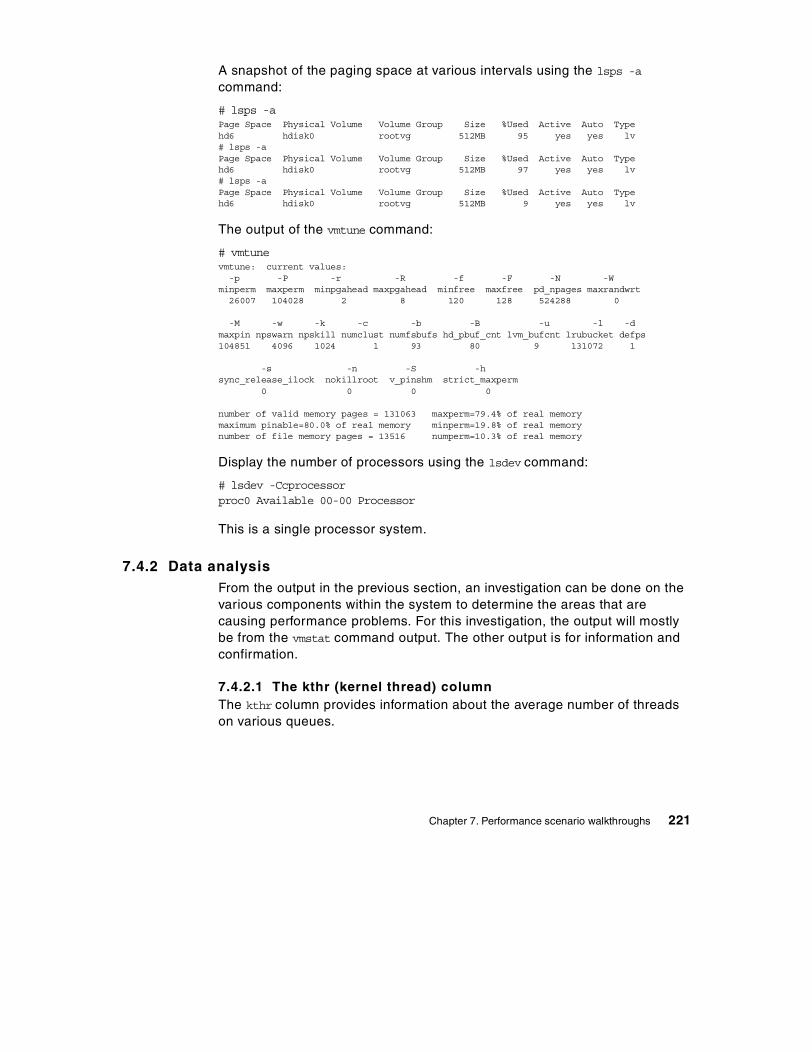
A snapshot of the paging space at various intervals using the lsps -a command:
# lsps -aPage Space Physical Volume Volume Group Size %Used Active Auto Typehd6 hdisk0 rootvg 512MB 95 yes yes lv# lsps -aPage Space Physical Volume Volume Group Size %Used Active Auto Typehd6 hdisk0 rootvg 512MB 97 yes yes lv# lsps -aPage Space Physical Volume Volume Group Size %Used Active Auto Typehd6 hdisk0 rootvg 512MB 9 yes yes lv
The output of the vmtune command:
# vmtunevmtune: current values:-p -P -r -R -f -F -N -W
minperm maxperm minpgahead maxpgahead minfree maxfree pd_npages maxrandwrt26007 104028 2 8 120 128 524288 0
-M -w -k -c -b -B -u -l -dmaxpin npswarn npskill numclust numfsbufs hd_pbuf_cnt lvm_bufcnt lrubucket defps104851 4096 1024 1 93 80 9 131072 1
-s -n -S -hsync_release_ilock nokillroot v_pinshm strict_maxperm
0 0 0 0
number of valid memory pages = 131063 maxperm=79.4% of real memorymaximum pinable=80.0% of real memory minperm=19.8% of real memorynumber of file memory pages = 13516 numperm=10.3% of real memory
Display the number of processors using the lsdev command:
# lsdev -Ccprocessorproc0 Available 00-00 Processor
This is a single processor system.
7.4.2 Data analysisFrom the output in the previous section, an investigation can be done on the various components within the system to determine the areas that are causing performance problems. For this investigation, the output will mostly be from the vmstat command output. The other output is for information and confirmation.
7.4.2.1 The kthr (kernel thread) columnThe kthr column provides information about the average number of threads on various queues.
Chapter 7. Performance scenario walkthroughs 221
Both the r and b counts are low, indicating that the system is executing the runable threads in the kernel sufficiently. The contention for CPU resources is low.
7.4.2.2 The memory columnThe memory column displays information about the use of real and virtual memory. A page size is 4096 bytes in size.
In the avm column it can be seen that the average number of pages allocated increased. The system will keep allocating pages until all paging space available is used (check with lsps -a command). When all the paging space has been utilized or reaches 100%, the system will start killing processes to make paging space available for use.
The fre column shows the average number of free memory pages. The MINFREE value for this system is 120, as shown with the vmtune command. In the example, the free memory stayed around the MINFREE value until it dropped to below 100 and almost to 0. This is one of the indications that the system was thrashing.
7.4.2.3 The page columnThe page column displays information about page faults and paging activity. These averages are given per second. Paging space is the part of virtual memory that resides on disk. It is used as an overflow when memory is overcommitted. Paging consists of paging logical volumes dedicated to the storage of working set pages that have been stolen from real memory. When a stolen page is referenced by the process, a page fault occurs and the page must be read into memory from paging space. Whenever a page of working storage is stolen, it is written to paging space. If not referenced again, it remains on the paging device until the process terminates or disclaims the space. Subsequent references to addresses contained within the faulted-out pages result in page faults, and the pages are paged in individually by the system. When a process terminates normally, any paging space allocated to that process is freed.
The re column, which is the number of reclaimed pages, remained at 0 throughout.
The pi column varied from 0 to the highest level of 56 pages paged in from paging space. Although a pi level of no more than 5 is considered acceptable, a level higher than 5 is not necessarily an indication of a performance problem, due to the fact that for every page paged in, there must have been a page that was paged out.
222 IBM Certification Study Guide AIX Performance and System Tuning
The po column, which reflected the number of pages paged out, was between 183 and 445 per second. With a high rate of paging, the system may see some performance degradation, as the paging space is kept on the hard disk and is accessed slower that RAM.
The fr column is the number of pages freed in a second.
The sr column is the number of pages scanned by the page placement algorithm. If the ratio between fr:sr is high, this can indicate a memory constraint, for example, if the ratio is 1:3, it will mean that for every page freed, three will need to be checked. In the example, the ratio is close to 1:2.
7.4.2.4 The faults columnThe information under the faults heading displays the trap and interrupt rate averages per second.
The in column is the number of device interrupts per second and is always greater than 100.
The sy column is the number of system calls and it is extremely difficult to say what this figure should be.
The cs column is the number of context switches.
7.4.2.5 The cpu columnThe information under the cpu heading provides a breakdown of CPU usage.
The us column indicates the amount of time spent in user mode. In the example, this is never above 5 percent.
The sy column indicates the amount of time spent in system mode. In this example, it is never below 92 percent.
The id column indicates the amount of idle time. In this example, the cpu is never idle.
The wa column indicates the amount of idle time with pending local disk I/O. In the example, it is never higher than 7 percent.
In a single processor system, if us + sy is greater than 90 percent, the system can be considered CPU bound.
Note
Chapter 7. Performance scenario walkthroughs 223
7.4.3 RecommendationFrom the data, the following are some recommendations that can be implemented to ease the situation:
• If it is possible, an additional CPU might be added to try and get the CPU utilization below 80 percent.
• Add an additional paging space on another internal disk. The reason for adding this paging area to an internal disk is for speed and availability. It is advisable to always spread the paging space across multiple disks, as this will improve paging performance.
• If this is a situation that occurs only at certain times, it may be possible to reschedule large jobs and spread them out, so as not to conflict with one another.
224 IBM Certification Study Guide AIX Performance and System Tuning
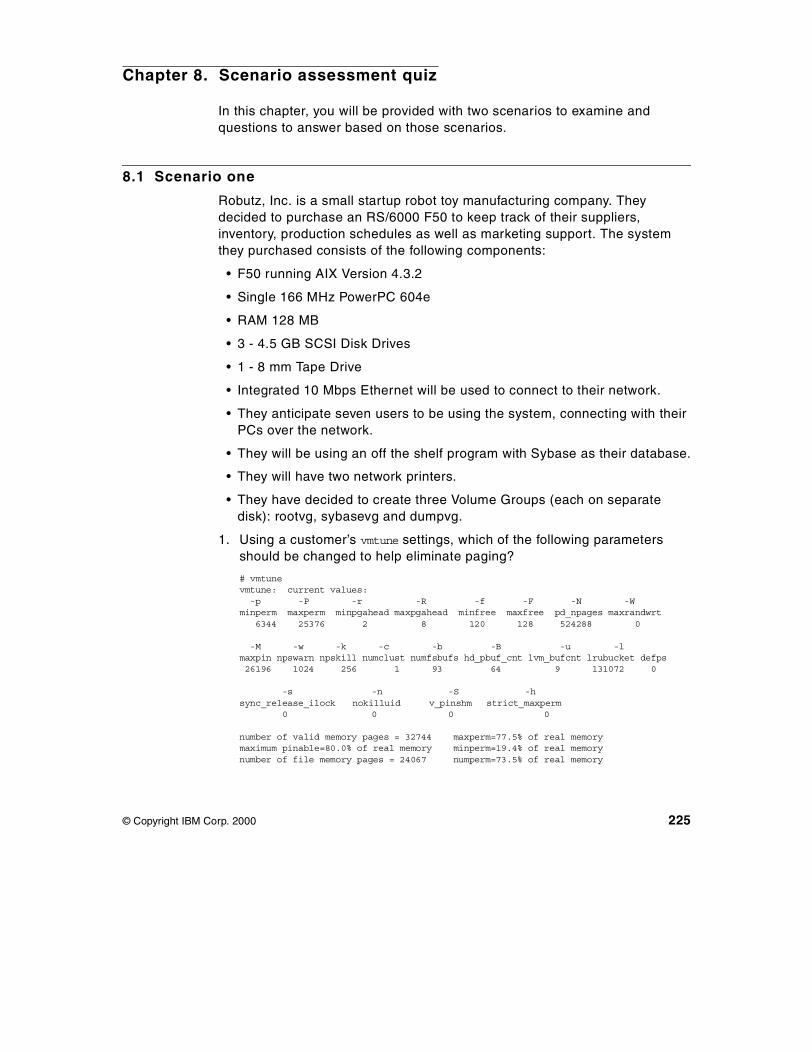
Chapter 8. Scenario assessment quiz
In this chapter, you will be provided with two scenarios to examine and questions to answer based on those scenarios.
8.1 Scenario one
Robutz, Inc. is a small startup robot toy manufacturing company. They decided to purchase an RS/6000 F50 to keep track of their suppliers, inventory, production schedules as well as marketing support. The system they purchased consists of the following components:
• F50 running AIX Version 4.3.2
• Single 166 MHz PowerPC 604e
• RAM 128 MB
• 3 - 4.5 GB SCSI Disk Drives
• 1 - 8 mm Tape Drive
• Integrated 10 Mbps Ethernet will be used to connect to their network.
• They anticipate seven users to be using the system, connecting with their PCs over the network.
• They will be using an off the shelf program with Sybase as their database.
• They will have two network printers.
• They have decided to create three Volume Groups (each on separate disk): rootvg, sybasevg and dumpvg.
1. Using a customer’s vmtune settings, which of the following parameters should be changed to help eliminate paging?
# vmtunevmtune: current values:-p -P -r -R -f -F -N -W
minperm maxperm minpgahead maxpgahead minfree maxfree pd_npages maxrandwrt6344 25376 2 8 120 128 524288 0
-M -w -k -c -b -B -u -lmaxpin npswarn npskill numclust numfsbufs hd_pbuf_cnt lvm_bufcnt lrubucket defps26196 1024 256 1 93 64 9 131072 0
-s -n -S -hsync_release_ilock nokilluid v_pinshm strict_maxperm
0 0 0 0
number of valid memory pages = 32744 maxperm=77.5% of real memorymaximum pinable=80.0% of real memory minperm=19.4% of real memorynumber of file memory pages = 24067 numperm=73.5% of real memory
© Copyright IBM Corp. 2000 225
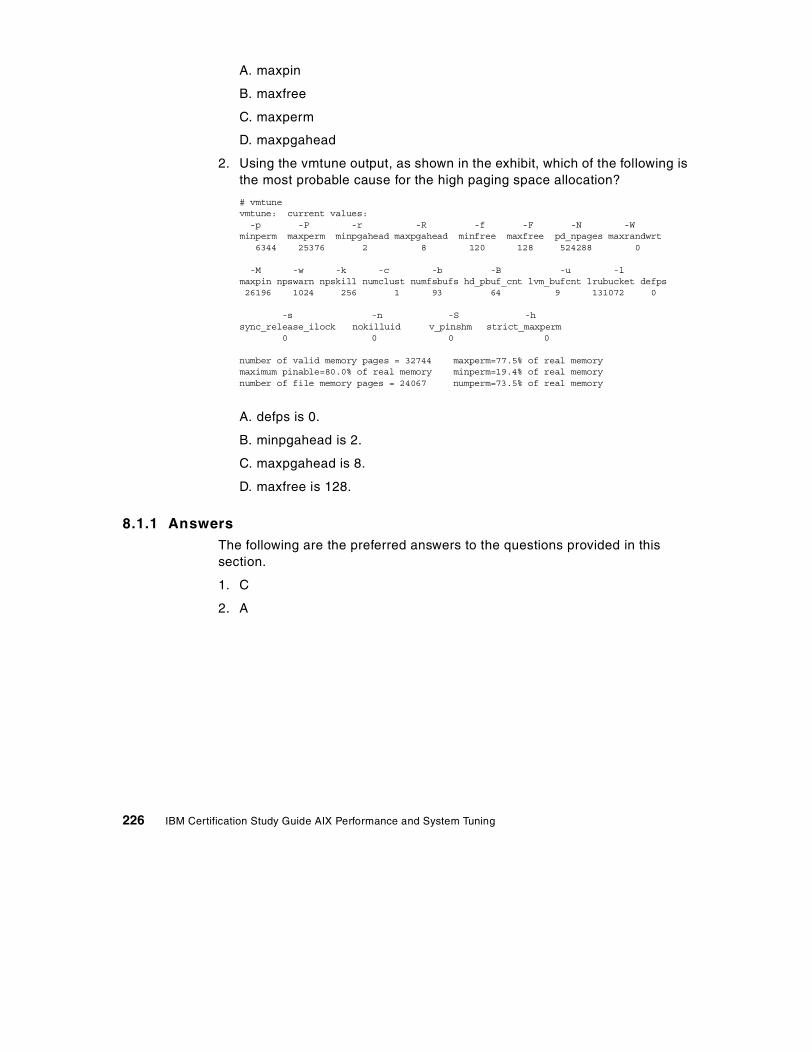
A. maxpin
B. maxfree
C. maxperm
D. maxpgahead
2. Using the vmtune output, as shown in the exhibit, which of the following is the most probable cause for the high paging space allocation?
# vmtunevmtune: current values:-p -P -r -R -f -F -N -W
minperm maxperm minpgahead maxpgahead minfree maxfree pd_npages maxrandwrt6344 25376 2 8 120 128 524288 0
-M -w -k -c -b -B -u -lmaxpin npswarn npskill numclust numfsbufs hd_pbuf_cnt lvm_bufcnt lrubucket defps26196 1024 256 1 93 64 9 131072 0
-s -n -S -hsync_release_ilock nokilluid v_pinshm strict_maxperm
0 0 0 0
number of valid memory pages = 32744 maxperm=77.5% of real memorymaximum pinable=80.0% of real memory minperm=19.4% of real memorynumber of file memory pages = 24067 numperm=73.5% of real memory
A. defps is 0.
B. minpgahead is 2.
C. maxpgahead is 8.
D. maxfree is 128.
8.1.1 AnswersThe following are the preferred answers to the questions provided in this section.
1. C
2. A
226 IBM Certification Study Guide AIX Performance and System Tuning
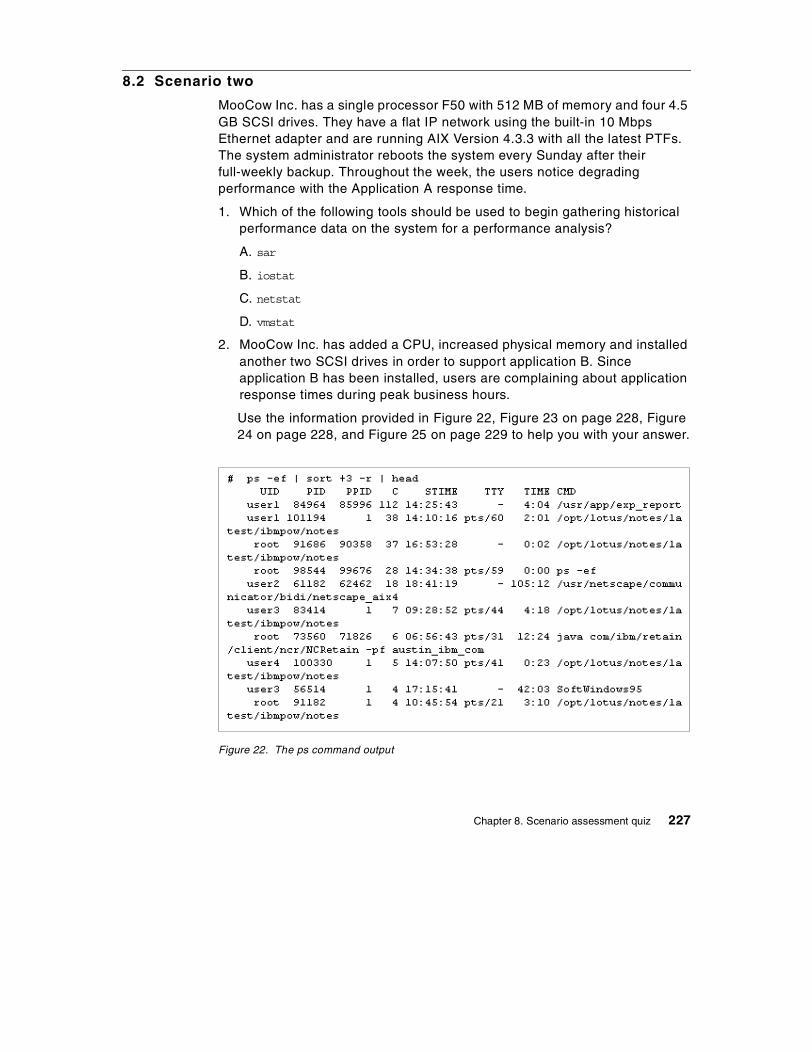
8.2 Scenario two
MooCow Inc. has a single processor F50 with 512 MB of memory and four 4.5 GB SCSI drives. They have a flat IP network using the built-in 10 Mbps Ethernet adapter and are running AIX Version 4.3.3 with all the latest PTFs. The system administrator reboots the system every Sunday after their full-weekly backup. Throughout the week, the users notice degrading performance with the Application A response time.
1. Which of the following tools should be used to begin gathering historical performance data on the system for a performance analysis?
A. sar
B. iostat
C. netstat
D. vmstat
2. MooCow Inc. has added a CPU, increased physical memory and installed another two SCSI drives in order to support application B. Since application B has been installed, users are complaining about application response times during peak business hours.
Use the information provided in Figure 22, Figure 23 on page 228, Figure 24 on page 228, and Figure 25 on page 229 to help you with your answer.
Figure 22. The ps command output
Chapter 8. Scenario assessment quiz 227
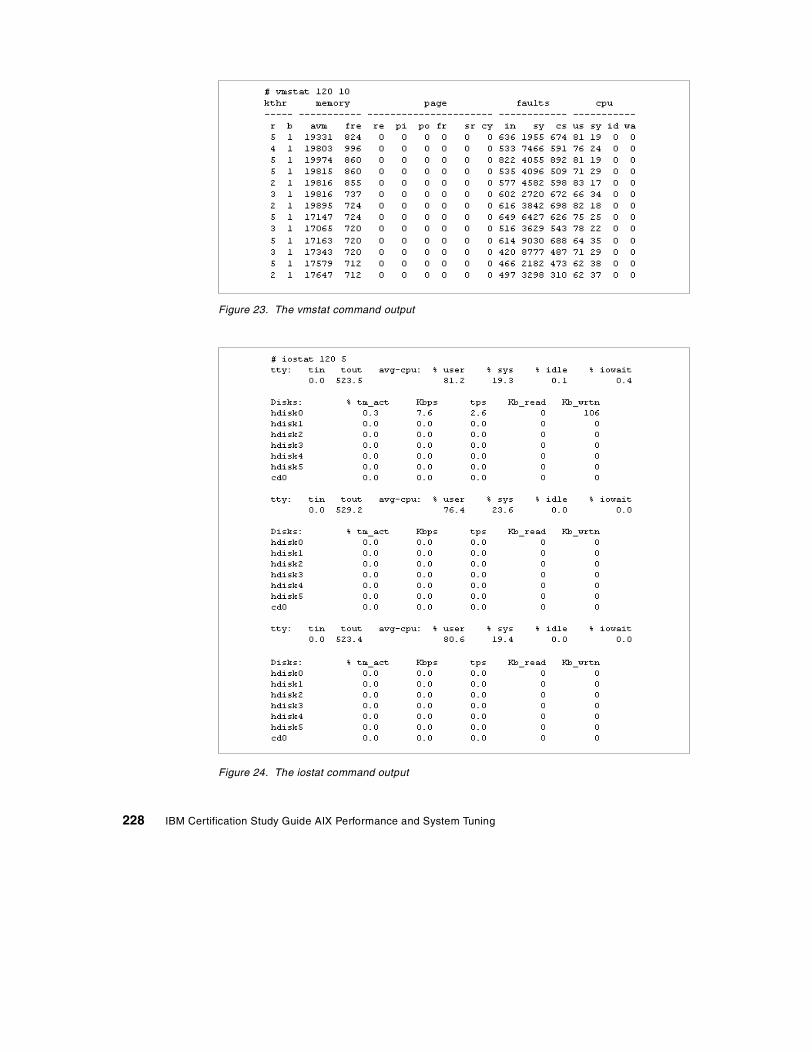
Figure 23. The vmstat command output
Figure 24. The iostat command output
228 IBM Certification Study Guide AIX Performance and System Tuning
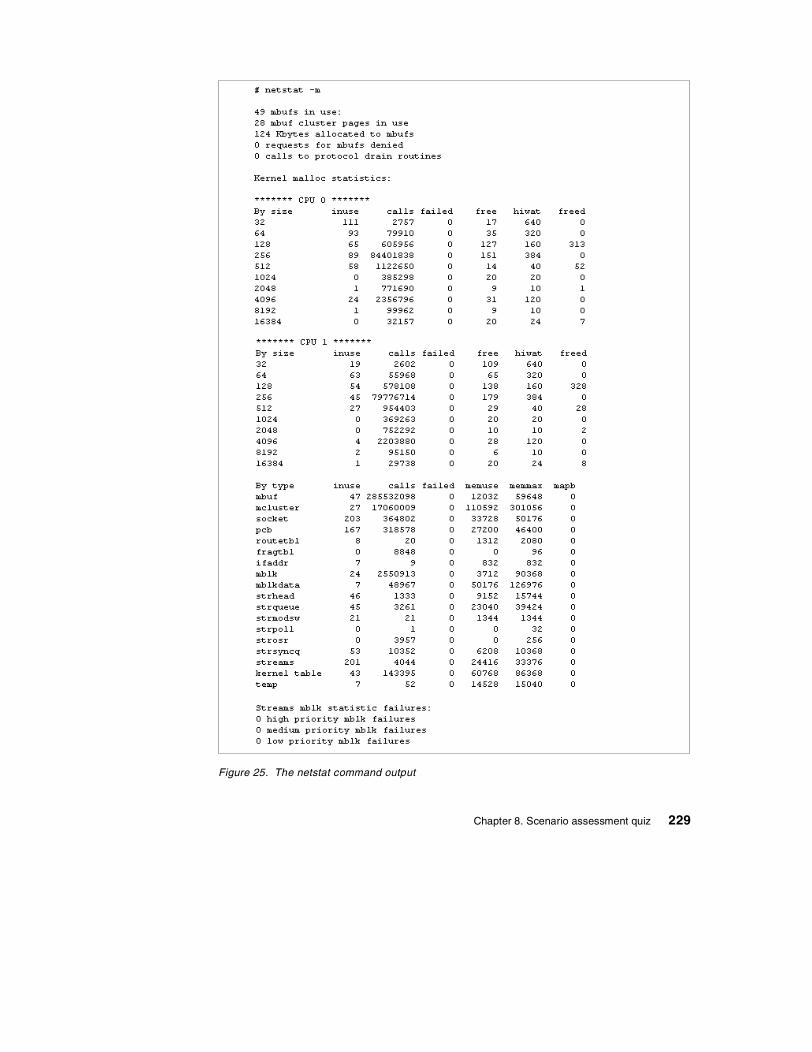
Figure 25. The netstat command output
Chapter 8. Scenario assessment quiz 229
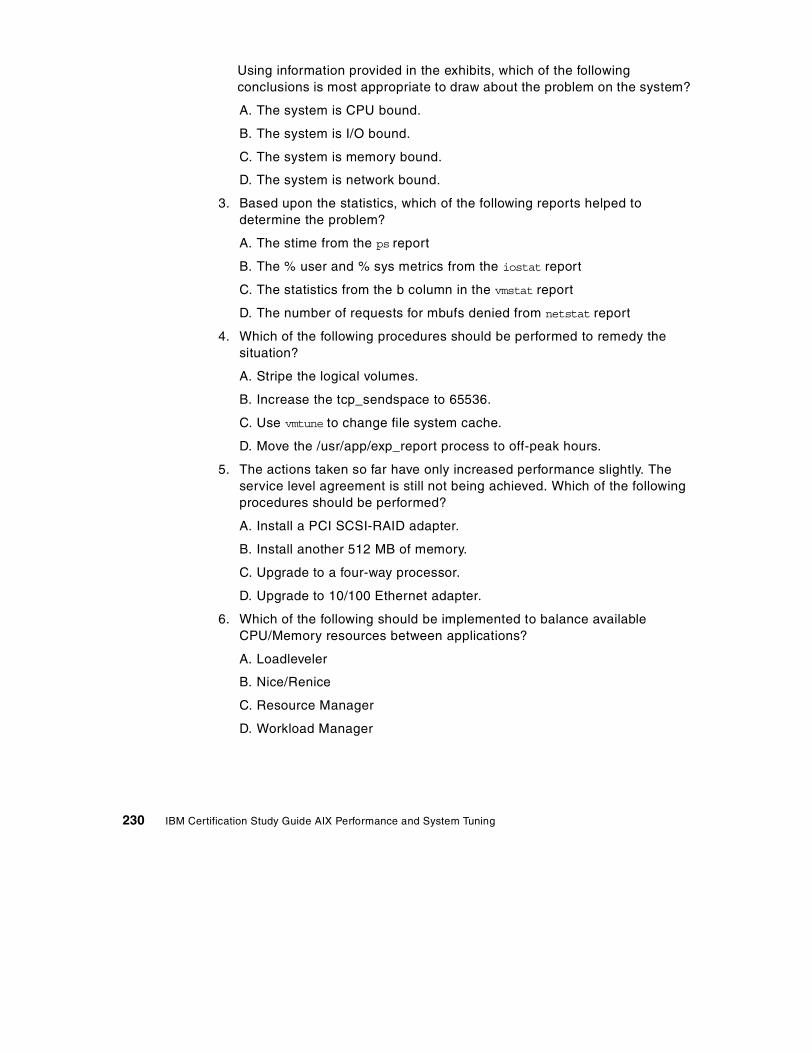
Using information provided in the exhibits, which of the following conclusions is most appropriate to draw about the problem on the system?
A. The system is CPU bound.
B. The system is I/O bound.
C. The system is memory bound.
D. The system is network bound.
3. Based upon the statistics, which of the following reports helped to determine the problem?
A. The stime from the ps report
B. The % user and % sys metrics from the iostat report
C. The statistics from the b column in the vmstat report
D. The number of requests for mbufs denied from netstat report
4. Which of the following procedures should be performed to remedy the situation?
A. Stripe the logical volumes.
B. Increase the tcp_sendspace to 65536.
C. Use vmtune to change file system cache.
D. Move the /usr/app/exp_report process to off-peak hours.
5. The actions taken so far have only increased performance slightly. The service level agreement is still not being achieved. Which of the following procedures should be performed?
A. Install a PCI SCSI-RAID adapter.
B. Install another 512 MB of memory.
C. Upgrade to a four-way processor.
D. Upgrade to 10/100 Ethernet adapter.
6. Which of the following should be implemented to balance available CPU/Memory resources between applications?
A. Loadleveler
B. Nice/Renice
C. Resource Manager
D. Workload Manager
230 IBM Certification Study Guide AIX Performance and System Tuning
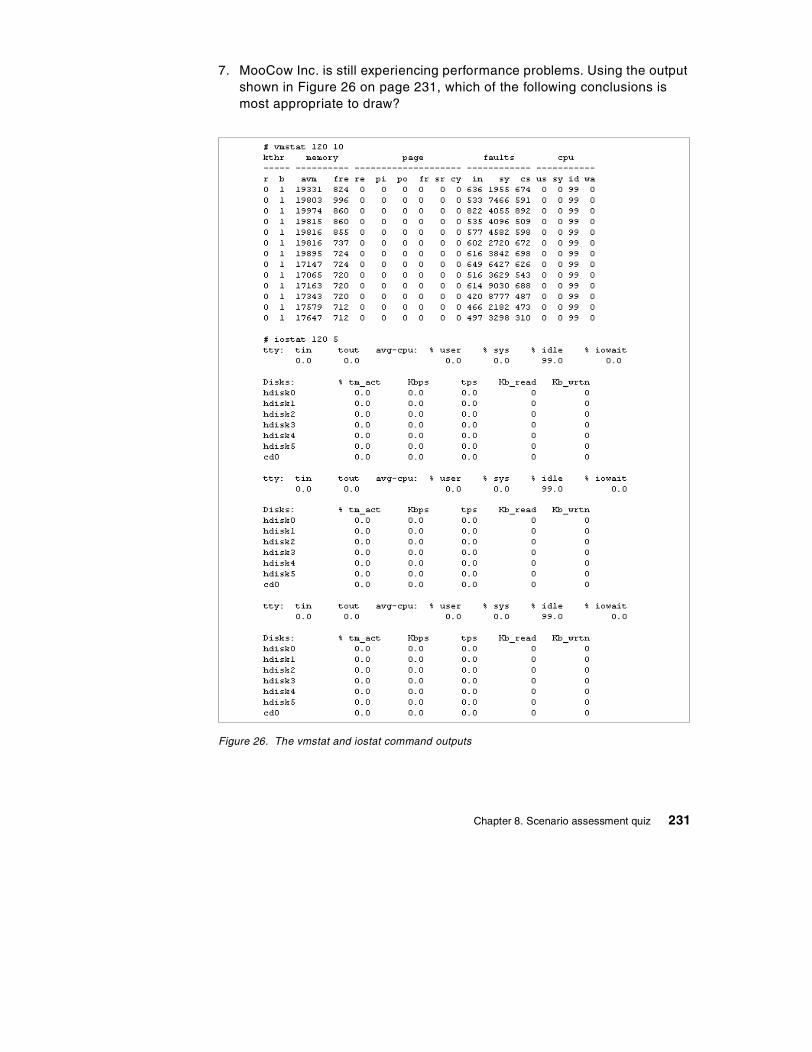
7. MooCow Inc. is still experiencing performance problems. Using the output shown in Figure 26 on page 231, which of the following conclusions is most appropriate to draw?
Figure 26. The vmstat and iostat command outputs
Chapter 8. Scenario assessment quiz 231
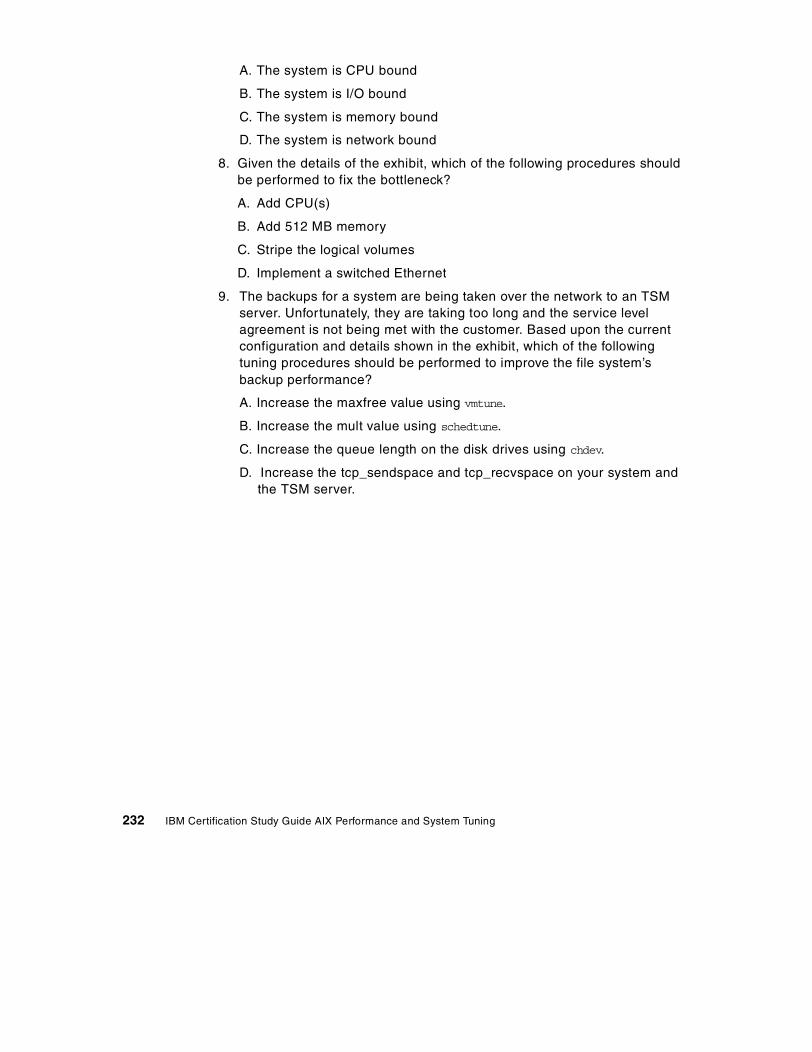
A. The system is CPU bound
B. The system is I/O bound
C. The system is memory bound
D. The system is network bound
8. Given the details of the exhibit, which of the following procedures should be performed to fix the bottleneck?
A. Add CPU(s)
B. Add 512 MB memory
C. Stripe the logical volumes
D. Implement a switched Ethernet
9. The backups for a system are being taken over the network to an TSM server. Unfortunately, they are taking too long and the service level agreement is not being met with the customer. Based upon the current configuration and details shown in the exhibit, which of the following tuning procedures should be performed to improve the file system’s backup performance?
A. Increase the maxfree value using vmtune.
B. Increase the mult value using schedtune.
C. Increase the queue length on the disk drives using chdev.
D. Increase the tcp_sendspace and tcp_recvspace on your system and the TSM server.
232 IBM Certification Study Guide AIX Performance and System Tuning
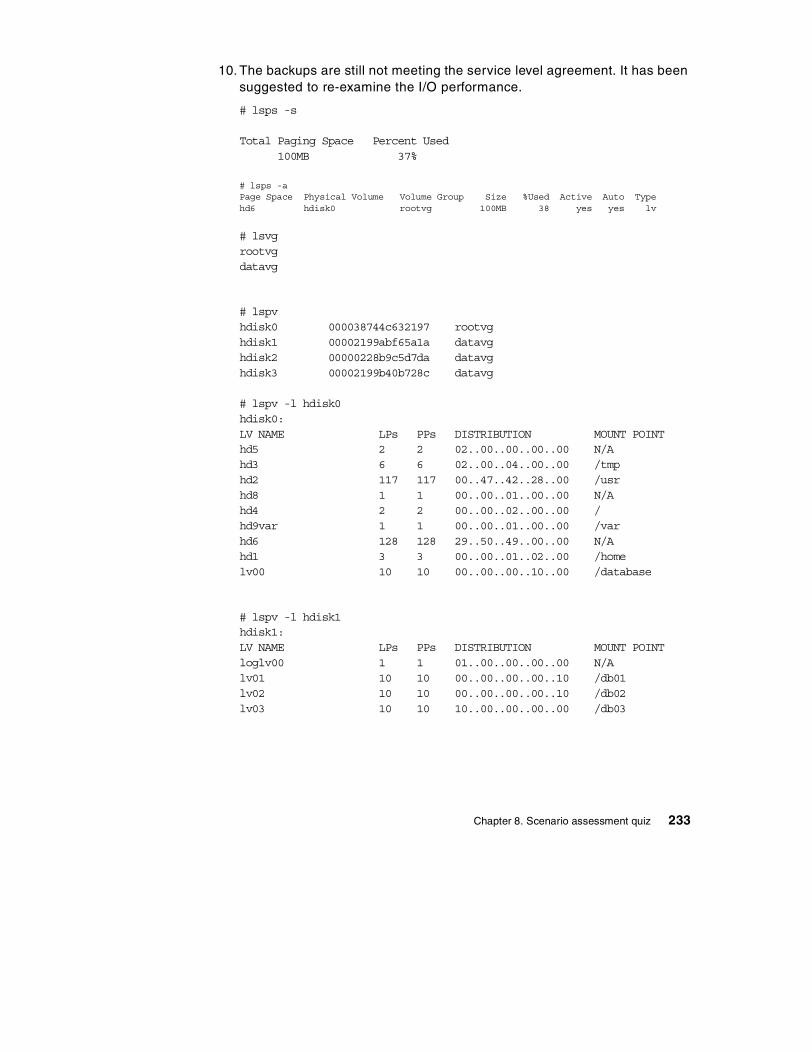
10. The backups are still not meeting the service level agreement. It has been suggested to re-examine the I/O performance.
# lsps -s
Total Paging Space Percent Used100MB 37%
# lsps -aPage Space Physical Volume Volume Group Size %Used Active Auto Typehd6 hdisk0 rootvg 100MB 38 yes yes lv
# lsvgrootvgdatavg
# lspvhdisk0 000038744c632197 rootvghdisk1 00002199abf65a1a datavghdisk2 00000228b9c5d7da datavghdisk3 00002199b40b728c datavg
# lspv -l hdisk0hdisk0:LV NAME LPs PPs DISTRIBUTION MOUNT POINThd5 2 2 02..00..00..00..00 N/Ahd3 6 6 02..00..04..00..00 /tmphd2 117 117 00..47..42..28..00 /usrhd8 1 1 00..00..01..00..00 N/Ahd4 2 2 00..00..02..00..00 /hd9var 1 1 00..00..01..00..00 /varhd6 128 128 29..50..49..00..00 N/Ahd1 3 3 00..00..01..02..00 /homelv00 10 10 00..00..00..10..00 /database
# lspv -l hdisk1hdisk1:LV NAME LPs PPs DISTRIBUTION MOUNT POINTloglv00 1 1 01..00..00..00..00 N/Alv01 10 10 00..00..00..00..10 /db01lv02 10 10 00..00..00..00..10 /db02lv03 10 10 10..00..00..00..00 /db03
Chapter 8. Scenario assessment quiz 233
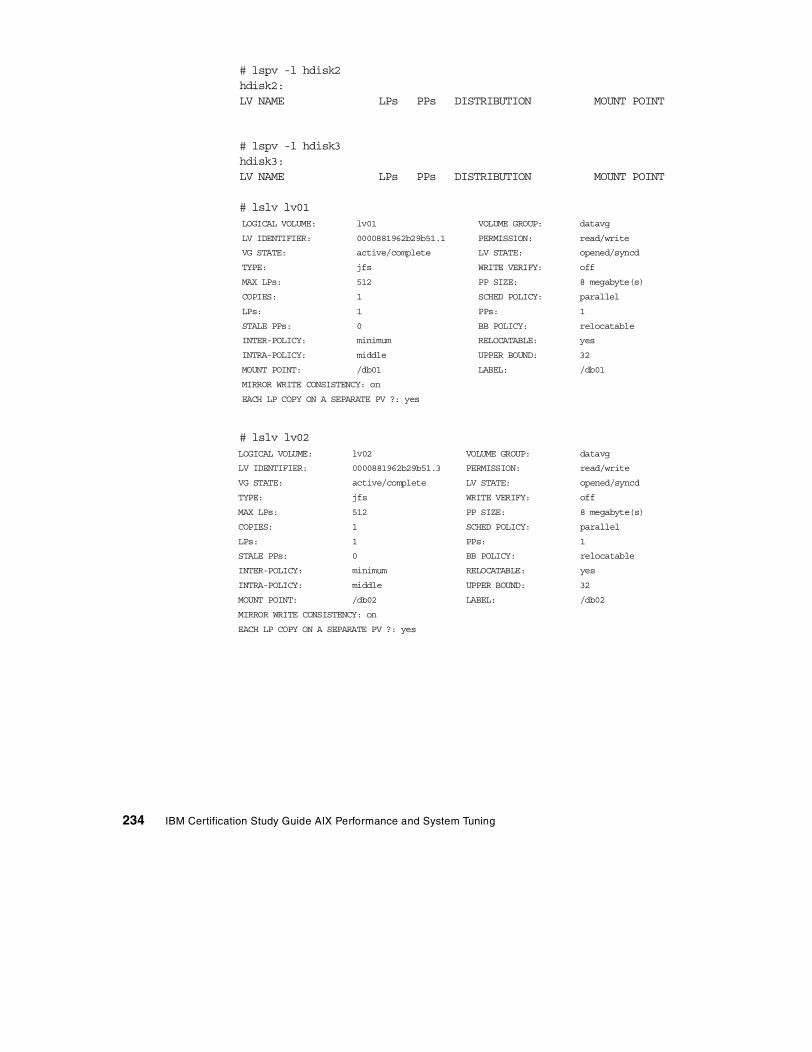
# lspv -l hdisk2hdisk2:LV NAME LPs PPs DISTRIBUTION MOUNT POINT
# lspv -l hdisk3hdisk3:LV NAME LPs PPs DISTRIBUTION MOUNT POINT
# lslv lv01
# lslv lv02
LOGICAL VOLUME: lv01 VOLUME GROUP: datavg
LV IDENTIFIER: 0000881962b29b51.1 PERMISSION: read/write
VG STATE: active/complete LV STATE: opened/syncd
TYPE: jfs WRITE VERIFY: off
MAX LPs: 512 PP SIZE: 8 megabyte(s)
COPIES: 1 SCHED POLICY: parallel
LPs: 1 PPs: 1
STALE PPs: 0 BB POLICY: relocatable
INTER-POLICY: minimum RELOCATABLE: yes
INTRA-POLICY: middle UPPER BOUND: 32
MOUNT POINT: /db01 LABEL: /db01
MIRROR WRITE CONSISTENCY: on
EACH LP COPY ON A SEPARATE PV ?: yes
LOGICAL VOLUME: lv02 VOLUME GROUP: datavg
LV IDENTIFIER: 0000881962b29b51.3 PERMISSION: read/write
VG STATE: active/complete LV STATE: opened/syncd
TYPE: jfs WRITE VERIFY: off
MAX LPs: 512 PP SIZE: 8 megabyte(s)
COPIES: 1 SCHED POLICY: parallel
LPs: 1 PPs: 1
STALE PPs: 0 BB POLICY: relocatable
INTER-POLICY: minimum RELOCATABLE: yes
INTRA-POLICY: middle UPPER BOUND: 32
MOUNT POINT: /db02 LABEL: /db02
MIRROR WRITE CONSISTENCY: on
EACH LP COPY ON A SEPARATE PV ?: yes
234 IBM Certification Study Guide AIX Performance and System Tuning
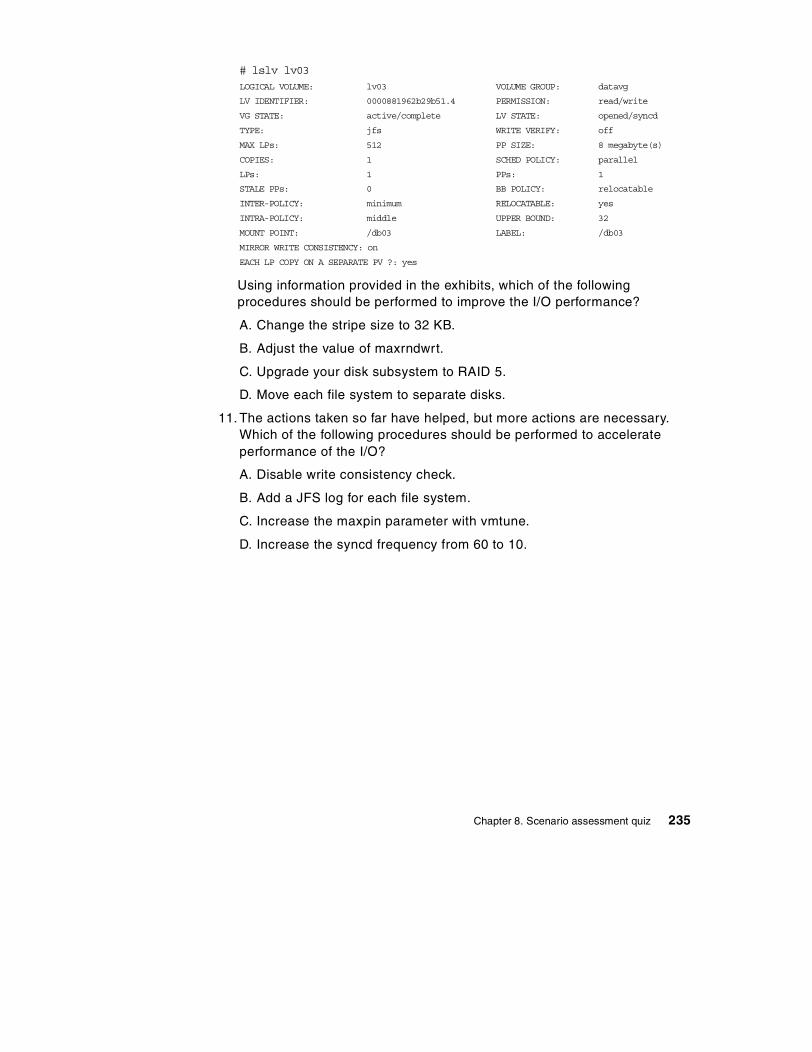
# lslv lv03
Using information provided in the exhibits, which of the following procedures should be performed to improve the I/O performance?
A. Change the stripe size to 32 KB.
B. Adjust the value of maxrndwrt.
C. Upgrade your disk subsystem to RAID 5.
D. Move each file system to separate disks.
11. The actions taken so far have helped, but more actions are necessary. Which of the following procedures should be performed to accelerate performance of the I/O?
A. Disable write consistency check.
B. Add a JFS log for each file system.
C. Increase the maxpin parameter with vmtune.
D. Increase the syncd frequency from 60 to 10.
LOGICAL VOLUME: lv03 VOLUME GROUP: datavg
LV IDENTIFIER: 0000881962b29b51.4 PERMISSION: read/write
VG STATE: active/complete LV STATE: opened/syncd
TYPE: jfs WRITE VERIFY: off
MAX LPs: 512 PP SIZE: 8 megabyte(s)
COPIES: 1 SCHED POLICY: parallel
LPs: 1 PPs: 1
STALE PPs: 0 BB POLICY: relocatable
INTER-POLICY: minimum RELOCATABLE: yes
INTRA-POLICY: middle UPPER BOUND: 32
MOUNT POINT: /db03 LABEL: /db03
MIRROR WRITE CONSISTENCY: on
EACH LP COPY ON A SEPARATE PV ?: yes
Chapter 8. Scenario assessment quiz 235
8.2.1 AnswersThe following are the preferred answers to the questions provided in this section.
1. A
2. A
3. B
4. D
5. C
6. D
7. D
8. D
9. D
10.D
11. B
236 IBM Certification Study Guide AIX Performance and System Tuning
Appendix A. The error log
The following topics are discussed in this appendix:
• A general discussion about the error logging subsystem
• How to manage error logs
• How to read error logs
The error log is the first place where an administrator will search for the cause of improper system performance.
A.1 Overview
The error logging process begins when an operating system module detects an error. The error-detecting segment of code then sends error information to either the errsave and errlast kernel services or the errlog application subroutine where the information is, in turn, written to the /dev/error special file. This process then adds a time stamp to the collected data. The errdemon daemon constantly checks the /dev/error file for new entries, and when new data is written, the daemon conducts a series of operations.
Before an entry is written to the error log, the errdemon daemon compares the label sent by the kernel or application code to the contents of the error record template repository. If the label matches an item in the repository, the daemon collects additional data from other parts of the system.
The system administrator can look at the error log to determine what caused a failure, or to periodically check the health of the system when it is running.
The software components that allow the AIX kernel and commands to log errors to the error log are contained in the fileset bos.rte.serv_aid. This fileset is automatically installed as part of the AIX installation process.
The commands that allow you to view and manipulate the error log, such as the errpt and errclear commands, are contained in the fileset called bos.sysmgt.serv_aid. This fileset is not automatically installed by earlier releases of AIX Version 4. Use the following command to check whether the package is installed on your system:
# lslpp -l bos.sysmgt.serv_aidFileset Level State Description
--------------------------------------------------------------------------Path: /usr/lib/objreposbos.sysmgt.serv_aid 4.3.3.0 COMMITTED Software Error Logging and
© Copyright IBM Corp. 2000 237
Dump Service Aids
Path: /etc/objreposbos.sysmgt.serv_aid 4.3.3.0 COMMITTED Software Error Logging and
Dump Service Aids
A.2 Managing the error log
Error logging is automatically started during system initialization by the /sbin/rc.boot script and is automatically stopped during system shutdown by the shutdown script. The part of /sbin/rc.boot that starts error logging looks such as:
if [ -x /usr/lib/errdemon ]then
echo "Starting the error daemon" | alog -t boot/usr/bin/rm -f /tmp/errdemon.$$/usr/lib/errdemon >/tmp/errdemon.$$ 2>&1if [ $? -ne 0 ]then
cat /tmp/errdemon.$$ | alog -t bootecho "Starting the errdemon with the system default" \
"log file, /var/adm/ras/errlog." | alog -t boot/usr/lib/errdemon -i /var/adm/ras/errlog
fi/usr/bin/rm -f /tmp/errdemon.$$
fi
As you can see the /usr/lib/errdemon command starts error logging and initializes /var/adm/ras/errlog as a default log file.
A.2.1 Configuring error log
You can customize the name and location of the error log file and the size of the internal error buffer to suit your needs.
To list the current settings, run /usr/lib/errdemon -l. The values for the error log file name, error log file size, and buffer size that are currently stored in the error log configuration database are displayed on your screen.
# /usr/lib/errdemon -lError Log Attributes--------------------------------------------Log File /var/adm/ras/errlogLog Size 1048576 bytesMemory Buffer Size 8192 bytes
238 IBM Certification Study Guide AIX Performance and System Tuning
You can change all of values listed above:
• To change the name of the file used for error logging, run:
# /usr/lib/errdemon -i /var/adm/ras/errlog.new
The /var/adm/ras/errlog.new file name is saved in the error log configuration database and the error daemon is immediately restarted.
• To change the maximum size of the error log file to 2000000 bytes, type:
# /usr/lib/errdemon -s 2000000
The specified log file size limit is saved in the error log configuration database and the error daemon is immediately restarted.
• To change the size of the error log device driver's internal buffer to 16384 bytes, enter:
# /usr/lib/errdemon -B 163840315-175 The error log memory buffer size you supplied will be roundedup to a multiple of 4096 bytes.
The specified buffer size is saved in the error log configuration database and, if it is larger than the buffer size currently in use, the in-memory buffer is immediately increased. The size you specify is rounded up to the next integral multiple of the memory page size (4 KBs).
Now verify what you did with the following command. Note the highlighted values reflect the changes you made:
# /usr/lib/errdemon -lError Log Attributes--------------------------------------------Log File /var/adm/ras/errlog.newLog Size 2000000 bytesMemory Buffer Size 16384 bytes
A.2.2 Clearing the error log
Clearing of the error log implies deleting old or unnecessary entries from the error log. Clearing is normally done as part of the daily cron command execution. To check it, type:
# crontab -l | grep errclear0 11 * * * /usr/bin/errclear -d S,O 30
The memory used for the error log device driver's in-memory buffer is not available for use by other processes (the buffer is pinned).
Note
Appendix A. The error log 239
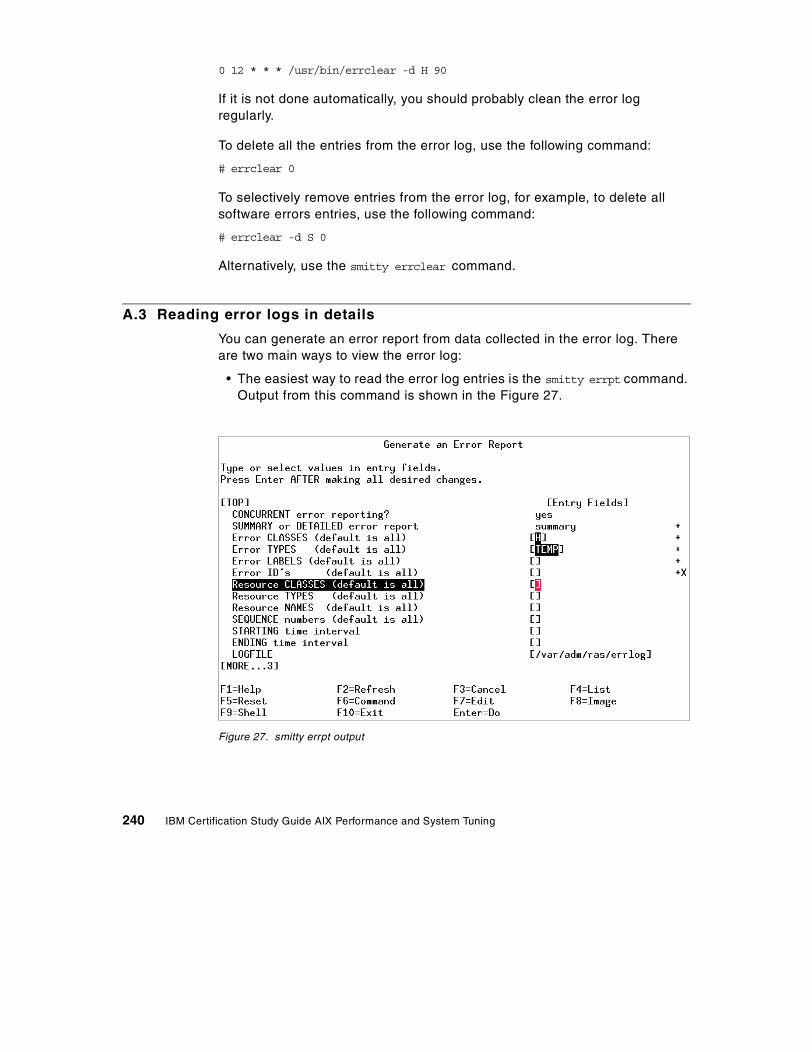
0 12 * * * /usr/bin/errclear -d H 90
If it is not done automatically, you should probably clean the error log regularly.
To delete all the entries from the error log, use the following command:
# errclear 0
To selectively remove entries from the error log, for example, to delete all software errors entries, use the following command:
# errclear -d S 0
Alternatively, use the smitty errclear command.
A.3 Reading error logs in details
You can generate an error report from data collected in the error log. There are two main ways to view the error log:
• The easiest way to read the error log entries is the smitty errpt command. Output from this command is shown in the Figure 27.
Figure 27. smitty errpt output
240 IBM Certification Study Guide AIX Performance and System Tuning
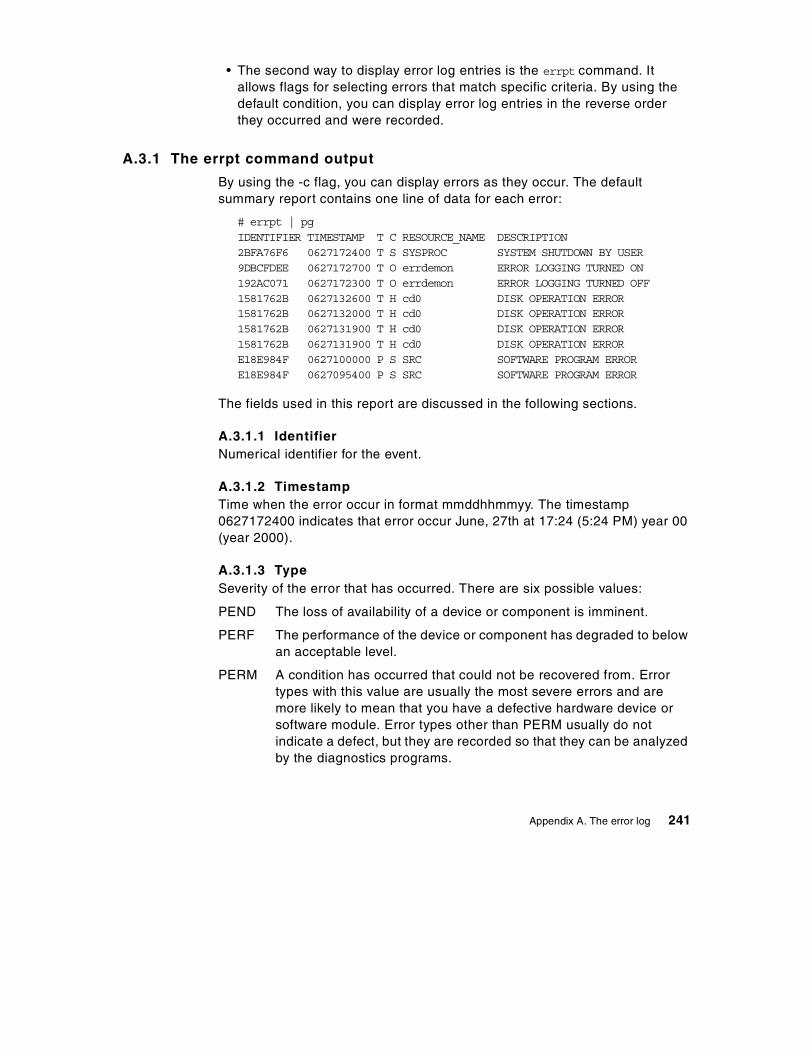
• The second way to display error log entries is the errpt command. It allows flags for selecting errors that match specific criteria. By using the default condition, you can display error log entries in the reverse order they occurred and were recorded.
A.3.1 The errpt command output
By using the -c flag, you can display errors as they occur. The default summary report contains one line of data for each error:
# errpt | pgIDENTIFIER TIMESTAMP T C RESOURCE_NAME DESCRIPTION2BFA76F6 0627172400 T S SYSPROC SYSTEM SHUTDOWN BY USER9DBCFDEE 0627172700 T O errdemon ERROR LOGGING TURNED ON192AC071 0627172300 T O errdemon ERROR LOGGING TURNED OFF1581762B 0627132600 T H cd0 DISK OPERATION ERROR1581762B 0627132000 T H cd0 DISK OPERATION ERROR1581762B 0627131900 T H cd0 DISK OPERATION ERROR1581762B 0627131900 T H cd0 DISK OPERATION ERRORE18E984F 0627100000 P S SRC SOFTWARE PROGRAM ERRORE18E984F 0627095400 P S SRC SOFTWARE PROGRAM ERROR
The fields used in this report are discussed in the following sections.
A.3.1.1 IdentifierNumerical identifier for the event.
A.3.1.2 TimestampTime when the error occur in format mmddhhmmyy. The timestamp 0627172400 indicates that error occur June, 27th at 17:24 (5:24 PM) year 00 (year 2000).
A.3.1.3 TypeSeverity of the error that has occurred. There are six possible values:
PEND The loss of availability of a device or component is imminent.
PERF The performance of the device or component has degraded to below an acceptable level.
PERM A condition has occurred that could not be recovered from. Error types with this value are usually the most severe errors and are more likely to mean that you have a defective hardware device or software module. Error types other than PERM usually do not indicate a defect, but they are recorded so that they can be analyzed by the diagnostics programs.
Appendix A. The error log 241
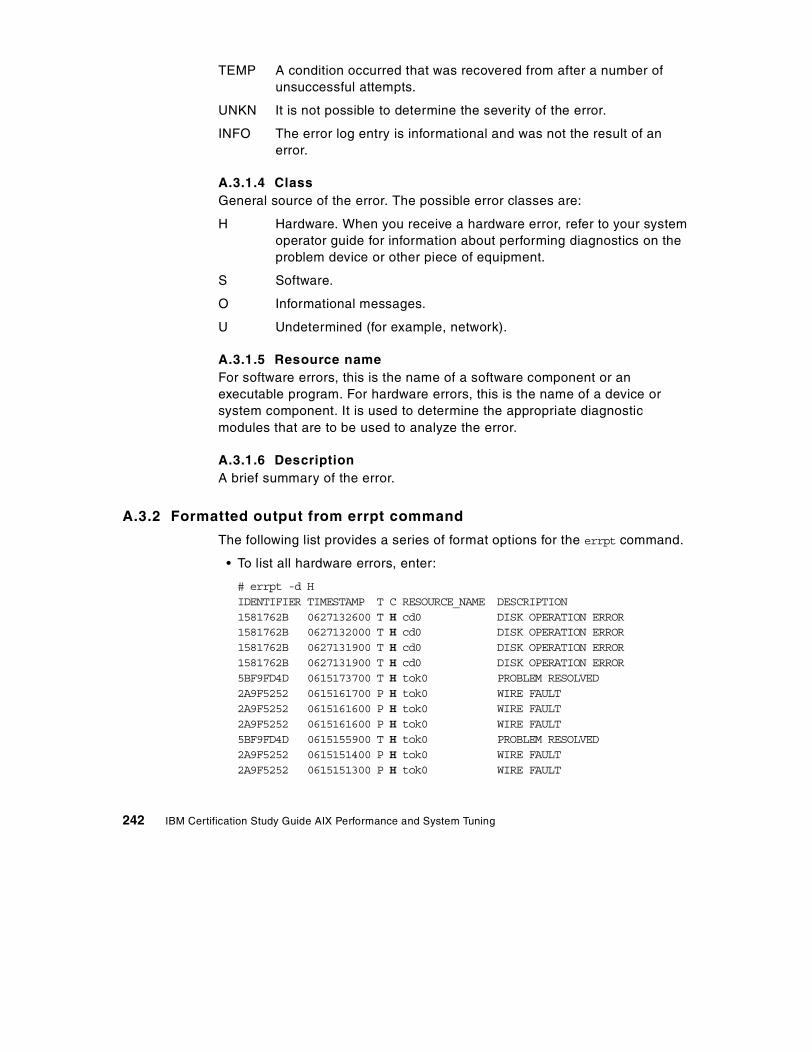
TEMP A condition occurred that was recovered from after a number of unsuccessful attempts.
UNKN It is not possible to determine the severity of the error.
INFO The error log entry is informational and was not the result of an error.
A.3.1.4 ClassGeneral source of the error. The possible error classes are:
H Hardware. When you receive a hardware error, refer to your system operator guide for information about performing diagnostics on the problem device or other piece of equipment.
S Software.
O Informational messages.
U Undetermined (for example, network).
A.3.1.5 Resource nameFor software errors, this is the name of a software component or an executable program. For hardware errors, this is the name of a device or system component. It is used to determine the appropriate diagnostic modules that are to be used to analyze the error.
A.3.1.6 DescriptionA brief summary of the error.
A.3.2 Formatted output from errpt command
The following list provides a series of format options for the errpt command.
• To list all hardware errors, enter:
# errpt -d HIDENTIFIER TIMESTAMP T C RESOURCE_NAME DESCRIPTION1581762B 0627132600 T H cd0 DISK OPERATION ERROR1581762B 0627132000 T H cd0 DISK OPERATION ERROR1581762B 0627131900 T H cd0 DISK OPERATION ERROR1581762B 0627131900 T H cd0 DISK OPERATION ERROR5BF9FD4D 0615173700 T H tok0 PROBLEM RESOLVED2A9F5252 0615161700 P H tok0 WIRE FAULT2A9F5252 0615161600 P H tok0 WIRE FAULT2A9F5252 0615161600 P H tok0 WIRE FAULT5BF9FD4D 0615155900 T H tok0 PROBLEM RESOLVED2A9F5252 0615151400 P H tok0 WIRE FAULT2A9F5252 0615151300 P H tok0 WIRE FAULT
242 IBM Certification Study Guide AIX Performance and System Tuning
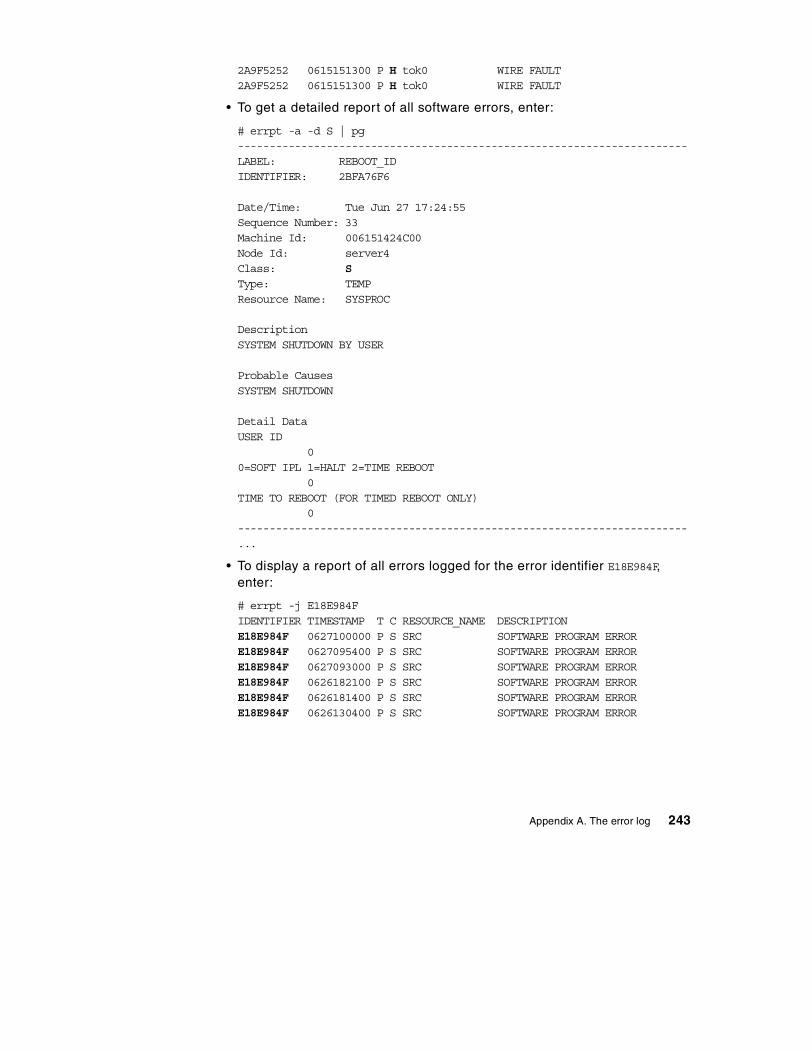
2A9F5252 0615151300 P H tok0 WIRE FAULT2A9F5252 0615151300 P H tok0 WIRE FAULT
• To get a detailed report of all software errors, enter:
# errpt -a -d S | pg-----------------------------------------------------------------------LABEL: REBOOT_IDIDENTIFIER: 2BFA76F6
Date/Time: Tue Jun 27 17:24:55Sequence Number: 33Machine Id: 006151424C00Node Id: server4Class: SType: TEMPResource Name: SYSPROC
DescriptionSYSTEM SHUTDOWN BY USER
Probable CausesSYSTEM SHUTDOWN
Detail DataUSER ID
00=SOFT IPL 1=HALT 2=TIME REBOOT
0TIME TO REBOOT (FOR TIMED REBOOT ONLY)
0-----------------------------------------------------------------------...
• To display a report of all errors logged for the error identifier E18E984F, enter:
# errpt -j E18E984FIDENTIFIER TIMESTAMP T C RESOURCE_NAME DESCRIPTIONE18E984F 0627100000 P S SRC SOFTWARE PROGRAM ERRORE18E984F 0627095400 P S SRC SOFTWARE PROGRAM ERRORE18E984F 0627093000 P S SRC SOFTWARE PROGRAM ERRORE18E984F 0626182100 P S SRC SOFTWARE PROGRAM ERRORE18E984F 0626181400 P S SRC SOFTWARE PROGRAM ERRORE18E984F 0626130400 P S SRC SOFTWARE PROGRAM ERROR
Appendix A. The error log 243
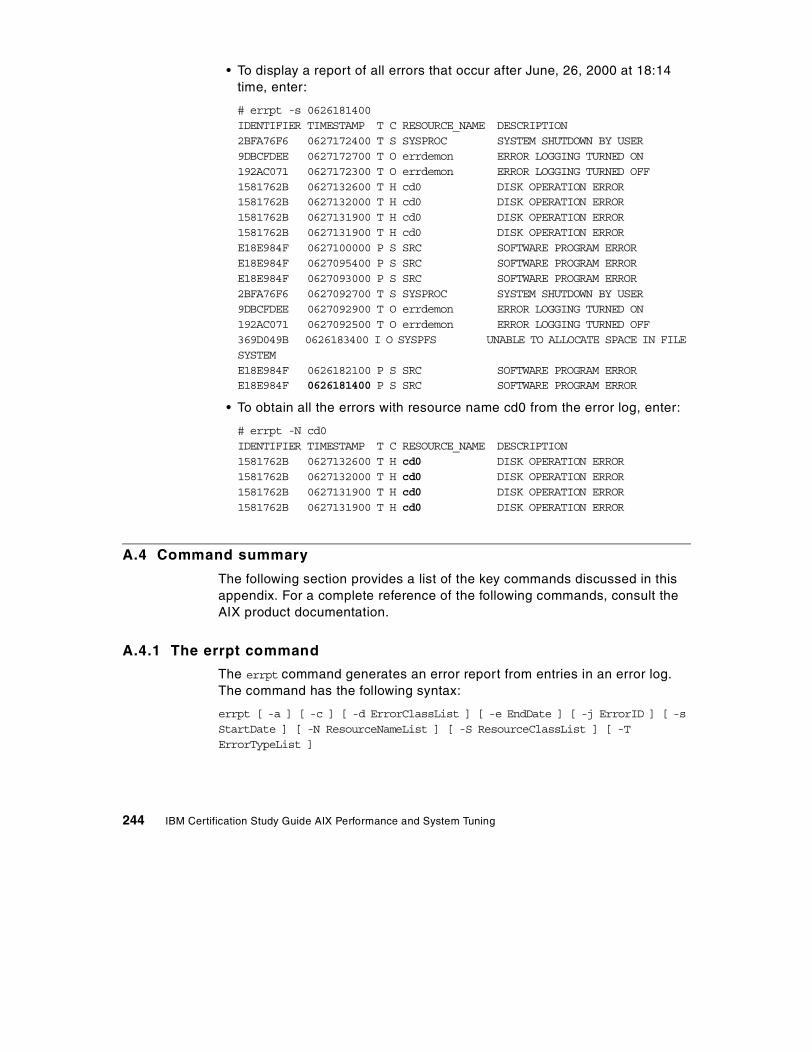
• To display a report of all errors that occur after June, 26, 2000 at 18:14 time, enter:
# errpt -s 0626181400IDENTIFIER TIMESTAMP T C RESOURCE_NAME DESCRIPTION2BFA76F6 0627172400 T S SYSPROC SYSTEM SHUTDOWN BY USER9DBCFDEE 0627172700 T O errdemon ERROR LOGGING TURNED ON192AC071 0627172300 T O errdemon ERROR LOGGING TURNED OFF1581762B 0627132600 T H cd0 DISK OPERATION ERROR1581762B 0627132000 T H cd0 DISK OPERATION ERROR1581762B 0627131900 T H cd0 DISK OPERATION ERROR1581762B 0627131900 T H cd0 DISK OPERATION ERRORE18E984F 0627100000 P S SRC SOFTWARE PROGRAM ERRORE18E984F 0627095400 P S SRC SOFTWARE PROGRAM ERRORE18E984F 0627093000 P S SRC SOFTWARE PROGRAM ERROR2BFA76F6 0627092700 T S SYSPROC SYSTEM SHUTDOWN BY USER9DBCFDEE 0627092900 T O errdemon ERROR LOGGING TURNED ON192AC071 0627092500 T O errdemon ERROR LOGGING TURNED OFF369D049B 0626183400 I O SYSPFS UNABLE TO ALLOCATE SPACE IN FILESYSTEME18E984F 0626182100 P S SRC SOFTWARE PROGRAM ERRORE18E984F 0626181400 P S SRC SOFTWARE PROGRAM ERROR
• To obtain all the errors with resource name cd0 from the error log, enter:
# errpt -N cd0IDENTIFIER TIMESTAMP T C RESOURCE_NAME DESCRIPTION1581762B 0627132600 T H cd0 DISK OPERATION ERROR1581762B 0627132000 T H cd0 DISK OPERATION ERROR1581762B 0627131900 T H cd0 DISK OPERATION ERROR1581762B 0627131900 T H cd0 DISK OPERATION ERROR
A.4 Command summary
The following section provides a list of the key commands discussed in this appendix. For a complete reference of the following commands, consult the AIX product documentation.
A.4.1 The errpt command
The errpt command generates an error report from entries in an error log. The command has the following syntax:
errpt [ -a ] [ -c ] [ -d ErrorClassList ] [ -e EndDate ] [ -j ErrorID ] [ -sStartDate ] [ -N ResourceNameList ] [ -S ResourceClassList ] [ -TErrorTypeList ]
244 IBM Certification Study Guide AIX Performance and System Tuning
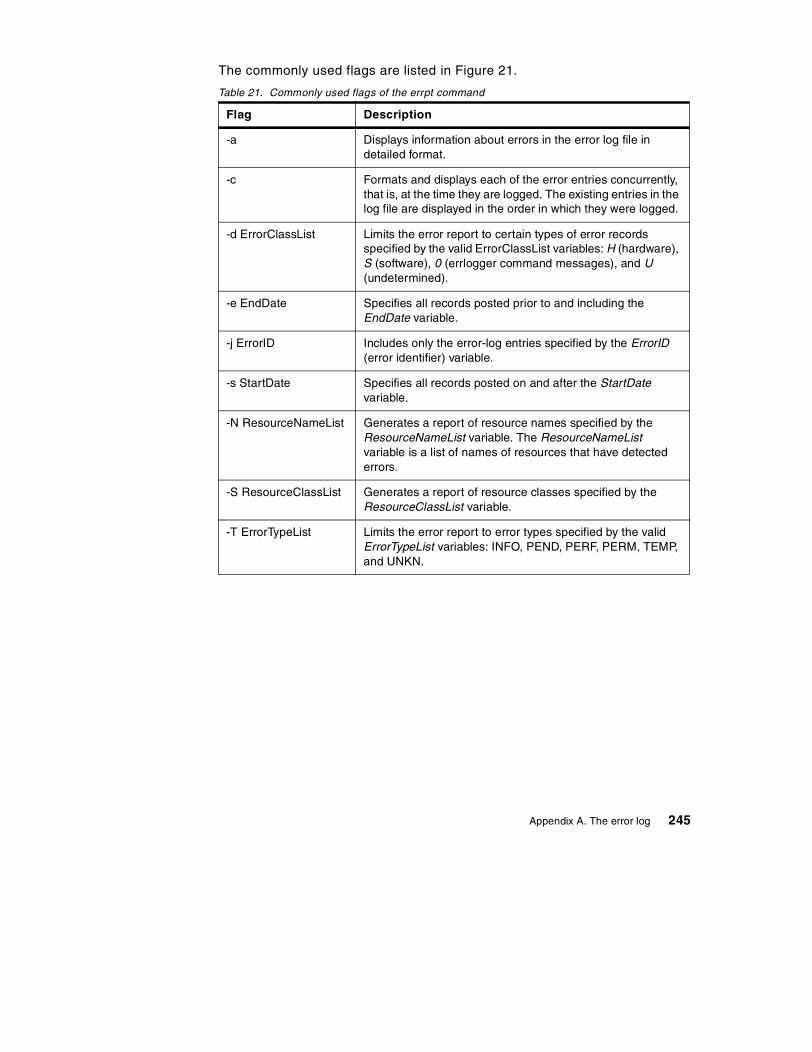
The commonly used flags are listed in Figure 21.
Table 21. Commonly used flags of the errpt command
Flag Description
-a Displays information about errors in the error log file in detailed format.
-c Formats and displays each of the error entries concurrently, that is, at the time they are logged. The existing entries in the log file are displayed in the order in which they were logged.
-d ErrorClassList Limits the error report to certain types of error records specified by the valid ErrorClassList variables: H (hardware), S (software), 0 (errlogger command messages), and U (undetermined).
-e EndDate Specifies all records posted prior to and including the EndDate variable.
-j ErrorID Includes only the error-log entries specified by the ErrorID (error identifier) variable.
-s StartDate Specifies all records posted on and after the StartDate variable.
-N ResourceNameList Generates a report of resource names specified by the ResourceNameList variable. The ResourceNameList variable is a list of names of resources that have detected errors.
-S ResourceClassList Generates a report of resource classes specified by the ResourceClassList variable.
-T ErrorTypeList Limits the error report to error types specified by the valid ErrorTypeList variables: INFO, PEND, PERF, PERM, TEMP, and UNKN.
Appendix A. The error log 245
A.5 Quiz
The following assessment question helps verify your understanding of the topics discussed in this appendix.
1. Which of the following commands should be used to list the system errors logged following February 29, 2000?
A. /usr/bin/errpt -s 0301000000
B. /usr/bin/lssrc -s 0301000000
C. /usr/lib/errdemon -s 0301000000
D. /usr/sbin/syslogd -m 0301000000
A.5.1 Answers
The following is the preferred answer to the question provided in this section.
1. A
A.6 Exercises
The following exercises provide sample topics for self study. They will help ensure comprehension of this appendix.
1. Change default error log attributes.
2. Using the errpt command, generate a report of errors caused by errdemon resource.
3. Using the errpt command, generate a report of software errors, but limit it to temporary errors.
4. Generate the same reports using smitty tool.
5. Delete all software logs.
246 IBM Certification Study Guide AIX Performance and System Tuning
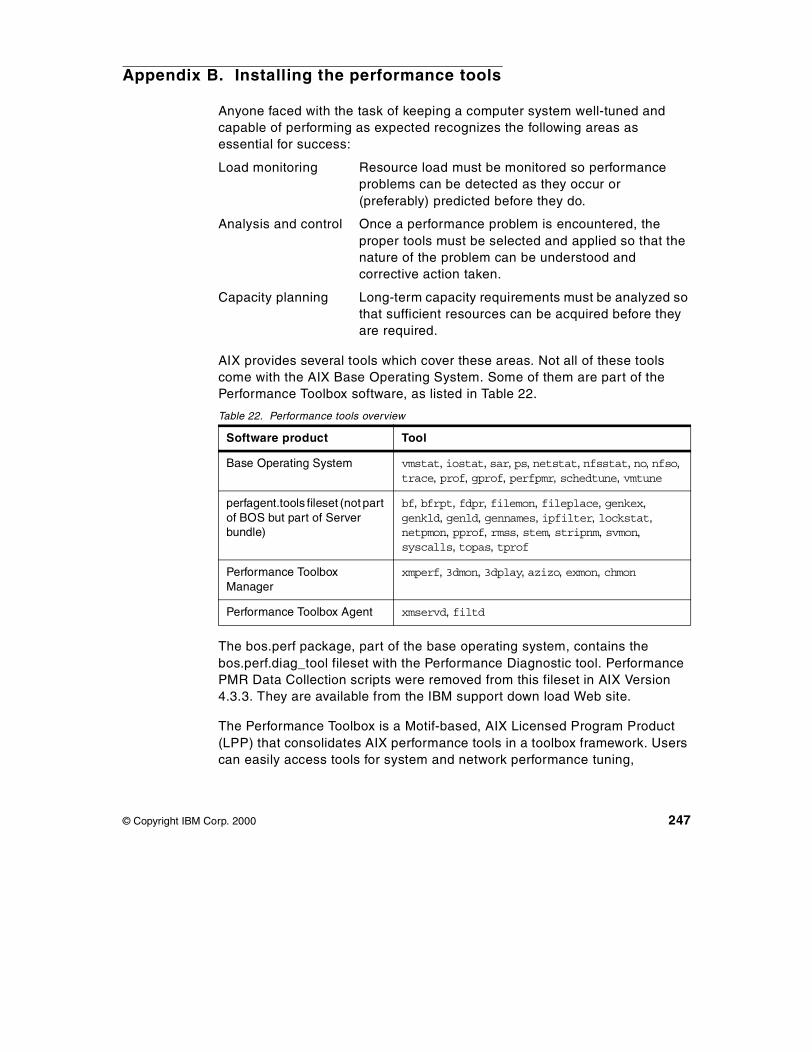
Appendix B. Installing the performance tools
Anyone faced with the task of keeping a computer system well-tuned and capable of performing as expected recognizes the following areas as essential for success:
Load monitoring Resource load must be monitored so performance problems can be detected as they occur or (preferably) predicted before they do.
Analysis and control Once a performance problem is encountered, the proper tools must be selected and applied so that the nature of the problem can be understood and corrective action taken.
Capacity planning Long-term capacity requirements must be analyzed so that sufficient resources can be acquired before they are required.
AIX provides several tools which cover these areas. Not all of these tools come with the AIX Base Operating System. Some of them are part of the Performance Toolbox software, as listed in Table 22.
Table 22. Performance tools overview
The bos.perf package, part of the base operating system, contains the bos.perf.diag_tool fileset with the Performance Diagnostic tool. Performance PMR Data Collection scripts were removed from this fileset in AIX Version 4.3.3. They are available from the IBM support down load Web site.
The Performance Toolbox is a Motif-based, AIX Licensed Program Product (LPP) that consolidates AIX performance tools in a toolbox framework. Users can easily access tools for system and network performance tuning,
Software product Tool
Base Operating System vmstat, iostat, sar, ps, netstat, nfsstat, no, nfso, trace, prof, gprof, perfpmr, schedtune, vmtune
perfagent.tools fileset (not part of BOS but part of Server bundle)
bf, bfrpt, fdpr, filemon, fileplace, genkex, genkld, genld, gennames, ipfilter, lockstat, netpmon, pprof, rmss, stem, stripnm, svmon, syscalls, topas, tprof
Performance Toolbox Manager
xmperf, 3dmon, 3dplay, azizo, exmon, chmon
Performance Toolbox Agent xmservd, filtd
© Copyright IBM Corp. 2000 247
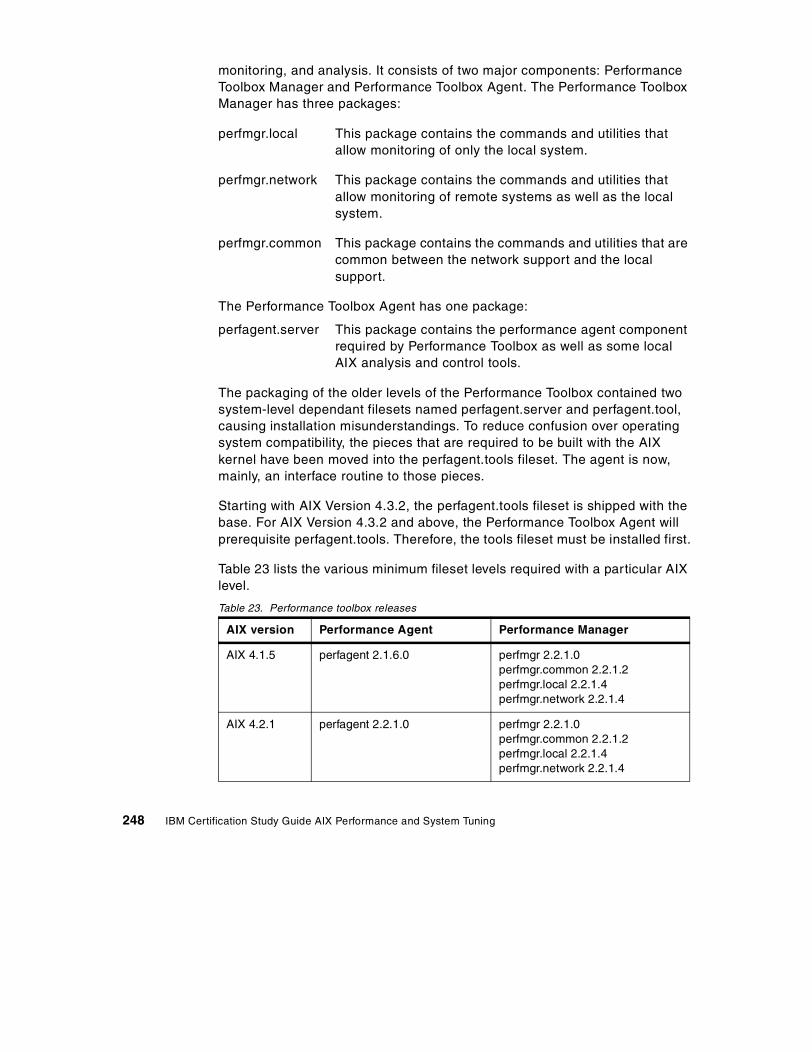
monitoring, and analysis. It consists of two major components: Performance Toolbox Manager and Performance Toolbox Agent. The Performance Toolbox Manager has three packages:
perfmgr.local This package contains the commands and utilities that allow monitoring of only the local system.
perfmgr.network This package contains the commands and utilities that allow monitoring of remote systems as well as the local system.
perfmgr.common This package contains the commands and utilities that are common between the network support and the local support.
The Performance Toolbox Agent has one package:
perfagent.server This package contains the performance agent component required by Performance Toolbox as well as some local AIX analysis and control tools.
The packaging of the older levels of the Performance Toolbox contained two system-level dependant filesets named perfagent.server and perfagent.tool, causing installation misunderstandings. To reduce confusion over operating system compatibility, the pieces that are required to be built with the AIX kernel have been moved into the perfagent.tools fileset. The agent is now, mainly, an interface routine to those pieces.
Starting with AIX Version 4.3.2, the perfagent.tools fileset is shipped with the base. For AIX Version 4.3.2 and above, the Performance Toolbox Agent will prerequisite perfagent.tools. Therefore, the tools fileset must be installed first.
Table 23 lists the various minimum fileset levels required with a particular AIX level.
Table 23. Performance toolbox releases
AIX version Performance Agent Performance Manager
AIX 4.1.5 perfagent 2.1.6.0 perfmgr 2.2.1.0perfmgr.common 2.2.1.2perfmgr.local 2.2.1.4perfmgr.network 2.2.1.4
AIX 4.2.1 perfagent 2.2.1.0 perfmgr 2.2.1.0perfmgr.common 2.2.1.2perfmgr.local 2.2.1.4perfmgr.network 2.2.1.4
248 IBM Certification Study Guide AIX Performance and System Tuning
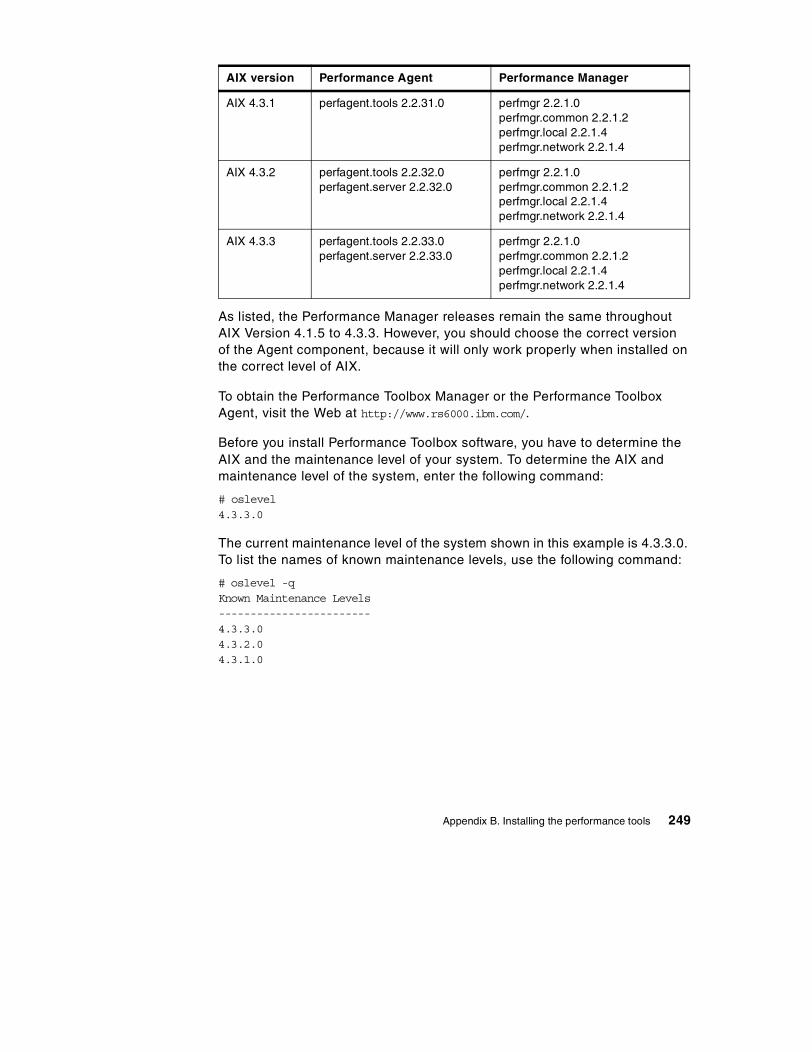
As listed, the Performance Manager releases remain the same throughout AIX Version 4.1.5 to 4.3.3. However, you should choose the correct version of the Agent component, because it will only work properly when installed on the correct level of AIX.
To obtain the Performance Toolbox Manager or the Performance Toolbox Agent, visit the Web at http://www.rs6000.ibm.com/.
Before you install Performance Toolbox software, you have to determine the AIX and the maintenance level of your system. To determine the AIX and maintenance level of the system, enter the following command:
# oslevel4.3.3.0
The current maintenance level of the system shown in this example is 4.3.3.0. To list the names of known maintenance levels, use the following command:
# oslevel -qKnown Maintenance Levels------------------------4.3.3.04.3.2.04.3.1.0
AIX 4.3.1 perfagent.tools 2.2.31.0 perfmgr 2.2.1.0perfmgr.common 2.2.1.2perfmgr.local 2.2.1.4perfmgr.network 2.2.1.4
AIX 4.3.2 perfagent.tools 2.2.32.0perfagent.server 2.2.32.0
perfmgr 2.2.1.0perfmgr.common 2.2.1.2perfmgr.local 2.2.1.4perfmgr.network 2.2.1.4
AIX 4.3.3 perfagent.tools 2.2.33.0perfagent.server 2.2.33.0
perfmgr 2.2.1.0perfmgr.common 2.2.1.2perfmgr.local 2.2.1.4perfmgr.network 2.2.1.4
AIX version Performance Agent Performance Manager
Appendix B. Installing the performance tools 249
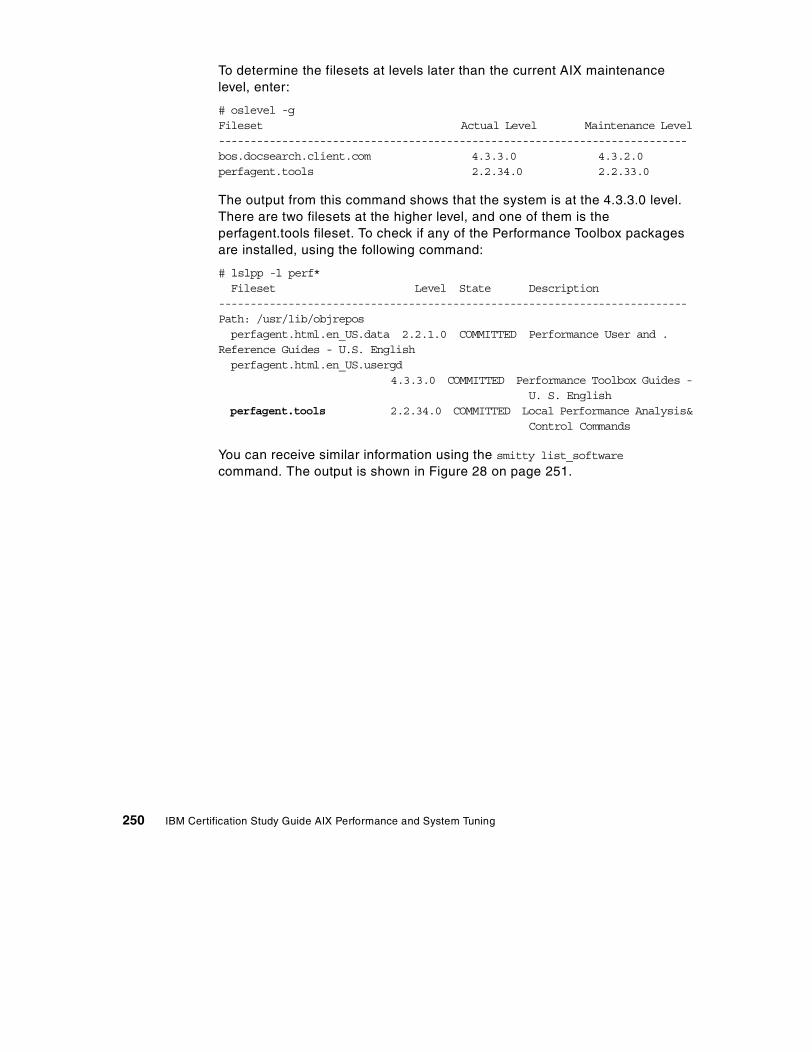
To determine the filesets at levels later than the current AIX maintenance level, enter:
# oslevel -gFileset Actual Level Maintenance Level--------------------------------------------------------------------------bos.docsearch.client.com 4.3.3.0 4.3.2.0perfagent.tools 2.2.34.0 2.2.33.0
The output from this command shows that the system is at the 4.3.3.0 level. There are two filesets at the higher level, and one of them is the perfagent.tools fileset. To check if any of the Performance Toolbox packages are installed, using the following command:
# lslpp -l perf*Fileset Level State Description
--------------------------------------------------------------------------Path: /usr/lib/objreposperfagent.html.en_US.data 2.2.1.0 COMMITTED Performance User and .
Reference Guides - U.S. Englishperfagent.html.en_US.usergd
4.3.3.0 COMMITTED Performance Toolbox Guides -U. S. English
perfagent.tools 2.2.34.0 COMMITTED Local Performance Analysis&Control Commands
You can receive similar information using the smitty list_software
command. The output is shown in Figure 28 on page 251.
250 IBM Certification Study Guide AIX Performance and System Tuning
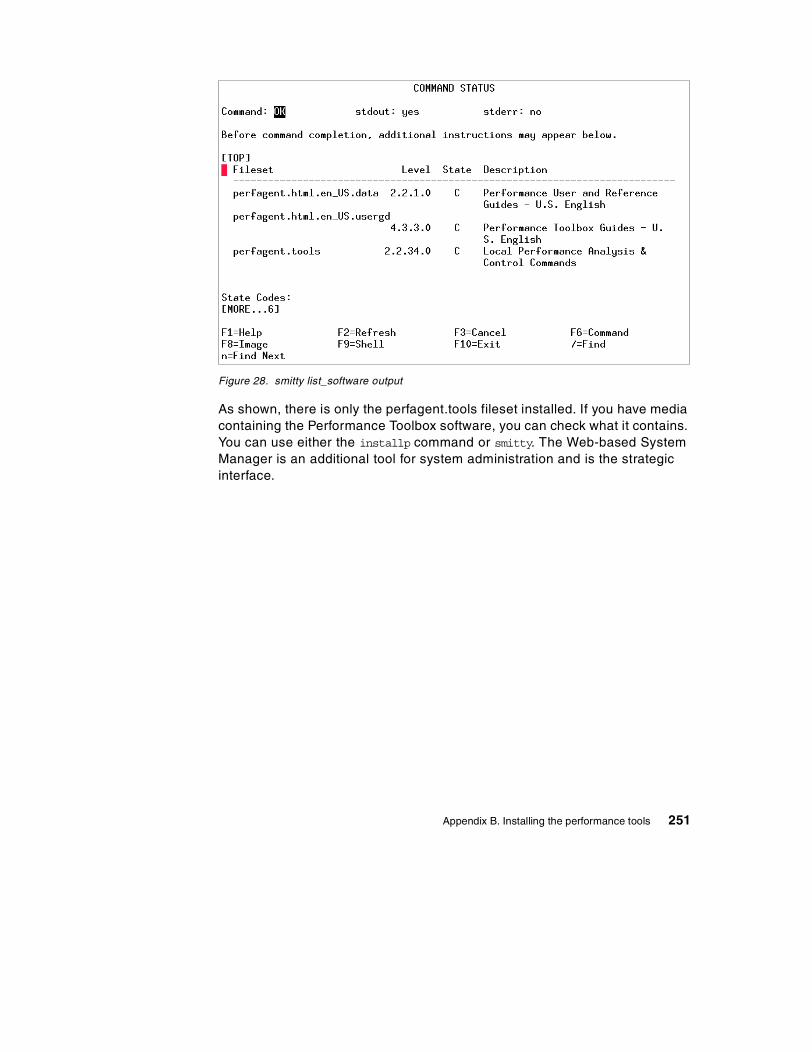
Figure 28. smitty list_software output
As shown, there is only the perfagent.tools fileset installed. If you have media containing the Performance Toolbox software, you can check what it contains. You can use either the installp command or smitty. The Web-based System Manager is an additional tool for system administration and is the strategic interface.
Appendix B. Installing the performance tools 251
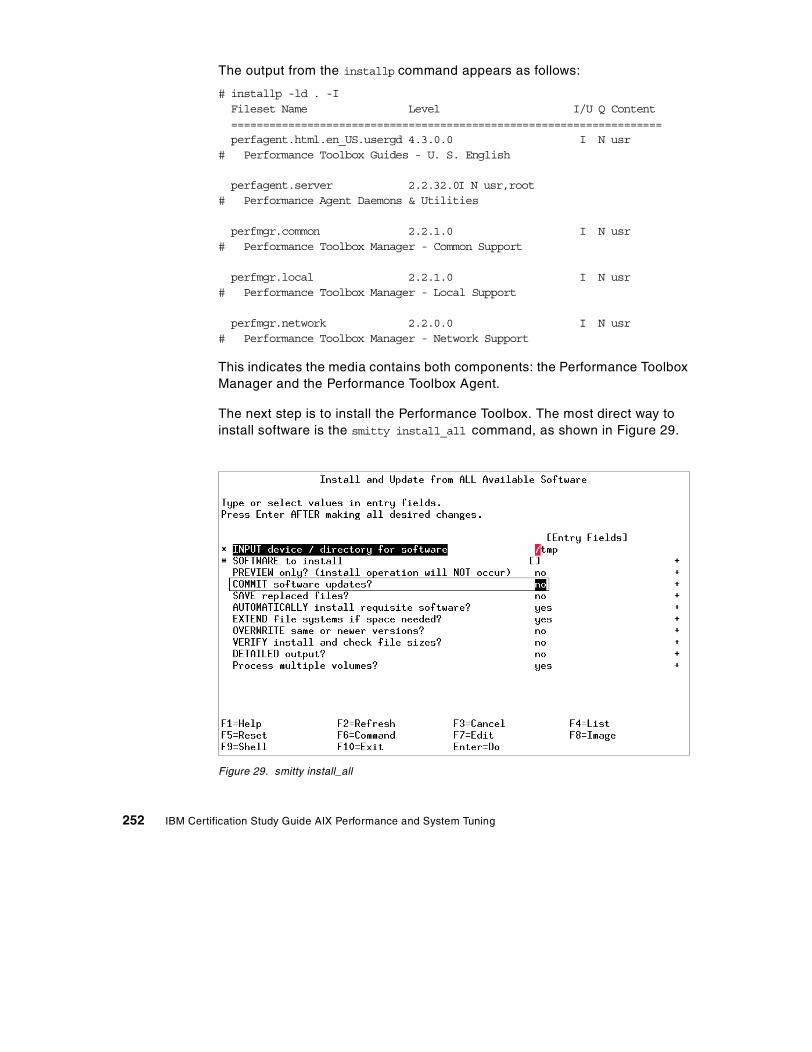
The output from the installp command appears as follows:
# installp -ld . -IFileset Name Level I/U Q Content====================================================================perfagent.html.en_US.usergd 4.3.0.0 I N usr
# Performance Toolbox Guides - U. S. English
perfagent.server 2.2.32.0I N usr,root# Performance Agent Daemons & Utilities
perfmgr.common 2.2.1.0 I N usr# Performance Toolbox Manager - Common Support
perfmgr.local 2.2.1.0 I N usr# Performance Toolbox Manager - Local Support
perfmgr.network 2.2.0.0 I N usr# Performance Toolbox Manager - Network Support
This indicates the media contains both components: the Performance Toolbox Manager and the Performance Toolbox Agent.
The next step is to install the Performance Toolbox. The most direct way to install software is the smitty install_all command, as shown in Figure 29.
Figure 29. smitty install_all
252 IBM Certification Study Guide AIX Performance and System Tuning
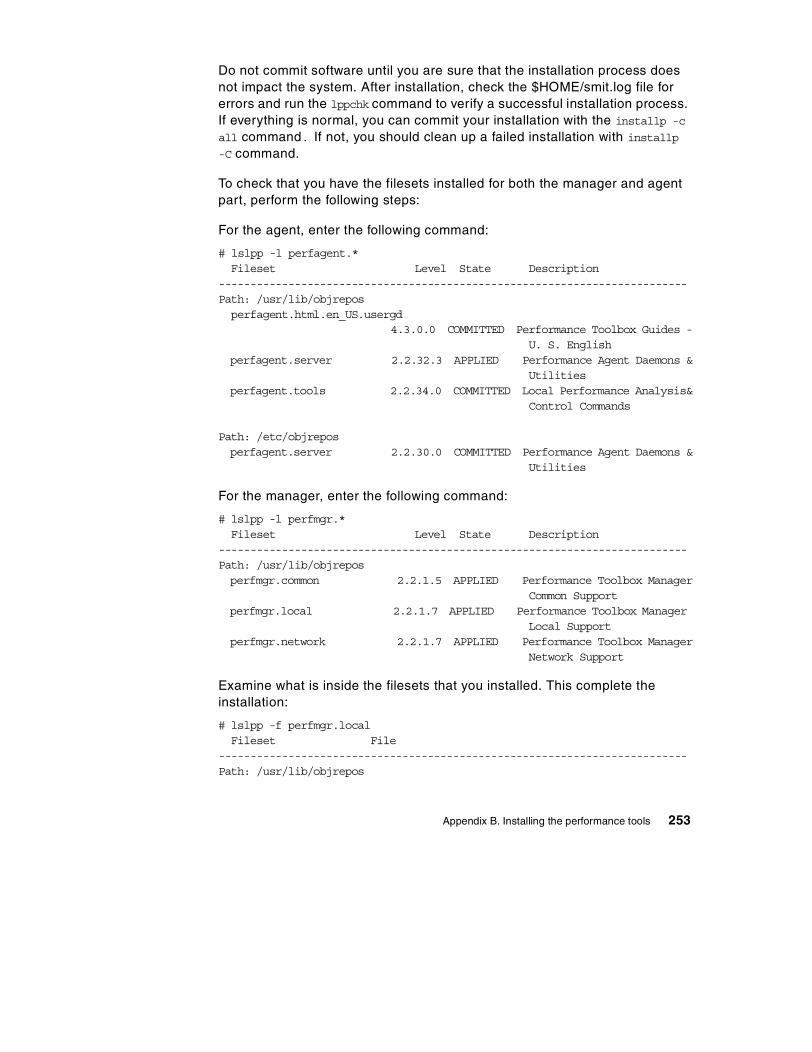
Do not commit software until you are sure that the installation process does not impact the system. After installation, check the $HOME/smit.log file for errors and run the lppchk command to verify a successful installation process. If everything is normal, you can commit your installation with the installp -c
all command. If not, you should clean up a failed installation with installp-C command.
To check that you have the filesets installed for both the manager and agent part, perform the following steps:
For the agent, enter the following command:
# lslpp -l perfagent.*Fileset Level State Description
--------------------------------------------------------------------------Path: /usr/lib/objreposperfagent.html.en_US.usergd
4.3.0.0 COMMITTED Performance Toolbox Guides -U. S. English
perfagent.server 2.2.32.3 APPLIED Performance Agent Daemons &Utilities
perfagent.tools 2.2.34.0 COMMITTED Local Performance Analysis&Control Commands
Path: /etc/objreposperfagent.server 2.2.30.0 COMMITTED Performance Agent Daemons &
Utilities
For the manager, enter the following command:
# lslpp -l perfmgr.*Fileset Level State Description
--------------------------------------------------------------------------Path: /usr/lib/objreposperfmgr.common 2.2.1.5 APPLIED Performance Toolbox Manager
Common Supportperfmgr.local 2.2.1.7 APPLIED Performance Toolbox Manager
Local Supportperfmgr.network 2.2.1.7 APPLIED Performance Toolbox Manager
Network Support
Examine what is inside the filesets that you installed. This complete the installation:
# lslpp -f perfmgr.localFileset File
--------------------------------------------------------------------------Path: /usr/lib/objrepos
Appendix B. Installing the performance tools 253
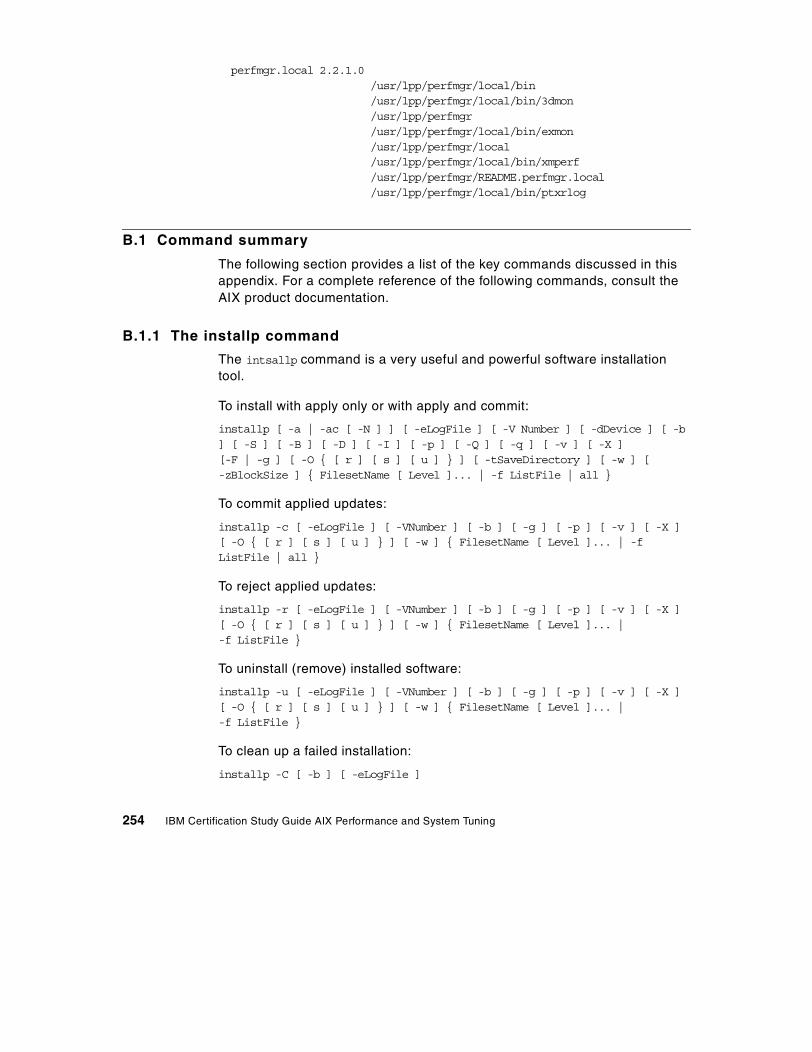
perfmgr.local 2.2.1.0/usr/lpp/perfmgr/local/bin/usr/lpp/perfmgr/local/bin/3dmon/usr/lpp/perfmgr/usr/lpp/perfmgr/local/bin/exmon/usr/lpp/perfmgr/local/usr/lpp/perfmgr/local/bin/xmperf/usr/lpp/perfmgr/README.perfmgr.local/usr/lpp/perfmgr/local/bin/ptxrlog
B.1 Command summary
The following section provides a list of the key commands discussed in this appendix. For a complete reference of the following commands, consult the AIX product documentation.
B.1.1 The installp command
The intsallp command is a very useful and powerful software installation tool.
To install with apply only or with apply and commit:
installp [ -a | -ac [ -N ] ] [ -eLogFile ] [ -V Number ] [ -dDevice ] [ -b] [ -S ] [ -B ] [ -D ] [ -I ] [ -p ] [ -Q ] [ -q ] [ -v ] [ -X ][-F | -g ] [ -O { [ r ] [ s ] [ u ] } ] [ -tSaveDirectory ] [ -w ] [-zBlockSize ] { FilesetName [ Level ]... | -f ListFile | all }
To commit applied updates:
installp -c [ -eLogFile ] [ -VNumber ] [ -b ] [ -g ] [ -p ] [ -v ] [ -X ][ -O { [ r ] [ s ] [ u ] } ] [ -w ] { FilesetName [ Level ]... | -fListFile | all }
To reject applied updates:
installp -r [ -eLogFile ] [ -VNumber ] [ -b ] [ -g ] [ -p ] [ -v ] [ -X ][ -O { [ r ] [ s ] [ u ] } ] [ -w ] { FilesetName [ Level ]... |-f ListFile }
To uninstall (remove) installed software:
installp -u [ -eLogFile ] [ -VNumber ] [ -b ] [ -g ] [ -p ] [ -v ] [ -X ][ -O { [ r ] [ s ] [ u ] } ] [ -w ] { FilesetName [ Level ]... |-f ListFile }
To clean up a failed installation:
installp -C [ -b ] [ -eLogFile ]
254 IBM Certification Study Guide AIX Performance and System Tuning
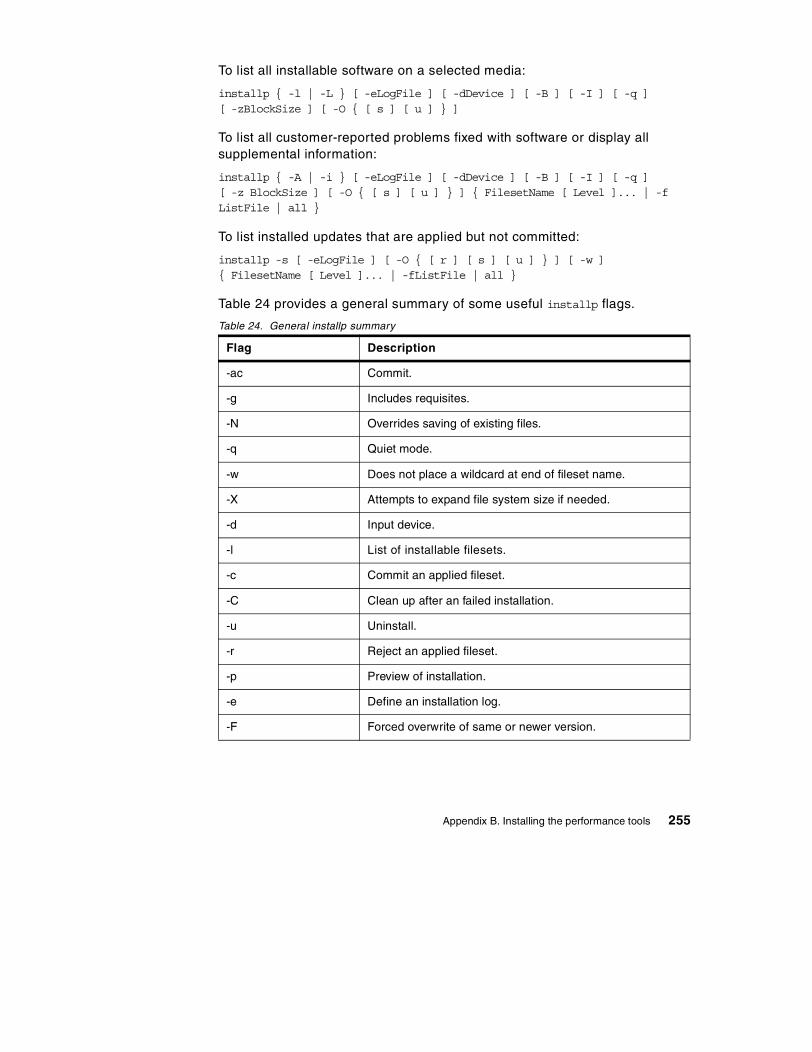
To list all installable software on a selected media:
installp { -l | -L } [ -eLogFile ] [ -dDevice ] [ -B ] [ -I ] [ -q ][ -zBlockSize ] [ -O { [ s ] [ u ] } ]
To list all customer-reported problems fixed with software or display all supplemental information:
installp { -A | -i } [ -eLogFile ] [ -dDevice ] [ -B ] [ -I ] [ -q ][ -z BlockSize ] [ -O { [ s ] [ u ] } ] { FilesetName [ Level ]... | -fListFile | all }
To list installed updates that are applied but not committed:
installp -s [ -eLogFile ] [ -O { [ r ] [ s ] [ u ] } ] [ -w ]{ FilesetName [ Level ]... | -fListFile | all }
Table 24 provides a general summary of some useful installp flags.
Table 24. General installp summary
Flag Description
-ac Commit.
-g Includes requisites.
-N Overrides saving of existing files.
-q Quiet mode.
-w Does not place a wildcard at end of fileset name.
-X Attempts to expand file system size if needed.
-d Input device.
-l List of installable filesets.
-c Commit an applied fileset.
-C Clean up after an failed installation.
-u Uninstall.
-r Reject an applied fileset.
-p Preview of installation.
-e Define an installation log.
-F Forced overwrite of same or newer version.
Appendix B. Installing the performance tools 255
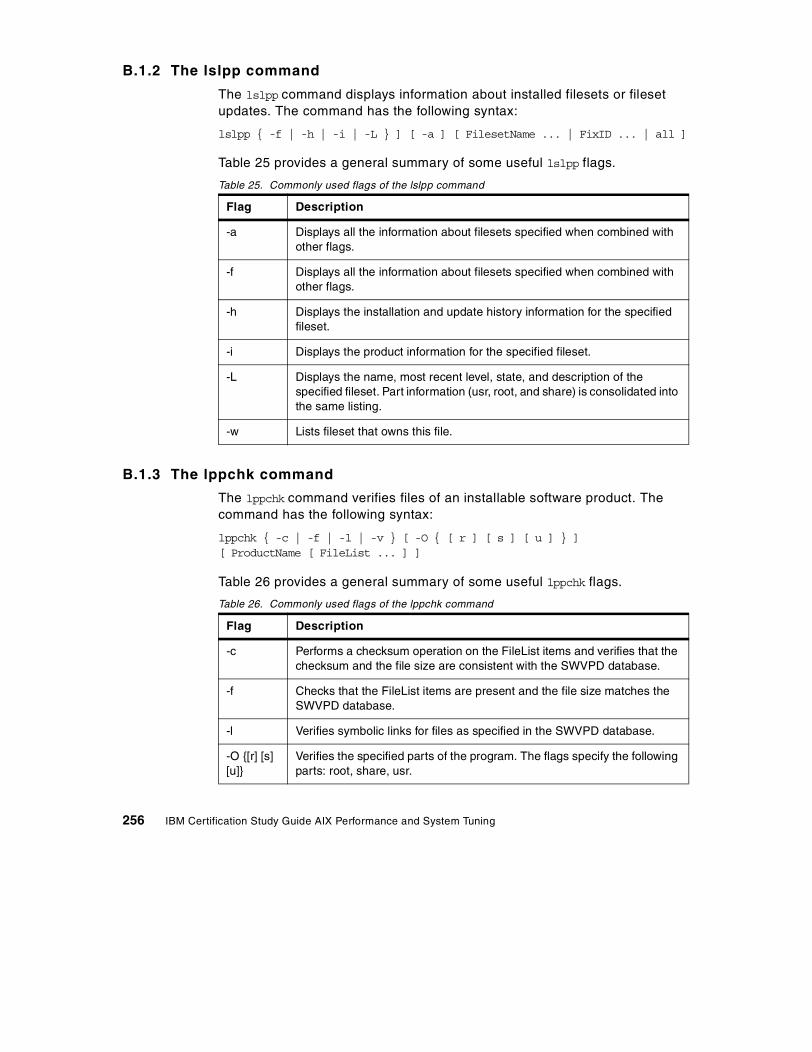
B.1.2 The lslpp command
The lslpp command displays information about installed filesets or fileset updates. The command has the following syntax:
lslpp { -f | -h | -i | -L } ] [ -a ] [ FilesetName ... | FixID ... | all ]
Table 25 provides a general summary of some useful lslpp flags.
Table 25. Commonly used flags of the lslpp command
B.1.3 The lppchk command
The lppchk command verifies files of an installable software product. The command has the following syntax:
lppchk { -c | -f | -l | -v } [ -O { [ r ] [ s ] [ u ] } ][ ProductName [ FileList ... ] ]
Table 26 provides a general summary of some useful lppchk flags.
Table 26. Commonly used flags of the lppchk command
Flag Description
-a Displays all the information about filesets specified when combined with other flags.
-f Displays all the information about filesets specified when combined with other flags.
-h Displays the installation and update history information for the specified fileset.
-i Displays the product information for the specified fileset.
-L Displays the name, most recent level, state, and description of the specified fileset. Part information (usr, root, and share) is consolidated into the same listing.
-w Lists fileset that owns this file.
Flag Description
-c Performs a checksum operation on the FileList items and verifies that the checksum and the file size are consistent with the SWVPD database.
-f Checks that the FileList items are present and the file size matches the SWVPD database.
-l Verifies symbolic links for files as specified in the SWVPD database.
-O {[r] [s] [u]}
Verifies the specified parts of the program. The flags specify the following parts: root, share, usr.
256 IBM Certification Study Guide AIX Performance and System Tuning
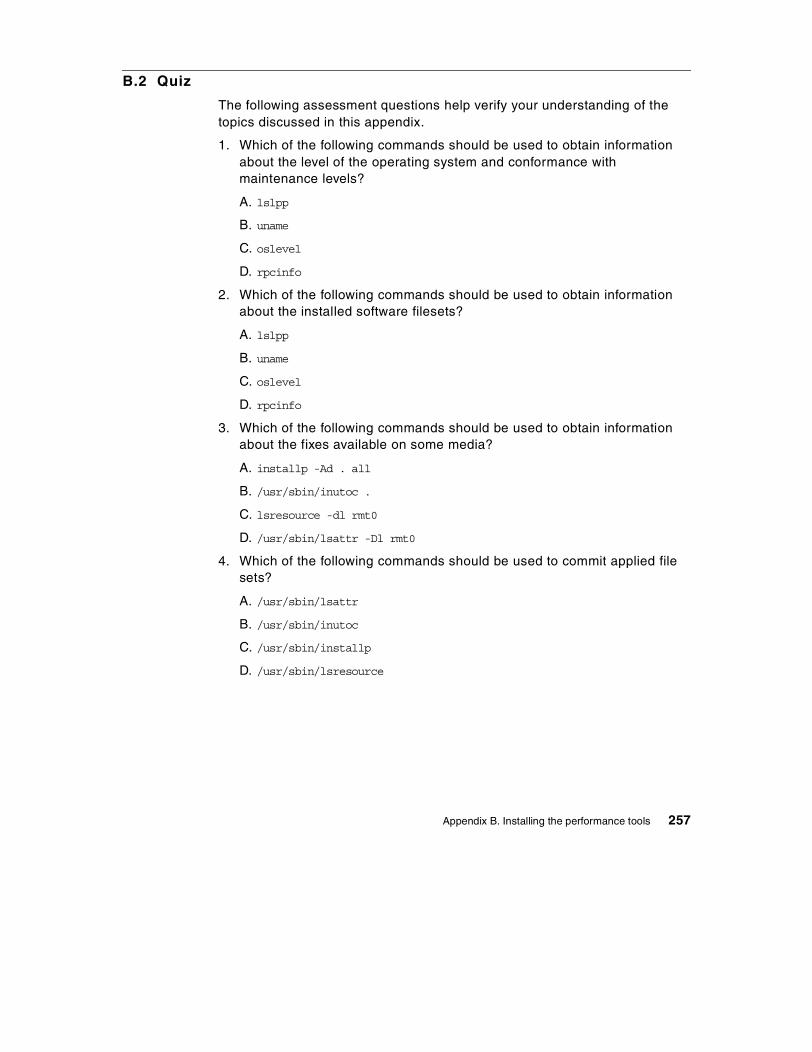
B.2 Quiz
The following assessment questions help verify your understanding of the topics discussed in this appendix.
1. Which of the following commands should be used to obtain information about the level of the operating system and conformance with maintenance levels?
A. lslpp
B. uname
C. oslevel
D. rpcinfo
2. Which of the following commands should be used to obtain information about the installed software filesets?
A. lslpp
B. uname
C. oslevel
D. rpcinfo
3. Which of the following commands should be used to obtain information about the fixes available on some media?
A. installp -Ad . all
B. /usr/sbin/inutoc .
C. lsresource -dl rmt0
D. /usr/sbin/lsattr -Dl rmt0
4. Which of the following commands should be used to commit applied file sets?
A. /usr/sbin/lsattr
B. /usr/sbin/inutoc
C. /usr/sbin/installp
D. /usr/sbin/lsresource
Appendix B. Installing the performance tools 257

5. An AIX Version 4.3 system must be evaluated and tuned. In order to use a set of performance tools (for example, filemon, svmon, and tprof) which of the following packages should exist on the system in question?
A. Java.adt
B. bos.perf
C. bos.adt.utils
D. perfagent.tools
6. Which of the following packages once contained the Performance PMR Data Collection scripts was removed in AIX Version 4.3.3, although they are available for download from the perfpmr site?
A. bos.perf
B. Java.adt
C. bos.adt.utils
D. perfagent.tools
7. Which of the following resources will provide the latest available performance data capture tools?
A. The systems software depositories
B. The IBM support down load Web site
C. The standard documentation included with the system
D. The software distribution media included with the system
8. Which of the following filesets is used to install tprof?
A. bos.acct
B. bos.perf.pmr
C. bos.rte.control
D. perfagent.tools
9. The components xmperf, 3dmon, 3dplay are part of Performance Toolbox contained in which of the following packages?
A. perfmgr
B. perfagent.server
C. perfagent.tools
D. perfagent.client
258 IBM Certification Study Guide AIX Performance and System Tuning
B.2.1 Answers
The following are the preferred answers to the questions provided in this section.
1. C
2. A
3. A
4. C
5. D
6. A
7. B
8. D
9. A
B.3 Exercises
The following exercises provide sample topics for self study. They will help ensure comprehension of this appendix.
1. Use the lslpp command to list installed filesets.
2. Use the lslpp command to find out which fileset is used to package a given command.
3. Use the lslpp command to display state, description, and all updates of the different filesets.
4. Use the oslevel command to determine the filesets at levels later than the current AIX maintenance level.
Appendix B. Installing the performance tools 259

260 IBM Certification Study Guide AIX Performance and System Tuning
Appendix C. Using the additional material
This redbook has an HTML version available as Web material. See the section below for instructions on using or downloading the material.
C.1 Locating the additional material on the Internet
The CD-ROM, diskette, or Web material associated with this redbook is also available in softcopy on the Internet from the IBM Redbooks Web server. Point your Web browser to:
ftp://www.redbooks.ibm.com/redbooks/SG246184
Alternatively, you can go to the IBM Redbooks Web site at:
ibm.com/redbooks
Select the Additional materials and open the directory that corresponds with the redbook form number.
C.2 Using the Web material
The additional Web material that accompanies this redbook includes the following:
File name DescriptionSG246184.zip Zipped HTML source
C.2.1 System requirements for downloading the Web material
The following system configuration is recommended for downloading the additional Web material.
Hard disk space: 40 MBOperating System: Windows or AIX with Netscape browserProcessor: Pentium 386 or PowerPC 604eMemory: 128 MB
C.2.2 How to use the Web material
Create a subdirectory (folder) on your workstation and copy the contents of the Web material into this folder. Point your browser at the index.html file to launch the application. The Web content has been optimized for the Netscape browser.
© Copyright IBM Corp. 2000 261

262 IBM Certification Study Guide AIX Performance and System Tuning
Appendix D. Special notices
This publication is intended to help IBM Business Partners, technical professionals, and customers of IBM prepare for the AIX Performance and System Tuning exam as part of the IBM Certified Specialist program. The information in this publication is not intended as the specification of any programming interfaces that are provided by AIX Version 4.3. See the PUBLICATIONS section of the IBM Programming Announcement for AIX Version 4.3 for more information about what publications are considered to be product documentation. The use of this guide for certification is not a promise of passing the exam or obtaining the certification. It is intended to be used as a supplemental learning tool that, when used in combination with professional instructors, accelerates the learning process.
References in this publication to IBM products, programs or services do not imply that IBM intends to make these available in all countries in which IBM operates. Any reference to an IBM product, program, or service is not intended to state or imply that only IBM's product, program, or service may be used. Any functionally equivalent program that does not infringe any of IBM's intellectual property rights may be used instead of the IBM product, program or service.
Information in this book was developed in conjunction with use of the equipment specified, and is limited in application to those specific hardware and software products and levels.
IBM may have patents or pending patent applications covering subject matter in this document. The furnishing of this document does not give you any license to these patents. You can send license inquiries, in writing, to the IBM Director of Licensing, IBM Corporation, North Castle Drive, Armonk, NY 10504-1785.
Licensees of this program who wish to have information about it for the purpose of enabling: (i) the exchange of information between independently created programs and other programs (including this one) and (ii) the mutual use of the information which has been exchanged, should contact IBM Corporation, Dept. 600A, Mail Drop 1329, Somers, NY 10589 USA.
Such information may be available, subject to appropriate terms and conditions, including in some cases, payment of a fee.
The information contained in this document has not been submitted to any formal IBM test and is distributed AS IS. The information about non-IBM ("vendor") products in this manual has been supplied by the vendor and IBM
© Copyright IBM Corp. 2000 263
assumes no responsibility for its accuracy or completeness. The use of this information or the implementation of any of these techniques is a customer responsibility and depends on the customer's ability to evaluate and integrate them into the customer's operational environment. While each item may have been reviewed by IBM for accuracy in a specific situation, there is no guarantee that the same or similar results will be obtained elsewhere. Customers attempting to adapt these techniques to their own environments do so at their own risk.
Any pointers in this publication to external Web sites are provided for convenience only and do not in any manner serve as an endorsement of these Web sites.
Any performance data contained in this document was determined in a controlled environment, and therefore, the results that may be obtained in other operating environments may vary significantly. Users of this document should verify the applicable data for their specific environment.
Reference to PTF numbers that have not been released through the normal distribution process does not imply general availability. The purpose of including these reference numbers is to alert IBM customers to specific information relative to the implementation of the PTF when it becomes available to each customer according to the normal IBM PTF distribution process.
The following terms are trademarks of the International Business Machines Corporation in the United States and/or other countries:
The IBM Certified Specialist mark is a trademark of the International Business Machines Corporation.
The following terms are trademarks of other companies:
AIX AS/400CT CurrentDB2 DominoIBM LotusLotus Notes Micro ChannelNetfinity OS/390PowerPC 601 PowerPC 604QMF RedbooksRedbooks Logo RS/6000S/390 SPSystem/390 XT
264 IBM Certification Study Guide AIX Performance and System Tuning
Tivoli, Manage. Anything. Anywhere.,The Power To Manage., Anything. Anywhere.,TME, NetView, Cross-Site, Tivoli Ready, Tivoli Certified, Planet Tivoli, and Tivoli Enterprise are trademarks or registered trademarks of Tivoli Systems Inc., an IBM company, in the United States, other countries, or both. In Denmark, Tivoli is a trademark licensed from Kjøbenhavns Sommer - Tivoli A/S.
C-bus is a trademark of Corollary, Inc. in the United States and/or other countries.
Java and all Java-based trademarks and logos are trademarks or registered trademarks of Sun Microsystems, Inc. in the United States and/or other countries.
Microsoft, Windows, Windows NT, and the Windows logo are trademarks of Microsoft Corporation in the United States and/or other countries.
PC Direct is a trademark of Ziff Communications Company in the United States and/or other countries and is used by IBM Corporation under license.
ActionMedia, LANDesk, MMX, Pentium and ProShare are trademarks of Intel Corporation in the United States and/or other countries.
UNIX is a registered trademark in the United States and other countries licensed exclusively through The Open Group.
SET, SET Secure Electronic Transaction, and the SET Logo are trademarks owned by SET Secure Electronic Transaction LLC.
Other company, product, and service names may be trademarks or service marks of others.
Appendix D. Special notices 265

266 IBM Certification Study Guide AIX Performance and System Tuning
Appendix E. Related publications
The publications listed in this section are considered particularly suitable for a more detailed discussion of the topics covered in this redbook.
E.1 IBM Redbooks
For information on ordering these publications see “How to get IBM Redbooks” on page 271.
• IBM Certification Study Guide AIX V4.3 System Administration, SG24-5129
• IBM Certification Study Guide AIX V4.3 System Support, SG24-5139
• IBM Certification Study Guide AIX Installation and System Recovery, SG24-6183 (December 2000)
• IBM Certification Study Guide AIX Problem Determination Tools and Techniques, SG24-6185 (December 2000)
• IBM Certification Study Guide AIX Communications, SG24-6186 (December 2000)
• IBM Certification Study Guide AIX HACMP, SG24-5131
• IBM Certification Study Guide RS/6000 SP, SG24-5348
• RS/6000 Performance Tools in Focus, SG24-4989
• AIX Logical Volume Manager, from A to Z: Introduction and Concepts, SG24-5432
• AIX Version 4.3 Differences Guide, SG24-2014
• AIX 5L AIX Workload Manager (WLM), SG24-5977
E.2 IBM Redbooks collections
Redbooks are also available on the following CD-ROMs. Click the CD-ROMs button at ibm.com/redbooks for information about all the CD-ROMs offered, updates and formats.
CD-ROM Title Collection Kit Number
IBM System/390 Redbooks Collection SK2T-2177
IBM Networking Collection SK2T-6022
IBM Transaction Processing and Data Management Redbooks Collection SK2T-8038
IBM Lotus Redbooks Collection SK2T-8039
© Copyright IBM Corp. 2000 267
E.3 Other resources
These publications are also relevant as further information sources:
• PCI Adapter Placement Reference, SA38-0538
• SSA Adapters: User’s Guide and Maintenance Information, SA33-3272
• System Management Concepts: Operating System, SC23-4311
• You can access all of the AIX documentation through the Internet at the following URL: www.ibm.com/servers/aix/library
The following types of documentation are located on the documentation CD that ships with the AIX operating system:
- User guides
- System management guides
- Application programmer guides
- All commands reference volumes
- Files reference
- Technical reference volumes used by application programmers
E.4 Referenced Web sites
These Web sites are also relevant as further information sources:
• http://www.rs6000.ibm.com
• ibm.com/redbooks
• http://www.ibm.com/servers/aix/download
• http://www.opengroup.org/onlinepubs/9629799/toc.htm
• http://www.ibm.com/services/learning/aix/#order
• http://www.ibm.com/certify
Tivoli Redbooks Collection SK2T-8044
IBM AS/400 Redbooks Collection SK2T-2849
IBM Netfinity Hardware and Software Redbooks Collection SK2T-8046
IBM RS/6000 Redbooks Collection SK2T-8043
IBM Application Development Redbooks Collection SK2T-8037
IBM Enterprise Storage and Systems Management Solutions SK3T-3694
CD-ROM Title Collection Kit Number
268 IBM Certification Study Guide AIX Performance and System Tuning

• http://www.rs6000.ibm.com/resource/hardware_docs/
• http://www.hursley.ibm.com/~ssa/
• http://techsupport.services.ibm.com/support/rs6000.support/databases
Appendix E. Related publications 269

270 IBM Certification Study Guide AIX Performance and System Tuning
How to get IBM Redbooks
This section explains how both customers and IBM employees can find out about IBM Redbooks, redpieces, and CD-ROMs. A form for ordering books and CD-ROMs by fax or e-mail is also provided.
• Redbooks Web Site ibm.com/redbooks
Search for, view, download, or order hardcopy/CD-ROM Redbooks from the Redbooks Web site. Also read redpieces and download additional materials (code samples or diskette/CD-ROM images) from this Redbooks site.
Redpieces are Redbooks in progress; not all Redbooks become redpieces and sometimes just a few chapters will be published this way. The intent is to get the information out much quicker than the formal publishing process allows.
• E-mail Orders
Send orders by e-mail including information from the IBM Redbooks fax order form to:
• Telephone Orders
• Fax Orders
This information was current at the time of publication, but is continually subject to change. The latest information may be found at the Redbooks Web site.
In United States or CanadaOutside North America
e-mail [email protected] information is in the “How to Order” section at this site:http://www.elink.ibmlink.ibm.com/pbl/pbl
United States (toll free)Canada (toll free)Outside North America
1-800-879-27551-800-IBM-4YOUCountry coordinator phone number is in the “How to Order” section at this site:http://www.elink.ibmlink.ibm.com/pbl/pbl
United States (toll free)CanadaOutside North America
1-800-445-92691-403-267-4455Fax phone number is in the “How to Order” section at this site:http://www.elink.ibmlink.ibm.com/pbl/pbl
IBM employees may register for information on workshops, residencies, and Redbooks by accessing the IBM Intranet Web site at http://w3.itso.ibm.com/ and clicking the ITSO Mailing List button. Look in the Materials repository for workshops, presentations, papers, and Web pages developed and written by the ITSO technical professionals; click the Additional Materials button. Employees may access MyNews at http://w3.ibm.com/ for redbook, residency, and workshop announcements.
IBM Intranet for Employees
© Copyright IBM Corp. 2000 271
IBM Redbooks fax order form
Please send me the following:
We accept American Express, Diners, Eurocard, Master Card, and Visa. Payment by credit card notavailable in all countries. Signature mandatory for credit card payment.
Title Order Number Quantity
First name Last name
Company
Address
City Postal code
Telephone number Telefax number VAT number
Invoice to customer number
Country
Credit card number
Credit card expiration date SignatureCard issued to
272 IBM Certification Study Guide AIX Performance and System Tuning
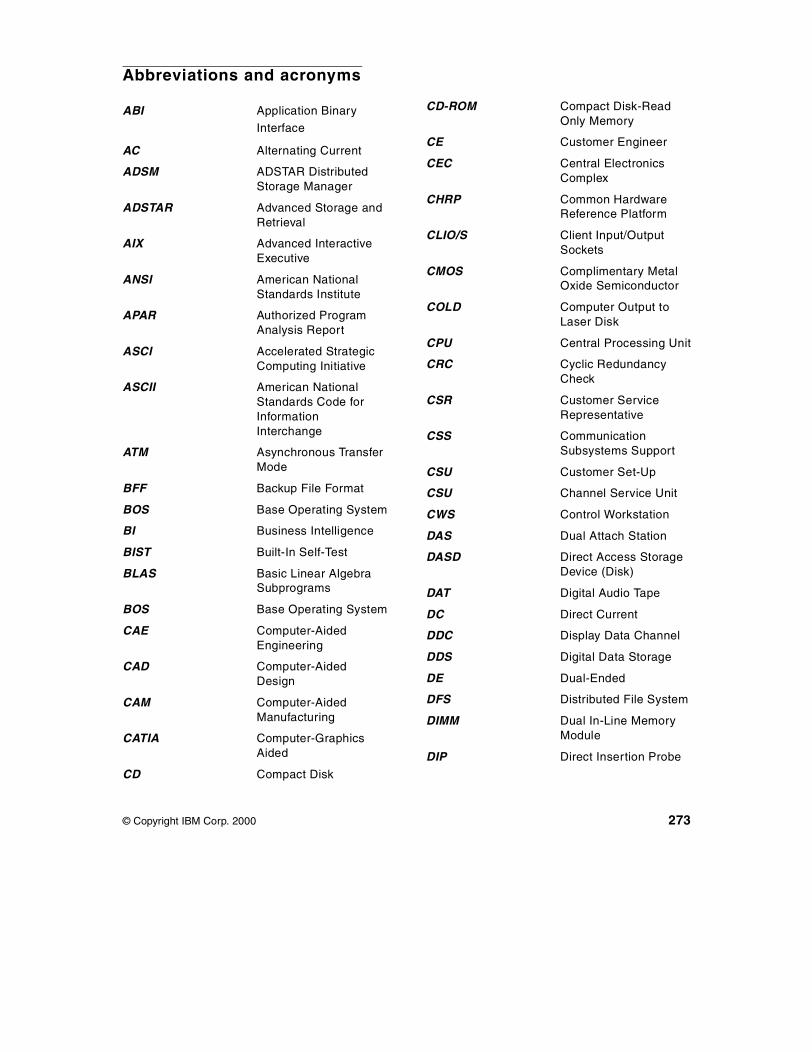
Abbreviations and acronyms
ABI Application Binary
Interface
AC Alternating Current
ADSM ADSTAR Distributed Storage Manager
ADSTAR Advanced Storage and Retrieval
AIX Advanced Interactive Executive
ANSI American National Standards Institute
APAR Authorized Program Analysis Report
ASCI Accelerated Strategic Computing Initiative
ASCII American National Standards Code for Information Interchange
ATM Asynchronous Transfer Mode
BFF Backup File Format
BOS Base Operating System
BI Business Intelligence
BIST Built-In Self-Test
BLAS Basic Linear Algebra Subprograms
BOS Base Operating System
CAE Computer-Aided Engineering
CAD Computer-Aided Design
CAM Computer-Aided Manufacturing
CATIA Computer-Graphics Aided
CD Compact Disk
© Copyright IBM Corp. 2000
CD-ROM Compact Disk-Read Only Memory
CE Customer Engineer
CEC Central Electronics Complex
CHRP Common Hardware Reference Platform
CLIO/S Client Input/Output Sockets
CMOS Complimentary Metal Oxide Semiconductor
COLD Computer Output to Laser Disk
CPU Central Processing Unit
CRC Cyclic Redundancy Check
CSR Customer Service Representative
CSS Communication Subsystems Support
CSU Customer Set-Up
CSU Channel Service Unit
CWS Control Workstation
DAS Dual Attach Station
DASD Direct Access Storage Device (Disk)
DAT Digital Audio Tape
DC Direct Current
DDC Display Data Channel
DDS Digital Data Storage
DE Dual-Ended
DFS Distributed File System
DIMM Dual In-Line Memory Module
DIP Direct Insertion Probe
273
DIVA Digital Inquiry Voice Answer
DLT Digital Linear Tape
DMA Direct Memory Access
DOS Disk Operating System
DRAM Dynamic Random Access Memory
DSU Data Service Unit
DW Data Warehouse
EC Engineering Change
ECC Error Checking and Correction
EEPROM Electrically Erasable Programmable Read Only Memory
EIA Electronics Industry Association
EISA Extended Industry Standard Architecture
ELA Error Log Analysis
EMIF ESCON Multiple Image Facility
EPOW Environmental and Power Warning
ESCON Enterprise Systems Connection (Architecture, IBM System/390)
ESSL Engineering and Scientific Subroutine Library
ETML Extract, Transformation, Movement and Loading
F/C Feature Code
FC-AL Fibre Channel-Arbitrated Loop
FCP Fibre Channel Protocol
FDDI Fiber Distributed Data Interface
FDX Full Duplex
FRU Field Replaceable Unit
FTP File Transfer Protocol
F/W Fast and Wide
GPFS General Parallel File System
GUI Graphical User Interface
HACMP High Availability Cluster Multi Processing
HACWS High Availability Control Workstation
HDX Half Duplex
HIPPI High Performance Parallel Interface
HiPS High Performance Switch
HiPS LC-8 Low-Cost Eight-Port High Performance Switch
HP Hewlett-Packard
HPF High Performance FORTRAN
HPSSDL High Performance Supercomputer Systems Development Laboratory
HP-UX Hewlett-Packard UNIX
HTTP Hypertext Transfer Protocol
Hz Hertz
IA Intel Architecture
ID Identification
IDE Integrated Device Electronics
IDS Intelligent Decision Server
274 IBM Certification Study Guide AIX Performance and System Tuning
IEEE Institute of Electrical and Electronics Engineers
I2C Inter Integrated-Circuit Communications
I/O Input/Output
IP Internetwork Protocol (OSI)
IPL Initial Program Load
IrDA Infrared Data Association (which sets standards for infrared support including protocols for data interchange)
IRQ Interrupt Request
ISA Industry Standard Architecture
ISB Intermediate Switch Board
ISDN Integrated-Services Digital Network
ISV Independent Software Vendor
ITSO International Technical Support Organization
JBOD Just a Bunch of Disks
JFS Journaled File System
JTAG Joint Test Action Group
L1 Level 1
L2 Level 2
LAN Local Area Network
LANE Local Area Network Emulation
LAPI Low-Level Application Programming Interface
LED Light Emitting Diode
LFT Low Function Terminal
LP Linear Programming
LPP Licensed Program Product
LV Logical Volume
LVDD Logical Volume Device Driver
LVM Logical Volume Manager
MAP Maintenance Analysis Procedure
MAU Multiple Access Unit
Mbps Megabits Per Second
MBps Megabytes Per Second
MCA Micro Channel Architecture
MCAD Mechanical Computer-Aided Design
MES Miscellaneous Equipment Specification
MIP Mixed-Integer Programming
MLR1 Multi-Channel Linear Recording 1
MMF Multi-Mode Fibre
MP Multiprocessor
MP Multi-Purpose
MPC-3 Multimedia PC-3
MPI Message Passing Interface
MPP Massively Parallel Processing
MPS Mathematical Programming System
MTU Maximum Transmission Unit
MVS Multiple Virtual Storage (IBM System 370 and 390)
275
MX Mezzanine Bus
NCP Network Control Point
NFS Network File System
NIM Network Installation Manager
NT-1 Network Terminator-1
NTP Network Time Protocol
NUMA Non-Uniform Memory Access
NVRAM Non-Volatile Random Access Memory
OCS Online Customer Support
ODM Object Data Manager
OLAP Online Analytical Processing
OS/390 Operating System/390
OSL Optimization Subroutine Library
OSLp Parallel Optimization Subroutine Library
P2SC Power2 Super Chip
PAP Privileged Access Password
PBLAS Parallel Basic Linear Algebra Subprograms
PCI Peripheral Component Interconnect
PDU Power Distribution Unit
PE Parallel Environment
PEDB Parallel Environment Debugging
PID Program Identification
PIOFS Parallel Input Output File System
POE Parallel Operating Environment
POP Power-On Password
POSIX Portable Operating Interface for Computing Environments
POST Power-On Self-test
POWER Performance Optimization with Enhanced RISC (Architecture)
PPP Point-to-Point Protocol
PREP PowerPC Reference Platform
PSSP Parallel System Support Program
PTF Program Temporary Fix
PTPE Performance Toolbox Parallel Extensions
PTX Performance Toolbox
PV Physical Volume
PVC Permanent Virtual Circuit
QMF Query Management Facility
QP Quadratic Programming
RAM Random Access Memory
RAN Remote Asynchronous Node
RAS Reliability, Availability, and Serviceability
RAID Redundant Array of Independent Disks
RDBMS Relational Database Management System
RIPL Remote Initial Program Load
ROLTP Relative Online Transaction Processing
RPA RS/6000 Platform Architecture
276 IBM Certification Study Guide AIX Performance and System Tuning
RVSD Recoverable Virtual Shared Disk
RTC Real-Time Clock
SAN Storage Area Network
SAS Single Attach Station
SAR Solutions Assurance Review
ScaLAPACK Scalable Linear Algebra Package
SCO Santa Cruz Operations
SCSI Small Computer System Interface
SDR System Data Repository
SDRAM Synchronous Dynamic Random Access Memory
SDLC Synchronous Data Link Control
SE Single-Ended
SEPBU Scalable Electrical Power Base Unit
SGI Silicon Graphics Incorporated
SLIP Serial Line Internet Protocol
SLR1 Single-Channel Linear Recording 1
SMIT System Management Interface Tool
SMS System Management Services
SMP Symmetric Multiprocessing
SOI Silicon-on-Insulator
SP Scalable POWERParallel
SP Service Processor
SPEC Standard Performance Evaluation Corp.
SPOT Shared Product Object Tree
SPS SP Switch
SPS-8 Eight-Port SP Switch
SRC System Resource Controller
SSC System Support Controller
SSA Serial Storage Architecture
STP Shielded Twisted Pair
SUP Software Update Protocol
SVC Switch Virtual Circuit
Tcl Tool Command Language
TCP/IP Transmission Control Protocol/Internet Protocol
TCQ Tagged Command Queuing
TPC Transaction Processing Council
UDB EEE Universal Database and Enterprise Extended Edition
UP Uniprocessor
USB Universal Serial Bus
UTP Unshielded Twisted Pair
UUCP UNIX-to-UNIX Communication Protocol
VESA Video Electronics Standards Association
VG Volume Group
277
VM Virtual Machine (IBM System 370 and 390)
VMM Virtual Memory Manager
VPD Vital Product Data
VSD Virtual Shared Disk
VSM Visual Systems Management
VSS Versatile Storage Server
VT Visualization Tool
WAN Wide Area Network
WTE Web Traffic Express
XTF Extended Distance Feature
278 IBM Certification Study Guide AIX Performance and System Tuning
Index
Symbols/etc/hosts 165/etc/netsvc.conf 165/etc/rc.nfs 167/etc/resolv.conf 165__prof.all 74
Aadapter
SCSI bottleneck 114allocation
logical volume 123allocation policy
intra disk 120application performance 135at 203attributes
logical volume 118availability
logical volume manager 120
Bbad block policy 119base value 182batch 203BB policy 119bigfile file system 135bos.perf fileset 247bosboot 115bottleneck
SCSI adapter 114
Ccenter disk allocation 120chdev 152, 153, 164chnfs 166, 168collecting
disk I/O history 110collecting data
sar command 47svmon 77
commadsnetpmon 45nice 191
© Copyright IBM Corp. 2000
commands 153/etc/netsvc.conf 165/etc/resolv.conf 165at 203batch 203chdev 152, 153, 164chnfs 166, 168defragfs 138emstat 100entstat 152filemon 41, 125, 141fileplace 41, 135, 142host 165ifconfig 152, 153, 164installp 252, 253iostat 40, 108, 201iptrace 161lockstat 115lsattr 152, 164lsdev 221lslpp 100, 250, 253lslv 41, 118, 142lsps 34, 112, 221migratepv 214netpmon 159netstat 43, 97, 152, 156nfso 153nfsstat 44nice 26, 189no 150, 157nslookup 165oslevel 249ping 156ps 25, 34, 68, 181, 202, 216renice 26, 189, 191reorgvg 211rmss 35sa1 59sa2 59sadc 59sar 23, 47, 51, 97schedtune 26, 186svmon 34, 77, 80, 83, 85, 88, 90, 217tcpdump 153, 161time 24, 201tokstat 152topas 97
279
command output 98tprof 26, 73traceroute 156trcstop 159vmstat 25, 33, 60, 97, 101, 155, 202, 215vmtune 35, 39, 66, 194, 221wlm 198
computational memory 31copies
logical volume 119CPU
bound problem 112iostat utilization report 111statistics with iostat 111
CPU bound 21process and thread table 23process state figure 22processes 22threads 22
CPU penalty 182CPU testcase 201
at 203batch 203iostat 201ps 202recent CPU usage 203rescheduling 203time 201vmstat 202
crontab 203
DDEFAULT_NICE 182deferred page space allocation 32defragfs command 138de-fragmentation of file system 138detailed file stats report in filemon 129disk
I/O statistics with iostat 108I/O wait 155iostat utilization report 113unbalanced load 112
disk bound 35logical volume device driver 35logical volume manager 35lvdd figure 36
disk bound problem 112disk bound problems 133
distribution column in lslv -l 123DPSA 32
Eearly alloaction algorithm 32emstat 100emulation routines 100entstat 152
Ffigures
128 run queues 181code, data.private and shared segments 29CPU penalty 188Disk, LVM and file system levels 107global run queue 180JFS file system organization 135lvdd 36LVM figure 37LVM intra disk positions 121memory registers 30muliple run queues 184network parameters 43performance tuning flowchart 21process state 22VMM segments 27
file memory 31file system
bigfile file system 135de-fragmentation 138fileplace command 135fragmentation size 134i-node 134journaled file system - JFS 134logical fragment 137organization 134performance 134
recommendations 140filemon 41
command 125, 141detailed file stats report 129disk access 133frequently accessed files 133logical file system 125logical volume monitoring 126monitoring scenario 211most active files report 129physical volume monitoring 126
280 IBM Certification Study Guide AIX Performance and System Tuning
reportlogical file level 127logical volume level report 130physical volume level 131virtual memory level 132
report analysis 127virtual memory system monitoring 126
fileplace 41fileplace command 135, 142files
/etc/hosts 165/etc/rc.nfs 167/usr/include/sys/lockname.h 117__prof.all 74
filesetsbos.perf 247
fragmentationfileplace command 136logical volume fragmentation scenario 210
fragmentation of logical volume 122fragmentation size 134fragmented files 136free list 30frequent periodic load balancing 186frequently accessed files 133
Gglobal run queue 179
Hhash anchor table 31high-water mark 39historical disk I/O 110host 165
II/O bottlenecks
scenarios 207I/O pacing 39idle load balancing 185ifconfig 152, 153, 164in band column in lslv -l 122infrequent periodic load balancing 186initial load balancing 185inner edge disk allocation 120inner middle disk allocation 120i-node 134
installp 252, 253inter disk policy 121
for logical volume 119maximum 121minimum 121
intra diskallocation 120policy
center 120inner edge 120inner middle 120outer edge 120outer middle 120
policy for logical volume 119iostat 40, 97, 201
enhancement to 4.3.3 40iostat command 108
historical disk I/O 110SMP behaviour 113
IP 150data flow 151input queue 154, 159
ipqmaxlen 154, 159iptrace 153, 161
JJFS 37
bigfile file system 135file system organization 134fileplace command 135fragmentation 37fragmentation size 134i-node 134performance tools 107
Kkernel locks
display with lockstat 115
Llate allocation algorithm 31limitations
striping 139load balancing 185
frequent periodic load balancing 186idle load balancing 185infrequent periodic load balancing 186
281
initial load balancing 185lock
display of lock contention with lockstat 115lock contention
display with lockstat 115lockstat command 115logical fragment 137logical partition 36logical volume 36
allocation 123allocation scenario 212attributes 118bad block policy 119copies 119distribution 123fragmentation 122fragmentation scenario 210highest performance 125inter disk policy 119, 121intra disk policy 119mirror write consistency 119organization for highest performance 138relocateable 119scheduling policy 119stripe size 122stripe width 122striping 122, 139upper bound 119write policy
parallel 120sequential 120
write verify 119logical volume device dirver 35logical volume manager
availability 120monitoring 125performance
analysis with lslv 118tools 107
logical volume manger 35low-water mark 39lsattr 152, 164lsdev command 221lslpp 100, 250, 253lslv 41lslv command 118, 142lsps 34lsps -a command 112lsps command 221
LVDD 35LVM 35
dependecies figure 37fragmentation 37high-water mark 39I/O pacing 39JFS 37logical partition 36logical volume 36low-water mark 39maxpgahead 38minpgahead 38physical partition 36physical volume 36sequential-access read ahead 38volume group 36write-behind 39
Mmaximum transfer unit (MTU) 149maxpgahead 38mbufs 153, 158memory bound 27
virtual memory 27migratepv command 214minpgahead 38mirror write consistency 119Mirroring 120monitoring
filemon command 125logical volume 125scenario with filemon 211
most active files report 129MTU 164multiple run queues 184multiprocessor
behaviour of iostat 113
Nname resolution
performance 165netpmon 45, 159netstat 43, 97, 152, 156network
I/O wait 155tuning tools 163
network bound 42parameter figure 43
282 IBM Certification Study Guide AIX Performance and System Tuning
NFS 160client performance 168file system 168mount options 168server performance 165tuning 165
nfs_socketsize 167nfs_tcp_socketsize 167nfso 153nfsstat 44NICE 182nice 26, 182, 189, 191
changing value on running thread 191flag table 192running program with nice 190
no 150, 157nslookup 165NSORDER 165
Oorganization
file system 134oslevel 249outer edge disk allocation 120outer middle disk allocation 120overhead
of performing tools 140
Ppacket
dropped 153, 159page fault 30page frame table 30page stealing 30paging performance problem 215
investigation 221recommendations 224
paging spacedisk performance 140
parallel write policy 120performace
filemon 125performance
analysis and control 247controlling resource allocation 21CPU bound 21define and prioritizie 20disk bound 35
file system 134file system recommendations 140highest logical volume performance 125identify resources 20identify workload 19load monitoring 247logical volume manager
analysis with lslv 118lvdd 36LVM and JFS performance tools 107LVM dependencies figure 37memory bound 27memory register figure 30minimize requirements 20network bound 42network parameter figure 43process and thread table 23process state figure 22processes 22resource table 20threads 22tuning flowchart picture 21VMM segment figure 27VMM segment picture 29vmstat table 33
performance capacity planning 247Performance PMR Data Collection 247performance tools 247
filesetperfagent.server 248perfagent.tool 248perfagent.tools 250perfmgr.common 248perfmgr.local 248perfmgr.network 248
installing 247overview 247Performance Toolbox 247
releases 248Performance Toolbox Agent 248Performance Toolbox Manager 248, 252
physical partition 36physical volume 36
filemon report 131unbalanced load 112
physical volume utilization 114ping 156priority 182priority calculation 4.3.2 179
283
priority calculation 4.3.3 182problems
disk bound 133processes 22processor
601 PowerPC 100604 PowerPC 100POWER 100
instructions 100PowerPC 100
proftotal collumn 74
protocolstatistics 157
protocolsIP 150TCP 149tuning 153UDP 149
ps 25, 34, 68, 181, 202%CPU column 70%MEM column 72C column 69PGIN column 73RSS column 72SIZE column 71TIME column 70TRS column 73TSIZ column 73
ps command 216PSALLOC 31
Deferred Page Space Allocation 32early allocation algorithm 32late allocation algorithm 31
Qqueue
receive 151size 152transmit 151
Rreceive queue 150recent CPU usage 181registers 29relocatable
attribute for logical volume 119renice 26, 189, 191
flag table 192reorgvg command 211report
iostat 109CPU utilization 111disk utilization 113TTY utilization 111
rescheduling 203resent CPU usage 203rfc1323 154rmss 35rx_que_size 150
Ssa1 command 59sa2 command 59sadc command 59sar 23, 97
/usr/lib/sa/sa1 23usr/lib/sa/sa2 23
sar command 47, 51flags 52
saturated SCSI adapter 115sb_max 154scenarios
filemon monitoring 211I/O bottlenecks 207iostat 209logical volume allocation 212logical volume fragmentation 210
SCHED_D 182, 186SCHED_FIFO 178SCHED_FIFO2 178SCHED_FIFO3 178SCHED_OTHER 178SCHED_R 182, 186SCHED_RR 178schedtune 26, 186
commandsschedtune 189
example 1 187example 2 187example 3 187flag table
tables
schedtune flags 189SCHED_D 186SCHED_R 186
284 IBM Certification Study Guide AIX Performance and System Tuning
SCHED_R and SCHED_D guidelines 188scheduler
128 run queue figure 181base value 182CPU penalty 182CPU penalty figure 188DEFAULT_NICE 182global run queue 179global run queue figure 180load balancing 185multiple run queue figure 184multiple run queues 184NICE 182nice value 182priority 182priority calculation 4.3.2 179priority calculation 4.3.3 182recent CPU usage 181SCHED_D 182, 186SCHED_FIFO 178SCHED_FIFO2 178SCHED_FIFO3 178SCHED_OTHER 178SCHED_R 182, 186SCHED_R and SCHED_D guidelines 188SCHED_RR 178schedtune example 1 187schedtune example 2 187schedtune example 3 187steal threshold 185steal_max 185waitproc 185xnice 183
scheduling policy for logial volume 119SCSI
adapter bottleneck 114segment registers 29sequential write policy 120sequential-access read ahead 38slowest average seek 121SMIT fast path
smit chgsys 110smitty
install_all 252list_software 250
SMPiostat behaviour 113
socketactive 157
buffer 165buffer overflows 167receive buffer 150, 154send buffe 154send buffer 149
statisticsCPU 159
queues 97utilization 98
disk I/O 108file 97Internet socket calls 160mbufs 158memory 98network device-driver I/O 159network interfaces 98paging 98physical disks 99terminal I/O 108
statisticsprotocols 157statistisc
Ethernet 152steal threshold 185steal_max 185stripe size logical volume attribute 122stripe width logical volume attribute 122striping 122
limitations 139logical volume striping 139recommendations 139
svmon 34svmon command 77, 80, 83, 85, 88, 90, 217
command report 90output description 92syntax 90
detailed segment report 88output description 89syntax 88
flags 94global report 77
output description 79syntax 77
process report 83output description 85syntax 83
report types 77segment report 85
output description 86syntax 85
285
user report 80output description 82syntax 80
workload class report 92output description 94syntax 92
systemtypical AIX system behaviour 133
Ttables
hardware and logical resources 20nice flags 192processes and threads 23renice flags 192VMM related output from vmstat 33
TCP 149, 165data flow 151
tcp_recvspace 154tcp_sendspace 149, 154tcpdump 153, 161telnet
session 161terminal
I/O statistics with iostat 108I/O wait 155
testcaseCPU 201
thewall 154, 158, 164threads 22
R state 22ready to run 22S state 23sleeping 23state 22suspended 23T state 23
throughputSCSI adapters 115
time 24, 201tokstat 152tools
LVM and JFS performance tools 107topas 97
command output 98tprof 26, 73
FREQ collumn 75general report 74
using tprof on a program 76traceroute 156traceroute command 156translation lookaside buffer 30transmit queue 150trcstop 159TTY
devices 111iostat utilization report 111
tx_que_size 150, 153
UUDP 149, 165
data flow 151udp_recvspace 154udp_sendspace 149, 154unbalanced disk load 112upper bound attribute for logical volume 119utilization
CPU with iostat 111disk with iostat 113TTY with iostat 111
Vvirtual memory
client segment 28code segment 28computational memory 31data segment 28file memory 31filemon report 132free list 30HAT 31high-water mark 39I/O pacing 39low-water mark 39maxpgahead 38memory register figure 30minpgahead 38page fault 30page stealing 30persistent segment 27private segment 28PSALLOC 31PTF 30segment figure 27segment picture 29segment registers 29
286 IBM Certification Study Guide AIX Performance and System Tuning
segments 27sequential-access read ahead 38shared segment 28TLB 30vmstat table 33working segment 28write-behind 39
Virtual Memory Manager (VMM) 194virtual memory monitoring
filemon command 125vmstat 25, 33, 97, 101, 155, 202vmstat command 60, 215
cpu column description 223faults column description 223kthr column description 221memory column description 222output description 61output interpretation 67page column description 222sum structure 63
vmtune 35, 39vmtune command 66, 194, 221
flags 195syntax 193
volume group 36
Wwaitproc 185wirte-behind 39wlm command 198workload
identify 19Workload Manager 198write policy
parallel 120sequential 120
write verify for logical volume 119
Xxnice 183
287

288 IBM Certification Study Guide AIX Performance and System Tuning
© Copyright IBM Corp. 2000 289
IBM Redbooks review
Your feedback is valued by the Redbook authors. In particular we are interested in situations where a Redbook "made the difference" in a task or problem you encountered. Using one of the following methods, please review the Redbook, addressing value, subject matter, structure, depth and quality as appropriate.
• Use the online Contact us review redbook form found at ibm.com/redbooks • Fax this form to: USA International Access Code + 1 845 432 8264 • Send your comments in an Internet note to [email protected]
Document NumberRedbook Title
SG24-6184-00IBM Certification Study Guide AIX Performance and System Tuning
Review
What other subjects would you like to see IBM Redbooks address?
Please rate your overall satisfaction:
O Very Good O Good O Average O Poor
Please identify yourself as belonging to one of the following groups:
O Customer O Business Partner O Solution DeveloperO IBM, Lotus or Tivoli EmployeeO None of the above
Your email address:The data you provide here may be used to provide you with information from IBM or our business partners about our products, services or activities.
O Please do not use the information collected here for future marketing or promotional contacts or other communications beyond the scope of this transaction.
Questions about IBM’s privacy policy?
The following link explains how we protect your personal information.ibm.com/privacy/yourprivacy/


IBM Certification Study Guide AIX Perform
ance and System Tuning


®
SG24-6184-00 ISBN 0738418323
INTERNATIONAL TECHNICALSUPPORTORGANIZATION
BUILDING TECHNICALINFORMATION BASED ONPRACTICAL EXPERIENCE
IBM Redbooks are developed by IBM's International Technical Support Organization. Experts from IBM, Customers and Partners from around the world create timely technical information based on realistic scenarios. Specific recommendations are provided to help you implement IT solutions more effectively in your environment.
For more information:ibm.com/redbooks
IBM Certification Study GuideAIX Performance andSystem Tuning
Developed specifically for the purpose of preparing for AIX certification
Makes an excellent companion to classroom education
For experienced AIX professionals
The AIX and RS/6000 Certifications, offered through the Professional Certification Program from IBM, are designed to validate the skills required of technical professionals who work in the powerful, and often complex, environments of the AIX operating system and RS/6000 and pSeries servers. A complete set of professional certifications are available. They include:
IBM Certified AIX User IBM Certified Specialist - AIX System Administration IBM Certified Specialist - AIX System Support IBM Certified Specialist - AIX HACMP IBM Certified Specialist - Business Intelligence for RS/6000IBM Certified Specialist - Domino for RS/6000IBM Certified Specialist - RS/6000 Solution SalesIBM Certified Specialist - RS/6000 SP and PSSP V3IBM Certified Specialist - RS/6000 SPRS/6000 SP - Sales QualificationIBM Certified Specialist - Web Server for RS/6000IBM Certified Advanced Technical Expert - RS/6000 AIX
This IBM Redbook is designed as a study guide for professionals wishing to prepare for the AIX Performance and System Tuning certification exam as a selected course of study in order to achieve: IBM Certified Advanced Technical Expert - RS/6000 AIX.