Embed Size (px)
Citation preview
WWW.IBISWORLD.CA Juice Production in Canada December 2014 1
IBISWorld Industry Report 31211cCAJuice Production in CanadaDecember 2014 Sarah Kahn
Freshly squeezed: New products aimed at healthier consumers will propel industry revenue
2 About this Industry2 Industry Definition
2 Main Activities
2 Similar Industries
3 Additional Resources
4 Industry at a Glance
5 Industry Performance5 Executive Summary
5 Key External Drivers
7 Current Performance
9 Industry Outlook
11 Industry Life Cycle
13 Products & Markets13 Supply Chain
13 Products & Services
14 Demand Determinants
15 Major Markets
16 International Trade
17 Business Locations
19 Competitive Landscape19 Market Share Concentration
19 Key Success Factors
19 Cost Structure Benchmarks
21 Basis of Competition
21 Barriers to Entry
22 Industry Globalization
23 Major Companies23 Lassonde Industries Inc.
27 Operating Conditions27 Capital Intensity
28 Technology & Systems
28 Revenue Volatility
29 Regulation & Policy
30 Industry Assistance
31 Key Statistics31 Industry Data
31 Annual Change
31 Key Ratios
32 Jargon & Glossary
www.ibisworld.ca | 1-800-330-3772 | [email protected]
WWW.IBISWORLD.CA Juice Production in Canada December 2014 2
Operators in this industry primarily produce fruit-based and fruit-flavoured beverages, as well as other nonalcoholic beverages, including iced coffee, iced tea,
sports drinks and energy drinks. Production of carbonated soft drinks (CSDs), ice and bottled water are not included in this industry.
The primary activities of this industry are
Manufacturing juice beverages
Researching and developing juice beverages
Promoting juice beverage brands
31192CA Coffee & Tea Production in CanadaThe Coffee Production industry includes establishments that produce coffee by purchasing coffee beans and processing them into roasted or ground coffee.
31194CA Seasoning, Sauce and Condiment Production in CanadaThe Seasoning, Sauce and Condiment Production industry manufactures products like mayonnaise, dressings, spices, extracts and dry food mixes from a plethora of ingredients.
31211aCA Soda Production in CanadaThe Soda Production industry blends various ingredients with carbonated water and also packages and distributes these beverages for resale.
31211bCA Bottled Water Production in CanadaThe Bottled Water Production industry purifies and bottles water for resale and manufactures ice.
31212CA Breweries in CanadaThe Breweries industry primarily brews alcoholic beverages using malted barley and hops.
Industry Definition
Main Activities
Similar Industries
About this Industry
The major products and services in this industry are
Apple Juice
Citrus Fruit Juice
Grape Juice
Juice of any other single fruit or vegetable
Mixtures of juices
Tomato Juice
WWW.IBISWORLD.CA Juice Production in Canada December 2014 3
About this Industry
Additional Resources For additional information on this industry
www.canadianbeverage.ca Canadian Beverage Association
www.statcan.gc.ca Canadian Community Health Survey
www.dietitians.ca Dietitians of Canada
www.hc-sc.gc.ca Health Canada
IBISWorld writes over 400 Canadian industry reports to help you make better business decisions, faster. To see all reports, go to www.ibisworld.ca
WWW.IBISWORLD.CA Juice Production in Canada December 2014 4
Lite
rs
110
60
70
80
90
100
2006 08 10 12 14 16 18Year
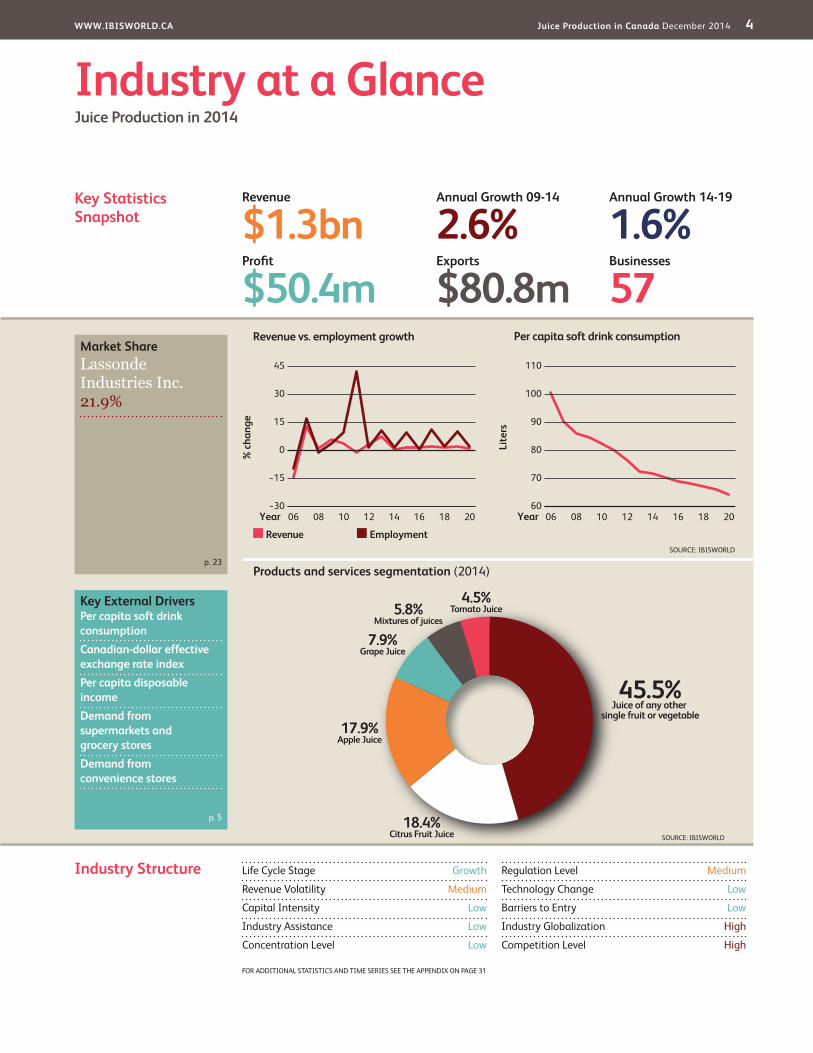
Per capita soft drink consumption
SOURCE: IBISWORLD
% c
hang
e
45
−30
−15
0
15
30
2006 08 10 12 14 16 18Year
Revenue Employment
Revenue vs. employment growth
Products and services segmentation (2014)
45.5%Juice of any other
single fruit or vegetable
4.5%Tomato Juice
18.4%Citrus Fruit Juice
17.9%Apple Juice
7.9%Grape Juice
5.8%Mixtures of juices
SOURCE: IBISWORLD
Key Statistics Snapshot
Industry at a GlanceJuice Production in 2014
Industry Structure Life Cycle Stage Growth
Revenue Volatility Medium
Capital Intensity Low
Industry Assistance Low
Concentration Level Low
Regulation Level Medium
Technology Change Low
Barriers to Entry Low
Industry Globalization High
Competition Level High
Revenue
$1.3bnProfit
$50.4mExports
$80.8mBusinesses
57
Annual Growth 14-19
1.6%Annual Growth 09-14
2.6%
Key External DriversPer capita soft drink consumptionCanadian-dollar effective exchange rate indexPer capita disposable incomeDemand from supermarkets and grocery storesDemand from convenience stores
Market ShareLassonde Industries Inc. 21.9%
p. 23
p. 5
FOR ADDITIONAL STATISTICS AND TIME SERIES SEE THE APPENDIX ON PAGE 31
WWW.IBISWORLD.CA Juice Production in Canada December 2014 5
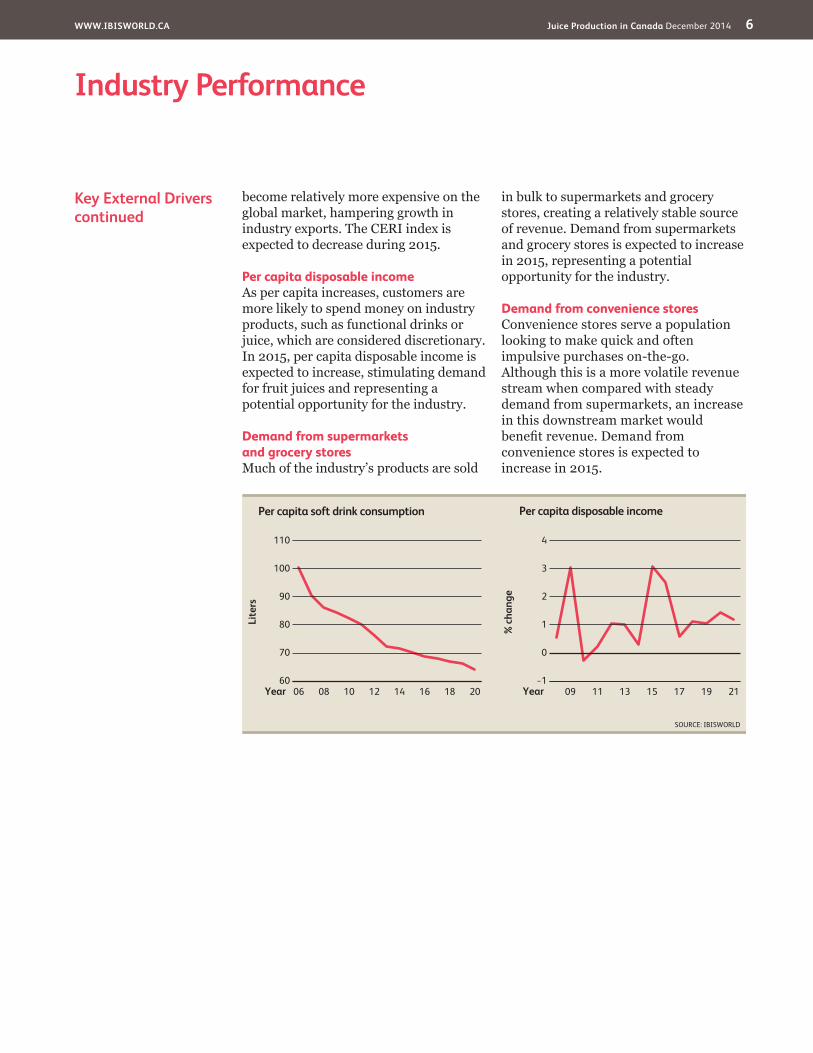
Key External Drivers Per capita soft drink consumptionJuice is considered a healthy alternative to soft drinks. Many health-conscious consumers, including an aging population, are decreasing their soft drink consumption and selecting a healthier drink instead. Consumers’ increased attention to sugar and calorie intake represents an opportunity for some industry products and a threat to others. In 2015, per capita soft drink consumption is expected to decrease.
Canadian-dollar effective exchange rate indexThe Canadian-dollar effective exchange rate index (CERI) is a weighted average of bilateral exchange rates comparing the Canadian dollar with the currencies of Canada’s primary trading partners. As the Canadian dollar appreciates, foreign goods become relatively less expensive in the Canadian market and thus more attractive, increasing import penetration. Additionally, Canadian-made products
Executive Summary
Growing health concerns as a result of the rise in obesity and diabetes have encouraged beverage customers to become increasingly selective in their drink consumption, migrating away from carbonated soft drinks (IBISWorld report 31211aCA) and toward industry products or bottled water (31211bCA). Marketing campaigns for low-calorie and all-natural beverages, as well as added fibre, omega-3 and probiotics, have further stimulated the movement toward juice substitutes. Consequently, over the past five years, revenue has grown at an
average annual rate of 2.6%, reaching $1.3 billion in 2014.
Demand for new products has been fuelling industry revenue, as producers invest heavily in research and development and market increasingly varied and exotic mixtures of fruits and vegetables. New companies have been taking advantage of the opportunities created by this variety of demand, and it has attracted new businesses and driven industry expansion. Additionally, increased consumer spending has been loosening consumers’ pockets and
encouraging impulsive on-the-go purchases of discretionary industry products. However, the industry faces ample external competition from industries creating other exotic beverages, such as coconut water, tropical beverages and kombucha. Nevertheless, revenue is expected to grow 0.5% in 2014 alone, as high investment in marketing and research and development pays off.
Over the next five years, exotic beverages are expected to continue boosting industry revenue as per capita soft drink consumption continues to decrease. A new concern for controlling sugar intake is driving consumers away from high-sugar juices to healthier alternatives. Additionally health-conscious consumers may turn to fruits and vegetables that have more fibre than juice. Nevertheless. increasing demand from grocery stores and supermarkets will also provide a stable revenue stream while rising per capita disposable income will continue to encourage impulse purchases from convenience stores and vending machines. Innovative and healthy products, coupled with the increasing prices of new brands, are expected to stabilize industry profit. Consequently, revenue is expected to increase at an average annual rate of 1.6% over the coming five years, reaching $1.4 billion in 2019.
Industry PerformanceExecutive Summary | Key External Drivers | Current Performance Industry Outlook | Life Cycle Stage
Demand for new products has been fuelling revenue, as producers invest heavily in R&D
WWW.IBISWORLD.CA Juice Production in Canada December 2014 6
Industry Performance
Key External Driverscontinued
become relatively more expensive on the global market, hampering growth in industry exports. The CERI index is expected to decrease during 2015.
Per capita disposable incomeAs per capita increases, customers are more likely to spend money on industry products, such as functional drinks or juice, which are considered discretionary. In 2015, per capita disposable income is expected to increase, stimulating demand for fruit juices and representing a potential opportunity for the industry.
Demand from supermarkets and grocery storesMuch of the industry’s products are sold
in bulk to supermarkets and grocery stores, creating a relatively stable source of revenue. Demand from supermarkets and grocery stores is expected to increase in 2015, representing a potential opportunity for the industry.
Demand from convenience storesConvenience stores serve a population looking to make quick and often impulsive purchases on-the-go. Although this is a more volatile revenue stream when compared with steady demand from supermarkets, an increase in this downstream market would benefit revenue. Demand from convenience stores is expected to increase in 2015.
% c
hang
e
4
−1
0
1
2
3
2109 11 13 15 17 19Year
Per capita disposable income
SOURCE: IBISWORLD
Lite
rs
110
60
70
80
90
100
2006 08 10 12 14 16 18Year
Per capita soft drink consumption
WWW.IBISWORLD.CA Juice Production in Canada December 2014 7
Industry Performance
Product development In the past decades, sweetened beverage intake in Canada increased, along with incidences of obesity among children. Between 2009 and 2014, however, consumption of soft drinks is expected to decrease by 3.2%, according to Statistics Canada. Over the past five years especially, health awareness has increased and consumers are gradually shifting their preferences to healthy foods and beverages. A shift away from carbonated soft drinks (IBISWorld report 31211a) has led consumers to seek healthier alternatives, such as bottled water (31211b) and juice. A growing awareness of the high sugar content in juice has, however, hurt the industry’s largest segment, which is fruit juice. Additionally, sales of juice have declined due to higher prices of inputs, especially for apple and orange juice.
This new concern regarding sugar intake has led to an explosion of new products, flavours and ingredients. Producers are responding to new health concerns by marketing calcium-enriched juices, low-calorie beverages and products with added fibre, omega-3 and probiotics. For example, V8 introduced V8 V-Fusion fruit and vegetable juices, available in five different flavours, including pomegranate blueberry and açai mixed berry, while Juicy Juice aims its products at consumers interested in healthy brain development for toddlers. Additionally, producers have introduced a multitude of fruit and vegetable mixes, including many juices that contain cucumber, kale, beets and carrots. Vegetable drinks have nutritional benefits
and companies have been blending lower brix vegetable juices like cucumber or lettuce with higher brix fruit juices, creating drinks with fewer calories and less sugar.
Overall, the increase in new product categories has led enterprises to grow over the five years to 2014 at an average annual rate of 4.4%, reaching 57 operators. Established companies have also been investing in acquisitions, often of their own bottling plants in order to decrease costs, and in research and development and marketing. Employment has also followed this trend, increasing an estimated 12.1% to 4,687 workers over the same period. Wages have increased at an even faster average annual 13.9%, as much of the new hiring has been focused on high-skill marketing and research and development positions, while the production process has been streamlined. Acquisitions and research and development investments have caused profit to decline slightly over the past five years.
Nevertheless, the industry continues to face increasing external competition from soda as well as other more exotic drinks. Sales of energy drinks, which are intended to supply mental and physical stimulation for a short period of time, have increased over the period. More exotic products, such as coconut water and kombucha, have been on the rise as well.
The Juice Production industry has been successful over the past five years, responding quickly to changing consumer preferences. With per capita income increasing, demand from supermarkets and grocery stores strengthening and health concerns intensifying, the industry has experienced sudden success. Over the
past five years, industry revenue has increased at an average annual rate of 2.6%, reaching a total of $1.3 billion in 2014. In 2014 alone, revenue is expected to increase 0.5%, as the production of new beverages bolsters the industry but operators face challenges from external competitors.
Current Performance
Concerns regarding sugar intake led to new products, flavours and ingredients
WWW.IBISWORLD.CA Juice Production in Canada December 2014 8
Industry Performance
Regulatory scene Health Canada, the Canadian Food Inspection Agency and the Canadian Medical Association are all actively researching the impact of fruit juices and new exotic juices on the health of Canadians, especially children. For example, the Canadian Medical Association recently called for a “ban on the sale of energy drinks to Canadians younger than the legal drinking age.” The Canadian Beverage Association (CBA), an industry association that develops guidelines and initiatives, also ensures responsible production and marketing of industry products. The CBA has introduced several major initiatives over the past five years. In 2009, the association’s members removed all soft drinks and provided water and 100.0% juice in elementary and middle schools, removed full-calorie soft drinks from secondary schools and capped caloric content and portion sizes. In 2011, it
launched Clear on Calories, making labels easier to read, with calories on the front of the package rather than on the back. Fountain beverage dispensers and vending machines must display calorie counts.
Moreover, The Children’s Advertising Initiative, administered by Advertising Standards Canada, prevents the marketing of beverages other than fruit juice, milk and water, in programming targeted to children under the age of 12. Members of the CBA have also agreed not to advertise food or beverage products in elementary schools. Such differences in the regulation of ingredients and labelling among other countries have kept exports at a low $80.8 million, decreasing at an annual rate of 1.5%, as producers focus on local markets. Nevertheless, imports are expected to continue to increase an average annual 0.8% to $814.0 million over the coming five years.
A 2011 Consumer Reports study tested 88 samples of juices, finding that 10.0% had arsenic levels over the allowable limit for drinking water in the United States and Canada. Reacting to the findings, the Canadian Food Inspection Agency partnered with Health Canada to monitor arsenic levels in juice products. In June 2014, Health Canada proposed to update the existing tolerance for lead in fruit juice, fruit nectar and beverages. Health Canada also proposed excluding apple juice from the existing tolerance for arsenic, 0.1 parts per million (ppm), and lead, 0.2 ppm, in fruit juice, fruit nectar and beverages. The proposal would decrease the tolerance to 0.01 ppm for total arsenic and 0.05 ppm for total lead in apple juice.
Although orange juice remains one of the most popular industry products, consumption has fluctuated and declined slightly over the past five years as the price of inputs increased. Citrus greening disease, also called Huanglongbing, causes citrus fruits to drop prematurely from afflicted trees. The disease has been devastating the world’s orange crop and still has no known cure.
Apples, grapes and oranges Orange juice consumption
has declined slightly over the past five years as the price of inputs increased
WWW.IBISWORLD.CA Juice Production in Canada December 2014 9
Industry Performance
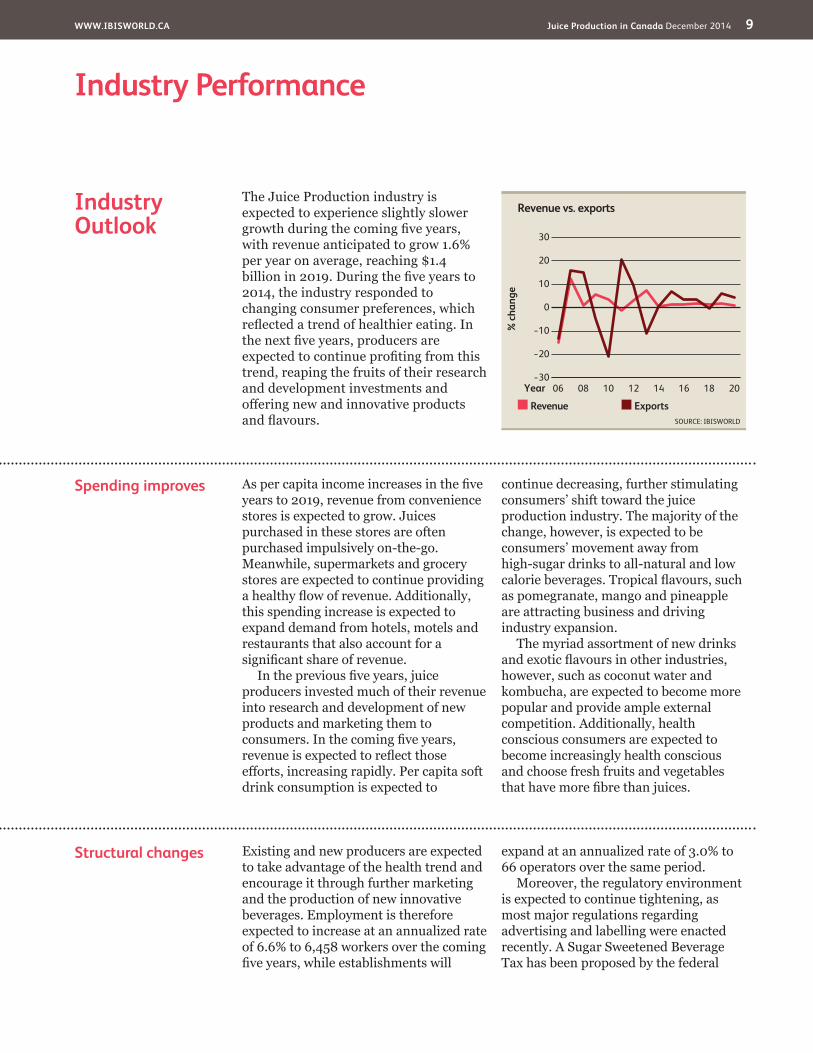
Spending improves As per capita income increases in the five years to 2019, revenue from convenience stores is expected to grow. Juices purchased in these stores are often purchased impulsively on-the-go. Meanwhile, supermarkets and grocery stores are expected to continue providing a healthy flow of revenue. Additionally, this spending increase is expected to expand demand from hotels, motels and restaurants that also account for a significant share of revenue.
In the previous five years, juice producers invested much of their revenue into research and development of new products and marketing them to consumers. In the coming five years, revenue is expected to reflect those efforts, increasing rapidly. Per capita soft drink consumption is expected to
continue decreasing, further stimulating consumers’ shift toward the juice production industry. The majority of the change, however, is expected to be consumers’ movement away from high-sugar drinks to all-natural and low calorie beverages. Tropical flavours, such as pomegranate, mango and pineapple are attracting business and driving industry expansion.
The myriad assortment of new drinks and exotic flavours in other industries, however, such as coconut water and kombucha, are expected to become more popular and provide ample external competition. Additionally, health conscious consumers are expected to become increasingly health conscious and choose fresh fruits and vegetables that have more fibre than juices.
Structural changes Existing and new producers are expected to take advantage of the health trend and encourage it through further marketing and the production of new innovative beverages. Employment is therefore expected to increase at an annualized rate of 6.6% to 6,458 workers over the coming five years, while establishments will
expand at an annualized rate of 3.0% to 66 operators over the same period.
Moreover, the regulatory environment is expected to continue tightening, as most major regulations regarding advertising and labelling were enacted recently. A Sugar Sweetened Beverage Tax has been proposed by the federal
The Juice Production industry is expected to experience slightly slower growth during the coming five years, with revenue anticipated to grow 1.6% per year on average, reaching $1.4 billion in 2019. During the five years to 2014, the industry responded to changing consumer preferences, which reflected a trend of healthier eating. In the next five years, producers are expected to continue profiting from this trend, reaping the fruits of their research and development investments and offering new and innovative products and flavours.
Industry Outlook
% c
hang
e
30
−30
−20
−10
0
10
20
2006 08 10 12 14 16 18Year
Revenue Exports
Revenue vs. exports
SOURCE: IBISWORLD
WWW.IBISWORLD.CA Juice Production in Canada December 2014 10
Industry Performance
government and is still being debated, as the Canadian Beverage Association advocates that it is more effective to educate consumers to make informed decisions rather than taxing the high-sugar beverages. Further regulations regarding the packaging and recycling of materials in an efficient yet
environmentally friendly manner are expected to take effect in the coming five years. Furthermore, despite scrutiny at the border, exports are expected to increase over the coming five years at an average annual rate of 4.0% to $98.1 million, as imports increase 3.3% to $956.3 million over the same period.
Structural changes continued
WWW.IBISWORLD.CA Juice Production in Canada December 2014 11
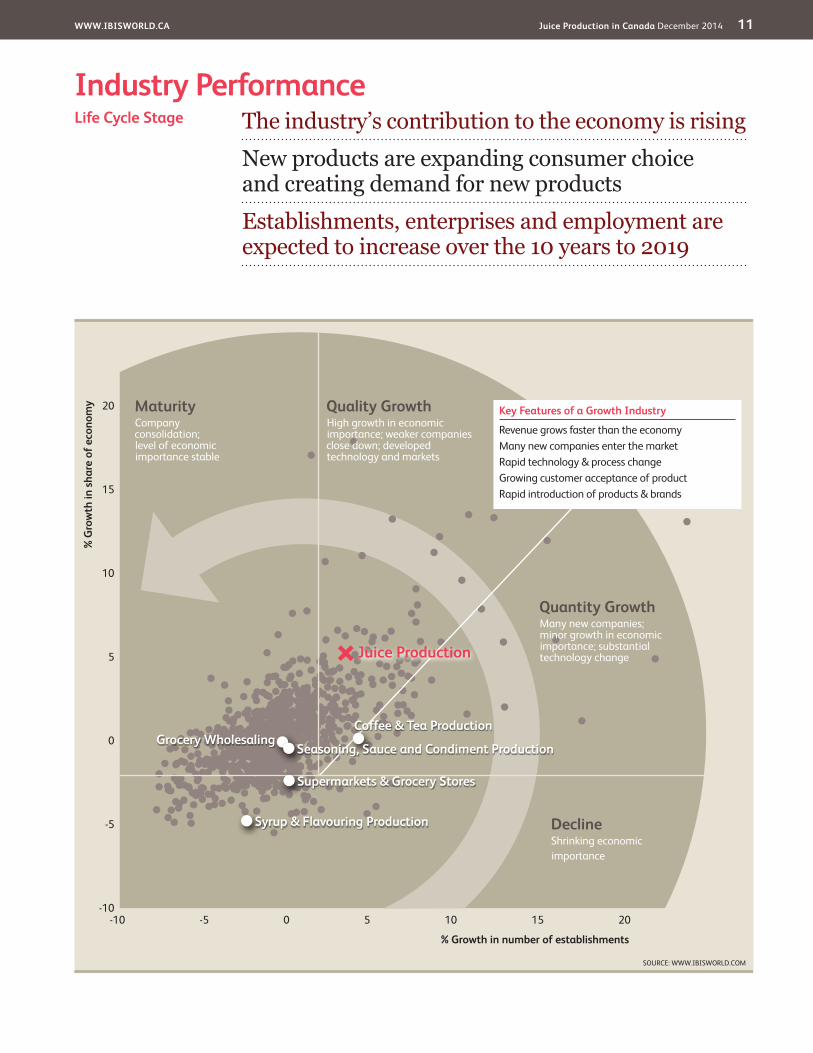
Industry PerformanceThe industry’s contribution to the economy is risingNew products are expanding consumer choice and creating demand for new productsEstablishments, enterprises and employment are expected to increase over the 10 years to 2019
Life Cycle Stage
SOURCE: WWW.IBISWORLD.COM
20
15
10
5
0
-5
-10
% G
row
th in
sha
re o
f eco
nom
y
% Growth in number of establishments
-10 -5 0 5 10 15 20
DeclineShrinking economicimportance
Quality GrowthHigh growth in economic importance; weaker companies close down; developed technology and markets
MaturityCompany consolidation;level of economic importance stable
Quantity GrowthMany new companies; minor growth in economic importance; substantial technology change
Key Features of a Growth Industry
Revenue grows faster than the economyMany new companies enter the marketRapid technology & process changeGrowing customer acceptance of productRapid introduction of products & brands
Coffee & Tea ProductionGrocery Wholesaling
Syrup & Flavouring Production
Seasoning, Sauce and Condiment Production
Supermarkets & Grocery Stores
Juice Production
WWW.IBISWORLD.CA Juice Production in Canada December 2014 12
Industry Performance
Industry Life Cycle The Juice Production industry is in the midst of a growth period and is anticipated to continue expanding over the next five years. Industry value added, a measure of the industry’s contribution to the national economy, is expected to increase at an annualized rate of 7.7% over the ten years to 2019. Over the same period, GDP is expected to rise at a significantly slower 2.3% annualized rate.
Over the 10 years, the number of enterprises is expected to increase at a rate of 3.7%, with employment following at 9.3%. New producers on niche segments are attracting an increasing number of health-conscious consumers, increasing the market competition quickly. New drinks and exotic flavours have been entering the industry and attracting customers with widespread success, increasing the market segments offered in the Juice Production industry.
This industry is Growing
WWW.IBISWORLD.CA Juice Production in Canada December 2014 13
Products & Services Cold pressing, a method in which fruits and vegetables are crushed and pressed for maximum liquid extraction, has become increasingly popular. With the centrifugal juicer method, the cold-presser uses no heat and minimizes oxygen exposure, which can be detrimental to the live enzymes and nutrients in fruits and vegetables.
Citrus juicesAlthough orange juice remains one of the most popular juices, its consumption has declined significantly over the past five years. Citrus greening, also called Huanglongbing, a disease with no known cure that causes fruits to drop prematurely from afflicted trees, has caused the supply of oranges to wane,
leading to orange price increases and declining demand.
Apple and grape juicesDemand for apple juice and grape juice fluctuated slightly over the past five years. A 2011 Consumer Reports study of 88 juice samples in the United States and Canada found that 10.0% had arsenic levels over the allowable limit for drinking water. Health Canada has updated lead and arsenic tolerances and is proposing to lower the existing tolerance for lead in fruit juice, fruit nectar and beverages. The agency is also proposing to exclude apple juice from the existing tolerance for arsenic in fruit juice, fruit nectar and beverages.
Products & MarketsSupply Chain | Products & Services | Demand Determinants Major Markets | International Trade | Business Locations
KEY BUYING INDUSTRIES
41311CA Grocery Wholesaling in Canada Most of the producers sell their products to wholesalers for resale to supermarkets and convenience stores.
44511CA Supermarkets & Grocery Stores in Canada This is the largest single market for the Juice Production industry, a key contact with final consumers.
44512CA Convenience Stores in Canada Although smaller than grocery stores, convenience stores remain an important demand link to final consumers.
45421CA Vending Machine Operators in Canada Some producers sell their products to vending machine operators for resale to the public.
KEY SELLING INDUSTRIES
31193CA Syrup & Flavouring Production in Canada Liquid beverage bases, colourings and flavorings are purchased from this industry.
31199CA Baking Mix & Prepared Food Manufacturing in Canada Other ingredients, such as caffeine, non-sugar sweeteners, acidulants, preservatives, potassium and sodium are purchased from various specialist manufacturers.
32221CA Cardboard Box & Container Manufacturing in Canada Paperboard boxes are used to distribute the products of this industry to wholesale and retail outlets.
32311CA Printing in Canada Label printing of bottles and cans is imperative for product recognition and sales, so this is a key input for soft drink and ice manufacturers.
32616CA Plastic Bottle Manufacturing in Canada Much of the juice sold for final consumption is packaged in plastic bottles, making this industry a key supplier to bottlers.
Supply Chain
WWW.IBISWORLD.CA Juice Production in Canada December 2014 14
Products & Markets
DemandDeterminants
Juice producers are largely affected by changes in disposable income, weather conditions, and changing lifestyles and tastes. Industry products are considered discretionary, as they are easily replaceable with tap water. Thus, when per capita disposable income and consumer spending decrease, industry revenue follows. Companies spend significantly on research and development and marketing their products, especially to the younger population. Additionally, seasonal variation and weather conditions impact the industry, as sales increase during the warmer months.
Consumer lifestyles play a large role in their intake of different types of
beverages. Athletes often demand electrolyte-rich sports drinks, while people in business environments may resort to energy drinks for a boost during the day and relaxation drinks to help them sleep at night.
Changes in consumer preferences are often impacted by new health reviews and trends. As certain ingredients are declared harmful and others are declared healthy, consumers migrate to healthier choices with the help of marketing. Additionally, the regulation that enforces clear labels encourages consumers to read labels more closely and choose healthier options.
Products & Servicescontinued
Currently, there is a tolerance of 0.1 parts per million (ppm) of arsenic and 0.2 ppm of lead in ready-to-serve fruit juice, fruit nectar and beverages. Health Canada’s proposal would decrease the tolerance to 0.01 ppm for total arsenic and 0.05 ppm for total lead in apple juice.
Vegetable juicesOver the five years to 2014, a general trend towards healthier eating has
brought new flavors into the Juice Production industry, including many juices that contain cucumber, kale, beets and carrots. Health experts have said that vegetable drinks have beneficial nutrients and companies have been blending lower brix vegetable juices like cucumber or lettuce with higher brix fruit juices, creating drinks with fewer calories and less sugar.
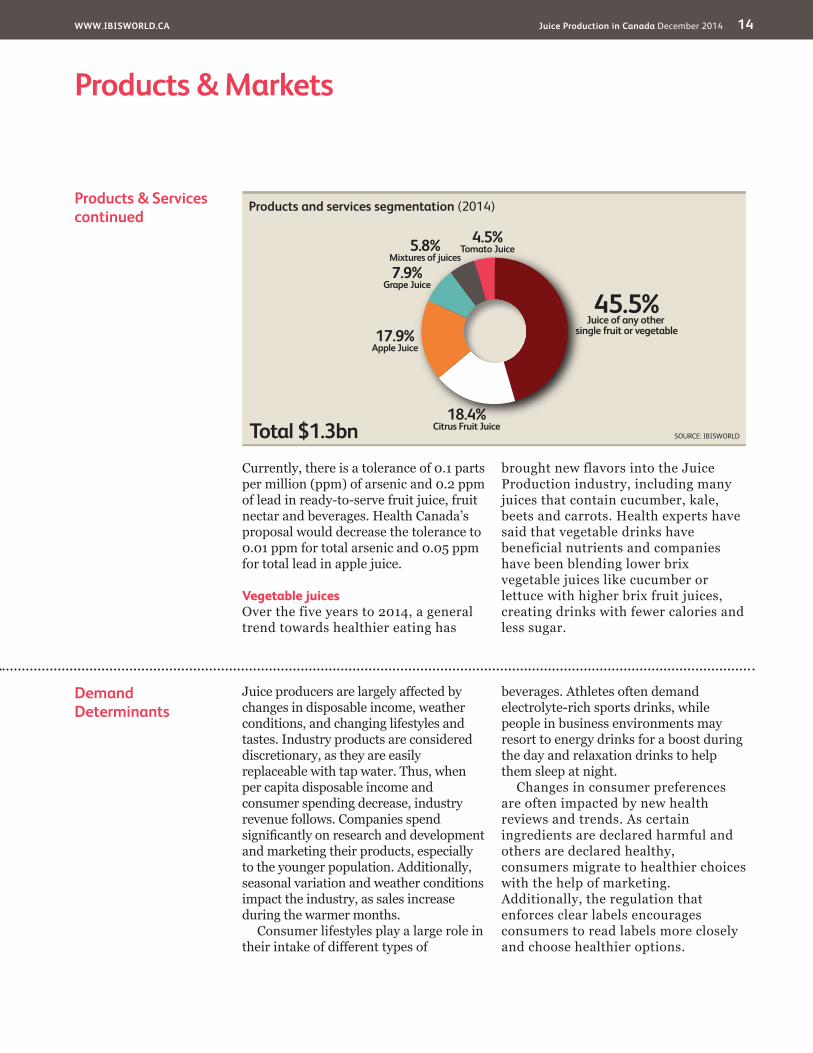
Products and services segmentation (2014)
Total $1.3bn
45.5%Juice of any other
single fruit or vegetable
4.5%Tomato Juice
18.4%Citrus Fruit Juice
17.9%Apple Juice
7.9%Grape Juice
5.8%Mixtures of juices
SOURCE: IBISWORLD
WWW.IBISWORLD.CA Juice Production in Canada December 2014 15
Products & Markets
Major Markets
Convenience storesConvenience stores represent the largest single market for sales of industry goods, especially because they are sometimes open 24 hours a day and thereby maintain a high volume of sales. Convenience stores provide producers with retail space to market beverages that depend heavily on impulse buyers, such as people on a lunch break or seeking refreshment while traveling. This market segment has been an increasing source of sales during the five years to 2014. Furthermore, it is anticipated to grow slowly during the five years to 2019 as personal disposable income increases.
Grocery and supermarketsThe next-largest market is comprised of grocery stores and supermarkets. Supermarkets often buy industry products in bulk and offer a steady stream of revenue. This segment is anticipated to decline as more small companies with niche drinks enter the industry but sell their drinks locally.
Vending machinesVending machines and individual vendors are convenient outlets for consumers, placed in locations such as rail and bus stations where no alternative vendors exist. Therefore, they represent an important
market for impulse sales. Other minor markets include drug stores, private clubs (particularly sporting) and recreation centres. This segment has declined during the five years to 2014 as consumers cut down on impulse purchases. Vending machines must display calorie counts per container on selection buttons, discouraging purchases of some industry products. These markets are expected to decrease during the next five years.
Exports and otherExport markets, which overwhelmingly are comprised by the United States but also include Japan and China, are very small in relation to the industry as a whole, since major industry players typically license beverage manufacturing in countries where demand is high. Exports decreased over the five years since 2009 due to the increased popularity of local drinks. They are anticipated to increase during the five years to 2019, however, as popularity of juices increases along with globalization.
Other markets include restaurants and bars, hotels, hospitals and schools, which do not usually sell a large number of this industry’s products. This category is projected to expand, however, as the market for fruit juices continues to grow.
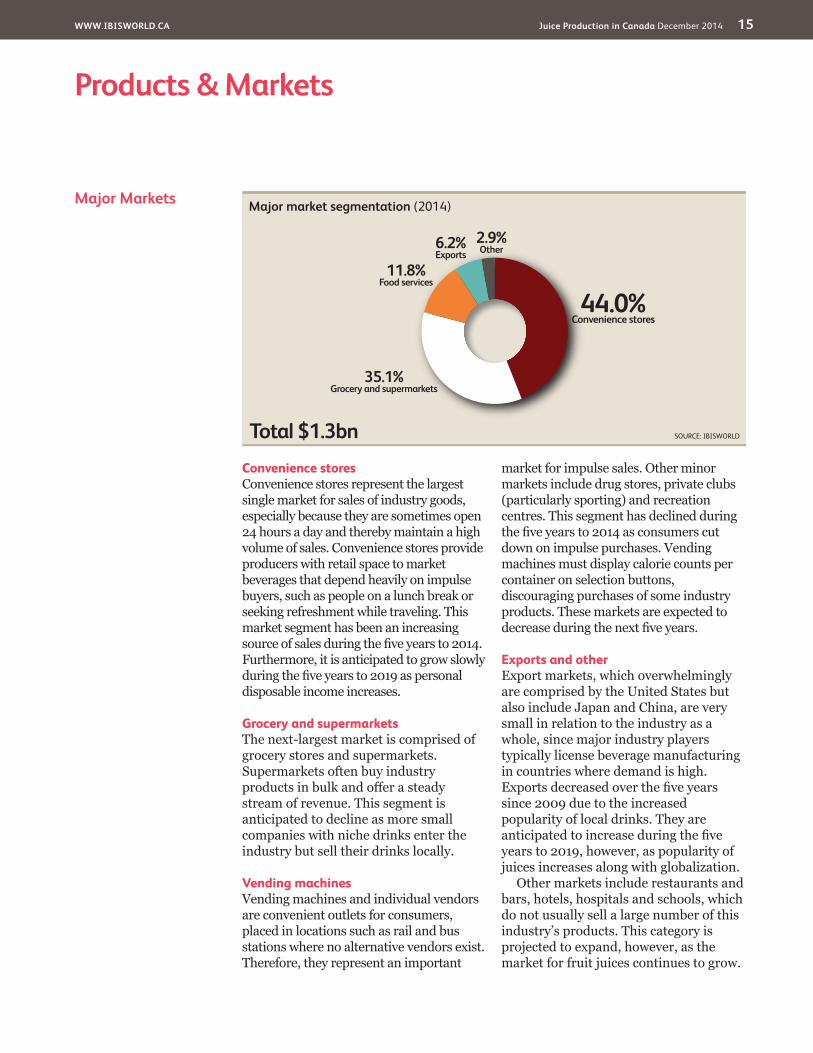
Major market segmentation (2014)
Total $1.3bn
44.0%Convenience stores
35.1%Grocery and supermarkets
11.8%Food services
6.2%Exports
2.9%Other
SOURCE: IBISWORLD
WWW.IBISWORLD.CA Juice Production in Canada December 2014 16
Products & Markets
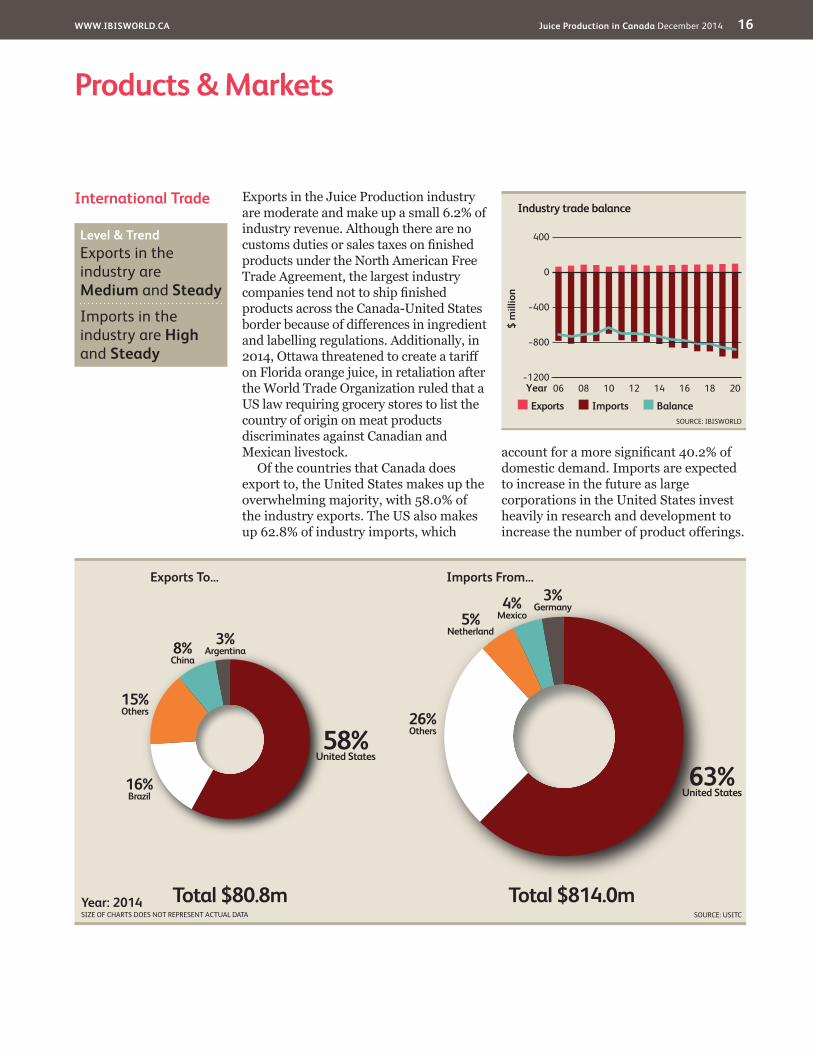
International Trade Exports in the Juice Production industry are moderate and make up a small 6.2% of industry revenue. Although there are no customs duties or sales taxes on finished products under the North American Free Trade Agreement, the largest industry companies tend not to ship finished products across the Canada-United States border because of differences in ingredient and labelling regulations. Additionally, in 2014, Ottawa threatened to create a tariff on Florida orange juice, in retaliation after the World Trade Organization ruled that a US law requiring grocery stores to list the country of origin on meat products discriminates against Canadian and Mexican livestock.
Of the countries that Canada does export to, the United States makes up the overwhelming majority, with 58.0% of the industry exports. The US also makes up 62.8% of industry imports, which
account for a more significant 40.2% of domestic demand. Imports are expected to increase in the future as large corporations in the United States invest heavily in research and development to increase the number of product offerings.
Imports From...
Total $814.0m
63%United States
26%Others
5%Netherland
4%Mexico
3%Germany
Exports To...
Total $80.8m
58%United States
16%Brazil
15%Others
8%China
3%Argentina
Year: 2014SIZE OF CHARTS DOES NOT REPRESENT ACTUAL DATA SOURCE: USITC
$ m
illio
n
400
−1200
−800
−400
0
2006 08 10 12 14 16 18Year
Exports Imports Balance
Industry trade balance
SOURCE: IBISWORLD
Level & Trend Exports in the industry are Medium and Steady
Imports in the industry are High and Steady
WWW.IBISWORLD.CA Juice Production in Canada December 2014 17
Products & Markets
Business Locations 2014
NORTHERN TERRITORIES0.0
BC20.1
AB10.7
SK3.4
MB4.1
QC18.5
NS4.1
PE0.6NB
2.8
NL4.1
YTNT
NU
Establishments (%)
Less than 5% 5% to less than 20% 20% to less than 40% 40% or more
SOURCE: IBISWORLD
ON31.3
WWW.IBISWORLD.CA Juice Production in Canada December 2014 18
Products & Markets
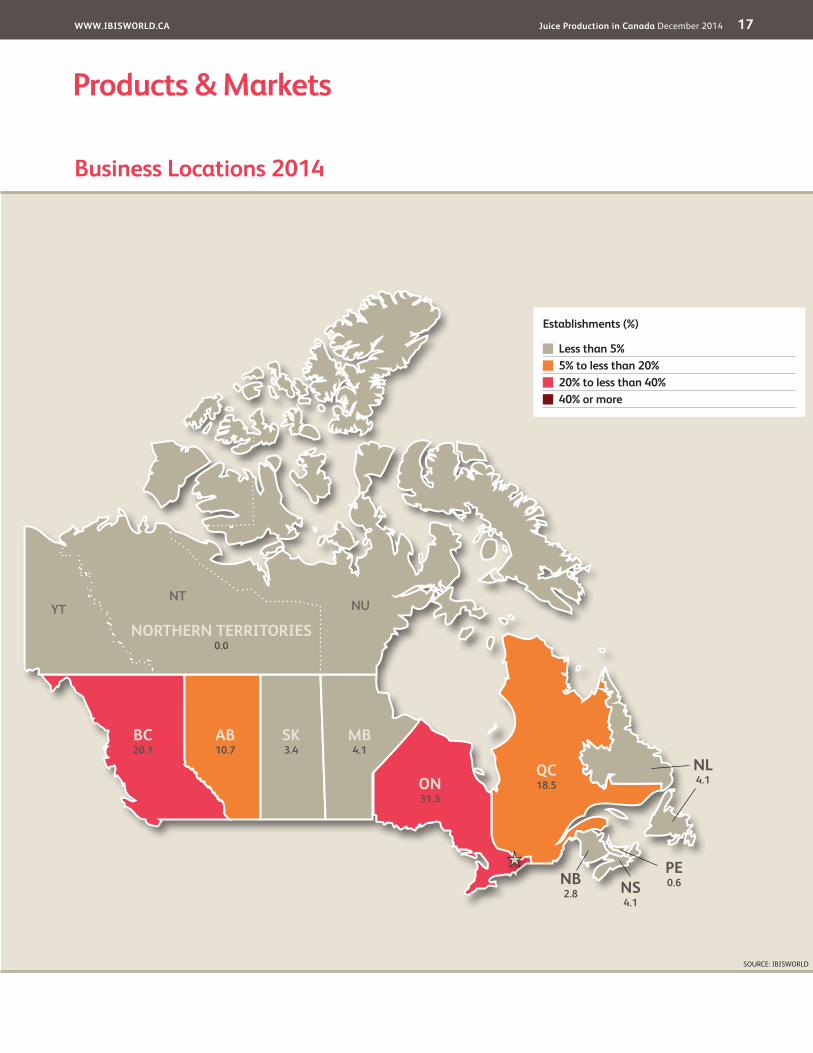
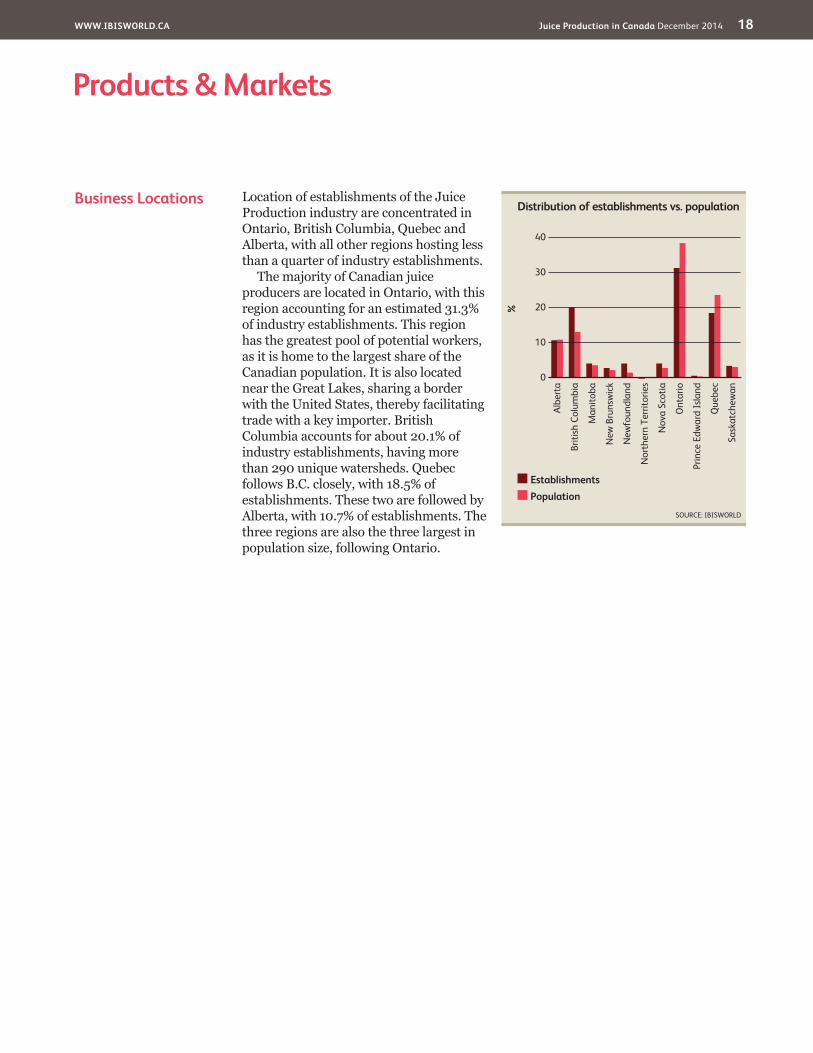
Business Locations Location of establishments of the Juice Production industry are concentrated in Ontario, British Columbia, Quebec and Alberta, with all other regions hosting less than a quarter of industry establishments.
The majority of Canadian juice producers are located in Ontario, with this region accounting for an estimated 31.3% of industry establishments. This region has the greatest pool of potential workers, as it is home to the largest share of the Canadian population. It is also located near the Great Lakes, sharing a border with the United States, thereby facilitating trade with a key importer. British Columbia accounts for about 20.1% of industry establishments, having more than 290 unique watersheds. Quebec follows B.C. closely, with 18.5% of establishments. These two are followed by Alberta, with 10.7% of establishments. The three regions are also the three largest in population size, following Ontario.
%
40
0
10
20
30
Sask
atch
ewan
Albe
rta
Briti
sh C
olum
bia
Man
itoba
New
Bru
nsw
ick
New
foun
dlan
d
Nor
ther
n Te
rrito
ries
Nov
a Sc
otia
Ont
ario
Prin
ce E
dwar
d Is
land
Que
bec
EstablishmentsPopulation
Distribution of establishments vs. population
SOURCE: IBISWORLD
WWW.IBISWORLD.CA Juice Production in Canada December 2014 19
Cost Structure Benchmarks
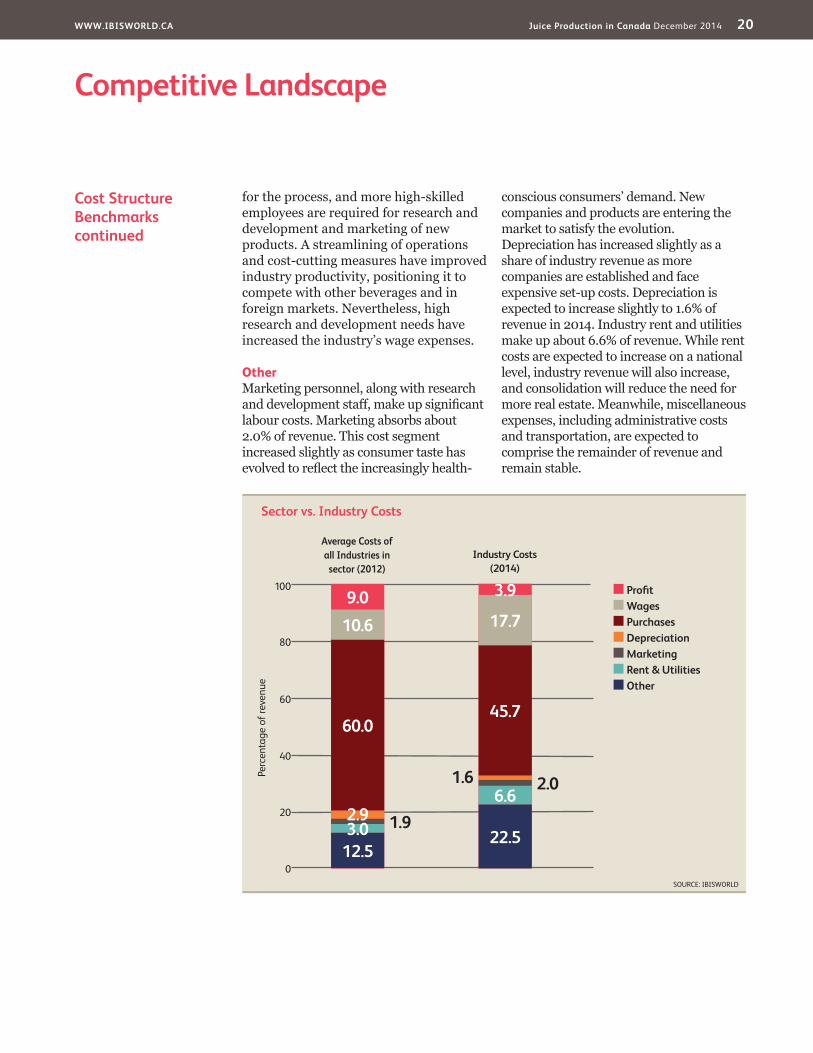
ProfitabilityThe Juice Production industry’s profit, as measured by earnings before interest and taxes, is expected to total 3.9% of revenue in 2014. Acquisitions and contracts have led to high operating costs, offset by a more efficient production level as manufacturing duties shifted to large corporations that purchase inputs in bulk and have state-of-the-art machinery. Profit is anticipated to fall as large firms invest more heavily in R&D and marketing.
PurchasesPurchases are expected to make up 45.7% of industry revenue in 2014. Despite wide
fluctuations in input prices, the industry is transitioning to a more efficient structure and producers can buy inputs, such as plastic for packaging, in bulk or on long-term contracts. This strategy is projected to continue over the next several years as ingredient prices are projected to be particularly volatile.
WagesWages are estimated to comprise 17.7% of industry revenue in 2014, a sharp increase from the 10.5% they comprised in 2009. Although much of the production process has become automated, low paying jobs are necessary
Key Success Factors Research and developmentFirms must be able to quickly identify new trends, due to fast-changing consumer taste, and spot potentially profitable geographic areas and demographics.
Economies of scopeCompanies that produce a wide range of brands can target many different markets at once, offsetting losses from one product with gains from another.
Extensive distribution and collection networkMarket power in the industry’s distribution networks is very high and somewhat concentrated. Potential
entrants must have access to these networks to survive.
Economies of scaleThe size of the operation will determine unit prices, which is a key variable with respect to competitiveness. Larger companies with a greater number of goods are, therefore, more likely to succeed.
Wide and expanding product rangeAs consumers become more health-conscious and their demand shifts from carbonated soda to more natural flavored juices, companies must be prepared to supply a variety of drinks to a variety of customers.
Market Share Concentration
The Juice Production industry is highly fragmented, with the top four players making up only 36.0% of total industry revenue and the largest company making up 21.9% of the market. Market share concentration has slightly increased over the past five years through acquisitions, contracts and new product development. Additionally, Canadians are still drinking
lots of soda, and soda consumption continues to grow. Rising rates of obesity and diabetes are expected to help shift consumer preferences. As Canadian consumers shift their preferences away from carbonated soft drinks and to fruit juices, this industry is expected to continue growing, with new companies entering the market and creating new flavours.
Competitive LandscapeMarket Share Concentration | Key Success Factors | Cost Structure Benchmarks Basis of Competition | Barriers to Entry | Industry Globalization
Level Concentration in this industry is Low
IBISWorld identifies 250 Key Success Factors for a business. The most important for this industry are:
WWW.IBISWORLD.CA Juice Production in Canada December 2014 20
Competitive Landscape
Cost Structure Benchmarkscontinued
for the process, and more high-skilled employees are required for research and development and marketing of new products. A streamlining of operations and cost-cutting measures have improved industry productivity, positioning it to compete with other beverages and in foreign markets. Nevertheless, high research and development needs have increased the industry’s wage expenses.
OtherMarketing personnel, along with research and development staff, make up significant labour costs. Marketing absorbs about 2.0% of revenue. This cost segment increased slightly as consumer taste has evolved to reflect the increasingly health-
conscious consumers’ demand. New companies and products are entering the market to satisfy the evolution. Depreciation has increased slightly as a share of industry revenue as more companies are established and face expensive set-up costs. Depreciation is expected to increase slightly to 1.6% of revenue in 2014. Industry rent and utilities make up about 6.6% of revenue. While rent costs are expected to increase on a national level, industry revenue will also increase, and consolidation will reduce the need for more real estate. Meanwhile, miscellaneous expenses, including administrative costs and transportation, are expected to comprise the remainder of revenue and remain stable.
Sector vs. Industry Costs
■ Profi t■ Wages■ Purchases■ Depreciation■ Marketing■ Rent & Utilities■ Other
Average Costs of all Industries in sector (2012)
Industry Costs (2014)
0
20
40
60
Perc
enta
ge o
f rev
enue
80
1009.0
12.53.0 1.92.9
60.0
10.6
3.9
22.5
6.62.01.6
45.7
17.7
SOURCE: IBISWORLD
WWW.IBISWORLD.CA Juice Production in Canada December 2014 21
Competitive Landscape
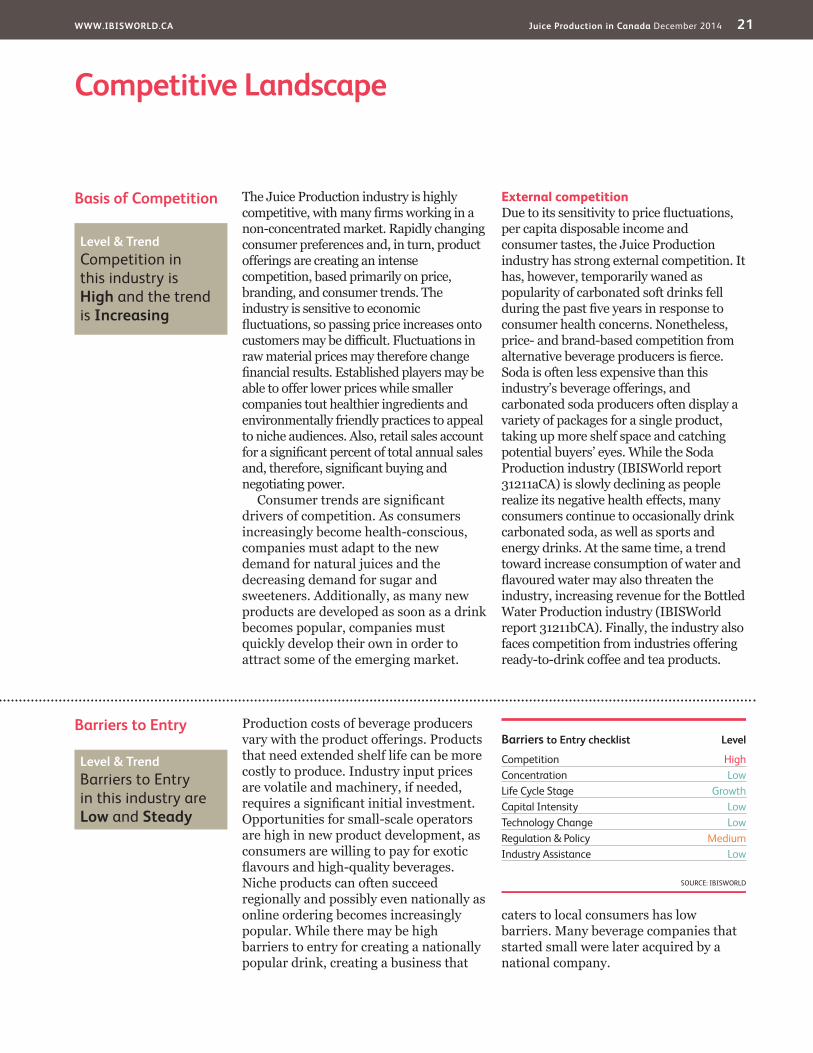
Barriers to Entry Production costs of beverage producers vary with the product offerings. Products that need extended shelf life can be more costly to produce. Industry input prices are volatile and machinery, if needed, requires a significant initial investment. Opportunities for small-scale operators are high in new product development, as consumers are willing to pay for exotic flavours and high-quality beverages. Niche products can often succeed regionally and possibly even nationally as online ordering becomes increasingly popular. While there may be high barriers to entry for creating a nationally popular drink, creating a business that
caters to local consumers has low barriers. Many beverage companies that started small were later acquired by a national company.
Basis of Competition The Juice Production industry is highly competitive, with many firms working in a non-concentrated market. Rapidly changing consumer preferences and, in turn, product offerings are creating an intense competition, based primarily on price, branding, and consumer trends. The industry is sensitive to economic fluctuations, so passing price increases onto customers may be difficult. Fluctuations in raw material prices may therefore change financial results. Established players may be able to offer lower prices while smaller companies tout healthier ingredients and environmentally friendly practices to appeal to niche audiences. Also, retail sales account for a significant percent of total annual sales and, therefore, significant buying and negotiating power.
Consumer trends are significant drivers of competition. As consumers increasingly become health-conscious, companies must adapt to the new demand for natural juices and the decreasing demand for sugar and sweeteners. Additionally, as many new products are developed as soon as a drink becomes popular, companies must quickly develop their own in order to attract some of the emerging market.
External competitionDue to its sensitivity to price fluctuations, per capita disposable income and consumer tastes, the Juice Production industry has strong external competition. It has, however, temporarily waned as popularity of carbonated soft drinks fell during the past five years in response to consumer health concerns. Nonetheless, price- and brand-based competition from alternative beverage producers is fierce. Soda is often less expensive than this industry’s beverage offerings, and carbonated soda producers often display a variety of packages for a single product, taking up more shelf space and catching potential buyers’ eyes. While the Soda Production industry (IBISWorld report 31211aCA) is slowly declining as people realize its negative health effects, many consumers continue to occasionally drink carbonated soda, as well as sports and energy drinks. At the same time, a trend toward increase consumption of water and flavoured water may also threaten the industry, increasing revenue for the Bottled Water Production industry (IBISWorld report 31211bCA). Finally, the industry also faces competition from industries offering ready-to-drink coffee and tea products.
Level & Trend Competition in this industry is High and the trend is Increasing
Barriers to Entry checklist Level
Competition HighConcentration LowLife Cycle Stage GrowthCapital Intensity LowTechnology Change LowRegulation & Policy MediumIndustry Assistance Low
SOURCE: IBISWORLD
Level & Trend Barriers to Entry in this industry are Low and Steady
WWW.IBISWORLD.CA Juice Production in Canada December 2014 22
Competitive Landscape
Industry Globalization
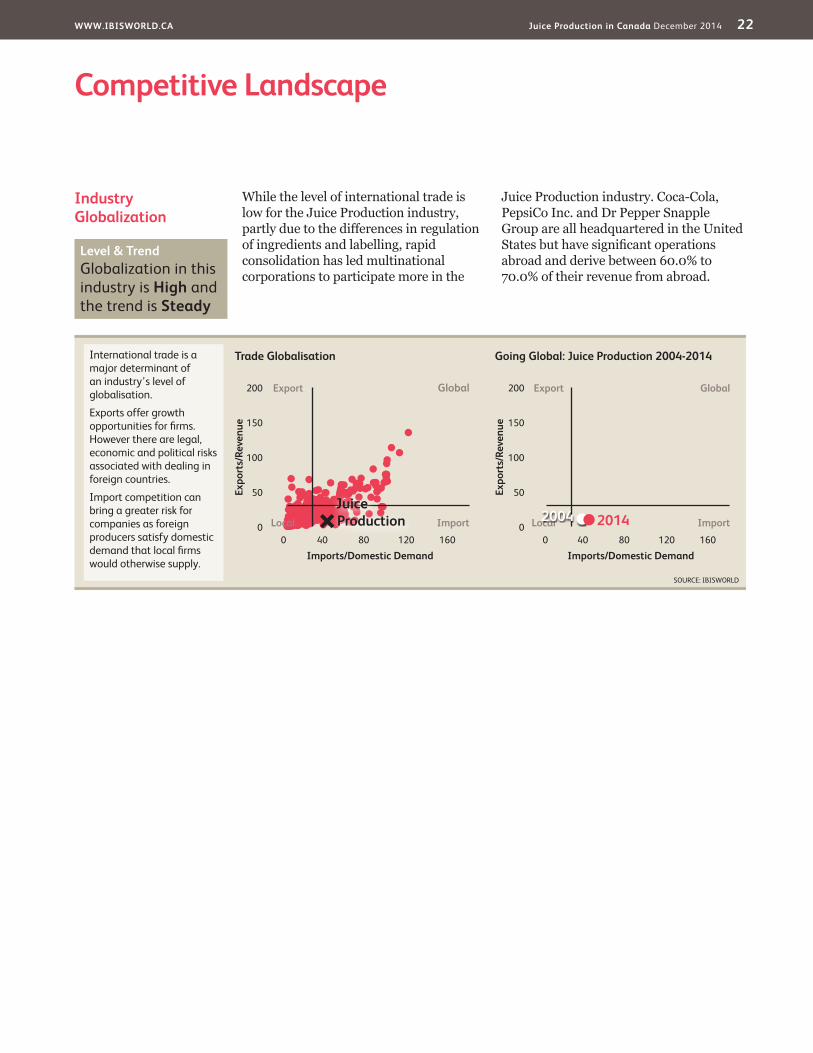
While the level of international trade is low for the Juice Production industry, partly due to the differences in regulation of ingredients and labelling, rapid consolidation has led multinational corporations to participate more in the
Juice Production industry. Coca-Cola, PepsiCo Inc. and Dr Pepper Snapple Group are all headquartered in the United States but have significant operations abroad and derive between 60.0% to 70.0% of their revenue from abroad.
SOURCE: IBISWORLD
Trade Globalisation Going Global: Juice Production 2004-2014
Expo
rts/
Reve
nue
Expo
rts/
Reve
nue
200
150
100
50
0
200
150
100
50
0
Imports/Domestic Demand Imports/Domestic Demand0 040 4080 80120 120160 160
International trade is a major determinant of an industry’s level of globalisation.
Exports offer growth opportunities for fi rms. However there are legal, economic and political risks associated with dealing in foreign countries.
Import competition can bring a greater risk for companies as foreign producers satisfy domestic demand that local fi rms would otherwise supply.
Export ExportGlobal Global
ImportLocal ImportLocal
Juice Production 2004 2014
Level & Trend Globalization in this industry is High and the trend is Steady
WWW.IBISWORLD.CA Juice Production in Canada December 2014 23
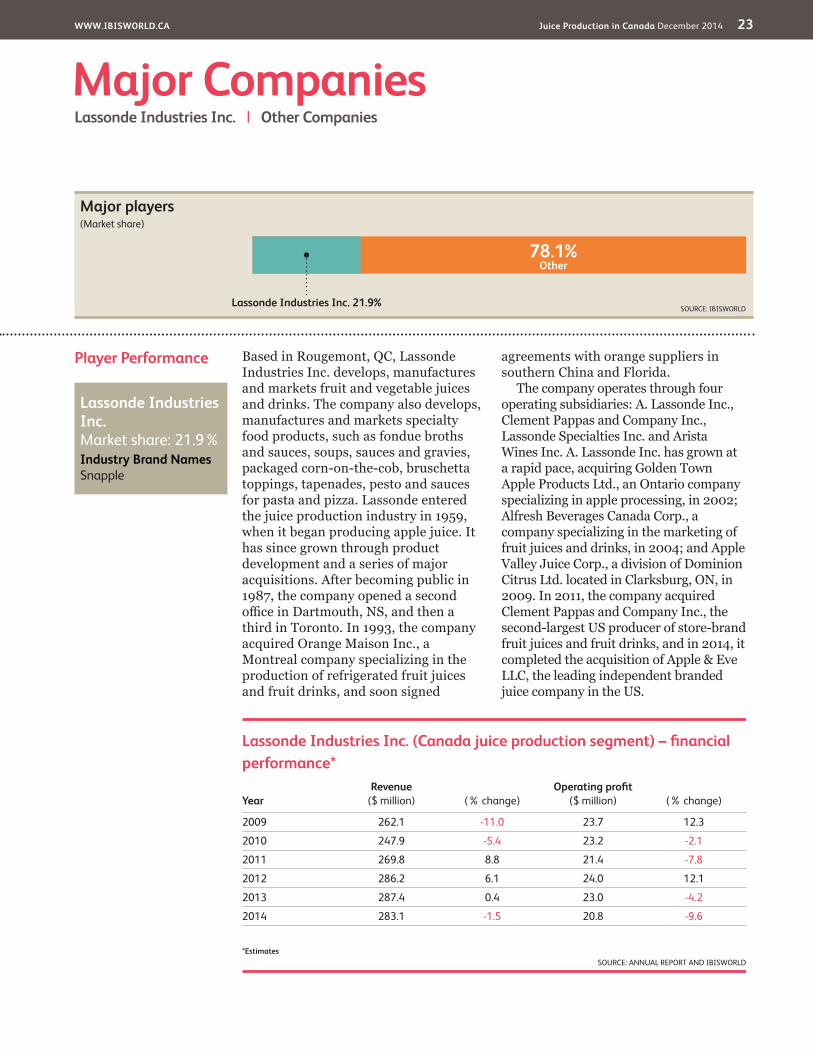
Player Performance Based in Rougemont, QC, Lassonde Industries Inc. develops, manufactures and markets fruit and vegetable juices and drinks. The company also develops, manufactures and markets specialty food products, such as fondue broths and sauces, soups, sauces and gravies, packaged corn-on-the-cob, bruschetta toppings, tapenades, pesto and sauces for pasta and pizza. Lassonde entered the juice production industry in 1959, when it began producing apple juice. It has since grown through product development and a series of major acquisitions. After becoming public in 1987, the company opened a second office in Dartmouth, NS, and then a third in Toronto. In 1993, the company acquired Orange Maison Inc., a Montreal company specializing in the production of refrigerated fruit juices and fruit drinks, and soon signed
agreements with orange suppliers in southern China and Florida.
The company operates through four operating subsidiaries: A. Lassonde Inc., Clement Pappas and Company Inc., Lassonde Specialties Inc. and Arista Wines Inc. A. Lassonde Inc. has grown at a rapid pace, acquiring Golden Town Apple Products Ltd., an Ontario company specializing in apple processing, in 2002; Alfresh Beverages Canada Corp., a company specializing in the marketing of fruit juices and drinks, in 2004; and Apple Valley Juice Corp., a division of Dominion Citrus Ltd. located in Clarksburg, ON, in 2009. In 2011, the company acquired Clement Pappas and Company Inc., the second-largest US producer of store-brand fruit juices and fruit drinks, and in 2014, it completed the acquisition of Apple & Eve LLC, the leading independent branded juice company in the US.
Major CompaniesLassonde Industries Inc. | Other Companies
78.1%Other
Lassonde Industries Inc. 21.9%SOURCE: IBISWORLD
Major players(Market share)
Lassonde Industries Inc. (Canada juice production segment) – fi nancial performance*
YearRevenue
($ million) (% change)Operating profi t
($ million) (% change)
2009 262.1 -11.0 23.7 12.3
2010 247.9 -5.4 23.2 -2.1
2011 269.8 8.8 21.4 -7.8
2012 286.2 6.1 24.0 12.1
2013 287.4 0.4 23.0 -4.2
2014 283.1 -1.5 20.8 -9.6
*EstimatesSOURCE: ANNUAL REPORT AND IBISWORLD
Lassonde Industries Inc. Market share: 21.9% Industry Brand Names Snapple
WWW.IBISWORLD.CA Juice Production in Canada December 2014 24
Major Companies
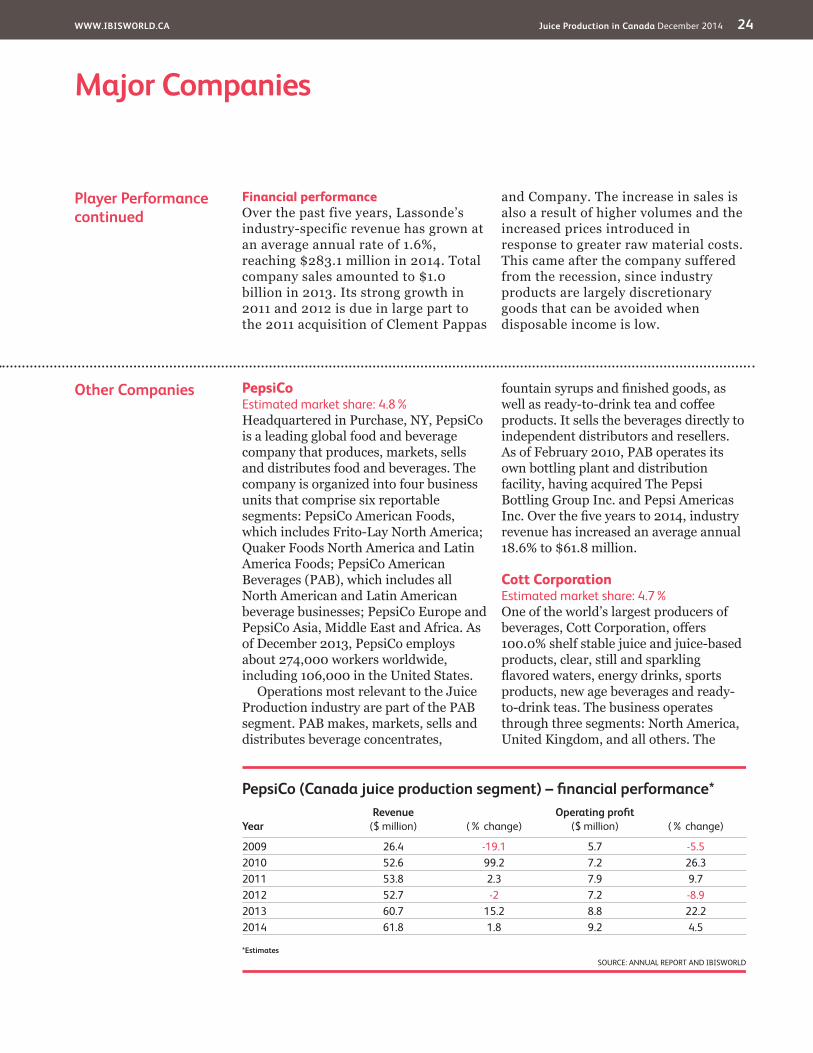
Other Companies PepsiCo Estimated market share: 4.8%Headquartered in Purchase, NY, PepsiCo is a leading global food and beverage company that produces, markets, sells and distributes food and beverages. The company is organized into four business units that comprise six reportable segments: PepsiCo American Foods, which includes Frito-Lay North America; Quaker Foods North America and Latin America Foods; PepsiCo American Beverages (PAB), which includes all North American and Latin American beverage businesses; PepsiCo Europe and PepsiCo Asia, Middle East and Africa. As of December 2013, PepsiCo employs about 274,000 workers worldwide, including 106,000 in the United States.
Operations most relevant to the Juice Production industry are part of the PAB segment. PAB makes, markets, sells and distributes beverage concentrates,
fountain syrups and finished goods, as well as ready-to-drink tea and coffee products. It sells the beverages directly to independent distributors and resellers. As of February 2010, PAB operates its own bottling plant and distribution facility, having acquired The Pepsi Bottling Group Inc. and Pepsi Americas Inc. Over the five years to 2014, industry revenue has increased an average annual 18.6% to $61.8 million.
Cott Corporation Estimated market share: 4.7%One of the world’s largest producers of beverages, Cott Corporation, offers 100.0% shelf stable juice and juice-based products, clear, still and sparkling flavored waters, energy drinks, sports products, new age beverages and ready-to-drink teas. The business operates through three segments: North America, United Kingdom, and all others. The
Player Performancecontinued
Financial performanceOver the past five years, Lassonde’s industry-specific revenue has grown at an average annual rate of 1.6%, reaching $283.1 million in 2014. Total company sales amounted to $1.0 billion in 2013. Its strong growth in 2011 and 2012 is due in large part to the 2011 acquisition of Clement Pappas
and Company. The increase in sales is also a result of higher volumes and the increased prices introduced in response to greater raw material costs. This came after the company suffered from the recession, since industry products are largely discretionary goods that can be avoided when disposable income is low.
PepsiCo (Canada juice production segment) – fi nancial performance*
YearRevenue
($ million) (% change)Operating profi t
($ million) (% change)
2009 26.4 -19.1 5.7 -5.52010 52.6 99.2 7.2 26.32011 53.8 2.3 7.9 9.72012 52.7 -2 7.2 -8.92013 60.7 15.2 8.8 22.22014 61.8 1.8 9.2 4.5
*EstimatesSOURCE: ANNUAL REPORT AND IBISWORLD
WWW.IBISWORLD.CA Juice Production in Canada December 2014 25
Major Companies
Other Companiescontinued
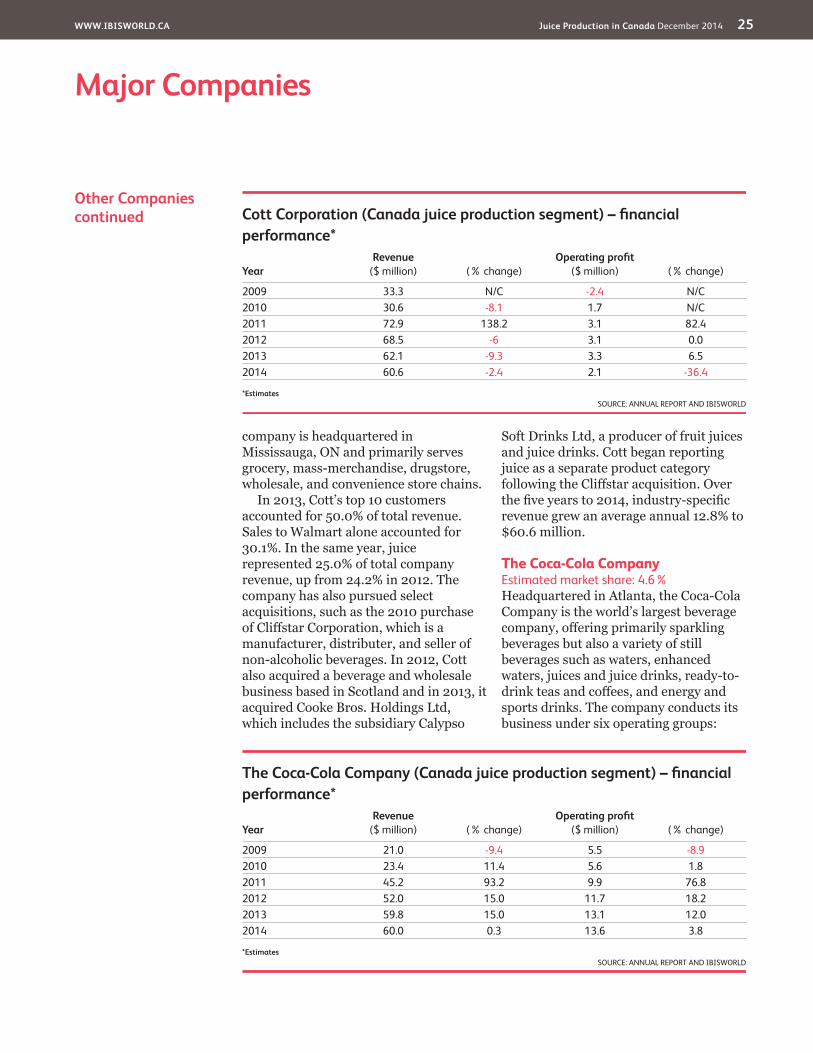
company is headquartered in Mississauga, ON and primarily serves grocery, mass-merchandise, drugstore, wholesale, and convenience store chains.
In 2013, Cott’s top 10 customers accounted for 50.0% of total revenue. Sales to Walmart alone accounted for 30.1%. In the same year, juice represented 25.0% of total company revenue, up from 24.2% in 2012. The company has also pursued select acquisitions, such as the 2010 purchase of Cliffstar Corporation, which is a manufacturer, distributer, and seller of non-alcoholic beverages. In 2012, Cott also acquired a beverage and wholesale business based in Scotland and in 2013, it acquired Cooke Bros. Holdings Ltd, which includes the subsidiary Calypso
Soft Drinks Ltd, a producer of fruit juices and juice drinks. Cott began reporting juice as a separate product category following the Cliffstar acquisition. Over the five years to 2014, industry-specific revenue grew an average annual 12.8% to $60.6 million.
The Coca-Cola Company Estimated market share: 4.6%Headquartered in Atlanta, the Coca-Cola Company is the world’s largest beverage company, offering primarily sparkling beverages but also a variety of still beverages such as waters, enhanced waters, juices and juice drinks, ready-to-drink teas and coffees, and energy and sports drinks. The company conducts its business under six operating groups:
The Coca-Cola Company (Canada juice production segment) – fi nancial performance*
YearRevenue
($ million) (% change)Operating profi t
($ million) (% change)
2009 21.0 -9.4 5.5 -8.92010 23.4 11.4 5.6 1.82011 45.2 93.2 9.9 76.82012 52.0 15.0 11.7 18.22013 59.8 15.0 13.1 12.02014 60.0 0.3 13.6 3.8
*EstimatesSOURCE: ANNUAL REPORT AND IBISWORLD
Cott Corporation (Canada juice production segment) – fi nancial performance*
YearRevenue
($ million) (% change)Operating profi t
($ million) (% change)
2009 33.3 N/C -2.4 N/C2010 30.6 -8.1 1.7 N/C2011 72.9 138.2 3.1 82.42012 68.5 -6 3.1 0.02013 62.1 -9.3 3.3 6.52014 60.6 -2.4 2.1 -36.4
*EstimatesSOURCE: ANNUAL REPORT AND IBISWORLD
WWW.IBISWORLD.CA Juice Production in Canada December 2014 26
Major Companies
Other Companiescontinued
Eurasia and Africa, Europe, Latin America, North America, Pacific and bottling investments. An additional operating segment is corporate.
Coca-Cola Refreshments Canada (CCRC) is the only Canadian bottler responsible for manufacturing and distributing Coca-Cola brands in Canada. Coca-Cola Ltd. markets several of Canada’s top non-alcoholic beverage brands including Coca-Cola, Diet Coke and Sprite. Additionally, it is the world’s largest juice and juice drink company with brands such as Minute Maid, Five Alive, FUZE and Fruitopia. Collectively, CCRC and
Coca-Cola Ltd. employ about 6,300 workers in Canada.
Over the past five years, the company has had an aggressive acquisition strategy. In 2010, it purchased Coca-Cola Enterprises Inc. (CCE), one of its major bottlers operating in the United States, Canada, the British Virgin Islands, the US Virgin Islands and the Cayman Islands. The company also reached an agreement with Dr. Pepper Snapple Group (DPSG) Inc. to distribute certain DPSG brands in particular territories. Over the five years to 2014, industry-specific revenue is expected to increase an average annual 23.3% to $60.0 million.
WWW.IBISWORLD.CA Juice Production in Canada December 2014 27
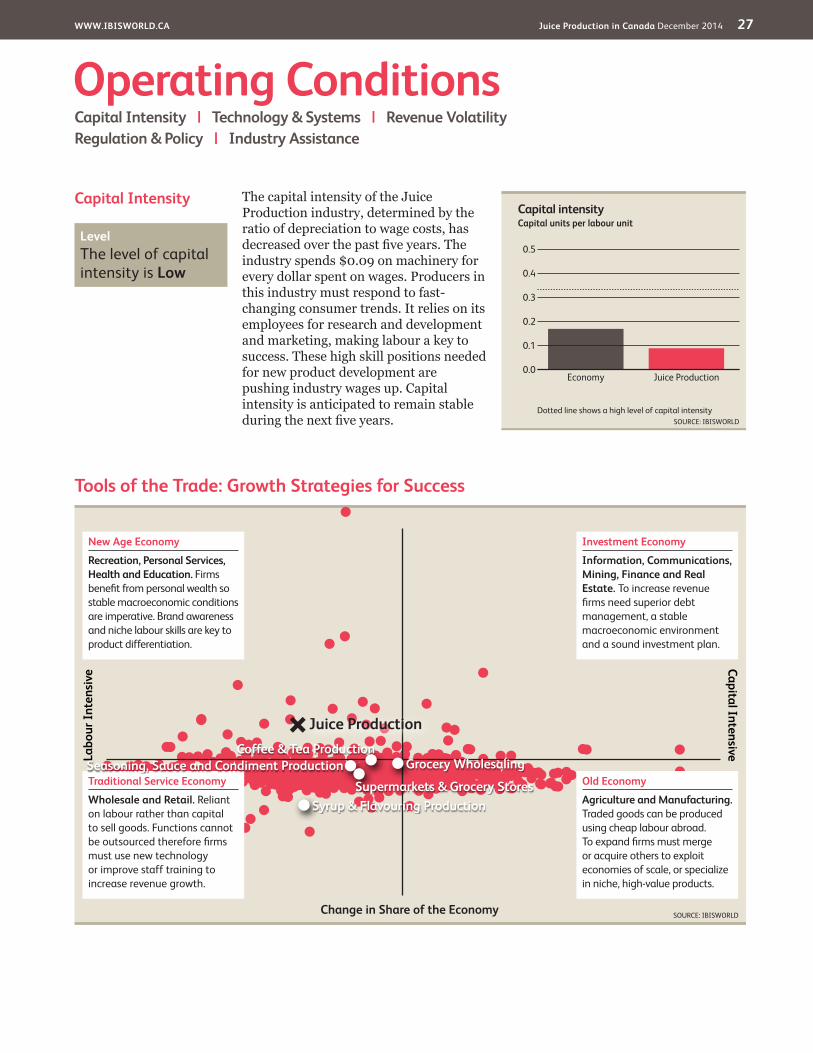
Capital Intensity The capital intensity of the Juice Production industry, determined by the ratio of depreciation to wage costs, has decreased over the past five years. The industry spends $0.09 on machinery for every dollar spent on wages. Producers in this industry must respond to fast-changing consumer trends. It relies on its employees for research and development and marketing, making labour a key to success. These high skill positions needed for new product development are pushing industry wages up. Capital intensity is anticipated to remain stable during the next five years.
Operating ConditionsCapital Intensity | Technology & Systems | Revenue VolatilityRegulation & Policy | Industry Assistance
Tools of the Trade: Growth Strategies for Success
SOURCE: IBISWORLD
Labo
ur In
tens
ive Capital Intensive
Change in Share of the Economy
New Age Economy
Recreation, Personal Services, Health and Education. Firms benefi t from personal wealth so stable macroeconomic conditions are imperative. Brand awareness and niche labour skills are key to product differentiation.
Traditional Service Economy
Wholesale and Retail. Reliant on labour rather than capital to sell goods. Functions cannot be outsourced therefore fi rms must use new technology or improve staff training to increase revenue growth.
Old Economy
Agriculture and Manufacturing. Traded goods can be produced using cheap labour abroad. To expand fi rms must merge or acquire others to exploit economies of scale, or specialize in niche, high-value products.
Investment Economy
Information, Communications, Mining, Finance and Real Estate. To increase revenue fi rms need superior debt management, a stable macroeconomic environment and a sound investment plan.
Coffee & Tea ProductionGrocery Wholesaling
Syrup & Flavouring Production
Seasoning, Sauce and Condiment ProductionSupermarkets & Grocery Stores
Juice Production
Capital intensity
0.5
0.0
0.1
0.2
0.3
0.4
SOURCE: IBISWORLDDotted line shows a high level of capital intensity
Capital units per labour unit
Juice ProductionEconomy
Level The level of capital intensity is Low
WWW.IBISWORLD.CA Juice Production in Canada December 2014 28
Operating Conditions
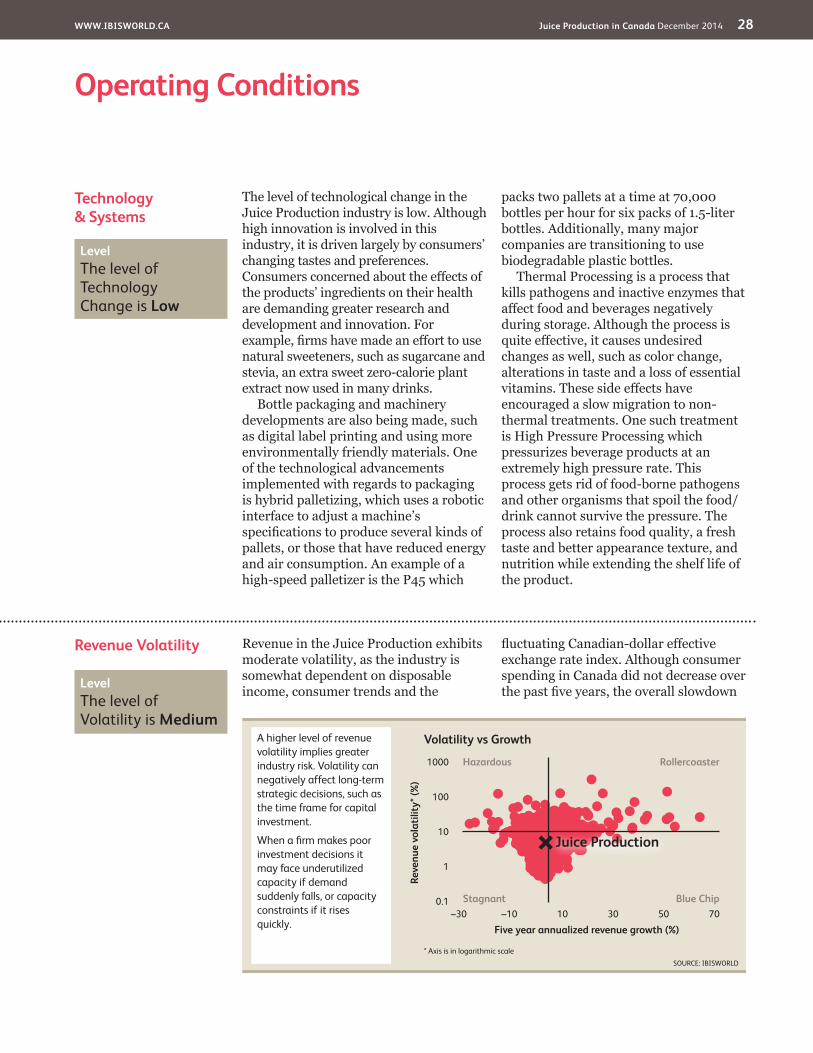
Revenue Volatility Revenue in the Juice Production exhibits moderate volatility, as the industry is somewhat dependent on disposable income, consumer trends and the
fluctuating Canadian-dollar effective exchange rate index. Although consumer spending in Canada did not decrease over the past five years, the overall slowdown
Technology& Systems
The level of technological change in the Juice Production industry is low. Although high innovation is involved in this industry, it is driven largely by consumers’ changing tastes and preferences. Consumers concerned about the effects of the products’ ingredients on their health are demanding greater research and development and innovation. For example, firms have made an effort to use natural sweeteners, such as sugarcane and stevia, an extra sweet zero-calorie plant extract now used in many drinks.
Bottle packaging and machinery developments are also being made, such as digital label printing and using more environmentally friendly materials. One of the technological advancements implemented with regards to packaging is hybrid palletizing, which uses a robotic interface to adjust a machine’s specifications to produce several kinds of pallets, or those that have reduced energy and air consumption. An example of a high-speed palletizer is the P45 which
packs two pallets at a time at 70,000 bottles per hour for six packs of 1.5-liter bottles. Additionally, many major companies are transitioning to use biodegradable plastic bottles.
Thermal Processing is a process that kills pathogens and inactive enzymes that affect food and beverages negatively during storage. Although the process is quite effective, it causes undesired changes as well, such as color change, alterations in taste and a loss of essential vitamins. These side effects have encouraged a slow migration to non-thermal treatments. One such treatment is High Pressure Processing which pressurizes beverage products at an extremely high pressure rate. This process gets rid of food-borne pathogens and other organisms that spoil the food/drink cannot survive the pressure. The process also retains food quality, a fresh taste and better appearance texture, and nutrition while extending the shelf life of the product.
Level The level of Technology Change is Low
SOURCE: IBISWORLD
Volatility vs Growth
Reve
nue
vola
tility
* (%
)
1000
100
10
1
0.1
Five year annualized revenue growth (%)–30 –10 10 30 50 70
Hazardous
Stagnant
Rollercoaster
Blue Chip
* Axis is in logarithmic scale
Juice Production
A higher level of revenue volatility implies greater industry risk. Volatility can negatively affect long-term strategic decisions, such as the time frame for capital investment.
When a fi rm makes poor investment decisions it may face underutilized capacity if demand suddenly falls, or capacity constraints if it rises quickly.
Level The level of Volatility is Medium
WWW.IBISWORLD.CA Juice Production in Canada December 2014 29
Operating Conditions
Regulation & Policy Health Canada is the Federal department responsible for helping Canadians maintain their health. The Canadian Food Inspection Agency is responsible for assuring food safety. Juice producers also self-regulate through the Canadian Beverage Association (CBA), an industry association that develops guidelines and initiatives to ensure the responsible production and marketing of industry products.
The Canadian Medical Association has recently called for a “ban on the sale of energy drinks to Canadians younger than the legal drinking age.” As provincial governments slowly implement this ban, the energy drink segment is expected to decline in the future.
Sale of Beverages in Schools In 2009, CBA completed an initiative to increase parental control over their children’s consumption patterns, removing full-calorie soft drinks from schools across the country. The program removed all soft drinks and provided water and 100% juice in elementary and middle schools while removing full-calorie soft drinks from secondary schools and capping caloric content and portion sizes. Energy drinks are not and were never sold in the schools.
Clear on CaloriesAnother CBA program is the Clear on Calories initiative, launched in 2011, that helps consumers understand the caloric
content and serving size of beverages. Labels are to be easier to read, with calories on the front of the package rather than on the back. Vending machines must display calorie counts per container on selection buttons (or in close proximity) and fountain beverage dispensers must display calorie count using a 500 ml serving size for sports drinks and 250 ml serving size for juices and fruit drinks. Association members have also committed to reducing calories in the marketplace through the production of new beverages, smaller portions and stronger marketing for low-calorie beverages.
Product labelsIn order to increase awareness of caloric intake, most single serve beverage containers will display calorie content on the front of all containers. Multi-serve packaging for juice and fruit drinks, larger than 591 ml, must be labelled per 250 ml serving size. Sports drinks greater than 750 ml are considered multi-serve and must be labelled per 500 ml serving size.
Children’s Advertising InitiativeThe Children’s Advertising Initiative is administered by Advertising Standards Canada, the industry’s independent self-regulatory body. Global marketing standards accepted by CBA members prevent marketing of beverages other than fruit juice, milk and water, in paid
Revenue Volatilitycontinued
in global spending and a small decrease in disposable income caused some fluctuations. As income and preferences fluctuated in countries that import industry beverages, exports have vacillated as well.
Additionally, an aggressive marketing campaign that presented the industry drinks as healthy increased overall industry demand. A different health
trend focused on the sugar concentration in fruit juices caused that segment to decrease and increased the popularity of ready-to-drink tea. As the industry offers many different products, a loss in one segment can be offset by a gain in another. The industry as a whole, however, is largely affected by popularity trends and marketing tactics that drastically change from year to year.
Level & Trend The level of Regulation is Medium and the trend is Increasing
WWW.IBISWORLD.CA Juice Production in Canada December 2014 30
Operating Conditions
Industry Assistance The Canadian Beverage Association is the national industry association representing more than 60 brands that manufacture and distribute the majority of non-alcoholic refreshment
beverages consumed in Canada. The association develops guidelines and initiatives focused on the environment, regulatory and health affairs as well as public affairs.
Regulation & Policycontinued
programming targeted to children under the age of 12. Producers will devote 100% of advertising directed to children under the age of 12 to promote healthy dietary
choices. Members have also committed not to advertise food or beverage products in elementary schools – pre-kindergarten through Grade 6.
Level & Trend The level of Industry Assistance is Low and the trend is Steady
WWW.IBISWORLD.CA Juice Production in Canada December 2014 31
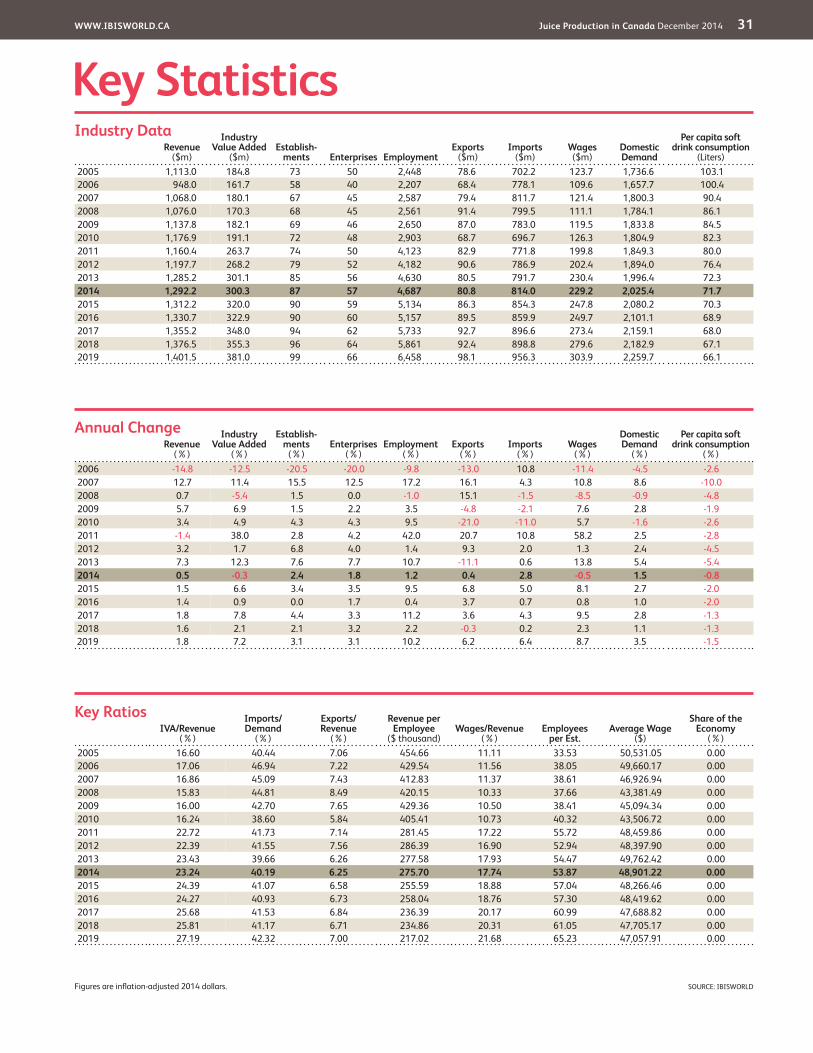
Key StatisticsRevenue
($m)
Industry Value Added
($m)Establish-
ments Enterprises EmploymentExports
($m)Imports
($m)Wages ($m)
Domestic Demand
Per capita soft drink consumption
(Liters)2005 1,113.0 184.8 73 50 2,448 78.6 702.2 123.7 1,736.6 103.12006 948.0 161.7 58 40 2,207 68.4 778.1 109.6 1,657.7 100.42007 1,068.0 180.1 67 45 2,587 79.4 811.7 121.4 1,800.3 90.42008 1,076.0 170.3 68 45 2,561 91.4 799.5 111.1 1,784.1 86.12009 1,137.8 182.1 69 46 2,650 87.0 783.0 119.5 1,833.8 84.52010 1,176.9 191.1 72 48 2,903 68.7 696.7 126.3 1,804.9 82.32011 1,160.4 263.7 74 50 4,123 82.9 771.8 199.8 1,849.3 80.02012 1,197.7 268.2 79 52 4,182 90.6 786.9 202.4 1,894.0 76.42013 1,285.2 301.1 85 56 4,630 80.5 791.7 230.4 1,996.4 72.32014 1,292.2 300.3 87 57 4,687 80.8 814.0 229.2 2,025.4 71.72015 1,312.2 320.0 90 59 5,134 86.3 854.3 247.8 2,080.2 70.32016 1,330.7 322.9 90 60 5,157 89.5 859.9 249.7 2,101.1 68.92017 1,355.2 348.0 94 62 5,733 92.7 896.6 273.4 2,159.1 68.02018 1,376.5 355.3 96 64 5,861 92.4 898.8 279.6 2,182.9 67.12019 1,401.5 381.0 99 66 6,458 98.1 956.3 303.9 2,259.7 66.1
IVA/Revenue (%)
Imports/ Demand
(%)
Exports/ Revenue
(%)
Revenue per Employee
($ thousand)Wages/Revenue
(%)Employees
per Est.Average Wage
($)
Share of the Economy
(%)2005 16.60 40.44 7.06 454.66 11.11 33.53 50,531.05 0.002006 17.06 46.94 7.22 429.54 11.56 38.05 49,660.17 0.002007 16.86 45.09 7.43 412.83 11.37 38.61 46,926.94 0.002008 15.83 44.81 8.49 420.15 10.33 37.66 43,381.49 0.002009 16.00 42.70 7.65 429.36 10.50 38.41 45,094.34 0.002010 16.24 38.60 5.84 405.41 10.73 40.32 43,506.72 0.002011 22.72 41.73 7.14 281.45 17.22 55.72 48,459.86 0.002012 22.39 41.55 7.56 286.39 16.90 52.94 48,397.90 0.002013 23.43 39.66 6.26 277.58 17.93 54.47 49,762.42 0.002014 23.24 40.19 6.25 275.70 17.74 53.87 48,901.22 0.002015 24.39 41.07 6.58 255.59 18.88 57.04 48,266.46 0.002016 24.27 40.93 6.73 258.04 18.76 57.30 48,419.62 0.002017 25.68 41.53 6.84 236.39 20.17 60.99 47,688.82 0.002018 25.81 41.17 6.71 234.86 20.31 61.05 47,705.17 0.002019 27.19 42.32 7.00 217.02 21.68 65.23 47,057.91 0.00
Figures are inflation-adjusted 2014 dollars.
Revenue (%)
Industry Value Added
(%)
Establish-ments
(%)Enterprises
(%)Employment
(%)Exports
(%)Imports
(%)Wages
(%)
Domestic Demand
(%)
Per capita soft drink consumption
(%)2006 -14.8 -12.5 -20.5 -20.0 -9.8 -13.0 10.8 -11.4 -4.5 -2.62007 12.7 11.4 15.5 12.5 17.2 16.1 4.3 10.8 8.6 -10.02008 0.7 -5.4 1.5 0.0 -1.0 15.1 -1.5 -8.5 -0.9 -4.82009 5.7 6.9 1.5 2.2 3.5 -4.8 -2.1 7.6 2.8 -1.92010 3.4 4.9 4.3 4.3 9.5 -21.0 -11.0 5.7 -1.6 -2.62011 -1.4 38.0 2.8 4.2 42.0 20.7 10.8 58.2 2.5 -2.82012 3.2 1.7 6.8 4.0 1.4 9.3 2.0 1.3 2.4 -4.52013 7.3 12.3 7.6 7.7 10.7 -11.1 0.6 13.8 5.4 -5.42014 0.5 -0.3 2.4 1.8 1.2 0.4 2.8 -0.5 1.5 -0.82015 1.5 6.6 3.4 3.5 9.5 6.8 5.0 8.1 2.7 -2.02016 1.4 0.9 0.0 1.7 0.4 3.7 0.7 0.8 1.0 -2.02017 1.8 7.8 4.4 3.3 11.2 3.6 4.3 9.5 2.8 -1.32018 1.6 2.1 2.1 3.2 2.2 -0.3 0.2 2.3 1.1 -1.3
2019 1.8 7.2 3.1 3.1 10.2 6.2 6.4 8.7 3.5 -1.5
Annual Change
Key Ratios
Industry Data
SOURCE: IBISWORLD
WWW.IBISWORLD.CA Juice Production in Canada December 2014 32
Jargon & Glossary
BARRIERS TO ENTRY High barriers to entry mean that new companies struggle to enter an industry, while low barriers mean it is easy for new companies to enter an industry.
CAPITAL INTENSITY Compares the amount of money spent on capital (plant, machinery and equipment) with that spent on labour. IBISWorld uses the ratio of depreciation to wages as a proxy for capital intensity. High capital intensity is more than $0.333 of capital to $1 of labour; medium is $0.125 to $0.333 of capital to $1 of labour; low is less than $0.125 of capital for every $1 of labour.
CONSTANT PRICES The dollar figures in the Key Statistics table, including forecasts, are adjusted for inflation using the current year (i.e. year published) as the base year. This removes the impact of changes in the purchasing power of the dollar, leaving only the “real” growth or decline in industry metrics. The inflation adjustments in IBISWorld’s reports are made using Statistics Canada’s implicit GDP price deflator.
DOMESTIC DEMAND Spending on industry goods and services within Canada, regardless of their country of origin. It is derived by adding imports to industry revenue, and then subtracting exports.
EMPLOYMENT The number of permanent, part-time, temporary and casual employees, working proprietors, partners, managers and executives within the industry.
ENTERPRISE A division that is separately managed and keeps management accounts. Each enterprise consists of one or more establishments that are under common ownership or control.
ESTABLISHMENT The smallest type of accounting unit within an enterprise, an establishment is a single physical location where business is conducted or where services or industrial operations are performed. Multiple establishments under common control make up an enterprise.
EXPORTS Total value of industry goods and services sold by Canadian companies to customers abroad.
IMPORTS Total value of industry goods and services brought in from foreign countries to be sold in Canada.
INDUSTRY CONCENTRATION An indicator of the dominance of the top four players in an industry. Concentration is considered high if the top players account for more than 70% of industry revenue. Medium is 40% to 70% of industry revenue. Low is less than 40%.
INDUSTRY REVENUE The total sales of industry goods and services (exclusive of excise and sales tax); subsidies on production; all other operating income from outside the firm (such as commission income, repair and service income, and rent, leasing and hiring income); and capital work done by rental or lease. Receipts from interest royalties, dividends and the sale of fixed tangible assets are excluded.
INDUSTRY VALUE ADDED The market value of goods and services produced by the industry minus the cost of goods and services used in production. IVA is also described as the industry’s contribution to GDP, or profit plus wages and depreciation.
INTERNATIONAL TRADE The level of international trade is determined by ratios of exports to revenue and imports to domestic demand. For exports/revenue: low is less than 5%; medium is 5% to 20%; and high is more than 20%. Imports/domestic demand: low is less than 5%; medium is 5% to 35%; and high is more than 35%.
LIFE CYCLE All industries go through periods of growth, maturity and decline. IBISWorld determines an industry’s life cycle by considering its growth rate (measured by IVA) compared with GDP; the growth rate of the number of establishments; the amount of change the industry’s products are undergoing; the rate of technological change; and the level of customer acceptance of industry products and services.
NONEMPLOYING ESTABLISHMENT Businesses with no paid employment or payroll, also known as nonemployers. These are mostly set up by self-employed individuals.
Industry Jargon
IBISWorld Glossary
100 PER CENT PURE OR 100 PER CENT JUICE Juice that is directly squeezed from a fruit or vegetable, but may contain water, vitamins and minerals.
ENERGY DRINKS Functional beverages intended to supply mental and physical stimulation for a short period of time. Regulated as food products, these contain caffeine, amino acids, vitamins and/or carbohydrates.
FRUIT FLAVOURED JUICE DRINK A drink that contains less than 100 per cent juice and may contain sweeteners and water. These beverages must have the total percentage of juice content listed on the label.
FUNCTIONAL DRINK A beverage that performs a function, including sports drinks that enhance athletic performance and energy drinks that increase alertness.
PASTEURIZED JUICE Juice that has been heated before packaging to increase shelf life while ensuring safety and minimizing nutrient loss.
READY-TO-DRINK (RTD) A beverage produced and packaged for immediate consumption.
SPORT DRINKS Functional beverage products that often contain carbohydrates and electrolytes to help physically active people hydrate before, during and after exercise.

WWW.IBISWORLD.CA Juice Production in Canada December 2014 33
Jargon & Glossary
PROFIT IBISWorld uses earnings before interest and tax (EBIT) as an indicator of a company’s profitability. It is calculated as revenue minus expenses, excluding interest and tax.
VOLATILITY The level of volatility is determined by averaging the absolute change in revenue in each of the past five years. Volatility levels: very high is more than ±20%; high volatility is ±10% to ±20%; moderate volatility is ±3% to ±10%; and low volatility is less than ±3%.
WAGES The gross total wages and salaries of all employees in the industry. Benefits and on-costs are included in this figure.
IBISWorld Glossary continued

Disclaimer
This product has been supplied by IBISWorld Inc. (‘IBISWorld’) solely for use by its authorized licensees strictly in accordance with their license agreements with IBISWorld. IBISWorld makes no representation to any other person with regard to the completeness or accuracy of the data or information contained herein, and it accepts no responsibility and disclaims all liability (save for liability which cannot be lawfully disclaimed) for loss or damage whatsoever suffered or incurred by any other person resulting from
the use of, or reliance upon, the data or information contained herein. Copyright in this publication is owned by IBISWorld Inc. The publication is sold on the basis that the purchaser agrees not to copy the material contained within it for other than the purchasers own purposes. In the event that the purchaser uses or quotes from the material in this publication – in papers, reports, or opinions prepared for any other person – it is agreed that it will be sourced to: IBISWorld Inc.
At IBISWorld we know that industry intelligence is more than assembling factsIt is combining data with analysis to answer the questions that successful businesses askIdentify high growth, emerging & shrinking marketsArm yourself with the latest industry intelligenceAssess competitive threats from existing & new entrantsBenchmark your performance against the competitionMake speedy market-ready, profit-maximizing decisions
Who is IBISWorld?We are strategists, analysts, researchers, and marketers. We provide answers to information-hungry, time-poor businesses. Our goal is to provide real world answers that matter to your business in our 400 Canadian industry reports. When tough strategy, budget, sales and marketing decisions need to be made, our suite of industry and Risk intelligence products give you deeply-researched answers quickly.
IBISWorld MembershipIBISWorld offers tailored membership packages to meet your needs.
Copyright 2014 IBISWorld
www.ibisworld.ca | 1-800-330-3772 | [email protected]