Embed Size (px)
Citation preview

IAT 355 Visual Analytics
Visual Encoding and Image Models Lyn Bartram

Image models
• Representation • The visual, aural or haptic (ie sensory) encoding of the data • This is often termed mapping
• Presentation • Selection, layout and organisation of encoded data • May involve multiple representations
• Interaction • Manipulation to acquire different views of the data
Visual Encoding | IAT 355 2

Representation
Visual Encoding | IAT 355
• What’s a common way of visually representing multivariate data sets?
• Graphs! (not the vertex-edge ones)
• More accurately, symbolic display
3

Types of Symbolic Displays (Kosslyn 89)
• Graphs
• Charts
• Maps
• Diagrams
Type name hereType title here
Type name hereType title here
Type name hereType title here
Type name hereType title here
Slide aapted from Marti Hearst Visual Encoding | IAT 355 4

Types of Symbolic Displays
• Graphs • at least two scales required • values associated by a symmetric “paired with” relation
• Examples: scatter-plot, bar-chart, layer-graph
Slide aapted from Marti Hearst Visual Encoding | IAT 355 5

Types of Symbolic Displays
• Charts • discrete relations among discrete
entities • structure relates entities to one
another • lines and relative position serve as
links
• Examples: • Family tree • Flow chart • Network diagram
Slide aapted from Marti Hearst Visual Encoding | IAT 355 6

Types of Symbolic Displays
• Maps • Internal relations determined (in part) by the spatial relations of
what is pictured • Labels paired with locations
• Examples: • Map of census data • Topographic maps
Visual Encoding | IAT 355 7

Visual Encoding | IAT 355 8
Map
• Internal relations determined (in part) by the spatial relations of what is pictured • Grid: geometric metadata
• Locations identified by labels • Nominal metadata • Examples: • Map of census data • Topographic maps

Types of Symbolic Displays
• Diagrams • Schematic pictures of objects or
entities • Parts are symbolic (unlike
photographs) • how-to illustrations • figures in a manual
From Glietman, Henry. Psychology. W.W. Norton and Company, Inc. New York, 1995
Visual Encoding | IAT 355 9

What is the “real” taxonomy for visual representations?
• An empirical investigation by Lohse et al.’94 • (Only used static, 2D graphics) • 16 participants
• Half had a graphic design background • First, looked at 60 images and scored them along 10 scales.
• These were used to compute statistical similarity
• Then, organized the 60 images into categories according to similarity.
• Were asked to name the groups • Then they grouped these into higher-level groups, repeatedly, until they
were in one large group.
Lohse, G L; Biolsi, K; Walker, N and H H Rueter, A Classification of Visual Representations, CACM, Vol. 37, No. 12, pp 36-49, 1994
Visual Encoding | IAT 355 10

Scales that Participants Used (and percentage of variance explained)
16.0 emphasizes whole – parts 11.3 spatial – nonspatial 10.6 static structure – dynamic structure 10.5 continuous – discrete 10.3 attractive – unattractive 10.1 nontemporal – temporal 9.9 concrete – abstract 9.6 hard to understand – easy 9.5 nonnumeric – numeric 2.2 conveys a lot of info – conveys little
Visual Encoding | IAT 355 11
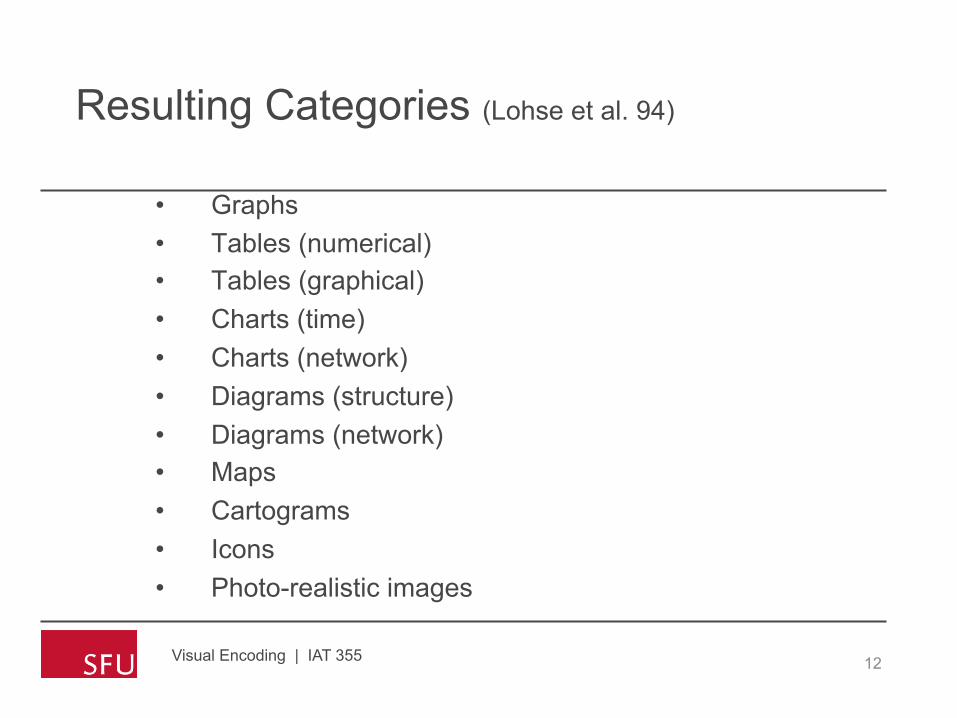
Resulting Categories (Lohse et al. 94)
• Graphs • Tables (numerical) • Tables (graphical) • Charts (time) • Charts (network) • Diagrams (structure) • Diagrams (network) • Maps • Cartograms • Icons • Photo-realistic images
Visual Encoding | IAT 355 12
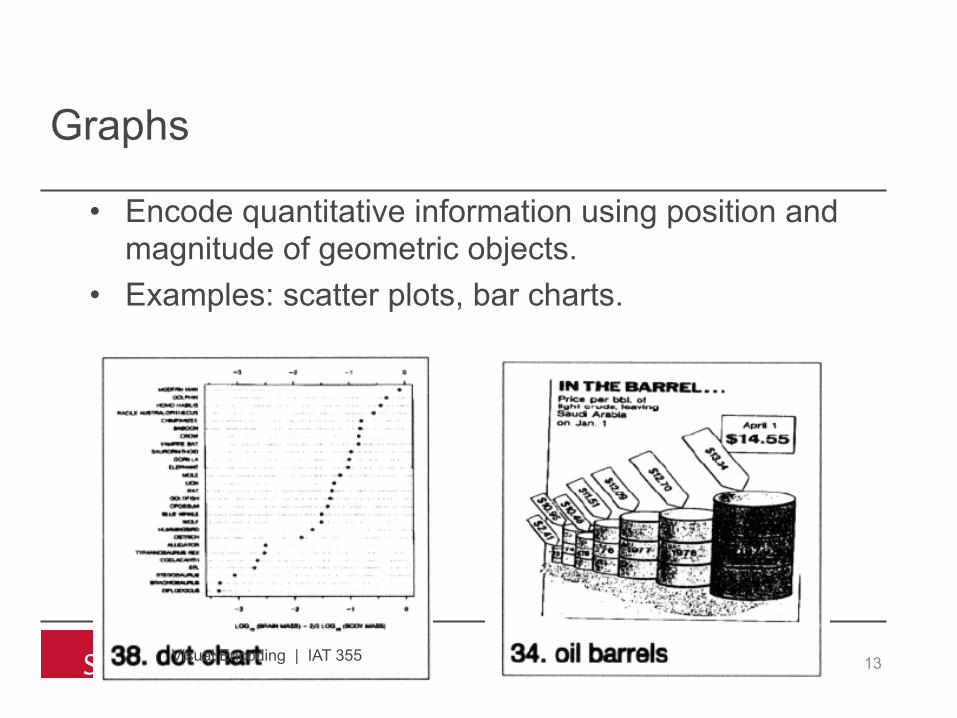
Graphs
• Encode quantitative information using position and magnitude of geometric objects.
• Examples: scatter plots, bar charts.
Visual Encoding | IAT 355 13

Tables
• An arrangement of words, numbers, signs, or combinations of them to exhibit a set of facts or relationships in a compact fashion.
• Less abstract symbolic notation than graphs. • Graphical tables and numerical tables
Visual Encoding | IAT 355 14

Time Charts
• Display temporal data. • Gantt chart, time schedule.
Visual Encoding | IAT 355 15

Network Charts
• Show the relationships among components • Symbols indicate the presence or absence of
components. • Correspondences are shown by lines, arrows,
proximity, similarity, or containment. • Flow charts, org charts, pert charts, decision trees.
Visual Encoding | IAT 355 16

Structure Diagrams
• A static description of a physical object. • Spatial layout expresses true coordinate dimensions
of the object. • Cross-sections
Visual Encoding | IAT 355 17

Process Diagrams
• Describe interrelationships and processes associated with physical objects.
• Spatial layout expresses dynamic, continuous, or temporal relationships among the objects. • Lifecycle
Visual Encoding | IAT 355 18

Maps
• Symbolic representations of physical geography. • Marine charts, topo maps, projections of world maps.
• Differ from cartograms in that cartograms super-impose quantitative data over a base map.
Visual Encoding | IAT 355 19

Cartograms
• Spatial maps that show quantitative data. • Show more quantitative information than structure
diagrams. • Chloropleths, dot maps, flow maps.
Visual Encoding | IAT 355 20

Icons
• Impart a single interpretation or meaning for a picture; a unique label for a visual representation.
Visual Encoding | IAT 355 21

Put into Multiple Categories
• No real agreement on these.
Visual Encoding | IAT 355 22

Where should these go?
Visual Encoding | IAT 355 23

• How do you decide what kind of chart is best for what kind of data?
• Image models and visual language • Semiology [Bertin] : an image is perceived as a set of
signs and “retinal variables”
Visual Encoding | IAT 355 24

Visual encoding variables
• Position (x 2) • Size • Value • Texture • Color • Orientation • Shape
Visual Encoding | IAT 355 25

Visual encoding variables
• Position • Length • Area • Volume • Value • Texture • Color • Orientation • Shape • Transparency • Blur / Focus ….…
Visual Encoding | IAT 355 26
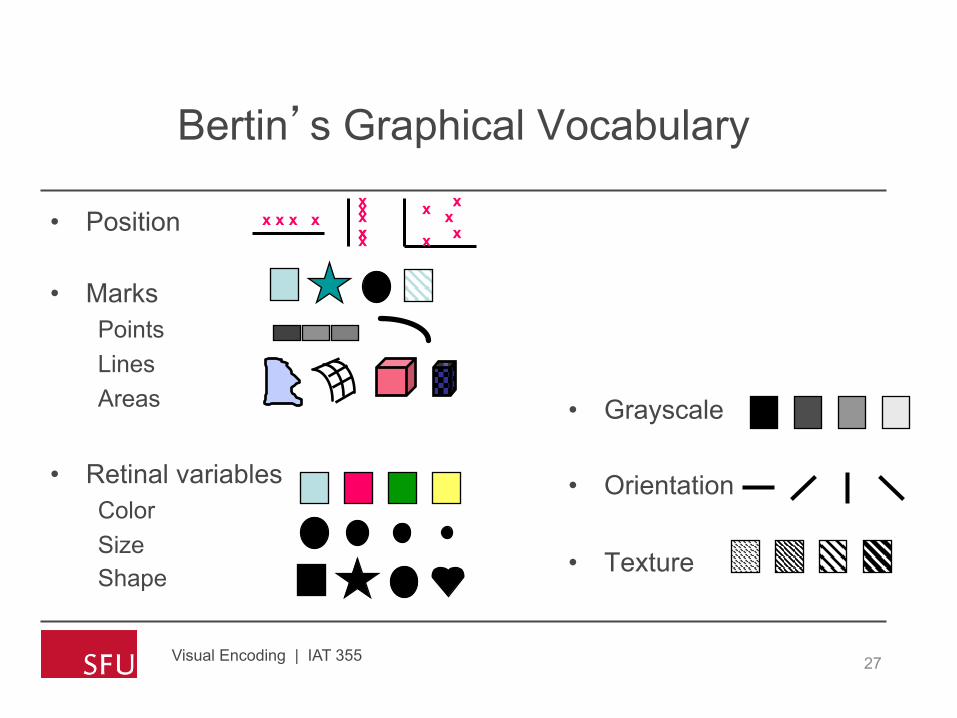
Bertin’s Graphical Vocabulary
• Position
• Marks Points Lines Areas
• Retinal variables Color Size Shape
Visual Encoding | IAT 355
• Grayscale
• Orientation
• Texture
x x x x x x x x x x
x x x x x
27

Key visual encoding tasks/characteristics
1. Selection/Discrimination: • Is A different from B?
2. Association: • Are A and B similar (related in some way)?
3. Order • Is A > B?
4. Quantification: a number can be deduced from differences • How much bigger is A than B?
Visual Encoding | IAT 355 28

Visual characteristics
5. Capacity (length) [Carpendale] • The number of distinctions possible using the variable • How many different things can we represent with this variable?
Visual Encoding | IAT 355 29

Figure 3.41 Interpretation of Bertin’s guidance regarding the suitability of various encoding methods to support common tasks
The marks are perceived as PROPORTIONAL to each other
Association Selection Order Quantity
Size
Value
Texture
Colour
Orientation
Shape
The marks canbe perceived as SIMILAR
The marks are perceived as DIFFERENT,forming families
The marks are perceived as ORDERED
Visual Encoding | IAT 355 30

Interpretations of Graphical Vocabulary Some properties can be discriminated more accurately but don’t have intrinsic meaning (Senay & Ingatious 97, Kosslyn, others)
• Density (Greyscale)
Darker -> More
• Size / Length / Area Larger -> More
• Position
Leftmost -> first, Topmost -> first
• Hue
no intrinsic meaning; good for highlighting
• Slope / Shape • no intrinsic meaning; • good for contrast
Visual Encoding | IAT 355 31

Accuracy Ranking of Quantitative Perceptual Tasks Estimated; only pairwise comparisons have been validated.
(Mackinlay 88 from Cleveland & McGill)

Visual variables: selectivity
LInfoVis Winter 2011 Chris Culy
33
Selectivity: Different values are easily seen as different
“Is A different from B?” Worst case: visual properties of all objects need to be
looked at one by one
LInfoVis Winter 2011 Chris Culy
34
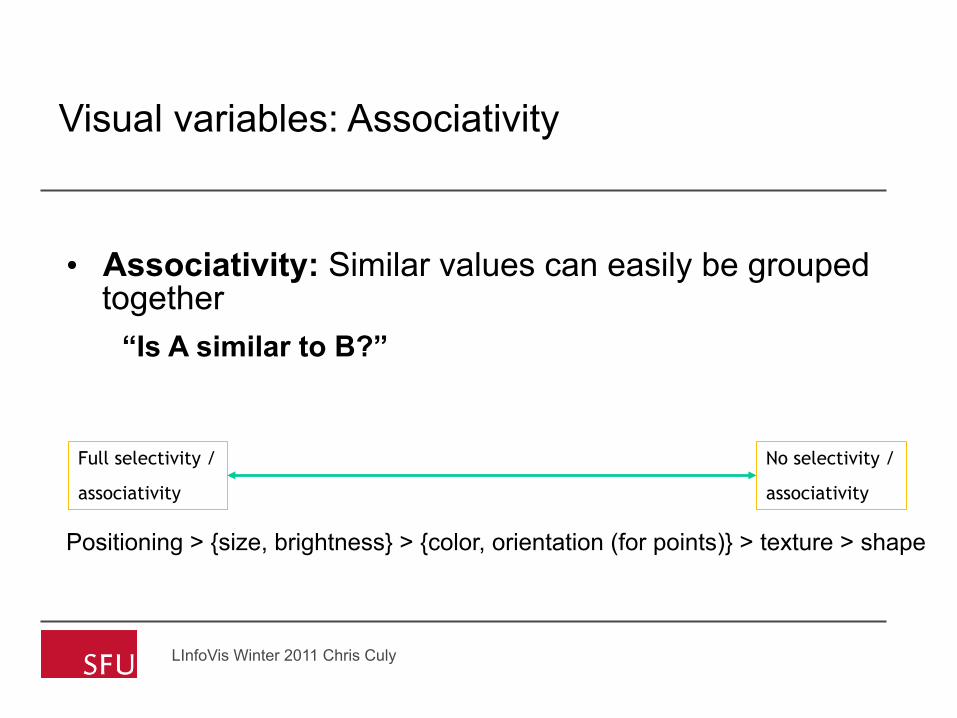
• Associativity: Similar values can easily be grouped
together “Is A similar to B?”
Positioning > {size, brightness} > {color, orientation (for points)} > texture > shape
Visual variables: Associativity
Full selectivity /
associativity
No selectivity /
associativity

LInfoVis Winter 2011 Chris Culy
35
Order: Different values are perceived as ordered “Is A more/greater/bigger than B?”
• Size and brightness are ordered
• Orientation, shape, texture are not ordered
• Hue is “not really” ordered
• Some visual culture of progression
Visual variables: Order

LInfoVis Winter 2011 Chris Culy
36
Quantity: A number can be deduced from differences
• “How much is the difference between A and B?”
• Position is quantitative, size is somewhat quantitative • The other variables are not quantitative
Visual variables: quantity

LInfoVis Winter 2011 Chris Culy
37
Length: The number of distinctions possible using the variable • “How many different things can we represent with this variable?”
• Shape, Texture: infinite, but … • Brightness, hue: 7 (Association) – 10 (Distinction) • Size: 5 (Association) -20 (Distinction) • Orientation: 4
Visual variables: capacity
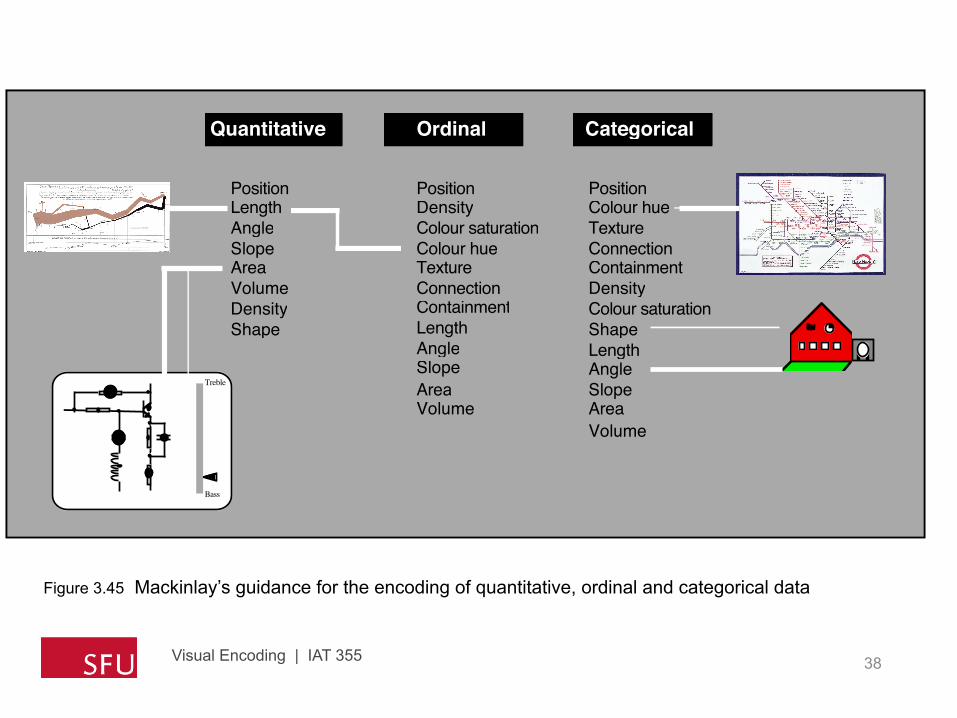
Figure 3.45 Mackinlay’s guidance for the encoding of quantitative, ordinal and categorical data
Quantitative
PositionLengthAngleSlopeAreaVolumeDensityShape
Ordinal
PositionDensityColour saturation
TextureConnectionContainmentLengthAngleSlopeAreaVolume
Colour hue
Categorical
PositionColour hueTextureConnectionContainmentDensityColour saturationShapeLengthAngleSlopeAreaVolume
Treble
Bass
Visual Encoding | IAT 355 38

Few’s Table:
Attribute Quantitative Qualitative
Line length
2-D position
Orientation
Line width
Size
Shape
Curvature
Added marks
Enclosure
Hue
Intensity

Design Space of Visual Encodings
40 Visual Encoding | IAT 355

Choosing Visual Encodings
Principle of Consistency • The properties of the image should match the
properties of the data
Principle of Importance Ordering • Encode the most important information in the most
important way
Visual Encoding | IAT 355

Jan 21, 2011 IAT 355 42
Univariate Data

Jan 21, 2011 IAT 355 43
What goes where
• In univariate representations, we often think of the data case as being shown along one dimension, and the value (quantity) in another
Y Axis is quantitative Graph shows change in Y over continuous range X
Y Axis is quantitative Graph shows value of Y for 4 cases

Jan 21, 2011 IAT 355 44
Bivariate Data
• Representations • Scatter plot • Each mark is a data case • Want to see relationship between
two variables • What is the pattern? • Note both variables are
continuous data
Price
Mileage

Jan 21, 2011 IAT 355 45
Trivariate Data
• 3D scatter plot may work • Must have 3D cues
• 3D blobs • motion parallax • Stereoscopy
• But there are other coding dimensions
Price
Mileage
Horsepower

Jan 21, 2011 IAT 355 46
Three variables
• Use blob attribute for another variable
Price
Mileage
Price
Mileage
2 (x,y) 1 (size, colour, shape …)

Jan 21, 2011 IAT 355 47
Hypervariate Data
• Number of well-known visualization techniques exist for data sets of 1-3 dimensions • line graphs, bar graphs, scatter plots OK • We see a 3-D world (4-D with time)
• What about data sets with more than 3 variables? • Often the interesting, challenging ones
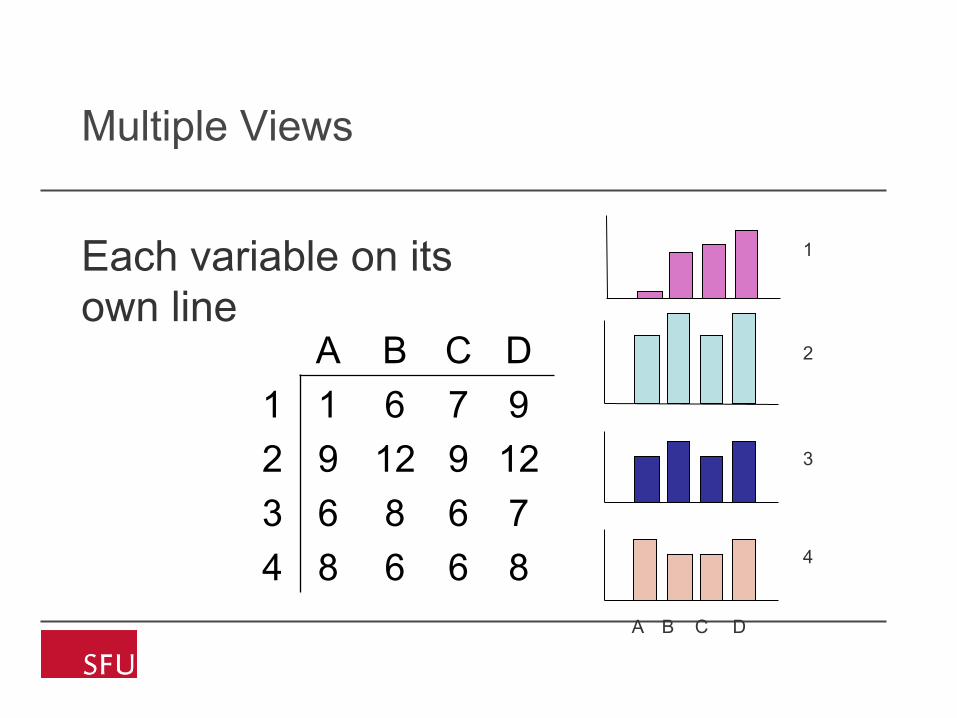
Multiple Views
A B C D 1 1 6 7 9 2 9 12 9 12 3 6 8 6 7 4 8 6 6 8
1
2
3
4
A B C D
Each variable on its own line

Jan 21, 2011 IAT 355 49
Scatterplot Matrix
• Represent each possible pair of variables in their own 2-D scatterplot
• Useful for what? • Misses what?

Using visual variables
• “Sameness of a visual element implies sameness of what the visual element represents” (Tufte, 2006)
• Characteristics of visual variables determine their use
• e.g. Ordered values have to be represented by ordered visual variables
• Be consistent concerning relations of similarity, proportion and configuration
• Adhere to conventional uses of visual variables e.g. in cartography use blue color for water
• Scales should be made up of visually equidistant values of a variable
LInfoVis Winter 2011 Chris Culy

Using visual variables (2)
• The full range of a visual variable should be used – e.g. when using shades of gray, use from white to black
• The number of visual variables of a visualization should correspond to the dimensionality of the represented information – But sometimes dual encoding can be useful
LInfoVis Winter 2011 Chris Culy

Using visual variables
When combining two visual variables, if people should be able to analyze the two attributes independently, then separable variables should be used.
Perception!!!! Next week.
LInfoVis Winter 2011 Chris Culy


![IAT 355 1 1 Text ______________________________________________________________________________________ SCHOOL OF INTERACTIVE ARTS + TECHNOLOGY [SIAT]](https://img.pdfslide.us/doc/110x75/56649e575503460f94b50854/iat-355-1-1-text-.jpg)