Embed Size (px)
Citation preview

FY16 half year results
Ian Davies, Managing Director and CEO
Graham Yerbury, Chief Financial Officer
Brisbane, 23 February 2016
For
per
sona
l use
onl
y

FY16 half year results
Ian Davies Managing Director and CEO
2
Highlights
Outlook
H1 FY16 results
Key takeaways
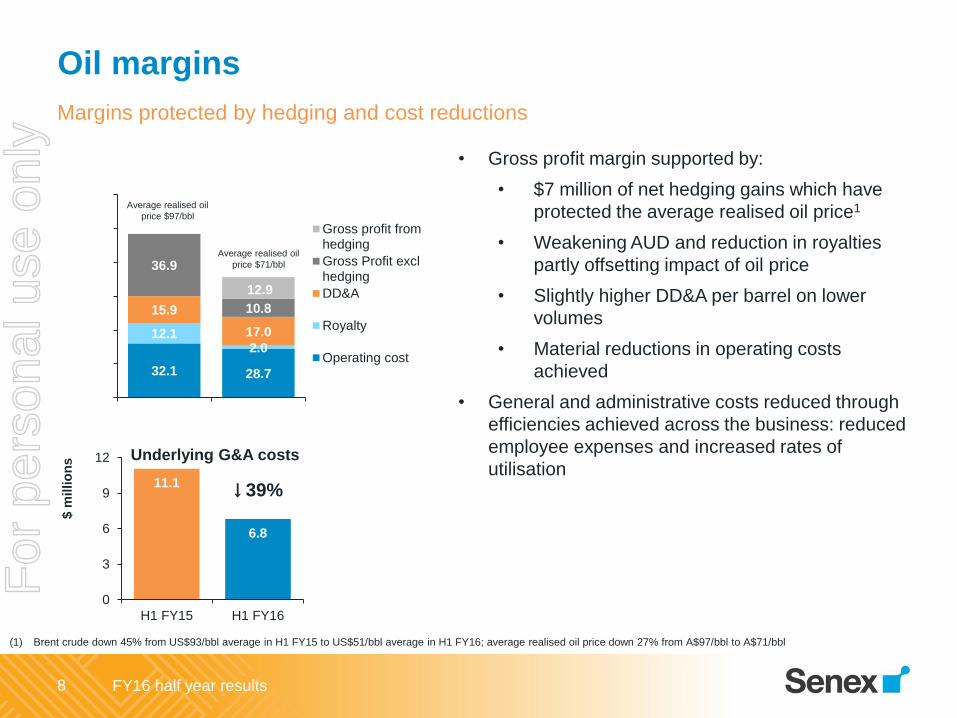
Cover slide imagery shows: Easternwell Rig 106 mobilised to the Ethereal-1 gas exploration well
site (Origin Energy joint venture)
Project updates
For
per
sona
l use
onl
y
FY16 half year results
Key takeaways
3
Maintaining financial strength and pursuing growth
• Strong financial position
• Successful cost out program
• Disciplined capital allocation in pursuit of growth
• Strongly positioned for an oil price recovery
For
per
sona
l use
onl
y

FY16 half year results
H1 FY16 business highlights
4
Solid performance in a challenging market
Corporate
• Improved safety performance, with TRIFR down 22% reflecting maintained
commitment in a challenging market
• Strengthened financial position: cash balance of $100 million and no cash
drawn down on our debt facility of $80 million
• Value accretive transactions: a series of strategic transactions in the Surat
Basin resulted in recognition of $38 million gain on sale of the Maisey block
Gas
• Stage 1 unconventional gas opportunity with Origin Energy: early success in
first two wells drilled, production testing to commence shortly
• Western Surat Gas Project: strategic agreements completed with GLNG
provide commercialisation and financing pathway for this project
Oil
• Solid production performance from oil portfolio: continuing to deliver a strong
margin
• Murta tight oil project: capital and risk sharing transaction completed with
Halliburton, and two wells fracture stimulated
(1) TRFIR = Total Recordable Injury Frequency Rate. H1 FY16 TRIFR of 3.07 (H1 FY15 TRIFR of 3.92)
For
per
sona
l use
onl
y

FY16 half year results
Graham Yerbury Chief Financial Officer
5
Highlights
Outlook
H1 FY16 results
Key takeaways
Project updates
For
per
sona
l use
onl
y

FY16 half year results
Key financial headlines
6
Significant improvements in operating and corporate costs
H1 FY16 H1 FY15 Change
Production (mmboe) 0.54 0.74 (27%)
Sales volumes (mmboe) 0.52 0.72 (28%)
Average realised oil price (A$ per barrel) 71 97 (27%)
Capital spend ($ million) 17.3 51.7 (67%)
Sales revenue ($ million) 36.8 69.9 (47%)
Oil operating cost excluding royalties ($ per barrel) 27.8 31.2 (11%)
Underlying G&A costs ($ million) 6.8 11.1 (39%)
Underlying NPAT ($ million) 5.2 1.6 225%
Statutory NPAT ($ million) (27.1) (65.9) 59%
Operating cash flow ($ million) 25.1 19.0 32%
Cash balance ($ million) 99.6 74.9 33%
Liquidity ($ million) 176.9 74.9 136% For
per
sona
l use
onl
y

FY16 half year results
Building a material east coast gas business
7
Unlocking shareholder value through a series of strategic transactions
Asset
swap
Maisey
sale
• A series of strategic transactions have delivered a material 100% held growth project and
monetised the Maisey block, resulting in a $38 million gain on sale:
December 2014 asset swap:
• Senex exchanged minority interests in
QGC operated eastern Surat Basin gas
permits for 100% operatorship of three
QGC JV western Surat Basin permits
• Nil cash consideration paid
December 2015 sale of Maisey block:
• Major agreements with GLNG
providing commercialisation and
financing pathway for the project
• Sale of Maisey block for $42 million
plus valuable suite of technical data
• 20 year binding Gas Sales Agreement
For
per
sona
l use
onl
y
FY16 half year results
32.1 28.7
12.1 2.0
15.9
17.0
36.9
10.8
12.9
0
20
40
60
80
100
120
H1 FY15 H1 FY16
A$ p
er
barr
el
Oil margins
Gross profit fromhedging
Gross Profit exclhedging
DD&A
Royalty
Operating cost
Oil margins
8
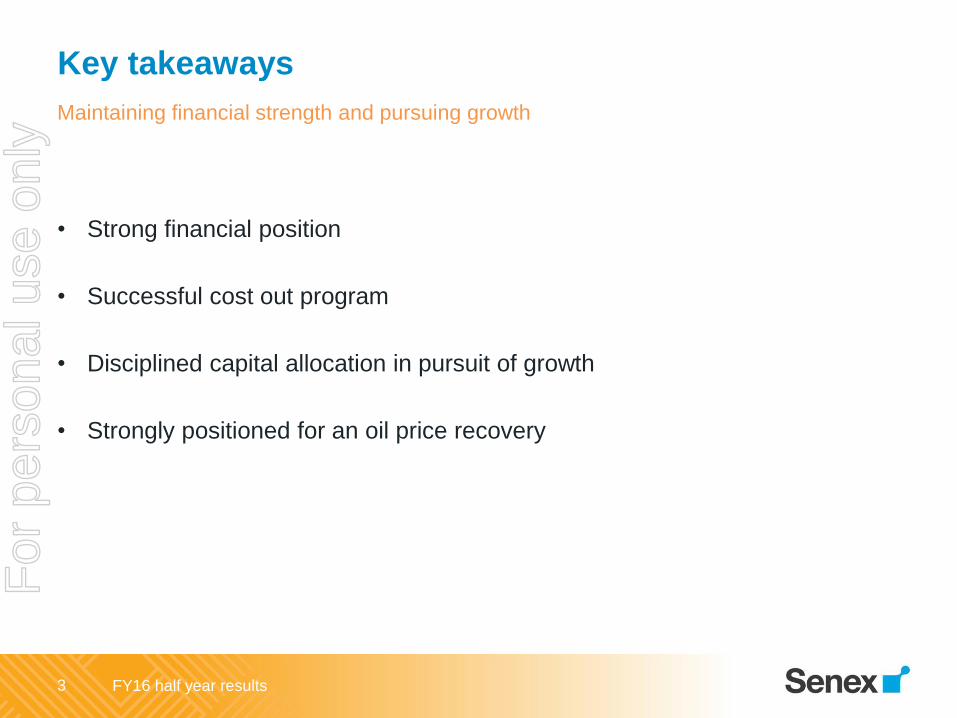
Margins protected by hedging and cost reductions
• Gross profit margin supported by:
• $7 million of net hedging gains which have
protected the average realised oil price1
• Weakening AUD and reduction in royalties
partly offsetting impact of oil price
• Slightly higher DD&A per barrel on lower
volumes
• Material reductions in operating costs
achieved
• General and administrative costs reduced through
efficiencies achieved across the business: reduced
employee expenses and increased rates of
utilisation
11.1
6.8
0
3
6
9
12
H1 FY15 H1 FY16
$ m
illio
ns
Underlying G&A costs
Average realised oil
price $97/bbl
Average realised oil
price $71/bbl
↓39%
(1) Brent crude down 45% from US$93/bbl average in H1 FY15 to US$51/bbl average in H1 FY16; average realised oil price down 27% from A$97/bbl to A$71/bbl
For
per
sona
l use
onl
y

FY16 half year results
1.6 5.2
18.5
15.9 (18.7)
(14.4 )
4.3 (2.0)
-40.0
-30.0
-20.0
-10.0
-
10.0
20.0
Underlying H1FY15 NPAT
Sales revenue -A$ price
Sales revenue -volume
Cost of sales Explorationexpense
G&A Other Underlying H1FY16 NPAT
$ m
illio
n
Movement in underlying net profit after tax
Underlying NPAT reconciliation
9
Corporate and operational cost savings outweigh lower oil price
1. Sales revenue
down on lower
average realised
price, primarily due
to sustained fall in
Brent crude prices
2. Sales revenue
down on lower
volumes of
hydrocarbons sold,
primarily due to
lower capital
investment
3. Cost of sales
improvement on
unit operating cost
savings, lower
royalties and lower
volumes
4. Significant
reduction in
exploration
expense given
reduced capex
5. G&A improvement
through business
efficiencies
achieved
1 2
3
4
5
For
per
sona
l use
onl
y

FY16 half year results
99.6 49.0
36.8 (16.0) (5.0) 64.8 (12.3)
52.5
42.0 7.0 (1.9)
77.2
0
40
80
120
160
200
Ope
nin
g c
ash
1 J
uly
20
15
Sale
s r
eve
nue
Ope
ratin
gcosts
De
ve
lop
men
tan
d fix
ed
asset cap
ex
Seis
mic
an
dexplo
ration
cape
x
Dis
posal of
Ma
isey
Ne
t w
ork
ing
capital
mo
ve
me
nt
Oth
er
Clo
sin
g c
ash
31
Decem
ber
20
15
$ m
illio
n
Movement in opening and closing cash balance
Operating cash reconciliation
10
Robust funding position
Others Opex and
development Growth
• Cash reserves of $100 million at 31 December 2015 with a $77 million undrawn debt facility
• Capex program significantly reduced in response to lower oil prices
• $42 million cash inflow received from GLNG in exchange for the sale of the Maisey block
• Net working capital reduction principally on lower receivables due to lower oil price
$177 million
total liquidity
For
per
sona
l use
onl
y

FY16 half year results
Ian Davies Managing Director and CEO
11
Highlights
Outlook
H1 FY16 results
Key takeaways
Project updates
For
per
sona
l use
onl
y

FY16 half year results
151.4
82.2
17.3
1.38 1.39
0.54
0
0.2
0.4
0.6
0.8
1
1.2
1.4
1.6
0
20
40
60
80
100
120
140
160
FY14 FY15 FY16 FY14 FY15 FY16m
mb
oe
$ m
illio
n
35.0 –
45.0
1.0 –
1.2
FY16 capital expenditure and production
12
On track to deliver in line with guidance
FY16 capex
• Significant year on year capex reductions since FY14
• First half capital program targeted near-term
production and cash flow generation
• Second half capital program focused on preparation
for production testing on Western Surat Gas Project
• Strong financial position maintained with over
$80 million of cash expected at end FY16
FY16 production
• Reduced capital investment since January 2015 has
an ongoing and cumulative impact on production
• On track to deliver production within guidance range
• Natural field decline partially offset by new well
connections
• Martlet-2 well now online; expect to bring the
Vanessa-1ST well online during H2 FY16
Capex Production
FY16 guidance range H1 FY16 actuals
Capital spend ($ million) H1 FY16
actual
FY16
guidance
Cooper Basin 13 15 – 20
Surat Basin 4 20 – 25
Total equity capex 17 35 – 45
Origin Energy free carry 9 25 – 35
Total capital deployed 26 60 – 80
For
per
sona
l use
onl
y

FY16 half year results
Outlook
• Strategy is unchanged: maturing oil and gas exploration assets into production and achieving a
material gas business, but acknowledging the realities of a “lower for longer” oil price environment
• Financial strength: $100 million cash and no debt to service, with low unit cash costs
• Business remains profitable: portfolio of producing assets remains cash positive at all points on
the US$ Brent forward curve
• Material cost savings have been achieved, supporting profit margins even at current prices
• Hedging for FY17 is not presently attractive due to cost of protection and market volatility
• Current US$ Brent forward curve supports all fields remaining online
• Disciplined capital allocation in pursuit of growth: live within our means, but continuing to
invest where opportunities meet our economic criteria
• Consider external opportunities which increase scale at the right price
• Western Surat Gas Project appraisal funded through GLNG payment
• Take advantage of lower costs in the service sector
• Ability to quickly increase capital programs given Senex operates all key assets
• Strongly positioned for an oil price recovery: Senex has retained and progressed growth
opportunities within the portfolio while simultaneously maturing its exploration opportunity set
13
Surviving a downside oil price scenario (lower for longer)
For
per
sona
l use
onl
y
FY16 half year results
Ian Davies Managing Director and CEO
14
Highlights
Outlook
H1 FY16 results
Key takeaways
Project updates
For
per
sona
l use
onl
y

FY16 half year results
Cooper Basin oil program
15
A self-funding, focused work program
During H1 FY16:
• Work program focused on oil production
• Building and refining regional petroleum system model
while conserving capital expenditure
• Reduced operating cost reflects cost saving measures
Ongoing strategy:
• Target high value drilling prospects that meet economic
criteria
• Take advantage of lower cost environment for capital
projects
• Extended production testing on southern Cooper Basin
wells as part of Murta tight oil pilot project, majority
funded by Halliburton
• Continue to meet all commitments and retain long term
tenure in Cooper Basin
• Project will evaluate the commerciality of the
Murta Formation
• Commerciality dependent on the response of
the reservoir to fracture stimulation and
production testing
• Mirage-6 and Ventura-2 wells brought online
in January 2016; both show productivity
increases
• Halliburton agreement can be expanded to
two further vertical wells
• Horizontal well appraisal programs a further
step towards commercialisation
Halliburton conducts fracture stimulation of the Ventura-2 well,
southern Cooper Basin
Spotlight: Murta Formation tight oil project
For
per
sona
l use
onl
y

FY16 half year results
Cooper Basin gas program
16
Progressing growth projects
During H1 FY16:
• Unconventional gas project with Origin Energy:
two-well drilling campaign successfully completed under
budget and ahead of schedule in the Allunga Trough
• Vanessa gas field: achieved mechanical completion of
surface facilities ready for commissioning
Ongoing strategy:
• Unconventional gas opportunity with Origin Energy:
• JV partners remain aligned on the stage 1 work
program for which Senex is free carried for its share
• Conduct fracture stimulation and testing campaign
on southern wells during H2 FY16
• Progressing targets for two-well drilling campaign in
the northern JV area (Patchawarra Trough)
• Vanessa gas field: bring online during H2 FY16
• Take advantage of lower cost environment for capital
projects
Construction of the Vanessa
pipeline (now complete) For
per
sona
l use
onl
y

FY16 half year results
Western Surat Gas Project
17
Material, near-term growth project
During H1 FY16:
• Completed value accretive transactions with GLNG
($42 million cash and 20 year GSA) and received
technical data suite on proximate wells
Ongoing strategy:
• Phase 1 work program to provide information on
reservoir quality and performance, and the opportunity for
early raw gas sales
• Flexibility of GSA allows for staged approach to
development
• Take advantage of lower cost environment for field
services as well as combined learnings from existing
large scale developments
• Continue work on community engagement,
environmental and cultural heritage management
targeting approval of our EIS in 2017
• Engineering design phase will be informed by Phase 1
results and peer performance to deliver an optimal full
field development plan and reach FID
• Appraisal testing of c. 15 wells
• Planning throughout H2 FY16
• Construction and first gas during FY17
• Utilise existing infrastructure (wells, lease pads,
access roads etc) wherever possible
• Potential to monetise raw gas production
through sale to GLNG
• Initial appraisal activity focused on the Eos and
Glenora blocks
Spotlight: Phase 1 work program
For
per
sona
l use
onl
y

FY16 half year results
Ian Davies Managing Director and CEO
18
Highlights
Outlook
H1 FY16 results
Key takeaways
Project updates
For
per
sona
l use
onl
y
FY16 half year results
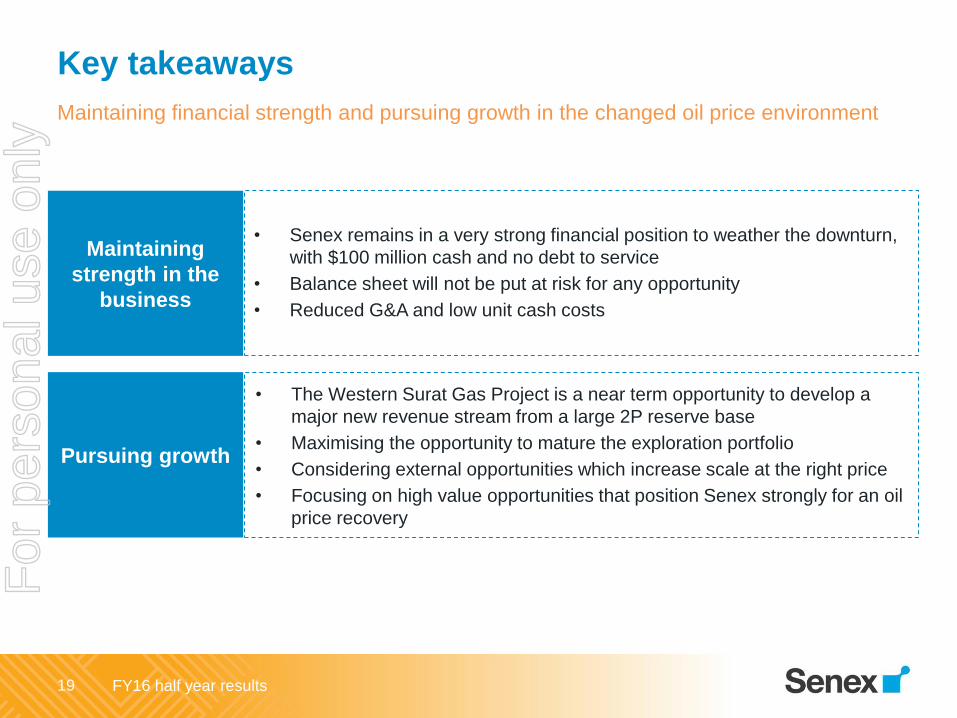
Key takeaways
19
Maintaining financial strength and pursuing growth in the changed oil price environment
Maintaining
strength in the
business
• Senex remains in a very strong financial position to weather the downturn,
with $100 million cash and no debt to service
• Balance sheet will not be put at risk for any opportunity
• Reduced G&A and low unit cash costs
Pursuing growth
• The Western Surat Gas Project is a near term opportunity to develop a
major new revenue stream from a large 2P reserve base
• Maximising the opportunity to mature the exploration portfolio
• Considering external opportunities which increase scale at the right price
• Focusing on high value opportunities that position Senex strongly for an oil
price recovery
For
per
sona
l use
onl
y

FY16 half year results
Registered Office
Level 14, 144 Edward Street
GPO Box 2233
Brisbane, Queensland 4000
Australia
Telephone +61 7 3335 9000
Web www.senexenergy.com.au
Investor enquiries:
Tess Palmer
Investor Relations Manager
Phone: (07) 3335 9719
Media enquiries:
Karen Cottier
Corporate Communications Manager
Phone: (07) 3335 9859
For
per
sona
l use
onl
y

FY16 half year results
Appendix | Net profit after tax
21
Statutory and underlying net profit
H1 FY16 NPAT driven by:
• $38 million gain on sale of the Maisey block
• Lower royalties given the lower oil price
• Lower oil operating cost of $27.8 per barrel,
excluding royalties (H1 FY15: $31.2)
• Significantly lower exploration expense
(successful efforts basis applied)
• Net G&A savings
• Effective tax rate of 0%
Offset by:
• Lower US$ Brent oil price
• Non-cash impairment charge of
$69.7 million reflecting lower oil price
environment
$ million H1
FY16
H1
FY15
Revenue 36.8 69.9
Operating costs (16.0) (31.8)
Gain on sale of Maisey block 38.2 -
Other revenue/costs1 (2.6) (4.5)
EBITDAX 56.4 33.5
Exploration expense (2.5) (18.4)
Depreciation & amortisation (10.4) (13.3)
Impairment (69.7) (86.5)
Net Finance Costs (0.9) 0.3
Tax benefit/(expense) - 18.5
Statutory NPAT (27.1) (65.9)
Impairment 69.7 86.5
Redundancies 0.8 -
Gain on sale of assets (38.2) -
Tax (benefit)/expense - (19.0)
Underlying NPAT 5.2 1.6
(1) Other revenue/costs includes flowline revenue, other income, other operating expenses, general and administrative expenses
Numbers may not add precisely to totals provided due to rounding
For
per
sona
l use
onl
y

FY16 half year results
Appendix | EBITDAX and G&A
22
EBITDAX reconciliation
$ million
H1
FY16
H1
FY15
Statutory net profit (loss) after tax (27.1) (65.9)
Add/(less):
Net interest 0.9 (0.3)
Tax - (18.5)
Amortisation & depreciation 10.4 13.3
Impairment 69.7 86.5
EBITDA 53.9 15.1
Add:
Oil and gas exploration expense 2.5 18.4
EBITDAX 56.4 33.5
G&A reconciliation
$ million
H1
FY16
H1
FY15 Saving
Net G&A 6.0 5.4 (0.6)
Add back redundancies 0.8 -
Deduct foreign exchange
gains 1.7 5.7
Underlying G&A 6.8 11.1 4.3
Numbers may not add precisely to totals provided due to rounding
For
per
sona
l use
onl
y

FY16 half year results
Appendix | Non-cash impairment
23
Impairment reflects prudent response to lower oil price environment
$ million
H1
FY16
H1
FY15
Statutory net loss after tax (27.1) (65.9)
Adjusted for:
Gain on sale of Maisey block (38.2) -
Impairment of exploration assets 69.7 51.7
Impairment of oil properties - 34.8
Redundancy costs 0.8 -
Tax (benefit)/ expense - (19.0)
Underlying net profit after tax 5.2 1.6
• Senex’s operating outlook remains
strong
• Impairment charge reflects
conservative approach to capital
allocation:
• Deferral/cessation of
development activity in the near
term
• Long term oil price of US$74/bbl
real and AUD/USD exchange rate
of 0.77
US$ Brent
(Nominal)
2016 $48 / bbl
2017 $57 / bbl
2018 $67 / bbl
2019 $71 / bbl
2020+ $74 / bbl (real 2020)
Assumptions used for impairment testing
For
per
sona
l use
onl
y
FY16 half year results
Important information
This presentation has been prepared by Senex Energy Limited (Senex). It is current as at the date of this presentation. It contains information in a
summary form and should be read in conjunction with Senex’s other periodic and continuous disclosure announcements to the Australian Securities
Exchange (ASX) available at: www.asx.com.au. Distribution of this presentation outside Australia may be restricted by law. Recipients of this
document in a jurisdiction other than Australia should observe any restrictions in that jurisdiction. This presentation (or any part of it) may only be
reproduced or published with Senex’s prior written consent.
Risk and assumptions
An investment in Senex shares is subject to known and unknown risks, many of which are beyond the control of Senex.
In considering an investment in Senex shares, investors should have regard to (amongst other things) the risks outlined in this presentation and in
other disclosures and announcements made by Senex to the ASX. This presentation contains statements, opinions, projections, forecasts and
other material, based on various assumptions. Those assumptions may or may not prove to be correct.
No investment advice
The information contained in this presentation does not take into account the investment objectives, financial situation or particular needs of any
recipient and is not financial advice or financial product advice. Before making an investment decision, recipients of this presentation should
consider their own needs and situation, satisfy themselves as to the accuracy of all information contained herein and, if necessary, seek
independent professional advice.
Disclaimer
To the extent permitted by law, Senex, its directors, officers, employees, agents, advisers and any person named in this presentation:
• give no warranty, representation or guarantee as to the accuracy or likelihood of fulfilment of any assumptions upon which any part of this
presentation is based or the accuracy, completeness or reliability of the information contained in this presentation; and
• accept no responsibility for any loss, claim, damages, costs or expenses arising out of, or in connection with, the information contained in this
presentation.
Disclaimer
24
For
per
sona
l use
onl
y