Embed Size (px)
Citation preview
30 June 2015
Field measurements –do they provide the ‘absolute truth’?
Ivo Wenneker and Niels G. Jacobsen
Key questions
Rijkswaterstaat (Netherlands):
“How accurate are field measurements of:• Water levels from measurement poles?• Waves in the surf zone?”
30 June 2015 2
Overview
1. Introduction
2. Case study I: water level measurements from measurement poles
3. Case study II: wave measurements in the surf zone
4. Conclusions
30 June 2015 3
1. Introduction
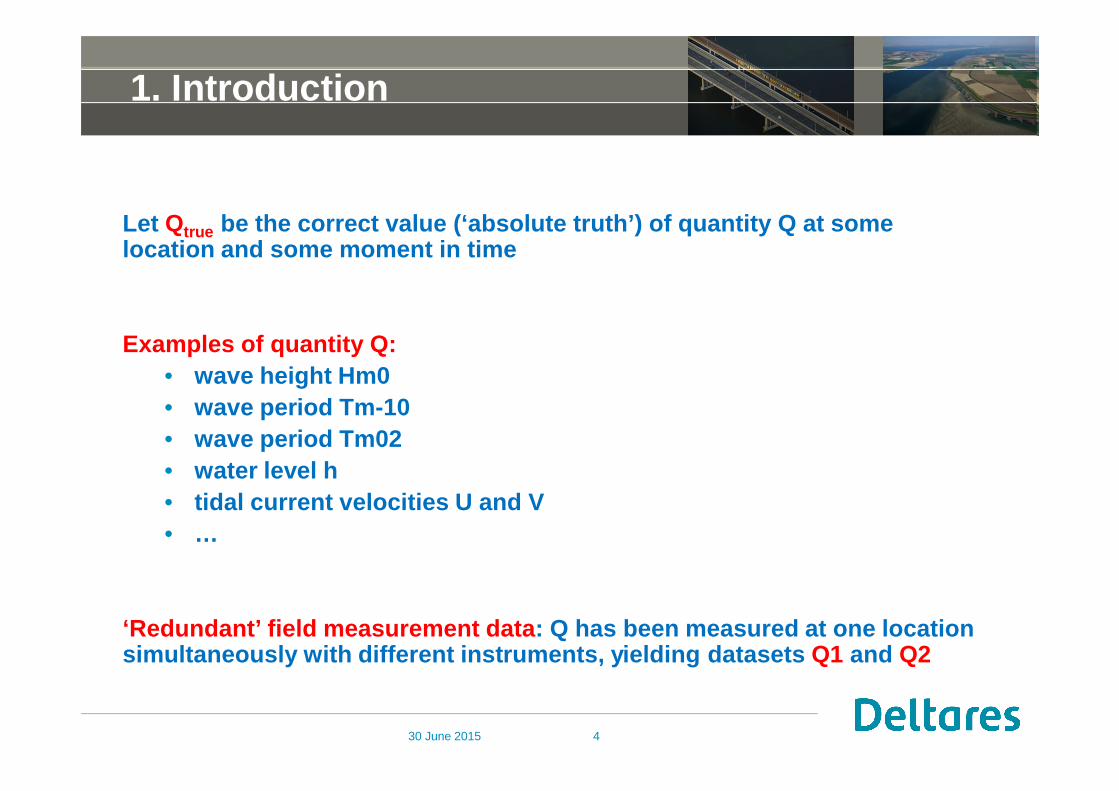
Let Qtrue be the correct value (‘absolute truth’) of quantity Q at somelocation and some moment in time
Examples of quantity Q:• wave height Hm0• wave period Tm-10• wave period Tm02• water level h• tidal current velocities U and V• …
‘Redundant’ field measurement data: Q has been measured at one locationsimultaneously with different instruments, yielding datasets Q1 and Q2
30 June 2015 4
1. Introduction
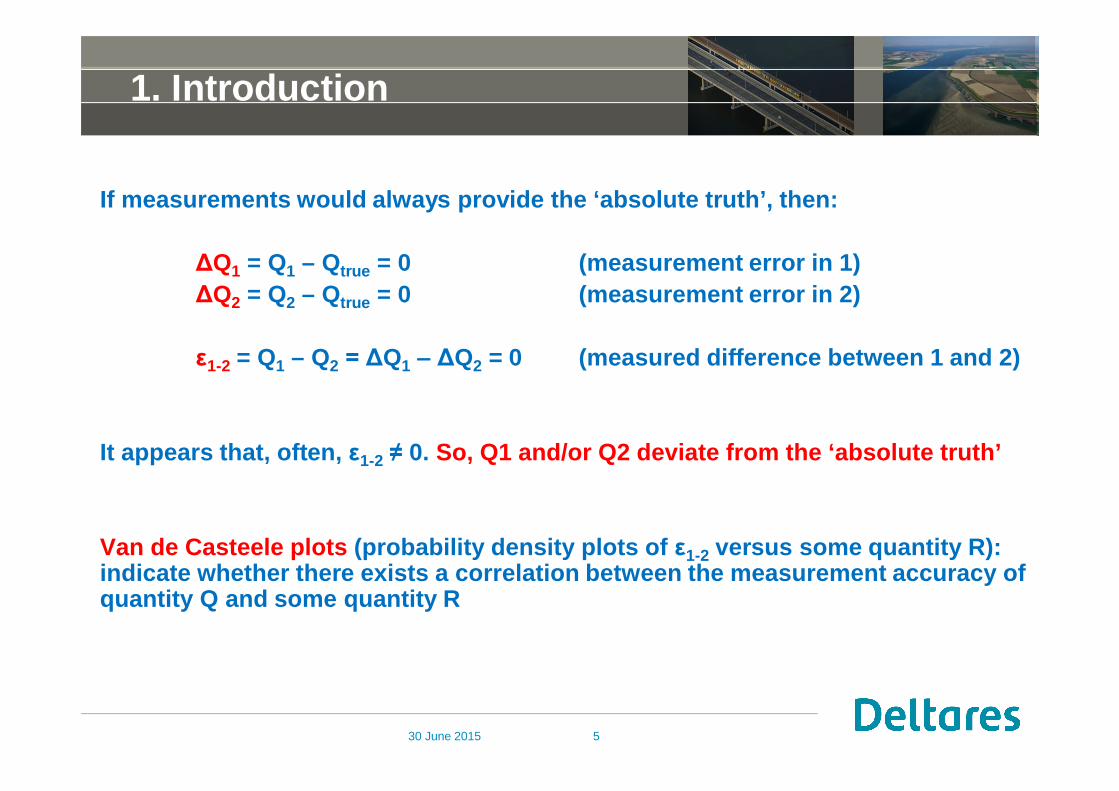
If measurements would always provide the ‘absolute truth’, then:
Q1 = Q1 – Qtrue = 0 (measurement error in 1)Q2 = Q2 – Qtrue = 0 (measurement error in 2)
1-2 = Q1 – Q2 Q1 Q2 = 0 (measured difference between 1 and 2)
It appears that, often, 1-2 0. So, Q1 and/or Q2 deviate from the ‘absolute truth’
Van de Casteele plots (probability density plots of 1-2 versus some quantity R):indicate whether there exists a correlation between the measurement accuracy ofquantity Q and some quantity R
30 June 2015 5
1. Introduction
30 June 2015
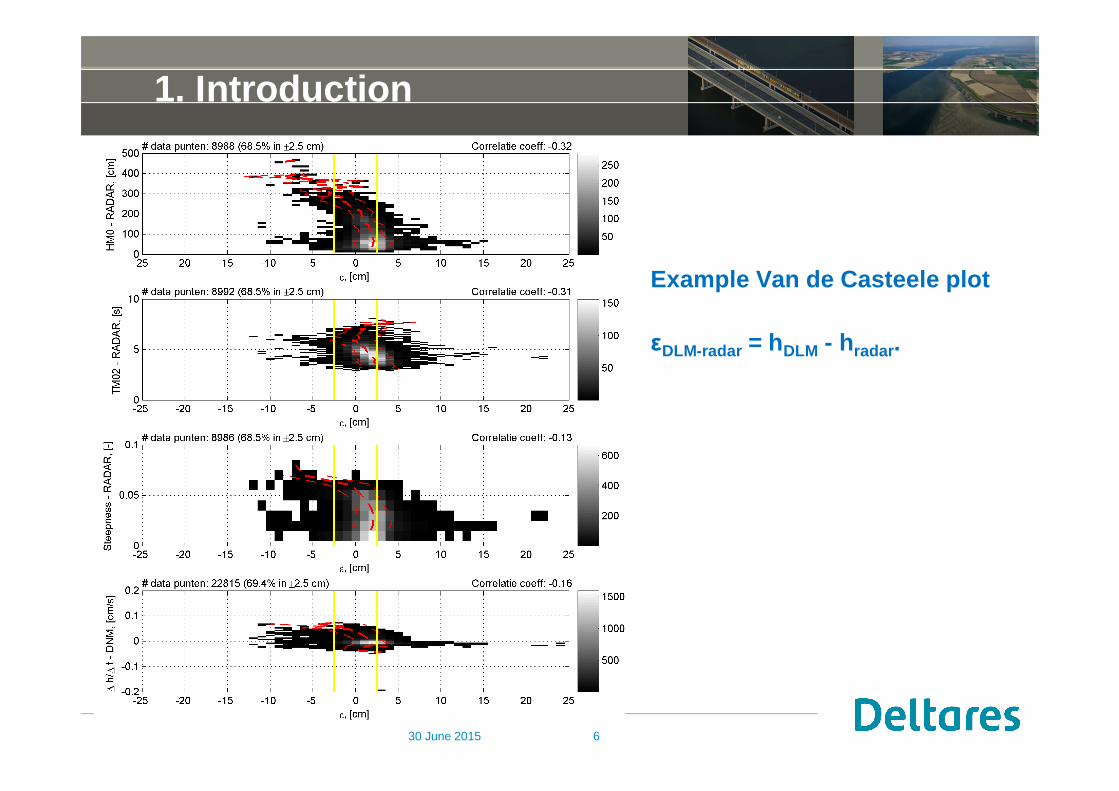
Example Van de Casteele plot
DLM-radar = hDLM - hradar.
6
30 June 2015
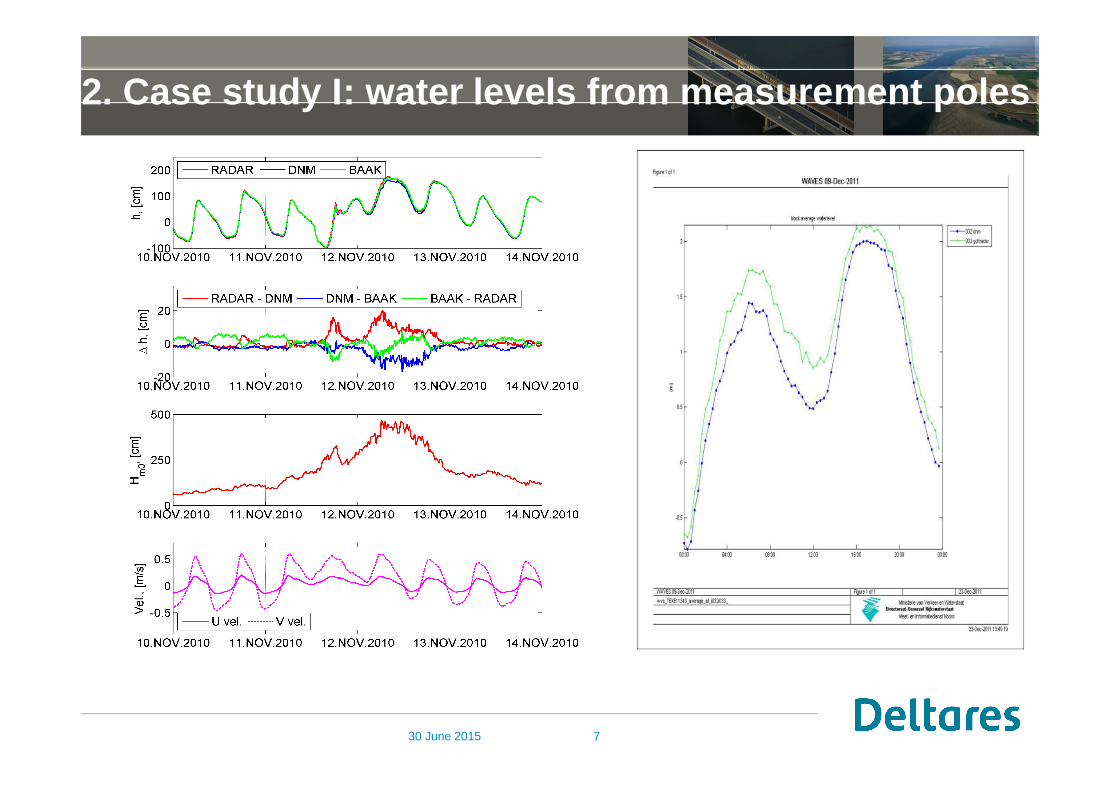
2. Case study I: water levels from measurement poles
7
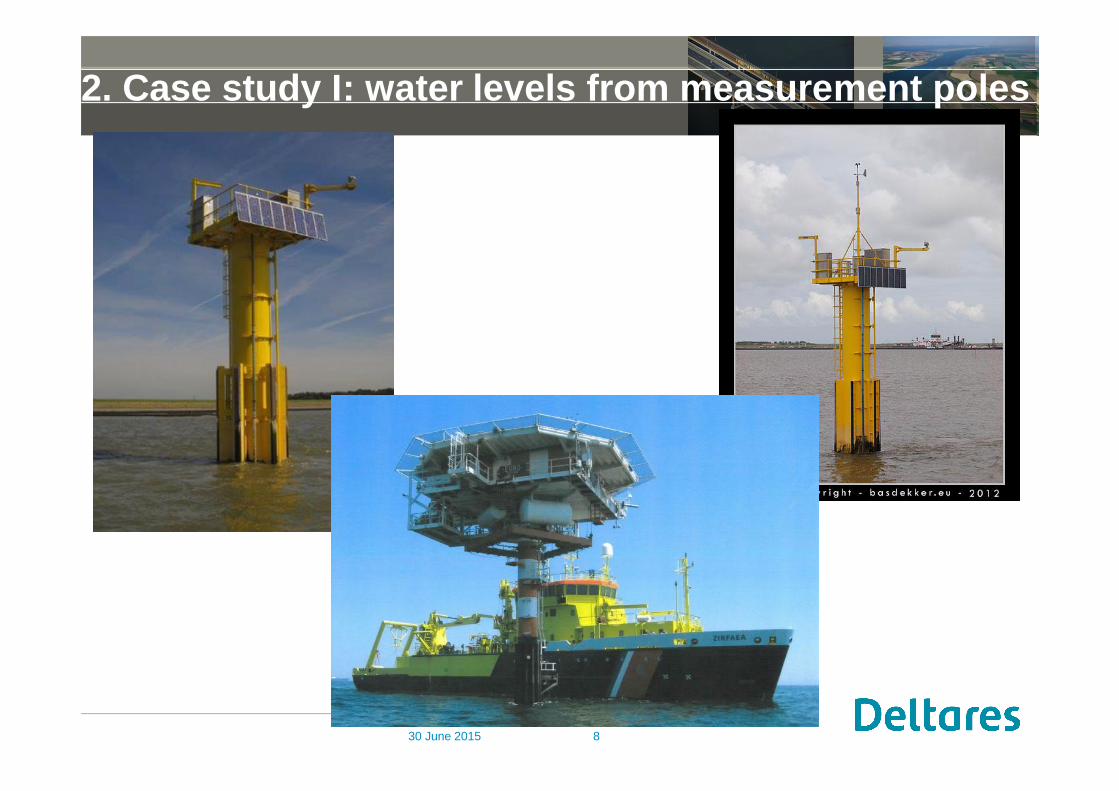
2. Case study I: water levels from measurement poles
30 June 2015 8
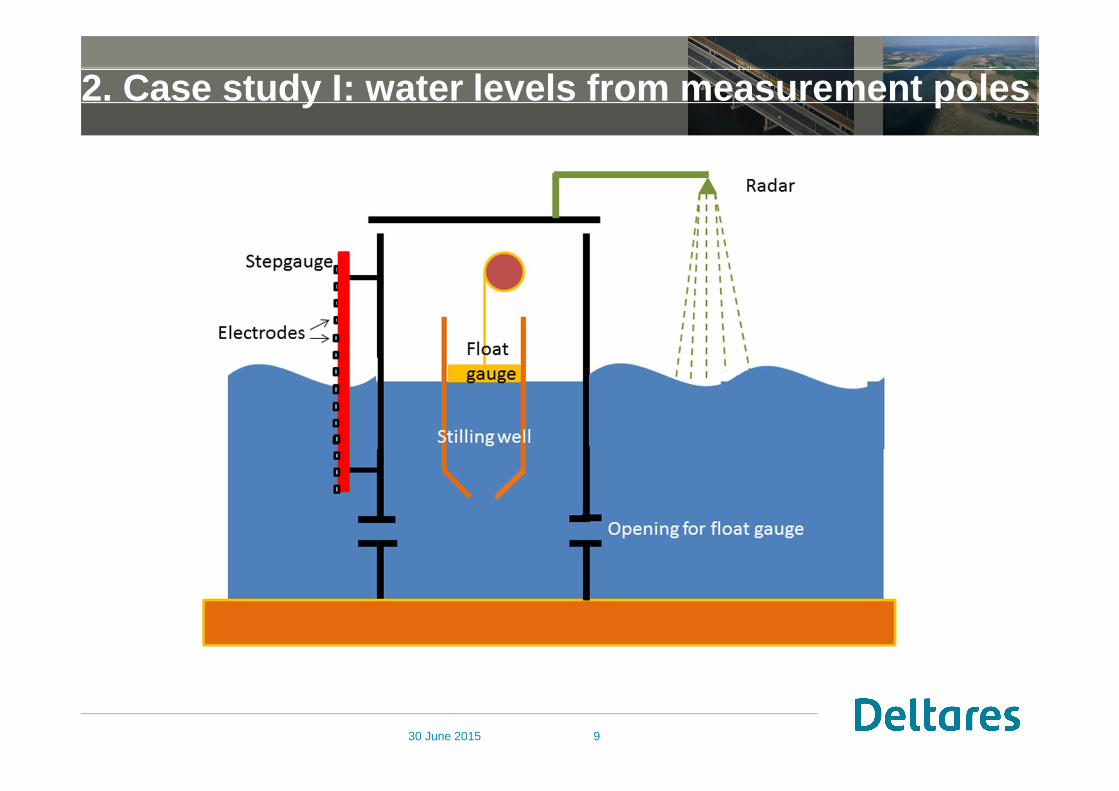
2. Case study I: water levels from measurement poles
30 June 2015 9
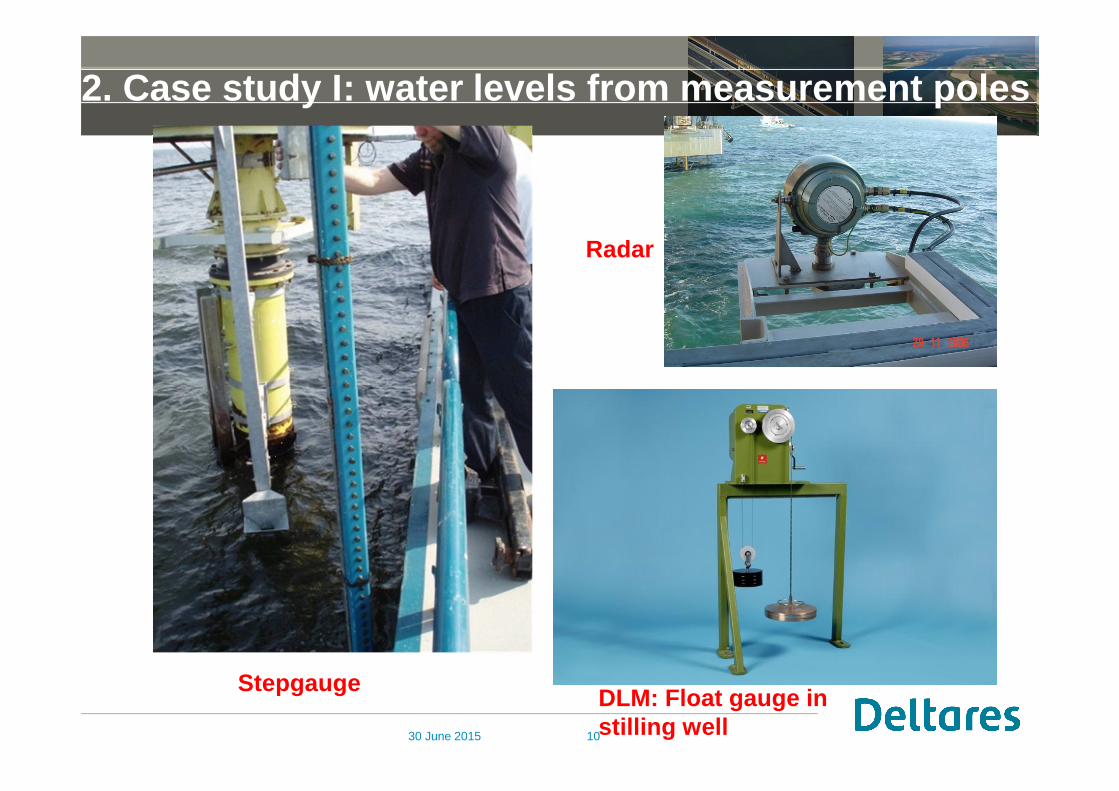
2. Case study I: water levels from measurement poles
Stepgauge DLM: Float gauge instilling well
Radar
30 June 2015 10
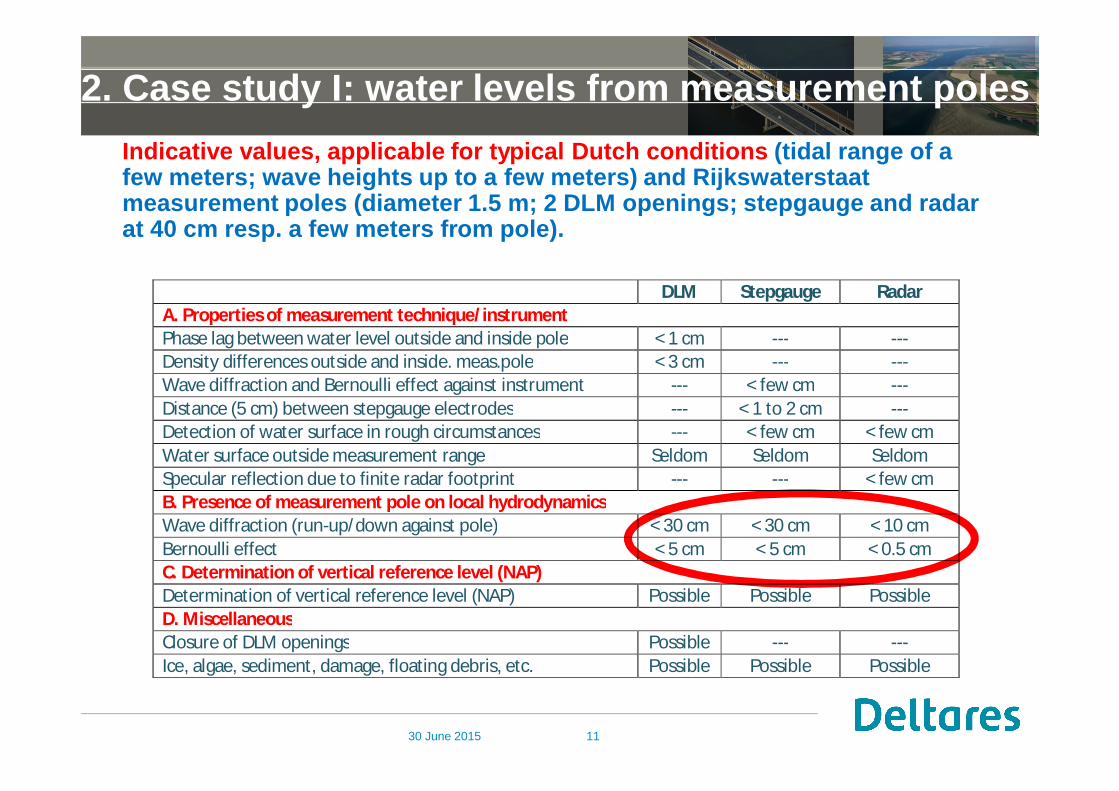
2. Case study I: water levels from measurement polesIndicative values, applicable for typical Dutch conditions (tidal range of afew meters; wave heights up to a few meters) and Rijkswaterstaatmeasurement poles (diameter 1.5 m; 2 DLM openings; stepgauge and radarat 40 cm resp. a few meters from pole).
DLM Stepgauge RadarA. Properties of measurement technique/instrumentPhase lag between water level outside and inside pole < 1 cm --- ---Density differences outside and inside. meas.pole < 3 cm --- ---Wave diffraction and Bernoulli effect against instrument --- < few cm ---Distance (5 cm) between stepgauge electrodes --- < 1 to 2 cm ---Detection of water surface in rough circumstances --- < few cm < few cmWater surface outside measurement range Seldom Seldom SeldomSpecular reflection due to finite radar footprint --- --- < few cmB. Presence of measurement pole on local hydrodynamicsWave diffraction (run-up/down against pole) < 30 cm < 30 cm < 10 cmBernoulli effect < 5 cm < 5 cm < 0.5 cmC. Determination of vertical reference level (NAP)Determination of vertical reference level (NAP) Possible Possible PossibleD. MiscellaneousClosure of DLM openings Possible --- ---Ice, algae, sediment, damage, floating debris, etc. Possible Possible Possible
30 June 2015 11
2. Case study I: water levels from measurement poles
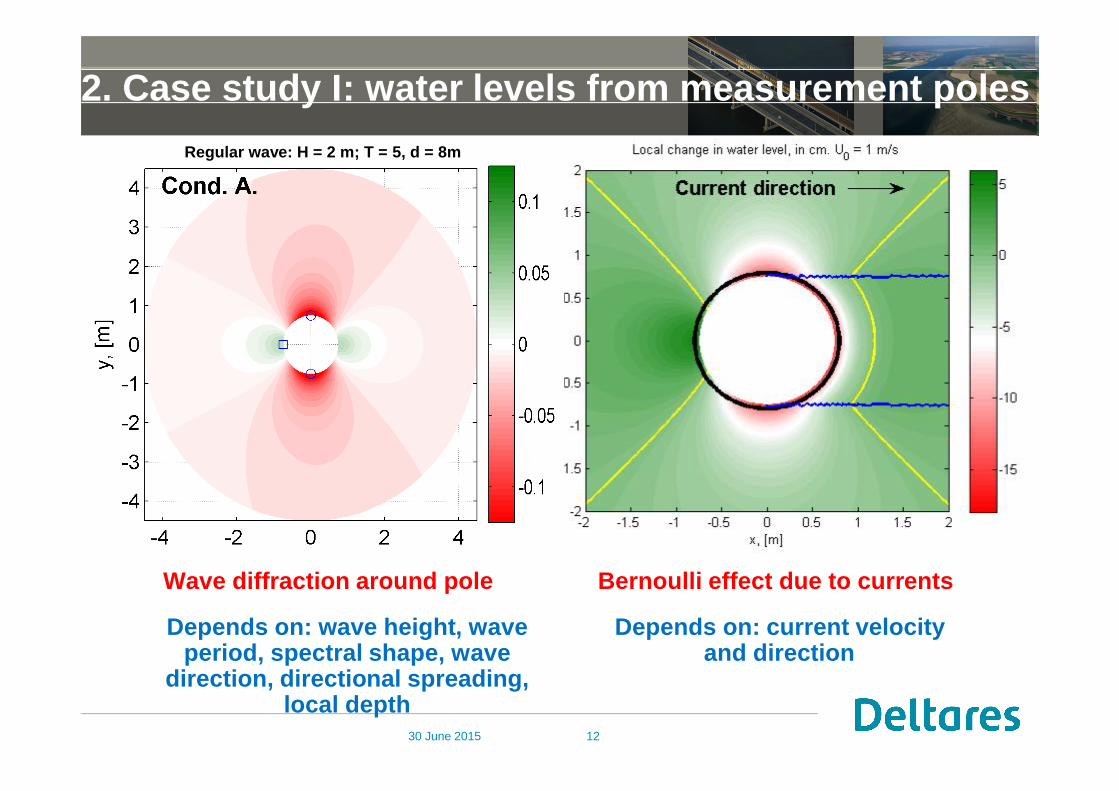
Wave diffraction around pole Bernoulli effect due to currents
Depends on: wave height, waveperiod, spectral shape, wave
direction, directional spreading,local depth
Depends on: current velocityand direction
Regular wave: H = 2 m; T = 5, d = 8m
30 June 2015 12
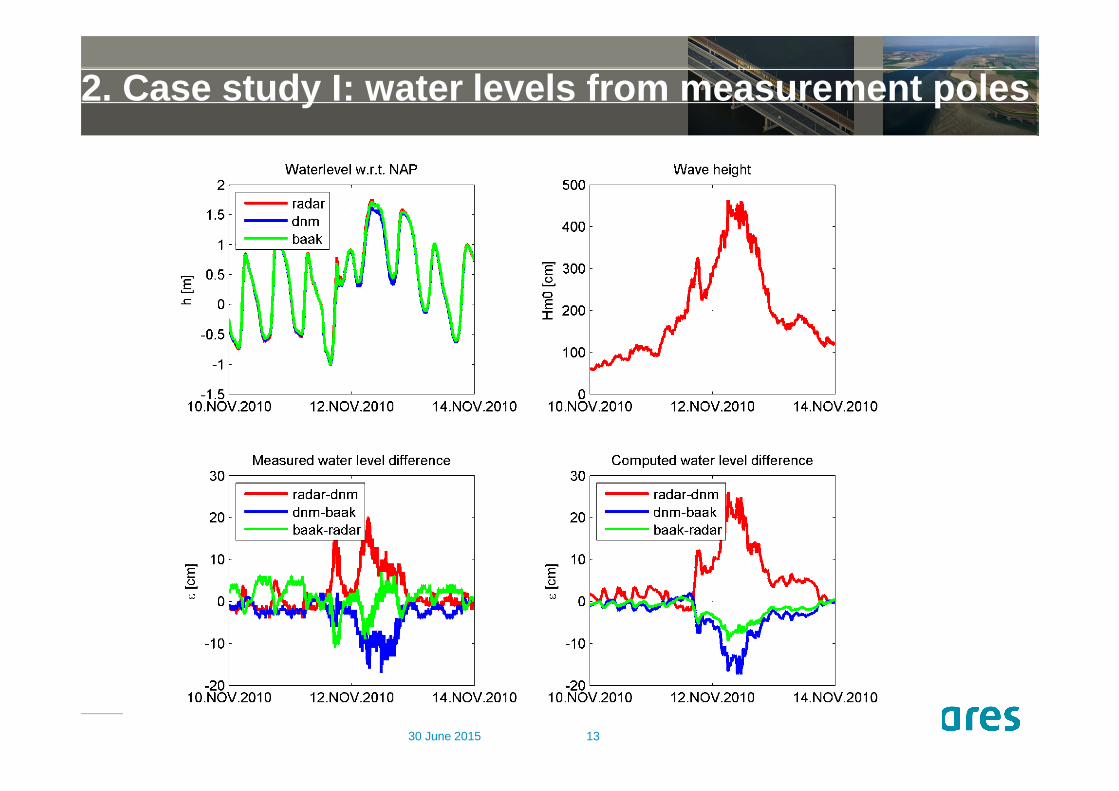
2. Case study I: water levels from measurement poles
30 June 2015 13
2. Case study I: water levels from measurement polesConclusions for well-calibrated water level measurements from measurementpoles
General:During mild conditions, the errors are small (up to a few cm)During storms, the errors can be very large (10 – 30 cm, and possibly larger).
Accuracy depends on measurement configuration (= instrument + measurementpole):
Interaction between measurement pole and local hydrodynamics:Wave diffractionCurrents
Properties of instrument and measurement techniqueMeasurement configuration with radar provides the most accurate water level data,because farthest away from pole
Improving accuracy:Optimising instrument position wrt measurement pole (in particular:increase the distance between them).30 June 2015 14
3. Case study II: wave measurements in the surf zone
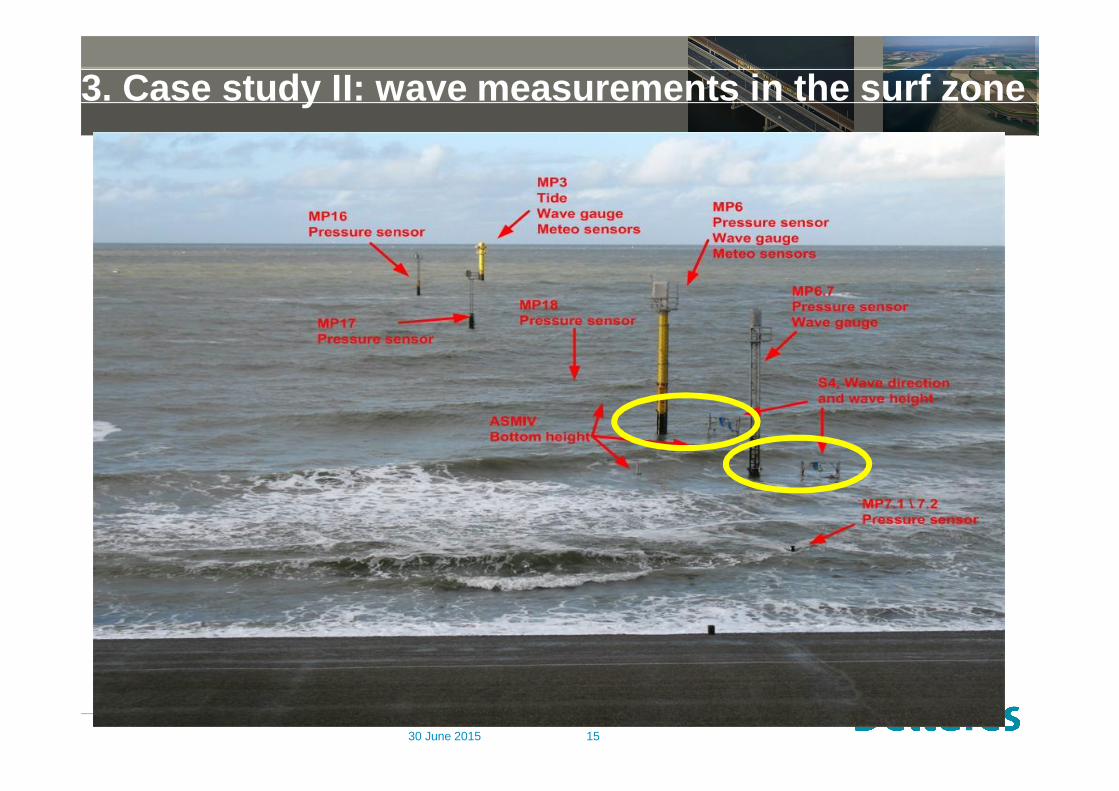
30 June 2015 15
3. Case study II: wave measurements in the surf zone
30 June 2015 16
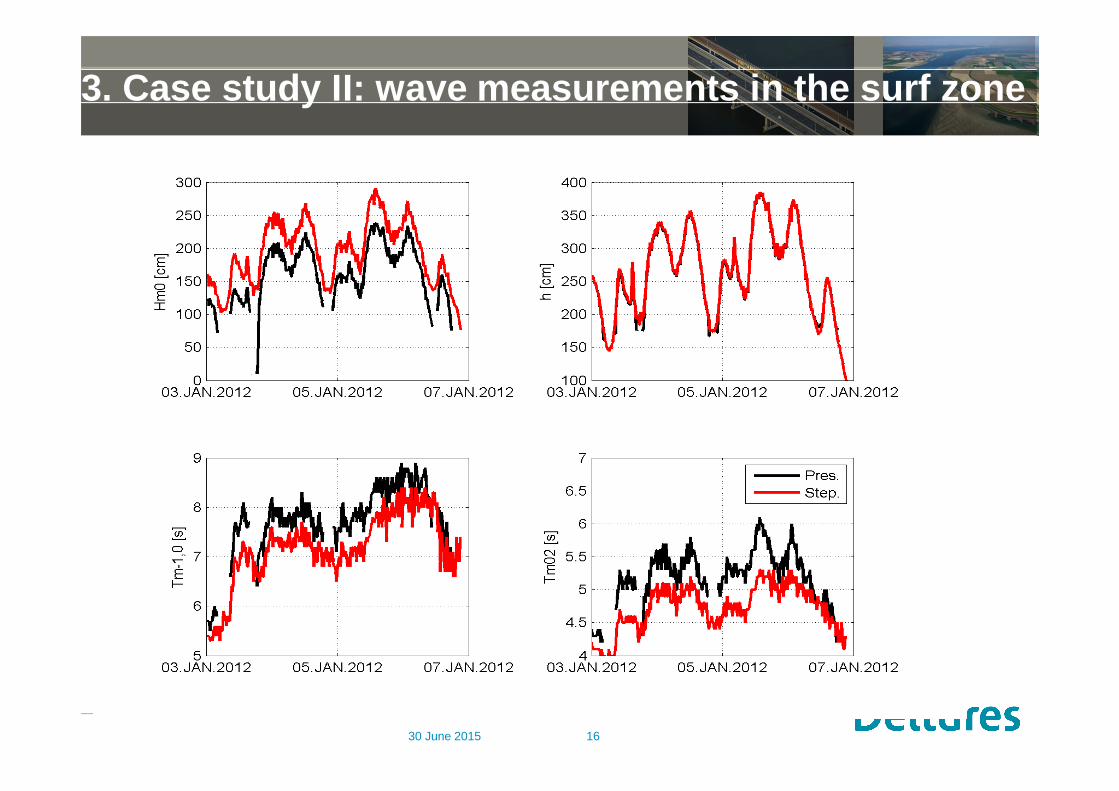
3. Case study II: wave measurements in the surf zone
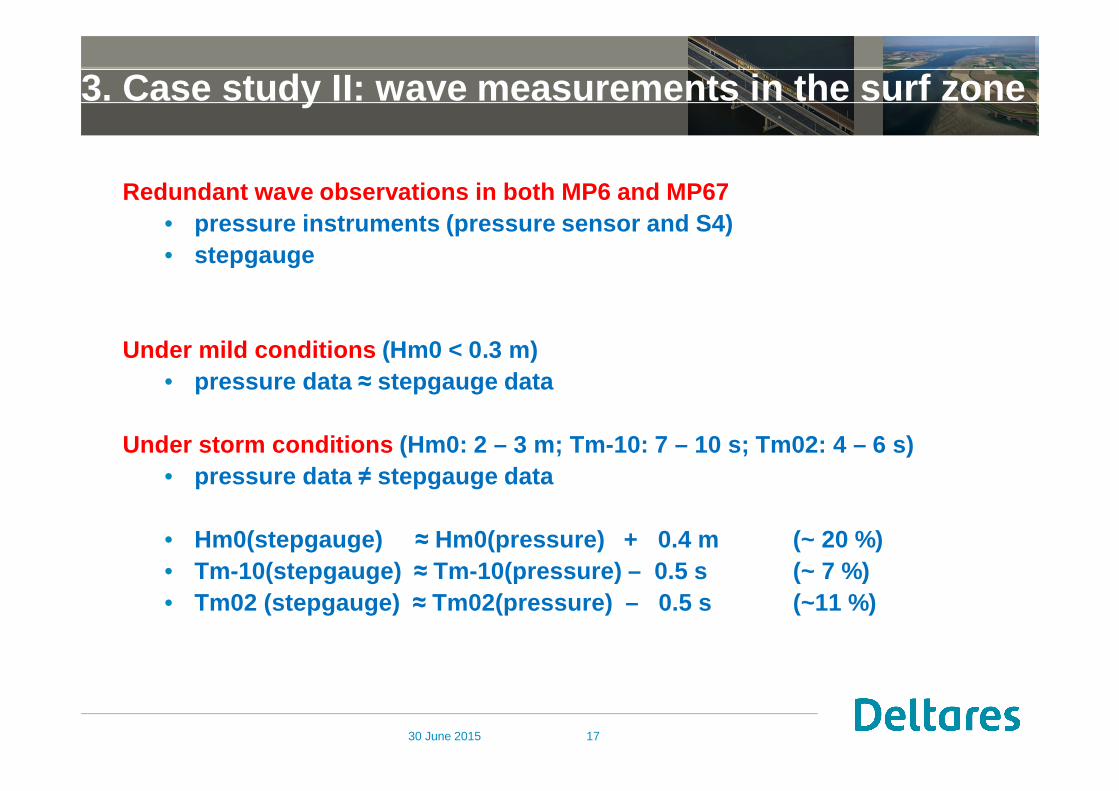
Redundant wave observations in both MP6 and MP67• pressure instruments (pressure sensor and S4)• stepgauge
Under mild conditions (Hm0 < 0.3 m)• pressure data stepgauge data
Under storm conditions (Hm0: 2 – 3 m; Tm-10: 7 – 10 s; Tm02: 4 – 6 s)• pressure data stepgauge data
• Hm0(stepgauge) Hm0(pressure) + 0.4 m (~ 20 %)• Tm-10(stepgauge) Tm-10(pressure) – 0.5 s (~ 7 %)• Tm02 (stepgauge) Tm02(pressure) – 0.5 s (~11 %)
30 June 2015 17
3. Case study II: wave measurements in the surf zone
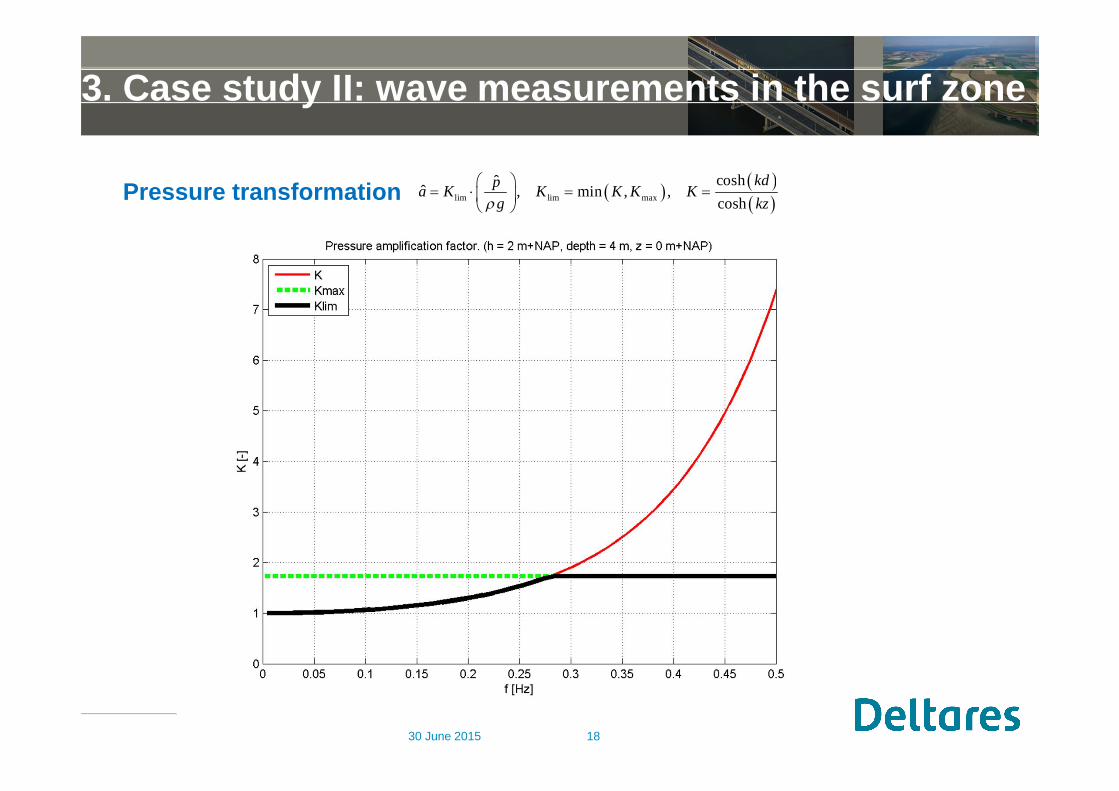
Pressure transformation lim lim max
coshˆˆ , min , ,cosh
kdpa K K K K Kg kz
30 June 2015 18
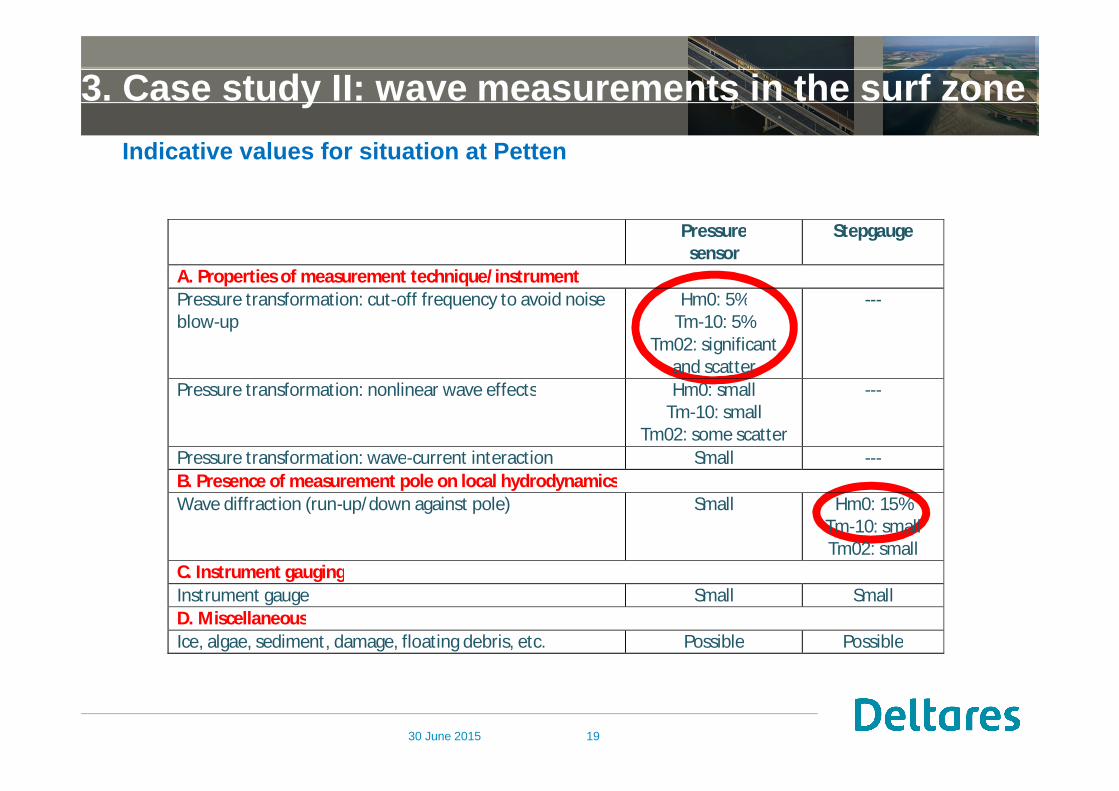
3. Case study II: wave measurements in the surf zoneIndicative values for situation at Petten
30 June 2015 19
Pressuresensor
Stepgauge
A. Properties of measurement technique/instrumentPressure transformation: cut-off frequency to avoid noiseblow-up
Hm0: 5%Tm-10: 5%
Tm02: significantand scatter
---
Pressure transformation: nonlinear wave effects Hm0: smallTm-10: small
Tm02: some scatter
---
Pressure transformation: wave-current interaction Small ---B. Presence of measurement pole on local hydrodynamicsWave diffraction (run-up/down against pole) Small Hm0: 15%
Tm-10: smallTm02: small
C. Instrument gaugingInstrument gauge Small SmallD. MiscellaneousIce, algae, sediment, damage, floating debris, etc. Possible Possible
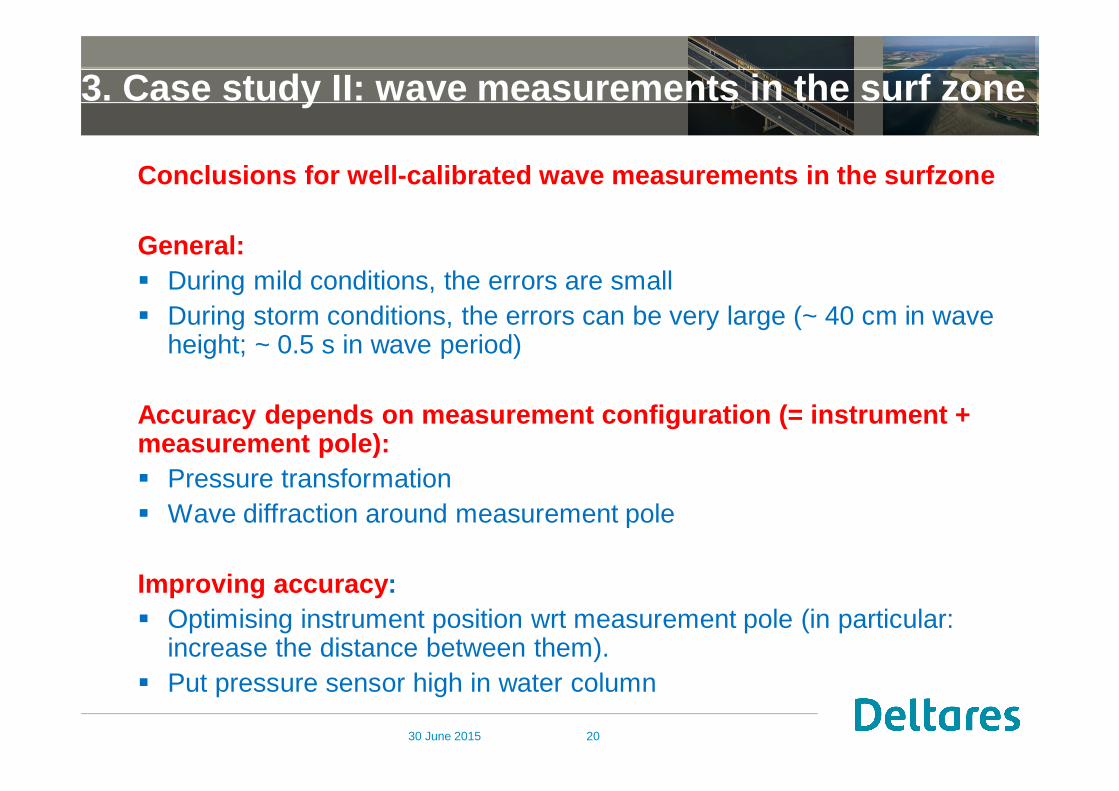
Conclusions for well-calibrated wave measurements in the surfzone
General:During mild conditions, the errors are smallDuring storm conditions, the errors can be very large (~ 40 cm in waveheight; ~ 0.5 s in wave period)
Accuracy depends on measurement configuration (= instrument +measurement pole):
Pressure transformationWave diffraction around measurement pole
Improving accuracy:Optimising instrument position wrt measurement pole (in particular:increase the distance between them).Put pressure sensor high in water column
30 June 2015
3. Case study II: wave measurements in the surf zone
20
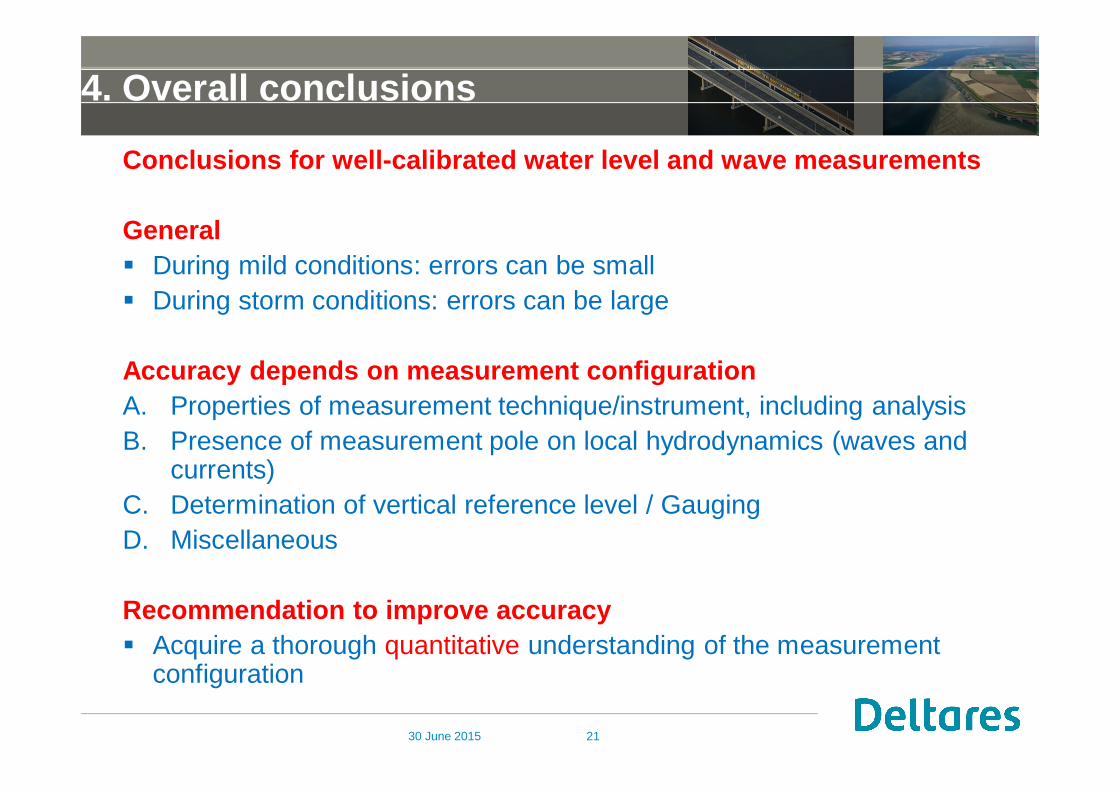
Conclusions for well-calibrated water level and wave measurements
GeneralDuring mild conditions: errors can be smallDuring storm conditions: errors can be large
Accuracy depends on measurement configurationA. Properties of measurement technique/instrument, including analysisB. Presence of measurement pole on local hydrodynamics (waves and
currents)C. Determination of vertical reference level / GaugingD. Miscellaneous
Recommendation to improve accuracyAcquire a thorough quantitative understanding of the measurementconfiguration
30 June 2015
4. Overall conclusions
21
Thank you
30 June 2015 22