Embed Size (px)
Citation preview
IAG results presentation
Quarter Three 2019
31 October 2019

Highlights
Willie Walsh, Chief Executive Officer
3
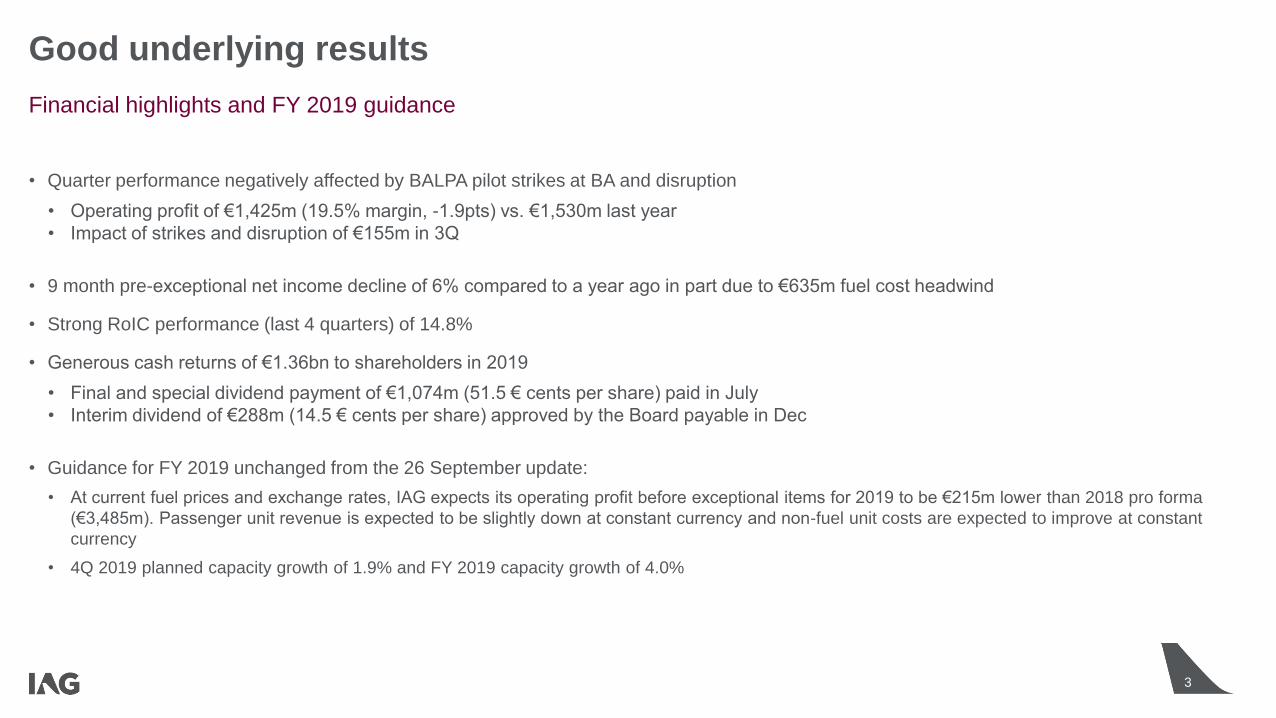
Good underlying results
• Quarter performance negatively affected by BALPA pilot strikes at BA and disruption
• Operating profit of €1,425m (19.5% margin, -1.9pts) vs. €1,530m last year
• Impact of strikes and disruption of €155m in 3Q
• 9 month pre-exceptional net income decline of 6% compared to a year ago in part due to €635m fuel cost headwind
• Strong RoIC performance (last 4 quarters) of 14.8%
• Generous cash returns of €1.36bn to shareholders in 2019
• Final and special dividend payment of €1,074m (51.5 € cents per share) paid in July
• Interim dividend of €288m (14.5 € cents per share) approved by the Board payable in Dec
• Guidance for FY 2019 unchanged from the 26 September update:
• At current fuel prices and exchange rates, IAG expects its operating profit before exceptional items for 2019 to be €215m lower than 2018 pro forma
(€3,485m). Passenger unit revenue is expected to be slightly down at constant currency and non-fuel unit costs are expected to improve at constant
currency
• 4Q 2019 planned capacity growth of 1.9% and FY 2019 capacity growth of 4.0%
Financial highlights and FY 2019 guidance

Financial results
Steve Gunning, Chief Financial Officer
5
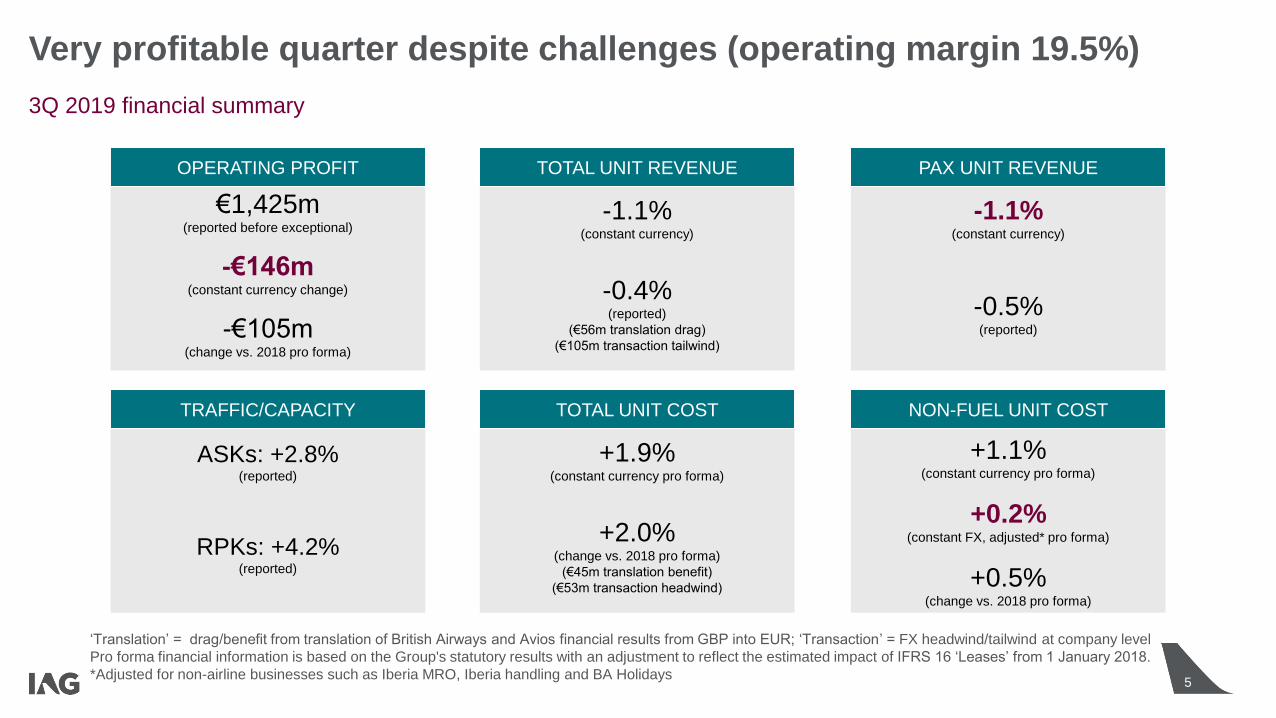
Very profitable quarter despite challenges (operating margin 19.5%)
3Q 2019 financial summary
ASKs: +2.8%(reported)
RPKs: +4.2%(reported)
TRAFFIC/CAPACITY
€1,425m(reported before exceptional)
-€146m(constant currency change)
-€105m(change vs. 2018 pro forma)
OPERATING PROFIT
-1.1%(constant currency)
-0.5%(reported)
PAX UNIT REVENUE
+1.1%(constant currency pro forma)
+0.2%(constant FX, adjusted* pro forma)
+0.5%(change vs. 2018 pro forma)
NON-FUEL UNIT COST
+1.9%(constant currency pro forma)
+2.0%(change vs. 2018 pro forma)
(€45m translation benefit)
(€53m transaction headwind)
TOTAL UNIT COST
-1.1%(constant currency)
-0.4%(reported)
(€56m translation drag)
(€105m transaction tailwind)
TOTAL UNIT REVENUE
‘Translation’ = drag/benefit from translation of British Airways and Avios financial results from GBP into EUR; ‘Transaction’ = FX headwind/tailwind at company level
Pro forma financial information is based on the Group's statutory results with an adjustment to reflect the estimated impact of IFRS 16 ‘Leases’ from 1 January 2018.
*Adjusted for non-airline businesses such as Iberia MRO, Iberia handling and BA Holidays
6
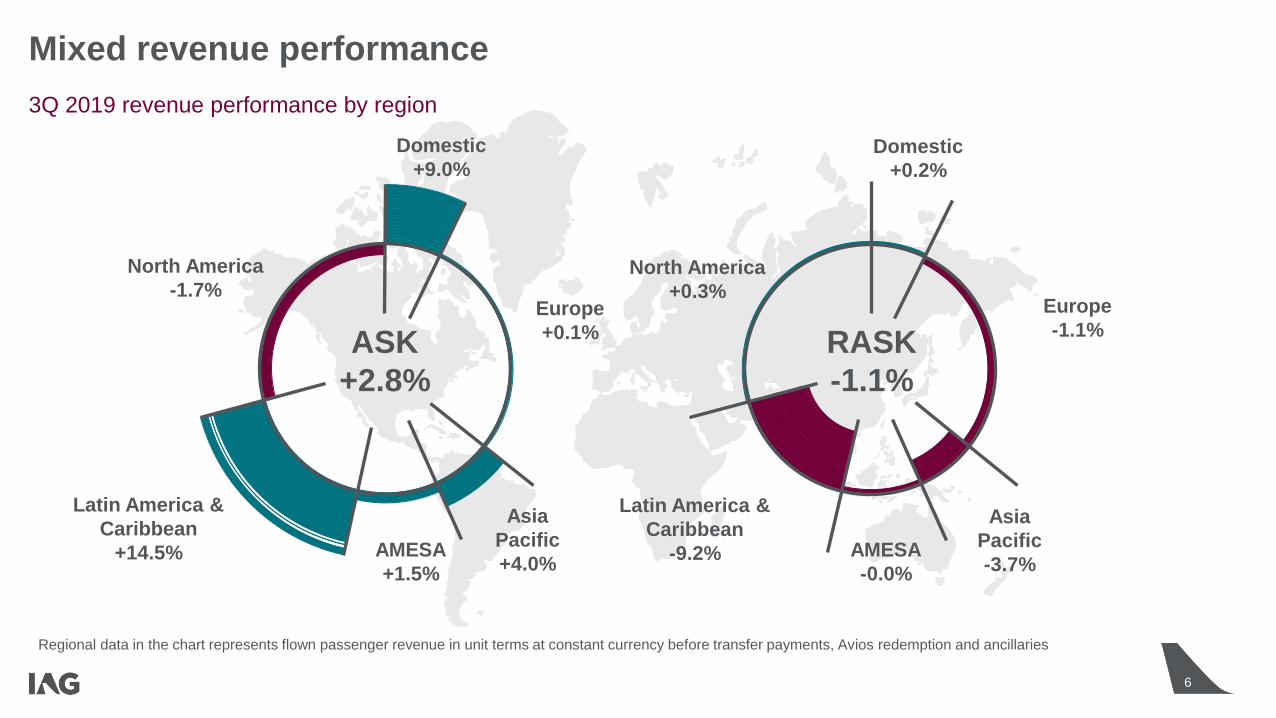
Mixed revenue performance
3Q 2019 revenue performance by region
6
Regional data in the chart represents flown passenger revenue in unit terms at constant currency before transfer payments, Avios redemption and ancillaries
Asia
Pacific
+4.0%
Europe
+0.1%
Latin America &
Caribbean
+14.5% AMESA
+1.5%
North America
-1.7%
Domestic
+9.0%
ASK
+2.8%
RASK
-1.1%
Europe
-1.1%
Asia
Pacific
-3.7%AMESA
-0.0%
Latin America &
Caribbean
-9.2%
North America
+0.3%
Domestic
+0.2%
7
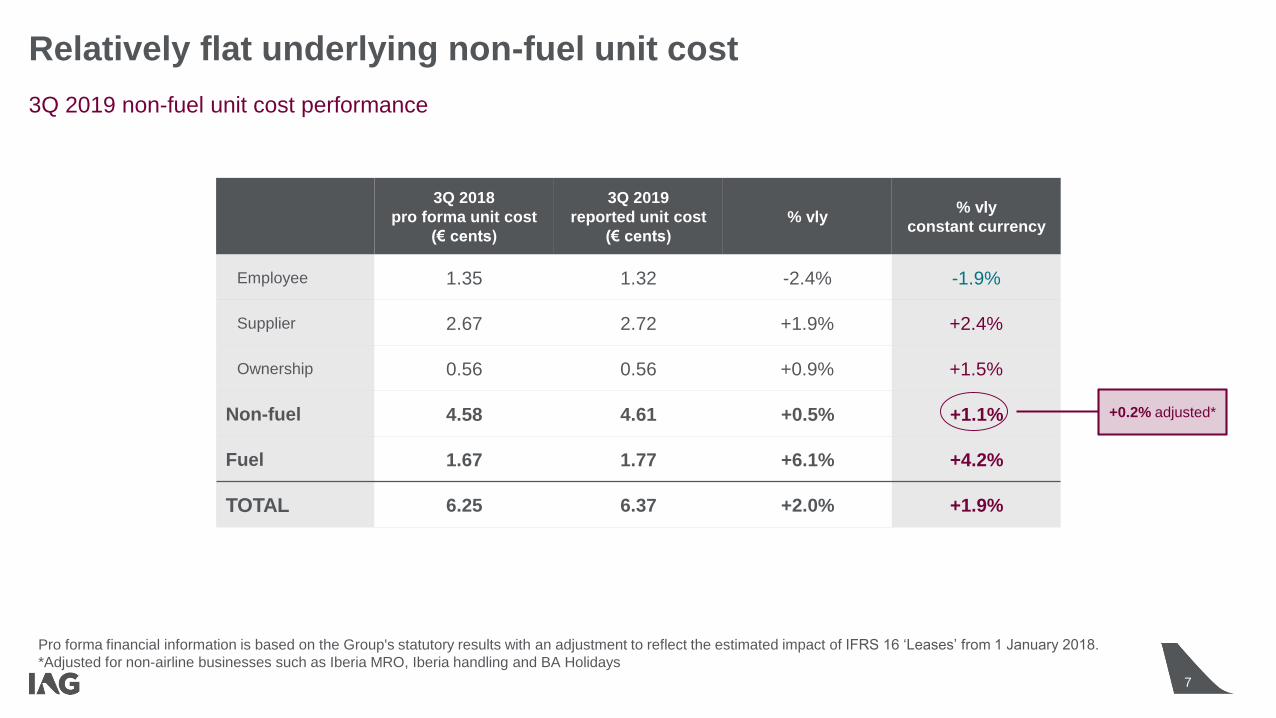
Relatively flat underlying non-fuel unit cost
3Q 2019 non-fuel unit cost performance
3Q 2018
pro forma unit cost
(€ cents)
3Q 2019
reported unit cost
(€ cents)
% vly% vly
constant currency
Employee 1.35 1.32 -2.4% -1.9%
Supplier 2.67 2.72 +1.9% +2.4%
Ownership 0.56 0.56 +0.9% +1.5%
Non-fuel 4.58 4.61 +0.5% +1.1%
Fuel 1.67 1.77 +6.1% +4.2%
TOTAL 6.25 6.37 +2.0% +1.9%
+0.2% adjusted*
Pro forma financial information is based on the Group's statutory results with an adjustment to reflect the estimated impact of IFRS 16 ‘Leases’ from 1 January 2018.
*Adjusted for non-airline businesses such as Iberia MRO, Iberia handling and BA Holidays
8
$580
$590
$600
$610
$620
$630
$640
$650
Q4-19 Q1-20 Q2-20 Q3-20 Q4-20 Q1-21
$+1.1%
76% 56%96% 87% 65%
$-3.1%$-3.5%
$-2.6%€+8.6%
€-0.2% €-1.5%
€-1.5%
€-3.4%
45%
€-0.6%
$-1.0%
$-3.4%
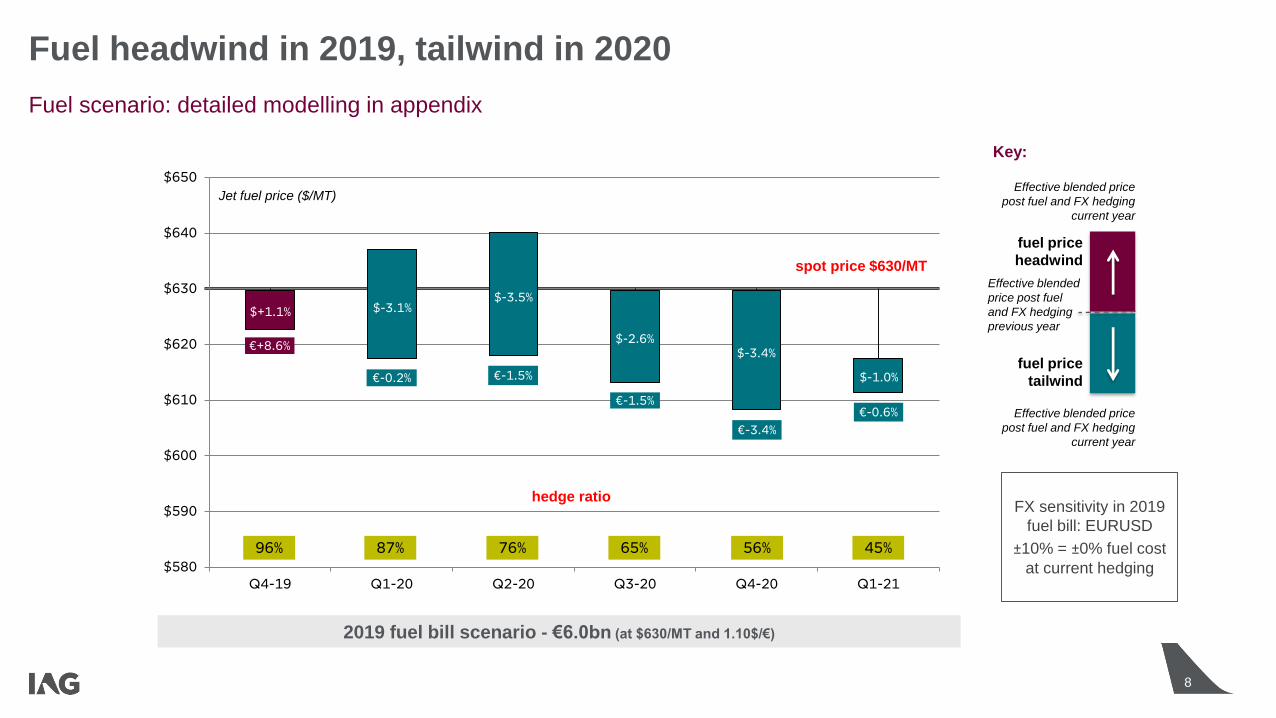
Fuel headwind in 2019, tailwind in 2020
Fuel scenario: detailed modelling in appendix
Key:
fuel price
headwind
fuel price
tailwind
Effective blended price
post fuel and FX hedging
current year
Effective blended
price post fuel
and FX hedging
previous year
Effective blended price
post fuel and FX hedging
current year
FX sensitivity in 2019
fuel bill: EURUSD
±10% = ±0% fuel cost
at current hedging
Jet fuel price ($/MT)
2019 fuel bill scenario - €6.0bn (at $630/MT and 1.10$/€)
spot price $630/MT
hedge ratio
9
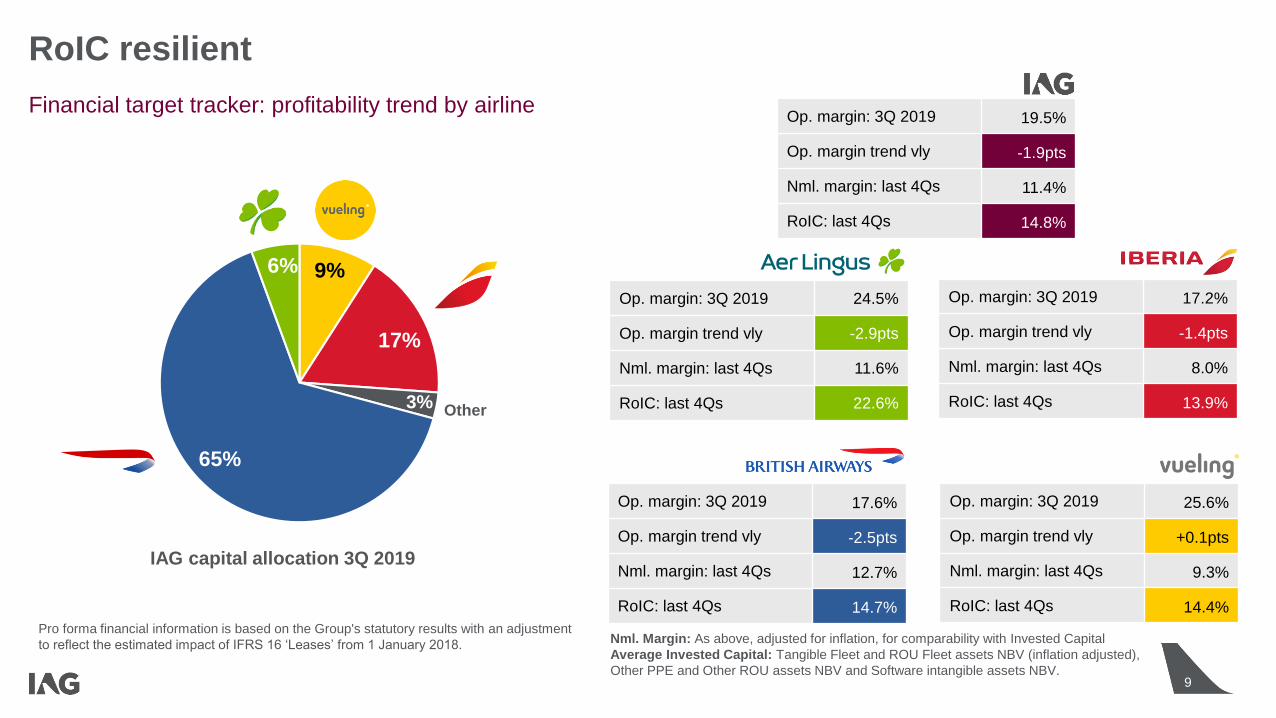
RoIC resilient
Financial target tracker: profitability trend by airline
Op. margin: 3Q 2019 24.5%
Op. margin trend vly -2.9pts
Nml. margin: last 4Qs 11.6%
RoIC: last 4Qs 22.6%
9%
17%
3%
65%
6%
IAG capital allocation 3Q 2019
Other
Op. margin: 3Q 2019 25.6%
Op. margin trend vly +0.1pts
Nml. margin: last 4Qs 9.3%
RoIC: last 4Qs 14.4%
Op. margin: 3Q 2019 17.2%
Op. margin trend vly -1.4pts
Nml. margin: last 4Qs 8.0%
RoIC: last 4Qs 13.9%
Op. margin: 3Q 2019 17.6%
Op. margin trend vly -2.5pts
Nml. margin: last 4Qs 12.7%
RoIC: last 4Qs 14.7%
Op. margin: 3Q 2019 19.5%
Op. margin trend vly -1.9pts
Nml. margin: last 4Qs 11.4%
RoIC: last 4Qs 14.8%
Pro forma financial information is based on the Group's statutory results with an adjustment
to reflect the estimated impact of IFRS 16 ‘Leases’ from 1 January 2018. Nml. Margin: As above, adjusted for inflation, for comparability with Invested Capital
Average Invested Capital: Tangible Fleet and ROU Fleet assets NBV (inflation adjusted),
Other PPE and Other ROU assets NBV and Software intangible assets NBV.
10
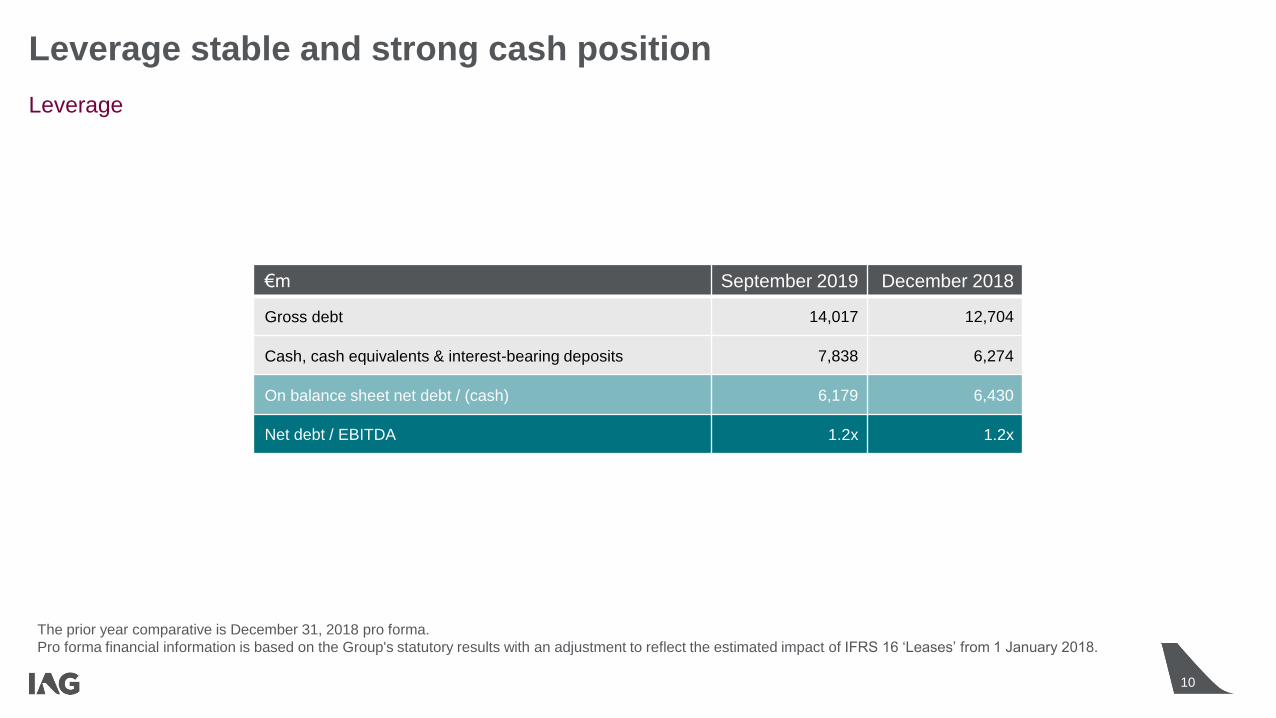
Leverage stable and strong cash position
Leverage
10
€m September 2019 December 2018
Gross debt 14,017 12,704
Cash, cash equivalents & interest-bearing deposits 7,838 6,274
On balance sheet net debt / (cash) 6,179 6,430
Net debt / EBITDA 1.2x 1.2x
The prior year comparative is December 31, 2018 pro forma.
Pro forma financial information is based on the Group's statutory results with an adjustment to reflect the estimated impact of IFRS 16 ‘Leases’ from 1 January 2018.
11
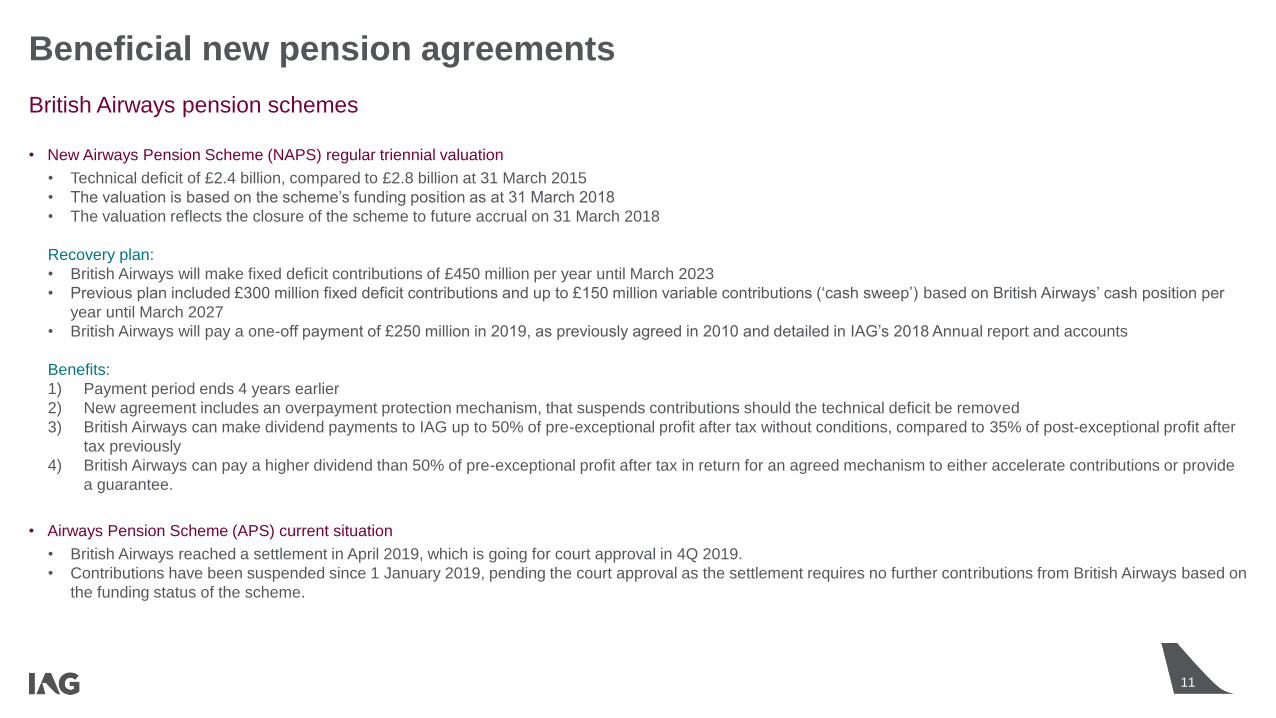
Beneficial new pension agreements
British Airways pension schemes
• New Airways Pension Scheme (NAPS) regular triennial valuation
• Technical deficit of £2.4 billion, compared to £2.8 billion at 31 March 2015
• The valuation is based on the scheme’s funding position as at 31 March 2018
• The valuation reflects the closure of the scheme to future accrual on 31 March 2018
Recovery plan:
• British Airways will make fixed deficit contributions of £450 million per year until March 2023
• Previous plan included £300 million fixed deficit contributions and up to £150 million variable contributions (‘cash sweep’) based on British Airways’ cash position per
year until March 2027
• British Airways will pay a one-off payment of £250 million in 2019, as previously agreed in 2010 and detailed in IAG’s 2018 Annual report and accounts
Benefits:
1) Payment period ends 4 years earlier
2) New agreement includes an overpayment protection mechanism, that suspends contributions should the technical deficit be removed
3) British Airways can make dividend payments to IAG up to 50% of pre-exceptional profit after tax without conditions, compared to 35% of post-exceptional profit after
tax previously
4) British Airways can pay a higher dividend than 50% of pre-exceptional profit after tax in return for an agreed mechanism to either accelerate contributions or provide
a guarantee.
• Airways Pension Scheme (APS) current situation
• British Airways reached a settlement in April 2019, which is going for court approval in 4Q 2019.
• Contributions have been suspended since 1 January 2019, pending the court approval as the settlement requires no further contributions from British Airways based on
the funding status of the scheme.

Outlook
Willie Walsh, Chief Executive Officer
13
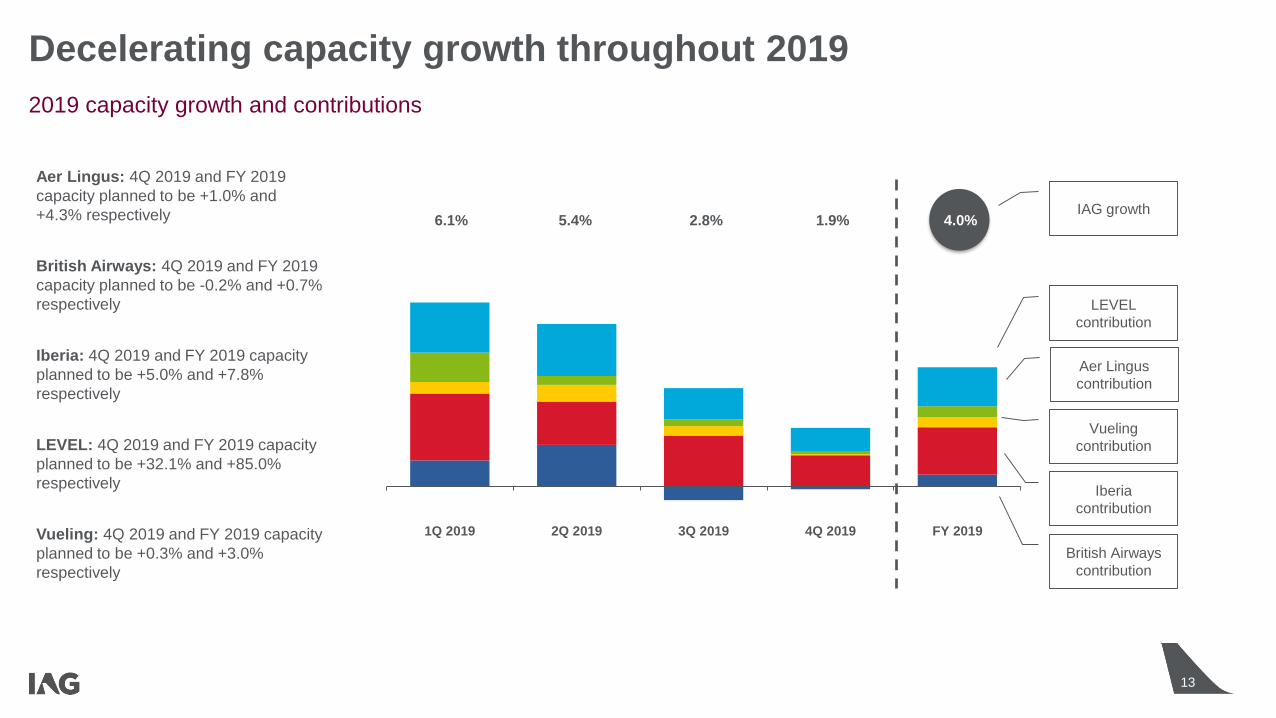
1Q 2019 2Q 2019 3Q 2019 4Q 2019 FY 2019
6.1% 5.4% 2.8% 1.9%
Decelerating capacity growth throughout 2019
Aer Lingus: 4Q 2019 and FY 2019
capacity planned to be +1.0% and
+4.3% respectively
British Airways: 4Q 2019 and FY 2019
capacity planned to be -0.2% and +0.7%
respectively
Iberia: 4Q 2019 and FY 2019 capacity
planned to be +5.0% and +7.8%
respectively
LEVEL: 4Q 2019 and FY 2019 capacity
planned to be +32.1% and +85.0%
respectively
Vueling: 4Q 2019 and FY 2019 capacity
planned to be +0.3% and +3.0%
respectively
4.0%
British Airways
contribution
Iberia
contribution
Vueling
contribution
Aer Lingus
contribution
IAG growth
LEVEL
contribution
2019 capacity growth and contributions
14
Guidance unchanged for FY2019 from the 26 September update
At current fuel prices and exchange rates, IAG expects its 2019 operating profit before exceptional items to be €215
million lower than 2018 pro forma (€3,485 million). Passenger unit revenue is expected to be slightly down at constant
currency and non-fuel unit costs are expected to improve at constant currency.

Appendices
16
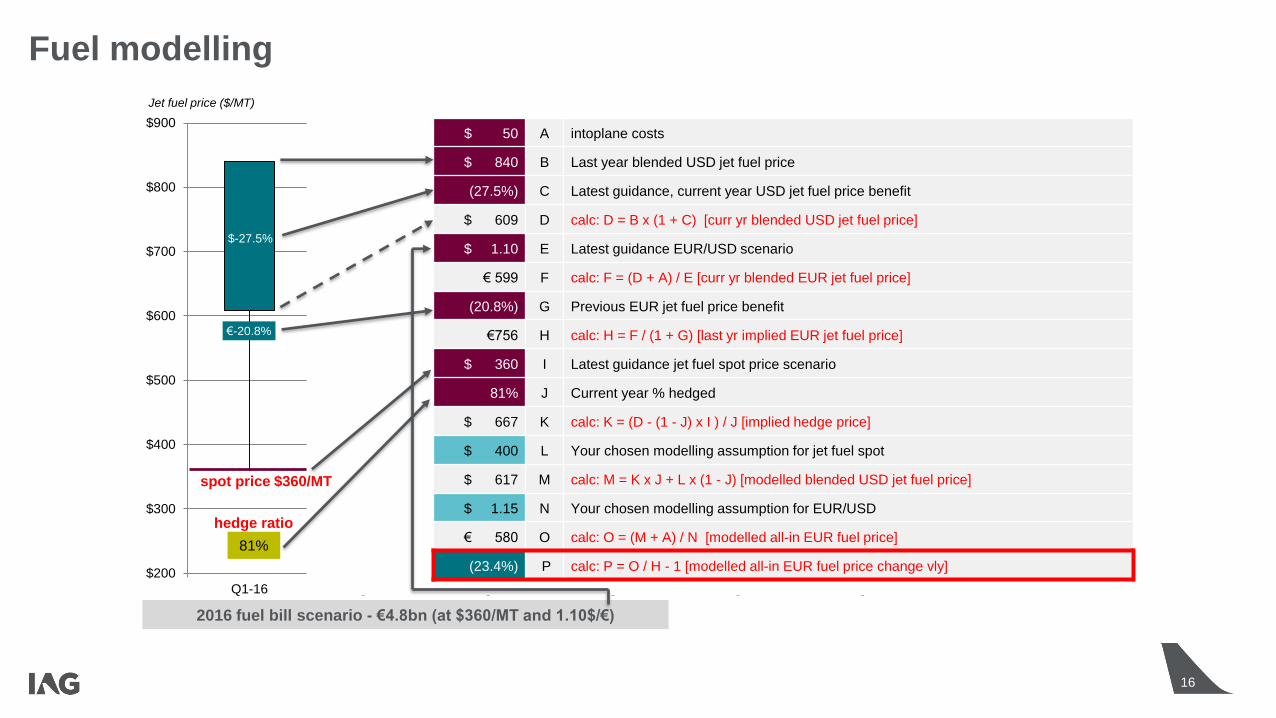
Fuel modelling
$200
$300
$400
$500
$600
$700
$800
$900
Q1-16 Q2-16 Q3-16 Q4-16 Q1-17 Q2-17
$-27.5%
61% 40%81% 76% 52%
$-31.1%
$-30.4%
$-34.5%
$-29.9%
€-20.8%
€-30.1%
€-26.6%
€-32.8%
€-28.1%
36%
€-23.5%
$-25.4%
2016 fuel bill scenario - €4.8bn (at $360/MT and 1.10$/€)
Jet fuel price ($/MT)
$ 50 A intoplane costs
$ 840 B Last year blended USD jet fuel price
(27.5%) C Latest guidance, current year USD jet fuel price benefit
$ 609 D calc: D = B x (1 + C) [curr yr blended USD jet fuel price]
$ 1.10 E Latest guidance EUR/USD scenario
€ 599 F calc: F = (D + A) / E [curr yr blended EUR jet fuel price]
(20.8%) G Previous EUR jet fuel price benefit
€756 H calc: H = F / (1 + G) [last yr implied EUR jet fuel price]
$ 360 I Latest guidance jet fuel spot price scenario
81% J Current year % hedged
$ 667 K calc: K = (D - (1 - J) x I ) / J [implied hedge price]
$ 400 L Your chosen modelling assumption for jet fuel spot
$ 617 M calc: M = K x J + L x (1 - J) [modelled blended USD jet fuel price]
$ 1.15 N Your chosen modelling assumption for EUR/USD
€ 580 O calc: O = (M + A) / N [modelled all-in EUR fuel price]
(23.4%) P calc: P = O / H - 1 [modelled all-in EUR fuel price change vly]
spot price $360/MT
hedge ratio
17
Disclaimer
Forward-looking statements:
Certain statements included in this announcement are forward-looking. These statements can be identified by the fact that they do not relate only to historical or current
facts. By their nature, they involve risk and uncertainties because they relate to events and depend on circumstances that will occur in the future. Actual results could differ
materially from those expressed or implied by such forward-looking statements.
Forward-looking statements can typically be identified by the use of words such as “expects”, “may”, “will”, “could”, “should”, “intends”, “plans”, “predicts”, “envisages” or
“anticipates” or other words of similar meaning. They include, without limitation, any and all projections relating to the results of operations and financial conditions of
International Consolidated Airlines Group S.A. and its subsidiary undertakings from time to time (the ‘Group’), as well as plans and objectives for future operations, expected
future revenues, financing plans, expected expenditure and divestments relating to the Group and discussions of the Group’s business plan. All forward-looking statements in
this announcement are based upon information known to the Group on the date of this announcement and speak as of the date of this announcement. Other than in
accordance with its legal or regulatory obligations, the Group does not undertake to update or revise any forward-looking statement to reflect any changes in events,
conditions or circumstances on which any such statement is based.
It is not reasonably possible to itemise all of the many factors and specific events that could cause the forward-looking statements in this announcement to be incorrect or
that could otherwise have a material adverse effect on the future operations or results of an airline operating in the global economy. Further information on the primary risks
of the business and the Group’s risk management process is set out in the ‘Risk management and principal risk factors’ section in the Annual Report and Accounts 2018;
these documents are available on www.iagshares.com. All forward-looking statements made on or after the date of this document and attributable to IAG are expressly
qualified in their entirety by the primary risks set out in that section.