Embed Size (px)
Citation preview

International Atomic Energy AgencyVienna
ISBN 978–92–0–110014–6ISSN 1011–4289
Root Cause Analysis Following an Event at a N
uclear Installation: Reference Manual
IAEA-TECDOC-1756
Root Cause AnalysisFollowing an Event at a Nuclear Installation:Reference Manual
@
IAEA-TECDOC-1756
IAEA-TECDOC-1756
IAEA TECDOC SERIES

IAEA SAFETY STANDARDS AND RELATED PUBLICATIONS
IAEA SAFETY STANDARDS
Under the terms of Article III of its Statute, the IAEA is authorized to establish or adopt standards of safety for protection of health and minimization of danger to life and property, and to provide for the application of these standards.
The publications by means of which the IAEA establishes standards are issued in the IAEA Safety Standards Series. This series covers nuclear safety, radiation safety, transport safety and waste safety. The publication categories in the series are Safety Fundamentals,Safety Requirements and Safety Guides.
Information on the IAEAs safety standards programme is available at the IAEA Internet site
http://www-ns.iaea.org/standards/
The site provides the texts in English of published and draft safety standards. The texts of safety standards issued in Arabic, Chinese, French, Russian and Spanish, the IAEA Safety Glossary and a status report for safety standards under development are also available. For further information, please contact the IAEA at PO Box 100, 1400 Vienna, Austria.
All users of IAEA safety standards are invited to inform the IAEA of experience in their use (e.g. as a basis for national regulations, for safety reviews and for training courses) for the purpose of ensuring that they continue to meet users needs. Information may be provided via the IAEA Internet site or by post, as above, or by email to [email protected].
RELATED PUBLICATIONS
The IAEA provides for the application of the standards and, under the terms of Articles III and VIII.C of its Statute, makes available and fosters the exchange of information relating to peaceful nuclear activities and serves as an intermediary among its Member States for this purpose.
Reports on safety and protection in nuclear activities are issued as Safety Reports, which provide practical examples and detailed methods that can be used in support of the safety standards.
Other safety related IAEA publications are issued as Radiological Assessment Reports, the International Nuclear Safety Groups INSAG Reports, Technical Reports and TECDOCs. The IAEA also issues reports on radiological accidents, training manuals and practical manuals, and other special safety related publications.
Security related publications are issued in the IAEA Nuclear Security Series.The IAEA Nuclear Energy Series consists of reports designed to encourage and assist
research on, and development and practical application of, nuclear energy for peaceful uses. The information is presented in guides, reports on the status of technology and advances, and best practices for peaceful uses of nuclear energy. The series complements the IAEAs safety standards, and provides detailed guidance, experience, good practices and examples in the areas of nuclear power, the nuclear fuel cycle, radioactive waste management and decommissioning.

ROOT CAUSE ANALYSISFOLLOWING AN EVENT AT A
NUCLEAR INSTALLATION:REFERENCE MANUAL

AFGHANISTANALBANIAALGERIAANGOLAARGENTINAARMENIAAUSTRALIAAUSTRIAAZERBAIJANBAHAMASBAHRAINBANGLADESHBELARUSBELGIUMBELIZEBENINBOLIVIABOSNIA AND HERZEGOVINABOTSWANABRAZILBRUNEI DARUSSALAMBULGARIABURKINA FASOBURUNDICAMBODIACAMEROONCANADACENTRAL AFRICAN
REPUBLICCHADCHILECHINACOLOMBIACONGOCOSTA RICACÔTE D’IVOIRECROATIACUBACYPRUSCZECH REPUBLICDEMOCRATIC REPUBLIC
OF THE CONGODENMARKDOMINICADOMINICAN REPUBLICECUADOREGYPTEL SALVADORERITREAESTONIAETHIOPIAFIJIFINLANDFRANCEGABONGEORGIAGERMANY
GHANAGREECEGUATEMALAHAITIHOLY SEEHONDURASHUNGARYICELANDINDIAINDONESIAIRAN, ISLAMIC REPUBLIC OF IRAQIRELANDISRAELITALYJAMAICAJAPANJORDANKAZAKHSTANKENYAKOREA, REPUBLIC OFKUWAITKYRGYZSTANLAO PEOPLE’S DEMOCRATIC
REPUBLICLATVIALEBANONLESOTHOLIBERIALIBYALIECHTENSTEINLITHUANIALUXEMBOURGMADAGASCARMALAWIMALAYSIAMALIMALTAMARSHALL ISLANDSMAURITANIA, ISLAMIC
REPUBLIC OFMAURITIUSMEXICOMONACOMONGOLIAMONTENEGROMOROCCOMOZAMBIQUEMYANMARNAMIBIANEPALNETHERLANDSNEW ZEALANDNICARAGUANIGERNIGERIANORWAY
OMANPAKISTANPALAUPANAMAPAPUA NEW GUINEAPARAGUAYPERUPHILIPPINESPOLANDPORTUGALQATARREPUBLIC OF MOLDOVAROMANIARUSSIAN FEDERATIONRWANDASAN MARINOSAUDI ARABIASENEGALSERBIASEYCHELLESSIERRA LEONESINGAPORESLOVAKIASLOVENIASOUTH AFRICASPAINSRI LANKASUDANSWAZILANDSWEDENSWITZERLANDSYRIAN ARAB REPUBLICTAJIKISTANTHAILANDTHE FORMER YUGOSLAV
REPUBLIC OF MACEDONIATOGOTRINIDAD AND TOBAGOTUNISIATURKEYUGANDAUKRAINEUNITED ARAB EMIRATESUNITED KINGDOM OF
GREAT BRITAIN AND NORTHERN IRELAND
UNITED REPUBLICOF TANZANIA
UNITED STATES OF AMERICAURUGUAYUZBEKISTANVENEZUELA, BOLIVARIAN
REPUBLIC OFVIET NAMYEMENZAMBIAZIMBABWE
The following States are Members of the International Atomic Energy Agency:
The Agency’s Statute was approved on 23 October 1956 by the Conference on the Statute of the IAEA held at United Nations Headquarters, New York; it entered into force on 29 July 1957. The Headquarters of the Agency are situated in Vienna. Its principal objective is “to accelerate and enlarge the contribution of atomic energy to peace, health and prosperity throughout the world’’.

IAEA-TECDOC-1756
ROOT CAUSE ANALYSIS FOLLOWING AN EVENT AT A
NUCLEAR INSTALLATION: REFERENCE MANUAL
INTERNATIONAL ATOMIC ENERGY AGENCYVIENNA, 2015

COPYRIGHT NOTICE
All IAEA scientific and technical publications are protected by the terms of the Universal Copyright Convention as adopted in 1952 (Berne) and as revised in 1972 (Paris). The copyright has since been extended by the World Intellectual Property Organization (Geneva) to include electronic and virtual intellectual property. Permission to use whole or parts of texts contained in IAEA publications in printed or electronic form must be obtained and is usually subject to royalty agreements. Proposals for non-commercial reproductions and translations are welcomed and considered on a case-by-case basis. Enquiries should be addressed to the IAEA Publishing Section at:
Marketing and Sales Unit, Publishing SectionInternational Atomic Energy AgencyVienna International CentrePO Box 1001400 Vienna, Austriafax: +43 1 2600 29302tel.: +43 1 2600 22417email: [email protected] http://www.iaea.org/books
For further information on this publication, please contact:
Operational Safety SectionInternational Atomic Energy Agency
Vienna International CentrePO Box 100
1400 Vienna, AustriaEmail: [email protected]
© IAEA, 2015Printed by the IAEA in Austria
January 2015
IAEA Library Cataloguing in Publication Data
Root cause analysis following an event at a nuclear installation : reference manual. — Vienna : International Atomic Energy Agency, 2014. p. ; 30 cm. — (IAEA-TECDOC series, ISSN 1011–4289 ; no. 1756) ISBN 978–92–0–110014–6 Includes bibliographical references.
1. Nuclear facilities — Safety measures. 2. Root cause analysis. 3. Failure analysis (Engineering). I. International Atomic Energy Agency. II. Series.
IAEAL 14–00947

FOREWORD
Following an event at a nuclear installation, it is important to determine accurately its root causes so that effective corrective actions can be implemented. As stated in IAEA Safety Standards Series No. SF-1, Fundamental Safety Principles: “Processes must be put in place for the feedback and analysis of operating experience”. If this process is completed effectively, the probability of a similar event occurring is significantly reduced. Guidance on how to establish and implement such a process is given in IAEA Safety Standards Series No. NS-G-2.11, A System for the Feedback of Experience from Events in Nuclear Installations.
To cater for the diverse nature of operating experience events, several different root cause analysis (RCA) methodologies and techniques have been developed for effective investigation and analysis. An event here is understood as any unanticipated sequence of occurrences that results in, or potentially results in, consequences to plant operation and safety.
RCA is not a topic uniquely relevant to event investigators: knowledge of the concepts enhances the learning characteristics of the whole organization. This knowledge also makes a positive contribution to nuclear safety and helps to foster a culture of preventing event occurrence.
This publication allows organizations to deepen their knowledge of these methodologies and techniques and also provides new organizations with a broad overview of the RCA process. It is the outcome of a coordinated effort involving the participation of experts from nuclear organizations, the energy industry and research centres in several Member States. This publication also complements IAEA Services Series No. 10, PROSPER Guidelines: Guidelines for Peer Review and for Plant Self-Assessment of Operational Experience Feedback Process, and is intended to form part of a suite of publications developing the principles set forth in these guidelines.
In addition to the information and description of RCA methodologies provided in this publication, available user manuals for RCA methodologies have been provided in the accompanying CD-ROM.
The IAEA wishes to thank all participants and their Member States for their valuable contribution. The IAEA officer responsible for the preparation of this publication was M. Caldoro from the Division of Nuclear Installation Safety.

EDITORIAL NOTE
This publication has been prepared from the original material as submitted by the contributors and has not been edited by the editorial staff of the IAEA. The views expressed remain the responsibility of the contributors and do not necessarily represent the views of the IAEA or its Member States.
Neither the IAEA nor its Member States assume any responsibility for consequences which may arise from the use of this publication. This publication does not address questions of responsibility, legal or otherwise, for acts or omissions on the part of any person.
The use of particular designations of countries or territories does not imply any judgement by the publisher, the IAEA, as to the legal status of such countries or territories, of their authorities and institutions or of the delimitation of their boundaries.
The mention of names of specific companies or products (whether or not indicated as registered) does not imply any intention to infringe proprietary rights, nor should it be construed as an endorsement or recommendation on the part of the IAEA.
The IAEA has no responsibility for the persistence or accuracy of URLs for external or third party Internet web sites referred to in this publication and does not guarantee that any content on such web sites is, or will remain, accurate or appropriate.

CONTENTS
1. INTRODUCTION ......................................................................................................... 1
1.1. Background ..................................................................................................... 1
1.2. Objective and Scope ........................................................................................ 1
1.3. Structure .......................................................................................................... 2
2. TYPICAL EVENT INVESTIGATION PROCESS ........................................................ 2
2.1. Purpose ............................................................................................................ 2
2.2. Prerequisites for Successful Event Investigation............................................... 2
2.3. Root Causes Analysis Process Description ....................................................... 3
2.3.1. Initiating a root cause investigation ....................................................... 3
2.3.2. Perform the investigation ...................................................................... 4
2.3.3. Preservation of the evidence ................................................................. 4
2.3.4. Selecting the proper root cause investigation team ................................ 4
2.3.5. Terms of reference for root cause analysis ............................................ 5
2.3.6. Investigation preparation ...................................................................... 6
2.3.7. Investigation performance .................................................................... 6
2.3.8. Review and approve the investigation ................................................. 14
3. TOOLS AND TECHNIQUES ..................................................................................... 15
3.1. Interviewing ................................................................................................... 15
3.2. Task Analysis ................................................................................................ 18
3.3. Change Analysis ............................................................................................ 19
3.4. Barrier Analysis ............................................................................................. 21
3.5. Event and Causal Factor Charting .................................................................. 22
3.6. Cause and Effect Analysis.............................................................................. 24
3.7. Fault Tree Analysis ........................................................................................ 25
3.8. Event Tree Analysis ....................................................................................... 27
3.9. The 5 Whys (Why Staircase) .......................................................................... 29
3.10. Common Cause Analysis ............................................................................... 30
3.11. Current Reality Tree ...................................................................................... 31
3.12. Failure Mode and Effects Analysis ................................................................. 34
3.13. Human Factor Investigation Tool (Human Performance) ............................... 36
3.14. Psychological and Physiological Evaluation ................................................... 38
3.15. Ergonomics Analysis ..................................................................................... 39
3.16. Kepner Tregoe Analysis ................................................................................. 40
3.17. Interrelationship Diagram (ID) ....................................................................... 41
3.18. JNES Organizational Factors List (JOFL) ...................................................... 43
4. COMPARISON OF TOOLS AND TECHNIQUES ..................................................... 45
5. METHODS ................................................................................................................. 52
5.1. Human Performance Enhancement System (HPES) ....................................... 53
5.2. Korean Human Performance Enhancement System (K-HPES) ....................... 55
5.3. Japanese Human Performance Enhancement System (J-HPES) ...................... 56
5.4. Man-Technology-Organization Investigation (MTO) ..................................... 57
5.5. Human Performance Evaluation Process (HPEP) ........................................... 58
5.6. Management Oversight and Risk Tree (MORT) ............................................. 60
5.7. Paks Root Cause Analysis Procedure (PRCAP) ............................................. 63

5.8. Safety Through Organizational Learning (SOL) ............................................. 65
5.9. Assessment of Safety Significant Events Teams (ASSET) ............................. 67
5.10. Accident Evolution and Barrier Function (AEB) ............................................ 70
5.11. Control Change Cause Analysis (3CA) .......................................................... 71
5.12. TRIPOD Beta ................................................................................................ 72
5.13. Systematic Approach For Error Reduction (SAFER) ...................................... 75
5.14. Method of Psychological Root Cause Analysis of Human Factors .................. 76
5.15. Commercial RCA Methods ............................................................................ 79
5.15.1. TapRoot® .......................................................................................... 79
5.15.2. Apollo root cause analysis .................................................................. 80
5.15.3. REASON® ........................................................................................ 81
5.15.4. PROACT® ......................................................................................... 82
APPENDIX I. EXAMPLE OF A FAILURE ANALYSIS GUIDELINE ............................... 83
APPENDIX II. EXAMPLE OF AN EQUIPMENT FAILURE WORKSHEET ..................... 84
APPENDIX III. EXAMPLE OF A LIST OF EQUIPMENT FAILURE MODES .................. 85
APPENDIX IV. EXAMPLE FOR TAXONOMY OF HUMAN FACTORS ......................... 86
APPENDIX V. HOW TO CHOOSE THE ROOT CAUSE METHOD .................................. 90
REFERENCES ..................................................................................................................... 93
ANNEX I. GENERAL TRAINING MATERIAL ................................................................. 97
ANNEX II. PT 534/535 EVENT PACKAGE ..................................................................... 121
ANNEX III. A REAL INVESTIGATION .......................................................................... 145
CONTRIBUTORS TO DRAFTING AND REVIEW .......................................................... 173
ACKNOWLEDGEMENT .................................................................................................. 175

1
1. INTRODUCTION
1.1. Background
The IAEA Safety Fundamental Publication, Fundamental Safety Principles [1] states the need for operating organizations to establish a programme for analysis of operating experience. It is recognized that there are different analysis tools, techniques and methods available which can be used to evaluate the root causes of events, including freely available as well as commercial products. Several of these different instruments are deployed in nuclear organizations around the world. Each tool, technique or method has characteristics that can make it suitable for use in particular circumstances of an event investigation. The IAEA Safety Guide NS-G-2.11, A system for the Feedback of Experience from Events in Nuclear Installations [2] states in Appendix III.14 that “Since there is no single best technique for use for all events in all States, the evaluator should select the most appropriate tool for use for the event in question, in the context of national capabilities.” Currently IAEA guidance exists which reviews some of these analysis instruments [3] however a comprehensive reference manual of tools, techniques and methods was not available up to now. Moreover, the present document is intended to complement IAEA-TECDOC-1550, Deterministic Analysis of Operational Events in Nuclear Power Plants [4] and IAEA-TECDOC-1417, Precursor Analyses [5].
1.2. Objective and Scope
The present publication is intended as a reference manual for Root Cause Analysis, providing in a single information package the most important material available on the topic or at least a direct reference to information. The overall objective of the publication is to allow benchmarking of the Root Cause Analysis tools, techniques and methods currently used in one organization, as well as to provide an objective assessment of the most appropriate tools and techniques to deploy in order to analyse events. The present manual is also intended to provide guidance to all organizations establishing a new process for Root Cause Analysis, especially in countries embarking on a nuclear power programme. This publication is mainly addressed to Operating Experience professionals working in: Nuclear Power Plants, Fuel Cycle Facilities, Research Centres, Technical Supporting Organizations and Regulatory Bodies. As the analysis of events is an important activity performed also in other industries, additional organizations could also benefit from it. It is not the intent of this publication to address the different levels of investigation performed in a nuclear power plant, nor to give extensive indications on corrective actions implementation. The reader is referred to IAEA-TECDOC-1581, Best Practices in Identifying, Reporting and Screening Operating Experience at Nuclear Power Plants [6],

2
IAEA-TECDOC-1600, Best Practices in the Organization, Management and Conduct of an Effective Investigation of Events at Nuclear Power Plants [7] and IAEA-TECDOC-1458, Effective Corrective Actions to Enhance Operational Safety of Nuclear Installations [8] for more information on these topics.
1.3. Structure
The present publication is divided in three parts.
• Sections 1-5 and Appendices I-V: Conduct of a Root Cause Analysis. This part includes: a description of the event investigation process, a description of the different tools, techniques and methods, and a comparison of tools and techniques;
• Annexes I-III: Training Material. This part includes: training for specific techniques, training for a complete event investigation, and examples of real investigations;
• CD-ROM: User Manuals for Methods. This part includes specific user manuals of Root Cause Analysis methods.
The first two parts are presented in this volume; the material of third part is presented in the CD-ROM attached to the inside back-cover of this document. The description of the event investigation process is based on the actual process in place at some of the best performing Nuclear Power Plants (NPPs). The tools, techniques and methods presented are the most commonly used for Root Cause Analysis (RCA), and they are currently used by the international community of nuclear operators and regulators. Other commercial RCA methods are available, which are specialized for other industries and situations, but have not been taken into account. For the description of these RCA instruments, extensive use was made of the Technical Report ‘Comparative analysis of nuclear event investigation methods, tools and techniques’ [9] prepared by the Joint Research Centre of the European Commission.
2. TYPICAL EVENT INVESTIGATION PROCESS
2.1. Purpose
To provide guidance on how to effectively conduct a comprehensive event investigation using Root Cause Analysis, and develop appropriate corrective actions with the purpose of preventing or reducing the probability of similar events occurring in the future.
2.2. Prerequisites for Successful Event Investigation
Prerequisites for event investigations should be in place in every organization. They include (but are not limited to):
• Management procedures, defining principles and organization of event investigations, roles, duties and responsibilities of participating personnel, threshold for performing RCA, etc.;

3
• A permanent structure, responsible for initiating and performing event investigation, reviewing and approving its results (e.g. Event Review Board - The management group that reviews and approves the final significant event reports and authorizes subsequent actions);
• Experienced root cause investigators proficient in the use of an internationally recognized Root Cause Analysis method and tools. (see Appendix V for guidance on selection of a method).
2.3. Root Causes Analysis Process Description
Following an event, a Condition Report (CR) should be initiated. After event screening, a decision is made to initiate a root cause investigation if appropriate. (The Event Screening Meeting is conducted by the management group that reviews the condition report and approves significance and subsequent actions (investigation level). The root cause investigation process consists of the following steps:
• Initiate an investigation; • Perform and document an investigation; • Review and Approve the investigation report.
2.3.1. Initiating a root cause investigation
Root cause investigations are initiated in response to significant issues or events as determined by the Event Screening Meeting or as specified by a Facility Manager, in accordance with organization’s procedures that define facility specific threshold. Typically the decision is based on real or potential consequences of the event and the uncertainty of the cause (uncertainty is based on whether the cause is known or not at the time of the event). For examples see Figure 1, Appendix V and references [3] and [6].) At this time, a Sponsoring Manager should be assigned for ownership of the root cause investigation. In addition:
• The event response should be performed in accordance with applicable procedure; • Root cause investigations should have a completion date (typically 28 days) from the
date of the Event Screening Meeting screening; • Extensions of root cause investigations should only be granted by the Event Review
Board.
FIG. 1. Decision Matrix.
Uncertainty
High Medium Low
High Root Cause Root Cause Apparent Cause
Medium Root Cause Apparent Cause Corrective
Actions Only
Low Apparent Cause Corrective
Actions Only
Corrective
Actions Only
/Close to Trend
Con
sequ
en
ce

4
2.3.2. Perform the investigation
Fault troubleshooting should be performed independently of the Event Investigation team (with fault investigation reported to the event investigation team). In the event that equipment issues that have reduced generation output or compromised nuclear safety, troubleshooting should be performed in parallel with event response activities. (Troubleshooting is a logical, systematic, experience based process to identify the failures, malfunction(s) or their symptoms within a technical system, and to determine and eliminate their causes.) If at any time during the performance of the root cause investigation additional adverse conditions are identified, then individual condition reports should be initiated. If at any time during the performance of the root cause investigation a question of operability arises then the Shift Manager must be notified immediately.
2.3.3. Preservation of the evidence
Careful preservation of the evidence is very important in the determination of the actual cause of an issue or event. In cases where malicious intents are suspected, it may be necessary to get Security involved.
• The Shift Manager should ensure quarantine, as long as it does not impede the operations of the station, of all documents, computers, areas, equipment and parts related to an event as soon as possible. This is to ensure that the event investigation team can objectively gather information and review the situation as close as possible in the same configuration as it was prior to the event. Quarantined areas should be obvious to prevent inadvertent entry into the quarantined area. Quarantine methods include:
o Placing security tape and placards around a piece of failed equipment including, control switches, breakers, isolation points and/or other controls;
o Taking custody of any tools utilized or parts replaced prior to or during the event;
o Placing related documents in a secure place; o Putting adequate controls on computers or network access as necessary.
• The Shift Manager will ensure that individuals involved in the event or those helpful
in the gathering of facts remain on site until interviews can occur. If individuals important to the event investigation have left the site, then they should be requested to return to the site as soon as safely possible in order to expedite gathering of pertinent information.
2.3.4. Selecting the proper root cause investigation team
Proper root cause investigation team composition will ensure that the correct technical and management perspectives are addressed objectively throughout the performance of the investigation. The Responsible Manager should select the root cause investigation team in accordance with guidance from this document.

5
When selecting the proper root cause investigation team there are important elements to consider:
• Ensure sponsorship is at the senior management level to ensure adequate resources are available to complete the investigation expediently and resolution of conflicts;
• A root cause investigation team should consist of at least three members, but can be larger proportionate to the significance and complexity of the event. At a minimum, one of the investigation team members should be a qualified and experienced root cause investigator; preferably, the other members should be trained in root cause analysis techniques and one of the team members should be an human factors expert. Depending on the significance of the event it may be advantageous to include an expert external to the plant in the team;
• The investigation Team Leader should be experienced in root cause investigations and it would be desirable that this person performed an investigation recently. It is their job to ensure the root cause process is followed throughout the investigation. It is recommended that the investigation Team Leader be fully independent if possible, however at the very least, the investigation Team Leader should not be from the department involved in the initiating event. If it is later determined during the investigation that the team leader may be from the involved organization, then a new team leader should be designated;
• The investigation team should include an individual that has technical expertise and recent experience in the area that the root cause investigation is being performed to evaluate;
• In order for the investigation to be conducted objectively, the remaining team members should be chosen that are not directly related to the area under investigation;
• Investigation team members should be dedicated to the investigation as their primary responsibility until the investigation is complete with the Responsible Manager’s signature.
2.3.5. Terms of reference for root cause analysis
A root cause investigation Terms of Reference (TOR) is very important because it defines the scope and resources needed for the root cause investigation. With the scope and resources defined and approved, Senior management can commit the resources necessary to enable the successful performance and completion of the investigation. The TOR contains the following important elements:
• Event Title; • Event Description (a two or three sentence synopsis of the actual event or issue); • Investigation Team Lead, Team Lead Department, Qualification tracking number; • Team Members, Respective Department, number of hours per week needed from each
team member for on time completion of the investigation; • Resources needed to complete the investigation including monetary, materials,
additional personnel, testing or other resources needed; • Investigation Scope – a succinct statement that captures the boundaries of the
investigation – included the failure analysis results if the root cause investigation is being performed for an equipment failure or trip;
• Interim Actions – actions taken to mitigate or prevent the issue or event until formal Corrective Actions to Prevent Recurrence can be implemented. Note: all interim actions taken or to be taken will be captured in the action tracking system, even

6
completed actions. (The Action tracking system is a programme used to monitor progress of completion of corrective actions identified during the event investigation process.);
• root cause investigation milestones – commitment dates for various root cause investigation actions taken throughout the performance and approval of the investigation;
• Event Review Board disciplines necessary for RCA investigation approval – members that have the proper technical expertise and influence to understand and support corrective actions listed in the investigation;
• Sponsoring Senior Management commitment signature and date – ensures that sponsoring manager has agreed to the root cause team, resources needed, scope, and interim actions for the successful completion of the investigation.
If the investigation scope changes during the performance of the root cause investigation, a new Terms of Reference should be completed and approved. The due date for the root cause investigation should remain as the original due date.
2.3.6. Investigation preparation
Successful outcome of the root cause investigation will have a profound impact on the business and ensure that continuous improvement is achieved. The proper conduct of the investigation will ensure a successful root cause investigation is achieved. The following steps should be taken to assist with the conduct of the investigation.
Secure a dedicated location for the entire term of the investigation and ensure this location contains all necessary equipment to perform the investigation;
Utilize Human Performance tools throughout the investigation including:
o Procedure adherence; o Questioning attitude; o Self check (e.g. Stop Think Act Review (STAR)); o Pre-job briefs.
2.3.7. Investigation performance
This section provides guidance on how to conduct the investigation. The most important thing to consider when performing and documenting the investigation is that the final document – RCI report - should be ‘stand alone’ so that an individual with a basic understanding of nuclear power can understand the technical content contained within the investigation, and understand how the root cause was derived. The investigation Team Leader should ensure the investigation timeline is followed. If nuclear safety or production is affected by the investigation outcome, then schedule investigators to work in shifts to expedite completion of the investigation.
2.3.7.1. Gathering information
Thorough information gathering is important to the success of the investigation. Missed evidence can lead to improper or inadequate conclusions. Investigation teams should gather all additional pertinent information as soon as possible. This information includes:

7
• All documents and information from the event response team during the investigation turnover meeting;
• Interviewing additional individuals potentially involved or related to an event at the earliest time possible;
• Review of event Condition Report data and previous related investigations, evaluations, audits, and self-assessments;
• Gather manual documents including procedures, logs, turnover sheets, work packages, drawings, operator rounds, surveys, shipping manifests, training records, or other related documents;
• Electronic data including work management data, control room or other sequence of event recorder outputs, chart recorders, indications, or other related electronic data or data capture devices;
• Taking photographs of equipment and areas related to the issue; • Ensure gas, fluid, or effluent samples have taken and sent for analysis as necessary; • If the event being investigated is a major transient (a Reactor Trip or Unplanned
Power Reduction) gather information from the Transient Review Board meeting minutes. (Transient Review Board is a group of managers and technical experts who perform a technical review of reactor trips or transients.);
• Perform Equipment Failure Analysis (a typical failure analysis guideline is shown in APPENDIX I).
2.3.7.2. Creating an event timeline for discussion of facts
Identification of the proper group of facts is important to ensure that the scope of the investigation is not too broad or too narrow. Extraneous or missing events or facts can confuse the root cause investigation team, Event Review Board, or others reviewing the investigation especially when reviewing it later without the benefit of one of the investigation team members to answer questions. However, the discussion of facts should be thorough enough that all information is included to review the investigation without utilizing other sources of information. When investigating an event, it is typical to use an event timeline to help identify when the first causal factor had an impact on the event. The event timeline should begin at the first set of facts just prior to the first failure or inappropriate action. When investigating a trend, programmatic weakness or organizational issue, it is typical to review the data in logical groupings of common issues. The logical groupings become the discussion of facts.
2.3.7.3. Selecting the proper root cause techniques
There are many root cause investigation techniques that can be considered for use in getting to the proper root cause of an event or issue, however, most techniques are effective only in certain situations (TABLE 1: COMPARISON OF TOOLS AND TECHNIQUES, Section 4). Usually a combination of techiques, selected as the investigation progresses, will be necessary to ensure the effective analysis of the event. Regardless of the technique utilized, a basic event and causal factor chart should be used to help identify all failures or inappropriate actions. Utilizing the event and causal factor chart and the most appropriate root cause techniques will identify the root causes, contributing causes and causal factors effectively.

8
2.3.7.4. Error precursors and failed defences
When performing a root cause investigation that has an element of human error as part of the cause, it is very important to make the assumption that all individuals come to work to do the best job they can every day. During the course of the investigation it can be determined if malicious intent was a factor in the event. When human errors occur, root cause investigators must always put the errors in the proper perspective. There are factors that influence even the most qualified and dedicated individuals to make errors. These factors are called Error precursors. One of the attributes of a strong process or programme is a defence in depth approach within the design of the process. Defence in depth is a design attribute of a strong process or programme used to ensure that one or very few human errors cannot result in a significant event. When a break through event occurs, it is important to evaluate the defences within the programme or process that are used to prevent errors. Usually, the investigator will find weak or non-existent failure defences1. Evaluation of error precursors and failed defences along with use of the proper root cause Analysis technique, allow the investigators to put the error in the proper context. For example if the investigation reveals that individuals involved in the event understand the expectation of procedure adherence, then when one of these individuals fails to follow a procedure, we would investigate whether program barriers were appropriate and whether there were error precursors present at the time of the error that had an influence in the outcome of the decision making by the individual that made the error. These two attributes properly documented in the event timeline or discussion of facts will ensure a thorough understanding of how the error occurred by the reviewers of the investigation. Corrective actions can be taken to address the error precursors and/or failed defences so that if an individual is put in the same situation in the future, the error will not repeat itself.
2.3.7.5. Repeat occurrence
Repeat events can only be determined once the root cause has been identified. For organizational or programmatic issues, repeat events are those in which the root cause and issue or event being investigated is similar to a significant event or issue from within the last few years (for example, in some NPPs two years is used due to the nature of frequent change in nuclear power management). For equipment failure related investigations, the equipment failure mode should be determined and if it is similar to a previous event that has occurred within the last few years (for example, some NPPs consider 5 years to be an adequate period). When previous events are identified, it is important to review the actions taken to address the previous events to ensure that the corrective actions from this investigation are more effective than the previous actions that were taken.
1 Failed (Flawed) defences are usually defined as defects that under the right circumstances may inhibit the ability of defensive measures to protect facility equipment or people against hazards or fail to prevent the occurrence of active errors.

9
There are a few ways to search for previous events. The root cause team may enlist the help of the group managing Operating Experience (OE) or corrective actions to obtain this information. Run queries on the CR database for related trend codes for significant events or issues. Also, scan the titles of all significant events that have occurred within the last few years. For Equipment Related issues, review the CR titles of significant issues for the last few years and review the equipment names within high priority work orders. For items which appear to be related by equipment, component for functional process, each root cause investigation will need to be reviewed to determine if the previous root cause is the same as the current root cause. If a previous similar event is found, then the respective Corrective Actions and their closures should be reviewed to identify why the event recurred. This information should be utilized in the development of the new Corrective Actions to ensure that these actions are developed with the new insights gained from this review. The search criterion utilized and results of the previous event search should be documented in the applicable section of the root cause investigation Report, and if no similar issues are found this should be documented as well in the report.
2.3.7.6. External Operating Experience
External Operating Experience (OPEX) from a facility outside the station can also be valuable when developing effective Corrective Actions to Prevent Recurrence. The root cause investigator should perform an Operating Experience Review in order to find similar events or issues in the Operating Experience database. The root cause investigator should collaborate with the site OE coordinator or designee to ensure the most accurate search is performed. Document the results of the OPEX search in the applicable area of the root cause investigation report. Include search criterion utilized for the search and any results of the search in the applicable section of the report. If no similar events or issues were found then document this in the applicable section.
2.3.7.7. Cause identification
Differentiating between the different causes revealed during a root cause investigation in order to determine which one is the root cause, is a knowledge based skill that takes experience and technique. Once the possible root cause is identified then the next question that needs to be asked is whether the issue or event can recur if this cause is permanently corrected. If it can still occur, then the root cause has not been identified.
• Root cause(s) is the most fundamental reason for an event or adverse condition, which if corrected will effectively prevent or minimize recurrence of the event or condition. The best way to get to the root cause is to ask ‘why’ an issue has occurred. Keep asking ‘why’ until the fix for the root cause becomes prohibitive to fix either from a realistic perspective. Although there are different philosophies on how many root causes an event can have, there should be not too many root causes for an event, and in most cases there will only be one root cause. Many root cause investigators mistake contributing causes for root causes resulting in too many, ineffective Corrective Actions, or too many resources expended correcting all the identfied root causes.

10
Investigations for failed equipment are unique in that equipment root causes are typically failures caused by humans as a result of a weak process, programme, or organization. These failures manifest themselves in the trip or degradation of one or more related components up to a unit trip. In order to identify the proper cause of the failure two things need to happen. First the direct cause of the equipment failure needs to be identified. Secondly, the failure mode needs to be identified through an accurate and independent failure analysis in order to identify the causal factors. Once the causal factors are identified then the root cause investigation process can evaluate the root cause and contributing causes. The most important point to note is the fact that although an equipment failure can be the cause of an event, the of the event is never the equipment failure, rather it is the weaknessthat lead to the equipment failure that is the root cause. Appendix II: Example of an Equipment Failure Worksheet contains a typical Equipment Failure Worksheet to assist in the equipment Failure cause identification. (A Direct cause is the immediate cause of an event or adverse condition. An Apparent Cause is a cause that can easily be dermined (obvious, apparent) by available information without further and deeper investigation.);
• Contributing Cause(s) is a causal factor that exacerbated the problem but is not the root cause of the problem. Contributing Causes are important in the anatomy of an event in that contributing causes exacerbate the issue or the event. A test of whether a cause is a contributing cause instead of a root cause is whether permanent correction of the contributing cause will prevent recurrence of the event. If ‘why’ is asked until it becomes unreasonable or unrealistic to fix the issue, and the event can still occur once this cause is corrected, then only a Contributing Cause has been identified. It is still important to initiate Corrective Actions to prevent the contributing causes as these causes could result of contribute to another event or issue of lesser significance if not corrected;
• Causal Factors are any action or condition either causing an event to occur or increase its severity. Causal factors result in inappropriate actions or failures. They must still be corrected through corrective actions from the investigation;
• A casual factor can be Proximate Root Cause (most probable) There will be cases when the root cause cannot be determined during the root cause investigation due to a lack of data, the inability to identify the exact failure, or a delay in revealing the failure due to outages or extended failure analyses. In these cases, the Proximate Root Cause should be determined. The proximate root cause is the best root cause that can be determined based on all of the information available.
The normal root cause investigation should be typically performed within the 28 day time frame. However, if determination of the root cause is dependent on more information, the proximate root cause will be used and a corrective action will be created to track amendment to the existing investigation, once further failure analysis or missing information is available. A new investigation should not be performed, the existing investigation should be re-opened, changes notated, and re-presented to Event Review Board for approval.

11
2.3.7.8. Extent of cause / Extent of condition
Once the root cause is identified, the Extent of Cause and Extent of Condition should be determined. The Extent of Cause is the extent to which the root causes of an identified problem have impacted other plant processes, equipment or human performance. In the simplest terms, the Extent of Cause is how the root cause manifests itself in other related areas. In order to determine if the extent of cause has been properly identified, the question needs to be asked: if the root cause is corrected permanently, is it possible for other significant events from the organizational or programmatic weakness to fail in a way that an event can occur that is similar to the event being investigated. Example: if a control switch fails due to inadequate maintenance work practices used by one maintenance crew, the extent of cause looks at others maintenance crews for inadequate work practices. The Extent of Condition is the extent to which the actual condition exists with other plant processes, equipment or human performance. It is the total effect that the root cause has had on the station, its processes or employees. Since root causes are mostly Organizational or Programmatic, evaluation of the Extent of Cause and Extent of Condition will determine how this Organizational or Programmatic cause if not corrected will affect the nuclear facility, resulting in repeat events. Answering the following questions will help to identify the Extent of condition, including the historical review of previous problems of similar events:
• Does this condition apply to other units or facilities? • Does this condition apply to other organizations? • Does this condition apply to other procedures? • Does this condition apply to other systems or components?
Example: if a control switch fails due to inadequate maintenance work practices used by one maintenance crew, the extent of condition is everything that this crew worked on over a predetermined period of time. This evaluation is important when developing the Corrective Actions because it will ensure that the action is broad enough to address the other areas affected by the root cause.
2.3.7.9. Corrective actions
There are many corrective actions taken as a result of a root cause investigation some actions mitigate the initial issue or related issues, while others permanently address the root cause. Corrective actions to address root causes get the highest level of priority in the corrective action program. The implementing organization should be involved in the development and implementation date of the corrective action. Each type of action is discussed more in detail below. Interim Actions (compensatory actions). Interim Actions are important for mitigating or preventing the effects of the causes until Corrective Actions to Prevent Recurrence can be

12
fully implemented. Interim Actions are sometimes implemented immediately upon discovery of the issue, or they can be initiated at anytime throughout the event response and performance of the root cause investigation. Interim Actions should be documented on the Terms of Reference for review by Event Review Board and within the root cause investigation in the applicable section of the report. Corrective Actions to address root causes. Corrective Actions that are taken to address the root causes of issues (Equipment, Organizational, human performance or Programme). As such, successful implementation of the corrective actions depends on effective change management in order to prepare the organization for the implementation of a change that is as significant as the issue being investigated. In order for the corrective action to be successfully implemented, the action must address several elements. These include:
• Administrative information including title, owner, tracking number, due date and other identification information;
• Which root cause that Corrective Action is being taken to address; • The desired end state or closure criterion so that should be met to confirm complete
implementation of the Corrective Action; • How the Corrective Action will be utilized. This is important to be sure that the
Corrective Action addresses all circumstances it was designed to address (Extent of Cause/Condition). For example outage related corrective actions are only utilized during outages, therefore an outage must occur and the corrective action must be utilized before it can be fully reviewed for effectiveness;
• Operating Experience that were used in the development of the Corrective Action so that learning from related internal and external events or issues were included in the development of the Corrective Action;
• Previous events to ensure history does not repeat itself; • An Implementation plan that includes all aspects necessary for the management of the
change related to the implementation of the Corrective Action. Elements of the Corrective Action implementation change management plan include identification of the following:
o Resources – personnel, cost, materials etc.; o Barriers to success; o Contingency planning; o Communications plan; o Training; o Stakeholders (people affected by corrective actions); o Project type; o Procedure or Work instructions that need to be changed.
In addition, Corrective Actions to address equipment failures should include:
• Outage identification (if applicable); • Plant modifications needed if necessary; • Performance centred maintenance Programme category change (if applicable).
With regard to Corrective Actions that address root causes typically there should be no more than two Corrective Actions per root cause. If more Corrective Actions are necessary, then some of the Corrective Actions are probably addressing contributing causes and a review of the root causes and contributing causes should be done.

13
Actions to Address Contributing Causes Corrective Actions taken to address contributing cause need are not as important as the Corrective Actions, yet if left incorrectly implemented can contribute to other failures. Actions to Address Other Causes Corrective Actions taken to address other causes should be taken. Each corrective action should be related to a cause, each cause should have at least one corrective action.
Extension of corrective actions to address root causes need to be approved by the Event Review Board.
Development of proper corrective actions is very important for the elimination of the identified deficiencies.
Corrective actions should have the following attributes:
• be specific and practical; • have content and timescale agreed by the recipient of the action, i.e. persons
accountable and responsible for the actions; • be prioritized; • short term actions/contingencies to correct immediate significant problems should be
implemented pending long term corrective action completion. The following criteria should apply to the corrective actions to ensure that they are viable. If they are not viable, re-evaluate the solutions.
• Will the corrective action prevent recurrence? • Is the corrective action feasible? • Does the corrective action allow meeting operating organization mission, primary
goals and objectives? • Does the corrective action introduce new risks? Are the assumed risks clearly stated?
(The safety of other systems must not be degraded by the proposed corrective action.) • Were immediate actions taken to address the direct (or apparent, observed) cause
appropriate and effective? Additional specific questions and considerations in developing and implementing corrective actions include:
• Do the corrective actions address all the causes? • Will the corrective actions cause detrimental effects? • What are the consequences of implementing the corrective actions? • What are the consequences of not implementing the corrective actions? • What is the cost of implementing the corrective actions (capital costs, operations, and
maintenance costs)? • Will training be required as part of the implementation? • In what time frame can the corrective actions reasonably be implemented? • What resources are required for successful development of the corrective actions? • What resources are required for successful implementation and continued
effectiveness of the corrective actions? • What impact will the development and implementation of the corrective actions have
on other work groups?

14
• Is the implementation of the corrective actions measurable? (For example, ‘Revise step 6.2 of the procedure to reflect the correct equipment location,’ is measurable; ‘Ensure the actions of procedure step 6.2 are performed correctly in the future,’ is not measurable.)
• Are the closure criteria clear such that it will be readily apparent when the corrective actions have been satisfactorily completed?
2.3.7.10. Effectiveness review assignment
Each root cause investigation should include an assignment to track a formal effectiveness review of the root cause investigation. The effectiveness review assignment should delineate how the corrective actions to prevent recurrence will be challenged and measured to be effective.
2.3.7.11. Trend codes
A trend is a series of related issues. Each issue may be coded and a trend database constructed. Upon conclusion of a root cause investigation, trend codes that reflect the actual investigation results should be documented in the root cause investigation report in the applicable section and in the trend code database.
2.3.8. Review and approve the investigation
2.3.8.1. Root cause investigation report presentation
Typically, the root cause investigation should be scheduled for presentation within the 28 day due date for the investigation. The Responsible Manager for the investigation maintains responsibility for complete and timely presentation of the root cause investigation to the Event Review Board. Root cause investigation package should include:
• The Initiating Event condition Report; • The investigation Terms of Reference; • Equipment Failure Worksheet (if applicable); • The Failure Analysis Report (if applicable); • The Complete signed root cause investigation Report.
The Manager Responsible for the performance of the root cause investigation should present the report to the Event Review Board. Technical support from the root cause investigation team should be present in the Event Review Board meeting during the presentation.
2.3.8.2. Minimum event review board disciplines needed to approve report when complete
During approval of the terms of reference, the Event Review Board approved the disciplines necessary to approve the root cause investigation. The purpose of this was to ensure that the proper technical and business process experts review the report for accuracy and objectivity. It is up to the Responsible Manager that has approved the report to ensure that the proper senior managers with these disciplines attend the Event Review Board.

15
Review and approval of the root cause investigation should be conducted in accordance with the Event Review Board Terms of Reference. The expectations and quorum for the Event Review Board should be defined in an administrative procedure. Once the investigation has been approved by Event Review Board, the Responsible Manager should incorporate all comments into the investigation, and the completed investigation should be provided to the Event Review Board chairman for review and approval along with the list of root cause investigation comments.
2.3.8.3. Effectiveness review
The effectiveness review should be scheduled no earlier than six months after the completion of latest Corrective Action to address root cause. If any of the Corrective Actions within the investigation are extended, the effectiveness review should be extended to six months after the new Corrective Action extension date.
3. TOOLS AND TECHNIQUES
This section provides a description of the following tools and techniques:
1. Interviewing. 2. Task analysis. 3. Change analysis. 4. Barrier analysis. 5. Event and causal factor charting. 6. Cause and effect analysis. 7. Fault tree analysis. 8. Event tree analysis. 9. 5 whys (why staircase). 10. Common cause analysis. 11. Current Reality Tree. 12. Failure Mode and Effects Analysis. 13. Human factor investigation tool. 14. Psychological and physiological evaluation. 15. Ergonomics analysis. 16. KEPNER TREGOE Analysis. 17. Interrelationship diagram (ID). 18. JNES Organizational Factors List (JOFL).
Where information was clearly available, strenghts and limitations of the tool or technique are stated in the description; a thorough examination of advantages and disadvantages of each tool or technique is presented in Section 4: COMPARISON OF TOOLS AND TECHNIQUES.
3.1. Interviewing
Interviewing is face-to-face communication between event investigator and witnesses to obtain facts pertinent to an issue or an event. In order to obtain pertinent information from the

16
interviewees it is necessary to consider the respondents sensibilities. For this reason the interviewer requires special training. The initial questions should be prepared in advance. Many questions are derived from other RCA tools (such as task analysis, change analysis, etc). The important aspects of the interviewing tool are:
• Interviewing is an important tool for data gathering and is used for all investigations; • Focused on fact-finding not fault finding; • Need a no-blame culture; • Requires a degree of skill on the part of interviewer; • Is done as soon as possible: facts become less clear, memory is lost and opinions
established as time passes; • Some direct witness may not always be available, you may have to select others; • Collaboration between interviewees should be avoided prior to the interview; • Not all interviewees would necessarily be directly involved in the event (e.g. work
planning, supervision, etc.); • There should not be a close relationship (professional or personal) between
Interviewer and interviewees. Due to the importance and nature of event investigations, interviews must be conducted in a professional manner. Interviewers must be capable of obtaining factual information from interviewees who may feel threatened, be hostile, be emotional, or have trouble recalling the information in an unbiased way or have trouble expressing themselves clearly. For all of these reasons, interviewers must acquire a level of expertise in the various techniques of interviewing through comprehensive training.
Preparation
Listening to the first-hand accounts from those involved in an event as soon as possible after it has happened will help the investigation team start to build a picture of what happened and potentially highlight what other information will be required. The optimum time for holding an interview is between two and 72 hours after the event. The interviewer needs to establish who they want to interview and make arrangements to do so as soon as possible. The interview should take place in a quiet, relaxed setting and, if possible, away from the interviewee’s usual place of work and not at the scene of the event. Steps should be taken to ensure, where possible, that no interruptions occur (e.g. telephones, pagers). The interviewer should ensure they have all the relevant documentation available at the interview. Additional tips for preparation of the interview:
• Schedule the appointments properly and mantain the schedule; • Choose a neutral location; • Make sure you are interviewing the right people; • Having question areas or themes prepared in advance; • Have required reference documents at hand; • Be mentally prepared and focussed.

17
Conducting the interview
Introductions should be made of those present in the room. Include details on roles and an explanation of the sequence of the interview and approximate length. The RCA process should be explained and an estimate given of how long it will take to complete. Recommendations concerning introduction
• Introduce yourself; • Explain the purpose of the interview; • Reduce interviewee’s tension; • Do not be confrontational; • Use an appropriate body language.
It is important to reinforce that this is not part of a disciplinary process. The interviewer should explain that notes will be taken throughout, for the purpose of informing the investigation. It must be stressed that these notes will not act as a formal witness statement and therefore do not need the interviewee’s signature The interviewee should be asked to confirm they have understood all of the above and should be reminded that they should offer only factual information, but include everything regardless of whether they think it is relevant or not. The interviewee should be discouraged from making ‘off the record comments’. The interviewee should also be advised that the first-hand account and the final report will be written with due anonymity to staff. Recommendations for interviewer concerning asking questions
• Seek to understand why not just what; • Control the interview; • Keep questions simple and focused; • Use a funnel approach: broad leading to specific questions; • Anticipate unsatisfactory replies: have a means to deal with them; • Avoid devious or trick questions; • Focus on facts; • Anticipate interviewee questions; • Be aware that interviewing is not interrogating; • The interviewee should be encouraged to provide any additional information that may
assist the interviewer in the inquiry. Listening techniques
• Don’t assume, ask questions; • Listen to answer before asking next question; • Be relaxed, friendly; • Do not let note taking interfere with listening.
Recording the information
• Take brief notes while listening; • Add more detail as soon as possible from memory; • If you do not understand, ask for clarification or confirmation;

18
• Do not wait until next day; • Discuss with counterparts; • Request copies of documents for later study; • Use of electronic recording devices should be carefully considered; • Contradictory information provided by the interviewee must be considered as
perceptions which may be important in the investigation. Recommendations concerning personal diversities
• Be alert for sensitive issues: treat them with care; • Treat interviewee with respect at all times.
Completion of the interview
On completion, the interviewer should ensure the interviewee feels the interview was objective. The interviewer should reconfirm what will happen with the information gained from the interview and how this will be used in the RCA process.
3.2. Task Analysis
Task analysis (TA) aims at providing a better understanding of what is exactly involved in carrying out an activity when performed correctly. TA involves collecting data about the operational procedures for performing a particular task, as well as collecting information about some additional aspects of the tasks such as the job conditions, the required skills and knowledge, safety and environmental factors, references, equipment, etc. Task analysis is performed in two steps:
• Paper and Pencil to study how the task SHOULD be done by reviewing the procedures and other documents, developing questions and identifying potential problems and simulating the task in the plant if possible;
• Walk-through to re-enact the task to determine how the task was actually performed, and identify potential problems.
The purpose of these steps is to:
• Become familiar with the task; • Learn the potential difficulties associated with performing the task; • Identify the gaps between what was done and what should have been done.
The first part of task analysis, how the task should have been performed can be a complex and time consuming process if this technique is used thoroughly. Normally subject matter expertise on the team and documents such as written procedures make it unnecessary to do a fully detailed task analysis. Often the work order process, pre-job brief, procedure and closing activities are used to create a very brief analysis of how the task should have been performed. Task analysis using paper and pencil provides investigators with a good insight of the task, helps to identify questions to use later for interviewing. It is useful for analyst not familiar with the task. The second part of task analysis, how the task was actually performed is almost always used as an investigation tool of human performance issues involved in events. It is absolutely critical to view the event from the standpoint of the individuals involved in the event. To

19
accomplish this goal you must be able to stand in the shoes of the individuals involved. It is almost impossible to recognize many of the human factors and environmental issues without walking through the event and these issues typically play a significant role in events in nuclear power plants. The attributes of the task analysis using walk-through are:
• Re-enact the task with the persons involved with the event; • If not available perform the task with another person who is normally performing the
task; • Limitations may exist to access the area after the event; • Note differences between actual re-enactment and procedure steps; • Very helpful to identify contributing factors that relate to physical environment and
man-machine interface.
Application: Task analysis compares how the task should have been performed with how the task was actually performed, the output which frequently becomes an input into a change analysis.
3.3. Change Analysis
Change analysis involves systematically identifying and analysing any changes that may have affected the problem under investigation. The tool is designed to determine what changed compared to previously successful occasions, if the change introduced was responsible for the consequences and what was the effect of the change in the event. As suggested by the name of the tool, change analysis is based on the concept that change (or difference) can lead to deviations in performance. This presupposes that a suitable basis for comparison exists. What is then required, is to fully specify both the deviated and correct conditions, and then compare the two so that changes or differences can be identified. Any change identified in this process becomes a potential cause of the overall deviation. There are basically three types of situations that can be used for comparison. First, if the deviation occurred during performance of some task or operation that has been performed before, then this past experience can be the basis. Second, if there is some other task or operation that is similar to the deviated situation, then that can be used. Finally, a detailed model or simulation of the task (including controlled event reconstruction) can be used, if necessary. Once a suitable basis for comparison is identified, then the deviation can be specified. The end result is a list of characteristics that fully describe the deviated condition. Given the full specification of the deviated condition, it becomes possible to perform a detailed comparison with the selected correct condition. Each difference is marked for further investigation. In essence, each individual difference (or some combination of differences) is a potential cause of the event. Causes identified using change analysis are usually direct causes of a single deviation; change analysis will not yield root causes. However, change analysis may be the only method that can find important, direct causes that are obscure or hidden.

20
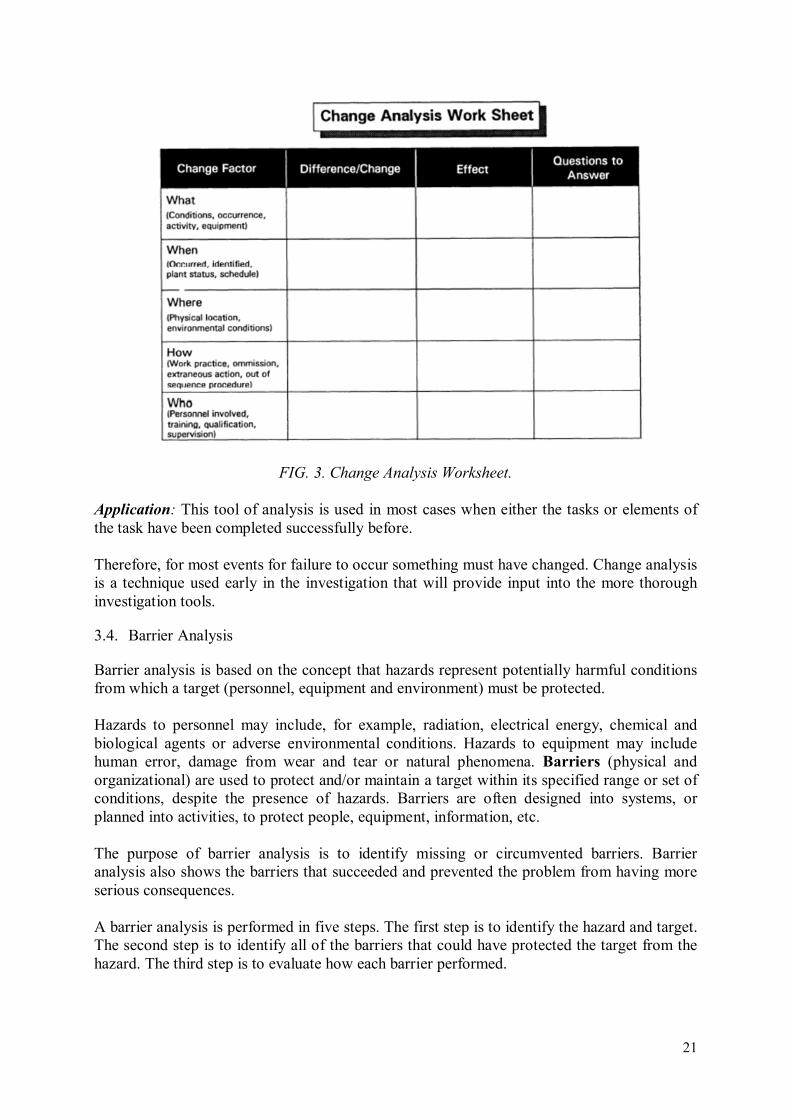
Figure 2 shows the six main steps involved in Change Analysis. Figure 3 is the Change Analysis Worksheet. The first step of a change analysis is to define the ‘event-free situation’ and compare it to the situation in which the ‘event’ under investigation occurred. Once the ‘event’ and ‘event-free’ situations have been identified, they are analysed to determine the specific differences between them. The impact of each difference on the event is then evaluated and used as an input to the cause analysis to determine whether the change was unimportant or was a direct, contributing, root and/or programmatic cause of the problem. The attributes of the change analysis tool are:
• Useful if is suspected that some change has contributed to the event; • Does not lead directly to the root cause; • Needs to be used with other tools.
Change analysis will provide clues to help pinpoint inappropriate actions.
FIG. 2. Six Steps Involved in Change Analysis.
21
FIG. 3. Change Analysis Worksheet.
Application: This tool of analysis is used in most cases when either the tasks or elements of the task have been completed successfully before. Therefore, for most events for failure to occur something must have changed. Change analysis is a technique used early in the investigation that will provide input into the more thorough investigation tools.
3.4. Barrier Analysis
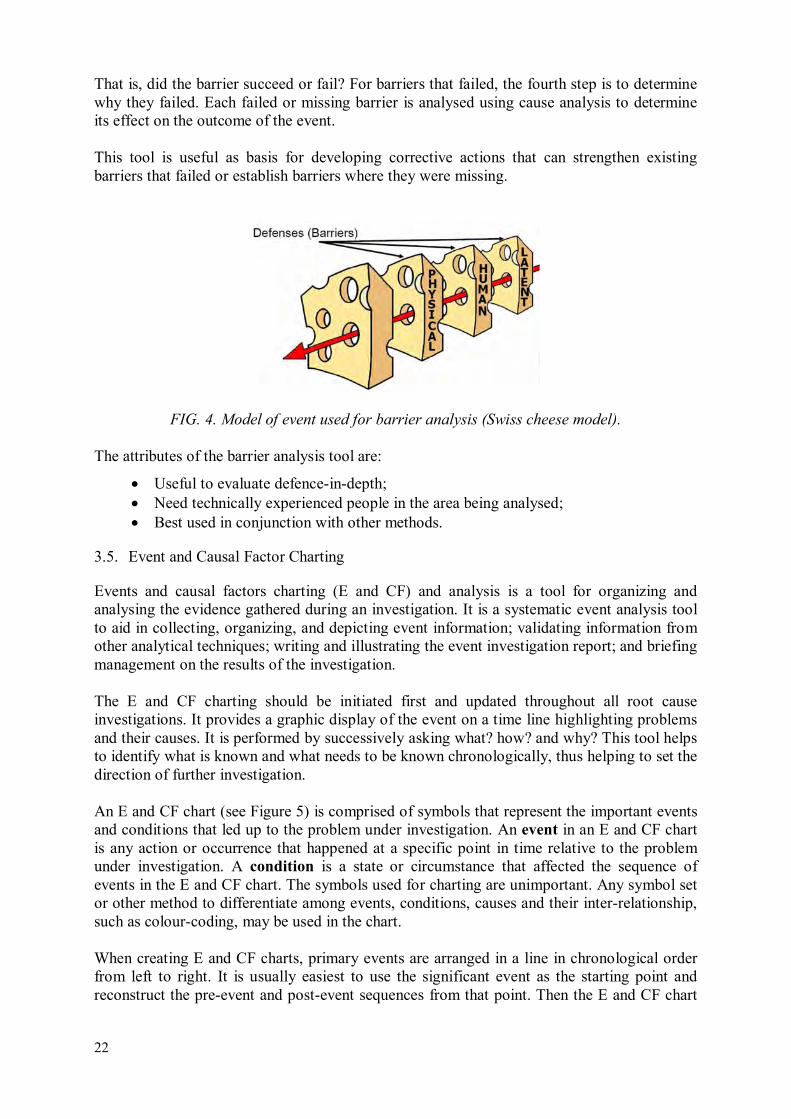
Barrier analysis is based on the concept that hazards represent potentially harmful conditions from which a target (personnel, equipment and environment) must be protected. Hazards to personnel may include, for example, radiation, electrical energy, chemical and biological agents or adverse environmental conditions. Hazards to equipment may include human error, damage from wear and tear or natural phenomena. Barriers (physical and organizational) are used to protect and/or maintain a target within its specified range or set of conditions, despite the presence of hazards. Barriers are often designed into systems, or planned into activities, to protect people, equipment, information, etc. The purpose of barrier analysis is to identify missing or circumvented barriers. Barrier analysis also shows the barriers that succeeded and prevented the problem from having more serious consequences. A barrier analysis is performed in five steps. The first step is to identify the hazard and target. The second step is to identify all of the barriers that could have protected the target from the hazard. The third step is to evaluate how each barrier performed.
22
That is, did the barrier succeed or fail? For barriers that failed, the fourth step is to determine why they failed. Each failed or missing barrier is analysed using cause analysis to determine its effect on the outcome of the event. This tool is useful as basis for developing corrective actions that can strengthen existing barriers that failed or establish barriers where they were missing.
FIG. 4. Model of event used for barrier analysis (Swiss cheese model).
The attributes of the barrier analysis tool are:
• Useful to evaluate defence-in-depth; • Need technically experienced people in the area being analysed; • Best used in conjunction with other methods.
3.5. Event and Causal Factor Charting
Events and causal factors charting (E and CF) and analysis is a tool for organizing and analysing the evidence gathered during an investigation. It is a systematic event analysis tool to aid in collecting, organizing, and depicting event information; validating information from other analytical techniques; writing and illustrating the event investigation report; and briefing management on the results of the investigation. The E and CF charting should be initiated first and updated throughout all root cause investigations. It provides a graphic display of the event on a time line highlighting problems and their causes. It is performed by successively asking what? how? and why? This tool helps to identify what is known and what needs to be known chronologically, thus helping to set the direction of further investigation. An E and CF chart (see Figure 5) is comprised of symbols that represent the important events and conditions that led up to the problem under investigation. An event in an E and CF chart is any action or occurrence that happened at a specific point in time relative to the problem under investigation. A condition is a state or circumstance that affected the sequence of events in the E and CF chart. The symbols used for charting are unimportant. Any symbol set or other method to differentiate among events, conditions, causes and their inter-relationship, such as colour-coding, may be used in the chart. When creating E and CF charts, primary events are arranged in a line in chronological order from left to right. It is usually easiest to use the significant event as the starting point and reconstruct the pre-event and post-event sequences from that point. Then the E and CF chart

23
is expanded further by adding secondary events, contributing factors and conditions which have affected the occurrence to establish how the event have happened. As more information is discovered, the chart is updated thus providing a continuous graphical indication of the progress of the investigation. Usually E and CF analysis is integrating several other event investigation tools and techniques such as interviewing, task analysis, change analysis and barrier analysis. The attributes of the Event and causal factor charting:
• graphically display concisely captures the entire event; • Breaks down the entire case into a sequence of occurrences; • Shows exact sequence of events from start to finish in a chronological order; • Allows addition of barriers, conditions, secondary events, presumptions; • Facilitates the integration of information gathered from different sources; • arseful for both simple and complex problem solutions; • Many causal factors become evident as the chart is developed; • Presents the information in a structured manner.
Application: This method is always used for any event investigation in which a timeline or sequence of events might apply regardless of the initiating event being equipment failure or human performance.
FIG. 5. Structure of an event and causal factor chart (E and CF).

24
FIG. 6. Example of an E and CF chart with broken barrier.
3.6. Cause and Effect Analysis
The purpose of this tool is to identify root causes by examining the relationship between cause and effect. It is performed by asking successively what effects have occurred and why, and proceeding from the last failure/deficiency backwards to find the cause. Using the cause and effect tool is simply starting with the most significant event and determining the cause(s) of it. The cause(s) for this event’s cause(s) are then determined, and this chain of events and causes is continued until no other causes can be determined. These causes are then verified by determining if the root cause criteria have been met. On the basis of information gathered, the Cause and Effect Diagram (CED), also known as the Fishbone Diagram, can be created (Figure 7). It is a tool to graphically identify and organize many possible causes of a problem (effect) based on pre-defined classification of possible causes.
FIG. 7. Example of the Cause and Effect Diagram (Fishbone Diagram).

25
While creating the CED, the main issue should be written in a box that is typically in the center of the right edge of the page. A line called the ‘spine’ or ‘backbone’ extends to the left starting from the edge of the main box. Branches angle off of the spine, each representing a cause or effect of the main issue. Each of these branches may contain additional branches. The attributes of the cause and effect analysis are:
• Successively ask and answer the why question; • Where to stop: Stop to the farthest cause that can be corrected within the operating
organization; • Arrives to the underlying cause of an event in a very direct manner; • Similar to a fault tree analysis but showing only the actual failed branches.
Application: A cause and effects analysis is often used in addressing events initiated by both human performance and equipment failures. For most events initiated by human performance issues, it is usually easier to use this tool later in the event investigation. Because of its logic and relationship aspects, a cause and effect analysis does not lend itself to use as one of the primary investigation tools for human performance issues. Human performance issues often have multiple influences on the event and often cannot be clearly specified until late in the investigation.
3.7. Fault Tree Analysis
Fault tree analysis is a tool for more detailed investigation of a cause and effects relationships visually depicting all possible ways that the undesirable condition being investigated could have occurred. Fault tree analysis creates an event reconstruction model in form of analytic diagram fault tree. This fault tree is designed to list all possible failure mechanisms and using scientific research to verify or refute the possible causes until the true initiating mechanism of an event can be determined. A fault tree analysis is recommended for equipment initiated events. To create a fault tree, an undesired system failure such as a safety system failure is selected for the top event. The top event is related to more basic failure events by logic gates and/or more basic events. The process is continued, until the events can no longer be expanded. An example of a fault tree with top event ‘Fire breaks out’ is shown on Figure 8. Possible but unrealistic and unsubstantiated paths/explanations for the problem are then eliminated using further investigation and deductive reasoning, until only the actual failure path remains.
FIG. 8. Example of a simple fault tree.
Fire
Ignition
Source
Oxygen Fuel
AND

26
The attributes of the fault tree analysis tool are:
• Top event is the significant event; • The graphic tree shape representation provides a structured vision of the event; • Similar in approach to E and CF charting and to cause and effect analysis but with all
branches; • Generally used to provide a graphic representation to a complex problem with many
possible scenarios; • Suitable to present also near miss potential.
Among other fault tree analysis features it should be mentioned, that fault trees encourage the user to ask the 5 Why’s multiple times for a given type of problem and to evaluate several possible problem causes on one diagram (similar to the manpower, methods, materials, and machines boxes on a Fishbone Diagram). Fault trees tend to be a predominantly experience-based tool, in that there are no predetermined questions that are used to help user to create the branches of a given tree. Strengths
FTA is recommended for evaluating events involving equipment failures but it could be used for analysis of human performance-related events also. If used early, it can help identify areas to initially focus on during the investigation. The fault tree can then be annotated to track the progress of the investigation as possible failure paths are eliminated from consideration. The tree may also be used near the end of an investigation to ensure all possible scenarios have been covered. Fault trees could be really useful for troubleshooting reoccurring problems, such as quality defects, because such problems tend to have a common set of causes and sub-causes. Limitations
Fault Tree Analysis is designed more for identifying HOW the event occurred, rather than WHY. For example, the fault tree may clearly point to the initiating fault in the chain of events being a relay that failed due to an over current condition, but we’ll need to look deeper if we want to know why the over current condition was present;
Successful use of this technique is dependent on identifying ALL credible explanations for the problems being analysed. In some cases, the assistance of subject matter experts may be necessary to ensure the analysis is comprehensive.
Fault trees typically fail because:
o people do not use them in a disciplined manner to develop multiple problem causes at each level;
o multiple levels of potential causes exist to be sorted through for each problem type;
o they are opinion driven. They often tend to be a blend of a cause – effect diagram and flow chart, but in such cases, the user can easily get lost and not arrive at any particular root cause.
Also, a fault tree that has been developed to its final extent often leads the user to discover that the same generic management system weaknesses are the root of the problems (such as poor training, excessive employee turnover, weak communications, and poor procedure design) but rarely to the comprehensive mix of realistic root causes.

27
3.8. Event Tree Analysis
The purpose of this tool is to identify potential outcomes from an initial event. An event tree analysis (ETA) is an inductive procedure that shows all possible outcomes resulting from the initiating event and additional occurences or factors. It takes into account whether installed safety barriers are functioning or not. Design and procedural weaknesses can be identified, and probabilities of the various outcomes from an accidental event can be determined. Further analysis may be necessary that includes consequence determination for the less than desirable outcomes. Event tree models can be developed as stand alone, and also in combination of event tree - fault tree models for more complex event progression scenarios. Main steps in event tree construction and analysis:
1. Identify (and define) a relevant initial event that may give rise to unwanted consequences. It is always recommended to start with the first significant deviation (system or equipment failure, human error or process upset) that may lead to development of undesirable occurrence. For each occurrence the following are identified: a) the potential progression(s); b) system dependencies; c) conditional system responses.
2. Identify the barriers that are designed to deal with the event. The barriers that are
relevant for a specific event should be listed in the sequence they will be activated. Examples of barriers include automatic detection systems (e.g. fire detection), automatic safety systems (e.g. fire extinguishing), alarms warning personnel/operators, procedures and operator actions, mitigating barriers. Additional occurences and/or factors should be listed together with the barriers, as far as possible in the sequence when they may take place.
Construct the event tree (see Figures 9 and 10). Constructing starts by an initiating event (not the final event), depicting by separate branches of a tree what happens if the line of defence is successful (S) or fails (F). Branching stops when a significant consequence or concern is identified.
3. Describe the (potential) resulting sequences.
4. Determine the frequency of the event and the(conditional) probabilities of the
branches in the event tree.
5. Calculate the probabilities/frequencies for the identified consequences (outcomes).
6. Compile and present the results from the analysis.

28
FIG. 9. Simple example of a generic event tree.
FIG. 10. Simple example of a real event tree.
Application: Event tree analysis is a tool used to help in assessing safety significance of the event both in Root Cause Analysis and in probabilistic safety analysis. Event tree analysis is useful in quantitatively determining the probability of the different consequences when the probability of each line of defence is known. It allows analysis of dependencies between various factors and ‘domino effects’ that are difficult to model using fault trees, and allows for determining the effectiveness of possible corrective actions to prevent recurrence by quantitative analysis of possible future failures if proposed corrective actions were to be implemented.

29
3.9. The 5 Whys (Why Staircase)
The 5 Whys is a questions-asking technique used to explore the cause/effect relationships underlying a particular problem. Ultimately, the goal of applying the 5 Whys is to determine a root cause of an issue or problem. The 5 Why’s procedure involves asking ‘Why?’ five times in succession. A true root cause can follow a series of ‘therefore’ statements backwards up through the 5 why analysis. The investigator should ask ‘why?’ until he goes outside of the scope of the investigation or until fixing the cause is beyond the control or desire of the organization. Although many root cause processes attempt to dictate the number of ‘why’s’ that should be asked, ‘why’ needs to be asked until fixing the issue becomes prohibitive from a business or realistic perspective. The questioning ‘Why?’ could be continued further to a sixth, seventh, or even greater level. The investigator should be encouraged to avoid assumptions and logic traps and instead to trace the chain of causality in direct increments from the effect through any layers of abstraction to a root cause that still has some connection to the original problem.
FIG. 11. Example of the 5 whys process.
Advantages
This technique can be used for all types of events to identify organizational weaknesses, simple technique, used to challenge the causes find with other techniques. If an investigator knows how to ask good, successive ‘why’ questions, and is able to ask them to the right people, he or she will find at least one root cause for a given problem. This approach takes little time to perform – as few as five minutes can be used to perform a 5Why analysis – and does not require the use of special software, flip chart paper or reading materials. If it is performed repeatedly with the same group of people in a sound manner, its use can lead to a new way of thinking amongst those people that have been exposed to the tool’s use. Disadvantages
While the 5 Whys is a powerful tool for engineers or technically savvy individuals to help get to the true causes of problems, it has been criticized as being too basic a tool to analyse root causes to the depth that is needed to ensure that the causes are fixed.
Problem
Why
Because
human
factors ・・・
Because
daily
management
・・・
Because
middle
management
・・・
Because top
management
・・・
Because
organization
climate・・・
1st Why 2nd Why 3rd Why 4th Why 5th Why
therefore
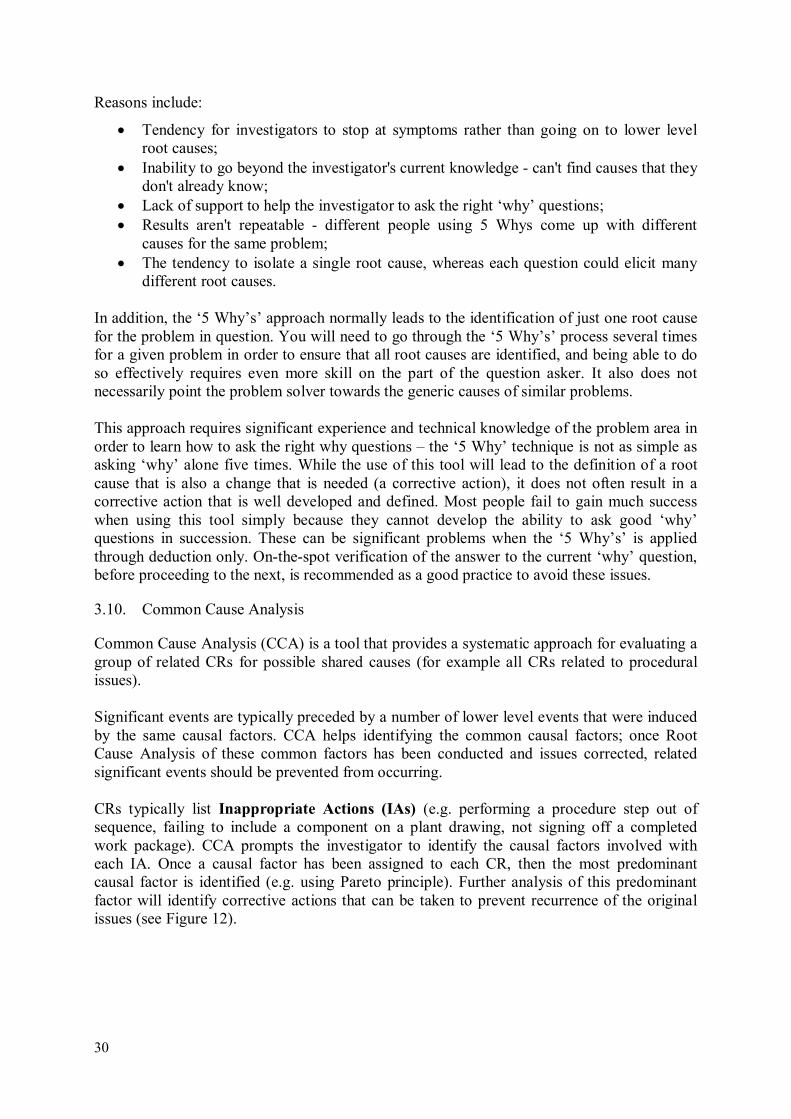
30
Reasons include:
• Tendency for investigators to stop at symptoms rather than going on to lower level root causes;
• Inability to go beyond the investigator's current knowledge - can't find causes that they don't already know;
• Lack of support to help the investigator to ask the right ‘why’ questions; • Results aren't repeatable - different people using 5 Whys come up with different
causes for the same problem; • The tendency to isolate a single root cause, whereas each question could elicit many
different root causes. In addition, the ‘5 Why’s’ approach normally leads to the identification of just one root cause for the problem in question. You will need to go through the ‘5 Why’s’ process several times for a given problem in order to ensure that all root causes are identified, and being able to do so effectively requires even more skill on the part of the question asker. It also does not necessarily point the problem solver towards the generic causes of similar problems. This approach requires significant experience and technical knowledge of the problem area in order to learn how to ask the right why questions – the ‘5 Why’ technique is not as simple as asking ‘why’ alone five times. While the use of this tool will lead to the definition of a root cause that is also a change that is needed (a corrective action), it does not often result in a corrective action that is well developed and defined. Most people fail to gain much success when using this tool simply because they cannot develop the ability to ask good ‘why’ questions in succession. These can be significant problems when the ‘5 Why’s’ is applied through deduction only. On-the-spot verification of the answer to the current ‘why’ question, before proceeding to the next, is recommended as a good practice to avoid these issues.
3.10. Common Cause Analysis
Common Cause Analysis (CCA) is a tool that provides a systematic approach for evaluating a group of related CRs for possible shared causes (for example all CRs related to procedural issues). Significant events are typically preceded by a number of lower level events that were induced by the same causal factors. CCA helps identifying the common causal factors; once Root Cause Analysis of these common factors has been conducted and issues corrected, related significant events should be prevented from occurring. CRs typically list Inappropriate Actions (IAs) (e.g. performing a procedure step out of sequence, failing to include a component on a plant drawing, not signing off a completed work package). CCA prompts the investigator to identify the causal factors involved with each IA. Once a causal factor has been assigned to each CR, then the most predominant causal factor is identified (e.g. using Pareto principle). Further analysis of this predominant factor will identify corrective actions that can be taken to prevent recurrence of the original issues (see Figure 12).

31
FIG. 12. Common cause analysis steps.
The use of systematic coding systems is advantageous in expediting this process.
Strengths
CCA is a proactive process that allows the identification of underlying organizational or programmatic and individual weaknesses that may be precursors to more significant events. It may be applied to look for driving factors behind a known problem area (e.g. an adverse trend in personnel contamination issues). CCA can be used to analyse a population of CRs for performance problems that were previously unrecognized. Limitations
During a CCA, the investigator attempts to draw conclusions based primarily upon information already documented in the OE Database. Getting good results may be a challenge if too few CRs are evaluated or if information in the OE Database for the CRs is inadequate or inaccurate. Consequently, the probability of successfully identifying common causes is dependent upon two factors: the amount and quality of the data available for analysis.
3.11. Current Reality Tree
The CRT addresses problems by relating multiple factors rather than isolated events. Its purpose is to help practitioners find the links between symptomatic factors, called undesirable effects (UDEs), of the core problem. The CRT was designed to show the current state of reality as it exists in a system. It reflects the most probable chain of cause-and-effect factors
Step 1
Determine the related CRs
for CCA
Step 3
Determine causal factors
for each IA
Step 2
Identify IA in each CR
Step 4
Categorize / validate / count causal factors
Step 5
Identify common cause(s)
Step 6
Analyse the common cause(s) to determine the
root cause(s)/ apparent cause(s)
Step 7
Develop Corrective
Actions
Step 8
Document Results

32
that contribute to a specific set of circumstances and creates a basis for understanding complex systems. The CRT assumes that all systems are subject to interdependencies among the factor components. Like the other tools, the CRT uses entities and arrows to describe a system. Entities are statements within some kind of geometric figure, usually a rectangle with smooth or sharp corners. An entity is expressed as a complete statement that conveys an idea. An entity can be a cause, an effect, or both. Arrows in the CRT signify a sufficiency relationship between the entities. Sufficiency implies that the cause is, in fact, enough to create the effect. Entities that do not meet the sufficiency criteria are not connected. The relationship between two entities is read as an ‘if-then’ statement such as, ‘If [cause statement entity], then [effect statement entity]’. In addition, the CRT uses a unique symbol, the oval or ellipse, to show relationships between interdependent causes. The literature distinguishes between interrelationship and interdependency using sufficient cause logic such that effects due to interdependency are attributed to multiple and related causal factors. Because the CRT is based on sufficiency, there may be cases where one cause is not sufficient by itself to create the proposed effect. Thus, the ellipse shows that multiple causes are required for the produced effect. These causes are contributive in nature such that they must all be present for the effect to take place. If one of the interdependent causes is removed, the effect will disappear. Relationships that contain an ellipse are read as, ‘If [first contributing cause entity] and [second contributing cause entity], then [effect entity].’ Figure 13 shows an example of a current reality tree.
FIG. 13. Example of current reality tree.
The CRT also allows for looping conventions that either positively or negatively amplify the effect. In this situation, an arrow is drawn from the last entity back to one of the earlier causes. If the original core cause creates a negative reinforcing loop, but can be changed to a positive, the entire system will be reinforced with a desirable effect.

33
Although constructed from the top, starting with effects, then working down to causes, the CRT is read from bottom to top using ‘if-then’ statements. The arrows lead from the cause upward. The procedure for constructing a CRT is as follows:
• List between five and 10 problems or undesirable effects related to the situation. • Test each UDE for clarity and search for a causal relationship between any two
undesirable effects; • Determine which UDE is the cause and which is the effect; • Test the relationship using categories of legitimate reservation; • Continue the process of connecting the UDEs using ‘if-then’ logic until all the UDEs
are connected; • Sometimes the cause by itself may not seem to be enough to create the effect.
Additional dependent causes can be shown using the ‘and’ connector; • Logical relationships can be strengthened using words like some, few, many,
frequently, and sometimes. This process continues as entities are added downward and chained together. At some point no other causes can be established or connected to the tree. The construction is complete when all UDEs are connected to very few root causes, which do not have preceding causal entities. The final step in the construction of the CRT is to review all the connections and test the logic of the diagram. Branches that do not connect to UDEs can be pruned or separated for later analysis. The assumptions and logic of the CRT are evaluated using rules called CLRs. These rules ensure rigor in the CRT process and are the criteria for verifying, validating, and agreeing upon the connections between factors. They are also used to facilitate discussion, communicate disagreement, reduce animosity, and foster collaboration. The CLRs consist of six tests or proofs: clarity, entity existence, causality existence, cause insufficiency, additional cause, and predicted effect. Clarity, causality existence, and entity existence are the first level of reservation and are used to clarify meaning and question relationships or the existence of entities. The second level of reservation includes cause insufficiency, additional cause, and predicted effect. They are secondary because they are used when questions remain after addressing first-level reservations. Second-level reservations look for missing or additional causes and additional or invalid effects. Advantages: allows finding common causes by grouping and organizing them for many different issues; good for capturing all the facts/brainstorming. The strength of the CRT is the rigor of the CLR mechanism that encourages attention to detail, ongoing evaluation, and integrity of output. Disadvantages: Practitioners may find the application of the CRT too difficult or time consuming.

34
3.12. Failure Mode and Effects Analysis
Failure Mode and Effects Analysis (FMEA) is a step-by-step procedure for identifying all possible failures and their effects. It is most commonly used for technical applications, but can also be applied for processes. It involves reviewing schematics, engineering drawings, operational manuals, etc, to identify basic faults at the lowest level and consequently determine their effects at a higher level. This approach is also considered as an inductive analysis tool that methodically details, on an element-by-element basis, all possible failure modes and identifies their resulting effects on surrounding elements and or the overall system. Failure modes are any errors or defects in a process or equipment, and can be potential or actual. Effects analysis refers to studying the consequences of those failures. Failures are prioritized according to how serious their consequences are, how frequently they occur, and how easily they can be detected. This tools helps to eliminate or reduce defects or problems, starting with the highest-priority ones (see Figure 14).
FIG. 14. Failure Mode and Effect Analysis.
FMEA is used during design of a process to prevent subsequent failures. Later it is used for control, before and during ongoing operation of the process. FMEA could be used:
• When a process, product or service is being designed or redesigned, after quality function deployment;
• When an existing process, product or service is being applied in a new way; • Before developing control plans for a new or modified process; • When improvement goals are planned for an existing process, product or service; • When analysing failures of an existing process, product or service; • Periodically throughout the life of the process, product or service; • To help to find a causal element within other RCA tools.

35
The general FMEA procedure includes following steps:
1. Formation of a cross-functional team of people with diverse knowledge about the process, product or service.
2. Identification of the scope of the FMEA. Flowcharts are used to identify the scope and to make sure every team member understands it in detail.
3. Identifying information has to be filled in at the top of the FMEA form. The rest of the information will be appropriately put into the columns of the form.
4. Identification of the functions of the scope and the purpose of the system, design, process or service. it should be identified with a verb followed by a noun. Usually the scope is broken into separate subsystems, items, parts, assemblies or process steps and the function of each step is identified.
5. For each function, identification of all the possible ways a failure could happen. These are potential failure modes. If necessary, the function should be rewritten with more detail to be sure the failure modes show a loss of that function.
6. For each failure mode, identification of all the consequences on the system, related systems, process, related processes or regulations. These are the potential effects of failure. The team should ask what happens when this failure occurs.
7. Determination of the seriousness of each effect. This is represented with a severity rating, or S. Severity is usually rated on a scale from 1 to 10, where 1 is insignificant and 10 is catastrophic. If a failure mode has more than one effect, only the highest severity rating for that failure mode should be written on the FMEA table.
8. For each failure mode, determination of all the potential causes. Tools classified as cause analysis tool should be used, as well as the best knowledge and experience of the team. All possible causes for each failure mode should be listed on the FMEA form.
9. For each cause, determination of the occurrence rating, or O. This rating estimates the probability of failure occurring for that reason during the lifetime of the scope. Occurrence is usually rated on a scale from 1 to 10, where 1 is extremely unlikely and 10 is inevitable. On the FMEA table, all the occurrence ratings should be listed.
10. For each cause, identification of the current barriers. These are tests, procedures or mechanisms that are in place to keep failures from occurring. These barriers might prevent the cause from happening, reduce the likelihood that it will happen or detect failure after the cause has already happened.
11. For each barrier, determination of the detection rating, or D. This rating estimates how well the controls can detect either the cause or its failure mode after they have happened but before a problem occurs. Detection is usually rated on a scale from 1 to 10, where 1 means the control is absolutely certain to detect the problem and 10 means the control is certain not to detect the problem (or no control exists). On the FMEA table, all the detection rating should be listed.
12. Calculation of the risk priority number, or RPN, which equals S × O × D and calcualtion of the Criticality by multiplying severity by occurrence, S × O. These numbers provide guidance for ranking potential failures in the order they should be addressed.
13. Identification of the recommended actions. These actions may be design or process changes to lower severity or occurrence. They may be additional controls to improve detection. the responsible for the actions and target completion dates have to be indicated in the form.
14. Once actions are completed, results and the date should be indicated on the FMEA form, together with new S, O or D ratings and new RPNs.

36
Advantages
Provides a disciplined approach to evaluating possible cause of equipment failures. All possible equipment failure modes are identified and their effect on the degradation of the piece of equipment is analysed. effective tool to confirm the cause and support the determination of the most effective corrective actions. Disadvantages
• This technique is time consuming and expertise is needed to effectively evaluate possible causes;
• The team may not recognize all potential causes; • This technique is not stand-alone; • This technique becomes difficult to use on complex problems because it cannot show
causal relationships beyond the specific failure mode being analysed.
3.13. Human Factor Investigation Tool (Human Performance)
The tool was developed on a theoretical basis with reference to existing tools and models and it collects four types of human factors information including (a) the action errors occurring immediately prior to the event, (b) error recovery mechanisms, in the case of near misses, (c) the thought processes which lead to the action error and (d) the underlying causes. The structure of HFIT is developed on a sequential model of the event where events are seen as the product of a number of different causes organized into four categories (see Figures 15 and 16). The behaviours immediately prior to the event are described as the first category called ‘Action Errors’, which personnel at the sharp-end enact. These action errors are generally preceded and caused in part by a reduction in awareness of their situation, so Situation Awareness is the second category. The reduction in situation awareness is often related to ‘Threats’ to safety from the work environment; otherwise, there are conditions that may have been in the system for some time, but have not been identified nor rectified (third category). If the error or reduced situation awareness is detected and recovered from before an event occurs (error recovery), a near miss results. So a fourth category called ‘Error Recovery’ is included that could occur during the action error or situation awareness stages. The four categories contain a total of 28 elements. Action error elements are divided into 22 further ‘items’, situation awareness elements are described by 21 ‘items’ and the error recovery elements contain 7 items. The 12 threat elements are divided into ‘sub-elements’ (n = 43) and ‘items’ (n = 271). The HFIT tool can be used in a number of different ways, first as an interview tool, where the investigator goes through the questions with each witness in turn. Secondly, the tool can be used after the witness interviews have taken place and the investigator/s use the tool themselves, keeping in mind what they found from the interviews. Finally, it can be used retrospectively on events that have been previously investigated using other investigation tools.

37
FIG. 15. HFIT model of event causation and direction of analysis.
Weaknesses
There have been inconsistencies with the results obtained by using this tool. It is resource intensive. One of the main issues seems to be the cost and resources implications for implementing new tools especially for large, international organizations.
FIG. 16. Structure of HFIT.

38
3.14. Psychological and Physiological Evaluation
‘Job relevant individual traits’ are features of human beings that define potentials and abilities for professional activity and training. These features are formed on the bases of genetic, social, and psychological factors. Requirements to the job relevant individual traits get stronger when work complexity and conditions increase. ‘Psycho-physiological evaluation’ is an investigation of job relevant individual and psycho-physiological traits. It is focused on the evaluation and forecast of the professional reliability of worker. Professional reliability is considered to be the relationship between these job-relevant individual traits and the job requirements. The psychological-physiological evaluation is also used in RCA to find root causes associated to psychological and physiological traits. Psychological and physiological investigation includes these following steps:
• Psychological evaluation with use of special psychological diagnostic tools; • Psycho-physiological evaluation with use of computer and other tools; • Psychological (employee oriented) interview; • Additional data gathering on individual traits from professional behaviors; • Preparation of conclusions based on obtained data analysis.
The psychological physiological evaluation areas are:
• Motivation and attitudes; • Job Relevant Individual Traits (JRIT); • Psycho-physiological traits (cognitive processes: perception, attention, memory,
thinking, central nerve system characteristics); • Fitness for duty (mental overstrain, emotional overdrive, mental overwork, mental
passivity, illness). And corresponding methods are chosen, for example:
• To assess motivation and attitudes; • To assess Job relevant individual traits; • To assess Psycho-physiological traits; • To assess Fitness for duty.
The evaluation conclusion includes:
• Psychological description of the evaluated person; • Description of job relevant and psycho-physiological traits; • Evaluation of the probability of inappropriate actions connected with psychological
and physiological traits. Application: the tool could be used in Root Cause Analysis for step of direct and root cause of erroneous actions of employee and allows to detect them on level of psychology and physiology. Advantages: allow to proactively remove a human factor failure mode.

39
Disadvantages: intrusion of privacy of individuals being investigated. Resources: trained medical staff, psychologists and human factor specialist, costly tool.
3.15. Ergonomics Analysis
The method is used by human factor specialists who are taking part in Root Cause Analysis, work place design, equipment quality assessment, investigation of esthetic and psycho-physiological work conditions. Ergonomics analysis evaluates the realtionship between the Man-Machine-Environment system (MMES) and traits and limitations of human being. Objects evaluated in an ergonomics analysis are: equipment, work environment and documentation. The following are ergonomic quality indicators:
• anthropometric (height, width, depth of work panel, placement of controls and so on); • biomechanical (instrument scales, user friendliness, frequency of controls use and so
on); • physiological (human sensory system such as visual, acoustic etc.); • psychological (Ability to receive, process and react to information and make
decisions). The ergonomic analysis of MMES could be fulfilled by the following set of ergonomic indices describing groups of ergonomic features:
• Anthropometric index describes correspondence between equipment features and human being body size and shape, mobility of body parts and other personal factors;
• Biomechanical index describes ergonomic requirements that define the relationship between technique, machine and human being strenght, velocity, energy, visual, acoustic, tactile, olfactory traits;
• Psychological index describes the relationship between machine and human being perception, memory, thinking, psychomotor system traits and also the level and type of group interaction;
• Hygienic index describes work environmental conditions – illumination, air temperature and wind velocity, humidity, radiation, noise, vibration, electromagnetic field, dust level, gas content, atmospheric pressure.
Ergonomic analysis consist of these following steps:
• to select an index for the object being analysed; • to evaluate values of this index and comparison with standards.
Application: the tool is used for Root Cause Analysis of human factor related problems and helps in the development of corrective actions to fix these problems. Advantages: when utilized whithin RCA the tool will highlight the following aspects:
• shortcomings of man-machine interfaces; • inappropriate workload;

40
• incompatibility to infrequently performed evolutions; • incompatibility to usability of documentation.
Disadvantages: use of the tool requires the presence of a specialist in ergonomics analysis.
3.16. Kepner Tregoe Analysis
Kepner-Tregoe is used when a comprehensive analysis is needed for all phases of the occurrence investigation process. Its strength lies in providing an efficient, systematic framework for gathering, organizing and evaluating information and consists of four basic steps:
• Situation appraisal to identify concerns, set priorities, and plan the next steps; • Problem analysis to precisely describe the problem, identify and evaluate the causes
and confirm the true cause. (This step is similar to change analysis); • Decision analysis to clarify purpose, evaluate alternatives, assess the risks of each
option and to make a final decision; • Potential problem analysis to identify safety degradation that might be introduced by
the corrective action, identify the likely causes of those problems, take preventive action and plan contingent action. This final step provides assurance that the safety of no other system is degraded by changes introduced by proposed corrective actions.
These four steps cover all phases of the occurrence investigation process and thus, Kepner-Tregoe can be used for more than causal factor analysis. Separate worksheets (provided by Kepner-Tregoe) provide a specific focus on each of the four basic steps and consist of step by step procedures to aid in the analyses. This systems approach prevents overlooking any aspect of the concern. A formal Kepner-Tregoe training is needed for those using this method. The steps that make up the problem analysis process of the Kepner-Tregoe technique are:
1. Describe the Problem. The problem is described by clearly stating the deviation, or stating what should have occurred and what actually occurred. As an aid in clearly stating the deviation, information should be gathered to answer the following questions:
• What is the deviation(s)? • Where is the deviation(s)? • When did the deviation(s) occur? • To what extent did the deviation(s) occur?
2. With this information in place, the next step of clearly understanding the deviation
is to develop an IS and IS NOT comparison chart. This chart should contain an information about what, where, when, and to what extent the deviation(s) IS along with what, where, when, and to what extent the deviation(s) IS NOT.
3. List the Possible Causes. This second basic step of the problem analysis process develops a list of possible causes for the specified deviation. This list is generated by listing the distinctions and/or changes that have occurred between the items of the IS and IS NOT lists. The causes of the distinctions or changes are then investigated.

41
4. Finding the True Cause(s). The last basic step of the problem analysis process is finding the true cause of the deviation. This step tests the list of possible causes for the most probable causes. This done by comparing all of the possible causes with the observed specifics (the IS/IS NOT chart) of the deviation. If the cause could produce all of the same observed specifics, it can be classified as a probable cause.
When all the probable causes have been determined, then the True Cause must be found and verified. This is done by further investigation, experimentation, observation, etc. of the most probable causes. As shown, the Kepner-Tregoe technique for performing a Root Cause Analysis does provide the basic benefits of a good analysis tool. This technique is a structured guideline to an investigator in determining the information needed, the questions to ask, and when to stop; i.e., when the root causes have been identified. The major drawback to this technique when performing Root Cause Analysis or determining their corrective actions is, as in any ‘thought’ process, extensive training in the technique is required and constant practice in its use is necessary. Also, a significant amount of time, energy and resources may be required for the verification of the true causes of the event. This technique, however, does provide a good base for the development of a more specific analysis tools to find root causes of reactor plant events. Advantages: this systems approach prevents overlooking any aspect of the concern Disadvantages: proprietary technique, licence required, complicated, extensive training in the technique is required and constant practice in its use is necessary. Also, a significant amount of time, energy and resources may be required for the verification of the true causes of the event.
3.17. Interrelationship Diagram (ID)
The ID, originally known as the relations diagram, was developed by the Society of Quality Control Technique Development in association with the Union of Japanese Scientists and Engineers (JUSE) in 1976. The relations diagram was part of a toolset known as the seven new quality control (7 new QC) tools. It was designed to clarify the intertwined causal relationships of a complex problem in order to identify an appropriate solution. The relations diagram evolved into a problem-solving and decision-making method from management indicator relational analysis, a method for economic planning and engineering. The interrelationship diagram takes complex, multivariable problems and explores and displays all of the interrelated factors involved. It graphically shows the logical (and often causal) relationships between factors. The ID allows groups to identify, analyse, and classify the cause-and-effect relationships that exist among all critical issues so that key factors can be part of an effective solution. The intent of the ID is to encourage practitioners to think in multiple directions rather than linearly so that critical issues can emerge naturally rather than follow personal agendas. The ID assists in systematically surfacing basic assumptions and reasons for those assumptions. In summary, the ID helps identify root causes. The ID uses arrows to show cause-and-effect relationships among a number of potential problem factors. Short sentences or phrases expressing the factor are enclosed in rectangles or ovals. Whether phrases or sentences are used is a group decision, but authors recommend the

42
use of at least a noun and a verb. Arrows drawn between the factors represent a relationship. As a rule, the arrow points from the cause to the effect or from the means to the objective. The arrow, however, may be reversed if it suits the purpose of the analysis. The format of the ID is generally unrestricted with several variants. The centrally converging ID places the major problem in the center with closely related factors arranged around it to indicate a close relationship. The directionally intense ID places the problem to one side of the diagram and arranges the factors according to their cause-and-effect relationships on the other side. The applications format ID can be unrestricted, centrally converging, or directionally intense, but adds additional structure based on factors such as organizational configuration, processes, or systems. The ID may use either quantitative or qualitative formats. In the qualitative format, the factors are simply connected to each other and the root cause is identified based on intuitive understanding. In the quantitative format, numeric identifiers are used to determine the strength of relations between factors and the root cause is identified based on the numeric value. It is recommended to follow such procedure when creating a relations diagram:
• Step 1: Collect information from a variety of sources; • Step 2: Use concise phrases or sentences as opposed to isolated words; • Step 3: Draw diagrams only after group consensus is reached; • Step 4: Rewrite diagrams several times to identify and separate critical items; • Step 5: Be not distracted by intermediate factors that do not directly influence the root
causes. It is recommended asking why questions to surface true cause-and-effect relationships and to slow the process so participants can critically evaluate, revise, examine, or discard factors. The first step for using an ID is to determine and label the factors, then place them on an easel or whiteboard in a circular shape and assess the relationship of each factor on other factors using arrows. After all relationships have been assessed, count the number of arrows pointing into or out of each factor. A factor with more ‘out’ arrows than ‘in’ arrows is a cause, while a factor with more ‘in’ arrows than ‘out’ arrows is an effect. The causal factors form the starting point for analysis. Figure 17 shows an example of an unrestricted quantitative interrelationship diagram. A variant of the ID is the ID matrix, which places all the factors on the first column and row of a matrix. This format creates a more orderly display and prevents the tool from becoming too chaotic when there are many factors. The strength and direction of the relationships can be represented through arrows, numbers, or other symbols placed in the cells of the matrix. It is observed that users become careless with large, complicated diagrams, so the ID matrix is a good technique to force participants to pay attention to each factor in a more systematic fashion. A particular concern of the ID is that it does not have a mechanism for evaluating the integrity of the selected root cause. In using the quantitative or qualitative method, practitioners must be able to assess the validity of their choices and the strength of the factor relationships. Some users may simply count the number of arrows and select a root cause without thoroughly analysing or testing their assumptions about the problem.

43
Overall, the ID’s strength is that it is a structured approach that provides for the analysis of complex relationships using a nonlinear approach. The disadvantage is that it may rely too heavily on the subjective judgments about factor relationships and can become quite complex or hard to read.
FIG. 17. Example of an unrestricted quantitative interrelationship diagram.
3.18. JNES Organizational Factors List (JOFL)
The Japanese Nuclear Energy Safety Organization (JNES) prepared the JNES Organizational
Factors List (JOFL) as a reference list for regulatory body to confirm the appropriateness of
organizational factors found by the licensees’ root cause analyses [JNES ceased to exist in
March 2014 as a result of integration into Nuclear Regulation Authority (NRA), Japan]. The
tool allows the regulator to evaluate organizational factors from various root causes analyses
so that they possibly can be combined in order to identify communalities.
This reference list is composed of six key factor areas that refer to a structure of 33 intermediate classifications as well as 137 questionnaires for the confirmation of each perspective. The six key factors areas are:
• external environmental factors; • organizational psychological factors; • corporate governance factors; • senior management factors; • group factors; • individual psychological factors.

44
Figure 18 indicates potential causal relationships among the factors considered in conducting a Root Cause Analysis. The licensee’s RCAs are evaluated utilizing the ‘JOFL classification’ following three steps:
1. Identification of middle management factors that caused the nonconformity. 2. Identification of top management factors that caused the problem with middle
management factors. 3. Analyse the nonconformity with middle management factors and top management
factors in a logical and integrated investigation. As necessary, the association of individual personal psychological factors with group factors (work related psychological factors) and organizational psychological factors should be analysed. Time to complete process is shorter than other methods. Limitations
• As the main target of this method is to assess the effectiveness of a Root Cause Analysis, identifying problems in the timeline is outside of the scope.
• As the set of ‘JOFL classification’ refers to a typical ideal organization and uses a
different terminology and definition of root cause compared with other methods, analysts may need to make changes for it to match with the organization which is the subject of the evaluation.
FIG. 18. Potential causal relationships (JOFL).
External environm
factor
Intermediate
management factors Operational
management factors
Collective factors Individual factors
Organization psychological factors
Organization psychological factors
Ex
tern
al E
nvir
on
me
nta
l
Fac
tor
Senior Management Factor
Corporate
Governance Factor
Group Factor Individual Psychological
Factor
Organizational Psychological Factor
Organizational Psychological Factor

45
4. COMPARISON OF TOOLS AND TECHNIQUES
Table 1 compares tools and techniques in the following areas:
Type of issue or event to be analysed
In this column the type of issue or event for which the technique is best suited is specified:
• Equipment issues (see Apendix III: Example of a list of equipment failure modes, for an example of a failure mode list);
• Human and organizational issues; • programmes issues (documentation, procedures, etc.); • Complex events.
Amount of information needed to perform it
Total amount of information needed to apply efficiently the tool. Single event / repeated events/ trend
In this category it is specified whether the techniques is more suitable for one single events or repeated ones, or it is more suitable to investigate trends. Safety significance
In this category it is specified the safety significance of the issue for which the technique is best suited. Technique completion time (preparation and execution)
Overall time necessary to execute the technique. Resources needed
Training for the technique, skills, competences, team size necessary to execute the technique.
46
TABLE 1: COMPARISON OF TOOLS AND TECHNIQUES
Root cause
analysis tool
Type of issue
or event
Amount of
information
needed to
perform it
Single event /
repeated
events / trend
Safety
significance
Necessary time for
the application of
the technique
(preparation and
execution)
Resources and
training needs Advantages Disadvantages
Interviewing All Low Single event
Repeated events
Any Quick Trained and experienced interviewer
Information gathering technique for investigations
Technique cannot be used alone to identify root causes. Should be used soon after event.
Task Analysis All Low / task specific
Parts of any event
Can be used for any
Time to complete process is moderate; however, individual causal factors can be identified quickly.
Minimal training required
Someone familiar with the type of task being evaluated.
Easily identifies differences between the proper performance of a task and the performance of the task at the time it was performed when it was related to the event being investigated.
Very helpful to identify causal factors that relate to physical environment and man-machine interface.
Usually requires the availability of an individual technically knowledgeable of the task being evaluated.
May be not effective when task cannot be re-enacted.
Used specific to single tasks, cannot be used for complex evolutions by itself.
Technique cannot be used alone to identify root causes.

47
Change
Analysis
All Low to Medium
Single event Recommended for low / medium
Medium Minimal training required
Best technique for identifying causes of issues when something changes between a successful evolution and one that has contributed to an event or issue.
Can be used for any type of change from a standard approach.
Must be used together with task analysis when change being evaluated is composed of more than one task.
If used in isolation, can result in only the obvious changes being identified.
Cannot be used for first time evolutions.
Can overlook gradual changes or evaluator, can accept the wrong - obvious answer.
Technique cannot be used alone to identify root causes.
Barrier
Analysis
All Medium Single event
Repeated events
Any Short Minimal training required
Someone technically familiar with the process or evolution being investigated.
Can identify probable causal factors with a systematic approach.
Used in conjunction with E and CF, can identify process weaknesses and the effectiveness of proposed CAs.
If the evaluator is not familiar with the technical aspects of the event being investigated, they may not recognize all barriers.
Technique cannot be used alone to identify root causes.
Event and
Causal Factor
Chart
All High / entire event
Single event
Repeated events
All Significance levels
Time to Complete process is long, however, individual causal factors can be identified quickly.
Trained/experienced E and CF evaluator
Provides an illustration of the whole problem from initiating event through recovery actions.
Time consuming
Evaluator needs experience for proficiency
Technique is not useful for evaluation of trends unless they are a result of a sequence of issues over a period of time.

48 Cause and
Effect Analysis
Non-complex events
Low, but causal factors must be identified prior to performance of this technique
Single event Recommended for low to Medium
Quick Minimal training required
Someone familiar with the process
Provides an easy approach for identifying root causes, for non-complex events.
Begins after causal factors are identified, therefore when viewed by itself it will not provide all background information to understand a complex problem.
Requires experience to ask the right questions.
Fault Tree
Analysis
Equipment High Single event
Repeated events
High Long Minimal training required, however technical knowledge of the issue being investigated is important.
Allows for a graphic depiction of how cause and effect are related to the event being investigated.
Can be used to evaluate complex events with multiple outcomes.
Good method for evaluating equipment failures.
Subjective in that all possible causes must be identified in order for this tool to work properly.
Designed more for identifying direct causes rather than causal factors.
Technique cannot be used alone to identify root causes.
Event Tree
Analysis
Equipment High Single event
Repeated events
High Long Minimal training required
A specialist in PRA is needed
Technical knowledge of the issue being investigated is important.
Specialized software
Each outcome is weighted allowing for the prioritization of corrective actions based on impact on the event or issue being evaluated.
Labour intensive
Needs to be used with other techniques to populate the event tree.

49
5 Whys, Why
Staircase
All Low All All Once causal factors are identified (depending on other techniques used), time to complete process is quick.
Not many resources or training needed
Most effective when performed by individual with a leadership perspective of the organization.
Can be used for all types of events to identify programmatic and organizational weaknesses.
Simple technique, used to challenge the causes identified by other techniques.
Highly subjective
Difficult to know when to stop asking ‘why’ (experience needed).
Does not easily differentiate between root causes, contributing causes to an event.
Needs to be used by an investigator familiar with the specific programmes and organization.
Need to be used with other techniques to identify the causal factors.
Common Cause
Analysis
All High Trend Can be used for all levels
High Training should include using trend reports, understanding causal factors and how they are assigned.
Can be used to identify programmatic or organizational weaknesses when trends of causal factors appear.
Can be used with any data sets that causal factors can be assigned to.
Quality of the analysis depends on the number and accuracy of the data points
A successful CCA will only result in the identification of the more dominant common causes for a group of events; a root cause method must be used in order to identify root causes and contributing causes to the trends identified.
Current Reality
Tree
Organizational or programmatic
High Single event
Repeated events
Medium / high Time to complete process is long, however, time to identify individual causal factors can be moderate.
Process expert in the use of this method
Individual with technical knowledge of organization
Allow finding common grouping and organizes them for many different issues.
Good for identification of organizational factors.
CRT could be found too difficult or time consuming.
Need to be used with other techniques to identify the causal factors.

50 Failure Modes
and Effects
Analysis
Equipment issues
High Single event
Repeated events
High Long High technical expertise related to the failure
Trained facilitator is needed
Provides a disciplined approach to evaluating possible cause of equipment failures.
Good method to confirm the cause and support the determination of the most effective CAs.
Time consuming
Expertise is needed to effectively evaluate possible causes. The team may not recognize all potential causes.
Need to be used with other techniques to identify the causal factors.
Human Factor
Investigation
Tool
Human performance
Medium / high Single event High Long
Need human factor specialist
HFIT is useful for the development of corrective actions related to human performance improvement.
Resource intensive
The tool relies heavily on the expertise of the specialist in order to get an accurate outcome.
Physiological
and
Psychological
Investigation
Human performance
Medium Single event
Repeated events
High Medium Trained medical staff and human factor specialist
Allows for the proactive identification and correction of a human performance failure mode.
Some individuals may consider this tool to be an excessive intrusion of their privacy.
Ergonomics
Analysis
Human performance
Low Single event Low / medium Moderate, however, time to identify individual causal factors can be quick.
Human factor / technical expertise
The tool highlights these following aspects:
• shortcomings of man-machine interfaces;
• inappropriate workload;
• incompatibility to infrequently performed evolutions;
• incompatibility to usability of documentation.
The tool relies heavily on the expertise of the specialist is necessary in order to get an accurate outcome.

51
K-T Problem
Analysis
Equipment issues
Medium / high Single event
Repeated events
High Time to complete process is long, however, time to identify individual causal factors can be moderate.
Training, experience, licence, technical expertise, team needed.
It is a rational, industry proven process that allows a focused approach to solving discrete problems. The system approach prevents overlooking any aspect of the concern.
Proprietary technique, licence required, extensive training in the technique is required and regular practice in its use is necessary.
Significant amount of time, energy and resources may be required for the verification of the true causes of the event.
Interrelationship
Diagram
Complex High Single event High Long Team needed It is a structured approach that provides for the analysis of complex relationships using a nonlinear approach.
Subjective and complex
It needs to be used with a method to validate the accuracy of the root causes identified.
JNES
Organizational
Factors List
(JOFL)
Human and organization issues
Low Single event
Repeated events
Recommended for High, can be used for any.
Individual causal factors can be identified quickly.
Someone with a little training can analyse by using a set of ‘JOFL classification’.
Questionnaires
Provides an illustration of the whole problem and contributing factors. Works very well with barrier analysis.
Identifying problems in the timeline is outside the scope (target of this method is to assess the effectiveness of a root cause analysis).
Analysts may need to make changes to match the organization which is the subject of the evaluation.

52
5. METHODS
This section provides a short description of the following methods:
1. Human Performance Enhancement System (HPES)
2. Korean Human Performance Enhancement System (KHPES)
3. Japanese Human Performance Enhancement System (JHPES)
4. Man-Technology-Organization Investigation (MTO)
5. Human Performance Evaluation Process (HPEP) 6. Management Oversight and Risk Tree (MORT)
7. Paks Root Cause Analysis Procedure (PRCAP)
8. Safety through Organizational Learning (SOL)
9. Assessment of Safety Significant Events Team (ASSET)
10. Accident evolution and barrier function (AEB)
11. Control Change Cause Analysis (3CA) 12. TRIPOD Beta
13. Systematic Approach For Error Reduction (SAFER)
14. Psychological Root Cause Analysis of Human Factor Method
15. Commercial RCA products:
• TapRoot® • Apollo root cause analysis • REASON® • PROACT®
The CD-ROM inside the back cover of this document also contains manuals and information on the following:
1. Control Change Cause Analysis (3CA FORM C)
2. Assessment of Safety Significant Events Teams (ASSET) 3. Japanese Human Performance Enhancement System (J-HPES)/Systematic Approach
For Error Reduction (SAFER)/JNES Organizational Factors List (JOFL)
4. Human Performance Evaluation Process (HPEP)
5. Events and Conditional Factors Analysis Manual (ECFA+) 6. Management Oversight and Risk Tree (MORT)
7. Paks Root Cause Analysis Procedure (PRCAP)
8. Psychological Root Cause Analysis of Human Factor Method
9. Safety through Organizational Learning (SOL)
10. Tripod Beta
These manuals and information have been taken from available publications, information available on the internet and information provided by contributors to the development of this TECDOC.

53
In the section below, where information was available, limitations of the methods are highlighted (limitations are weaknesses inherent of the particular method that limit its effectiveness in being used for a particular type of issue or event). With all methods specific training is required and regular practice at utilizing the method is important to maintain proficency.
5.1. Human Performance Enhancement System (HPES)
HPES is a method developed by Institute of Nuclear Power Operations (INPO) in 1990. It is designed directly for investigation of events in nuclear facilities involving human factor related problems and is widely distributed within the nuclear industry. It is user friendly and makes extensive use of graphic representation. For these reasons many other methods similar to HPES have been developed based on this technique and adapted as necessary by different individual organizations for their specific needs and requirements, for example: HPEP by the United States Nuclear Regulatory Commission (US NRC), MTO by the Swedish NPP operators, KHPES by the Korean NPP operators, JHPES by the Japanese NPP operators, and HPES is used by the United Kingdom NPP operators. Therefore, for the purposes of a strengths and limitations review, these methods can be considered to generally fall into one ‘school’ of approach. The HPES method utilizes task analysis, change analysis, barrier analysis, cause and effect analysis and interviewing. Event related information is graphically represented in an event and causal factors chart. The integrated event and causal factorss graphic shows the direct causes, the root causes, the contributing causes, the failed barriers with their interconnections and dependencies. Although valid for all types of issues (technical, procedural, etc), the method is oriented to enhance the determination of the human performance issues. A human performance specialist is recommended to be part of the team. Nevertheless, due to its systematic approach, the method can be very well used after a short practical training by non specialists. The event investigation team members are kept proficient with the technique by frequently practicing the method and participating in investigation teams. The HPES method is a systematic process to guide the event investigator first to understand what happened before attempting to understand the causes. To understand the mechanism of the human performance (or the individual’s behaviour) during the event it is necessary to find out how the event happened. To find the causes, it is determined why the behaviour occurred and what additional factors contributed to the event. It is carried out by systematically performing several steps (these are outlined in Annex I of this document):
• Task analysis. One of the first priorities when beginning an event investigation is to determine as much as possible about the activity that was being performed;
• Further information gathering (e.g. interviewing, walkthrough, etc.);
• Change analysis. The purpose of this step is to explore the potential affective changes which might be contributory to the event;
• Barrier analysis. For each primary event and primary effect the conditions are examined which allowed or forced it to occur. Conditions are circumstances pertinent to the situations that may have influenced the course of events. The conditions (causes) are placed on the chart (in ovals)

54
showing their relationship to the effect. For each identified condition, the question is asked, why that condition existed i.e. the condition is treated as an effect and the causes are determined. This cause-and-effect process is repeated until:
• Correction of the cause is outside the control of the organization; • Correction of the cause is determined to be cost prohibitive; • The primary effect is fully explained; • There are no other causes that can be found that explain the effect being investigated; • Further cause and effect analysis will not provide further benefit in correcting the
initial problem. The HPES Causal Factor Work Sheets provide guidance for performing the cause-and-effect process and for determining the actual causal factors and root causes of the event. Based on each root cause and failed barrier, the corrective actions are identified. The corrective actions must meet the following criteria:
• Will the corrective actions prevent recurrence of the event? • Is the corrective action within the capability of the utility to implement?
This method is mostly used for significant events. The HPES system is useful to help identify potential contributing causes that may be initially outside the mindset of the investigator. A full analysis typically requires 200-300 man-hours on average. Lower level events can be investigated in a simplified format with less resource. The HPES method provides the following strengths:
• While the main focus is on human factors, it has been demonstrated that it can be equally applied to equipment and design related issues;
• Systematic approach which can be used by non-human factors specialists to give consistent results following a limited period of training and practice in the method;
• The event and causal factors charting is a powerful tool for presenting the event genesis, root cause development, and failed barriers in a concise and easily understood format;
• Corrective actions which address the root causes can be easily developed from the event and causal factors chart;
• Effective tool for the investigation of individual events, with a proven track record at many NPPs;
• Can be used flexibly or in a shortened format if required. This is particularly useful for ‘apparent cause’ analysis of near miss or low level events for subsequent use in significant event precursor trending;
• Has been proven effective in identifying training and knowledge weaknesses whenever they are contributing factors to events;
• Can be used proactively to identify and correct ‘error-likely’ conditions and situations before they result in events;
• Identification of specific root causes and causal factors by coding allows for easy trending of event contributing factors.

55
Limitations:
• Organizational and programmatic factors are not strongly supported by the method. It
can be difficult from a single event investigation to target management weaknesses; • The application of the whole process can be time consuming, particularly in the area
of interviews of personnel. The HPES and associated techniques have now been adopted by many countries and organizations. The approach has been proven to be practicable and successful across a broad spectrum of NPP operators and cultures, having been adapted where necessary to meet local needs. Its limitations in the managerial and organizational areas have been addressed by those organizations which are increasing focus on these issues.
5.2. Korean Human Performance Enhancement System (K-HPES)
KHNP (Korea Hydro Nuclear Power Company) introduced K-HPES (Korean-version Human Performance Enhancement System) based on the HPES method. K-HPES was upgraded as a web based system with its Root Cause Analysis method refined in 2007. K-HPES was developed by replacing the behavioural factor analysis of HPES with operator’s cognitive model. This model utilized a set of check items to discover causes of an event. In this method, ‘accidents’ are described in series of events, and the events are traced down to search for root causes. Some causes are selected and classified using both an attribute table and classification tree, and they are further analysed with barrier analysis, finally are linked to corrective actions. K-HPES provides both a tree consisting of nine causal factors at the first level and an attribute table to categorize the causes. The nine causal factors include defective device, environment, and documents such as procedures, task management, organization, knowledge, workload, communication, and attitude shown in Figure 19. These first level causal factors are further decomposed until detail causal factors are obtained. The attribute table is used to find ergonomic factors of human error committer. The workflow of K-HPES is fully computerized and customized graphic user interfaces are provided.
FIG. 19. Cause Classification Tree (K-HPES).
Attitude
Tool
Causal Factor
Defect Device
MMI
Dev
CommEnviron Load Knowledge
Document Task Manage
Edu Edit Qual Shif Meth Attit Sup Plan Envi Prot Char Staff
Orgn.
Mang Budg Adhe
56
5.3. Japanese Human Performance Enhancement System (J-HPES)
The Central Research Institute of Electric Power Industry (CRIEPI) in Japan developed a human error analysis method, J-HPES (a Japanese version of the HPES) in 1990. The J-HPES was developed by fully modifying the HPES method, so that it was adapted to a Japanese environment. Developed as a remedy-oriented system for systematically analysing and evaluating human-related events occurring at nuclear power plants, this method aims in particular at identifying causal factors and deriving proposals for specific hierarchical corrective actions.
The procedure of the J-HPES comprises four stages:
1. Correct understanding of events. 2. Circumstantial analysis (gathering human factor data). 3. Causal analysis. 4. Proposing corrective actions.
The causal analysis stage (Stage 3) is applied to each trigger action (defined as a human action contributing directly to an abnormal change of machinery state in an event). The approach applies the modified fault tree method to initiate a search reaching down to the ultimate underlying causal factors. This causal relation chart clarifies the direct causal factors that have induced the trigger action, indirect causes that have contributed to the direct causal factors, and latent causes that have contributed to the indirect causes. The revised process, named HINT/J-HPES, comprises four stages. HINT is not an acronym, but was added to the name of the method because the revised version includes enhanced hints, in the form of the basic framework for causal analysis. Stages 1 and 4 have not changed from those of the original J-HPES. Gathering information for Stage 2 has been enhanced by using the causal factor reference list, with the basic framework as a reference. The framework has also been applied to the causal analysis (Stage 3) to guide the search down to the management factors. The causal factors are analysed to draw up a causal relation chart in the format shown in Figure 20. This method has been used mainly by the Japanese nuclear power industry. The basic framework for human error event analysis shown in Figure 20 is applied to a causal analysis after identifying trigger actions. First, the factors concerning personnel involved at implementation phase that is the working level are examined. These factors concern workers or work group members. Next, the local workplace factors such as task demands and work environment are examined. After that, work control such as preparing procedures and work packages is examined. Finally, management factors such as training, quality control, and safety culture are analysed. The causal factors reference list is summarized based on this framework, in order to assist investigators who do not have sufficient knowledge about human factors in identifying causal factors.

57
Resources and skills needed:
Requires a team that consists of a few members trained in the method, personnel involved, and a team leader with management experience.
FIG. 20. HINT/J-HPES method.
5.4. Man-Technology-Organization Investigation (MTO)
MTO is a systemic theory with a focus on the interactions between man, technology and organizations. It is a modified version of HPES method adopted by Swedish nuclear industry. The method uses three basic tools: event and cause analysis, barrier and change analysis. To structure the process events and causal factors flow-charts are used. MTO investigations are mostly used for significant events related to human and organizational factors. The basis for the MTO-analysis is that human, organizational, and technical factors should be focused equally in an event investigation. As previously mentioned, the MTO-analysis is based on the employment of three commonly used tools:
• Structured analysis by use of an event- and cause-diagram;
• Change analysis by describing how events have deviated from earlier events or common practice;
• Barrier analysis by identifying technological and administrative barriers which have failed or are missing.
The first step in an MTO-analysis is to develop the event sequence longitudinally and illustrate the event sequence in a block diagram (see Figure 21). Then, the analyst should identify possible technical and human causes of each event and draw these vertically to the events in the diagram.

58
The next step is to make a change analysis, i.e. to assess how aspects in the event progress have deviated from normal situation, or common practice. Normal situations and deviations are also illustrated in the diagram below. The investigator must further analyse which technical, human or organizational barriers have failed or were missing during the event progress. The investigator must also illustrate all missing or failed barriers below the events in the diagram. The basic questions in the analysis are:
• What may have prevented the continuation of the event sequence? • What may the organization have done in the past in order to prevent the event?
The last important step in the MTO-analysis is to identify and present recommendations. The recommendations should be as realistic and specific as possible, and might be technical, human or organizational.
FIG. 21. MTO-analysis worksheet.
5.5. Human Performance Evaluation Process (HPEP)
The Human Performance Evaluation Process is a resource developed for US NRC inspectors to use when reviewing licensee problem identification and resolution programs with regard to human performance. It is divided into two parts. Part I provides a step-by-step process for
59
reviewing licensee effectiveness in identifying, analyzing and resolving human performance problems. Part I also addresses the challenges in identifying and investigating human performance problems, describes three root cause analysis techniques, and discusses characteristics of effective corrective action plans. Part II is comprised of the HPEP cause tree and modules. The cause tree is a screening tool for identifying the range of possible causes for a human performance problem. The modules describe frequently identified causes for human performance problems and provide examples. Part II is intended to support the evaluation of licensee root cause analyses for human performance problems identified in Part I. Human errors may play several different roles in an event sequence. An error may:
• Directly cause an event; • Contribute to an event by setting up the conditions that, in combination with other
events or conditions, allowed the event to occur (e.g., leaving a valve open that should be closed);
• Make the consequences of an event more severe; or • Delay recovery from an event.
Human errors typically contribute to events rather than directly cause them. In fact, a single human error directly causes very few significant events because most systems that involve nuclear processes are designed to be fault-tolerant; that is, designed to prevent a single human action (or failure to act) from causing an event with important consequences. More often, a risk-significant event involves several system deficiencies, some of which may have happened long before the event takes place. For example, errors in the original installation of a system may set the stage for another human error to initiate an event months or years later. The value of investigating the human errors involved in an event is to understand what caused them so that corrective actions can be developed to minimize the likelihood of recurrence. It is also important to detect and correct patterns of errors before they result in an event. Human performance trends are a pattern of related errors resulting from the same causal factors. The HPEP is not intended to replace existing NRC inspection procedures. The purpose of the HPEP is to support NRC staff reviews of the effectiveness of licensee problem identification and resolution programs in detecting and resolving human performance problems. Methods are presented for evaluating licensee investigations of human performance problems, root cause analyses and corrective actions. Part I of HPEP includes:
• An overview of the HPEP; • Human performance problem review; • Identifying human peformance problems and their causes; • Investigation methods for human performance; • Evaluating the licensee’s root cause analysis; • Evaluating corrective action plans.
Part II of the HPEP includes:
• An overview of the HPEP cause tree and modules; • Fitness for duty; • Knowledge, skills and abilities; • Attention and motivation; • Procedures; • Tools and equipment;

60
• Staffing; • Supervision; • Human-system interface; • Task environment; • Communications; • Coordination and control.
5.6. Management Oversight and Risk Tree (MORT)
MORT method is an analytical procedure for inquiring into causes and contributing factors of events. The MORT method reflects the key ideas of a 34-year program run by the US Department of Energy to ensure high levels of safety and quality assurance in the energy industry. MORT is a method originally developed for analysing events of nuclear safety significance for which organization and management issues are apparent, and was later adapted for more general event investigation and safety assessment. The MORT method analyses an organization’s functions for managing its risks effectively. These functions have been described generically; the emphasis is on ‘what’ rather than ‘how’, and this allows MORT to be applied to different industries. MORT reflects a philosophy which holds that the most effective way of managing safety is to make it an integral part of business management and operational control. According to the philosophy of the MORT system, an event is caused by an ‘energy flux’ which is not controlled in the right way by adequate barriers and/or control upon the unwanted energy transfer. It is based on developing the analysis through several interconnected fault trees each one representing a domain of investigation and filling in the fault trees using a predetermined check list. A predetermined check list of around 100 generic problems and 200 basic causes is utilized. The implementation of this technique presents a certain complexity which requires expert users with a relatively higher expenditure of man-hours and resources for the investigation. Some versions of this technique were registered as a commercial product and are supported by software to expedite the diagnosis. The MORT method consists of three steps:
• Step 1: define the events to be analysed; • Step 2: characterize each event in terms of unwanted transfers of energy; • Step 3: evaluate the hypothesis that the unwanted transfers of energy were the result of
how risks were being managed in the activity in which the event occurred. Step 1 is supported using a procedure called Energy Trace and Barrier Analysis. In this step the analyst is trying to identify a complete set of events and to define each of them clearly. It is very difficult to use MORT, even in a superficial way, without first performing an Energy Trace and Barrier Analysis. In Step 2, the analyst looks at how the energy was exchanged with the person or asset. This way of characterizing events – as a series of ‘energy exchanges’ –was proposed as a means of analysing them scientifically. There may be several different energy transfers that need to be considered in the same investigation. In this step, the analyst aims to understand how the harm, damage or danger occurred.

61
In Step 3, the analyst considers how the activity was managed. This step involves the analyst looking at the ‘local’ management specific to the activity and resources. The analyst also looks ‘upstream’ to find management and design decisions about people, equipment, processes and procedures that are relevant to the event. To help make this analysis systematic, the analyst uses the MORT chart (Figure 22); this lists the topics and allows an analyst to keep track of his/her progress.
FIG. 22. Main Branches of the MORT Tree.
Each topic on the MORT chart has a corresponding question in the set of questions provided in advance. The questions in MORT are asked in a particular sequence, one that is designed to help the user clarify the facts surrounding an event (Figure 23). The analyst, focused on the context of the event, identifies which topics are relevant and uses the questions in the manual as a resource to frame his/her own inquiries. Like most forms of analysis applied in investigations, MORT helps the analyst structure what they know and identify what they need to find out; mostly the latter. The accent in MORT analysis is on inquiry and reflection by the analyst. MORT is a proven and free to use method. It looks to the whole management structure, uses detailed fault tree and gives up to 1500 potential causal factors. MORT uses barrier analysis and identifies the assumed risks taken by management. Computerized versions are available. MORT was found to be easy adaptable for quick analysis of simple events.

62
Limitations:
• Perceived by some to be complex, costly and time consuming due to extensive task analysis;
• Some versions of MORT and appropriate software are a commercial product that is only available for a fee;
• Not appropriate for use by NPP staff in routine investigations.
FIG. 23. Sequence for work though the MORT Chart.

63
5.7. Paks Root Cause Analysis Procedure (PRCAP)
The Paks Root Cause Analysis Procedure (PRCAP), has been developed to meet the safe and reliable operations of the Paks Nuclear Power Plant (NPP). PRCAP was originally an adaptation of the Human Performance Investigation Process (HPIP) of the US NRC and of the safety management factors in the Management Oversight and Risk Tree (MORT) of the US Department of Energy. Nevertheless, significant modifications and amendments were made to incorporate features of RCA methods currently used in the world, together with specific requirements for RCA at Paks NPP. PRCAP has extended the searching system and the cause modules of HPIP to cover potential contributions of ‘Equipment’ and ‘Personnel’ in the RCA; The complete process is presented in Figure 24 and consists of three columns:
• PRCAP Flow, which displays the major steps used to investigate and analyse an event (central column of the diagram);
• Purpose of each of the major steps, (left column of the diagram); • Tools, which are the RCA techniques, criteria, guidance/guidelines used in the major
steps (right column of the diagram). Among those tools, three are essential to perform RCA when following this process: PORTM, the PRCAP modules and the Event and Causal factors (E and CF) Charting. PORTM (Prevention, Observation, Response, Team Performance, and Management) is a decision tree represented by a series of Yes/No questions for logic identification of equipment and human performance factors. Application of PORTM will guide the investigator/ analyst during the investigation process to focus on those areas where the additional investigation is needed, and during the analysis process to allocate the findings or conclusions into one or more standard categories of the PRCAP modules in order to identify causal factors. The PRCAP modules cover all the basic elements (equipment, personnel and procedure) and the essential environmental/ managerial factors, which may contribute to or result in an event. The seven PRCAP modules or categories of causal factors are:
1. Equipment.
2. Personnel. 3. Procedures.
4. Human-Engineering.
5. Training.
6. First Line Supervision.
7. Management Systems.
Each module is formulated in a tree structure with branches and causal factors at three levels; they are structured with the intention to address all problems that could arise in analysing direct causes, contributing causes and root causes of the operational events.

64
FIG. 24. PRCAP process flow.
Purposes Process Flow Main Tools
Selecting significant &/or representative events for formal analysis
Select Events to be Subjected to RCA
Event Reports, Criteria for Selection of Events,
RCA Team Formation Organizing available facts from the selected event report for planning
Develop a Sequence of Event Occurrences
The Selected Event Report E&CF Charting
Establishing lists of questions for performance of investigation
Planning for Performance of Investigation
PORTM Guidelines Change Analysis
Barrier Analysis
Collecting additional information and objective evidence
Interview Personnel
Collect Evidence
E and CF Charting Interview Techniques
Organizing all obtained facts and causes related to the event development
Establish a Comprehensive E and CF Chart
E and CF Charting Barrier Analyses Tree Diagram
Searching the real problems (causal factors) contributing to the event
Analyse Problems and Categorize Factors
PORTM Guidelines PRCAP Modules
Analyzing a direct cause, contributing causes and a root cause of the event
Determine Root Cause of the Event
PRCAP Modules Criteria of Identification
Ensuring corrective actions addressing root cause and cost-effectiveness
Prioritize Corrective Actions Based on RCA
Criteria of Prioritization
Ensuring satisfactory presentation to convince the management and public
Prepare an RCA Report
E and CF Charting Guidance for RCA Report

65
5.8. Safety Through Organizational Learning (SOL)
SOL (Sicherheit durch Organisationales Lernen - Safety through Organizational Learning) was initially developed by the University of Berlin in collaboration with the TÜV. It requires a multidisciplinary team in order to ensure a wide approach. The SOL method covers the identification of human as well as technical, organizational and management factors. During the first phase of the analysis event data is collected, without questioning its significance (see Figure 25). In the second phase the data is organized in elements of the event as individual actions performed by the personnel, organizational unit or by systems. This is then classified chronologically for each factor (called ‘actor’) and represented in a graphic actor-action-time. The method uses a predetermined set of direct causes and contributing factors. On the basis of the selected direct causes the method proposes questions to be addressed to help identify the contributing causes. These elements are successively added to the graphic actor-action-time facilitating the progress of the investigation and the further collection of information. SOL method analyses events using a backward oriented problem-solving process. SOL employs the concept of event analysis in a set of two standardized process steps: (1) the description of the actual event situation, and (2) the identification of contributing factors. As the first step of the analysis, a situational description is constructed. The information needed for the description of the event is gathered by interviews and document analysis. A set of questions helps the analyst to ask the right questions in order to completely reconstruct the course of an event. The collected information is broken down into a sequence of event-building blocks, i.e. the event is decomposed into a sequence of single micro-events to clarify and illustrate what happened. For each event-building block the information is categorized according to the actor (human and technical actors), the action, the point in time of the action, the location (where the action takes place) and additional remarks. Thus, an event is determined by a sequence of singular actions by different actors. The starting point of an event (i.e. the first event-building block) is defined as the first deviation from a warranted course of action. These deviations are identified by contrasting actions against formal procedures and technical system design or against ‘normal’ system performance based on the appraisal of an event analyst. The end point (i.e. the last event-building block) is defined as the recovery of a safe system state. The situational description illustrates only observable facts (what happened). Actions which were not shown as well as hypotheses about potential causes should not be incorporated into the situational description. Each event-building block is graphically ordered in a time-actor diagram which provides an overview of the recomposed event and serves as an important information source for the subsequent identification of contributing factors. The identification of contributing factors, i.e. the second step, is conducted in the following way: for each event-building block a separate analysis is conducted. An identification aid supports the categorization of potential contributing factors which cover individual, technical, group, organizational and inter-organizational aspects to guarantee a sufficient scope of investigation.

66
FIG. 25. SOL and SOL-VE analysis procedure.
In order to support the identification of contributing factors each factor is assigned to a general question. For instance, the factor ‘working conditions’ is transferred into the question ‘Could there have been an influence of the working conditions on the operator’s performance?’. For each factor several specific examples are given to support the analysts, e.g. for ‘working conditions’ the examples are time pressure, noise, heat, lights or disturbances. Thus, the aid contains general questions related to possible contributing factors covering each of the five sub-systems in order to ensure the comprehensiveness of the analysis. Since it is assumed that an event analyst may not exclusively be a human factors specialist, the aid also gives illustrative examples of potential influences of contributing factors with the aim to stimulate creative problem solving processes. These examples are concrete enough to cover a broad range of potentially contributing factors but they are not meant to be exhaustive. To guarantee the comprehensiveness of the analysis all general questions are linked to others. These so-called cross-references are theoretically and empirically based. If one question is answered in the affirmative, the team is guided to answer another set of questions in order to identify other potentially contributing factors. Contributing factors are roughly divided into direct and indirect factors. The analysis process starts with the identification of direct factors which are linked to a couple of indirect factors due to the cross-references. For instance, if the direct factor ‘personal performance’ is identified, a cross-reference to indirect factors such as ‘training’ is given. By these cross-references mono-causal thinking and over-weighting of active errors should be overcome. Finally, all identified contributing factors are added to the time-actor-matrix (see Figure 26), thus successively completing the reconstruction of the event and its causes.

67
FIG. 26. Example of the SOL time-actor diagram with contributing factors.
A set of three specific guidelines is aimed to support the process of event analysis, to ensure its standardised conduct while at the same time mobilising expert knowledge and creativity of the analysis which can be compared to a backward oriented problem solving process:
1. Guideline for the description of the situation: the event is broken down into a sequence of event-parts i.e. single actions of different actors (man or machine), event building blocks, and no contributing factors should be identified at this stage.
2. Guideline for the identification of contributing factors: Every single action (representing an ‘event building block’) identified in the description of the situation should be analysed by asking the question ‘why’.
3. Guideline for the reporting of the event: The event description is a comprehensive documentation of the process of analysis and provides the main basis for the NPP’s internal organizational learning. The guideline insures the standardization of the reports in all NPPs ; it contains information about the role, form and writing of the event report, and also information about the classification of contributing factors for statistical analysis.
SOL-VE (SOL –Versio Electronica) is a computer based software tool for event analysis including the administration of events and associated corrective actions within a data base.. The application includes data base functions that allow trending of various root causes across all event investigation results.
5.9. Assessment of Safety Significant Events Teams (ASSET)
ASSET is an IAEA method developed in 1991 for investigating events of high significance with related managerial and organizational issues by an IAEA led team. Issues and corrective actions identified by ASSET method are often at high level, more applicable to management policy and philosophy, and of a generalized nature.

68
According to ASSET method, the work process at a nuclear power plant has three basic elements: people, procedures and equipment. The reason for an error in the performance of the work process must be a deficiency in one, or several of these basic elements. The ASSET approach is based on the logic that events always occur because of a failure (of people, procedures or equipment) to perform as expected due to a latent weakness (direct cause) which was not timely eliminated due to deficiencies in plant surveillance program (root cause). In ASSET analysis, the event is broken up in a logically connected occurrences which can be attributed to a single failure of either people, procedures or equipment, and the direct cause and root causes of each occurrence are identified to determine the corrective actions which will eliminate the direct cause and root causes. The fundamental approach of the ASSET method is shown in the following diagram:
FIG. 27. ASSET approach.
Figure 28 shows the event root cause anlysis form. The objective of the Root Cause Analysis is to establish exactly what happened and why, so as to contribute to the prevention of repetitious events. According to ASSET, the Root Cause Analysis is a process of three phases, namely:
• Investigation: the determination of what exactly happened, the identification of all the occurrences making up the event and their temporal and logical relationships;
• Analysis: the analysis of selected (or all of the) occurrences; • Formulation of recommendations: the identification of corrective actions on which to
base recommendations.
Advantages:
• Useful for investigation of generic events; • Can be useful for investigating a single event of high safety significance which has
related managerial and organizational aspects; • Useful for retrospective review of a population of events where a trend of recurring
problems has been identified.

69
FIG. 28. Event Root Cause Analysis form (blank).
Limitations:
• Uses a different terminology and definition of root cause compared with other techniques;
• Because the method identifies deficiencies in management, organization and higher policy issues, knowledgeable senior staff with practical experience are needed to perform the analysis;
• Issues and corrective actions identified by ASSET method are often at high level, more pertinent to management policy and philosophy, and of a generalized nature.

70
This makes development of concise, measurable, and achievable corrective actions difficult;
• ASSET services are no longer supported by the IAEA and hence, training and further improvements for the ASSET method may no longer be available through IAEA.
The ASSET method, when applied to discrete events of limited safety significance, develops root causes which are at the higher managerial levels, and as a result generate more global corrective actions. Such actions have been found to be difficult to implement due to issues relating to high cost and insufficient focus of ownership and accountability. The existing experience indicates that the application of other available methods in this respect can be more effective than the ASSET method for discrete events.
5.10. Accident Evolution and Barrier Function (AEB)
The AEB method models the interaction between human and technical systems. It consists of the narrative of the event, the flow chart model of human and systems malfunctions, errors and failures, and barrier function analysis. As a basic principle for classification in the AEB method, the evolution leading to an event is modeled as a chain or sequence of malfunctions, failures, and errors in human and technical systems. Referring to this, a distinction was made between barrier functions and barrier systems. A barrier function represents a function (and not, e.g. an object) which can arrest the event evolution so that the next event in the chain is never realized. Barrier systems are those maintaining the barrier function. Such systems may be an operator, an instruction, a physical separation, an emergency control system, and other safety-related systems, components, and human factors-organizational units. More generally, a barrier function can be defined as the specific manner by which the barrier achieves its purpose, whereas a barrier system can be defined as the foundation for the barrier function, i.e., the organizational and/or physical structure without which the barrier function could not be accomplished. The use of the barrier concept is based on a systematic description of various types of barrier systems and barrier functions, for instance as a classification system. This will help to identify specific barrier systems and barrier functions and to understand the role of barriers, in either meaning, in the history of an event. In Figure 29 barrier functions are shown as two parallel lines ‘//’.
FIG. 29. The Accident Evolution and Barrier (AEB) function model.

71
The AEB model proposed three different barrier systems, namely physical, technical, and human factors/organizational. Coupled with most links in this sequence of malfunctions, failures, and errors in human and technical systems there are possibilities to arrest the event evolution through barrier functions, (e.g. a physical barrier function) controlled by barrier function systems (e.g. a computer-controlled lock). In contrast to a tree representation of the contributing factors to barrier function failures, AEB implies that failures and failing barrier functions are analysed at successively more detailed levels. One of AEB disadvantages is that it does not present all the data in the main flow chart and hence runs a risk of missing potential relevant contributory factors.
5.11. Control Change Cause Analysis (3CA)
This method has its origins in a co-operative project run by Humber Chemical Focus and the UK Health and Safety Executive in 2000. The venture was aimed at line managers of chemical sites and sought to develop their skills in identifying underlying causes of events. The project aimed to equip people with tools to help them investigate and identify lessons to be learned. Control Change Cause Analysis – 3CA – is designed to help investigators structure their inquiries into the underlying cause of events and to make it easy for others to review their reasoning. In 3CA, the analyst treats an event as a sequence of occurences in which unwanted changes occur. This sequence begins with the moment that reduces control and ends with the moment that restores control. Some of the occurences in the sequence are ‘significant’ in the sense that they increase risks or reduce control in the situation, so allow further unwanted changes to occur. The first job for the 3CA analyst is to identify these significant occurences. With the set of significant occurences established, the analyst identifies what measures could have prevented them or limited their effects. To ensure the thoroughness of this identification, the analyst describes each significant occurence in terms that make explicit who/what is acting, the action and who/what is acted upon. In this way, the analyst evaluates all the elements of unwanted change from the point of view of prevention. The analyst has to identify in what ways prevention was ineffective. In the first part of the analysis the focus is on tangible barriers and controls, those at the operational level. Next, the analyst restates the facts as differences between what was expected (based on norms such as standards and procedures) and what was true in the actual situation. The differences between the actual and expected situations provide the agenda for the rest of the analysis. The investigator seeks to account for these differences in terms of the reasoning used by people responsible for the barriers and controls, the organizational and cultural factors that influenced the situation and, the systems and management arrangements that caused or allowed the difference to exist. The analysis runs in parallel with other investigative efforts; after the initial 3CA analysis, it is likely that one or more revisions are made as further enquiries yield new insights and, in some cases, new questions. The initial 3CA analysis is performed in two parts in the sequence described below and indicated in Figure 30.

72
In the first part, column 1 is completed (the significant occurences) before completing column 2 (the barriers and controls). The first part of the analysis is completed by setting priorities in column 3; these priorities decide the sequence for the second part of the analysis. In the second part of the analysis, columns 4 and 5 are completed for one significant occurrence at a time.
FIG. 30. Schematic showing sequence of the 3CA analysis.
To ensure completeness, an ‘event sequencing’ tool or technique (such as E and CF charting) should be used. The results of trials of applying 3CA suggested that the method:
• is quick to learn; • provides a structured way of taking the specific outcomes of an event through to the
relevant areas of the safety management system. In doing so it helps to identify which aspects of the system failed to be effective;
• is systematic and reproducible; • produces visible results that are easy to communicate; • is recordable and can be audited.
5.12. TRIPOD Beta
TRIPOD Beta is a combination of the original TRIPOD concept with the HEMP (‘the Hazard and Effects Management Process’). TRIPOD considered that substandard acts and situations do not just occur. They are generated by mechanisms acting in organizations, regardless whether there has been an event or not. Often these mechanisms result from decisions taken at high level in the organization. These underlying mechanisms are called Basic Risk Factors (BRFs). These BRFs may generate various psychological precursors which may lead to substandard acts and situations. Examples of psychological precursors of slips, lapses and violations are time pressure, being poorly motivated or depressed.

73
According to this model, eliminating the latent failures categorised in BRFs or reducing their impact will prevent psychological precursors, substandard acts and the operational disturbances. Furthermore, this will result in prevention of events. The identified BRFs cover human, organizational and technical problems. The different Basic Risk Factors are defined in Figure 31.
FIG. 31. The definitions of the basic risk factors (BRFs) in TRIPOD.
The TRIPOD model was further developed in TRIPOD Beta. As previously mentioned, TRIPOD Beta merges two different models, the HEMP (‘The Hazard and Effects Management Process’, see Figure 32) model and the TRIPOD ‘accident causation model’.

74
FIG. 32. ‘Accident mechanism’ according to HEMP.
The TRIPOD Beta accident causation model is presented in Figure 33. This string is used to identify the causes that lead to the breaching of the controls and defences presented in the HEMP model.
FIG. 33. TRIPOD Beta Accident Causation Model.
Although the new model is similar to the original TRIPOD model, its components and assumptions are different. In the Beta-model the defences and controls are directly linked to unsafe acts, preconditions and latent failures. Unsafe acts include how the barriers were breached and the latent failures why the barriers were breached. An example of a TRIPOD Beta accident analysis is shown in Figure 34.
FIG. 34. Example on a TRIPOD Beta analysis.

75
A computer-based instrument called TRIPOD Beta-tool has been developed based on the TRIPOD Beta model. This menu driven tool provides the user with a tree-like overview of the event that is investigated and guides the investigator through the process of making an electronic representation of the accident.
5.13. Systematic Approach For Error Reduction (SAFER)
SAFER was originally developed in 1997 as H2-SAFER by the Tokyo Electric Power Company’s (TEPCO) Human Factors Group (HFG). (H2 stands for Hiyari-Hatto, which is the Japanese term for near misses.) It was considerably improved in 2003 and renamed SAFER. Human error is not a cause, but is a result or consequence of error inducing factors. This is the basic meaning of what the TEPCO HFG refers to as human factors engineering. Effective analysis and corrective actions are usually performed by people on the site rather than by external method specialists. Therefore there is a need for a simple analysis method that is easy for the on-site people to use and that helps them identify the background factors of an event. The SAFER procedure embodies three stages: 1. Fact-finding, 2. Logical investigation, and 3. Development of corrective actions against background factors. SAFER further splits these stages into eight steps. As a first step, on site staff are given understanding on the notion of human factors engineering. In order to develop corrective actions (stage 3), TEPCO has comprehensive guidance. TEPCO specifies that the object of corrective actions is to prevent or minimize damage resulting from events related to human erroneous action. TEPCO has introdiced a distinction between two phases, prevention of errors and mitigation of effects, and two approaches, improvement of surrounding factors and improvement of individual’s abilities (individualistic countermeasures). This altogether resulted in the eleven measures shown in Figure 36. The method has the following attributes:
• It is convenient for everybody to use: once the basic notions and the steps of analysis have been learned, persons on-site as well as specialists in the method can use it easily;
• It is applicable to various events: the target events cover everything from serious events to near-miss and are not restricted to human errors but include problems in equipment and organizational matters;
• It is useful for developing a common way of thinking: the basic notion of human factors engineering, and the knowledge about how surroundings can lead to events, is far more important than procedures and formats. The use of SAFER can help a person acquire the underlying notion, the viewpoints, and the way of thinking, and to share them on site or in the office.

76
Limitations:
This method presents the basic notions, analysis step and practical know-how in analysis. However it does not present all the data such as causal factors reference list, countermeasure proposal list, etc. to management or other interested parties. Resources needed
Requires a team which consists of a few members trained in the method, other personnel involved, and a team leader with management experience. Skills needed
The true essence of SAFER is not a procedure but the basic notion of human factors engineering. Therefore, it is desirable that SAFER is implemented by analysts who have a good understanding of the basic notion.
FIG. 35. A guideline to think out measures ‘GUIDE’ (SAFER).
5.14. Method of Psychological Root Cause Analysis of Human Factors
This method was developed from the IAEA ASSET Guidelines. The method is based on the concept of professional activity, engineering and industrial psychology, And is used by human factor specialists to analyse human errors. According to this concept, the worker who performs inappropriate actions is considered as having deficiencies in ‘activity structure’. The ‘Activity structure’ contains motivation, knowledge and attitude to work areas. Deficiencies in each area define the characteristics of the inappropriate action.

77
Initial stage of investigation.
The main goal for the human factor specialist at this stage is to assist the event investigation team in establishing if human factors have had an impact on the event. If they have, the human factor specialist develops a plan for gathering information specific to the event and the personnel involved. The plan includes the following steps:
• Identification of inappropriate personnel actions; • Identification of abnormalities in equipment operation and procedure deficiencies that
led to the inappropriate personnel actions. To develop the information gathering plan the human factor specialist utilizes a table of basic elements for analysis, containing areas of inappropriate action precursors and information sources for each basic element.
The basic elements are:
• work activity; • task to be performed; • tools, equipment, procedures, etc. utilized to implement work; • working conditions; • interactions with management/supervision, other workers etc.
Information gathering.
The objective for the human factor specialist is to gather information on the circumstances of the event, with particular focus on human factor aspects.
In accordance to the prepared plan, the human factor specialist:
• collects necessary documentation connected with work\task; • collects data on suitability of selection of personnel involved in the event: personnel
selection, job assessment, training, psychological and social support; • collects data on work experience of personnel involved: briefings, operational
meeting, on-the-job training and so on; • conducts an analysis of factors at the involved work place; • conducts interview with involved personnel; • establishes if other personnel should be considered as involved in the event.
The information obtained from interviews and observations is classified in ‘causal factor modules’. The human factor specialist should then identify all problem issues.
The human factor specialist also has to identify if any similar events have already occurred, and analyse any associated information.
In the final stage of information gathering, hypothesis are formulated on inappropriate action types and root causes that led to personnel error. Identification of direct cause and inappropriate actions.
To detect the direct cause of inappropriate action, the human factor specialist has to find answers to the following questions:

78
Related to the activity – What happened? Related to the personnel performing the activity – What was done? Psychological analysis should be focused on the worker (or group of workers) who were involved in the event and should be conducted for all aspects of the activity:
• knowledge of available information; • assessment of the situation; • decision making process; • actions; • interaction with others workers, procedures, documents.
Identification of inappropriate actions.
The objective of this stage is to identify the type of inappropriate action for each of the involved persons, utilizing human error classification based on REASON. The human factor specialist makes conclusions on the types of inappropriate action using the information collected in previous stages and a block-scheme for inappropriate action types. The main classifications of inappropriate action are: premeditation (deliberate) and unexpectedness (inadvertent). Following the classification, the human factor specialist identifies the type of inappropriate action (slips, violation or motivational). Inappropriate action root causes identification.
At this stage the human factor specialist utilizes the information obtained in previous four stages and develops the analysis; taking into account social psychological, social economic and political factors (such as external conditions that could have an influence on psycho-emotional steadiness important for reliably carrying out work).
Some of these factors are the root causes of the event. These factors can be present at three levels:
• group/shift; • management and organization; • external to NPP environment (groups, project or contractor organizations and so on).
Identification of inappropriate ‘action sources’ (areas) and ‘safety decrease points’.
The goal of human factor specialist at this stage is to determine the internal and external factors that led to the inappropriate actions. The human factor specialist identifies inappropriate ‘action areas’ using a generalized list of root causes. To define ‘safety decrease points’ the specialist conducts an investigation of the areas previously identified. Corrective action development.
The human factor specialist develops corrective actions in accordance with results of the psychological analysis of human errors. Corrective measures are developed for each root cause of the inappropriate action. All corrective actions for each personnel shortcoming, including external factors influencing a worker’s capacity for work and reliability, must be
79
interconnected with each other, have no contradictions, must strengthen the positive effect on each other. Corrective actions directly addressing personnel should take into account the following aspects:
• individual traits; • the values and motivation system; • qualification; • human-being behavior management possibilities and restrictions.
For example, if the event cause ‘area’ is social self-control, the corrective measures could be effective-communication training.
Preparation of final conclusion.
The final stage of the investigation includes the preparation of the report, containing all results from psychological analysis. The investigation team leader is responsible for the preparation of the report. The report is developed starting from a template and forms part of the complete final event report.
5.15. Commercial RCA Methods
There are several commercial RCA methods available, listed are examples of some popular methods and a short description of their features.
5.15.1. TapRoot®
TapRooT® System is a process and techniques for organizing the facts of an event into a chronological order, investigation and analysis of these facts, identification of causal factors, determination of root causes and development of corrective actions to solve problems. The TapRooT® System combines both inductive and deductive techniques for systematic investigation of the fixable root causes of problems. The system is supported by software and provides a trendable event/root cause database and corrective action management database. The TapRooT® System is based on the concept that each error could be categorized and addressed. According to it, the investigation of each event should start with attributing of each causal factor of an issue to one of the four initial categories: a) human performance difficulties; b) equipment difficulties; c) natural disaster/sabotage; d) other. Then analysis is going further, digging deeper by selecting or eliminating the adequate more detailed subcategories to find root causes. TapRooT® can be used in troubleshooting and Root Cause Analysis of equipment, and includes 2000 equipment troubleshooting tables which can be used for finding the root cause of human performance and equipment-related problems.
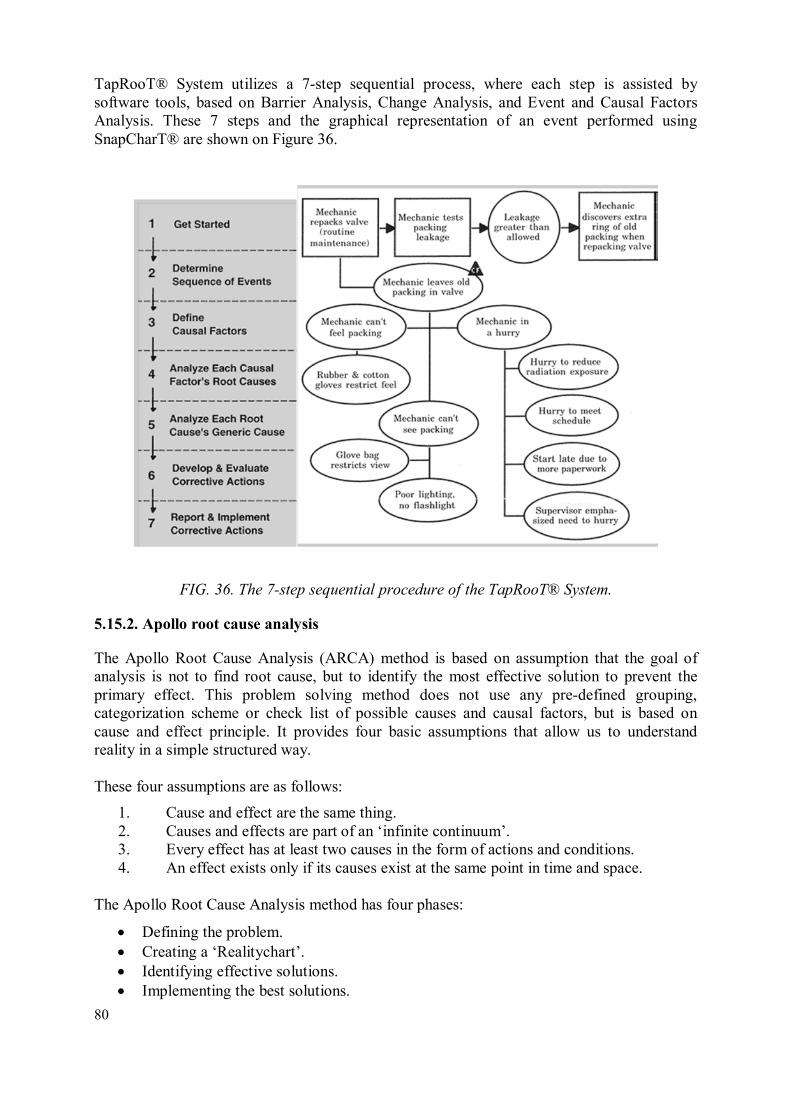
80
TapRooT® System utilizes a 7-step sequential process, where each step is assisted by software tools, based on Barrier Analysis, Change Analysis, and Event and Causal Factors Analysis. These 7 steps and the graphical representation of an event performed using SnapCharT® are shown on Figure 36.
FIG. 36. The 7-step sequential procedure of the TapRooT® System.
5.15.2. Apollo root cause analysis
The Apollo Root Cause Analysis (ARCA) method is based on assumption that the goal of analysis is not to find root cause, but to identify the most effective solution to prevent the primary effect. This problem solving method does not use any pre-defined grouping, categorization scheme or check list of possible causes and causal factors, but is based on cause and effect principle. It provides four basic assumptions that allow us to understand reality in a simple structured way. These four assumptions are as follows:
1. Cause and effect are the same thing. 2. Causes and effects are part of an ‘infinite continuum’. 3. Every effect has at least two causes in the form of actions and conditions. 4. An effect exists only if its causes exist at the same point in time and space.
The Apollo Root Cause Analysis method has four phases:
• Defining the problem. • Creating a ‘Realitychart’. • Identifying effective solutions. • Implementing the best solutions.

81
The Apollo Root Cause Analysis (ARCA) starts with a complete problem definition, which should include four elements, presenting answers to following questions: a) what is the problem (primary effect, recurrence of which should be prevented); b) when did it happen; c) where did it happen; d) what is the significance of the problem.
The Realitychart has five elements or steps:
1. ‘Why’ should be asked for each primary effect. 2. Causes of primary effect have to be looked in actions and conditions. 3. All causes have to be connected with ‘Caused By’. 4. All causes have to be supported with evidence. 5. Each cause path has to end with a symbol ‘?’ or a reason for stopping.
Performing these five steps gives the elemental causal set, made up of an effect and its immediate causes – an action and one or more conditions. Then each cause is treated as effect, and five steps procedure is repeated, generating next elemental causal set. Continuing this process further, elemental causal sets are combined to form reflection of common reality. There are four valid reasons for interrupting the expansion of the Realitychart: a) reaching the desired condition, b) reaching the situation without control, c) finding new primary effects that need a separate analysis, and d) finding more productive cause paths.
Potentially effective solutions to prevent recurrence are identified based on the causes identified from the Realitychart. After each solution is challenged, the best solution is identified according to the following criteria:
• prevent occurrence; • be within control; • meet the set goals and objectives (not to cause other unacceptable problems and
provide reasonable value for its cost).
5.15.3. REASON®
REASON® is both a method and a system software. The REASON® method is a standard operating procedure that guides the investigator to ask the right questions at the right time, in order to get the right answers. REASON® Root Cause Analysis is a multifaceted discipline that leads a user through the investigation of an event using a standard, repeatable inquiry process. This process guides the user to logically reconstruct an event from the causal facts. The method of inquiry is not based on predetermined questions found in a list or template but is a process that creates a line of questioning based on the nature of the facts themselves. The REASON® process ensures that the questions logically required by an event are asked. Following this process a tree model of the event is created. The tree graphically represents the facts of the event and depicts how these facts networked to produce the overall event being investigated. The tree also indicates solutions that could have interrupted the causal network, thus achieving prevention of the unwanted event.

82
This approach generally looks at a systemic failure (organizationally) leading to an event and also may help to answer the systemic ‘why’ of an event, complementing the ‘how’ and ‘when.’
5.15.4. PROACT®
PROACT® is method that provides tools to document, validate, report and track findings and recommendations. The method identifies an organization's most significant annual losses and provides tools to identify all the causes and then eliminate their recurrence in the future. The end result is that it builds a business case for which events are the best candidates for Root Cause Analysis based on the Return-On-Investment (ROI). The PROACT® Logic Tree is an expression of cause and effect relationship that represents an undesirable outcome. These cause and effect relationships are validated with factual evidence.
FIG. 37. Structure of the PROACT® Logic tree.
PROACT® Software allows for:
• the user to preview and select an appropriate template that most closely matches the conditions associated with any failure analysis;
• the user to drill down through the levels of detail that occur within any failure mechanism;
• multi-levels of detail to uncover related causes in the cause and effect relationship seen when analysing the event;
• the deletion or modification of the graphic structure and text as new/additional causes of the failure are identified and uncovered.

83
APPENDIX I. EXAMPLE OF A FAILURE ANALYSIS GUIDELINE
Failure Analysis – equipment failure
When a failure of a piece of equipment occurs, accurate determination of the equipment failure mechanism is important so that the failure mode can be determined. The following steps should be performed in order to identify the proper failure mechanism.
Off site failure analysis (preferred):
• Ensure that the evidence is not tampered with, disassembled or discarded; • Ensure that the failure analysis is performed by an objective external third party
vendor with experience doing failure outside of the station; • Ensure the failure analysis instructions to the vendor clearly provides enough detail to
ensure that the organization performing the failure analysis understands how the equipment worked, how it interacted within the plant, and how the failure manifested itself;
• Provide a complete set of the most current work instructions, procedures, and post maintenance testing to the vendor performing the failure analysis;
• Ensure that the shipping is secure so that the component is not damaged or altered in shipment;
• Place all similar components in the warehouse on electronic hold with notes to prevent inadvertent issuance. Ensure the notes include reference to the SCR tracking the failure analysis of the failed component.
On site failure analysis:
• Sometimes failure analysis needs to be performed on site if the equipment is currently installed, or is too large to remove for external failure analysis;
• Do not allow failure analysis to be performed by the same individuals that had previously worked on the equipment;
• Utilize the component’s Original Equipment Manufacturer (OEM) whenever possible to help with failure analysis, however ensure that a station management representative (preferably component specialist) accompanies the vendor at all times when on site.
Present the failure analysis results to the Event Review Board and include in the terms of reference for the root cause investigation

84
APPENDIX II. EXAMPLE OF AN EQUIPMENT FAILURE WORKSHEET
(Included in reports for all Equipment Related Root Cause Investigations)
1. Is the equipment properly classified to the proper level of criticality within the
performance centred maintenance programme? (document basis)
2. Was the equipment failure caused by inadequate maintenance work practices? (provide basis)
3. Was the equipment failure caused by improper Operation of the Equipment? (provide basis)
4. Was the equipment failure caused by other plant conditions or external factors such as:
• Water Hammer? • Excessive Vibrations? • Humidity/Temperature in area? • Weather related (storms, rain, etc…)? (provide basis)
5. Was the equipment failure caused by inadequate, lack of or improper preventive
maintenance? (provide basis)
6. Was the equipment failure the result of inadequate performance monitoring? (provide basis)
7. Are there existing open corrective actions against this equipment or could this failure have been prevented through the proper use of other internal/external OPEX? (provide basis)
8. Is the equipment failure the result of a design deficiency or mis-application of the proper design? (provide basis)
9. Is the equipment failure the result of inadequate manufacturing, refurbishment, handling, storage or supplier quality defects or issues? (provide basis)

85
APPENDIX III. EXAMPLE OF A LIST OF EQUIPMENT FAILURE MODES
No Failure Mode Contents
1 Rupture
Chap, Fracture, Meltdown, Seizure, Delamination, Fatigue, Flaw, Pinhole, Wear, Defect, Fray, Fretting, Rub, Melting, High cycle fatigue, Burnout, Leak path, Low cycle fatigue, Erosion, Crack, Thermal fatigue, Damage
2 Deformation Interference, Defection, Deformation, Defect, Falling, Friction, Slide, Twist, Loose, Slippage, Detachment, Contact failure, Contact, Displacement
3 Loss of function
Out grease, Capacity shortage, Fail to open, Stuck, Wrong signal, Fail to start, Poor lubrication, Seal failure, Fail to control, Clogging, Jamming, Fail to shutdown, Circuit fault, Malfunction, Fail to close, Faulty wiring, Fail to open/close valve, Error signal, Set-point drift, Fail to roll pump, False operation, Poor contact
4 Overload
Pressure fluctuation, Power fluctuation, Abnormal vibration, Overheat, Synchronization failure, Abnormal water level, Overstress, Noise, Abnormal voltage, Shock, Abnormal pressure, Abnormal electric current, Excessive vibration, Abnormal temperature, Abnormal flow, Resistance growth, Abnormal revolution, Overload, Thermal stress, Abnormal acceleration, Electric overload, Hunching, Abnormal power, Abnormal radiation, Microvibration, Abnormal vacuum, Water hammer
5 Disconnection Disconnection, Loss of power supply, Soldering defects, Electricity failure
6 Short circuit / Earth fault
Arc, Short circuit/ Earth fault, Soldering defects, Insulation failure
7 Corrosion/ Embrittlement
Stress corrosion, Corrosion, Intergranular corrosion cracking, Stress corrosion cracking, Corruption, Erosion, Chemical corrosion, Blowhole, Embrittlement, Thinning
8 Alien substance Contamination, Aeration, Water/Steam leak, Alien attachment, Dew condensation, Abnormal dust/salt, Stain, Moisture, Bleeding, Dent, Scale attachment
9 Abnormal circumstance
Abnormal ambient temperature, Abnormal humidity atmosphere, Abnormal atmosphere (Lack of oxygen)
10 External factors Fire, Flooding, Poisonous gas, Earthquake, Inundation, Leak of oil, gas and air
11 Miss operation
12 Under investigation
13 Cause unknown

86
APPENDIX IV. EXAMPLE FOR TAXONOMY OF HUMAN FACTORS
No. Major classification
factors
No. Medium classification factors
Explanation Explanation
1 Individual characteristic factors
1 Psychological stressor
These factors depend on
internal characteristics of
employee’s individual
personnel that affect their
performance and
function.
Psychological stressor due to excessive task requirements, irritation for insufficient time, monotonous job and fear of impact caused by failure that caused mental task pressure and tension leading to compromised cognitive behaviour had negative impact on personnel’s behaviour or performance.
2 Physiological stressor
Physiological stressor due to stressful working environment, fatigue and night work that caused physical task pressure and tension leading to compromised cognitive behaviour had negative impact on personnel’s behaviour or performance.
3 Subjective factors
Overconfident, wrong impression, attention deficit and habit of personnel had negative impact on personnel’s behaviour.
4 Work performance competence
Insufficiency in knowledge, experience and training of personnel had negative impact on his behaviour.
5 Others

87
2 Task characteristic factors
1 Task difficulties
These factors depend on
characteristics unique to
the task situation
concerned.
Complex situation with work-specific limitation such as difficulty in work prediction / decision making or contradictory targets had negative impact on personnel’s behaviour or performance.
2 Workload factors
Excessive time restriction or excessive / insufficient workload due to inappropriate work plan / procedure had negative impact on personnel’s behaviour or performance.
3 Working time inadequacies
The working time zone influencing personnel’s physical condition and circadian rhythm had negative impact on personnel’s behaviour or performance.
4 Parallel / Unexpected work
Situation where multiple works should be done in parallel or presence of unexpected / unscheduled work had negative impact on personnel’s behaviour or performance.
5 Others
3
Working environmental characteristic factors
1 Insufficient Human Machine Interface (HMI) qualities
These factors depend on
characteristics of facility
structure treated by
personnel or physical
characteristics of
working environment.
Insufficiency or deficit of ergonomic consideration to machines and equipment had negative impact on personnel’s behaviour.
2 Workplace factors
Insufficiency of jobsite had negative impact on personnel’s behaviour or performance.

88
3 Work condition inadequacies
Inappropriate status of working environment had negative impact on personnel’s behaviour or performance.
4 Special equipment
Inappropriateness of special outfit worn during work (safety outfit, protection clothing, gloves etc.) had negative impact on personnel’s behaviour or performance.
5 Others
4
Organizational workplace characteristic factors
1 Organization / Team structure
These factors depend on
characteristics of work
environment affecting
employees.
External factors such as ‘inappropriate job assignment’, ‘inappropriate organization or team structure’ and ‘inappropriate change of organization or team’ etc. had negative impact on personnel’s behaviour or performance.
2 Inadequacies in Instruction / Supervision etc.
Inappropriateness of supervisor’s direction or instruction to personnel including those of subcontractors or inappropriate command system had negative impact on personnel’s behaviour or performance.
3 Communication
Communication-related issues such as ‘inappropriate communication among individuals’ and ‘inappropriate communication among organizations or teams’ etc. had negative impact on personnel’s behaviour or performance.

89
4 Team work / Workshop morale
‘In appropriate teamwork’ and ‘deficiency of workshop moral’ including bad habits at work had negative impact on personnel’s behaviour or performance.
5 Compliance to rules
Workplace characteristics about compliance to rules such as ‘non-compliance’ and ‘no check for non-compliance’ had negative impact on personnel’s behaviour or performance.
6 Others
5 Administrative characteristic factors
1 Education / Training
These factors depend on
characteristics of work
management related to
task.
Inappropriateness of stipulated ‘education and training’ or deficiency of ‘education and skill training’ that should have been in place from an objective standpoint had negative impact on personnel’s behaviour or performance.
2 Provisions / Procedures etc.
Insufficiency of provisions, procedures and check sheet etc. on manual operation, work, design verification and purchasing management had negative impact on personnel’s behaviour or performance.
3 Planning / Change of planning etc.
Insufficiency in planning, change of planning, preparation etc. concerning manual operation, work, detection of aging-related deterioration etc. had negative impact on personnel’s behaviour or performance.
4 Others (Evaluation of work, favour / rewards, etc.)

90
APPENDIX V. HOW TO CHOOSE THE ROOT CAUSE METHOD
Most of the internationally recognized root cause methods, when used properly, will enable the investigation team to identify the root cause/causes of an event or conditions. However during performance of a root cause investigation tools and techniques are chosen applicable to the type of event that has occurred. Several factors should be considered when selecting a RCA method:
• Benchmarking within and outside the industry; • Recommendations by international organizations; • The amount of training needed to successfully use the method; • The available software to support the method; • The cost of the licence.
The more comprehensive process of selection the appropriate RCA method for needs of some organization should consist of several steps and meet the following criteria:
• Determine your Internal RCA Needs:
− Are you looking to set up an RCA effort or to investigate a single event only? − Will your RCA effort focus on ‘events’ only, chronic failures only, or both? − Will management support be solicited? − Will management systems be implemented? − Will teams be dedicated to completion of RCAs? − Will hourly personnel participate on teams? − Will additional technical resources be required? − Will additional technical equipment be required?
• Determine Appropriate RCA Method to Use for your Environment:
− Evaluate simplicity of method; − Evaluate analysis flexibility; − Evaluate quality of materials and job aids; − Evaluate training flexibility; − Evaluate method comprehensiveness; − Evaluate system to track for results; − Evaluate overall value of method (cost-benefit analysis).
• Determine How to Implement: In-House or Outsource:
− Does the facility posses the instructional technology skills and resources to develop in-house courses on evaluated and proven RCA method?
− Is it more economical and timely to develop courses in-house (cost-benefit)? − Would utilizing past vendor training be appropriate for in-house instructors? − Is there any copyright infringement concerns utilizing past vendor training in-
house? − Are qualified RCA instructors with field experience available in-house? − Would in-house instructors be dedicated to supporting and mentoring their
students?

91
− Would management be willing to fund the RCA method development in-house? − Would management be willing to wait for completion of the skill development and
then implementation?
• Choose the Appropriate RCA Vendor:
− Does the vendor provide the chosen RCA method by the facility? − Does the vendor have training in RCA for field personnel, engineers and
management? − Does the vendor posses various methods that compliment each other and provide
specifically designed training to the appropriate level of audience? − Does the vendor’s instructor(s) have field experience in implementing RCA? How
much? − Does the vendor’s instructor(s) have experience in instructional technology and
applied learning to increase presentation retention rates? − Can the vendor provide references of successful client field applications? In your
industry? − Does the vendor have products/services to support RCA method (management
system support models, software, on-site facilitation services, follow-up capabilities, etc.)?
− Is the vendor willing to customize instruction and materials to accommodate your needs?
− Is the vendor willing to work on specific, on-going in-house failures during training?
− Does the vendor possess the skills on staff to deal with managerial culture transformations?
− Is the vendor willing to partner? Share risk? − Does the vendor posses the staff capacity to handle your requirements?
Domestically? Internationally? Obviously, this list of criteria is not as comprehensive as it possibly could be, however it is a good starting point. The key to starting is clearly defining what the organization wants and obtaining internal support for the vision. Then the task will be to solicit the qualified vendors to help execute that vision. Experienced root cause investigators will often adjust a RCA method when performing an investigation because each event or condition is different or unique.


93
REFERENCES
[1] EUROPEAN ATOMIC ENERGY COMMUNITY, FOOD AND AGRICULTURE ORGANIZATION OF THE UNITED NATIONS, INTERNATIONAL ATOMIC ENERGY AGENCY, INTERNATIONAL LABOUR ORGANIZATION, INTERNATIONAL MARITIME ORGANIZATION, OECD NUCLEAR ENERGY AGENCY, PAN AMERICAN HEALTH ORGANIZATION, UNITED NATIONS ENVIRONMENT PROGRAMME, WORLD HEALTH ORGANIZATION, Fundamental Safety Principles: Safety Fundamentals, IAEA Safety Standards Series No. SF-1, IAEA, Vienna (2006).
[2] INTERNATIONAL ATOMIC ENERGY AGENCY, A System for the Feedback of Experience from Events in Nuclear Installations, IAEA Safety Standards Series No. NS-G-2.11, IAEA, Vienna (2006).
[3] INTERNATIONAL ATOMIC ENERGY AGENCY, Review of Methodologies for Analysis of Safety Incidents at Nuclear Power Plants, IAEA-TECDOC-1278, IAEA, Vienna (2002).
[4] INTERNATIONAL ATOMIC ENERGY AGENCY, Deterministic Analysis of Operational Events in Nuclear Power Plants, IAEA-TECDOC-1550, IAEA, Vienna (2007).
[5] INTERNATIONAL ATOMIC ENERGY AGENCY, Precursor Analyses - The Use of Deterministic and PSA Based Methods in the Event Investigation Process at Nuclear Power Plants, IAEA-TECDOC-1417, IAEA, Vienna (2004).
[6] INTERNATIONAL ATOMIC ENERGY AGENCY, Best Practices in Identifying, Reporting and Screening Operating Experience at Nuclear Power Plants, IAEA-TECDOC-1581, IAEA, Vienna (2007).
[7] INTERNATIONAL ATOMIC ENERGY AGENCY, Best Practices in the Organization, Management and Conduct of an Effective Investigation of Events at Nuclear Power Plants, IAEA-TECDOC-1600, IAEA, Vienna (2007).
[8] INTERNATIONAL ATOMIC ENERGY AGENCY, Effective Corrective Actions to Enhance Operational Safety of Nuclear Installations, IAEA-TECDOC-1458, IAEA, Vienna (2005).
[9] JRC EUROPEAN COMMISSION, Comparative Analysis of Nuclear Event Investigation Methods, Tools and Techniques, Petten (2011).


95
ANNEXES - TRAINING MATERIAL
Annex 1 contains general training material for the most important techniques to be used in a Root Cause Analysis for the Human Performance Enhancement System (HPES) approach.
Annex II presents an example of training material to simulate a root cause investigation with trainees but additional examples can be produced using the analyses presented in Annex III or from specific event information.
Annex III presents an example of a real event investigation.


97
ANNEX I. GENERAL TRAINING MATERIAL
I.1. INTRODUCTION
Annex 1 contains general training material for the most important techniques to be used in a Root Cause Analysis for the Human Performance Enhancement System (HPES) approach.
Annex II presents an example of training material to simulate a root cause investigation with trainees but additional examples can be produced using the analyses presented in Annex III or from specific event information.
Annex III presents an example of a real event investigation.
I.2. TRAINING FOR SPECIFIC TECHNIQUES
I.2.1. Event and Causal Factor Charting
What it is?
An events and causal factors chart (E and CF) is a graphically displayed flow chart of an entire event. The heart of the E and CF chart is the sequence of events plotted on a time line. Beginning and ending points are selected to capture all essential information pertinent to the situation. When to use it?
Should be used for complex events especially those that have occurred over a period of time. How to use it?
STEP 1: Evaluate initial information and documentation
− What were inappropriate actions and/or equipment failures? − When did they occur (during what task/evolution)? How did they occur? − What were the consequences?
STEP 2: Define the event
− Define the starting point (Starting points often changes during the course of investigation, as more facts are revealed)
− Define the final point STEP 3: Begin constructing the preliminary primary event time line.
− Start early - use currently known facts − Use ‘Post-it notes’
STEP 4: Identify the inappropriate actions and conditions (problems):
− Equipment failures − Human errors − Programme (procedures)

98
STEP 5: Conduct the analysis of each inappropriate action
− utilize the appropriate analysis techniques based on the type of inappropriate action)
STEP 6: Identify causal factors
STEP 7: Determine how the causal factor impacted the event
− direct cause, contributing cause, root cause…
STEP 8: Continuously validate the fact during the analysis
FIG. 38. E and CFC Flow diagram.
FIG. 39. Typical layout of E and CF Chart.
Evaluate
initial
info.
(CR)
Define
the
event
(Circle)
Construct
prelim.
Timeline
(What)
Identify
Inapprop.
Actions
Conduct
an
analysisValidate
facts
Determine
Cause
types
Identify
Causal
Factors
ACTION TERMINAL
EVENT
BEHAVIOUR
CONDITION
WHAT
HOW
WHYCausal
factor
INAPPROPRIATE ACTION
/ EQUIPMENT FAILURE
CHANGE

99
Example
Near-miss associated with cleaning of a battery room. An I and C technician requests the cleaning of a battery room: they meet with the cleaner and a briefing is delivered. The cleaner starts to perform the task and places the dustpan on the top of a battery: this caused a risk of shorting the battery.
FIG. 41. Event time line.
FIG. 41. Event time line after initial investigation.
FIG. 42. Identify the inappropriate actions and conditions.
Cleaning starts
Risk of
shorting
battery
I&C Tech requests
room cleaning. Meets cleaner
I&C Tech
delivers
inadequate
brief
Dust pan
placed on top
of battery
Cleaning starts
Risk of
shorting
battery
I&C Tech requests
room cleaning. Meets cleaner
I&C Tech
delivers
inadequate
brief
Dust pan
placed on top
of battery
Battery terminals not
insulated
Cleaning starts
Risk of
shorting
battery
I&C Tech requests
room cleaning. Meets cleaner
I&C Tech
delivers
inadequate
brief
Dust pan
placed on top
of battery
Battery terminals not
insulated
Unaware of standards for
briefing
Tech not trained in setting to work
Assumed briefing
unnecessary

100
FIG. 43. Identify the inappropriate actions and conditions.
FIG. 44. Identify causal factors.
I.2.2. Change Analysis
What it is?
Technique that determines what was different about an event or condition from all the other times the same task or activity was carried out without an event. When to use it?
• When you suspect a change may have contributed to the event; • When causes of event are obscure; • When you don't know where to start the evaluation; • Error/ failure rates for personnel and/or equipment notably increase over a
relatively short period of time; • Failure rates for two pieces of equipment are notably different or the error
rates for different people performing same task vary significantly.
Cleaning
starts
Risk of
shorting
battery
I&C Tech requests
room cleaning. Meets cleaner
I&C Tech
delivers
inadequate
brief
Dust pan
placed on top
of battery
Battery terminals not
insulated
Unaware of standards for
briefing
Tech not trained in setting to work
Assumed briefing
unnecessary
No general electrical safety
training
Unaware of hazard
Not included in original
design
Inadequate safety review /
Area RA
Insulation caps not added
Lack of Quest Attitude / Safety Culture in Maint
/Eng

101
How to use it?
STEP 1: Analyse the event or condition.
STEP 2: Analyse a similar situation that did not have a problem.
STEP 3: Compare the two situations.
STEP 4: Write down all differences (identify the differences that were not apparent during the initial event or condition).
STEP 5: Evaluate the differences for the impact on the event or condition.
STEP 6: Identify the causal factors for the differences that impact the event or condition.
FIG. 45. Change analysis work sheet.
Example
The workshop supervisor noticed a puddle of oil under a car this afternoon. A trainee changed the oil and oil filter this morning. Normally a more experienced technician does the activity. After doing the work, the trainee had borrowed the car and driven it off-road over some rough terrain.
FIG. 46. Example of a performed change analysis.
Factors that
influence
performance
Event
condition
Successful
performance
Difference
/Change
Effect Follow-up
questions
Factors that influence
performance
Event Condition
Successful Performance
Change Effect Follow-up Questions
Personnel
Trainee changed oil & filter
Technician changed oil & filter
Level of experience
Oil leak
Filter installed wrongly?
Oil plug installed wrongly?
Old filter gasket removed?
Equipment Filter from a
retail store Dealer supplied filter
Different filter?
Filter leaking
Proper filter?
Usage Car driven over rough terrain
On-road use Car driven over obstacles
Damage causing leak
Sump leaking or damaged?
Oil filter damaged?

102
I.2.3. Task Analysis
What it is?
Task analysis is a tool that is used on investigations where problems during performance of tasks contributed to the event. When and why to use it?
Task analysis is most useful when investigating incidents where human performance is believed to be a significant factor; This technique is used early in the investigation to assist in improving understanding of the circumstances surrounding the event. How to use it?
STEP 1: Obtain Preliminary Information.
Determine what occurred, who was involved, where they were, what they were doing and what procedures or instructions were being utilized when the event occurred.
STEP 2: Select Task(s) of Interest.
Determine which activity to focus on. Since many events occur during the performance of extended evolutions, it’s best to start with those portions of the evolution that are considered most likely to have been a factor. For example, it may not be necessary to conduct Task Analysis on a 10-page valve lineup if only one valve was later found in the wrong position.
STEP 3: Obtain Detailed Information.
Obtain detailed information about the task(s) of interest by: talking with subject matter experts; and/or, reviewing relevant procedures, documents, manuals, and
drawings; and/or, performing a walk-down of the area where the incident
occurred. (Simulating the task might help to understand it better.)
STEP 4: Divide task into steps.
To clearly understand what should have happened had the activity been performed in accordance with guidance in place at the time of the event, use the information obtained in Step 3, break down the task of interest into its sub-steps. Indicate what each step involves, who performs it, as well as any tools, controls, indications, equipment, and/or prerequisite conditions required for satisfactory performance. Also denote any questions that require answers regarding that particular step.

103
Form C-1 provides a useful format for doing this; however, many tasks already have detailed procedures and checklists associated with them that might work just as well.
Cautionary note: there may be errors in the task methodology. For example, a poorly written or inaccurate procedure might be a causal factor for the event. Clearly annotate and follow up on any issues that might have adversely affected the outcome, or otherwise need to be corrected.
STEP 5: Re-enact selected elements of the task.
Task performance elements should be re-enacted by the individual(s) involved in the incident, if practical. If the task was performed by a crew; then crew members should play the same role they fulfilled when carrying out that task.
If the personnel involved are unavailable, utilize other personnel who perform the task in question. While the use of uninvolved individuals limits the ability to identify performance deficiencies unique to those involved, it still provides an opportunity to identify issues (e.g. lighting, labelling) that may have adversely affected the outcome. The use of uninvolved personnel is also beneficial when there are reasons to believe that due to deficient training or other generic issues, inadequate task performance may not be limited to the individual involved in the event.
Whenever possible, perform re-enactments at the actual work location. Doing so will help identify any human factors (e.g. lighting, temperature, noise, area congestion), that might affect task performance.
STEP 6: Identify causal factors for the inappropriate actions
Evaluate discrepancies between desired and actual task performance as potential causal factors for the incident you’re investigating.
Example
Note: Table 1 provides a sample Task Analysis Worksheet for the following incident. Example Incident: Unit 1 Plant Operations desired to place Demineralizer Bed A in service in order to take Bed B off-line for maintenance. Prior to doing so, they asked Chemistry personnel to determine the boron concentration on the outlet of Bed A. Chemistry personnel drew a sample and subsequently reported the boron concentration to be 700 ppm. Since the sample result fell within 50 ppm of the boron concentration in the reactor coolant system, Plant Operations stopped flushing Bed A and placed it in service. Not long afterward, reactor power unexpectedly increased. Plant Operations believed that the power increase was caused by the boron concentration on the outlet of Bed A being much lower than Chemistry reported.

104
STEP 1: Obtain Preliminary Information
The incident occurred in Unit 1, but it is unknown when or who was involved. Investigation reveals that the event occurred at noon today, and that chemistry technician Jones drew and analysed the sample that appears to have been in error.
STEP 2: Select Task(s) of Interest
Based upon input from Plant Operations, the only credible explanation for the power increase is something going wrong with the act of placing bed A in service. This activity actually involves several distinct tasks, among them sampling, boron analysis, and performing valve manipulations to place the bed in service. Since initial information indicates that the problem most likely resulted from an inaccurate boron result, initial focus should be on the sampling process and then the analysis methodology tasks.
STEP 3: Obtain Detailed Information
Discussions with another chemistry technician reveal the fact that demineralizer outlet samples are drawn in the Unit 1 Hot Lab in accordance with procedure A. Knowing this, obtain a copy of this procedure from the library, also obtain a drawing of the sampling system from the library or system engineer. A walk-down of the area might also prove beneficial.
STEP 4: Divide task into steps
Break down the task of sampling, step-by-step. Use Form C-1 to do this. Look for anything that doesn’t make sense. Do the procedure steps follow a logical sequence? Are there any obvious errors that might have caused confusion? Do the valves operated in the procedure correlate to the correct valves on the system drawing?
Any pertinent questions or remarks regarding a particular step should be annotated on the worksheet. It is identified as a fact that a proper sample purge and use of a clean sample bottle are important for ensuring a representative sample is drawn. It is also noted that the procedure apparently requires the opening of an already open valve. These notes will help maintain focus later when observing or discussing the task in step 6.
STEP 5: Re-enact selected elements of the task
Technician Jones is more than willing to assist the investigation by re-enacting the task.

105
As Technician Jones simulates the task at the sample panel, check off actions as they are performed. Also check off tools and components as she uses them. Any relevant observations (including discrepancies) are noted on the worksheet, including environmental conditions (lighting, noise, etc.) that might adversely impact task performance. When it comes to the first identified critical point, it is noted that she purges the sample line for a set time of five minutes, rather than basing her purge time on the purge flow rate as the procedure required. This might be a causal factor.
STEP 6: Identify causal factors for the inappropriate actions
Technician Jones violated the sampling procedure, but it will take further review to determine whether her error could result in the sample not being representative of water on Bed A’s outlet. In this case it is possible to determine that her five-minute purge would not allow the correct volume of water to pass before a sample was drawn.
It is still unknown why she didn’t purge in the manner required by the procedure. Use other analytical techniques (e.g. interviewing) to get this information. It might still be prudent to do a Task Analysis on the analytical process and other tasks that could have caused the incident.

106
TABLE 2. EXAMPLE OF A COMPLETE TASK ANALYSIS WORKSHEET
Step # Performed by Required Action(s) Component(s) Tools Remarks/Questions
1.1 Technician notify control room of intent to sample phone
1.2 Technician open demineralizer outlet grab sample valve
XPS-0311 Is this the correct valve, per system design?
1.3 Technician open sample panel isolation valve XPS-0214 Is this the correct valve, per system design?
1.4 Technician observe pressure indicator PI-4469
1.5 Technician adjust/maintain sample pressure <20 psig XPS-0311 PCV-4469A
1.6 Technician observe flow rate on meter FICV-4469

10
7
1.7 Technician purge at least 2.5 gallons of water through sample lines
Clock or watch?
Critical step in order to ensure sample is representative. Were sample lines flushed the proper amount
1.8 Technician throttle open grab sample valve XPS-0311 Why does step 1.8 say to open valve, when it is already open per step 1.2?
1.9 Technician draw sample from grab sample valve sample bottle Sample contamination could occur here. Did technician ensure sample bottle was clean and empty?
2.0 Technician close sample valve XPS-0311

108
I.2.4. Barrier Analysis
What it is?
Barrier analysis is a technique that is utilized to identify degraded or failed barriers that have contributed or caused an adverse condition or event. The limitation of barrier analysis is that it needs to be used in conjunction with other tools in order to identify causal factors that ultimately may be contributors or the root cause of that event. When and why to use it?
Barrier Analysis is used for evolutions that depend on defence in depth in order for a successful performance. How to use it?
Barrier Analysis is a seven-step process, as presented in Figure 48:
FIG. 47. Barrier Analysis Process Diagram.
STEP 1: Identify Undesirable Situation(s)
In order to begin Barrier Analysis, it is necessary to define exactly what that undesirable situation entails (e.g. a worker was injured, the reactor tripped).
List undesirable situations on the Barrier Analysis Worksheet. STEP 2: Identify Existing Barriers
Once the undesirable situation is identified, it is necessary to identify what processes, practices, policies, and procedures are already in place for preventing, delaying, discouraging, detecting, or reducing the severity of the incident.
Evaluate how the barrier is supposed to prevent an undesirable situation. It may be necessary to interview subject matter experts,
Step 2
Identify Existing Barriers
Step 1
Identify Undesirable Situation(s)
Step 3
Determine if Barriers Failed
Step 4
Determine How Barriers Failed
Step 6
Consider Missing Barriers
Step 7
Analyze and Integrate Results
Step 5
Determine Why Barriers Failed

109
perform an area walk down, or review reference materials in order to identify ALL existing barriers that apply
Barriers include but are not limited to the following: Physical Barriers:
• Engineered Safety Features; • Safety and Relief Devices; • Conservative Design Allowances; • Redundant Equipment; • Locked Doors and Valves; • Ground Fault Protection Devices; • Radiation Shielding; • Alarms and Annunciators; • Fire Barriers and Seals.
Administrative Barriers:
• Plant Operating and Maintenance Procedures; • Policies and Practices; • Training and Education; • Maintenance Work Requests; • Radiation Work Permits; • Licensing of Operators; • Qualification of employees; • Methods of Communication; • Certification of Health Physicists and Technicians; • Certification of Engineers; • Technical Specifications; • Regulations; • Supervisory Practices; • Work History.
STEP 3: Determine if Barriers Failed
Which barriers failed, or partially failed to prevent the inappropriate action or equipment failure? Update Form
STEP 4: Determine How Barriers Failed
How did the barrier fail? Did it simply not work as designed (e.g. level alarm didn’t actuate)? Was it overridden (e.g. locking device was removed)? Update Form.
Note: utilize an applicable analysis tool to determine causal factor, once we know how the barrier failed

110
STEP 5: Determine Why Barriers Failed
Determine why the barrier failed to prevent this situation from occurring. What prevented the failed barriers from working? Did the worker fail to use the procedure because he was unaware it applied to the task? Reasons for barrier failures often hold the key to identifying causal factors for the event. It might be necessary to use interviewing and other root cause analysis techniques to conclusively determine WHY these barriers failed.
STEP 6: Consider Missing Barriers
Were there any barriers missing that could have prevented, delayed, discouraged, detected, or reduced the severity of the incident you’re investigating? Identify missing barriers on Form.
STEP 7: Identify Causal Factors
Evaluate the effect that degraded or missing barriers had on the outcome of the event. Identify specific causal factors to explain why the barrier failed.
Corrective actions to address causal factors will generally involve strengthening degraded and/or missing barriers or implementing new ones. Involvement of personnel involved in the incident may be one of the best sources of identifying new barriers (or strengthening existing ones) to prevent recurrence.
Example
Supervisor 1 revises work instructions intended to disable an out-of-service bypass valve. The changes introduce an error: not only will the bypass valve be disabled with a jumper, but the in-service valve as well. Days later, Supervisor 2 and the technicians assigned to perform the task see the changes to the work instructions. They noted it as unusual that two jumpers would be landed, since only one jumper per valve was typically used. Their concerns were put to rest, however, when they observed that Supervisor 1, who was respected for his competence, revised the work instructions. Consequently, neither Supervisor #2 nor the technicians bothered to verify the accuracy of the work instructions, despite management expectations to do so. When work commenced, their actions caused the in-service valve to close. Feedwater flow to the affected steam generator (S/G) dropped like a rock, and a reactor trip on low S/G water level occurred. Table 2 provides a completed Barrier Analysis worksheet based upon this event. STEP 1: Identify Undesirable Situation(s)
Two undesirable situations are identified:
• The work instructions were incorrect; • The S/G level went too low after the valve went closed.

111
STEP 2: Identify Existing Barriers
In the case of the work instructions, site procedures allowed Supervisor 1 to make field changes to documents. While no administrative barriers were in place to prevent this event, three human action-type barriers were in place that could have prevented it from occurring.
Specifically, management expectations had been established to require:
• personnel to use self-verification techniques as a means of preventing errors of this type;
• personnel to exhibit a questioning attitude; • crews to verify the accuracy of work instructions prior to
implementation.
With respect to the low S/G level, the reactor protection circuitry provided a physical barrier to limit its impact on reactor safety, if it were to occur
STEP 3: Determine If Barriers Failed
− Degraded or failed Barriers: Verification and Approval to changes of work instructions
Management expectations that personnel self-verify, exhibit a questioning attitude, and verify the accuracy of work instructions failed to protect the plant against the inappropriate actions.
− Successful Barrier:
The reactor tripped when the low steam generator water level set point was reached. This physical-type barrier was effective in placing the plant in a safe mode BEFORE conditions deteriorated to the point where reactor safety was threatened.
STEP 4: Determine How Barriers Failed
Supervisor 1 did not self-check when revising the work instructions.
Supervisor 2 and the two technicians did not look into something that appeared unusual in the work instructions (two jumpers instead of one).
Supervisor 2 and the two technicians chose not to verify that the work instructions were accurate.
STEP 5: Determine Why Barriers Failed
The investigation for this event found that complacency, as a result of overconfidence, was the primary reason why all three barriers failed. Those involved all knew the management expectations that weren’t met…but didn’t follow through.

112
STEP 6: Consider Missing Barriers
The process, by which supervisors can revise work instructions, while convenient, obviously introduces an opportunity for error. An administrative-type barrier requiring field changes to work instructions to be independently reviewed may be needed.
STEP 7: Identify Causal Factors
The issue of complacency will be evaluated as a likely causal factor once the data collection and review phase of the investigation is over. The corrective action plan will have to strengthen/reinforce the barriers that broke, and/or implement new ones.

113
TABLE 3. EXAMPLE OF A COMPLETE BARRIER ANALYSIS WORKSHEET
Undesirable
Situation
Existing
Barriers
Failed ?
(yes/no)
How Barrier Failed Why Barrier Failed Missing Barriers ?
inaccurate work instructions
self-verification yes Supervisor #1 did not self-check when revising the work instructions.
complacency require independent review of field changes
questioning attitude
yes Supervisor #2 and the two technicians did not look into something that appeared unusual in the work instructions (two jumpers instead of one).
complacency
crew validation of work instructions
yes Supervisor #2 and the two technicians chose not to verify that the work instructions were accurate.
complacency
low S/G level reactor protection circuitry
no

114
I.2.5. Interview
The following slides provide an example of training material for interview technique.

115

116

117

118

119
I.3. COMPLETE INVESTIGATION TRAINING PACKAGES
The training package presented in Annex II is an example that could be followed to create training packages from real events. It has been split in the following types of documents:
• Initial event information which can include event description, event report, etc.; • Fact finding information which can include maps, flow sheets, diagrams,
procedures, drawings, technical documentations, etc.; • Answers from the interviews of the plant personnel for the instructor’s simulation; • Templates for typical analysis techniques, for example task analysis, change
analysis, barrier analysis, etc.; • Results of the analyses performed specific to the event being analysed.
How to Use the Training Package
Between 5 and 20 people should be trained at once (split in groups of 3 to 5 people), basic knowledge requested to trainee to adequately participate in the investigation simulation: analysis process, training material on most used tools presented in Chapter 1. Training session steps:
• Initial material to be distributed to the trainee - Document A1; • Let the trainee analysis the material provided so far; • Ask the trainee what they should do next; • Begin filling in Event Time Line with initial facts (suggest the trainee to start
filling it if they don’t answer correctly); • Ask the trainee what other material they should ask for (material available:
Documents B1-3, together with the possibility to interview plant personnel). In case the trainees don’t ask for all the material available, tell them what else is available;
• After the trainees have reviewed the material, ask what they should do next (interview);
• Ask the trainees who they want to interview (anybody involved in the event, for example: shift supervisor, maintenance individuals, trainees, etc.);
• Let the trainees interview the selected personnel. Training instructor should take the role of the personnel selected for the interview and use C1-4;
• In case trainees want to interview other people involved, training instructor should utilize event description and the other reference material;
• Verify they are filling the Event Time Line as they gather information; • Ask/suggest the trainees what techniques they should use to identify the
inappropriate actions; • Guide the trainees in performing analysis by means of selected techniques
utilizing worksheets D1-3; • Guide the trainee in commencing the construction of the E and CF chart by
adding the information identified so far to the time line; • Facilitators assist the groups (if more than one) in comparing the E and CF charts
produced, and discuss the possible differences;

120
• Use the root cause method that the company utilizes to identify the effect of error precursors, failed defences in the inappropriate action, and finally the causal factors;
• Evaluate the causal factors to determine which are contributing and root causes; • Document the results of the investigation in the format that the company utilizes
for root cause investigation; • Discuss with trainees possible corrective actions to address the root causes,
contributing causes and to mitigate the problem until those corrective actions can be implemented;
• Discuss with trainees the possible way to determine the effectiveness of the root cause investigation, including how to measure effectiveness and what are the criteria for successful implementation of corrective actions;
• Compare the different investigation results produced by trainees (if more than 1 group) with the Exercise results E1-4 and the Summary of Causes and Corrective Actions.

121
ANNEX II. PT 534/535 EVENT PACKAGE
II.1. EVENT INFORMATION
II.1.1. DOCUMENT A1 – EVENT DESCRIPTION
This morning at 5:30 a.m. a reactor scram occurred from 100 per cent rated power. This event was initiated by an I and C technician lifting a wire in a main steam line pressure transmitter during a calibration surveillance. Three I and C technicians were assigned the task of calibrating six main steam line pressure transmitters on the midnight shift by the I and C supervisor. This task is normally assigned to a lead technician working with two senior technicians. Due to a lack of human resources, the supervisor assigned a lead technician, a senior technician, and a trainee to perform the surveillance. The lead technician was given a copy of the procedure by the operator to perform the surveillance. The lead technician remained in the control room while the senior technician and trainee got a deadweight tester and test pressure gauge. The two technicians proceeded to the main steam tunnel and established headset communications with the lead technician in the control room. The surveillance was controlled by the lead technician in the control room. This was the first time they had calibrated all six transmitters on the same shift. Previously, they would do one per shift until all six were calibrated. This week there had been a lot of extra work to do and the surveillance had been delayed. The surveillances had to be completed because of requirements contained within the technical specifications. Four of the six transmitters had been calibrated by 5:00 a.m. with two remaining. The next transmitter to be calibrated was PT-534. As directed by the procedure, the lead technician in the control room placed the circuit card for PT-534 in ‘TEST.’ This annunciated a control room alarm as expected. He then directed the technicians to isolate the sensing line to PT-534. Once this was completed, he directed the technicians to connect the deadweight tester and pressure gauge and lift the lead wire from PT-534. About 10 minutes later a reactor scram occurred when the technicians inadvertently lifted the lead wire on transmitter PT-535. With transmitter PT-534 in test and the wire from PT-535 lifted, the reactor protection system logic was satisfied causing the scram. All systems performed as designed and the unit was stabilized in hot standby.

122
II.1.2. DOCUMENT B1 – LOGIC DIAGRAM
II.1.3. DOCUMENT B2 - MAIN STEAM TUNNEL MAP
STEAM LINE
PT 530 PT 532 PT 531
STEAM LINE
PT 533
PT 534 PT 535

123
II.1.4. DOCUMENT B3 - TASK PROCEDURE
5.2.3 Testing/Calibration AB/PT0534 (Loop 3)
5.2.3.1 On main control board panel RL006, locate AB FS/532C ‘Steam Flow Select Switch.’ Ascertain that it is selected to the ‘F533’ position. If it is, N/A Step 5.2.3.2 and 5.2.3.3 and proceed to Step 5.2.3.4. If it is not selected to ‘F533’ position, perform Steps 5.2.3.2 and 5.2.3.3.
5.2.3.2 Locate AE FK-530 M/A station on RL006. Have Operations place it in ‘manual’ position.
5.2.3.3 Have Operations place AB FS/532C in the ‘F533’ position. After stabilization, AE FK 530 can be returned to ‘Auto’ at Operation's discretion.
5.2.3.4 Notify Operations that they can expect the following alarms and status indications:
• ‘PCS CAB DOOR OPEN’ (RK024-893) • ‘STM LINE LP L3 PB534A’ (Rx Partial Trip Status Panel) • ‘STM HP RATE L3 PB534B’ (Rx Partial Trip Status Panel)
5.2.3.5 Verify on Reactor Trip Status panel that no status indication lamps are illuminated for any Safety Injection or Steam line Isolation function. (may not apply in Modes 3-6)
5.2.3.6 In Protection Set I, cabinet 01, locate ‘Channel Test’ Card PS 534 at location 0848.
Place the two switches, FS/534A and PS/534B in the TEST position.
5.2.3.7 In Protection Set I, cabinet 01, locate ‘Master Test’ Card UY/761T at location 0874.
Place Sw. 67 in TEST position
5.2.3.8 If in Modes 1 or 2, re-notify Operations that you are about to remove AB/PT0534 from service.

124
5.2.3.9 PT0535 in the steam tunnel. Close the sensing line isolation
Valve.
5.2.3.10 A deadweight tester pump of the proper type will be used as the test pressure source
5.2.3.11 Connect the test input pressure source, with gauge, to the test input of the manifold.
5.2.3.12 Remove the transmitter cover faceplate.
5.2.3.13 Using the DVM, check the supply voltage to the transmitter at the Pos (+) and Neg (-) terminals. It should be approximately 25-45 Vdc. If it is less than 20 Vdc, the loop should be checked for power supply problems prior to calibration.
5.2.3.14 Lift the Pos (+) lead wire from the transmitter terminal block and connect the precision 50-ohm resistors in series with the current loops.
II.1.5. DOCUMENT C1 - INTERVIEWING EXERCISE: SENIOR I and C TECHNICIAN
INFORMATION
Note:
IF asked to draw a map of the work area, provide students a copy of document B2. The additional information found on document C2 may be annotated by hand onto the first map IF solicited by the students during the interview.
1. The pressure transmitters provide main steam line break protection. Two out of three transmitters on a single steam line must get a signal to cause a scram.
2. You’ve performed this task successfully several times before, most recently about
five months ago.
3. The task involves placing the channel in test, verifying an alarm is received, isolating the transmitter, hooking up a deadweight tester and pressure gauge and then performing the calibration.
1st 2nd

125
4. Normally, one transmitter is calibrated per shift. Typically, two qualified
technicians are in the field, one of who is on the phones with the lead technician in the control room. The technician on the phone follows the procedure and relays orders from lead technician to the second technician, who then performs the work.
5. This time, you were working with a Trainee. It’s bad enough that your supervisor
wants all six transmitters calibrated in one shift, but you’re supposed to do it while providing on-the-job training (OJT). You were performing the OJT according to your own judgment, as nobody ever told you how to do it, but it slowed things down, so you had to hurry things in order to ensure all six were finished.
6. All three participants attended a pre-job briefing given by your supervisor. The
subject matter was standard: job assignments, possibility of tripping the plant if we messed up, need to calibrate all six transmitters this shift, etc.
7. It was the third midnight shift in the cycle. You felt pretty alert, and don’t think
the Trainee was tired either. The shift lasts from midnight to 8:00 a.m.
8. The Trainee had watched you calibrate the first two transmitters, and you watched her do the next two satisfactorily.
9. The reactor scram happened around 5:00 a.m. while calibrating the fifth
transmitter, PT-534. The Trainee apparently was working on PT-535 instead of PT-534. The transmitters are right next to each other.
10. The Trainee was working between you and the transmitters, with her back to you.
11. You were standing about 8 feet away from the Trainee when the scram occurred.
Unlike the first four calibrations, the headset jack was too far away to get within 6 feet of the transmitters. The Trainee had already done two calibrations just fine, so you figured you might as well stand a little farther away under an AC duct and be comfortable. It’s pretty hot in the rooms due to the main steam lines going through them.
12. You had a copy of the procedure in-hand and checked off each step as it was
performed. When you got to the step in the procedure that said to isolate PT-535, you remembered it was a typographical error and told the Trainee to isolate the correct transmitter, which was PT-534. The Trainee repeated back the order to isolate PT-534, but still managed to get on the wrong transmitter! The typographical error has been there awhile and everybody’s aware of it.
13. Step 9 of the procedure required two checks. Until about a year ago, one block
was checked by the performer and the other by a quality control (QC) specialist. The site no longer has QC do second checks like this, so you just skipped the block.

126
14. After the scram, your supervisor told you that the extra block in step 9 was for independent verification. The shop has had some training in the past year on how to perform independent verification (IV), but nothing about it being required in situations like this.
15. The lighting in the steam tunnels isn’t very good, with lots of shadows near PT-
534 and 535.
16. You looked for a working flashlight before you left the shop, but the batteries were all dead or nearly so. You didn’t think it was worth having to get the Shift Supervisor to call in a warehouse person on overtime to get more batteries, nor could you wait that long if all the transmitters were to get calibrated.
17. Labels on transmitters and associated components are correct, but aren’t easy to
read as they feature small black characters on a gray background.
II.1.6. DOCUMENT C2 - MAIN STEAM TUNNEL MAP: SENIOR TECHNICIAN
INFORMATION
4’
STEAM LINE
PT 530 PT 532 PT 531Phone Jack
STEAM LINE
PT 533Phone Jack AC Duct
Headphone Cord 6’
12 ‘
PT 534 PT 535
6’

127
II.1.7. DOCUMENT C3 - TRIP NOTIFICATION REPORT WRITTEN BY SHIFT
SUPERVISOR
Note:
This material can be used for simulating other interviews
At 05:30 hours today, there was a trip of Reactor 2 from full power. The event occurred when an I and C technician disconnected a wire in a main steam-line pressure transmitter during routine calibration. At the start of the night shift, 3 I and C technicians were assigned the task of calibrating 6 main steam-line transmitters by the I and C Supervisor. The task was usually assigned to a Lead Technician working with 2 Senior Technicians, but because the Supervisor was short of staff he assigned a Lead Tech, a Senior Tech and a I and C Trainee to do the work. The Lead Tech was issued with copies of the procedures by the Supervisor and the I and C team were given permission from the Shift Supervisor and the Reactor Operator to perform the calibrations. The Lead Tech remained in the Control Room whilst the Senior and the Trainee collected a dead-weight tester and a test pressure gauge. The Senior and Trainee proceeded to the main steam tunnel and established headset communication with the Lead Tech who was controlling the work from the Control Room. This was the first time that 6 transmitters had been calibrated on the same shift. It is normal practice to calibrate one transmitter per shift until all 6 have been calibrated. This week there has been a lot of extra I and C work to do and the routines have been delayed. The routine calibrations had to be completed last night to remain in compliance with the requirements contained in the Technical Specifications. 4 of the 6 transmitters had been successfully completed by about 05:00 hours with 2 remaining. The next transmitter to be calibrated was PT-534 followed by PT-535. As directed by the procedure, the Lead Tech placed the circuit card for PT-534 in 'Test'; this annunciated an alarm in the Control Room as expected. He then directed the technicians in the steam tunnel to isolate the sensing line to PT-534. Once this was completed, he directed the technicians to connect the dead-weight tester and pressure gauge and to disconnect the lead wire from PT-534. About 10 minutes later a reactor trip occurred when the technicians in the steam tunnel inadvertently disconnected the lead wire on transmitter PT-535. With PT-534 in 'Test' and the wire from PT-535 disconnected, the Reactor Protection System logic was satisfied, causing the trip. All plant systems performed as designed and the unit was stabilized in Hot Standby.

128
II.1.8. DOCUMENT C4 - ADDITIONAL EVENT NARRATIVE
Note:
This material can be used for simulating other interviews
Three I and C technicians were assigned to calibrate 6 main steam line pressure transmitters located in the steam tunnel. The technicians had successfully calibrated 4 of the six and were attempting to locate and identify pressure transmitter PT-534. The Lead Technician working in the Control Room placed the test switch (in the safeguards cabinet) for PT-534 into the 'Test' position. He then directed his two colleagues (a Senior Technician and a Trainee), working in the steam tunnel to locate and isolate PT-534 and connect test equipment. The Senior Technician received this information over a headset and directed the Trainee to find PT-534 and then to isolate it and connect the test equipment. The Trainee went to the nearest transmitter and read the label. It was PT-534 but the Trainee mistakenly read the label as PT-535. Knowing that there was only one other transmitter remaining to be calibrated she went to the last transmitter and began to work on it thinking it was PT-534 - it was actually PT-535. This transmitter was sited in a corner in shadow. During the calibrations, the Senior Technician was acting as on-job-trainer for the Trainee, who was performing the calibrations. However the Senior Tech did not directly supervise the Trainee and did not conduct the required Independent Verification when ready to lift the transmitter output lead. So, the Trainee isolated PT-535, connected the test equipment and disconnected the lead. With PT-534 in 'Test' and PT-535 inoperable the 2 out of 3 reactor protection logic was satisfied and the reactor tripped followed by Safety Injection. ADDITIONAL COMMENTS Even though the procedure, ABC-5.2.3 did not cause the event, it contains a technical error that could have caused the event. The I and C technicians were compensating for the error without properly having made a procedure change. The procedure has now been changed. All personnel should be encouraged to initiate and pursue changes to procedures when technical inaccuracies are discovered.

12
9
II.2. WORKSHEETS
II.2.1. DOCUMENT D1 - TASK ANALYSIS WORKSHEET
Step # Performed By Required Action(s) Component(s) Tools Remarks/Questions

13
0
II.2.2. DOCUMENT D2 - CHANGE ANALYSIS WORKSHEET
Critical Factor
(who, what, when,
where, how)
Incident Conditions Non-Incident
Conditions
Difference/Change Effect Questions to Answer

13
1
II.2.3. DOCUMENT D3 - BARRIER ANALYSIS WORK SHEET
Undesirable
Situation
Existing
Barriers
Failed?
(yes/no)
How Barrier Failed Why Barrier Failed Missing
Barriers?
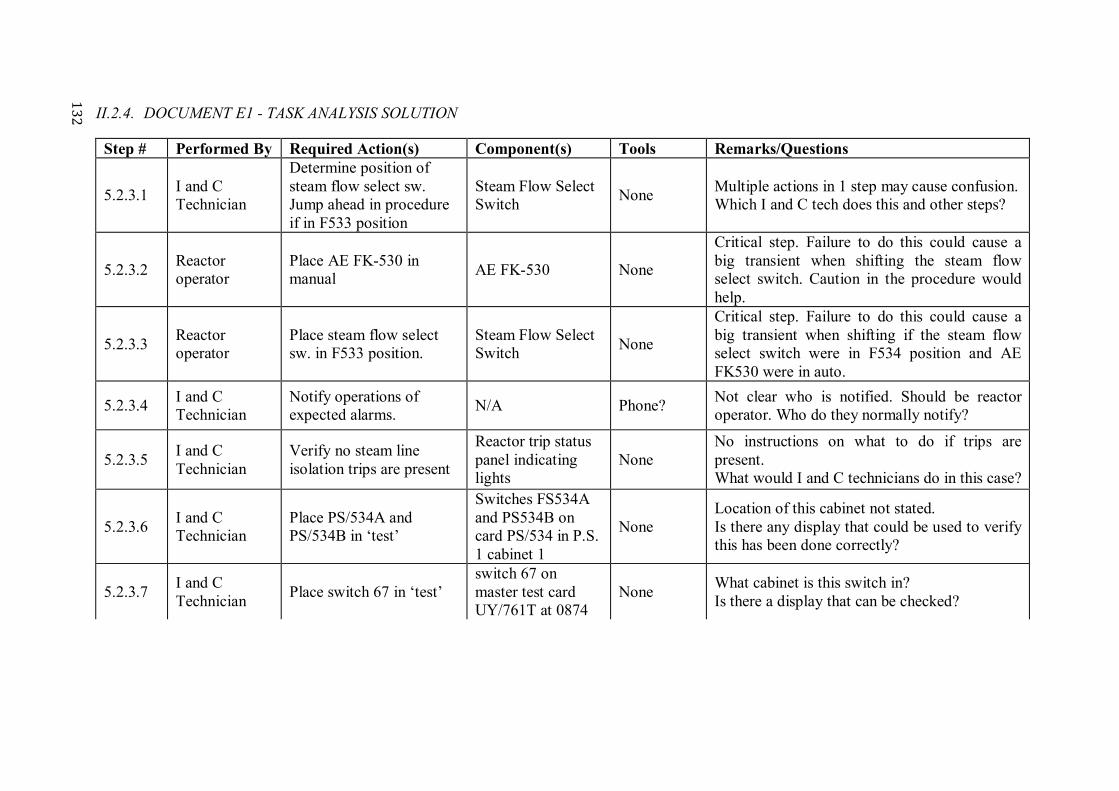
13
2
II.2.4. DOCUMENT E1 - TASK ANALYSIS SOLUTION
Step # Performed By Required Action(s) Component(s) Tools Remarks/Questions
5.2.3.1 I and C Technician
Determine position of steam flow select sw. Jump ahead in procedure if in F533 position
Steam Flow Select Switch
None Multiple actions in 1 step may cause confusion. Which I and C tech does this and other steps?
5.2.3.2 Reactor operator
Place AE FK-530 in manual
AE FK-530 None
Critical step. Failure to do this could cause a big transient when shifting the steam flow select switch. Caution in the procedure would help.
5.2.3.3 Reactor operator
Place steam flow select sw. in F533 position.
Steam Flow Select Switch
None
Critical step. Failure to do this could cause a big transient when shifting if the steam flow select switch were in F534 position and AE FK530 were in auto.
5.2.3.4 I and C Technician
Notify operations of expected alarms.
N/A Phone? Not clear who is notified. Should be reactor operator. Who do they normally notify?
5.2.3.5 I and C Technician
Verify no steam line isolation trips are present
Reactor trip status panel indicating lights
None No instructions on what to do if trips are present. What would I and C technicians do in this case?
5.2.3.6 I and C Technician
Place PS/534A and PS/534B in ‘test’
Switches FS534A and PS534B on card PS/534 in P.S. 1 cabinet 1
None Location of this cabinet not stated. Is there any display that could be used to verify this has been done correctly?
5.2.3.7 I and C Technician
Place switch 67 in ‘test’ switch 67 on master test card UY/761T at 0874
None What cabinet is this switch in? Is there a display that can be checked?

13
3
Step # Performed By Required Action(s) Component(s) Tools Remarks/Questions
5.2.3.8 I and C Technician
Inform ops going to remove AB PTO 534 from service.
N/A Phone? Probably need communications set up with personnel in aux building steam tunnel. How many techs does this take?
5.2.3.9 I and C Technician
Close isolation valve. Sensing line isolation valve for PT 535
None
Apparent procedure error. Which valve was closed? Is valve uniquely identified? May be tech. spec. problem if two channels inoperable at same time. What do 1st and 2nd blanks mean?
5.2.3.10 I and C Technician
Not clear what action is required.
Dead weight tester None
This should probably be a note or reworded to make specific action clear. Does not specify type deadweight tester or tester calibration requirements. Does not require tester serial number to be recorded.
5.2.3.11 I and C Technician
Connect dead weight tester.
Dead weight tester Wrench Does not say how to connect tester. A drawing would help. What transmitter is tester connected to?
5.2.3.12 I and C Technician
Remove transmitter cover.
Transmitter Screwdriver Specific transmitter not identified.
5.2.3.13 I and C Technician
Check voltage at + and - terminals
Transmitter Digital voltmeter
DVM Serial No. and voltage readings are not recorded. Type DVM is not specified.
5.2.3.14 I and C Technician
Lift + wire and connect 50Ω precision resistors
Transmitter
Screwdriver/50Ω resistors/test leads
No caution or note that lifting wire on wrong transmitter will cause main steam line rupture signal to reactor protection system (2/3 channels tripped). Rx scram, safety injection, and steam line isolation will result.

13
4
II.2.5. DOCUMENT E2 - CHANGE ANALYSIS SOLUTION
Critical Factor
(who, what,
when, where,
how)
Incident
Conditions
Non-Incident
Conditions
Difference/Change Effect Questions to Answer
Calibration of PT-534
Lifted lead on PT-535
Lifted lead on PT-534
Lifted lead on wrong transmitter
Trip logic satisfied/reactor scram
How did the technicians end up on the wrong transmitter? Were they close together?
Schedule Calibration delayed until just before due
Calibrations performed more in advance of due date
Less time to complete task
Perceived time pressure
Were the technicians rushing/taking short cuts due to schedule pressure? How was decision made to delay performance till the last minute?
Schedule (2) Six calibrations in one shift
One calibration/shift
Crew assigned 5 more calibrations than previously performed
?2 Did the performance of repetitive tasks lead to fatigue, complacency, etc.?
2 More or less question marks could be present in the results from the simulation, depending on when the change analysis is performed during the investigation (and consequently on the amount of information already available). Questions to answer should change accordingly.

13
5
I and C Personnel Assigned
Lead Technician, Senior Technician, Trainee
Lead Technician, two Senior Technicians
Trainee involved, fewer qualified personnel
Less experience with task
Why was the crew short-handed? What were the job assignments during the calibration? Which technician lifted the wire? Was the Senior or Lead Technician providing proper control/oversight of trainee? What are site requirements for trainee control? What was the experience level of the Lead and Senior Technician?
Physical factors (environmental, labelling, configuration)
? ? ? ?
Does configuration, labelling, lighting, etc. inhibit identification of the correct component?
Time of Day Mid-shift/ 5:30 AM
Various shifts/times ? ?
Is this a task that should be performed on backshifts? Was this close to shift turnover? If so, was self-imposed time pressure a factor?

13
6
II.2.6. DOCUMENT E3 - BARRIER ANALYSIS SOLUTION
Undesirable
Situation
Existing
Barriers
Failed?
(yes/no)
How Barrier Failed Why Barrier Failed Missing
Barriers?
Inadequate staff Work Planning Yes Low staff level required use of Trainee
Workload not included in schedule planning
Different team makeup
Training and Qualification
?3 (Trainee fully qualified?)
Supervision Yes Lead stayed in CR with procedure
Normal practice
Team development
? (Was this first time with the trainee?)
Communication ? (Headset used: was it clear?)
Pre-job briefs ? (Was it commensurate to the team member, especially the trainee?)
Performed more Calibrations per shift
Work planning Yes Emergent work caused backup of TS level work items
Emergent work not controlled.
3 More or less question marks could be present in the results from the simulation, depending on when the change analysis is performed during the investigation (and consequently on the amount of information already available). List of missing barriers should change accordingly.
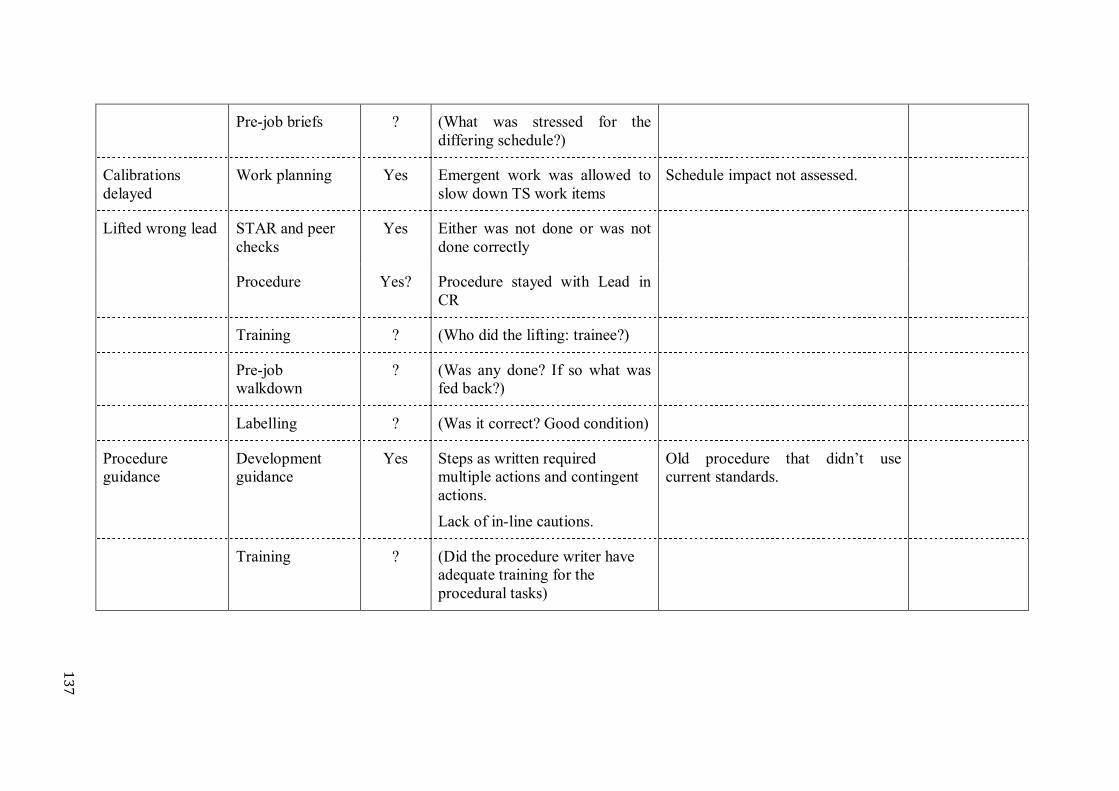
13
7
Pre-job briefs ? (What was stressed for the differing schedule?)
Calibrations delayed
Work planning Yes Emergent work was allowed to slow down TS work items
Schedule impact not assessed.
Lifted wrong lead STAR and peer checks
Yes Either was not done or was not done correctly
Procedure Yes? Procedure stayed with Lead in CR
Training ? (Who did the lifting: trainee?)
Pre-job walkdown
? (Was any done? If so what was fed back?)
Labelling ? (Was it correct? Good condition)
Procedure guidance
Development guidance
Yes Steps as written required multiple actions and contingent actions.
Lack of in-line cautions.
Old procedure that didn’t use current standards.
Training ? (Did the procedure writer have adequate training for the procedural tasks)

13
8 Walkthroughs ? (Was a procedural walkthrough
done to identify adverse conditions)
Barriers to check:
Work conditions
Procedure adherence
Communication between CR/field
Procedure content
Equipment availability

13
9
II.2.7. DOCUMENT E4 - E and CF CHARTING SOLUTION

14
0

14
1

142
II.3. CAUSES AND CORRECTIVE ACTIONS
II.3.1. SUMMARY OF CAUSES AND CORRECTIVE ACTIONS
1. Work schedule induced time pressure: insufficient time and resources were available to support the scheduling of the routine calibration activities on this occasion.
2. Labeling was hard to read: labels on transmitters and associated components are correct, but aren’t easy to read as they feature small black characters on a gray background.
3. Lighting is poor: the lighting in the steam tunnels isn’t very good, with lots of
shadows near PT-534 and 535.
4. Self-check techniques (e.g. STAR) not used: I and C personnel did not maintain questioning attitudes several times during the performance of the evolution.
5. Inadequate training on on-job training supervision: Senior I and C technician
(and all I and C technicians) had not been trained on their responsibilities and duties whilst acting as supervisors during on-job training of other staff, so he performed an inadequate control of Trainee.
6. Procedure ABC-5.2.3 does not clearly indicate that independent verification is
required when identifying and isolating the transmitter.
7. Inadequate communication of changes: the requirements of using Verification practices - a relatively new programme - had not been explained or reinforced with I and C workers even though it was being incorporated into procedures.
II.3.2. ROOT CAUSES
Failure of I and C technicians to properly identify and utilize verification practices during critical evolutions: causes 7 and 5 are the root causes of the event. II.3.3. CORRECTIVE ACTIONS TO ADDRESS RECURRENCE
CA 7: • Reinforce with all I and C technicians and trainees the requirement to
follow proper verifications (this action is complete when this has been reinforced will all individuals in I and C department);
• Review and add as applicable the use of proper verification techniques to the initial and refresher training (this action is complete when applicable lesson plans and programs has been updated).
CA 5:
Review and add as applicable responsibilities of supervisors during on-job training to the initial and refresher training (this action is complete when applicable lesson plans and programs has been updated).

143
All contributing causes, extent of conditions and identified deficiencies should have applicable corrective actions specified. (Example of CA 6: Amend the procedure ABC at step 5.2.3.9 to provide clear instructions that independent verification is required for identifying the transmitter to be worked on.4) II.3.4. EFFECTIVENESS REVIEW
Determine effectiveness of the corrective action to prevent recurrence by performing the following:
CA 7: • Review the corrective action database for issues related to failure to use
proper verification techniques; • Review I and C initial and refresher training material to ensure that they
include use of proper verification techniques.
CA 5: Review I and C initial and refresher training material to ensure that they include on-job training supervision.
4 Cause 6 has not been considered as one of the root causes but just a contributing cause because there was a second block to be checked at step 5.2.3.9; a different interpretation could consider the procedure deficiency as one of the root causes, and in this case an extent of conditions would require to verify also other I and C procedures utilized for critical evolutions. In this last case, the CA 6 would be: Review all I and C procedures utilized for critical evolutions and ensure that they include the requirement for proper verification signature at the important steps (this action is complete when all procedures have been reviewed). An effectiveness review for CA 6 would require to randomly select 10 completed critical I and C procedure checklists and review for proper verification signature.

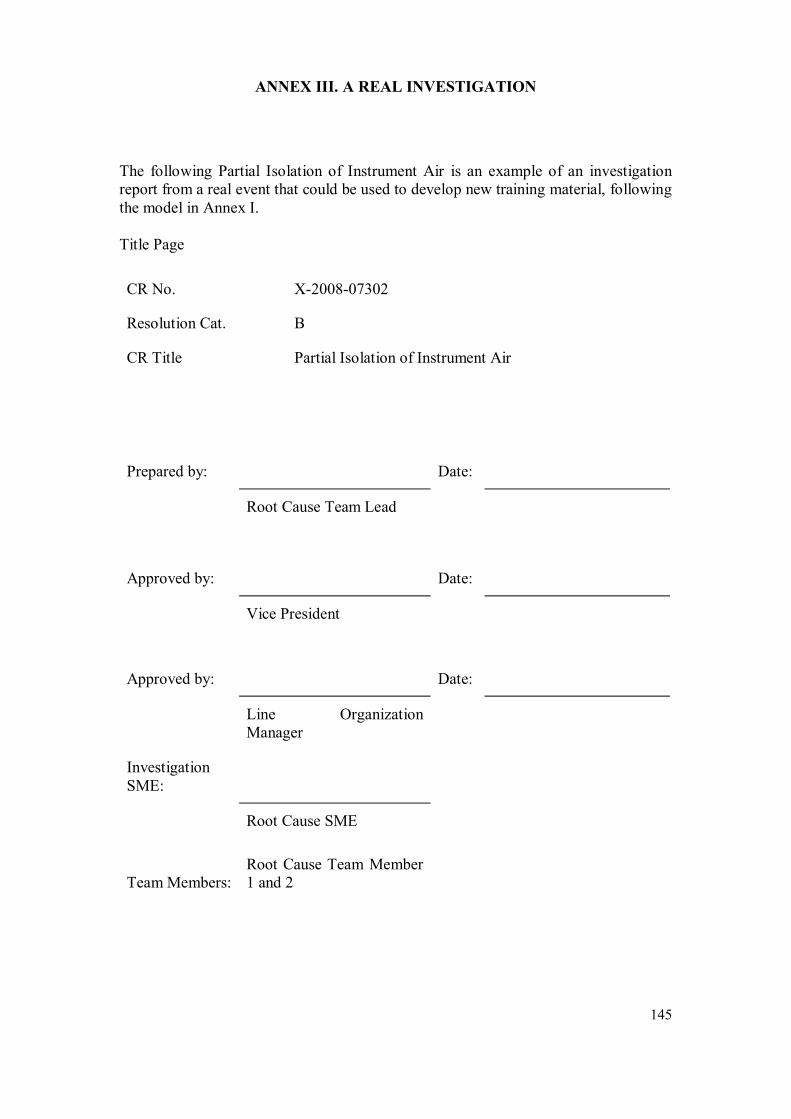
145
ANNEX III. A REAL INVESTIGATION
The following Partial Isolation of Instrument Air is an example of an investigation report from a real event that could be used to develop new training material, following the model in Annex I. Title Page
CR No. X-2008-07302
Resolution Cat. B
CR Title Partial Isolation of Instrument Air
Prepared by: Date:
Root Cause Team Lead
Approved by: Date:
Vice President
Approved by: Date:
Line Organization Manager
Investigation SME:
Root Cause SME
Team Members: Root Cause Team Member 1 and 2

146
III.1. MANAGEMENT SUMMARY
III.1.1. SUMMARY OF CONDITION
On March 1rd, 2008 during the removal of Work Permit 50438 in Unit 3 for 3-75120-RV142, a partial loss of instrument air occurred that resulted in a Level 2 Impairment of Negative Pressure Containment (NPC) due to the closure of 3-3831-DP43 and DP44. In addition instrument air was inadvertently isolated to various loads. This event was reportable to Regulatory Authority III.1.2. SUMMARY OF CAUSES
Root Cause - Standards as defined in AD-PROC-00617 and OPS-PROC-000XX were not followed. III.1.3. EXTENT AND SIGNIFICANCE OF CONDITION
The extent of condition is specific to non-compliance with Operator Fundamentals and Human Performance Standards at both Stations A and B. Numerous events documented via the CR database are attributed to inadequate Pre-job Briefs (‘PJB’). Inadequate PJB is an industry-wide problem: and it affects both A and B Stations. III.1.4. SUMMARY OF THE CORRECTIVE ACTION PLAN
Corrective actions taken to prevent recurrence include the following:
• Prepare and deliver Human Performance training program for Operations workers and supervisors at A Station with a particular emphasis on the Pre-job Briefing. This addresses Root Cause 1 and Contributing Causes 1, 2, and 5.
Action: SECTIONHEAD, TCD: 15 January 2010;
• Complete XX-PROCS-00011 process with the individuals involved in the
event; XX-PROCS-00011 process has been initiated to re-affirm that compliance with standards is mandatory.
Action: DEPTHEAD, Completed.
III.2. PROBLEM STATEMENT
On March 3rd, 2009 during the removal of Work Permit 50438 in Unit 3 for 3-75120-RV142, a partial loss of instrument air occurred that resulted in a Level 2 Impairment of Negative Pressure Containment (NPC) due to closure of 3-3831-DP43 and DP44. In addition instrument air was inadvertently isolated to various loads. This event was reportable to Regulatory Authority.

147
III.3. INVESTIGATION SCOPE
Conduct a thorough review of the root and contributing causes that resulted in the loss of instrument air event, including a review of the Operations Standards implementation process and substandard human performance. Programmatic weaknesses and organizational failures will be addressed and corrective actions will be recommended that, when implemented, will prevent recurrence. III.4. DETAILED DISCUSSION OF FACTS
FIG. 48. Air receiver and valves involved in the event.
V306
V307

148
FIG. 49. Flow sheet depicting instrument air receiver and associated valves.
During the Unit 3 permit removal for 3-75120-RV142 a partial loss of instrument air occurred as a result of human performance error when instrument air was inadvertently isolated to various loads. 3-75120-V305 was closed to allow re-pressurization of receiver 3-75120-RC5 via 3-75120-V306, which was partially opened. 3-75120-V307 was prematurely closed, prior to re-opening V305. With V305 and V307 closed, instrument air was isolated to the loads downstream of receiver RC5. Event review revealed that a one minute and 27 seconds Level 2 impairment of the Negative Pressure Containment (NPC) resulted due to a closure of Vault Vapour Recovery System dampers 3-38310-DP43 and DP44. The dampers were closed as a result of the isolation of the air supply when V307 was closed. The impairment was terminated by manual intervention of Unit 0 CRO who boxed-up the containment in Unit 3 as per the alarm response manual. III.4.1. EVENT TIMELINE
March 1st, 2008
09:30 NPO (Nuclear Plant Operator) orders caution tag removal and permit removal. NPO gives the package, including Caution Tag removal Tag Out (order to operate) and Work Protection Permit removal Tag Out, to the NLO (Non-licensed Operator) asking him to deliver the package to the Unit 3 UTL (Union Team Leader). NPO does not specify which Tag Out should be executed first. NPO includes caution note in the package to open 3-7512 V306 slowly.
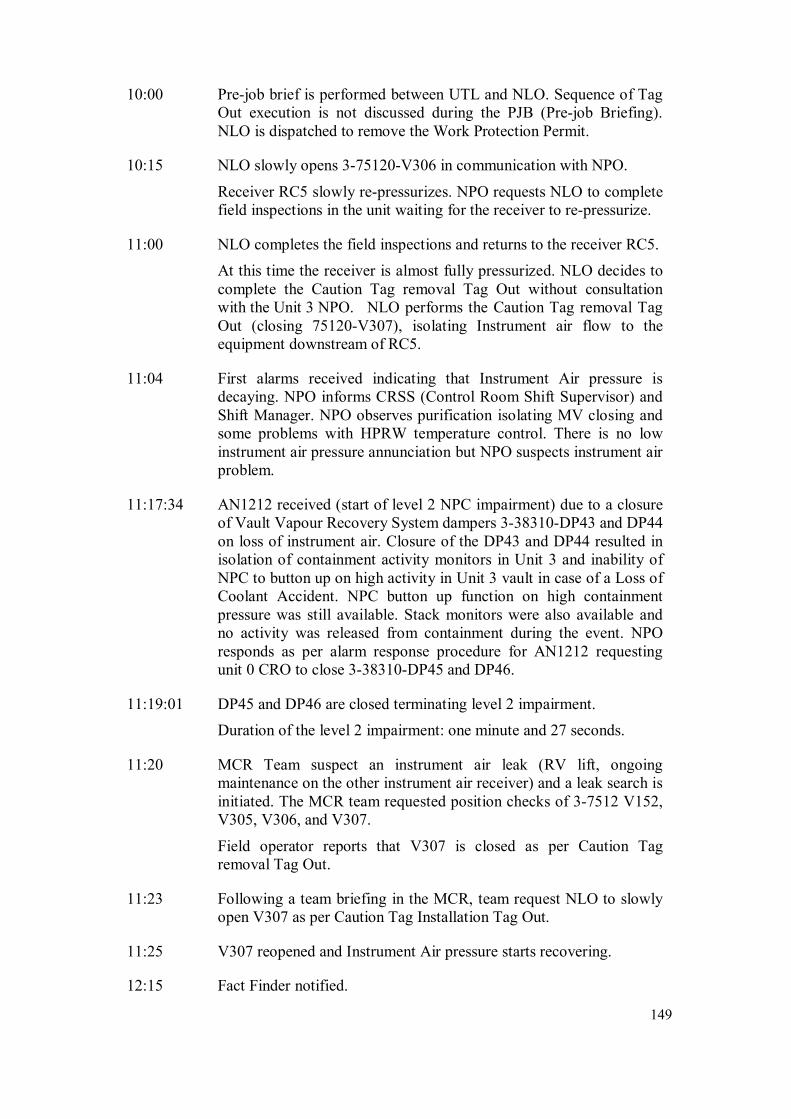
149
10:00 Pre-job brief is performed between UTL and NLO. Sequence of Tag Out execution is not discussed during the PJB (Pre-job Briefing). NLO is dispatched to remove the Work Protection Permit.
10:15 NLO slowly opens 3-75120-V306 in communication with NPO.
Receiver RC5 slowly re-pressurizes. NPO requests NLO to complete field inspections in the unit waiting for the receiver to re-pressurize.
11:00 NLO completes the field inspections and returns to the receiver RC5.
At this time the receiver is almost fully pressurized. NLO decides to complete the Caution Tag removal Tag Out without consultation with the Unit 3 NPO. NLO performs the Caution Tag removal Tag Out (closing 75120-V307), isolating Instrument air flow to the equipment downstream of RC5.
11:04 First alarms received indicating that Instrument Air pressure is decaying. NPO informs CRSS (Control Room Shift Supervisor) and Shift Manager. NPO observes purification isolating MV closing and some problems with HPRW temperature control. There is no low instrument air pressure annunciation but NPO suspects instrument air problem.
11:17:34 AN1212 received (start of level 2 NPC impairment) due to a closure of Vault Vapour Recovery System dampers 3-38310-DP43 and DP44 on loss of instrument air. Closure of the DP43 and DP44 resulted in isolation of containment activity monitors in Unit 3 and inability of NPC to button up on high activity in Unit 3 vault in case of a Loss of Coolant Accident. NPC button up function on high containment pressure was still available. Stack monitors were also available and no activity was released from containment during the event. NPO responds as per alarm response procedure for AN1212 requesting unit 0 CRO to close 3-38310-DP45 and DP46.
11:19:01 DP45 and DP46 are closed terminating level 2 impairment.
Duration of the level 2 impairment: one minute and 27 seconds.
11:20 MCR Team suspect an instrument air leak (RV lift, ongoing maintenance on the other instrument air receiver) and a leak search is initiated. The MCR team requested position checks of 3-7512 V152, V305, V306, and V307.
Field operator reports that V307 is closed as per Caution Tag removal Tag Out.
11:23 Following a team briefing in the MCR, team request NLO to slowly open V307 as per Caution Tag Installation Tag Out.
11:25 V307 reopened and Instrument Air pressure starts recovering.
12:15 Fact Finder notified.

150
III.4.2. NON-COMPLIANCE OF OPERATIONS STAFF WITH OPERATOR
FUNDAMENTALS
Operations standards are documented in OPS-PROC-000XX procedure. The latest revision (rev 4) of OPS-PROC-000XX was issued in February 2009. There two main reasons why sometimes Operators do not follow all standards as prescribed in OPS-PROC-000XX: Lack of familiarity with the standard - One of contributing factors to partial loss of instrument air in Unit 3 was action of NLO, who closed instrument air receiver bypass valve without consultation with NPO. The bypass valve was the first (and only) device on the Caution Tag Out. OPS-PROC-000XX requires the Operator to notify the MCR before manipulating the first device in a procedure or on a Tag Out. After the event we surveyed field operators and control room staff on the crew with respect to the knowledge of the standard requiring MCR notification when the first step in a procedure is executed. We found that a large number of operators did not know this specific standard. OPS-PROC-000XX section 4.33 ‘Plant Status Control’ specifies that all manipulations shall be directed by approved procedures. Checklists used for Work Protection may be used without additional approval provided the manipulations do not cause an operating change i.e.
• Energize or de-energize equipment; • Change parameter values within a system, such as pressure, temperature, flow,
level; • Cause a device to move; • Changes in magnitude of a system or equipment hazard.
If Operational steps are included in the Checklist, then additional approvals are required, depending on the type of system involved (per the table in OPS-PROC-000XX section 4.33). Crew supervision were not effective in ensuring that standards are followed - SM, CRSS and FSOS did not reinforce standards by observing staff performing work and coaching staff to make sure the Standards are known and followed. III.4.3. REVIEW OF COMPANY PRE-JOB BRIEFING (PJB) STANDARD
FOROPERATIONS IN COMPARISON WITH RECOMMENDED BEST INDUSTRY
PRACTICE
Company Pre-Job Briefing standards for Operations are defined in two documents: OPS-PROC-000XX and AD-PROC-00617. During the investigation the standards described in OPS-PROC-000XX and XX-PROCS-00617 were reviewed against INPO and WANO recommendations. Specifically two INPO documents were reviewed for comparison:

151
• INPO 07-006 Human Performance Tools for Managers and Supervisors • INPO 06-002 Human Performance Tools for Workers
The review demonstrated that Company standards of when and how to perform Pre-Job Briefing match the recommendations presented in the INPO documents. Until recently there was no formal classroom training programme for workers and supervisors on how to use and enforce usage of the Human Performance (HU) tools. Formal HU training programs are being presently prepared and delivered for various groups on site to improve understanding and usage of the HU tools. The training has already been delivered to the Maintenance staff at Station A; sessions are planned for Maintenance at Station B and for Operations at both stations. The branch of HU tools associated with the Pre-Job Briefings requires particular attention due to many events caused by inadequate PJBs. III.4.4. UTILIZATION OF WORK PROTECTION
The standard defined in OPS-PROC-000XX section 4.34 ‘Work Protection’ states the preferred method to remove equipment from service is to use approved operating procedures to shutdown energized equipment and remove residual system energy. It is acceptable to use a Clearance Order Checklist to achieve the desired state. Once the system is in shutdown state, positioning of the devices to establish the boundary of isolation shall be performed using the associated Clearance Order Checklist. While reviewing OPS-PROC-000XX a lack of clarification was discovered in section 4.34 ‘Work Protection’ with respect to the Clearance Order removal. OPS-PROC-000XX does not explicitly specify if Clearance Order Final Clear Checklist can be used to return equipment to service. Since approved operating procedures receive more rigorous review, using operating procedures is a preferred method of returning equipment back to service. OPS-PROC-000XX section 4.33 ‘Plant Status Control’ states that all equipment manipulations shall be directed by approved procedures. Checklists used for Work Protection may be used without additional approval provided the manipulations do not cause an operating change i.e.
• Energize or de-energize equipment; • Change parameter values within a system, such as pressure, temperature, flow,
level; • Cause a device to move; • Changes in the magnitude of a system or equipment hazard.
OPS-PROC-000XX allows using a Clearance Order Checklist to remove equipment from service and return to service with NPO, CRSS and SM review (and Duty Manager approval if required) in absence of approved operating procedures. The process of Clearance Order Checklist review by authorized staff is a relatively new process. During the root cause investigation, staff from both Station A and B

152
were interviewed with respect to the implementation of this process. Based on the interviews it appears that this process has been effectively implemented at Station B where almost all Work Protection Tag Outs (Clearance Order Checklists) receive the required certified staff review. A gap has been identified at Station A where a significant number of Work Protection Tag Outs (Clearance Order Checklists) do not receive the required certified staff review as specified in OPS-PROC-000XX. The Work Protection Tag Outs are work protection documents so non-work protection reviews cannot be documented on the Tag Outs. Station B follows a process of recording the certified staff review of the Tag Outs in the NPO logs. Station A is presently adopting the Station B process of recording the certified staff review in the NPO logs. III.4.5. OPERATIONS WORK PLANNING PROCESS
The procedure for taking instrument air receivers out of service and returning them to service was not available when the Unit 3 partial loss of instrument air event occurred, although the task to work on the instrument air receiver was put on the plan a few months before the event. Since the work protection Tag Out was not adequate to take equipment out of service and to return equipment to service, a separate activity from work protection application and removal was required to take equipment out of service and return to service but only tasks for permit application and removal were scheduled on the plan. Operator Task Planners (Assessors) are required to specify the procedure needed to execute the activity and if a procedure does not exist, they are to have one produced prior to the T-5 walk down. This was not done prior to this event but is now being done more consistently, with the assessors generating a DCR to have the procedures generated. Note that OPS-PROC-000XX still allows the use of an Operational Checklist with the appropriate approvals if an applicable procedure is not available. III.5. OPERATING EXPERIENCE REVIEW
III.5.1. SITE
A search of Company CRs was performed for events that can be attributed to using work protection Tag Out rather than operating procedures. Some of the CRs found are listed below:
Y-1998-02079 U5 Registered Valve in wrong position causes boilers to flood with lake water;
Y-1998-03654 U8 Moderator Spill;
Y-1998-03776 U6 Instrument Air transient- nearly a Unit step back;
Y-2001-01192 U7 D2O in H2O monitors damaged by steam;
Y-2003-01776 U6 Class 3 supply transformer loss of protection;

153
Y-2004-00670 U0B impairment of EFADS during 0-34310-MV1 actuator overhaul;
Y-2008-02934 U0A FIRE IN STATION Alarmed During 4-5323-T2 Deluge Isolation;
Y-2008-13460 U4 Loss of Instrument Air;
Y-2009-00143 Y1B Spill of Sodium Hypochlorite;
Y-2009-23309 U4 Liquid Zone Control spent IX column placed in service.
The Company SER database has been searched for events associated with inadequate pre-job briefing. A very large number of events attributed to missed or insufficient PJBs were found. A few of these CRs are listed below:
Y-2009-07117 YB FH New fuel bundle dropped in loading trough;
Y-2009-08852 YB Station - Maintenance Compliance to PJB Procedure Requires Improvement;
Y-2009-10722 U5 Improper Work Protection application;
Y-2007-13727 YA U0 Finger Cut;
Y-2008-17160 U3 Worker taking oil samples without proper PPE;
Y-2008-20377 U3 Valve 3-33350-V14 jammed open.
The partial loss of instrument air in Unit 3 was a repeat event. A very similar event occurred at Station B in 1998, when a Field Operator was returning 75120-RC4 to service. The bypass valve (75120-V312) was closed before the receiver was up to pressure. This resulted in a low-pressure transient to a section of the instrument air distribution system. The apparent causes were also similar to the event under investigation in 2009; Tag Outs were used to remove and replace equipment from and to service instead of using the operating manual procedure. PJB was insufficient for the work to be performed. The corrective action included one item that stated “Need to reinforce the use of pre-job briefings and operational Tag Outs with all crews”. Station B event was documented in CR Y-1998-03776. III.5.2. INDUSTRY
INPO and WANO SOERs associated with the Instrument Air problems have been reviewed. INPO SOER 88-1 ‘Instrument Air System Failure’ which summarized various instrument air failures was reviewed. The failures described in the SOER were associated with equipment failures or instrument air purity. The Station A event was related to human performance rather than equipment problems so this SOER is not applicable to the Station A event.

154
INPO and WANO SOERs associated with incorrect valve manipulation have been reviewed, specifically INPO SOER 85-2 ‘Valve Mispositioning Events Involving Human Error’. Analysis in this SOER listed the following factor (among others) contributing to human errors:
• Incomplete task-specific procedures and detailed steps for restoration (this condition applies to the Consolidated A event).
SOER 85-2 provided the following recommendation (9):
• Procedure involving the manipulation of valves should clearly provide sufficient detail for accomplishing task being performed.
Benchmarking Trip to a Nuclear Station with a recognized high safety record. In 2008 the C Crew of Station A performed a benchmarking trip to a NPP with a recognized well-organized approach to PJBs. They include information required for PJB in the work packages. In addition they have a PJB database allowing reuse of the PJB information the next time the same task is performed. III.6. EXTENT OF CONDITION
Pre-WANO assessment at Station B demonstrated that non-compliance with Operations standards described in this report applies to both Station A and B. It is not limited to instrument air systems. Inadequate Pre-Job Briefing is a site and industry wide problem. III.7. EXTENT OF CAUSE
The extent of cause is applicable to Station A only. Station B already had a procedure for removing instrument air receivers from service and returning them back to service. Station A procedure was developed after the event. III.8. EVALUATION
III.8.1. SIGNIFICANCE OF EVENT OR CONDITION
• No impact on Radiological Safety; • No Impact on Industrial Safety; • No Impact on Environmental Safety; • Nuclear Safety:
o Event caused a Level 2 Impairment of NPC. Containment automatic box-up logic on high containment activity was impaired for approximately one minute and 30 seconds.
III.8.2. METHODS USED TO COLLECT DATA
Interviews with operating and support staff, review of procedures used during the event, DCC alarm summaries, review or Company Power procedures.

155
III.8.3. ROOT CAUSE ANALYSIS TECHNIQUES
Event and causal factor charting and comparative task analysis. III.8.4. CONCLUSIONS(S)
Root and Contributing Causes
Root Cause - Standards as defined in AD-PROC—00XXX and OPS-PROC-000XX were not followed. In the actions leading to the event, in several steps, the Operating staff did not follow the requirements of XX-PROCS-00617 and OPS-PROC-000XX:
1. Work Protection Tag Out and Caution Tag Out were not reviewed by CRSS and SM as required in OPS-PROC-000XX section 4.33 ‘Plant Status Control’.
As a result of changes to OPS-PROC-000XX it is now a requirement for the certified staff to review Clearance Order Checklists (Work Protection Tag Outs) if operational steps are included. The level of review and approval is based on the type of system being isolated. Work protection Tag Out was not adequate to return equipment to service and should not have been used as a procedure. Because the standard requiring Tag Out review by CRSS and SM was not followed both CRSS and SM were unaware of the deviation and did not have the opportunity to stop the job and initiate development of a proper procedure that would ensure the correct sequence of device manipulation.
2. NLO did not notify Main Control Room prior to closing receiver bypass
valve 3-75120-V307.
OPS-PROC-000XX section 4.17 states that field operators (NLOs) are required to notify control room (NPO) just prior to operating the first device on a Clearance Order Checklist (Tag Out). The instrument air receiver bypass valve 75120-V307, that was closed resulting in partial loss of instrument air, was the first device on the Caution Tag Out. If the NLO had contacted the NPO prior to the V307 operation it would have allowed the NPO to review the correctness of the action and stop it. It would also have allowed the NPO to mitigate the consequences of the event if the action was performed.
Contributing Cause 1 – Acceptance of low standards. Several actions leading to the event demonstrated acceptance of low standards by individuals involved:
• NPO ordered Caution Tag Out and Work Protection Removal Tag Out at the same time. Work Protection Tag Out should have been ordered first and after its completion Caution Tag removal should have been ordered;

156
• When NPO sent out the package for execution, he did not have a face-to-face discussion with the UTL.
Contributing Cause 2 – Lack of Questioning Attitude and Situational Awareness. The NLO closed instrument air receiver bypass valve without referring to the flow sheet and without understanding the consequences of his actions. The NLO was only required manipulate four valves and the part of the system that the operator was working on was not complicated. A flow sheet review would have allowed the operator to understand the functionality of the bypass valve. The NLO followed procedure without trying to understand the steps in the procedure. The NLO did stop and ask for the sequence of procedure execution. The NLO did not adhere to the ‘Reactor Safety’ Operator Fundamental that requires operators to understand the consequences of their actions. Contributing Cause 3 – NPO giving instructions directly to NLO bypassing UTL and FSOS. NLOs do not report to the NPO. They should be getting their instructions from UTL and FSOS who are responsible for NLO safety and performance. Both NLO and FSOS can provide valuable input and bypassing them eliminates additional defence-in-depth barrier. Contributing Cause 4 – Unclear expectations with respect to planning of Operations activities and insufficient Operations involvement in the planning process. The loss of instrument air event in Unit 3 would have been avoided if Operators had an approved operating procedure to return the air receiver back to service and if the task on the plan for work protection removal (which would only require lifting of the work protection tags) was separate from the task to return the air receiver to service. 75120-RC5 work was scheduled on the plan without a task for Operations to take the receiver out of service and to return it to service following the maintenance. The only task identified was the one for permit application and removal. Contributing Cause 5 - Inadequate Pre-Job Briefing (PJB). There was no PJB between the Unit NPO and Union Team Leader (UTL) to discuss the requirements for the return to service of the air receiver. The PJB between UTL and NLO did not discuss the execution sequence of the Tag Outs, nor did it address the five basic PJB questions (specifically ‘what’s the worst that could happen’). Contributing Cause 6 – Standard of Work Protection Tag Out review by certified staff not fully implemented at Station A.

157
As a result of changes to OPS-PROC-000XX (section 4.33 ‘Plan Status Control’) it is now a requirement for certified staff to review Work Protection Clearance Order Checklists (Work Protection Tag Outs) if they include operational steps. Since Station A has relatively few procedures for removing equipment from service, most Clearance Order checklists are required to include these steps and to have some level of review by certified staff. Human Performance
NPO performance below standard defined in
• OPS-PROC-000XX Section 4.25 (Pre-job brief); • OPS-PROC-000XX Section 4.29 (Communication); • OPS-PROC-000XX Section 4.32 (Conservative decision making).
UTL performance below standard defined in
• OPS-PROC-000XX Section 4.25 (Pre-job brief); • OPS-PROC-000XX Section 4.32 (Conservative decision making); • XX-PROCS-00617 Section 4.2 (Situational awareness).
NLO performance below standard defined in
• OPS-PROC-000XX Section 4.9 (Control manipulation); • XX-PROCS-00617 Section 4.2 (Situational awareness).
Training
The investigation revealed training deficiencies in the following areas:
• General HU Training at all Company Stations; • Pre-Job Brief Training for supervisory staff; • Lack of knowledge of rules prescribed in OPS-PROC-0038 and XX-PROCS-
00617; • Lack of effective implementation plans for revising procedures such as the
OPS-PROC-000XX to ensure that the required training is delivered. III.8.5. ENHANCEMENT OPPORTUNITIES
A caution notice stating “Caution, Low Pressure can cause Steam Drum Low
Level Step Back. See Note 1.234567-FS-2” has been attached to the pipework adjacent to the Air Receiver. A label with text: “Caution. Closing this valve with receiver isolated will result in
loss of instrument air” will be installed next to all instrument air receiver bypass valves.

158
FIG. 50. Caution notice.
III.9. CORRECTIVE ACTION PLAN
III.9.1. INTERIM ACTIONS
1. NPO removed from Issuing Authority function until remediation.
2. UTL removed from UTL and EA role function until remediation.
3. NLO removed from EA function until remediation.
4. Initiated disciplinary process per XX-PROCS-00X11 for NPO, UTL and
NLO.
5. Created an approved procedure for removing/returning instrument air
receivers from/to service.
6. Notified all Shift Managers and Control Room Shift Supervisors about non-
compliance with OPS-PROC-000XX section 4.33 ‘Plant Status Control’ at
Station A. Added non-compliance discussion to Station A Shift Manager
weekly call agenda to make all Shift Managers aware of the issue.
III.9.2. COMPLETED CORRECTIVE ACTIONS
1. Remediation completed for NPO, UTL and NLO that consisted of review of:
• OPS-PROC-000XX;
• XX-PROCS-00617;
• YB-WPP-00001;
• YB-WPP-00002.
2. Procedure created for removing from service and returning to service of
instrument air receivers at Station A.

159
3. After the Shift Manager weekly call, a compliance process with OPS-PROC-
000XX section 4.33 ‘Plant Status Control’ was initiated.
III.9.3. CORRECTIVE ACTIONS TO PREVENT RECURRENCE (CAPRS)
1. Prepare and deliver Human Performance training program for Operations workers and supervisors at Station A with a particular emphasis on the Pre-job Briefing. This addresses Root Cause 1 and Contributing Causes 1, 2, and 5. Action: SECBASU, TCD: 15 January 2010.
2. Complete XX-PROCS-00411 process with the individuals involved in the event
XX-PROCS-00411 process has been initiated to re-affirm that compliance with standards is mandatory. Action: DEPTHEADSOAC, Completed.
III.9.4. CORRECTIVE ACTIONS
1. Define standards and recommend necessary procedural changes to increase Operations input into the Inage task planning and address Operations needs in the work planning process. This addresses Contributing Cause 4. Action: DEPTHEADOCP, TCD: 15 January 2010.
2. Perform comprehensive review of Operations staff training (both initial and refresher) in the area of Operations standards defined in OPS-PROC-000XX and XX-PROCS-00617; and develop required improvement plan. This addresses Contributing Causes 1, 2, 5 and 6 Action: DEPTHEADCRT, TCD: 30 November 2009.
3. Develop OPS-PROC-000XX rollout plan for Station A. This addresses Contributing Causes 1, 2, 5 and 6 Action: DIVISIONMGR,TCD: 30 November 2009.
4. FSOS and CRSS Review CR X-2008-03307 with the Operating Crews at Station A. This addresses Contributing Causes 3 and 5. Review CR X-2008-03307 with the operating crews at Station A. Each crew FSOS is to review the CR with the field operators, and each crew CRSS is to review the CR with MCR staff. During the review focus on:
• Standard defined in OPS-PROC-000XX section 4.17 requiring notification of Main Control Room staff when manipulating field devices.

160
Discuss how this standard was not followed during the event and how the event could have been avoided if the standard had been followed;
• Standards of Pre-Job Briefing defined in XX-PROCS-00617 section 4.2.4
and how these standards have not been followed during the event (between NPO and UTL, and between UTL and NLO). Discuss how the event could have been avoided if the standards had been followed.
Action:
DEPTHEADSOAA TCD: 31 October 2009
DEPTHEADSOAB TCD: 31 October 2009
DEPTHEADSOAC TCD: 31 October 2009
DEPTHEADSOAD TCD: 31 October 2009
DEPTHEADSOAE TCD: 31 October 2009.
5. Distribute ‘Lessons Learned’ in this event to site organization.
Action: AT-OPEX, TCD: 15 September 2009
6. Each crew management team to perform five Observations and Coaching (using checklists) on pre-job briefing. This addresses Contributing Cause 5.
Action:
DEPTHEADSOAA TCD: 31 October 2009
DEPTHEADSOAB TCD: 31 October 2009
DEPTHEADSOAC TCD: 31 October 2009
DEPTHEADSOAD TCD: 31 October 2009
DEPTHEADSOAE TCD: 31 October 2009
SECBAAX TCD: 31 October 2009
SECBAOS TCD: 31 October 2009.
III.9.5. EFFECTIVENESS REVIEW PLAN
1. Complete Effectiveness Review of CAPR 1 (Prepare and deliver Human Performance Operations training program for workers and supervisors) to determine if the actions were effective. Effectiveness of CAPR 1 will be measured as minimum 95% of Operations staff receiving formal training in the Human Performance area. Individuals will receive formal re-testing after 1 year to confirm compliance. Action: DEPTHEADSOAC, TCD 15 April 2010.
2. Complete Effectiveness Review of CAPR 2 (Complete XX-PROCS-00411
process with the individuals involved in the event) to determine whether the action was effective.

161
Per CARB recommendation, the effectiveness of CAPR 2 will be determined by verifying that the discussion of the event and follow up actions is adequately documented in the appropriate personnel files of the individuals involved. Action:
DEPTHEADSOAC, TCD 15 September 2009.
III.9.6. ENHANCEMENT ACTIONS
Refer to section III.8.5.
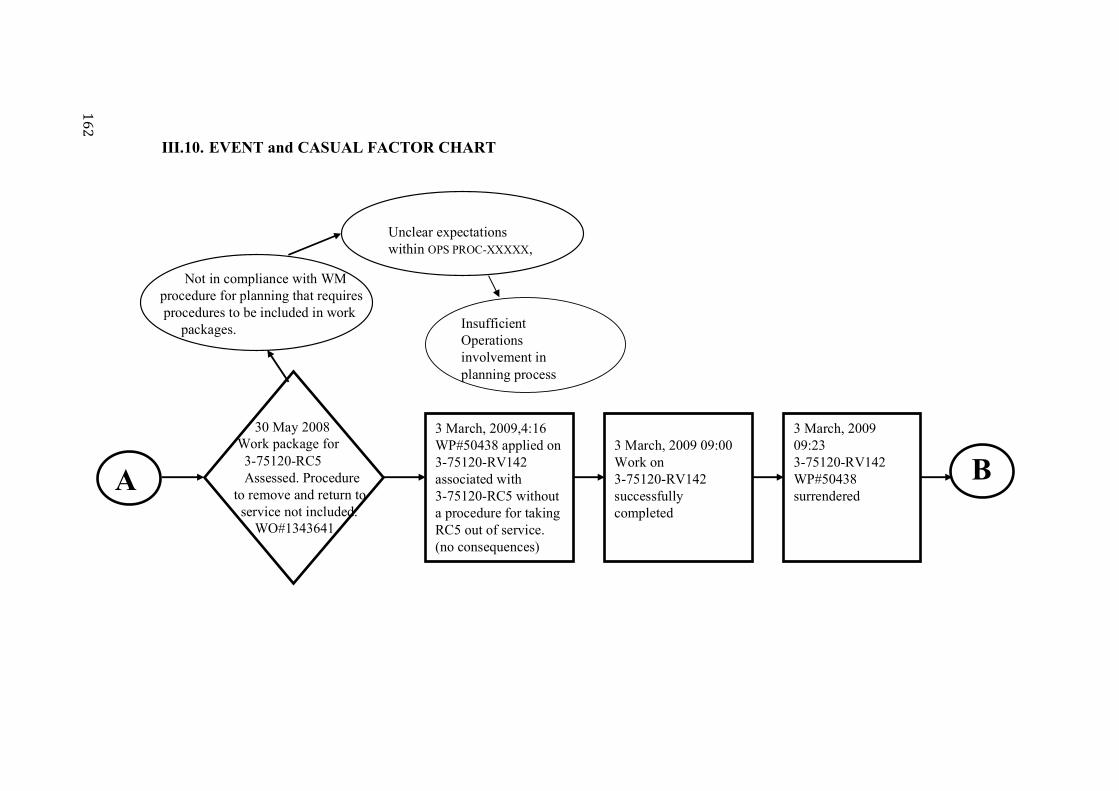
16
2
III.10. EVENT and CASUAL FACTOR CHART
3 March, 2009 09:233-75120-RV142 WP#50438 surrendered
BA
3 March, 2009,4:16WP#50438 applied on 3-75120-RV142 associated with 3-75120-RC5 without a procedure for taking RC5 out of service. (no consequences)
30 May 2008 Work package for3-75120-RC5Assessed. Procedure
to remove and return toservice not included.
WO#1343641
3 March, 2009 09:00Work on 3-75120-RV142 successfully completed
Not in compliance with WM procedure for planning that requires procedures to be included in work
packages.
Unclear expectationswithin OPS PROC-XXXXX,
Insufficient Operations involvement in planning process

16
3
3 March, 2009 09:30
NPO orders Caution tag and Work Permit
Removals.Sequence not
specified.
3 March, 2009 09:30
NPO gives the NLO the C/T and WP Tagout package to deliver to UTL. No PJB between NPO
and UTL
3 March, 2009 09:30NPO includes caution note in the package to open V306 slowly
B
3 March, 2009 10:00
PJB performed between UTL and NLO. Sequence of CTR and WP Tagoutexecution is not discussed during
PJB.
C
WP and CT tagouts are not discussed between NPO and UTL.No discussion about the sequence of Tag out executions. 5 basic
questions of PJB not asked.
RC#1 Standards as defined in AD-PROC-00XXXand OPS
PROC-XXXXX not followed.
RC#1 Standards as defined in AD-PROC-00XXXand OPS
PROC-XXXXX not followed.
WP and CT Tagout not reviewed by SM/CRSS as per OPS PROC-XXXXX
Accepting low standards
NPO gives work direction to NLO bypassing FSOS / UTL.
WP and CT OTOs are not discussed between UTL and NLONo discussion about the sequence of tagout executions. 5 basic questions of PJB notasked. Flowsheet not reviewed.OPEX not used.

16
4
3 March, 2009 10:00
UTL cautions NLO to open V306 very slowly and in communications with NPO
3 March, 2009 10:15NLO slowly opens V306 while in communications with the NPO as per WP removal OTO.
3 March, 2009 10:15While RC5 slowly repressurizes, NPO suggests NLO to complete OFIs in the Unit
C
3 March, 2009 11:00NLO completes OFIs and returns to RC5. At this time RC5 is almost fully pressurized
D

16
5
RC#1 Standards as defined in BP-PROC-00617 and GRP-OPS-00038 not followed.
RC#1 Standards as defined in BP-PROC-00617 and GRP-OPS-00038 not followed.
3 March, 2009 11:00
NLO completes caution tag removal Tagoutwithout consultation with ANO by closing
V307
3 March, 2009 11:04
First alarm indicating that I/A pressure is decaying. NPO informs CRSS and SM
3 March, 2009 11:04ANO observes moderator purification isolating MV closing and some problems with HPRW temperature control
D
3 March, 2009 11:17:34
AN1212 received(start of Level 2 NPC impairment) due to the closure of 38310-DP43 and 44 on loss of instrument air
E
Information provided in PJB not sufficient
Lack of questioning attitude and situational awarenessPerforming action withoutprocedure and inadequate
verbal instructionsProcedure not available
Did not stop to develop and approve procedure
Procedure not provided in work package
NLO did not notify MCR prior operating first device on CT OTO

16
6
3 March, 2009 11:19:01
DP45 and DP46 are closed as per ARM page by U0 CRO terminating Level 2 impairment. MCR Team suspect I/A leak and leak search is initiated.
3 March, 2009 11:20
MCR Team request position check of V152, V305, V306, V307 and RV142. NLO reports that V307 is closed as per Caution Tag removal OTO.
3 March, 2009 11:25
MCR team requests NLO to slowly open V307. V307 reopened and Instrument air pressure starts to recover.
E
3 March, 2009 11:23
Team Brief Performed and decision to slowly reopen V307 made
3 Mar,0912:15
Event terminated, CR B-2008-03307 filed and fact finder notified. Investigation team set up and started on

167
III.11. COMPARATIVE TASK ANALYSIS
DATE/TIME What Happened? What Should Have Happened?
Result of the Difference
Significance of the Difference
30 May 2008
Work package for
3-75120-RC5 Assessed. Procedure to remove and return to service not included.
WO#1343641
Procedure should have been specified in the Work Package, hold for procedure put in Passport, DCR submitted.
Procedure was not available for taking equipment out of service to return to service
Significant increase of human performance error during task execution.
Operator performed the task in knowledge mode and made a mistake
3 March, 2009
04:16
WP 50438 applied on
3-75120-RV142 associated with
3-75120-RC5 without a procedure for taking out of service. (no operating consequences)
Operators should have stopped, challenged performing the task without a procedure, developed a procedure, had it reviewed and approved.
Task was executed without proper operating procedure.
Increased risk of error, although task performed successfully.
Accepting low standards. Non-compliance with OPS-PROC-000XX.
3 March, 2009
09:00
WP 50438 Work on
3-75120-RV142 successfully performed
No delta No delta No delta
3 March, 2009
09:23
WP 50438 surrendered on
3-75120-RV142 associated with
3-75120-RC5
No delta No delta No delta
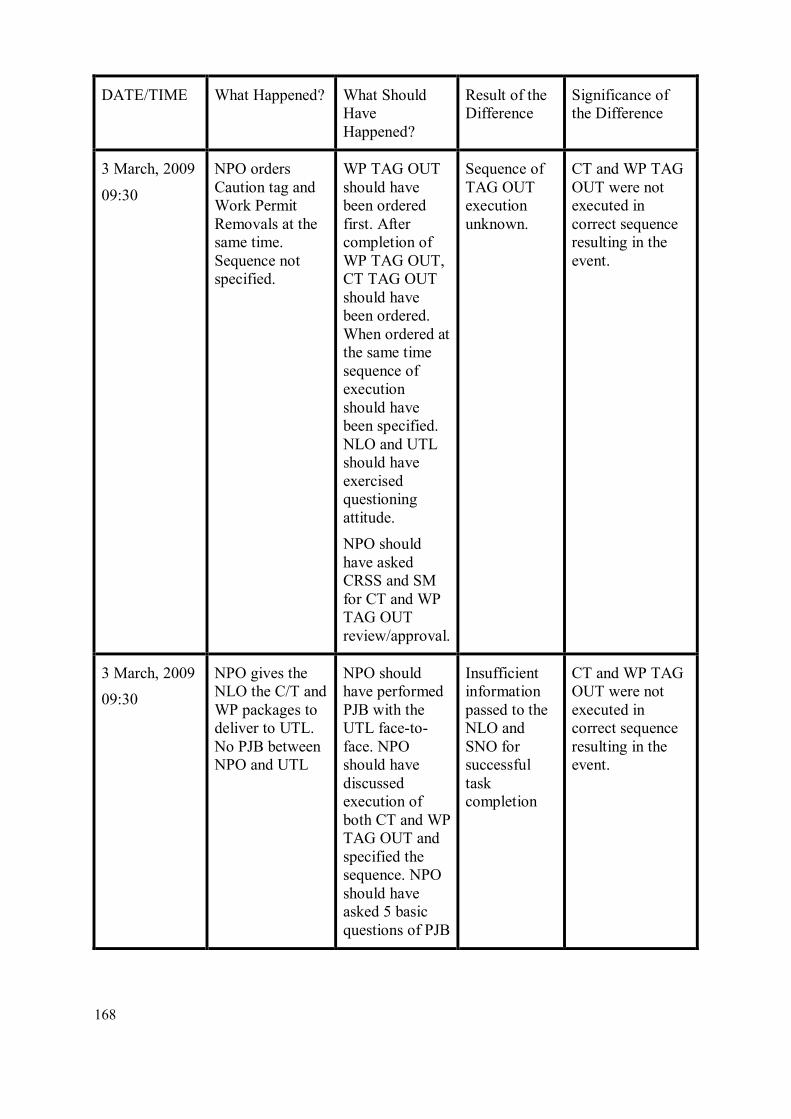
168
DATE/TIME What Happened? What Should Have Happened?
Result of the Difference
Significance of the Difference
3 March, 2009
09:30
NPO orders Caution tag and Work Permit Removals at the same time. Sequence not specified.
WP TAG OUT should have been ordered first. After completion of WP TAG OUT, CT TAG OUT should have been ordered. When ordered at the same time sequence of execution should have been specified. NLO and UTL should have exercised questioning attitude.
NPO should have asked CRSS and SM for CT and WP TAG OUT review/approval.
Sequence of TAG OUT execution unknown.
CT and WP TAG OUT were not executed in correct sequence resulting in the event.
3 March, 2009
09:30
NPO gives the NLO the C/T and WP packages to deliver to UTL. No PJB between NPO and UTL
NPO should have performed PJB with the UTL face-to-face. NPO should have discussed execution of both CT and WP TAG OUT and specified the sequence. NPO should have asked 5 basic questions of PJB
Insufficient information passed to the NLO and SNO for successful task completion
CT and WP TAG OUT were not executed in correct sequence resulting in the event.

169
DATE/TIME What Happened? What Should Have Happened?
Result of the Difference
Significance of the Difference
3 March, 2009
09:30
NPO includes caution note in the package to open V306 slowly
No delta No delta No delta
3 March, 2009
10:00
PJB performed between UTL and NLO. Sequence of CTR and WP TAG OUT execution is not discussed during PJB
UTL should have reviewed flow sheet and OPEX with NLO during PJB.
UTL should have discussed execution of both CT and WP TAG OUT and specified the sequence. UTL should have asked 5 basic questions of PJB. NLO should have challenged performing task without an Operating Procedure.
NLO did not have sufficient information to successfully complete the task
NLO closed V307 at a wrong time resulting in the event
3 March, 2009
10:00
UTL cautions NLO to open V306 very slowly and in communications with NPO
No delta No delta No delta

170
DATE/TIME What Happened? What Should Have Happened?
Result of the Difference
Significance of the Difference
3 March, 2009
10:15
NLO slowly opens V306 while in communications with the NPO as per WP removal TAG OUT.
No delta No delta No delta
3 March, 2009
10:15
While RC5 slowly repressurizes, NPO suggests NLO to complete OFIs in the Unit
No delta No delta No delta
3 March, 2009
11:00
NLO completes
OFIs and returns to RC5. At this time RC5 is almost fully pressurized
No delta No delta No delta
3 March, 2009
11:00
NLO completes caution tag removal TAG OUT without consultation with NPO by closing V307.
NLO should have exercised questioning attitude. NLO should have had full understanding of the actions performed. NLO should have informed NPO prior manipulation of V307.
NLO closed V307 at a wrong time resulting in the partial loss of Instrument Air.
NLO closed V307 at a wrong time resulting in the partial loss of Instrument Air and Level 2 Impairment of NPC for 1 min 30 sec.

171
DATE/TIME What Happened? What Should Have Happened?
Result of the Difference
Significance of the Difference
3 March, 2009
11:04
First alarm indicating that I/A pressure is decaying. NPO informs CRSS and SM
No delta No delta No delta
3 March, 2009
11:04
NPO observes moderator purification isolating MV closing and some problems with HPRW temperature control
No delta No delta No delta
3 March, 2009
11:17:34
AN1212 received
(start of Level 2 NPC impairment) due to the closure of 38310-DP43 and 44 on loss of instrument air
No delta No delta No delta
3 March, 2009
11:19:01
DP45 and DP46 are closed as per ARM page by U0 CRO terminating Level 2 impairment. MCR Team suspect I/A leak and leak search is initiated
No delta No delta No delta

172
DATE/TIME What Happened? What Should Have Happened?
Result of the Difference
Significance of the Difference
3 March, 2009
11:20
MCR Team requests position check of V152, V305, V306, V307 and RV142. NLO reports that V307 is closed as per Caution Tag removal TAG OUT.
No delta No delta No delta
3 March, 2009
11:23
Team Brief Performed and decision to slowly reopen V307 made
No delta No delta No delta
3 March, 2009
11:25
MCR team requests NLO to slowly open V307. V307 reopened and Instrument air pressure starts to recover.
No delta No delta No delta
3 March, 2009
12:15
Event terminated, CR X-2008-03307 filed and fact finder notified. Investigation team set up and started.
No delta No delta No delta

173
CONTRIBUTORS TO DRAFTING AND REVIEW
Caldoro, M . International Atomic Energy Agency
Drangeid, S. O. Acona Wellpro AS, Norway
Fotedar, S. K. International Atomic Energy Agency
Kearney, M. International Atomic Energy Agency
Kubota, R. Japan Nuclear Energy Safety Organization (JNES), Japan
Nichols, R. Consultant, United Kingdom
Noel, M. JRC Institute for Energy, European Commission
Murray, P. Peak Performance Through Innovative Solutions (PPTIS), USA
Stanislovas, Z. Joint Research Centre (JRC) Institute for Energy, European Commission
Volkov, E. Obninsk Scientific Centre Prognoz, Russian Federation
CONSULTANTS’ MEETINGS
Vienna, Austria: 14 – 18 June 2010; 13 – 17 December 2010; 15 – 19 August 2011.


175
ACKNOWLEDGEMENT
IAEA is extremely grateful to following organisations for giving permissions to include their
event analysis methods / related information in a CD-ROM that accompanies this TECDOC.
• Noordwijk Risk Initiative Foundation, Netherlands
• Central Research Institute of Electric Power Industry (CRIEPI), Japan
• Tokyo Electric Power Company (TEPCO), Japan
• Japan Nuclear Energy Safety Organization (JNES)*
• US Nuclear Regulatory Commission (USNRC)
• Scientific Research Centre ‘Prognoz’, Russian Federation
• PAKS Nuclear Power Plant, Hungary & ENCONET Consulting GmbH, Austria.
• MTO Safety GmbH, Berlin ,Germany
• Stichting Tripod Foundation, United Kingdom
*JNES ceased to exist in March 2014 as a result of integration into Nuclear Regulation Authority
(NRA), Japan


@ No. 23
ORDERING LOCALLYIn the following countries, IAEA priced publications may be purchased from the sources listed below or from major local booksellers.
Orders for unpriced publications should be made directly to the IAEA. The contact details are given at the end of this list.
AUSTRALIADA Information Services648 Whitehorse Road, Mitcham, VIC 3132, AUSTRALIA Telephone: +61 3 9210 7777 Fax: +61 3 9210 7788 Email: [email protected] Web site: http://www.dadirect.com.au
BELGIUMJean de LannoyAvenue du Roi 202, 1190 Brussels, BELGIUM Telephone: +32 2 5384 308 Fax: +32 2 5380 841 Email: [email protected] Web site: http://www.jean-de-lannoy.be
CANADARenouf Publishing Co. Ltd.5369 Canotek Road, Ottawa, ON K1J 9J3, CANADA Telephone: +1 613 745 2665 Fax: +1 643 745 7660 Email: [email protected] Web site: http://www.renoufbooks.com
Bernan Associates4501 Forbes Blvd., Suite 200, Lanham, MD 20706-4391, USA Telephone: +1 800 865 3457 Fax: +1 800 865 3450 Email: [email protected] Web site: http://www.bernan.com
CZECH REPUBLICSuweco CZ, spol. S.r.o.Klecakova 347, 180 21 Prague 9, CZECH REPUBLIC Telephone: +420 242 459 202 Fax: +420 242 459 203 Email: [email protected] Web site: http://www.suweco.cz
FINLANDAkateeminen KirjakauppaPO Box 128 (Keskuskatu 1), 00101 Helsinki, FINLAND Telephone: +358 9 121 41 Fax: +358 9 121 4450 Email: [email protected] Web site: http://www.akateeminen.com
FRANCEForm-Edit5 rue Janssen, PO Box 25, 75921 Paris CEDEX, FRANCE Telephone: +33 1 42 01 49 49 Fax: +33 1 42 01 90 90 Email: [email protected] Web site: http://www.formedit.fr
Lavoisier SAS14 rue de Provigny, 94236 Cachan CEDEX, FRANCE Telephone: +33 1 47 40 67 00 Fax: +33 1 47 40 67 02 Email: [email protected] Web site: http://www.lavoisier.fr
L’Appel du livre99 rue de Charonne, 75011 Paris, FRANCE Telephone: +33 1 43 07 50 80 Fax: +33 1 43 07 50 80 Email: [email protected] Web site: http://www.appeldulivre.fr
GERMANYGoethe Buchhandlung Teubig GmbHSchweitzer Fachinformationen Willstätterstrasse 15, 40549 Düsseldorf, GERMANY Telephone: +49 (0) 211 49 8740 Fax: +49 (0) 211 49 87428 Email: [email protected] Web site: http://www.goethebuch.de
HUNGARYLibrotade Ltd., Book ImportPF 126, 1656 Budapest, HUNGARY Telephone: +36 1 257 7777 Fax: +36 1 257 7472 Email: [email protected] Web site: http://www.librotade.hu

INDIAAllied Publishers1st Floor, Dubash House, 15, J.N. Heredi Marg, Ballard Estate, Mumbai 400001, INDIA Telephone: +91 22 2261 7926/27 Fax: +91 22 2261 7928 Email: [email protected] Web site: http://www.alliedpublishers.com
Bookwell3/79 Nirankari, Delhi 110009, INDIA Telephone: +91 11 2760 1283/4536 Email: [email protected] Web site: http://www.bookwellindia.com
ITALYLibreria Scientifica “AEIOU”Via Vincenzo Maria Coronelli 6, 20146 Milan, ITALY Telephone: +39 02 48 95 45 52 Fax: +39 02 48 95 45 48 Email: [email protected] Web site: http://www.libreriaaeiou.eu
JAPANMaruzen Co., Ltd.1-9-18 Kaigan, Minato-ku, Tokyo 105-0022, JAPAN Telephone: +81 3 6367 6047 Fax: +81 3 6367 6160 Email: [email protected] Web site: http://maruzen.co.jp
NETHERLANDSMartinus Nijhoff InternationalKoraalrood 50, Postbus 1853, 2700 CZ Zoetermeer, NETHERLANDS Telephone: +31 793 684 400 Fax: +31 793 615 698 Email: [email protected] Web site: http://www.nijhoff.nl
Swets Information Services Ltd.PO Box 26, 2300 AA LeidenDellaertweg 9b, 2316 WZ Leiden, NETHERLANDS Telephone: +31 88 4679 387 Fax: +31 88 4679 388 Email: [email protected] Web site: http://www.swets.com
SLOVENIACankarjeva Zalozba ddKopitarjeva 2, 1515 Ljubljana, SLOVENIA Telephone: +386 1 432 31 44 Fax: +386 1 230 14 35 Email: [email protected] Web site: http://www.mladinska.com/cankarjeva_zalozba
SPAINDiaz de Santos, S.A.Librerias Bookshop Departamento de pedidos Calle Albasanz 2, esquina Hermanos Garcia Noblejas 21, 28037 Madrid, SPAIN Telephone: +34 917 43 48 90 Fax: +34 917 43 4023 Email: [email protected] Web site: http://www.diazdesantos.es
UNITED KINGDOMThe Stationery Office Ltd. (TSO)PO Box 29, Norwich, Norfolk, NR3 1PD, UNITED KINGDOM Telephone: +44 870 600 5552 Email (orders): [email protected] (enquiries): [email protected] Web site: http://www.tso.co.uk
UNITED STATES OF AMERICABernan Associates4501 Forbes Blvd., Suite 200, Lanham, MD 20706-4391, USA Telephone: +1 800 865 3457 Fax: +1 800 865 3450 Email: [email protected] Web site: http://www.bernan.com
Renouf Publishing Co. Ltd.812 Proctor Avenue, Ogdensburg, NY 13669, USA Telephone: +1 888 551 7470 Fax: +1 888 551 7471 Email: [email protected] Web site: http://www.renoufbooks.com
United Nations300 East 42nd Street, IN-919J, New York, NY 1001, USA Telephone: +1 212 963 8302 Fax: 1 212 963 3489 Email: [email protected] Web site: http://www.unp.un.org
Orders for both priced and unpriced publications may be addressed directly to:IAEA Publishing Section, Marketing and Sales Unit, International Atomic Energy Agency Vienna International Centre, PO Box 100, 1400 Vienna, Austria Telephone: +43 1 2600 22529 or 22488 • Fax: +43 1 2600 29302 Email: [email protected] • Web site: http://www.iaea.org/books


14-47351

IAEA SAFETY STANDARDS AND RELATED PUBLICATIONS
IAEA SAFETY STANDARDS
Under the terms of Article III of its Statute, the IAEA is authorized to establish or adopt standards of safety for protection of health and minimization of danger to life and property, and to provide for the application of these standards.
The publications by means of which the IAEA establishes standards are issued in the IAEA Safety Standards Series. This series covers nuclear safety, radiation safety, transport safety and waste safety. The publication categories in the series are Safety Fundamentals,Safety Requirements and Safety Guides.
Information on the IAEAs safety standards programme is available at the IAEA Internet site
http://www-ns.iaea.org/standards/
The site provides the texts in English of published and draft safety standards. The texts of safety standards issued in Arabic, Chinese, French, Russian and Spanish, the IAEA Safety Glossary and a status report for safety standards under development are also available. For further information, please contact the IAEA at PO Box 100, 1400 Vienna, Austria.
All users of IAEA safety standards are invited to inform the IAEA of experience in their use (e.g. as a basis for national regulations, for safety reviews and for training courses) for the purpose of ensuring that they continue to meet users needs. Information may be provided via the IAEA Internet site or by post, as above, or by email to [email protected].
RELATED PUBLICATIONS
The IAEA provides for the application of the standards and, under the terms of Articles III and VIII.C of its Statute, makes available and fosters the exchange of information relating to peaceful nuclear activities and serves as an intermediary among its Member States for this purpose.
Reports on safety and protection in nuclear activities are issued as Safety Reports, which provide practical examples and detailed methods that can be used in support of the safety standards.
Other safety related IAEA publications are issued as Radiological Assessment Reports, the International Nuclear Safety Groups INSAG Reports, Technical Reports and TECDOCs. The IAEA also issues reports on radiological accidents, training manuals and practical manuals, and other special safety related publications.
Security related publications are issued in the IAEA Nuclear Security Series.The IAEA Nuclear Energy Series consists of reports designed to encourage and assist
research on, and development and practical application of, nuclear energy for peaceful uses. The information is presented in guides, reports on the status of technology and advances, and best practices for peaceful uses of nuclear energy. The series complements the IAEAs safety standards, and provides detailed guidance, experience, good practices and examples in the areas of nuclear power, the nuclear fuel cycle, radioactive waste management and decommissioning.

International Atomic Energy AgencyVienna
ISBN 978–92–0–110014–6ISSN 1011–4289
Root Cause Analysis Following an Event at a N
uclear Installation: Reference Manual
IAEA-TECDOC-1756
Root Cause AnalysisFollowing an Event at a Nuclear Installation:Reference Manual
@
IAEA-TECDOC-1756
IAEA-TECDOC-1756
IAEA TECDOC SERIES