Embed Size (px)
Citation preview

ANCHOR BOLT BEHAVIOR IN ASR/DEF-DAMAGED DRILLED SHAFTS
by
Sungjin Bae, Oguzhan Bayrak, James O. Jirsa, and Richard E. Klingner
Technical Report: IAC 88-5DDIA004
ANCHOR BOLT BEHAVIOR IN ASR/DEF-DAMAGED DRILLED SHAFTS
conducted for the
Texas Department of Transportation
by
THE UNIVERSITY OF TEXAS AT AUSTIN
February 2007

Investigation performed in cooperation with the Texas Department of Transportation.
ACKNOWLENDMENTS We greatly appreciate the financial support from the Texas Department of Transportation that made this project possible. The support of the project monitoring committee, Randy Cox, Timothy E. Bradberry, Scott Walton, Jim Yang, John Vogel and Dingyi Yang, is also very much appreciated.
DISCLAIMER The contents of this report reflect the views of the authors, who are responsible for the facts and the accuracy of the data presented herein. The contents do not necessarily reflect the view of the Federal Highway Administration or the Texas Department of Transportation. This report does not constitute a standard, specification, or regulation.
NOT INTENDED FOR CONSTRUCTION,
PERMIT, OR BIDDING PURPOSES
ii

TABLE OF CONTENTS
LIST OF FIGURES.................................................................................................................................................. VI
LIST OF TABLES.................................................................................................................................................... IX
CHAPTER 1: INTRODUCTION...............................................................................................................................1
1.1 BACKGROUND ............................................................................................................................... 1 1.2 HMIP FOUNDATIONS .................................................................................................................... 1
1.3 FIELD EVALUATION OF PERFORMANCE ........................................................................................ 4
1.4 OBJECTIVE AND SCOPE ................................................................................................................. 5
CHAPTER 2: LITERATURE REVIEW ..................................................................................................................6
2.1 INTRODUCTION.............................................................................................................................. 6 2.2 PREMATURE CONCRETE DETERIORATION DUE TO ALKALI-SILICA REACTION (ASR) AND
DELAYED ETTRINGITE FORMATION (DEF) .................................................................................. 6 2.2.1 Alkali-Silica Reaction (ASR) (Klingner et al. 2000)............................................................................6 2.2.2 Delayed Ettringite Formation (DEF) (Merrill 1997) ..........................................................................6 2.2.3 Effect of ASR/DEF...............................................................................................................................7
2.3 PREVIOUS RESEARCH ON DEEP ANCHOR BOLTS USED IN DRILLED SHAFTS................................ 8 2.3.1 Research by Hasselwander, Jirsa and Breen (1974)...........................................................................8 2.3.2 Research by Calzadilla (1982) ............................................................................................................8 2.3.3 Research by Jirsa, Cichy, Calzadilla, Smart, Pavluvcik, and Breen (1984) .......................................9 2.3.4 ACI 318-05 APPENDIX D ..................................................................................................................9
2.4 TXDOT DESIGN DETAILS FOR HMIP FOUNDATIONS ................................................................. 10 2.5 DESIGN REQUIREMENTS FOR ANCHOR BOLTS USED IN HMIP FOUNDATIONS........................... 16
2.5.1 AASHTO Specifications (2001) .........................................................................................................16 2.5.2 TxDOT Bridge Design Manual (2001)..............................................................................................16
2.6 WIND-INDUCED LOADS............................................................................................................... 16
CHAPTER 3: EXPERIMENTAL PROGRAM......................................................................................................18
3.1 INTRODUCTION............................................................................................................................ 18 3.2 MATERIAL PROPERTIES............................................................................................................... 20
3.2.1 Newly Constructed, Undamaged Control Specimens ........................................................................20 3.2.2 ASR/DEF-Damaged Specimens Constructed in 1989 .......................................................................21
3.3 TEST SETUP ................................................................................................................................. 26 3.4 INSTRUMENTATION ..................................................................................................................... 29
iii

3.5 TEST PROCEDURE........................................................................................................................ 31 3.3 CONVERSION OF TEST DATA....................................................................................................... 33
3.3.1 Moment-Rotation Relationship..........................................................................................................33 3.3.2 Anchor Bolt Stress-Rotation Relationship .........................................................................................33
CHAPTER 4: TEST RESULTS ...............................................................................................................................36
4.1 INTRODUCTION............................................................................................................................ 36 4.2 CONTROL SPECIMENS (S16-CONTROL AND S20-CONTROL) ...................................................... 36 4.3 ASR/DEF-DAMAGED SPECIMENS (S16-ASR1 AND S20-ASR).................................................. 44 4.4 ASR/DEF-DAMAGED SPECIMEN UNDER MONOTONIC LOAD (S16-ASR2)................................ 50 4.5 CFRP-REPAIRED SPECIMEN (S20-CFRP)................................................................................... 53
CHAPTER 5: EVALUATION OF TEST RESULTS.............................................................................................61
5.1 INTRODUCTION............................................................................................................................ 61 5.2 COMPARISON OF ANCHOR BOLT STRESS VERSUS ROTATION RELATIONSHIPS .......................... 61 5.3 MODES OF FAILURE OF ANCHOR BOLTS..................................................................................... 64 5.4 DESIGN IMPLICATIONS OF OBSERVED BEHAVIOR OF DEEP ANCHOR BOLTS IN HMIP
SHAFTS........................................................................................................................................ 67 5.4.1 Design Implications for Tension-Loaded Anchors ............................................................................67 5.4.2 Design Implications for Compression-Loaded Anchors....................................................................68
5.5 CONCLUDING REMARKS REGARDING TEST RESULTS................................................................. 69
CHAPTER 6: DESIGN PROVISIONS FOR DEEP ANCHOR BOLTS..............................................................70
6.1 INTRODUCTION............................................................................................................................ 70 6.2 TXDOT BRIDGE DESIGN MANUAL (2001).................................................................................. 70 6.3 ACI 318-05 APPENDIX D ............................................................................................................ 72 6.4 PROPOSED MODIFICATION TO SIDE-FACE BLOWOUT PROVISIONS OF ACI 318-05 FOR
DRILLED SHAFT .......................................................................................................................... 73 6.5 CONCLUDING REMARKS REGARDING ANCHOR-DESIGN PROVISIONS......................................... 74
CHAPTER 7: CALCULATION OF DESIGN WIND LOADS FOR HMIPS......................................................75
7.1 INTRODUCTION............................................................................................................................ 75 7.2 CALCULATION OF DESIGN WIND LOADS BY THE AASHTO SPECIFICATIONS (2001) ................ 75
7.2.1 Wind Pressure Equation of the AASHTO Specifications (2001) .......................................................75 7.2.2 Gust Effect Factor (G) in the AASHTO Specifications (2001) ..........................................................75 7.2.3 Drag Coefficient (Cd) in the AASHTO Specifications (2001)............................................................76
iv
7.2.4 Design Wind Loads by the AASHTO Specifications (2001) ..............................................................76 7.3 CALCULATION OF DESIGN WIND LOADS BY ASCE 7-05............................................................ 76
7.3.1 Wind Pressure Equation of ASCE 7-05.............................................................................................76 7.3.2 Design Wind Loads by ASCE 7-05 ....................................................................................................77 7.3.3 Gust Effect Factor (G) by ASCE 7-05 ...............................................................................................77
7.4 COMPARISON OF DESIGN WIND LOADS FROM AASHTO SPECIFICATIONS (2001), ASCE 7-95 AND ASCE 7-05 ..................................................................................................................... 79 7.4.1 Comparison of Estimates of Equivalent Viscous Damping Ratios ....................................................79 7.4.2 Comparison of Design Base Moments from Wind by Different Design Standards ...........................80
CHAPTER 8: SUMMARY, CONCLUSIONS AND RECOMMENDATIONS...................................................82
8.1 SUMMARY ................................................................................................................................... 82 8.2 CONCLUSIONS ............................................................................................................................. 82 8.3 RECOMMENDATIONS................................................................................................................... 82
8.4 FUTURE INVESTIGATIONS........................................................................................................... 83
APPENDIX A: CALCULATION OF WIND LOAD: EXAMPLE .......................................................................84
A.1 INTRODUCTION............................................................................................................................ 84 A.2 WIND PROVISIONS OF AASHTO SPECIFICATIONS (2001) .......................................................... 84 A.3 WIND-INDUCED MOMENT FOR 150-FT, 8-SIDED HMIP FOUNDATION........................ 85
REFERENCES .........................................................................................................................................................87
v

LIST OF FIGURES
Figure 1.1 HMIP Foundations in Texas ....................................................................................................................1 Figure 1.2 Failure of HMIPs and their Foundations (courtesy of Florida DOT).......................................................2 Figure 1.3 ASR/DEF Damage in Drilled Shafts........................................................................................................3
Figure 1.4 HMIP Foundations In Texas ....................................................................................................................4 Figure 1.5 Locations of Tested Drilled Shafts in Houston ........................................................................................4 Figure 2.1 Effect of ASR on Strengths of Concrete Specimens (Clayton et al. 1990) ..............................................7 Figure 2.2 Conditions around Anchorage after Formation of Concrete Cone (Hasselwander et al. 1974) ...............8 Figure 2.3 Standard Design Detail for HMIP Foundation (1986) ...........................................................................11 Figure 2.4 Standard Design Detail for HMIP Foundation (1998) ...........................................................................12 Figure 2.5 Standard Design Detail for HMIP (1998) ..............................................................................................14 Figure 2.6 Wind-Induced Loads on HMIP Foundation ...........................................................................................17 Figure 3.1 Texas HMIP Foundation Design Details................................................................................................19 Figure 3.2 Templates in HMIP Foundation.............................................................................................................20 Figure 3.3 HMIP Foundation with Premature Concrete Cracking ..........................................................................21 Figure 3.4 Typical Results of Uranyl Acetate Fluorescent Method (UAFM) .........................................................22 Figure 3.5 Stress-Strain Curves for Anchor Bolts ...................................................................................................24 Figure 3.6 Area used to Record Damage Index for ASR/DEF-Damaged Specimens .............................................25 Figure 3.7 Test Setup...............................................................................................................................................27 Figure 3.8 Connection of 6 Extreme Anchor Bolts to Base Plate............................................................................29 Figure 3.9 Locations of Inclinometers and Linear Potentiometers ..........................................................................30 Figure 3.10 Locations of CRFP Laminates and Strain Gauges for Specimen S20-CFRP.........................................31 Figure 3.11 Typical Loading History for Five of Six Specimens..............................................................................32 Figure 3.12 Loading History for CFRP-repaired Specimen (S16-ASR2) .................................................................32 Figure 3.13 Free-Body Diagram of Test Setup showing Equilibrium of Anchor Forces ..........................................34 Figure 4.1 Misalignment of Anchor Bolts in Specimen S16-Control......................................................................37 Figure 4.2 Damage Sequence for Specimen S16-Control .......................................................................................38 Figure 4.3 Damage Sequence for Specimen S20-Control .......................................................................................39 Figure 4.4 Progression of Damage ..........................................................................................................................39 Figure 4.5 Failure of Control Specimens.................................................................................................................40 Figure 4.6 Moment-Rotation Response of Specimen S16-Control .........................................................................41 Figure 4.7 Moment-Rotation Response of Specimen S20-Control .........................................................................41 Figure 4.8 Anchor Bolt Stress-Rotation Response of Specimen S16-Control.........................................................42 Figure 4.9 Relationship of Anchor Bolt Stresses, f1 and f2 ......................................................................................43 Figure 4.10 Anchor Bolt Stress-Rotation Response of Specimen S20-Control.........................................................43
vi

Figure 4.11 ASR/DEF-Damaged Specimens ............................................................................................................44 Figure 4.12 Damage Sequence for Specimen S16-ASR1..........................................................................................45 Figure 4.13 Damage Sequence for Specimen S20-ASR............................................................................................45 Figure 4.14 Moment-Rotation Response of Specimen S16-ASR1............................................................................46 Figure 4.15 Moment-Rotation Response of Specimen S20-ASR..............................................................................46 Figure 4.16 Anchor Bolt Stress-Rotation Response of Specimen S16-ASR1 ...........................................................47 Figure 4.17 Anchor Bolt Stress-Rotation Response of Specimen S20-ASR.............................................................47 Figure 4.18 Failure of Specimen S16-ASR1 .............................................................................................................48 Figure 4.19 Failure of Specimen S20-ASR ...............................................................................................................49 Figure 4.20 Damage Sequence for Specimen S16-ASR2 (Loading Phase I) ............................................................51 Figure 4.21 Stripping of Anchor Bolt Threads in Specimen S16-ASR2 (Loading Phase II) ....................................51 Figure 4.22 Moment-Rotation Response of Specimen S16-ASR2............................................................................52 Figure 4.23 Anchor Bolt Stress-Rotation Response of Specimen S16-ASR2 ...........................................................52 Figure 4.24 Damage Sequence for Specimen S20-CFRP..........................................................................................54 Figure 4.25 Moment-Rotation Response of Specimen S20-CFRP............................................................................55 Figure 4.26 Compression Bearing Failure of Specimen S20-CFRP..........................................................................55 Figure 4.27 Anchor Bolt Stress-Rotation Response of Specimen S20-CFRP...........................................................56 Figure 4.28 Strain Distribution in CFRP under Positive Moment.............................................................................57 Figure 4.29 Strain Distribution in CFRP under Negative Moment ...........................................................................58 Figure 4.30 Moment-Strain Relationship for CFRP Gauges B4 and F4 ...................................................................59 Figure 4.31 Moment-Strain Relationship for CFRP Gauges B5 and F5 ...................................................................59 Figure 4.32 Strain versus Maximum Moment for CFRP Gauge F4 ..........................................................................60 Figure 4.33 Strain versus Maximum Moment for CFRP Gauge F5 ..........................................................................60 Figure 5.1 Anchor Bolt Stress-Rotation Responses: 16-Anchor Bolt Specimens ...................................................62 Figure 5.2 Anchor Bolt Stress-Rotation Responses: 20-Anchor Bolt Specimens ...................................................62 Figure 5.3 Anchor Bolt Stress-Rotation Responses for Design Concrete Strength ( fc′ = 3,600 psi): 16-Anchor
Bolt Specimens ......................................................................................................................................63 Figure 5.4 Anchor Bolt Stress-Rotation Responses for Design Concrete Strength ( fc′ = 3,600 psi): 20-Anchor
Bolt Specimens ......................................................................................................................................63 Figure 5.5 Concrete Side-Face Blowout Failure .....................................................................................................65 Figure 5.6 Tensile Failure of Anchor Bolt...............................................................................................................65 Figure 5.7 Contact of Nuts with Top Surface of Drilled Shaft ................................................................................66 Figure 5.8 Compressive Failure of Anchor Bolt......................................................................................................66 Figure 5.9 Load Transfer Mechanisms....................................................................................................................68 Figure 5.10 Double Nuts ...........................................................................................................................................68 Figure 6.1 Possible Ways of Computing Effective Bearing Area for Design Purposes ..........................................71 Figure 6.2 Proposed Modified Definition of ca2 ......................................................................................................73
vii

Figure 7.1 Damping Ratios of HMIP (Connor and Hodgson 2006)........................................................................79 Figure 7.2 Wind-Induced Design Base Moments for 150-ft, 8-Sided HMIP (ASCE 7) .........................................80 Figure 7.3 Wind-Induced Design Base Moments for 175-ft, 8-Sided HMIP (ASCE 7) .........................................81
viii

LIST OF TABLES
Table 2.1 Wind-Induced Design Loads for 8-sided HMIP Foundations at Design Wind Speed (3-second gust) of 130 mph (AASHTO 2001).....................................................................................................................17
Table 6.1 Comparison of Observed and Predicted Tensile Capacities using Eq. (6.1) ..........................................71 Table 6.2 Comparison of Observed and Predicted Tensile Capacities as Governed by Side-Face Blowout (ACI
318-05, Appendix D) .............................................................................................................................72 Table 6.3 Comparison of Observed and Predicted Tensile Capacities using Proposed Modification to the
Definition of c in ACI 318-05 Appendix Da2 .........................................................................................74 Table 7.1 Wind-Induced Design Base Moment for HMIP Foundation: AASHTO Specifications (2001).............80
ix

SUMMARY
The primary objective of this research is to evaluate the effect of Alkali-Silica Reaction (ASR) and Delayed Ettringite Formation (DEF) on the structural performance of High Mast Illumination Pole (HMIP) foundations and if needed, to recommend a possible retrofitting method to strengthen them and prevent further damage.
To achieve this goal, six full-scale field tests were conducted in the Houston area. Two types of drilled shafts were examined: 16-anchor drilled shafts supporting 150-ft high HMIPs; and 20-anchor drilled shafts supporting 175-ft high HMIPs. One of the 20-anchor drilled shafts was repaired by wrapping with Carbon Fiber-Reinforced Polymer (CFRP) laminate. Observed performance under field tests was also evaluated in the context of the design wind loads of the AASHTO Specifications (2001) and ASCE 7-05 (2005). Failure modes and the related load-transfer mechanisms were investigated and some design recommendations were suggested for better design of drilled shafts.
x

CHAPTER 1: INTRODUCTION
1.1 BACKGROUND High Mast Illumination Poles (HMIPs) are commonly used in many states of the US to illuminate large areas such as plazas, parking lots, stadiums and expressway toll-gates. The height of these HMIPs (from 100 to 175 ft) permits the use of fewer poles and more uniform illumination.
The Texas Department of Transportation (TxDOT) was one of the first state transportation agencies to use HIMPs. HMIPs with heights of 150 ft were erected in Dallas in the 1970s, followed by many more elsewhere in the state. Previous TxDOT-sponsored studies (Hasselwander et al. 1974; Calzadilla 1982; Jirsa et al. 1984) investigated the behavior of single and group anchor bolts used for HMIP foundations, and found that clear cover and bearing area were the major variables influencing the strength of such anchor bolts. A recent study (Lawrence et al. 1999) reveals that many HMIP foundations constructed by TxDOT near Houston in the late 1980’s had developed premature concrete deterioration due to a combination of alkali-silica reaction (ASR) and delayed ettringite formation (DEF). Little research has been conducted on the effects of such deterioration on the behavior of anchor bolts. In this study, the behavior of anchor bolts in concrete drilled shafts with ASR/DEF damage is evaluated.
1.2 HMIP FOUNDATIONS Because of their height, HMIP structures are very flexible laterally, and are susceptible to loads from wind and traffic. The photographs in Figure 1.1 show typical deflected shapes of HMIPs under strong winds.
Figure 1.1 HMIPs under Wind Loading (courtesy of Florida DOT)
1

Many failures of HMIP structures have been reported in recent years, and subsequent investigations have revealed the following problems for HMIPs and their foundations (Wood and Starnater 2005):
(1) fatigue-prone details; (2) insufficient tensioning of anchor bolts; and (3) premature concrete deterioration of drilled shafts.
Figure 1.2 shows examples of HMIP/Foundation failures. The primary cause of these failures was hurricane level wind loads. A significant number of drilled shafts constructed in the late 1980’s are now exhibiting concrete deterioration due to ASR/DEF (Figure 1.3). Such deterioration causes severe cracks in drilled shafts. At first glance, such cracks would be expected to significantly decrease the capacity of the anchor bolts.
Figure 1.2 Failure of HMIPs and their Foundations (courtesy of Florida DOT)
2

Figure 1.3 ASR/DEF Damage in Drilled Shafts
Consider the design equation proposed by Jirsa et al. (1984) for the tensile capacity of deep anchors in drilled shafts:
2140 0.7 lnn b c s smw
CT A f K AD D
⎡ ⎤⎛ ⎞′= + ≤⎢ ⎥⎜ ⎟−⎢ ⎥⎝ ⎠⎣ ⎦yf (lbs) Eq. (1.1)
where Tn = nominal tensile capacity of an anchor bolt Ab = net bearing area (in.2), not greater than 4D2 nor less than the projecting area of the nut. Asm = mean tensile area of anchor bolt (in.2) D = bolt diameter (in.) Dw = diameter (in.) of the washer or anchor plate, where a continuous template or anchor
plate is used for a group of anchor bolts. The washer diameter may be taken as the diameter of a circle concentric with the bolt and inscribed within the template or anchor plate. Dw shall not be taken greater than 8 times the thickness of the washer, plate or template.
C = clear cover to bolt (in.) Ks = spacing reduction factor = 0.02S+0.40 ≤ 1.0 S = center-to-center bolt spacing (in.) fc′ = concrete compressive strength (psi) fy = yield strength of the bolt material (psi)
Eq. (1.1) indicates that tensile strength of deep anchor bolts in drilled shafts are most significantly affected by concrete cover and concrete tensile strength, both of which may be adversely affected by cracking associated with ASR/DEF. The compressive capacity of deep anchors in drilled shafts was not considered in Eq. (1.1), as the gap between the HMIP and concrete foundation was grouted at that time, as shown in Figure 1.4. With the grout pad, the compression forces are transferred by the grout to the drilled shaft, and anchor bolts act as tension members only. Because the grout pads were found to trap moisture and cause corrosion in anchor bolts, however, grout pads have not been used in Texas since the 1980’s. As a result, both the tension and the compression forces generated by HMIPs have to be transferred through anchor bolts. Little research has been conducted on the compressive strength of these anchor bolts in drilled shafts without grout pads.
3

(a) HMIP Foundation in 1970’s (from Texas Highways 1970)
(b) HMIP Foundation in 1989
Grout Pad
Figure 1.4 HMIP Foundations in Texas
1.3 FIELD EVALUATION OF PERFORMANCE To evaluate the effect of ASR/DEF on the performance of drilled shafts and the behavior of anchor bolts, full-scale field tests were conducted in the Houston area, at the intersection of US 59 South and the Sam Houston Tollway (Beltway 8), as shown in Figure 1.5. Six HMIP foundations were tested. Of these, four were existing foundations with ASR/DEF damage, and two were newly constructed for test purposes and hence undamaged.
Field test locations
Figure 1.5 Locations of Tested Drilled Shafts in Houston
4

1.4 OBJECTIVE AND SCOPE The objective of this testing project is to evaluate the effect of ASR/DEF on the structural performance of HMIP foundations and if needed, to recommend a possible retrofitting method to strengthen them and prevent further damage. To achieve this goal, six full-scale field tests were conducted in the Houston area. Two types of drilled shafts were examined: 16-anchor drilled shafts supporting 150-ft high HMIPs; and 20-anchor drilled shafts supporting 175-ft high HMIPs. One of the 20-anchor drilled shafts was repaired by wrapping with carbon fiber-reinforced polymer (CFRP) laminate. Observed performance under field tests was also evaluated in the context of the design wind loads of the AASHTO Specifications (2001) and ASCE 7-05 (2005).
In Chapter 2, a review of literature related to ASR and DEF, behavior of anchor bolts, and TxDOT design details for HMIP foundations is provided. In Chapter 3, field tests on six full-scale concrete drilled shafts are described. In Chapter 4, the results of those tests are presented. In Chapter 5, the responses of tested drilled shaft specimens are compared and effects of ASR/DEF are summarized; the load-transfer mechanism between anchor bolts and the shaft is investigated; and modifications are recommended to current design provisions for such anchorages. In Chapter 6, the current design provisions of the TxDOT Bridge Design Manual (2001) and ACI 318-05 (2005) are examined. In Chapter 7, the wind-load provisions of the AASHTO Specifications (2001) and ASCE 7-05 (2005) are summarized and those wind-load provisions are compared with probable wind loads for HMIPs and hence their foundations. In Chapter 8, the work is summarized, principal conclusions are presented, and recommendations for implementation and further research are noted.
5

CHAPTER 2: LITERATURE REVIEW
2.1 INTRODUCTION In this chapter previous pertinent research is discussed and synthesized. Several background areas are of interest: the mechanisms of ASR/DEF and its associated damage in concrete structures; previous research on the behavior of deep anchor bolts in drilled shafts; and TxDOT Standard Design Details for HMIPs and their shaft foundations.
2.2 PREMATURE CONCRETE DETERIORATION DUE TO ALKALI-SILICA REACTION (ASR) AND DELAYED ETTRINGITE FORMATION (DEF)
Within the past 10 years, a variety of TxDOT structures have exhibited premature concrete damage from Alkali-Silica Reaction (ASR) or Delayed Ettringite Formation (DEF), singly or in combination. ASR was first identified as a concrete durability problem in the early 1940’s, and significant research has been conducted on it since that time. DEF was first identified as a potential problem in heat-cured concrete during the early 1980’s. It has been the subject of considerable research since then. In the first part of this literature review, the basics of each deterioration mechanism are discussed.
2.2.1 Alkali-Silica Reaction (ASR) (Boenig et al. 2002) ASR is a reaction between siliceous aggregate and high-alkali pore water in the surrounding cementitious matrix. A high alkali concentration in the pore water provides the hydroxyl ions that react with the silica to form a gel at the interface between the cementitious matrix and the aggregate. This gel grows as it absorbs water from the environment, consequently generating expansive forces that can produce map cracking or surface popouts. ASR deterioration requires the following conditions:
• high alkali concentration in the pore water; • aggregate with reactive silica; and • water.
As a result, ASR is sensitive to the specific materials used in concrete, as well as the location and condition of the concrete.
2.2.2 Delayed Ettringite Formation (DEF) (Boenig et al. 2002) Ettringite, a normal hydration product, is a reaction between sulfates, calcium aluminates and water. Primary ettringite, which forms before the concrete sets, is not deleterious. Damage is caused by DEF in the hardened concrete. Delayed ettringite forms from a reaction between decomposed primary ettringite and water, creating nests of ettringite in the paste. Research indicates that high amounts of sulfur, contributed by the clinker, may be another source of the reaction. In both cases, exposure to water over time causes the ettringite to reform, producing expansive forces. DEF, like ASR, shows as map cracking. DEF deterioration requires the following conditions:
• decomposed ettringite or high amounts of sulfur; and • water.
6

2.2.3 Effect of ASR/DEF The essential question is how to quantify the effect of ASR/DEF-related concrete deterioration for the overall structural performance. It has been frequently assumed that ASR/DEF-caused expansion is closely related to a loss of structural capacity. Even though qualitative measurement has been frequently used to evaluate the severity of concrete deterioration due to ASR/DEF, there are no quantitative guidelines. Clayton et al. (1990) conducted five different strength test methods for ASR-damaged concrete specimens, which test results are summarized in Figure 2.1, and concluded that that any strength test conducted on a specimen quantifies the performance of the material in relation to that method of test only and does not necessarily reflect the performance of the material in its structural context. It can be observed from Figure 2.1 that ASR does not produce a significant effect on compression and tensile splitting strengths of concrete specimens. This emphasizes the need to have a full-scale testing in order to evaluate the effect of ASR/DEF on structural performance.
A series of investigations were conducted at the University of Texas at Austin (Fúnez 1999; Boenig et al. 2002; Roche 2001; Memberg et al. 2002) to assess the structural performance of in-service bridges with ASR/DEF damages under the support of the Texas Department of Transportation (TxDOT Study 1857). Flexural, shear and fatigue tests on full-scale prestressed concrete box girders and strand-pullout tests on slice specimens were conducted to investigate ASR/DEF effect on the structural performance. In addition, field observations were made to monitor crack widths of five TxDOT bridge structures over three years. The following are the conclusions made from TxDOT Study 1857:
• ASR/DEF damage caused a reduction in bond strength between prestressing strands and concrete. In splice specimens taken from full-scale prestressed box girders, 40% reduction of average bond strength was observed;
• Capacity of prestressed girders with ASR/DEF damages was governed by other mechanisms than bond failure of prestressing strands. No strand bond failure was observed from full-scale prestressed box girder tests;
• Severity of cracks on outside faces was not found to be a good indicator of interior damage.
Figure 2.1 Effect of ASR on Strengths of Concrete Specimens (Clayton et al. 1990)
7

2.3 PREVIOUS RESEARCH ON DEEP ANCHOR BOLTS USED IN DRILLED SHAFTS Deep anchor bolts or threaded rods with nuts are commonly used to connect HMIPs to their reinforced concrete foundations. TxDOT has sponsored several research projects to investigate the behavior of such anchor bolts and to develop design guidelines. In this section, pertinent research related to deep anchor bolts of the type commonly used in drilled shafts is summarized. Some relevant anchor design provisions from ACI 318-05 are also noted.
2.3.1 Research by Hasselwander, Jirsa and Breen (1974) The primary objectives of research by Hasselwander, Jirsa and Breen (1974) were to evaluate the effects of bolt diameter, embedment length, clear cover, and bearing area on the behavior of high-strength anchor bolts loaded in tension. In addition, a series of exploratory tests were conducted to determine the influence of cyclic loading, lateral loading, bolt grouping, and transverse reinforcement on the bolt behavior. Anchor bolts up to 1-3/4 in. in diameter with specified yield strengths ranging from 50 to 130 ksi were tested.
This study showed that a deep anchor bolt transfers load to the concrete by a sequence of mechanisms: steel-to-concrete bond; bearing against the anchor head; and finally, wedging action by a cone of crushed and compacted concrete ahead of the anchor head. In the mechanism, shown in Figure 2.2, load is resisted by a cone of concrete wedging against the concrete cover. The test results indicated that clear cover and bearing area were the major variables influencing the tensile strength of such anchor bolts.
Results from the exploratory tests indicated that cyclic loads at or below service level did not adversely affect anchor bolt stiffness or strength. Transverse reinforcement (in the form of hairpins along the bolt in front of the anchor head) significantly increased the strength of deep anchor bolts with relatively thin cover.
Figure 2.2 Conditions around Anchorage after Formation of Concrete Cone (Hasselwander et al. 1974)
2.3.2 Research by Calzadilla (1982) Calzadilla (1982) investigated the behavior and ultimate capacity of high-strength anchor bolt groups embedded in reinforced concrete piers, with particular attention to the effect of bolt spacing on group capacity. The effect of clear cover, of variable anchorage lengths in a bolt group, and transverse reinforcement was studied but in a limited range.
Anchor bolts with 1-3/4 in. diameter and 105 ksi specified yield stress were arranged in 4-bolt groups and tested to failure in simple tension. The bolts were observed to fail in a wedge-splitting mode. The
8

response of the anchor bolts was measured in terms of bolt force versus slip curves. The group interaction was evaluated by comparing the actual strength of bolts in a group with the predicted capacity for an isolated bolt with similar geometry. The test results indicated that the ultimate capacity of bolts in a group embedded at close spacing (8.9 in. to 13.5 in.) was 30% less than that of 4 isolated anchors.
2.3.3 Research by Jirsa, Cichy, Calzadilla, Smart, Pavluvcik, and Breen (1984) Jirsa et al. (1984) evaluated the effects of bolt-group interaction by comparing the average experimentally observed capacity of deep anchor groups with the predicted capacity of isolated bolts with similar geometry. Bolts with a diameter of 1-3/4 in. and a yield stress of 105 ksi were tested. As bolt spacing decreased, the reduction in strength significantly increased. Based on the available data, Hasselwander’s equation was modified to produce an equation for the nominal tensile capacity of group anchors as governed by concrete:
u nT Tφ≤ Eq. (2.1) where Tu is the factored bolt tensile capacity, φ is a capacity reduction factor of 0.75, and Tn is the nominal tensile capacity of an anchor bolt with embedment length not less than 12(Dw−D).
The nominal tensile capacity of anchor bolt (Tn) can be calculated by:
2140 0.7 lnn b c s smw
CT A f K AD D
⎡ ⎤⎛ ⎞′= + ≤⎢ ⎥⎜ ⎟−⎢ ⎥⎝ ⎠⎣ ⎦yf (lbs) Eq. (2.2)
where Ab = net bearing area (in.2), not greater than 4D2 nor less than the projecting area of the nut. Asm = mean tensile area of anchor bolt (in.2) D = bolt diameter (in.) Dw = diameter (in.) of the washer or anchor plate, where a continuous template or anchor
plate is used for a group of anchor bolts. The washer diameter may be taken as the diameter of a circle concentric with the bolt and inscribed within the template or anchor plate. Dw shall not be taken greater than 8 times the thickness of the washer, plate or template.
C = clear cover to bolt (in.) Ks = spacing reduction factor = 0.02S+0.40 ≤ 1.0 S = center-to-center bolt spacing (in.) fc′ = concrete compressive strength (psi) fy = yield strength of the bolt material (psi)
2.3.4 ACI 318-05 APPENDIX D For anchor bolts of HMIP foundations, concrete side-face blowout under tension loading is the most likely failure mode because of long embedment length, small concrete cover, large amount of longitudinal reinforcement, spirals and large size of anchor bolts. For a single headed anchor with deep embedment close to edge (ca1 < 0.4hef), the nominal side-face blowout strength, Nsb , is expressed in ACI 318-05 Appendix D as:
1160 ′=sb a brg cN c A f Eq. (2.3) (D-17) in ACI 318-05
where: ca1 = minimum edge distance from the center of anchor bolt to the edge of concrete (in.) hef = effective embedment length of anchor bolt (in.) Abrg = bearing area of the head of stub or anchor bolt (in.2) fc′ = concrete compressive strength (psi)
The modification factor of (1+ ca2/ca1)/4 is applied if ca2 < 3ca1 , where ca2 is the distance from the center of the anchor bolt to the edge of concrete in the direction perpendicular to ca1 . For multiple anchors with ca1 < 0.4hef , the nominal side-face blowout strength of the group of anchors is calculated as:
9

10
11
6⎛ ⎞
= +⎜ ⎟⎝ ⎠
where s is spacing of the outer anchors and Nsb is obtained from Eq. (2.3) without the modification factor.
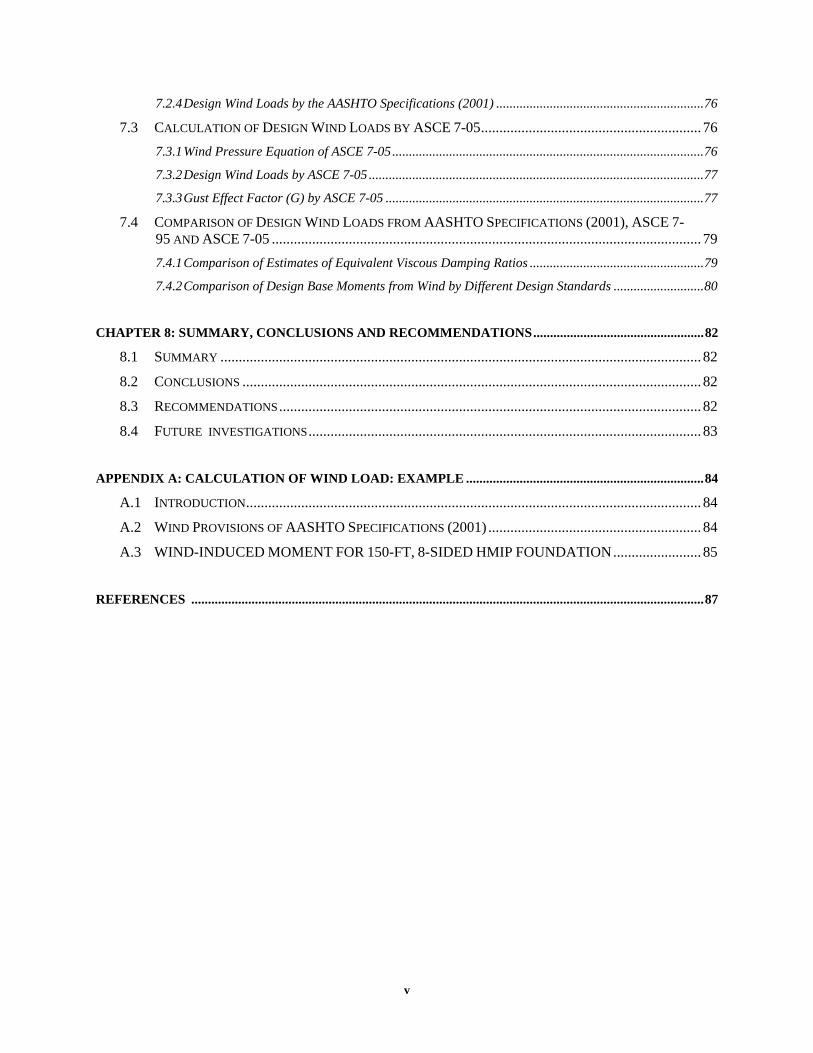
Most ASR/DEF-damaged concrete pile foundations in the Houston area were constructed in the late 1980’s in accordance with the TxDOT Standard Design Details (1986, revised 1998), shown in Figure 2.3 and Figure 2.4. The required diameter and length of the drilled shaft, the number of anchor bolts and the diameter of anchor bolt circle are based on the design wind speed and the cross-section of the HMIP. The focus of this report is to investigate the influence of ASR/DEF-related damage on the drilled-shaft foundations of HMIPs with a basic design wind speed of 100 mph and pole heights of 150 and 175 ft. The details of the anchor bolts for the drilled shafts required for these HMIP are given in the Anchor Bolt Table in Figure 2.3 and Figure 2.4.
2.4 TXDOT DESIGN DETAILS FOR HMIP FOUNDATIONS
The design wind speed used in Figure 2.3 and Figure 2.4 is the fastest-mile wind speed, which was used by the 1994 AASHTO Standard Specifications for Structural Supports for Highway Signs, Luminaires and Traffic Signals (AASHTO 1994). In the 2001 AASHTO Specifications, wind-load calculations were revised to in terms of three-second gust wind speed. According to the AASHTO design wind speed map around Houston area, the fastest-mile design wind speed of 100 mph in Figure 2.3 and Figure 2.4 is roughly equivalent to a three-second gust design wind speed of 130 mph.
Texas Cone Penetrometer Test (Tables) in Figure 2.3 and Figure 2.4 show that 60-in. diameter drilled shafts are required for both 150-ft and 175-ft HMIPs. The required shaft diameter for a 175-ft HMIP was increased to 66 in. in the 1998 TxDOT Standard Design Details (Figure 2.4). Figure 2.3 and Figure 2.4 also show that anchor bolts are required to be anchored with nuts and a template plate, intended to hold the embedded ends of the anchors in the correct position and also increase their pullout capacity. Nuts are required to be tack-welded to the template to prevent floating during concrete placement.
Even though it is not clear in the 1986 TxDOT Standard Design Details (Figure 2.3), the Anchor Bolt Table of Figure 2.4(b) illustrates that either an 8-sided or a 12-sided HMIP can be used, depending on the required number of anchor bolts and the required diameter of the anchor bolt circle. Examination of anchor-bolt details for 150- and 175-ft HMIP in the 1986 TxDOT Standard Design Details (Figure 2.3) indicates that the HMIP foundations constructed in accordance with the 1986 TxDOT Standard Design Details require the use of an 8-sided pole (Figure 2.4(b)). This observation supports the fact that 8-sided poles were mostly used for 150 ft and 175 ft HMIPs by TxDOT. The 1998 TxDOT Standard Design Details for HMIP are shown in Figure 2.5, in which required details for HMIP with heights of 150 ft and 175 ft are indicated in the gray box.
sbg sba
sN Nc
Eq. (2.4) (D-18) in ACI 318-05

11
Figure 2.3 Standard Design Detail for HMIP Foundation (1986)
11
12
Figure 2.4(a) Standard Design Detail for HMIP Foundation (1998)
12

13
Figure 2.4(b) Standard Design Detail for HMIP Foundation (1998)
13

14
Figure 2.5(a) Standard Design Detail for HMIP (1998)
14

Figure 2.5(b) Standard Design Detail for HMIP (1998)
15
15

2.5 DESIGN REQUIREMENTS FOR ANCHOR BOLTS USED IN HMIP FOUNDATIONS
The deep anchor bolts commonly used to connect an HMIP to drilled-shaft foundations may be designed by a number of different provisions. In this section, those are reviewed briefly.
2.5.1 AASHTO Specifications (2001) The AASHTO Standard Specifications for Structural Supports for Highway Signs, Luminaires, and Traffic Signals (2001) govern the structural design of HMIP foundations. Even though those requirements address the design of anchor bolts, those designs are required to meet the condition that “anchor bolts shall be embedded in concrete with sufficient cover, length, and anchorage to ensure that the anchor bolts will reach their minimum tensile strength prior to failure of the concrete.” The AASHTO Specifications also allow anchor bolts to be designed based on accepted engineering practices or by full-scale testing.
2.5.2 TxDOT Bridge Design Manual (2001) The TxDOT Bridge Design Manual (2001) is generally based on the 2001 AASHTO Specifications. Because the AASHTO Specifications provide little information on the design of anchor bolts, the TxDOT Bridge Design Manual allows the use of the design equation proposed by Jirsa et al. (1984). Few guidelines for the required factor of safety in designing anchor bolts are provided, except that: “Certainly, the anchorage should develop the service load tension in the bolts. Preferably, a reasonable factor of safety should be provided.” In this report, when the experimentally observed capacities of drilled shafts are compared with required design values, the required factor of safety is taken consistent with that of ASCE 7-05 and ACI 318-05.
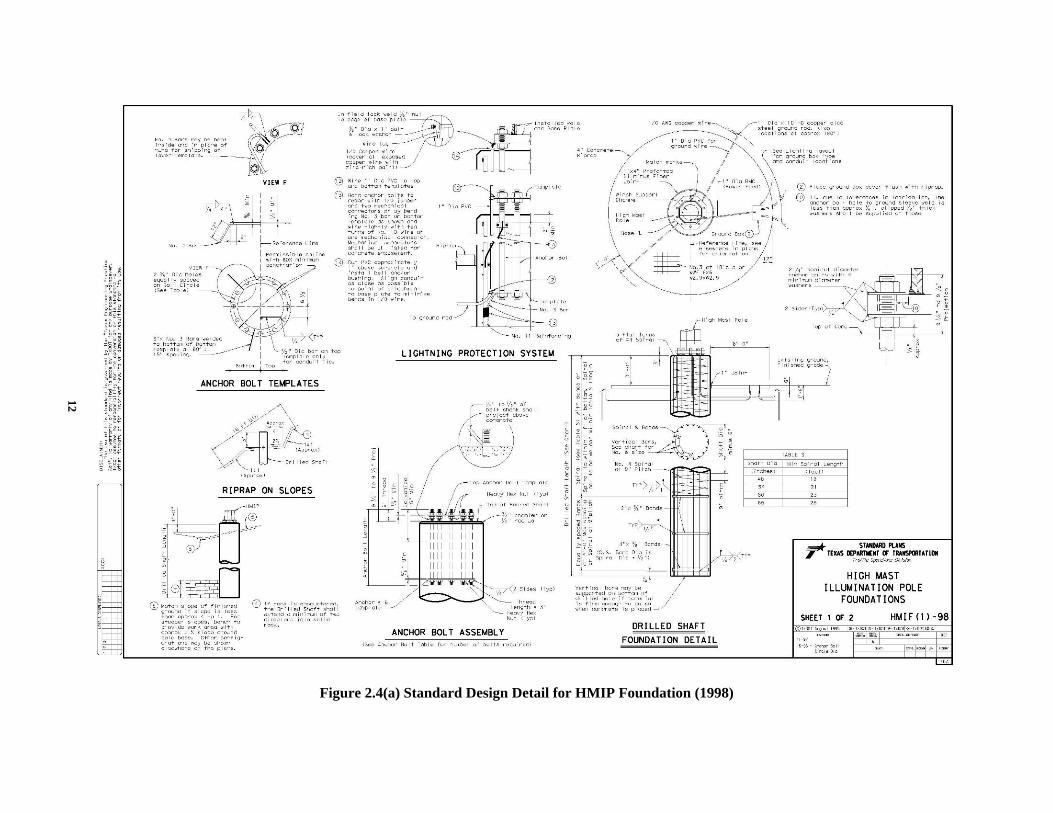
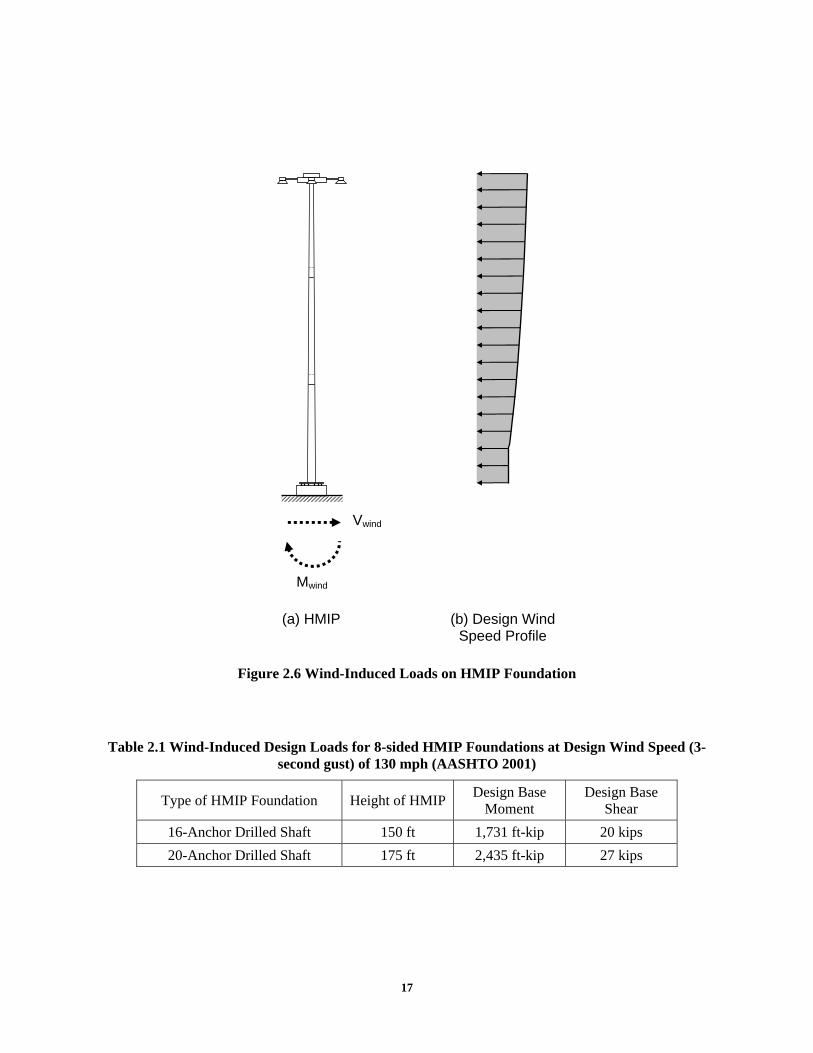
2.6 WIND-INDUCED LOADS Wind loads govern the design of HMIPs and their foundations. Design wind loads are assumed to correspond to 8-sided HMIPs, since those match with the 16- and 20-anchor shafts studied in this research. TxDOT Design Details for 8-sided HMIPs for 150 ft and 175 ft heights are shown in Figure 2.5.
Based on the HMIP details of that figure, the required design wind loads for drilled shafts were estimated using AASHTO Specifications (2001), as shown in Figure 2.6. The basic design wind speed was 130 mph (3-second gust), as specified for Houston in the AASHTO Specifications (2001). The results are summarized in Table 2.1, which shows that the design base shear forces generated by the wind load are relatively small and the flexural moments are the most critical loads in evaluating the performance of HMIP drilled shafts. Based on this observation, a test setup was planned to provide flexural moments to HMIP drilled shafts using a hydraulic actuator. The detailed descriptions of the test setup are provided in Chapter 3. The wind-load calculation procedure of the AASHTO Specifications is also explained in more detail in Chapter 5.
16
Vwind
Mwind
(b) Design Wind Speed Profile
(a) HMIP
Figure 2.6 Wind-Induced Loads on HMIP Foundation
Table 2.1 Wind-Induced Design Loads for 8-sided HMIP Foundations at Design Wind Speed (3-second gust) of 130 mph (AASHTO 2001)
Type of HMIP Foundation Height of HMIP Design Base Moment
Design Base Shear
16-Anchor Drilled Shaft 150 ft 1,731 ft-kip 20 kips 20-Anchor Drilled Shaft 175 ft 2,435 ft-kip 27 kips
17

CHAPTER 3: EXPERIMENTAL PROGRAM
3.1 INTRODUCTION To investigate the effect of ASR/DEF damage on the performance of HMIP foundations, six field tests were conducted in Houston. Tested specimens were located at the intersection of US 59 South and the Sam Houston Tollway (Beltway 8). Of those six drilled-shaft specimens, four were constructed in 1989 and affected by ASR/DEF, and two were newly constructed in 2006 for test purposes and hence unaffected.
The following field tests were conducted:
(1) cyclic tests on newly constructed, undamaged control specimens (S16-Control and S20-Control); (2) cyclic tests on ASR/DEF-damaged specimens (S16-ASR1 and S20-ASR); (3) a test on the ASR/DEF-damaged specimen with monotonic loads (S16-ASR2) (4) a cyclic test on the repaired specimen (S20-CFRP)
Design details for the control specimens, shown in Figure 3.1, are identical to the 1986 TxDOT Standard Design Details (Figure 2.3). As the ASR/DEF damaged specimens were constructed in 1989 in accordance with the 1986 TxDOT Standard Design Details, all specimens have the same design details for each 16- and 20-anchor bolt drilled shafts. Figure 3.2 shows templates that were used to prevent anchor bolts from floating during concrete placement. The bottom anchor bolt template also acts as a washer at the anchor head. In this chapter, the mechanical properties of the materials used, the test setup, the test instrumentation, the loading protocol, the test procedure and the presentation of test data are described.
18

19
Figure 3.1 Texas HMIP Foundation Design Details
19

Top anchor bolt template
Bottom anchor bolt template
4-1/2″ (Min) 1/4″ (Min)
9/16″ (Min)
Figure 3.2 Templates in HMIP Foundation
3.2 MATERIAL PROPERTIES 3.2.1 Newly Constructed, Undamaged Control Specimens
3.2.1.1 Concrete
For these drilled shafts, TxDOT Bridge Design Manual (2001) requires a 28-day concrete compressive strength of at least 3,600 psi. To determine the actual concrete strength, compressive strength tests were conducted. For the control specimens (S16-Control and S20-Control), concrete compressive strengths were determined by tests on three 6- ×12-in. concrete cylinders for each specimen. Tests were conducted by Houston District Laboratory of Texas Department of Transportation in accordance with ASTM C 39-05. Test results are summarized in Table 3.1.
Table 3.1 Compressive Strength of Control Specimens
Specimen Test 1 ( fc, psi)
Test 2 ( fc, psi)
Test 3 ( fc, psi)
fc, avg (psi)
S16-Control 7,730 7,130 6,520 7,130 S20-Control 6,830 8,250 7,630 7,570
3.2.1.2 Anchor Bolts
TxDOT Bridge Design Manual specifies that HMIP be anchored using anchor bolts conforming to ASTM A193-Grade B7, a high-strength, carbon-alloy steel, with a specified minimum tensile strength of 125 ksi and a minimum yield strength (0.2% offset) of 105 ksi. Coarse-threaded anchor bolts were used for the newly constructed control specimens and had a nominal diameter of 2-1/4 in. Three steel coupons were prepared. Tested values of yield stress, fy ; yield strain, εy : modulus of elasticity, E ; ultimate tensile stress,
20

Table 3.2 Mechanical Properties of Anchor Bolts
Elastic Region Strain-Hardening Region Thread Type Specimen fy
(ksi) εyE
(ksi) fut
(ksi) εu
S16-Control Coarse threads
S20-Control 119 0.0066 31,000 134 0.069
fut ; and corresponding strain, εu , are given in Table 3.2. The tested anchor bolts satisfy the ASTM A193 requirements.
3.2.2 ASR/DEF-Damaged Specimens Constructed in 1989
3.2.2.1 Concrete
Four HMIP foundations constructed in 1989 were found to have extensive cracking throughout the foundations, as shown in Figure 3.3. The figure illustrates deposits of ettringite within the cement paste, which is an indication of DEF. The possible presence of ASR gel was investigated using the Uranyl Acetate Fluorescent Method (UAFM) on some core samples. Uranyl acetate solution was applied to the surfaces of the cores; the core samples were exposed to UV light; and the ASR gel glows bright yellowish-green. The typical test result is illustrated in Figure 3.4. The bright yellowish-green areas are represented by the dotted lines. Hence, it is concluded that these four HMIP foundations constructed in 1989 were affected by DEF or ASR, separately or in combination.
Figure 3.3 HMIP Foundation with Premature Concrete Cracking
21

Figure 3.4 Typical Results of Uranyl Acetate Fluorescent Method (UAFM)
To determine the compressive strength and the splitting tensile strength of the concrete in the ASR/DEF-damaged specimens, concrete cores, varying in diameter from 3.7 to 4.2 in., were extracted after the foundations had been field-tested. The ends of the cores were cut perpendicular with a wet saw, and the compression specimens were capped with sulfur. All procedures for drilling and preparing cores, compressive strength tests and splitting tensile strength tests were conducted in accordance with the applicable ASTM standards (ASTM C 42, C 617, C 39 and C 496). Test results are summarized in Table 3.3 and Table 3.4. It has been reported that some loss of concrete strength can occur in the process of drilling cores (Malhotra 1977; ACI 318-83 Commentary; Szypula and Grossman 1990; ASTM C 42-04). In other words, concrete cores extracted from laboratory-cured cylinders can be expected to have a tested compressive strength equal to about 85% of the tested strength of the same laboratory-cured cylinders. To address this, concrete strengths obtained by core testing were divided by 0.85, as shown in Table 3.3. These adjusted compressive strengths were considered to more realistically represent the probable strength of the concrete in the ASR/DEF-damaged drilled shafts.
To examine the effect of ASR/DEF on the concrete tensile strength, the tested splitting tensile strengths were compared with the estimated tensile strengths of 6.7√ fc, avg (R11.2.1.1 in ACI 318-05), where fc, avg is the average compressive strength from core tests. The results are illustrated in Table 3.4. All measured tensile strengths are 17% to 46% larger than the predicted values, indicating little influence of ASR/DEF on the splitting tensile strength of concrete.
Table 3.3 Compressive Strength of ASR/DEF-Damaged Specimens
Specimen Test 1 ( fc, psi)
Test 2 ( fc, psi)
Test 3 ( fc, psi)
Test 4 ( fc, psi)
fc, avg (psi)
fc, avg /0.85 (psi)
S16-ASR1 5,140 5,540 5,040 6,120 5,460 6,420 S16-ASR2 5,420 5,560 6,190 6,280 5,860 6,890 S20-ASR 5,470 4,930 - - 5,200 6,120
S20-CFRP 5,990 5,610 5,950 5,640 5,800 6,820
22

Table 3.4 Splitting Tensile Strength of ASR/DEF-Damaged Specimens
Test 1 Test 2 Specimen fct
(psi) fct
6.7√ fc, avg
fct(psi)
fct
6.7√ fc, avg
fct, avg(psi)
S16-ASR1 650 1.31 618 1.25 634 S16-ASR2 605 1.18 669 1.30 637 S20-ASR 670 1.39 707 1.46 689
S20-CFRP 724 1.42 596 1.17 660
3.2.2.2 Anchor Bolts
Fine-threaded anchor bolts were used for the ASR/DEF-damaged specimens. On the other hand, coarse-threaded anchor bolts were used for the newly constructed control specimens. Both had a nominal diameter of 2-1/4 in. Three steel coupons were prepared for each type of anchor bolt. Test results are summarized in Table 3.5, and stress-strain curves are presented in Figure 3.5. Tested fine-threaded anchor bolts do not satisfy the ASTM A193 requirements as their minimum yield strength and tensile strength are slightly less than the required values of 105 and 125 ksi, respectively.
Table 3.5 Mechanical Properties of Anchor Bolts
Elastic Region Strain-Hardening Region Thread Type Specimen fy
(ksi) εyE
(ksi) fut
(ksi) εu
S16-ASR1 S16-ASR2 S20-ASR
Fine threads
S20-CFRP
102 0.0061 33,000 124 0.074
23

0
40
80
120
160
0 0.02 0.04 0.06 0.08 0.1 0.12
Strain
Fine threads (ASR/DEF-damaged specimens)
Coarse threads (Control specimens)
Stre
ss (k
si)
0.2% offset line
Figure 3.5 Stress-Strain Curves for Anchor Bolts
3.2.2.3 Damage Index
Four of the tested specimens, constructed in the 1989, suffered severe ASR/DEF damage. The severity of that damage was quantified using the damage index (DI) proposed by Boenig et al. (2002):
2DI w l=∑ Eq. (3.1)
where w is the crack width in thousandths of an inch, and l is the crack length in inches.
The damage index was calculated over a square area measuring 12 in. on each side, as shown in Figure 3.6. The most useful way to do this was crack-by-crack, using a tabular format with one row per crack. The average width of each crack in inches was recorded, along with the length of the crack in inches. The damage indices were measured at four locations for each specimen, two above the ground level and the other two below the ground level. Specimen S16-ASR1 had the most severe cracks exhibiting widths that varied from 0.005 in. to 0.06 in. On the other hand, the crack widths of other ASR/DEF-damaged specimens were similar, varying from 0.005 in. to 0.025 in.
Table 3.6 shows the measured damage index, evaluated at four different locations for each ASR/DEF-damaged specimen. The damage indices at locations 1 and 2 were measured above the ground level and those at locations 3 and 4 were below the ground level. The damage index calculations (Table 3.6) indicate that specimen S16-ASR1 is the most severely damaged drilled shaft by ASR/DEF. The damage indices also suggest similar levels of ASR/DEF damage in specimens S16-ASR2, S20-ASR and S20-CFRP. It is important to note that the damage index is a subjective measurement because measured crack widths, lengths and selected locations are subjective. Therefore, the estimated damage index values should be taken as a qualitative indication of severity of cracks.
24

(a) S16-ASR1 (b) S16-ASR2
(c) S20-ASR (d) S20-CFRP
Figure 3.6 Area used to Record Damage Index for ASR/DEF-Damaged Specimens
25

Table 3.6 Damage Index for ASR/DEF-Damaged Specimens
Damage Index Specimen
Location ∑w2l (in.3)
Average (in.3)
1 102,900 2 67,600 3 24,700
S16-ASR1
4 16,600
52,950
1 7,400 2 2,400 3 4,100
S16-ASR2
4 3,300
4,300
1 1,700 2 4,500 3 5,600
S20-ASR
4 5,600
4,350
1 2,700 2 4,800 3 7,100
S20-CFRP
4 6,200
5,200
3.3 TEST SETUP Field tests were conducted on drilled shafts using the test frame and test setup shown in Figure 3.7(a). Tension and compression in the ram produced overturning moment and axial load in the shaft. As the number and configuration of anchors differed for the 16- and 20-anchor drilled shafts, two base plates were prepared, one for each 16 anchors and the other for 20. Before testing, the backfill around the drilled shaft was excavated to facilitate the subsequent observation of behavior.
During testing, the loading arm was loosely suspended from an overhead crane for safety, as shown in Figure 3.7(b). Due to the capacity limitations of the test setup, the base plate was connected to the drilled shaft using only 6 of the 16 or 20 anchor bolts -- that is, 3 bolts on the extreme tension side of the shaft, and 3 on the extreme compression side (Figure 3.8). The overturning base moments associated with those six extreme anchor bolts are fractions of base overturning moments associated with the total number of anchor bolts. According to the AASHTO Standard Specifications (2001), which require elastic analysis in calculating anchor-bolt forces, the ratio of base moment capacity for 6 extreme anchor bolts to base moment capacity for all the anchor bolts is 0.68 for the 16-anchor bolt shafts, and 0.56 for the 20-anchor bolt shafts. This is discussed further in Chapter 4.
26

Specimen (φ-60 in.)
Actuator - 220 kip load capacity - 30 in. stroke capacity
Load cell
25 ft
Loading arm
Base plate
Figure 3.7(a) Test Setup
Figure 3.7(b) Test Setup
27

Figure 3.7(c) Test Setup (continued)
28

Base plate
Drilled shaft
Figure 3.8 Connection of 6 Extreme Anchor Bolts to Base Plate
3.4 INSTRUMENTATION Rotations of the axis of each drilled shaft were measured at two different elevations: at the top surface of the shaft; and at the base plate. For this purpose, electronic inclinometers were mounted on the top of the drilled shaft and base plate, and four linear potentiometers were installed, as shown in Figure 3.9. In addition, one inclinometer (INC-3 in Figure 3.9) was installed on the base plate in the transverse direction (perpendicular to the direction of the applied moment), and was intended to monitor the stability of the setup during test for safety.
For the CFRP-repaired specimen (S20-CFRP), strain gauges were also installed on the CFRP layers. A total of 12 strain gauges were attached along the longitudinal direction of the drilled shaft, as illustrated in Figure 3.10. Strain gauges were installed in the following manner: First, an adhesive compatible with the gauges was applied to prepare the surface for gauge installation. Second, the strain gauges were attached and finally, a coating was applied to waterproof the strain gauges.
29

INC*-1
INC-2
INC-3
LP**-1 LP-2
(*: Inclinometer; **: Linear Potentiometer)
INC-1
INC-2
INC-3
LP-1 LP-2
LP-3 LP-4
(a) Side View
A A
(b) Top View (A-A)
(c) Picture View
Inclinometer
Linear Potentiometer
Figure 3.9 Locations of Inclinometers and Linear Potentiometers
30

B6B5B4B3B2
B1
F6 F5 F4 F3 F2
F1
CFRP laminates
1 ft
2 ft
2 ft
Figure 3.10 Locations of CRFP Laminates and Strain Gauges for Specimen S20-CFRP
3.5 TEST PROCEDURE The test procedure followed the steps listed below:
1) The loading arm and base plate were lifted by overhead crane and bolted to the top of the drilled shaft. The actuator was attached at its lower end to the actuator foundation; its upper end was lifted to a plumb position by the overhead crane, and attached to the loading arm. All bolts were hammer-tightened with spud wrenches
2) An initial compressive load of 6.8 kips was applied to the loading arm to counterbalance the moment introduced by the arm’s self-weight.
3) Five of the six drilled shafts were subjected to repeated cycles of reversed cyclic loading, to monotonically increasing maximum load levels, following the loading protocol of Figure 3.11.
4) One of 16-anchor specimens (S16-ASR2) was tested under monotonic loading, in two stages (Figure 3.12):
a) To examine the tensile capacity of the group of 3 tension-side anchor bolts, the 6 anchor bolts of specimen S16-ASR2 were engaged to the base plate, and the specimen was loaded monotonically to concrete blowout around the tension-side anchor bolts.
b) To examine the tensile capacity of a single tension-side anchor bolt, the specimen was unloaded and 2 of the 3 anchor bolts previously in compression were disengaged, leaving only one anchor bolt attached to the base plate on the side opposite to the blowout failure noted above. All three anchor bolts on the side of the blowout failure were kept engaged. The specimen was loaded monotonically in a direction opposite to the above, so that the single engaged bolt was placed in tension.
In the first test (S16-Control), ten fully reversed load cycles were applied at each loading step. The ten cycles were intended to simulate hurricane loading. Since strength and stiffness degradation were negligible from each loading step to the next, the number of fully reversed cycles was reduced to five for the rest of the specimens. Cyclic loading effects are discussed in more detail in Chapter 4.
31

-200
-150
-100
-50
0
50
100
150
200
0 5 10 15 20 25 30
0.5W* 1.0W
Tn** 2.0W
Up to the failure or stroke capacity of actuator
(*: Design wind load; **: Design tensile capacity of anchor bolts)
Loading Cycles
Load
from
Act
uato
r (ki
p)
Figure 3.11 Typical Loading History for Five of Six Specimens
-200
-150
-100
-50
0
50
100
150
200
0 0.2 0.4 0.6 0.8 1 1.2
Up to failure
Load
from
Act
uato
r (ki
p)
Loading Cycles
Phase I
Phase II
(b) Phase I (c) Phase II
(a) Loading Protocol
Three anchor bolts are in tension.
Only one anchor bolt is in tension.
Figure 3.12 Loading History for CFRP-repaired Specimen (S16-ASR2)
32
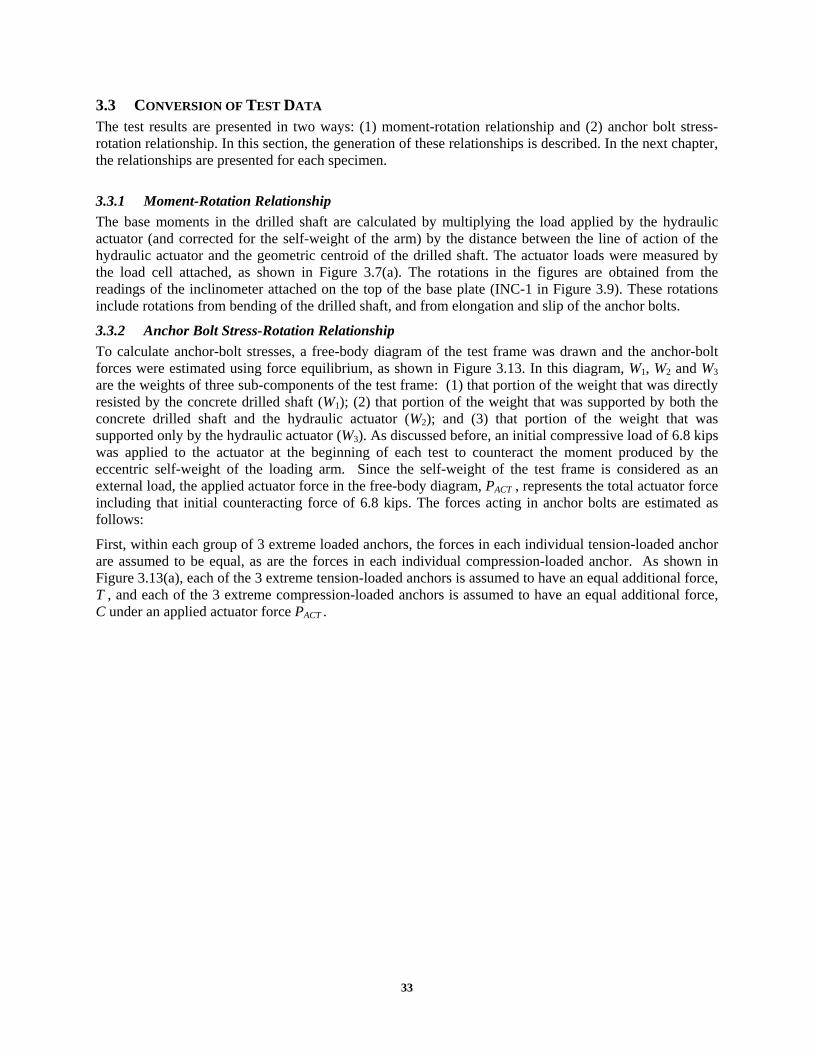
3.3 CONVERSION OF TEST DATA The test results are presented in two ways: (1) moment-rotation relationship and (2) anchor bolt stress-rotation relationship. In this section, the generation of these relationships is described. In the next chapter, the relationships are presented for each specimen.
3.3.1 Moment-Rotation Relationship The base moments in the drilled shaft are calculated by multiplying the load applied by the hydraulic actuator (and corrected for the self-weight of the arm) by the distance between the line of action of the hydraulic actuator and the geometric centroid of the drilled shaft. The actuator loads were measured by the load cell attached, as shown in Figure 3.7(a). The rotations in the figures are obtained from the readings of the inclinometer attached on the top of the base plate (INC-1 in Figure 3.9). These rotations include rotations from bending of the drilled shaft, and from elongation and slip of the anchor bolts.
3.3.2 Anchor Bolt Stress-Rotation Relationship To calculate anchor-bolt stresses, a free-body diagram of the test frame was drawn and the anchor-bolt forces were estimated using force equilibrium, as shown in Figure 3.13. In this diagram, W1, W2 and W3 are the weights of three sub-components of the test frame: (1) that portion of the weight that was directly resisted by the concrete drilled shaft (W1); (2) that portion of the weight that was supported by both the concrete drilled shaft and the hydraulic actuator (W2); and (3) that portion of the weight that was supported only by the hydraulic actuator (W3). As discussed before, an initial compressive load of 6.8 kips was applied to the actuator at the beginning of each test to counteract the moment produced by the eccentric self-weight of the loading arm. Since the self-weight of the test frame is considered as an external load, the applied actuator force in the free-body diagram, PACT , represents the total actuator force including that initial counteracting force of 6.8 kips. The forces acting in anchor bolts are estimated as follows:
First, within each group of 3 extreme loaded anchors, the forces in each individual tension-loaded anchor are assumed to be equal, as are the forces in each individual compression-loaded anchor. As shown in Figure 3.13(a), each of the 3 extreme tension-loaded anchors is assumed to have an equal additional force, T , and each of the 3 extreme compression-loaded anchors is assumed to have an equal additional force, C under an applied actuator force PACT .
33

d2d1
d2
CC
C
T T T
R2 = 3×C
R1 = 3×T
de
(a) Equilibrating Forces in Anchor Bolts and their Lines of Action
+ ×= 1 22
3ed dd
16-anchor bolt 20-anchor boltd 1 42.00 46.00d 2 38.80 43.75d e 39.87 44.50
(Unit: inch)
W1 = 13.6 kips
W2 = 10.8 kips
W3 = 1.3 kips
PACT
R1 R2
25 ft
de/2 de/2
12.5 ft
(b) Free-Body Diagram of Test Setup
W1, W2, and W3 = weights of test frame PACT = forces acting on the actuator R1 and R2 = forces in anchor bolt group de = distance between the centroid of anchor bolt groups
A
Figure 3.13 Free-Body Diagram of Test Setup showing Equilibrium of Anchor Forces
34

With this simplification, the forces R1 and R2 acting on the 3 extreme compression-loaded and tension-loaded anchors are 3×C and 3×T respectively, and the distance de between the geometric centroidal axis of the shaft and the lines of action of each resultant is obtained by summing moments about the centroid of the shaft:
1 223e
d dd + ×= Eq. (3.2)
Based on the free-body diagram of the test frame shown in Figure 3.13(b), the following two equations of equilibrium are derived by taking moments about Point A:
0 :AM =∑
( )1 2 3 212.5' 25' 25' 02 2 2 2
⎛ ⎞ ⎛ ⎞ ⎛ ⎞ ⎛ ⎞+ + + + − + +⎜ ⎟ ⎜ ⎟ ⎜ ⎟ ⎜ ⎟⎝ ⎠ ⎝ ⎠ ⎝ ⎠ ⎝ ⎠
e e e eACT e
d d d dW W W P R d =
0 :yF =∑
1 2 3 1 2 0+ + − − + =ACTW W W P R R
These two equations can be summarized as follows:
1 2 3
2
25' 12.5' 25'2 2 2 2
⎛ ⎞ ⎛ ⎞ ⎛ ⎞ ⎛ ⎞+ − − + − +⎜ ⎟ ⎜ ⎟ ⎜ ⎟ ⎜ ⎟⎝ ⎠ ⎝ ⎠ ⎝ ⎠ ⎝ ⎠=
e e e eACT
e
d d d dP W W WR
d Eq. (3.3)
1 1 2 3 2( )= + + + − ACTR W W W R P Eq. (3.4)
From Eq. (3.3) and Eq. (3.4), the stress at each anchor bolt can be calculated as follows:
( ) ( )1 21 2
/ 3 / 3;
b b
R Rf f
A A= = Eq. (3.5)
where Ab is the effective net tensile stress area of a single anchor bolt.
Using Eq. (3.3) through Eq. (3.5), the relationships between anchor bolt stress and base plate rotation are obtained.
35

CHAPTER 4: TEST RESULTS
4.1 INTRODUCTION In this chapter, results are reported for the field tests on the six drilled shafts. Five of the six specimens were tested under repeated cycles of reversed cyclic load; the ASR-damaged specimen S16-ASR2 was tested under monotonic loading, first in one direction and then in the other, with different numbers of tension-side anchors connected in each phase. Following the presentation of test observations and results, the significance of the results is discussed.
4.2 CONTROL SPECIMENS (S16-CONTROL AND S20-CONTROL) At the time of test for Specimen S16-Control, a misalignment of the anchor bolt group in the drilled shaft was found, as illustrated in Figure 4.1. The measured edge distances on each side were 11-3/4 in. and 6-1/4 in. The alignment was checked for all other drilled shaft specimens, and misalignment was found only in Specimen S16-Control.
Figure 4.2 and Figure 4.3 show the damage sequence of control specimens, which are newly constructed and undamaged. Figure 4.4 illustrates a general damage sequence observed in these specimens. The first signs of distress were local spalling cracks around the anchor bolts on the top concrete surface of the drilled shaft, as shown in Figure 4.4(a). At an applied load of about 60 kips, flexural cracking started just below the level of the bottom template and nuts (Figure 4.4(b)). This load level corresponds roughly to the calculated flexural cracking capacity of the drilled shafts. Soon thereafter, at an applied load of about 70 kips, a second flexural crack occurred, above the level of the template and nuts (Figure 4.4(c)). Near the maximum load, vertical cracks and horizontal cracks occurred around anchor bolts (Figure 4.4(d)). The comparison of failed specimens, which is shown in Figure 4.2(c) and Figure 4.3(c), indicates that the area of damaged concrete is larger in the S16-Control specimen than in the S20-Control specimen. The specified edge distance and anchor bolt spacing of the S16-Control specimen are 9 in. and 8.25 in., while those of the S20-Control specimen are 7 in. and 7.23 in. The thicker concrete cover and greater bolt spacing in the S16-control specimen provided larger concrete area for resisting pullout of anchor bolts, which in turn generated larger damaged concrete area. Even though the measured edge distance at the top surface of specimen S16-Control was 6-1/4 in. on the failed side, the template was not visible up to the concrete depth of 4 in., indicating the better alignment at the template level. The two control specimens failed by concrete side-face blowout on the tension side.
After testing the cracked concrete was removed and the failure mode of the tested specimens was further examined, as shown in Figure 4.5. The gaps between the tip of longitudinal reinforcement and surrounding concrete indicate that the core concrete moved upward against the longitudinal reinforcement under the tensile loading (Figure 4.5(a)). The fact that the core concrete behaved as a single piece of concrete is the result of the group effect of anchor bolts and the effective anchorage provided by template. Similar observation can be made in specimen S20-Control, as shown in Figure 4.5(b). Due to the relatively thin cover concrete, concrete cover near the template was spalled off and the template was exposed for specimen S20-Control. The template, shown in Figure 4.5(b), was bent as the anchor bolts were pulled out under tension. The distance between the template and nuts is equal to the amount of the bent of template. This observation also indicates that the core concrete moved upward under tension. The examination of exposed core concrete surfaces showed inclined cracks and compression struts propagating from the template to the spirals (Figure 4.5(b)). These inclined concrete cracks occurred by splitting tensile concrete cracks under compression stresses which were transferred from the template to spirals.
36

A A
(a) Test Setup
(b) Misalignment of anchor bolts (Section A-A)
11-3/4″ 6-1/4″
Direction of view in Figure 4.2
Figure 4.1 Misalignment of Anchor Bolts in Specimen S16-Control
It was also found that the spiral of specimen S16-Control was poorly placed and that the spacing varied significantly along the depth (Figure 4.5(a)).
Figure 4.6 and Figure 4.7 show moment-rotation relationships for each specimen. The calculations of base moments and rotations are described in Chapter 3. The corresponding loading steps to (a), (b) and (c) of Figure 4.2 and Figure 4.3 are also included in Figure 4.6 and Figure 4.7. The design base moments consistent with the basic design wind speed of 130 mph calculated according to the AASHTO Specifications (2001) are 1,731 kip-ft and 2,435 kip-ft for the 16- and the 20-anchor shafts respectively. The ratio of base moment capacity from the six extreme anchor bolts (three bolts on each side) divided by base moment capacity from all anchor bolts are calculated using elastic analysis, as required by the AASHTO Specifications (2001), and are 0.68 and 0.56 for the 16- and the 20-anchor shafts respectively. Based on this calculation, the design base moment demand for six extreme anchor bolts are estimated as 989 and 1,370 ft-kip for the 16- and the 20-anchor shafts respectively. This base moment demand (Mwind) is also included in the figures. For use in design, that base moment demand must be multiplied by the ASCE 7-05 load factor of 1.6 for wind to obtain the factored design base moment. That factored design base moment must be equaled or exceeded by the nominal base moment capacity of the anchors,
37

decreased by the ACI 318-05 capacity-reduction factor (φ factor) of 0.75. The quotient of those factors (1.6/0.75) equals 2.13, which represents an effective factor of safety. The unfactored base moment demand (Mwind), multiplied by that factor of safety, represents the required nominal capacity of the 6 extreme anchor bolts, and is also shown in the figures as Mwind × (1.6/0.75). Figure 4.6 and Figure 4.7 show that control specimens behave linearly at design base moments and their maximum moment capacities provides the ACI-required factor of safety. For Specimen S16-Control, the required factor of safety marginally satisfies the ACI required factor of safety. The tested concrete compressive strengths of Specimens S16-Control and S20-Control are 7,130 and 7,570 psi respectively, however. Since the TxDOT-specified concrete strength of 3,600 psi is much less than those values, the safety factor might not be sufficient for a drilled shaft whose concrete strength was closer to the specified value. As mentioned in Chapter 3, ten load cycles were applied at each loading step for Specimen S16-Control. Figure 4.6 shows that the degradation of strength and stiffness is negligible. As the cyclic loading did not appear to significantly affect the behavior of the HMIP foundations, the number of loading cycles was reduced to five for the remaining specimens.
Figure 4.8 shows the anchor bolt stress-rotation relationship for the Specimen S16-Control. Eqs. (3.3), (3.4) and (3.5) were used in calculating anchor bolt stresses, f1 and f2 . Comparison of Figure 4.8(a) and Figure 4.8(b) indicates that anchor bolt stresses at opposite sides, f1 and f2 , are similar but slightly different in magnitude. To examine that difference, the stresses are compared in Figure 4.9, which shows that the anchor bolt stress f2 is larger than the opposite anchor stress f1 by 10% to 14%. Because the load applied by the actuator introduces axial force as well as the moment into the foundation, the anchor bolt stresses on opposite sides differ slightly. Because the anchor bolt stress f2 exceeds f1 , the anchor bolt stress-rotation relationship of Specimen S20-Control is represented using anchor bolt stresses f2 , as shown in Figure 4.10.
(a) Pram = 63 kips (b) Pram = 101 kips (c) After failure
Figure 4.2 Damage Sequence for Specimen S16-Control
38

(a) Pram = 72 kips (b) Pram = 134 kips (c) After failure
Figure 4.3 Damage Sequence for Specimen S20-Control
(b) Pram ≈ 60 kips (c) Pram ≈ 70 kips (d) At failure (a) Pram = 20 ∼ 30 kips
Figure 4.4 Progression of Damage
39

(a) Specimen S16-Control
(b) Specimen S20-Control
Gaps
Inclined cracks
Figure 4.5 Failure of Control Specimens
40

-3,500-3,000-2,500-2,000-1,500-1,000
-5000
5001,0001,5002,0002,5003,0003,500
-3 -2 -1 0 1 2 3
Bas
e M
omen
t, M
base
(ft-k
ip)
Rotation (degree)
140 120 100 80 60 40 20 0 -20 -40 -60 -80 -100 -120 -140
Load
from
Act
uato
r, P
ram (k
ip)
Mwind
Mwind × (1.6/0.75)
(a)
(b)
(c)
Figure 4.6 Moment-Rotation Response of Specimen S16-Control
-3,500-3,000-2,500-2,000-1,500-1,000
-5000
5001,0001,5002,0002,5003,0003,500
-3 -2 -1 0 1 2 3
Bas
e M
omen
t, M
base
(ft-k
ip)
Rotation (degree)
140 120 100 80 60 40 20 0 -20 -40 -60 -80 -100 -120 -140
Load
from
Act
uato
r, P
ram (k
ip)
Mwind
Mwind × (1.6/0.75)
(a)
(c)
(b)
Figure 4.7 Moment-Rotation Response of Specimen S20-Control
41

Figure 4.8(a) Anchor Bolt Stress-Rotation Response of Specimen S16-Control
ol
Figure 4.8(b) Anchor Bolt Stress-Rotation Response of Specimen S16-Contr
-120
-100
-80
-60
-40
-20
0
20
40
60
80
100
120
-3 -2 -1 0 1 2 3
Anc
hor B
olt S
tress
, f2 (
ksi)
Rotation (degree)
Tension
Compression
f2
Tension
Compression
-120
-100
-80
-60
-40
-20
0
20
40
60
80
100
120
-3 -2 -1 0 1 2 3
f1
Anc
hor B
olt S
tress
, f1 (
ksi)
Rotation (degree)
42

Figure 4.9 Relationship of Anchor Bolt Stresses, f1 and f2
-120-100-80-60-40-20
020406080
100120
-12 -10 -80 -60 -40 -20 0 20 40 60 80 100 120
Figure 4.10 Anchor Bolt Stress-Rotation Response of Specimen S20-Control
Anc
hor B
olt S
tress
, f2 (
ksi)
Anchor Bolt Stress, f1 (ksi) -120 -100
f1 f2
-120
-100
-80
-60
-40
-20
0
20
40
60
80
100
120
-3 -2 -1 0 1 2 3
Anc
hor B
olt S
tress
, f2 (
ksi)
Rotation (degree)
Tension
Compression
f2
43

4.3 ASR/DEF-DAMAGED SPECIMENS (S16-ASR1 AND S20-ASR) Due to ASR/DEF, Specimens S16-ASR1 and S20-ASR had severe cracking prior to testing (Figure 4.11). Vertical cracking along anchor bolts and horizontal cracking adjacent to spirals can be found in these figures. As discussed in Chapter 3, more severe cracks occurred in Specimen S16-ASR1. Figure 4.12 and Figure 4.13 show the damage sequence of specimens S16-ASR1 and S20-ASR. The damage sequence was similar to that of the control specimens. After the formation of local spalling cracks around the anchor bolts on the top concrete surface of the drilled shaft, flexural cracks formed below and above the template. Thereafter, existing ASR/DEF-induced vertical and horizontal cracks widened, and only a few new vertical and horizontal cracks developed.
Consistent with the control specimens, the concrete damaged area of Specimen S16-ASR1 was larger than that of Specimen S20-ASR (Figure 4.12(c) and Figure 4.13(c)). Interestingly, Specimen S20-ASR failed by concrete bearing on the compression side at a load of 110 kips. Figure 4.14 and Figure 4.15 show moment-rotation relationships for these specimens. Figure 4.16 and Figure 4.17 show anchor bolt stress (f2)-rotation relationships. At the compression bearing failure in Specimen S20-ASR, a sudden loss of flexural capacity can be observed, but strength was soon regained, as illustrated in Figure 4.15 and Figure 4.17. In addition, Figure 4.15 and Figure 4.16 illustrate that the behavior of these specimens is linear up to the design base moments. Figure 4.15 also shows, however, that due to ASR/DEF damage, Specimen S20-ASR has insufficient flexural strength to satisfy the required factor of safety of ACI 318/ASCE 7
Figure 4.18 and Figure 4.19 show the failure appearance of Specimens S16-ASR1 and S20-ASR after removing cracked concrete. Discoloration of concrete and anchor bolts in Figure 4.18 indicate that ASR/DEF-induced cracks in Specimen S16-ASR1 propagated from the surface to the anchor bolt at the top of the drilled shaft, and to the longitudinal reinforcement along the drilled shafts. Similar discoloration is evident in Specimen S20-ASR at the top of the drilled shaft, but Specimen S20-ASR showed little signs of discoloration at cracks along the drilled shaft, indicating less ASR/DEF damage. This observation is somewhat consistent with the measured damage indices of 52,950 in.3 and 4,350 in.3 for Specimens S16-ASR1 and S20-ASR respectively.
(a) S16-ASR1 (b) S20-ASR Figure 4.11 ASR/DEF-Damaged Specimens
44
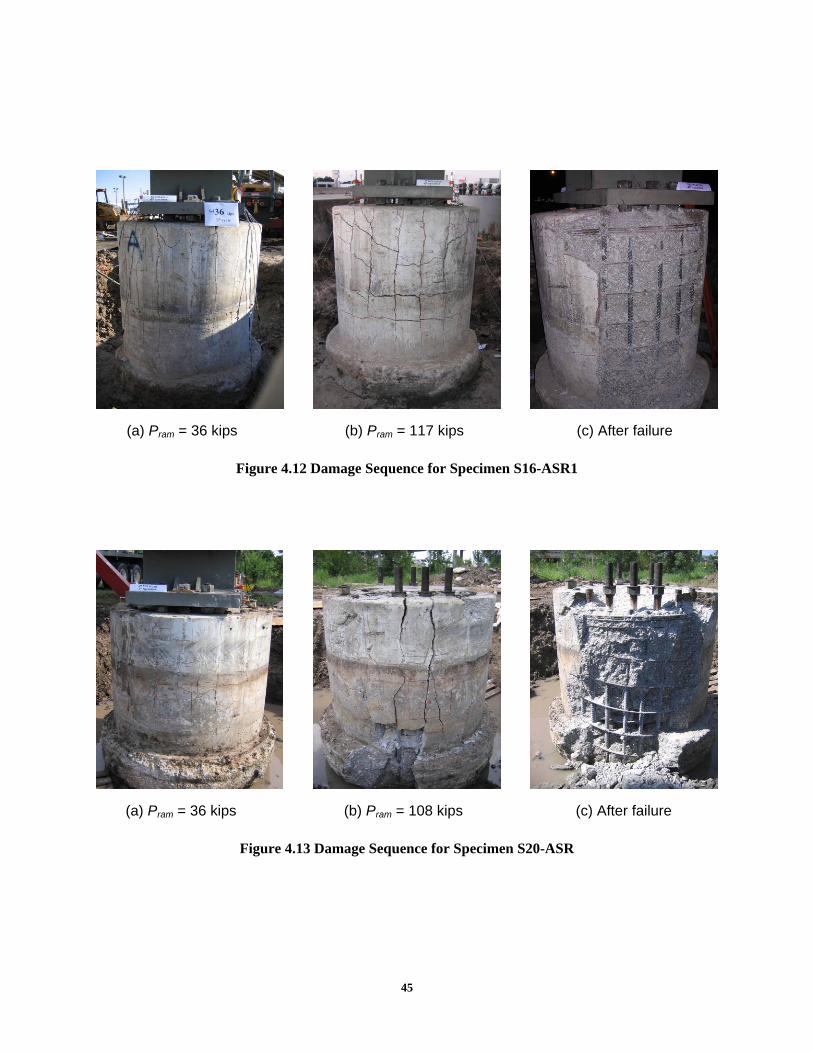
(a) Pram = 36 kips (b) Pram = 117 kips (c) After failure
Figure 4.12 Damage Sequence for Specimen S16-ASR1
Figure 4.13 Damage Sequence for Specimen S20-ASR
(a) Pram = 36 kips (b) Pram = 108 kips (c) After failure
45

Figure 4.14 Moment-Rotation Response of Specimen S16-ASR1
Figure 4.15 Moment-Rotation Response of Specimen S20-ASR
-3,500-3,000-2,500-2,000-1,500-1,000
-5000
5001,0001,5002,0002,5003,0003,500
-3 -2 -1 0 1 2 3
Bas
e M
omen
t, M
base
(ft-k
ip)
Rotation (degree)
140 120 100 80 60 40 20 0 -20 -40 -60 -80 -100 -120 -140
Load
from
Act
uato
r, P
ram (k
ip)
Mwind
Mwind × (1.6/0.75)
Concrete bearing failure
(c)
(b)
(a)
-3,500-3,000-2,500-2,000-1,500-1,000
-5000
5001,0001,5002,0002,5003,0003,500
-3 -2 -1 0 1 2 3
Bas
e M
omen
t, M
base
(ft-k
ip)
Rotation (degree)
140 120 100 80 60 40 20 0 -20 -40 -60 -80 -100 -120 -140
Load
from
Act
uato
r, P
ram (k
ip)
(b)
Mwind
Mwind × (1.6/0.75)
(a)
(c)
46

Figure 4.16 Anchor Bolt Stress-Rotation Response of Specimen S16-ASR1
Figure 4.17 Anchor Bolt Stress-Rotation Response of Specimen S20-ASR
-120
-100
-80
-60
-40
-20
0
20
40
60
80
100
120
-3 -2 -1 0 1 2 3
Anc
hor B
olt S
tress
, f2 (
ksi)
Rotation (degree)
Tension
Compression
f2
Concrete bearing failure
-120
-100
-80
-60
-40
-20
0
20
40
60
80
100
120
-3 -2 -1 0 1 2 3
Anc
hor B
olt S
tress
, f2 (
ksi)
f2
Tension
Compression
Rotation (degree)
47
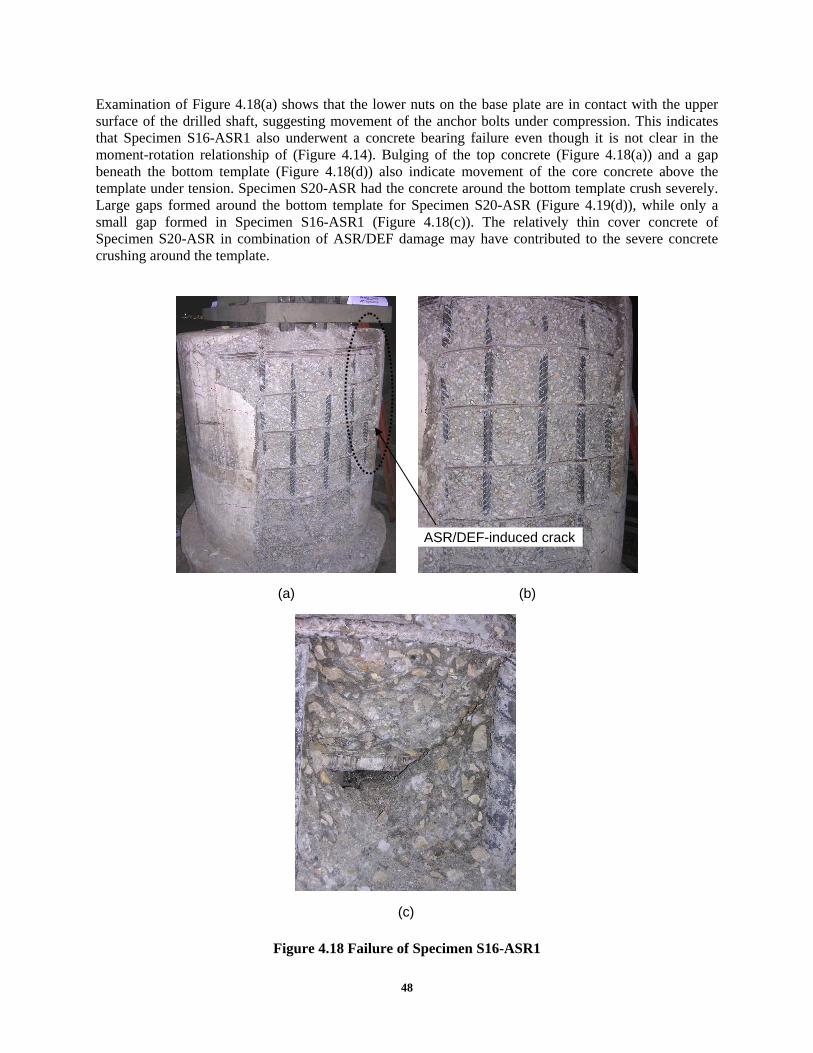
Examination of Figure 4.18(a) shows that the lower nuts on the base plate are in contact with the upper surface of the drilled shaft, suggesting movement of pression. This indicates that Specimen S16-ASR1 also underwent a concrete bearing failure even though it is not clear in the
Figure 4.18 Failure of Specimen S16-ASR1
the anchor bolts under com
moment-rotation relationship of (Figure 4.14). Bulging of the top concrete (Figure 4.18(a)) and a gap beneath the bottom template (Figure 4.18(d)) also indicate movement of the core concrete above the template under tension. Specimen S20-ASR had the concrete around the bottom template crush severely. Large gaps formed around the bottom template for Specimen S20-ASR (Figure 4.19(d)), while only a small gap formed in Specimen S16-ASR1 (Figure 4.18(c)). The relatively thin cover concrete of Specimen S20-ASR in combination of ASR/DEF damage may have contributed to the severe concrete crushing around the template.
ASR/DEF-induced crack
(a) (b)
(c)
48

Figure 4.19 Failure of Specimen S20-ASR
(a) (b)
(c) (d)
ASR/DEF-induced crack
49

4.4 ASR/DEF-DAMAGED SPECIMEN UNDER MONOTONIC LOAD (S16-ASR2) Based on the results of tests on the first series of ASR/DEF-damaged specimens, investigators decided not to retrofit the second 16-anchor bolt ASR/DEF-damaged specimen (S16-ASR2), and to test it under monotonic loading in each direction to investigate the effects of cyclic loading and of reductions in anchor capacity at close spacing. The damage sequence for Specimen S16-ASR2 (Loading Phase I), where three anchor bolts were engaged for tension and tested under monotonic loading, is shown in Figure 4.20. In spite of the differences in loading protocols, cracking patterns in Specimen S16-ASR2 were similar to those of Specimen S16-ASR1.
In Loading Phase II of the monotonic testing of Specimen S16-ASR2, where only one extreme tension-side anchor was connected by a nut, the anchor-bolt threads failed by stripping (Figure 4.21). This was unexpected, because such bolts are intended to fracture in tension before stripping. Fine-threaded anchor bolts are used in the ASR/DEF-damaged specimens, which were constructed in 1989.
The moment-rotation relationship for Specimen S16-ASR2 is shown in Figure 4.22. Like Specimen S16-ASR1, which was tested under cyclic loads, Specimen S16-ASR2 had sufficient flexural strength to satisfy the required factor of safety. Figure 4.23(a) and Figure 4.23(b) illustrate the anchor bolt stress-rotation relationships of Specimen S16-ASR2. Figure 4.23(a) represents the individual bolt stresses f2 in a group, which is three anchor bolt group, and Figure 4.23(b) shows the bolt stresses f1 of a single anchor bolt. As discussed previously, the tensile capacity of a single anchor bolt in this monotonic test was governed by stripping of anchor bolt threads rather than concrete failure or fracture of an anchor bolt. The maximum tensile anchor stress observed in the three anchor bolt group was 109 ksi, while that of the single anchor was 141 ksi. Hasselwander et al. (1977) report that interaction among closely spaced anchor bolts might result in an abrupt, non-ductile failure of the anchor group at bolt stresses significantly lower than those reached in an otherwise identical single anchor. In this case, the maximum tensile stress reached by the bolts in the group was 77% of that of the single bolt. The current TxDOT Bridge Design Manual (2001) specifies a spacing reduction factor (or grouping effect factor), which was proposed by Jirsa et al. (1984), as the ratio of the capacity of the bolts in a group to the capacity of the single bolt to take into account this reduction in tensile capacity:
,group
,single
0.02 0.40 1.0
ns
n
TK
T
S
=
= + ≤
Eq. (4.1)
where Ks is the spacing reduction factor and S is the center-to-center bolt spacing (in inches).
The estimated spacing reduction factor for Specimen S16-ASR2 using Eq. (4.1) would be 0.56, or 56%. The fact that the experimentally observed spacing reduction factor was greater than the estimated value means that observed capacity of the single anchor was lower than predicted due to the unexpected stripping of the anchor bolt threads.
50

Figure 4.20 Damage Sequence for Specimen S16-ASR2 (Loading Phase I)
Figure 4.21 Stripping of Anchor Bolt Threads in Specimen S16-ASR2 (Loading Phase II)
(a) Pram = 36 kips (b) Pram = 133 kips (c) After failure
(a) Bolt Thread Stripping (b) Nut
51

Figure 4.22 Moment-Rotation Response of Specimen S16-ASR2
Figure 4.23(a) Anchor Bolt Stress-Rotation Response of Specimen S16-ASR2
-150
-120
-90
-60
-30
0
30
60
90
120
150
Anc
hor B
olt S
tress
, f2 (
ksi)
-3 -2 -1 0 1 2 3
Rotation (degree)
Tension
Compression
f2
Phase I: Group anchor bolt test
-3,500-3,000-2,500-2,000-1,500-1,000
-5000
5001,0001,5002,0002,5003,0003,500
-3 -2 -1 0 1 2 3
Bas
e M
omen
t, M
base
(ft-k
ip)
Rotation (degree)
140 120 100 80 60 40 20 0 -20 -40 -60 -80 -100 -120 -140
Load
from
Act
uato
r, P
ram (k
ip)
Mwind
Mwind × (1.6/0.75)
Phase I: Group anchor bolt test
(a)
(b)
(c)
Phase II: Single anchor bolt test
52

Figure SR2
4.5 CFRP-RBased on the SR1 and S20-
en S20-CFRP by wrapping eight lay ft below the original grou
Figure 4.24 Due to the CFRP wrapping, the only
Specimen S20-CFRP was terminated due to t oment-rotation relationship and e that Specime ure was observed in this specimen. Figure 4.2 contact with
embedded head is indicated b Figure 4.26 also compression
and contacted the t ignificant as for Specimen e CRFP. Figure 4.27 shows that th ose to the stress level of 141 ksi at which thread stripping was observed, it can be concluded that Specimen S20-CFRP was close to
Specimen S20-CFRP had a total of twelve strain gauges attached to the CFRP, six on the extreme fiber of ach face of the retrofitted shaft (Figure 3.9). Distributions of circumferential (bursting) strain along the eight of the shaft for each direction of applied base moment are shown in Figure 4.28 and Figure 4.29. he direction of the applied moment and location of template are included in the figures.
train Gauges F1 to F6 experienced larger strains than B1 to B6, indicating that application of the first rge moment produced severe concrete cracks where anchor bolts were in tension. The readings of Strain
4.23(b) Anchor Bolt Stress-Rotation Response of Specimen S16-A
EPAIRED SPECIMEN (S20-CFRP) results of tests on the first series of ASR/DEF-damaged specimens (S16-A
ASR), the investigators decided to repair the 20-anchor bolt ASR/DEF-damaged Specimers of CFRP sheets around the concrete shaft, from the top surface to 5
nd level (Figure 3.9).
shows the damage sequence for repaired Specimen S20-CFRP. visible concrete cracks were a crack that formed on the top surface of the shaft and a flexural
crack that formed below the CFRP-wrapped (Figure 4.24). Testing ofhe stroke limit of the hydraulic actuator. Figure 4.25 shows the m
Figure 4.27 presents the anchor bolt stress-rotation relationship. These figures illustratn S20-CFRP had excellent performance. Concrete bearing fail
4(b) shows that the nuts on the bottom of the HMIP base plate were in the top surface of the drilled shaft, indicating anchor bolt movement. Concrete bearing failure under the
y the sudden drop in load capacity shown in Figure 4.25. illustrates that the base plate of the test setup tilted as the anchor bolts pushed down under
op concrete surface of the drilled shaft. The loss of capacity was not as s S20-ASR, however, probably due to the confinement provided by the applied maximum anchor bolt stress was close to 120 ksi. Because this is cl
failure.
ehT
Sla
-150
-120
-90
-60
-30
0
30
60
90
120
150
-3 -2 -1 0 1 2 3
Tension
Compression
f1
Phase II: Single anchor bolt test
Anc
hor B
olt S
tress
, f1 (
ksi)
Rotation (degree)
53

Gauges F1 to F6 also suggest that when the anchor bolts were in tension, the largest strains developed just above the bottom template as the concrete tended to burst due to wedging and tensile splitting. On the other hand, when the anchor bolts were in compression, the most severe strains developed just below the bottom template, as the concrete tended to burst in compression bearing.
The relationships of base moment versus strain for individual Strain Gauges B4, B5, F4 and F5 are also presented in Figure 4.30 and Figure 4.31. The relationship between strain and maximum moment for Strain Gauges F4 and F5 are presented in Figure 4.32 and Figure 4.33. These figures show that the transverse strain demands on the CFRP laminate are less than 0.002 up to applied moments of 4,000 ft-kips, beyond which they increase rapidly. Figure 4.32 and Figure 4.33 also illustrate that the maximum measured CFRP strain was less than 0.0045, much less than the design ultimate strain of 0.0085.
Figure 4.24 Damage Sequence for Specimen S20-CFRP
(a) Pram = 72 kips (b) Pram = 165 kips (c) After failure
54

Figure 4.25 Moment-Rotation Response of Specimen S20-CFRP
Figure 4.26 Compression Bearing Failure of Specimen S20-CFRP
5,000
-5,000
-4,000
-3,000
-2,000
-1,000
0
-3 -2 -1 0 1 2 3
Bas
e M
omen
t,
1,000
2,000
3,000
4,000
Mba
se (f
t-kip
)
Rotation (degree)
200
0
-40
-80
-120
-160
-200
Load
from
Act
uato
r,
160
120
80
40
Pra
m (k
ip)
Mwind
Mwind × (1.6/0.75)
(c)
(b)
(a)
Concrete bearing failure
55

Figure 4.27(a) Anchor Bolt Stress-Ro RP
Figur FRP
-150
-120
-90
-60
-30
0
30
60
90
120
150
-3 -2 -1 0 1 2 3
Anc
hor B
olt S
tress
, f2 (
ksi)
f2
Tension
Compression
Rotation (degree)
tation Response of Specimen S20-CF
-150
-120
-90
-60
-30
0
30
60
90
120
150
-3 -2 -1 0 1 2 3
Tension
Compression
f1
Anc
hor B
olt S
tress
, f1 (
ksi)
Rotation (degree)
e 4.27(b) Anchor Bolt Stress-Rotation Response of Specimen S20-C
56

Figure 4.28 Strain Distribution in CFRP under Positive Moment
-5
-4
-3
-2
-1
0
0 0.001 0.002 0.003 0.004 0.005
-5
-4
-3
-2
-1
0
0 0.001 0.002 0.003 0.004 0.005
Dis
tanc
e fro
m B
ase
(ft)
CFRP Strain
0
1
2
3
4
5
(c) Strain Reading from Gauges of F1 through F6
4,000 ft-kip
3,000 ft-kip2,000 ft-kip
3,500 ft-kip
Location of bottom template
B6 B5 B4 B3 B2
B1
F6 F5 F4 F3 F2
F1 0 ft1 ft2 ft3 ft4 ft5 ft
Dis
tanc
e fro
m B
ase
(ft)
CFRP Strain
(b) Strain Reading from Gauges of B1 through B6
3,000 ft-kip2,000 ft-kip
3,500 ft-kip4,000 ft-kip
Location of bottom template
0
1
2
3
4
5
(a) Locations of CFRP Strain Gauges
57

-5
-4
-3
-2
-1
0
0 0.001 0.002 0.003 0.004 0.005
-5
-4
-3
-2
-1
0
0 0.001 0.002 0.003 0.004 0.005
Dis
tanc
e fro
m B
ase
(ft)
CFRP Strain
0
1
2
3
4
5
(c) Strain Reading from Gauges of F1 through F6
4,500 ft-kip3,000 ft-kip
3,500 ft-kip
Location of bottom template
B6 B5 B4 B3 B2
B1
F6 F5 F4 F3 F2
F1 0 ft1 ft2 ft3 ft4 ft5 ft
Dis
tanc
e fro
m B
ase
(ft)
CFRP Strain
(b) Strain Reading from Gauges of B1 through B6
3,500 ft-kip3,000 ft-kip
4,000 ft-kip4,500 ft-kip
Location of bottom template
0
1
2
3
4
5
(a) Locations of CFRP Strain Gauges
4,000 ft-kip
Figure 4.29 Strain Distribution in CFRP under Negative Moment
58

Figure 4.30 Moment-Strain Relationship for CFRP Gauges B4 and F4
Fi 5
gure 4.31 Moment-Strain Relationship for CFRP Gauges B5 and F
-5,000
-4,000
-3,000
-2,000
-1,000
0
1,000
2,000
3,000
4,000
5,000
-0.001 0 0.001 0.002 0.003 0.004 0.005
-5,000
-4,000
-3,000
-2,000
-1,000
0
1,000
2,000
3,000
4,000
5,000
-0.001 0 0.001 0.002 0.003 0.004 0.005
Bas
e M
omen
t, M
base
(ft-k
ip)
CFRP Strain
B5
CFRP Strain
F5
(a) Gauge B5 (b) Gauge F5
Anchor bolt in tension
Anchor bolt in tension
-5,000
-4,000
-3,000
-2,000
-1,000
0
1,000
2,000
3,000
4,000
5,000
-0.001 0 0.001 0.002 0.003 0.004 0.005
Bas
e M
omen
t, M
base
(ft-k
ip)
CFRP Strain
B4
CFRP Strain
F4
-5,000
-4,000
-3,000
-2,000
-1,000
0
1,000
2,000
3,000
4,000
5,000
-0.001 0 0.001 0.002 0.003 0.004 0.005
Anchor bolt in tension
Anchor bolt in tension
(a) Gauge B4 (b) Gauge F4
59

Figure 4.32 Strain versus Maximum Moment for CFRP Gauge F4
Figure 4.33 Strain versus Maximum Moment for CFRP Gauge F5
0
0.001
0.002
0.003
0.004
0.005
0 1,000 2,000 3,000 4,000 5,000
CFR
P S
train
Max. Base Moment, M (ft-kip)
base
F5
Sudden increase in strains
0
0.001
0.002
0.003
0.004
0.005
0 1,000 2,000 3,000 4,000 5,000
CFR
P S
train
Max. Base Moment, Mbase (ft-kip)
F4
Sudden increase in strains
60

CHAPTER 5: EVALUATION OF TEST RESULTS
5.1 INTRODUCTION The prime objective of this research is to investigate the effect of ASR/DEF on the behavior of drilled shafts. To that purpose, the response of tested drilled shafts is compared in terms of normalized anchor bolt stress ( f2/√fc) versus rotation. Normalization of the anchor bolt stress with respect to √fc has been shown by Hasselwander et al. (1977) to satisfactorily account for variations in concrete strength. In addition, failure modes of anchor bolts observed during full-scale drilled shaft tests are discussed and design recommendations are made.
5.2 COMPARISON OF ANCHOR BOLT STRESS VERSUS ROTATION RELATIONSHIPS Figure 5.1 and Figure 5.2 show anchor bolt stress responses of 16- and 20-anchor bolt specimens, respectively. The anchor bolt stress at which thread stripping occurred in Specimen S16-ASR2 is included in the figures. For 16-anchor bolt specimens (Figure 5.1), the undamaged Specimen S16-Control had less capacity than the ASR/DEF-damaged specimens (S16-ASR1 and S16-ASR2). As discussed in Chapter 4, Specimen S16-Control had misaligned anchor bolts, which may have reduced the tensile capacity of the anchor bolts. Specimen S16-ASR1 was tested under cyclic loads, and Specimen S16-ASR2 (Phase I) was tested under monotonic load. Comparisons of the strength and stiffness of these specimens indicate that cyclic loading does not significantly affect the response of drilled shafts. Figure 5.2 illustrates that the difference of strengths between Specimen S20-Control and S20-ASR is negligible. Therefore, the effect of ASR/DEF damage may be insignificant on the performance of the 16- and 20-anchor bolt drilled shafts as strengths of the ASR/DEF-damaged specimens were in similar levels to control specimens.
The moment-rotation relationships of the tested specimens indicate that all except Specimen S20-ASR had sufficiently large safety factors to satisfy the requirements of ACI 318/ASCE 7. The concrete compressive strengths of these specimens varied from 6,120 psi to 7,730 psi, much higher than the specified design concrete compressive strength of 3,600 psi in the TxDOT Bridge Design Manual (2001). To estimate the anchor bolt capacities at the design concrete strength, the anchor bolt stresses were normalized by the ratio of the square root of the design concrete strength of 3600 psi, divided by square root of their actual tested strengths. Figure 5.3 and Figure 5.4 show the moment-rotation curves plotted using those normalized bolt stresses. The design wind-induced bolt stress, fwind, and the factored design wind-induced bolt stress including the strength reduction factor, fwind × (1.6/0.75), are also included in these figures. These figures show that all tested drilled shafts except Specimen S20-CFRP fall short of the factor of safety required by ACI 318/ASCE 7. Normalized stress-rotation curves are linear up to the design wind level.
61

Nor
mal
ized
Anc
hor B
olt S
tress
, t2
f 2
-2000
-1500
-1000
-500
0
500
1000
1500
2000
-3 -2 -1 0 1 2 3
Rotation (degrees)
Tension
Compression
f2
S16-Control
S16-ASR2
S16-ASR1
Stripping failure
Figure 5.1 Anchor Bolt Stress-Rotation Responses: 16-Anchor Bolt Specimens
Nor
mal
ized
Anc
hor B
olt S
tress
, t2
f 2
-2000
-1500
-1000
-500
0
500
1000
1500
2000
-3 -2 -1 0 1 2 3
Rotation (degrees)
f2
S20-Control
S20-CFRP
S20-ASR Tension
Compression
Stripping failure
Figure 5.2 Anchor Bolt Stress-Rotation Responses: 20-Anchor Bolt Specimens
62

Figure 5.3 Anchor Bolt Stress-Rotation Responses for Design Concrete Strength ( fc′ = 3,600 psi):
Figure 5.4 An
Anch
or B
olt S
tress
,
16-Anchor Bolt Specimens
chor Bolt Stress-Rotation Responses for Design Concrete Strength ( fc′ = 3,600 psi): 20-Anchor Bolt Specimens
× f c
3,60
0 ps
i t 1
(ksi
) t 2 f 2
-120
-100
-80
-60
-40
-20
0
20
40
60
80
100
120
-3 -2 -1 0 1 2 3
Rotation (degrees)
S20-ASR
S20-CFRPS20-Control
fwind × (1.6/0.75)
fwind
Anch
or B
olt S
tress
,
× f c
3,60
0 ps
i t 1
(ksi
) t 2 f 2
-120
-100
-80
-60
-40
-20
0
20
40
60
80
100
120
-3 -2 -1 0 1 2 3
S16-Control
S16-ASR2
Rotation (degrees)
S16-ASR1
fwind × (1.6/0.75)
fwind
63
5.3 MODES OF FAILURE OF ANCHOR BOLTS Two different failure modes of anchor bolts were observed in the tested specimens: side-face blowout failure of the tension-side anchors in all specimens under tension except Specimen S20-CFRP; and bearing failure of concrete under the heads of the compression-side anchors in Specimens S16-ASR1, S20-ASR and S20-CFRP.
Hasselwander et al. (1977) report that the load-transfer mechanism of a near-edge and deep embedded anchor bolt follows the sequence of steel-to-concrete bond; bearing against the washer of the anchor head; wedging of a cone of crushed and compacted concrete in front of the anchor head; and failure by wedge splitting of a cone of crushed and compacted concrete in front of the washer. Washers were used as with the anchor heads in the tests of Hasselwander et al. In contrast, the TxDOT Bridge Design Manual (2001) requires a template to prevent anchor bolts from floating during concrete placement (Figure 3.2). The use of a template increases the bearing area for wedging action, which may increase the tensile capacity of anchor bolts. Jirsa et al. (1984) examined the tensile capacity of two anchor bolts in a 42-in. diameter drilled shaft with a circular steel plate as the anchorage device. They observed a large increase in the tensile capacity of the anchor bolts, indicating that the template increased the effective bearing area. This is discussed in more detail in Chapter 6.
Full-scale test results of drilled shafts showed splitting tensile cracks propagating from the template to the spirals, as illustrated in Figure 5.5. These inclined splitting tensile cracks and compression concrete struts had not been observed in previous tests of deep anchor bolt group (Hasselwander et al. 1974; Calzadilla 1982; and Jirsa et al. 1984). Figure 5.6 illustrates the progression of damage and the internal stresses for this failure mode. As the template provided an effective means of anchorage under tension loads, large bearing stresses were developed and transferred from the template to neighboring longitudinal reinforcements through concrete and spirals. Finally, the splitting tensile cracks developed due to these large compressive stresses and resulted in inclined cracks from the template to spirals (Figure 5.6(b)).
In contrast, concrete bearing failure below the template was observed in ASR/DEF-damaged specimens (S16-ASR1, S20-ASR and S20-CFRP). Because nuts were only placed below the template and were tack-welded to the template, the template did not act with the anchor nuts under compression loads. As a result, the bearing area was limited to the cross-sectional areas of nuts and anchor bolts. As only a small bearing area was provided for compression loads, large bearing stresses developed in the concrete below the template, leading to concrete bearing failure. Once concrete bearing failure started, the affected compression-loaded anchor bolt slipped downward, as shown in Figure 5.7 and Figure 5.8, leading to a loss of strength. The anchor bolt continued to slip until the nut started to bear against the top concrete surface of drilled shaft, which provided additional bearing area (Figure 5.8(b)) and led to a recovery of bearing strength.
64

Inclined cracks
Figure 5.5 Concrete Side-Face Blowout Failure
(a) Wedging Failure (b) Side-Face Blowout Failure
Bottom template
Figure 5.6 Tensile Failure of Anchor Bolt
65

Figure 5.7 Contact of Nuts with Top Surface of Drilled Shaft
Secondary bearing after slippage of anchor bolt
(b) Contact of Nut with Concrete Surface
(a) Bearing Failure
Figure 5.8 Compressive Failure of Anchor Bolt
66

5.4 DESIGN IMPLICATIONS OF OBSERVED BEHAVIOR OF DEEP ANCHOR BOLTS IN HMIP DRILLED SHAFT FOUNDATIONS
5.4.1 Design Implications for Tension-Loaded Anchors Tensile loads acting on deep anchor bolts in HMIP shafts are transferred to the longitudinal bars in the shaft through the following sequence: from the anchor nut and template, to the concrete between the anchor bolt and the surrounding spirals, and then to the longitudinal bars. This load-transfer mechanism is related to that of a non-contact tension splice (Figure 5.9). As shown in Figure 5.9(a), bond forces develop approximately uniformly along the splice length, and are transferred between the spliced bars through compression struts between the bars. As bond stresses become more uniform over the splice length, the corresponding concrete strut forces also become more uniform. Since the transverse reinforcement confines the concrete, it can increase the load transfer capacity or reduce the required splice length for a given required capacity.
In deep anchor bolts, however, bond stresses are not distributed uniformly along the length of the anchor. Steel-to-concrete bond is present only in very early stages of loading; as bond is lost along the anchor bolt, the load is transferred entirely by bearing against the template and by wedging action of the cone of concrete ahead of the template. As a result, the compression struts are directed from the template to the surrounding spirals. Large compressive stresses are transferred through the concrete near the template. These high stresses can exist only if the struts are confined by closely spaced transverse reinforcement in the shaft. This load-transfer mechanism suggests several potential design improvements:
(1) increase the amount of spiral reinforcement; (2) increase the number of longitudinal bars; and (3) increase the diameter of the drilled shaft
Increasing the amount of spiral reinforcement and the number of longitudinal bars are effective because they increase concrete confinement. For a given diameter of HMIP, increasing the diameter of the drilled shaft increases the anchor edge distance increases, and therefore the concrete side-face blowout strength. Since the local transfer from anchor bolts to deformed bars is different than that seen in non-contact tension splices, and to me more prudent, these potential design improvements should be verified by testing.
67

(a) Reinforcing bars (b) Anchor Bolt and Reinforcing bar
Figure 5.9 Load Transfer Mechanisms
5.4.2 Design Implications for Compression-Loaded Anchors Compression bearing failures were observed for several specimens (S16-ASR1, S20-ASR and S20-CFRP) due to the relatively small bearing area for compression compared with tension. The difference in bearing area is caused by the fact that in the current design, nuts are placed only below the template, not above it. When the anchor bolts are in compression, their downward movement can not be restrained by the template. Therefore, double nuts should be used to increase compression bearing capacity, as shown in Figure 5.10.
Figure 5.10 Double Nuts
68

5.5 CONCLUDING REMARKS REGA
The evaluation of experimental results presented in this chapter indicates that the ASR/DEF damage in drilled shafts does not cause significant loss of anchor bolt tensile capacity. Compression bearing failures
mbination of the lack
RDING TEST RESULTS
did occur in Specimens S16-ASR1, S20-ASR and S20-CFRP, however, due to a coof double nuts and the ASR/DEF damage. Related to the concrete side-face blowout failure, inclined concrete cracks were observed. The load-transfer mechanism between anchor bolts and longitudinal bars was investigated. Finally, some improvements are suggested to the current TxDOT design for drilled shafts.
69

CHAPTER 6: DESIGN PROVISIONS FOR DEEP ANCHOR BOLTS
6.1 INTRODUCTION In this chapter, current design equations for predicting the tensile strength of deep anchor bolts are presented. Capacities predicted by the design equations of the TxDOT Bridge Design Manual (2001) and ACI 318-05 are compared with the experimentally obtained values. Several methods for calculating effective bearing area are examined, and suggestions are made to improve the accuracy of those calculations. Suggestions are made for improving the side-face blowout provisions of ACI 318-05.
6.2 TXDOT BRIDGE DESIGN MANUAL (2001) The anchor bolt design provisions of Section 12 in Chapter 9 of the TxDOT Bridge Design Manual (2001) refer to the design equation proposed by Jirsa et al. (1984), repeated here as Eq. (6.1), to calculate the tensile capacity of anchor bolt groups with deep embedment. This equation relates tensile strength to clear concrete cover and anchor bolt spacing.
2140 0.7 lnn b c s smw
CT A f K AD D
⎡ ⎤⎛ ⎞′= + ≤⎢ ⎥⎜ ⎟−⎢ ⎥⎝ ⎠⎣ ⎦yf (lbs) Eq. (6.1)
where Ab = net bearing area (in.2), calculated as π/4 × (Dw2 − D2) and not greater than 4D2
Asm = mean tensile area of anchor bolt (in.2) D = bolt diameter (in.) Dw = diameter (in.) of the washer or anchor plate, where a continuous template or anchor
plate is used for a group of anchor bolts. The washer diameter may be taken as the diameter of a circle concentric with the bolt and inscribed within the template or anchor plate. Dw shall not be taken greater than 8 times the thickness of the washer, plate or template.
C = clear cover to bolt (in.) Ks = spacing reduction factor (or grouping factor) = 0.02S+0.40 ≤ 1.0 S = center-to-center bolt spacing (in.) fc′ = concrete compressive strength (psi) fy = yield strength of the bolt material (psi)
TxDOT Standard Design Details (1986 and 1998) for HMIP foundations, shown in Chapter 2, specify the use of a template instead of washers. The TxDOT Bridge Design Manual (2001) recognizes that the use of a template instead of washers increases the tension capacity, but this beneficial effect is ignored by Eq. (6.1). In other words, in calculating the net bearing area, Ab, the template is treated like a washer with a diameter of Dw . To study the increase in tensile strength due to the template, Jirsa et al. (1984) tested a two-bolt group in a 42-in. diameter drilled shaft. They found that the actual tensile strength could be 85% larger than the predicted capacity from Eq. (6.1) when the net bearing area is defined as π/4 × (Dw
2 − D2).
This large underestimation of the tension capacity indicates that the net bearing area provided by the template is greater than the specified net bearing area of π/4 × (Dw
2 − D2).
To better estimate the tensile strength of a deep anchor bolt in HMIP foundations as governed by bearing of the anchor head plus a template, various possible ways of including the net bearing area of the template are examined (Figure 6.1). Three bearing areas are considered: (a) a circle with a diameter of template width, Dw ; (b) a square with a template width, Dw ; and (c) a rectangular area with bolt spacing, s, and template width, Dw . The predicted tensile capacities of an anchor bolt in a group using each possible net bearing area are compared with the experimental values, as shown in Table 6.1. When the definition of
70

net bearing area in the TxDOT Bridge Design Manual (2001) is used with Eq. (6.1), the ratio of the observed capacity to the predicted capacity varies from 1.27 to 1.85, as shown in Case (a) of Table 6.1. The average ratio is 1.64. This suggests that the net bearing area expression in the TxDOT Bridge Design Manual (2001) underestimates tensile capacity significantly, which is consistent with the conclusion of Jirsa et al. (1984). The ratio of the observed capacity to the predicted capacity is much smaller for Specimen S16-Control than for the other specimens, due to the misalignment of anchor bolts in that specimen.
When a net bearing area based on a square area with a width of Dw is used, which is Case (b) in Table 6.1, better estimates result. The ratios of observed to predicted capacity vary between 0.93 and 1.36, giving the average ratio of 1.20. CEB (1994) reported that for bearing failures, the 5% fractile (90% probability) of the failure loads could be derived as 0.77∼0.81 times the average failure loads. Based on this observation, CEB recommends design bearing capacities of 0.8 times the average failure loads.
(a) Ab = π/4 × (Dw2
– D2) (b) Ab ≈Dw2 − π/4⋅D2 (c) Ab ≈ Dw⋅s − π/4⋅D2
Dw
D
Dw
s
Figure 6.1 Possible Ways of Computing Effective Bearing Area for Design Purposes
Table 6.1 Comparison of Observed and Predicted Tensile Capacities using Eq. (6.1)
Ab = π/4 × (Dw2 – D2)*
(a) Ab = Dw
2 − π/4⋅D2
(b) Ab = Dw⋅s − π/4⋅D2
(c) Specimen fc (psi)
Texp (kip) Tn
(kip) Texp / TnTn
(kip) Texp / TnTn
(kip) Texp / Tn
S16-Control 7,130 267 211 1.27 288 0.93 586 0.46 S16-ASR1 5,460 309 184 1.68 252 1.23 513 0.60 S16-ASR2 5,860 354 191 1.85 261 1.36 531 0.67
S20-Control 7,570 319 186 1.72 254 1.26 446 0.72 S20-ASR 5,200 257 154 1.67 211 1.22 369 0.70
Average 1.64 Average 1.20 Average 0.63 *: Bridge Design Manual (2001) uses expression (a) in calculating the net bearing area.
71

According to the CEB recommendation, the appropriate ratio of the observed capacity to the predicted capacity for design purpose is 1.25 (=1/0.85). Even though the obtained average ratio of 1.20 from the Case (b) in Table 6.1 is slightly less than the CEB-recommended value of 1.25, the use of the net bearing area for the template as (Dw
2 − π/4⋅D2) provides an accurate prediction of anchor bolt capacity. The use of the Case (c) with Eq. (6.1) significantly overestimates the tension capacity of anchor bolts.
6.3 ACI 318-05 APPENDIX D For the anchor bolts used in HMIP foundations, tensile capacity is probably governed by concrete side-face blowout capacity, because of long embedment length, small concrete cover, large amount of longitudinal reinforcement, spirals and large size of anchor bolts. For a single headed anchor with deep embedment close to an edge (ca1 < 0.4hef), the nominal side-face blowout strength, Nsb, is expressed in ACI 318-05 Appendix D as:
1160 ′=sb a brg cN c A f Eq. (6.2) (D-17) in ACI 318-05
where: ca1 = minimum edge distance from the center of anchor bolt to the edge of concrete (in.) hef = effective embedment length of anchor bolt (in.) Abrg = bearing area of the head of stub or anchor bolt (in.2) fc′ = concrete compressive strength (psi)
A modification factor of (1+ ca2/ca1)/4 is applied if ca2 < 3ca1 , where ca2 is the distance from the center of the anchor bolt to the edge of concrete in the direction perpendicular to ca1 . For multiple anchors with ca1 < 0.4hef , the nominal side-face blowout strength of the group of anchors is calculated as:
11
6⎛ ⎞
= +⎜ ⎟⎝ ⎠
sbg sba
sN Nc
Eq. (6.3) (D-18) in ACI 318-05
where s is spacing of the outer anchors and Nsb is obtained from Eq. (6.2) without the modification factor.
Examination of Eq. (6.2) shows that the bearing area, Abrg , is defined as the bearing area of the “head” of the stud or anchor bolt, or the bearing area of a nut on a threaded rod. The possible existence of a template (or washer) is ignored in computing bearing strength in ACI 318-05. In addition, Eq. (6.3) indicates that the side-face blowout strength of the group of anchors is estimated in ACI 318-05 by multiplying the side-face blowout strength of a single anchor, Nsb, with a group factor (1+ s/6ca1), which is independent of the number of anchors in the group. In Table 6.2, experimentally observed side-face blowout capacities are compared with the capacities predicted by ACI 318-05. Since the number of anchors is not taken into account in ACI 318-05, the calculated side-face blowout strength of each anchor bolt in the group is taken as the group strength, Nsbg , divided by three.
Table 6.2 Comparison of Observed and Predicted Tensile Capacities as Governed by Side-Face Blowout (ACI 318-05, Appendix D)
Specimen fc (psi)
Texp (kip)
Nsb(kip)
Nsbg(kip)
Nsbg/3 (kip) Texp / (Nsbg/3)
S16-Control 7,130 267 377 435 145 1.84 S16-ASR1 5,460 309 330 380 127 2.43 S16-ASR2 5,860 354 342 394 131 2.70
S20-Control 7,570 319 302 354 118 2.70 S20-ASR 5,200 257 251 294 98 2.62
Average 2.46
72

As shown in Table 6.2, ACI 318-05 Appendix D significantly underestimates the tensile strength of deep anchor bolts in drilled shafts, as governed by side-face blowout. Ratios of observed to predicted capacities range from 1.84 to 2.70.
6.4 PROPOSED MODIFICATION TO SIDE-FACE BLOWOUT PROVISIONS OF ACI 318-05 FOR DRILLED SHAFTS
As shown above, the ACI 318-05 provisions for side-face blowout strength for a group of tensile anchor bolts are independent of the number of anchor bolts in the group and provide estimates that are quite conservative. In addition, they do not address the beneficial effect of a template on pullout strength.
In the current ACI 318-05 provisions for a single anchor bolt, side-face blowout strength is calculated using a modification factor (1+ ca2/ca1)/4 to include the effects of edge distances in two perpendicular directions (Figure 6.2(a)). Based on this observation, it is suggested that one could assume that the concrete section is divided for design purposes into discrete blocks extending halfway between each anchor bolt (Figure 6.2(b)). Using this design assumption, ca2 is s/2, where s is the bolt spacing. The side-face blowout capacity for a single anchor bolt (Eq. (6.2)), including the effect of the modification factor (1+ ca2/ca1)/4, with ca2 is s/2, can then be used to predict the tensile capacity of a single anchor bolt in a group. This modification factor of (1+ ca2/ca1)/4 would be equivalent to the spacing reduction factor, Ks , of the TxDOT Bridge Design Manual (2001).
Using this proposed modification to the calculation of ca2 , the various possible bearing areas shown in Figure 6.1 are examined. Table 6.3 shows the estimated tensile strengths of anchor bolts using the proposed method and the ratio of the observed to the estimated capacity. The bearing area as a rectangular area with bolt spacing, s, and template width, Dw , provides an average ratio of 1.47, which is larger than the CEB-recommended ratio (5% fractile, 90% probability) is 1.25. Using the proposed modification to the group blowout provisions of ACI 318-05, Case (a) (template area equal to head area) is very conservative. Cases (b) and (c) from Figure 6.1 are more accurate and still sufficiently conservative.
ca1 ca1
ca2
ca2 = s/2
s
s
(a) ACI 318-05 (b) Proposed Modification to ACI 318-05
Figure 6.2 Proposed Modified Definition of ca2
73

Table 6.3 Comparison of Observed and Predicted Tensile Capacities using Proposed Modification to the Definition of ca2 in ACI 318-05 Appendix D
Ab = π/4 × (Dw2 – D2)
Case (a) Ab = Dw
2 − π/4⋅D2
Case (b) Ab = Dw⋅s − π/4⋅D2
Case (c) Specimen fc (psi)
Texp (kip) Nsb*
(kip) Texp / Nsb*Nsb* (kip) Texp / Nsb* Nsb*
(kip) Texp / Nsb*
S16-Control 7,130 267 153 1.75 179 1.49 255 1.05 S16-ASR1 5,460 309 134 2.31 156 1.98 223 1.39 S16-ASR2 5,860 354 139 2.55 162 2.19 231 1.53
S20-Control 7,570 319 128 2.49 149 2.14 197 1.62 S20-ASR 5,200 257 106 2.42 124 2.07 164 1.57
Average 2.30 Average 1.97 Average 1.43 *: The modification factor of (1+ca2/ca1)/4 is included, using ca2 as shown in Figure 6.2(b).
6.5 CONCLUDING REMARKS REGARDING ANCHOR-DESIGN PROVISIONS In this chapter, the anchor-design provisions of TxDOT Bridge Design Manual (2001) and ACI 318-05 are examined. The comparison of the observed capacity with that predicted by design equations shows that current design provisions significantly underestimate the anchor bolt capacity of drilled shaft. Current design provisions do not consider the increase in effective bearing area provided by a template. In addition, ACI 318-05 design expressions do not properly address the side-face blowout capacity of anchor bolts in drilled shafts.
Various ways of including the template in the bearing area were examined and a modified design method for ACI 318-05 side-face blowout provisions was proposed. From the comparison of various bearing areas, Case (b) of Figure 6.1 is suggested for use with the equation of the TxDOT Bridge Design Manual (2001), and Case (c) of Figure 6.1 is suggested for use with the modified procedures of ACI 318-05.
74

CHAPTER 7: CALCULATION OF DESIGN WIND LOADS FOR HMIPS
7.1 INTRODUCTION Wind is the most critical design load for HMIP foundations. The 2001 AASHTO Standard Specifications for Structural Supports for Highway Signs, Luminaires, and Traffic Signals provides minimum requirements for calculating design wind load for supports for highway signs, luminaries, and traffic signals. The AASHTO Specifications (2001) permit the use of ANSI/ASCE 7-95 (Minimum Design Loads for Buildings and Other Structures) in estimating wind loads as alternative method. The ANSI/ASCE 7-95 has been replaced by ASCE 7 in 1998, and most recently, by ASCE 7-05. In this chapter, the wind-load provisions of the 2001 AASHTO Specifications (2001) and ASCE 7-05 are discussed in the context of HMIP foundations.
7.2 CALCULATION OF DESIGN WIND LOADS BY THE AASHTO SPECIFICATIONS (2001) The AASHTO Specifications (2001) requires that design wind loads for luminaire support structures exceeding 49.2 ft in height be based on a design life of at least 50 years. The AASHTO Specifications (2001) provide the following simple procedure to calculate design wind loads to avoid the need for explicit computation of the effects of the dynamic response of the HMIP to wind.
7.2.1 Wind Pressure The design wind pressure is calculated using the following equation:
20.00256z z rP K GV= dI C (psf) Eq. (7.1) Eq.3-1 in AASHTO (2001)
where Kz = height and exposure factor G = gust effect factor V = basic design wind speed from wind speed map Ir = wind Importance factor Cd = wind drag coefficient
7.2.2 Gust Effect Factor (G) The gust effect factor is intended to correct the effective velocity pressure for the dynamic interaction of the structure with the wind gusts. ANSI/ASCE 7-95 states that if the fundamental frequency of a structure is less than 1 Hz or if the ratio of the height to least horizontal dimension is greater than 4, the structure should be designed as a wind-sensitive structure. The ANSI/ASCE 7-95 requires special procedures for the calculation of the gust effect factor for wind-sensitive structures. The ANSI/ASCE 7-95 gust effect factor can be greater than or less than unity, depending on the dynamic characteristics of the structure.
By this logic, virtually all structures covered by the AASHTO Specifications (2001) should be classified as wind-sensitive structures. For simplicity, however, this is not required. The AASHTO Specifications (2001) simplify the special procedures of ANSI/ASCE 7-95 for the following reasons (AASHTO Commentary 3.8.5):
The problem is that the use of the calculation of the gust effect calculation procedure presented in ANSI/ASCE 7-95 for wind-sensitive structures would significantly complicate these Specifications. The ANSI/ASCE 7-95 calculation procedure requires reasonable estimates of critical factors such as the damping and fundamental frequency of the structure. These factors are site and structure dependent. Relative small errors in the estimation of these factors result in significant variations in the calculated gust effect factor. Therefore, even though sign, luminaire, and traffic signal support structures are wind-
75

sensitive, the benefits of using the ANSI/ASCE 7-95 gust effect factor calculation procedure do not outweigh the complexities and confusion introduced by its use.
The AASHTO Specifications (2001) require the gust effect factor (G) to be at least 1.14. As explained in Section 3.8.5 of the AASHTO Commentary, this gust effect factor, which is intended for use with 3-second gust wind speeds, is derived from the fastest-mile gust coefficient of 1.3 in the 1994 AASHTO Specifications. The design wind pressure expression in the 1994 AASHTO Specifications is shown in the following:
( )20.00256 1.3 d hP V= C C
f
(psf) Eq. (7.2)
where P = wind pressure V = fastest mile wind speed Cd = drag coefficient Ch = coefficient for height above ground
The fastest-mile gust coefficient in the 1995 AASHTO Specifications is related to the wind speed, V, while the gust effect factor, G, in the 2001 AASHTO Specifications is related to square of wind speed, V2. As the 3-second gust wind speed is approximately equal to 1.21 times of the fastest-mile wind speed, an equivalent gust coefficient for the 3-second wind speed will be 1.07. The corresponding gust effect factor, G, is then taken as the square of that value, or 1.14. The AASHTO Specifications (2001) also allows the gust effect calculation procedure for flexible or dynamically sensitive structures of ANSI/ASCE 7-95.
7.2.3 Drag Coefficient (Cd) The drag coefficient for wind in the AASHTO Specifications (2001) varies from 0.45 to 1.70, depending on the radius and shape of the object and the wind speed. Accordingly, the drag coefficients of 8-sided and 12-sided HIMP are 1.20 and 0.79, respectively.
7.2.4 Design Wind Loads The AASHTO Specifications (2001) require determination of design wind loads based on the cross-sectional areas. The design wind loads for HMIP foundation can be calculated by the following equation:
l zW P A= (lb) Eq. (7.3)
where Pz = design wind pressure from Eq. (7.1) Af = projected area normal to the wind
7.3 CALCULATION OF DESIGN WIND LOADS BY ASCE 7-05 The wind-load provisions of ASCE 7-05 provide three procedures for calculating design wind loads: the simplified procedure; the analytical procedure; and the wind-tunnel procedure. For high-rise structures such as HMIP, either the analytical procedure or the wind-tunnel procedure is permitted to be used. The analytical procedure is summarized here.
7.3.1 Wind Pressure According to ASCE 7-05, the velocity pressure is evaluated at a height z by the following equation:
20.00256z z ztq K K K= dV I (psf) Eq. (7.4) (6-15) in ASCE 7-05
where Kz = velocity pressure exposure coefficient Kzt = topographic factor Kd = wind directionality factor V = basic design wind speed from wind speed map I = wind importance factor
76

7.3.2 Design Wind Loads The design wind force for chimneys, tanks, rooftop equipment, open signs, lattice frameworks, trussed towers and similar structures can be determined by the following equation:
z f fF q GC A= (lb) Eq. (7.5) (6-28) in ASCE 7-05
where qz = velocity pressure from Eq. (7.4) G = gust-effect factor from Eq. (7.6) Cf = force coefficient Af = projected area normal to the wind
7.3.3 Gust Effect Factor (G) by ASCE 7-05 For flexible or dynamically sensitive structures, whose fundamental natural frequency is less than 1 Hz, the gust-effect factor, Gf, can be calculated by Eq. (7.6).
2 2 2 21 1.70.925
1 1.7z Q R
fv z
I g Q g RG
g I
⎛ ⎞+ +⎜ ⎟=⎜ +⎝
⎟⎠
Eq. (7.6) (6-8) in ASCE 7-05
(6-9) in ASCE 7-05
(6-5) in ASCE 7-05
(6-6) in ASCE 7-05
(6-10) in ASCE 7-05
(6-11) in ASCE 7-05
(6-12) in ASCE 7-05
(6-13) in ASCE 7-05
where 3.4Q vg g= =
11
0.5772ln(3,600 )2ln(3,600 )Rg n
n= +
1/ 633
zI cz
⎛ ⎞= ⎜ ⎟⎝ ⎠
at which z = equivalent height of the structure defined as 0.6h, but not less than zmin for all building heights h.
0.63
1
1 0.63z
QB h
L
=⎛ ⎞+
+ ⎜ ⎟⎝ ⎠
resonant responsefactor
1 (0.53 0.47 )n h B L
R
R R R R
=
= +β
damping ratio,percent of criticalβ =
15/ 3
1
7.47(1 10.3 )n
NRN
=+
11
z
z
n LNV
=
2
2
1 1 (1 ) for 02
1 f
lR e− η= − − η >η η
= ηor 0=
At which the subscript l in the expression of Rl shall be taken as h, B and L, respectively, where h, B and L are defined as following:
77

1
1
1
1
building naturalfrequency4.6setting
4.6setting
15.4setting
=
= η =
= η =
= η =
l hz
l Bz
l Lz
nn hR R
Vn BR R
Vn LR R
V
mean hourly windspeed (ft/s)at height determinedas:
33
α
=
⎛ ⎞= ⎜ ⎟⎝ ⎠
zV z
zb V
(6-14) in ASCE 7-05
Examination of Eq. (7.6) indicates that the ASCE 7 gust-effect factor for flexural structures, Gf , is a function of the structure’s fundamental natural frequency and its equivalent viscous damping ratio. The Commentary (C6.5.7) to ASCE 7-05 provides simple equations to estimate the natural frequency for cantilevered masts or poles of uniform cross-section and cantilevered, tapered, circular poles as follows:
For cantilevered masts or poles of uniform cross-section,
1 2
0.56 EInh m
= Eq. (7.7)
(C6-22a) in ASCE 7-05
where EI = bending stiffness of the section m = mass/unit height h = height
An approximate formula for cantilevered, tapered, circular poles,
1 22EIn
h mλ
≈π
Eq. (7.8)
(C6-22b) in ASCE 7-05
where EI, m = same as defined in Eq. (7.7)
λ = 0.666
4 6.651.9exp
0.9
t
b t
b
dd e
e
⎛ ⎞−+⎜ ⎟
⎛ ⎞⎝ ⎠+ ⎜ ⎟⎝ ⎠
dt, db = external diameter at the tip and base, respectively et, eb = wall thickness at the tip and base, respectively
The Commentary to ASCE 7-05 (C.6.5.7) has the following remarks on selection of a damping ratio:
In wind applications, damping ratios of 1 percent and 2 percent are typically used in the United States for steel and concrete buildings at serviceability levels, respectively, while ISO suggests 1 percent and 1.5 percent for steel and concrete, respectively. Damping values for steel support structures for signs, chimneys, and towers may be much lower than buildings and may fall in the range of 0.15 percent to 0.5 percent. ⋅⋅⋅⋅⋅⋅ Note that damping levels used in wind load applications are smaller than the 5 percent damping ratios common in seismic applications because buildings subjected to wind loads respond essentially elastic while buildings subjected to design level earthquakes respond inelastically at higher damping levels.
78
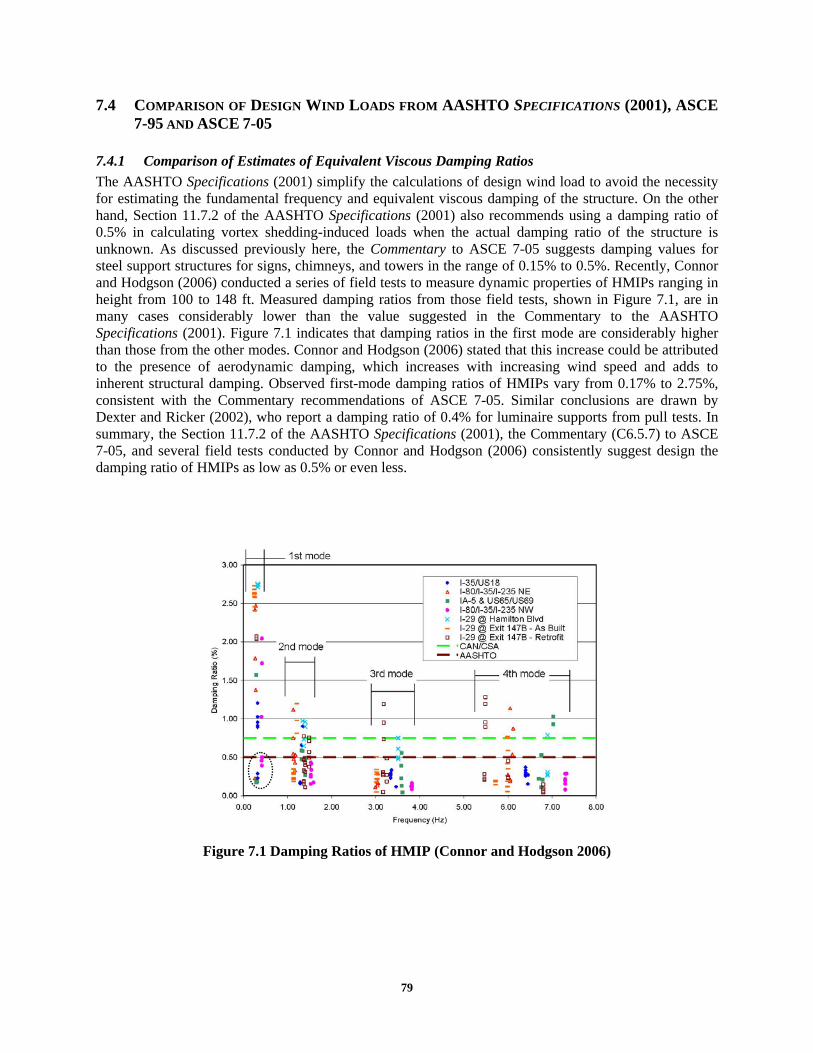
7.4 COMPARISON OF DESIGN WIND LOADS FROM AASHTO SPECIFICATIONS (2001), ASCE 7-95 AND ASCE 7-05
7.4.1 Comparison of Estimates of Equivalent Viscous Damping Ratios The AASHTO Specifications (2001) simplify the calculations of design wind load to avoid the necessity for estimating the fundamental frequency and equivalent viscous damping of the structure. On the other hand, Section 11.7.2 of the AASHTO Specifications (2001) also recommends using a damping ratio of 0.5% in calculating vortex shedding-induced loads when the actual damping ratio of the structure is unknown. As discussed previously here, the Commentary to ASCE 7-05 suggests damping values for steel support structures for signs, chimneys, and towers in the range of 0.15% to 0.5%. Recently, Connor and Hodgson (2006) conducted a series of field tests to measure dynamic properties of HMIPs ranging in height from 100 to 148 ft. Measured damping ratios from those field tests, shown in Figure 7.1, are in many cases considerably lower than the value suggested in the Commentary to the AASHTO Specifications (2001). Figure 7.1 indicates that damping ratios in the first mode are considerably higher than those from the other modes. Connor and Hodgson (2006) stated that this increase could be attributed to the presence of aerodynamic damping, which increases with increasing wind speed and adds to inherent structural damping. Observed first-mode damping ratios of HMIPs vary from 0.17% to 2.75%, consistent with the Commentary recommendations of ASCE 7-05. Similar conclusions are drawn by Dexter and Ricker (2002), who report a damping ratio of 0.4% for luminaire supports from pull tests. In summary, the Section 11.7.2 of the AASHTO Specifications (2001), the Commentary (C6.5.7) to ASCE 7-05, and several field tests conducted by Connor and Hodgson (2006) consistently suggest design the damping ratio of HMIPs as low as 0.5% or even less.
Figure 7.1 Damping Ratios of HMIP (Connor and Hodgson 2006)
79

7.4.2 Comparison of Design Base Moments from Wind by Different Design Standards To examine the implications of different available documents for calculating design wind loads, wind load-induced design base moments for HMIP foundations are calculated and compared in this section. In Table 7.1 are shown design base moments calculated according to the AASHTO Specifications (2001) for various HMIP foundations. A large difference in design base moments exists between 8-sided and 12-sided HMIPs, because of the different values for drag coefficient in the AASHTO Specifications (2001) depending on the shape of the cross-section of the HMIP.
Table 7.1 Wind-Induced Design Base Moment for HMIP Foundation: AASHTO Specifications (2001)
Design Base Moment for HMIP Foundation (ft-kip) Height of HMIP
8-sided 12-sided 150 ft 1,731 1,310 175 ft 2,435 1,805
In Figure 7.2 and Figure 7.3, the same values are presented for ASCE 7-05. That document requires the fundamental natural frequency and equivalent viscous damping ratio of the HMIP. In this report, the natural frequencies are estimated using SAP2000 (2005), and design base moments are calculated for various damping ratios. The ASCE 7 calculations are carried out using an importance factor of 1.0 and Exposure Category B. Using the same fundamental natural frequency, equivalent viscous damping ratio, importance factor and exposure category, wind-induced base moments are also estimated according to ASCE 7-95 and included in these figures. Finally, the figures also include the design load from the AASHTO Specifications (2001).
0
1,000
2,000
3,000
4,000
5,000
6,000
7,000
0 0.5 1 1.5
Bas
e M
omen
t, M
base
(ft-k
ip)
Damping Ratio (%)
2
AASHTO (2001)
ASCE 7-05 commentary recommended damping values
ASCE 7-95
ASCE 7-05
Figure 7.2 Wind-Induced Design Base Moments for 150-ft, 8-Sided HMIP (ASCE 7)
80
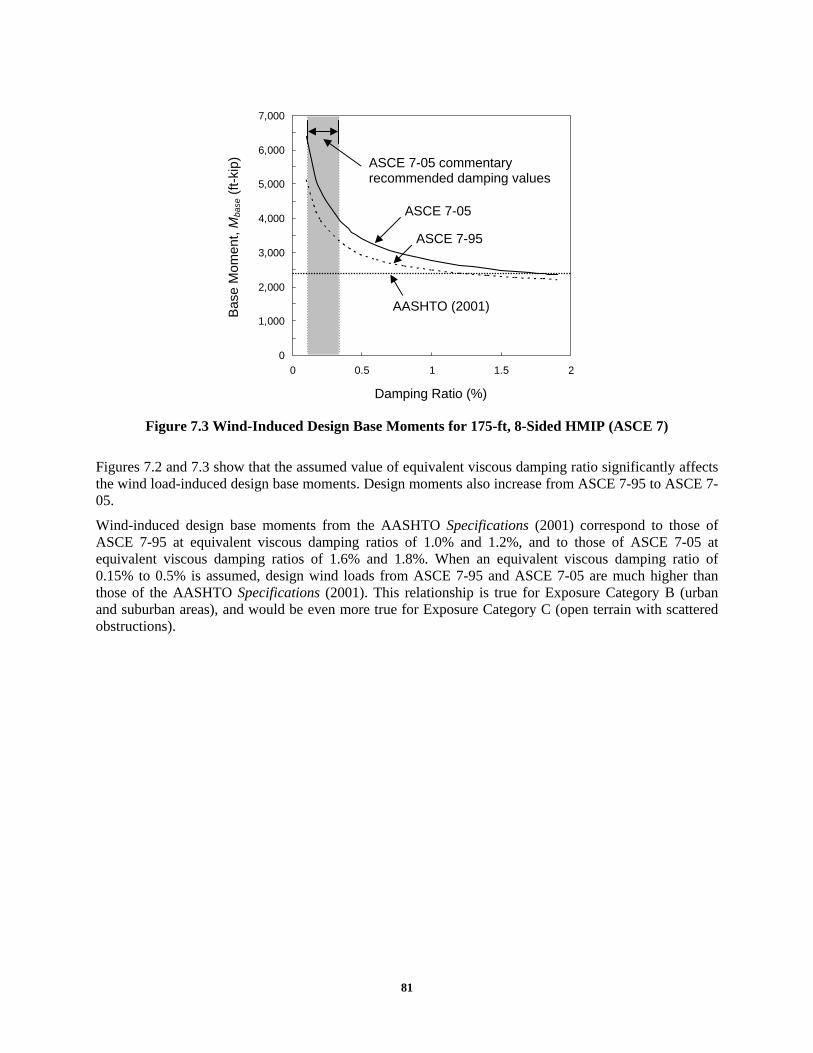
0
1,000
2,000
3,000
4,000
5,000
6,000
7,000
0 0.5 1 1.5
Bas
e M
omen
t, M
base
(ft-k
ip)
Damping Ratio (%)
2
AASHTO (2001)
ASCE 7-05 commentary recommended damping values
ASCE 7-95
ASCE 7-05
Figure 7.3 Wind-Induced Design Base Moments for 175-ft, 8-Sided HMIP (ASCE 7)
Figures 7.2 and 7.3 show that the assumed value of equivalent viscous damping ratio significantly affects the wind load-induced design base moments. Design moments also increase from ASCE 7-95 to ASCE 7-05.
Wind-induced design base moments from the AASHTO Specifications (2001) correspond to those of ASCE 7-95 at equivalent viscous damping ratios of 1.0% and 1.2%, and to those of ASCE 7-05 at equivalent viscous damping ratios of 1.6% and 1.8%. When an equivalent viscous damping ratio of 0.15% to 0.5% is assumed, design wind loads from ASCE 7-95 and ASCE 7-05 are much higher than those of the AASHTO Specifications (2001). This relationship is true for Exposure Category B (urban and suburban areas), and would be even more true for Exposure Category C (open terrain with scattered obstructions).
81

CHAPTER 8: SUMMARY, CONCLUSIONS AND RECOMMENDATIONS
8.1 SUMMARY Strength and behavior of anchor bolts in ASR/DEF-damaged drilled shafts for High-Mast Illumination Poles (HMIP) were studied. The drilled shafts were used for 150- and 175-ft high, eight-sided HMIP. Six full-scale drilled shafts, three with 16 anchors and three with 20 anchors, were tested to failure. Four of the specimens, constructed in the late 1980’s, had experienced severe ASR/DEF damage; the remaining two were constructed for this study for comparison purposes. One of the ASR/DEF-damaged specimens was repaired by wrapping with Carbon-Fiber Reinforced Polymer (CFRP) to investigate the effectiveness of such wrapping as a retrofitting method.
Observed behavior of the specimens was used to examine a load-transfer mechanism between the anchor bolts and the drilled shafts, and to make recommendations for improvements to current anchor-design provisions of the TxDOT Bridge Design Manual (2001) and ACI 318-05. In addition, wind-load provisions of the AASHTO Specifications (2001) and ASCE 7-05 were examined.
8.2 CONCLUSIONS The following conclusions are based on the experimental study from this study:
(1) ASR/DEF-damaged drilled shafts appeared to have no significant strength loss as a result of ASR/DEF damage. Anchor bolts of all 16-anchor specimens and of the undamaged 20-anchor specimen failed in tension; anchor bolts of an ASR/DEF-damaged 20-anchor specimen failed in compression. Anchor bolts of all ASR/DEF-damaged specimens showed an indication of concrete compression bearing failure. The specimen wrapped with eight layers of CFRP performed well.
(2) Inclined concrete breakout surfaces were observed for all tested specimens except the retrofitted specimen. Based on this observation, a load-transfer mechanism between anchor bolts and longitudinal bars was investigated.
(3) Cyclic loads did not significantly decrease the strength and stiffness of the response of drilled shafts.
(4) The damage index can be used as qualitative measurement for cracks because the measured crack widths, lengths and locations are subjective. As the severity of these cracks is not directly related to the behavior of ASR/DEF-damaged drilled shaft, the damage index can not be used directly to estimate the reduction in capacity of ASR/DEF-damaged shafts.
(5) All specimens had base moment capacities at least equal to the required design capacity. When the safety factors implied by ACI 318-05/ASCE 7-05 were included, most tested specimens satisfy the required capacity. If specified rather than actual concrete strengths were used in the calculation of design capacity, however, the available safety factors of all tested specimens except the retrofitted specimen were less than that implied by ACI 318-05 and ASCE 7-05.
8.3 RECOMMENDATIONS (1) The following changes to current TxDOT Standard Design Details (2001) are proposed:
• increase the amount of spiral reinforcement in the shaft • increase the longitudinal steel in the shaft
82

• increase the size of drilled shaft • use double nuts on the positioning template at the level of the anchor heads.
(2) The design equations of the TxDOT Bridge Design Manual (2001) and ACI 318-05 for the tensile strength of anchor bolts are too conservative, and should be modified.
(3) The wind-load provisions of the AASHTO Specifications (2001) are significantly less conservative than those of ASCE 7-05, and should be modified to remove this discrepancy.
(4) Because ASR/DEF-damaged drilled shafts appeared to have no significant strength loss as a result of ASR/DEF damage, retrofitting or replacing of ASR/DEF-damaged drilled shafts may not be necessary. However, prevention of further ASR/DEF damage or corrosion of reinforcement and anchor bolts should be considered.
8.4 FUTURE INVESTIGATIONS (1) The changes to design recommendations made here should be verified through full-scale tests
of drilled shafts.
(2) Comparison of the calculated wind loads of the AASHTO Specifications (2001) and ASCE 7-05 indicates that the AASHTO Specifications may be unconservative and should be investigated further.
83
APPENDIX A: CALCULATION OF WIND LOAD: EXAMPLE
A.1 INTRODUCTION Design wind-induced moments for HMIP foundations according to the AASHTO Specifications (2001) and ASCE 7-05 are discussed in Chapter 7. In this chapter, the detailed procedure of estimating design wind-induced moments for HMIP foundations according to the AASHTO Specifications (2001) is presented and illustrated for 150-ft, 8-sided HMIP foundation used for this study.
A.2 WIND PROVISIONS OF AASHTO SPECIFICATIONS (2001) In order to estimate design wind-induced moments, design wind loads have to be calculated. Calculation of design wind loads is composed of two steps:
• Estimation of design wind pressures • Transforming design wind pressures to design wind loads
The expression of the AASHTO Specifications (2001) to estimate design wind pressures is shown in Eq. (A.1).
20.00256z z rP K GV= dI C
f
(psf) Eq. (A.1) Eq.3-1 in AASHTO (2001)
where Pz = design wind pressure Kz = height and exposure factor
G = gust effect factor V = basic design wind speed from wind speed map Ir = wind Importance factor Cd = wind drag coefficient
The gust effect factor (G) of 1.14 is generally used for HMIP design, which is the minimum allowed value. The drag coefficient (Cd) varies from 0.45 to 1.70, depending on the radius and shape of the object and the wind speed. More precisely, the AASHTO Specifications (2001) provide a table (Table 3-6 in AASHTO Specifications (2001)) where drag coefficient values for HMIP are determined based on the shape of a pole and CvVd, in which Cv is the velocity conversion factor, V is the basic design wind speed and d is the depth (diameter) of a pole. Once design wind pressures are calculated, design wind loads can be obtained by combining design wind pressures with corresponding projected area to the wind, as shown in Eq. (A.2).
l zW P A= (lb) Eq. (A.2)
where Wl = design wind load Pz = design wind pressure
Af = projected area normal to the wind
84

A.3 WIND-INDUCED MOMENT FOR 150-FT, 8-SIDED HMIP FOUNDATION The detailed procedure for calculating the wind-induced moment for a 150-ft, 8-sided HMIP foundation is illustrated. As the height and exposure factor (Kz) and depth of HMIP varies along its height, HMIP has to be divided into multiple segments for accurate estimation, as shown in Figure A.1. The pole is divided into one hundred segments. A spreadsheet is used to calculate the design wind pressure, load and generated moment for each segment. The results are illustrated in Table A.1. Table A.2 presents the wind-induced moment from luminary.
(a) HMIP
1.5 ft
H
1
2
3
n
⋅⋅⋅⋅⋅ D2,(tip-tip) = D1,(flat-flat) / cos (22.5°)
D1,(flat-flat)
(b) 8-sided Pole Section
Luminary (Aeff = 54 ft2)
99
100
98
⋅⋅⋅⋅⋅
Figure A.1 150-ft, 8-sided HMIP
85

Table A.1 Design Wind-Induced Moment from HMIP (1) (4) (5) (6) (7)
ID H D1,(flat-flat) D2,(tip-tip) Cv*V*d Cd Cd Cd Kz P Wl Wl*H(ft) (in) (in) (mph*ft) (12-sided) (8-sided) (psf) (kip) (ft-kip)
1 0.75 32.50 35.18 352.10 0.79 1.20 1.20 0.87 51.49 0.23 0.172 2.25 32.25 34.91 349.42 0.79 1.20 1.20 0.87 51.49 0.22 0.513 3.75 32.01 34.64 346.73 0.79 1.20 1.20 0.87 51.49 0.22 0.844 5.25 31.76 34.38 344.05 0.79 1.20 1.20 0.87 51.49 0.22 1.165 6.75 31.51 34.11 341.37 0.79 1.20 1.20 0.87 51.49 0.22 1.486 8.25 31.26 33.84 338.69 0.79 1.20 1.20 0.87 51.49 0.22 1.807 9.75 31.02 33.57 336.01 0.79 1.20 1.20 0.87 51.49 0.22 2.118 11.25 30.77 33.30 333.33 0.79 1.20 1.20 0.87 51.49 0.21 2.419 12.75 30.52 33.04 330.65 0.79 1.20 1.20 0.87 51.49 0.21 2.71
10 14.25 30.27 32.77 327.97 0.79 1.20 1.20 0.87 51.49 0.21 3.0111 15.75 30.03 32.50 325.28 0.79 1.20 1.20 0.87 51.49 0.21 3.29
(2) (3)
⋅⋅⋅⋅⋅
⋅⋅⋅⋅⋅
⋅⋅⋅⋅⋅
⋅⋅⋅⋅⋅
89 132.75 10.72 11.60 116.15 0.79 1.20 1.20 1.34 79.51 0.12 15.3190 134.25 10.47 11.34 113.47 0.79 1.20 1.20 1.35 79.70 0.11 15.1691 135.75 10.23 11.07 110.78 0.79 1.20 1.20 1.35 79.88 0.11 15.0092 137.25 9.98 10.80 108.10 0.79 1.20 1.20 1.35 80.07 0.11 14.8493 138.75 9.73 10.53 105.42 0.79 1.20 1.20 1.36 80.25 0.11 14.6694 140.25 9.48 10.27 102.74 0.79 1.20 1.20 1.36 80.43 0.10 14.4895 141.75 9.24 10.00 100.06 0.79 1.20 1.20 1.36 80.61 0.10 14.2896 143.25 8.99 9.73 97.38 0.79 1.20 1.20 1.37 80.79 0.10 14.0897 144.75 8.74 9.46 94.70 0.79 1.20 1.20 1.37 80.97 0.10 13.8698 146.25 8.49 9.19 92.02 0.79 1.20 1.20 1.37 81.15 0.09 13.6499 147.75 8.25 8.93 89.33 0.79 1.20 1.20 1.37 81.32 0.09 13.41100 149.25 8.00 8.66 86.65 0.79 1.20 1.20 1.38 81.49 0.09 13.16
Σ 17.82 1169.23
Table A.2 Design Wind-Induced Moment from Luminary (1) (2) (3) (4) (5) (6) (7)
ID H Af Cd Kz P Wl Wl*H(ft) (ft2) (psf) (kip) (ft-kip)
Luminary 150.00 54.00 1.00 1.38 67.98 3.67 550.67
Therefore, the base moment generated from HMIP and luminary at the bottom of HIMP is 1,720 ft-kip (= 1169.2 + 550.7). Considering the base plate thickness of 3 in. and the clear distance between HIMP and concrete drilled shaft of 3 in., the wind-induced moment for HMIP foundation can be obtained, which is 1,731 ft-kip.
86

REFERENCES
1. ACI Committee 318 (1983) “Commentary on Building Code Requirements for Reinforced
Concrete (ACI 318-83),” American Concrete Institute, Detroit, Michigan, 164 pp. 2. ACI Committee 318 (2005) “Building Code Requirements for Reinforced Concrete (ACI
318-05) and Commentary (ACI 318R-05),” American Concrete Institute, Detroit, Michigan, 423 pp.
3. American Association of State Highway and Transportation Officials (1994), “Standard Specifications for Structural Supports for Highway Signs, Luminaires and Traffic Signals,” Washington, D.C.
4. American Association of State Highway and Transportation Officials (2001), “Standard Specifications for Structural Supports for Highway Signs, Luminaires and Traffic Signals,” 4th Edition, Washington, D.C.
5. American Society of Civil Engineers (2005) “Minimum Design Loads for Buildings and Other Structures,” ASCE Standard ASCE/SEI 7-05, 424 pp.
6. ASTM International (2003) “Standard Practice for Capping Cylindrical Concrete Specimens,” ASTM C 617, 5 pp.
7. ASTM International (2004) “Standard Test Method for Obtaining and Testing Drilled Cores and Sawed Beams of Concrete,” ASTM C 42/C 42M, 6 pp.
8. ASTM International (2004) “Standard Test Method for Obtaining and Testing Drilled Cores and Sawed Beams of Concrete,” ASTM C 42/C 42M, 6 pp.
9. ASTM International (2004) “Standard Test Method for Splitting Tensile Strength of Cylindrical Concrete Specimens,” ASTM C 496/C 496M, 5 pp.
10. ASTM International (2005) “Standard Test Method for Compressive Strength of Cylindrical Concrete Specimens,” ASTM C 39/C 39M, 7 pp.
11. Boenig, A., Fúnez, L., Klingner, R.E., and Fowler, T.J. (2002) “Bridges with Premature Concrete Deterioration: Field Observations and Large-Scale Testing,” Research Report 1857-1, Center for Transportation Research, The University of Texas at Austin, Austin, Texas, May, 230 pp.
12. Calzadilla, M.R. (1982) “Tensile Capacity of High-Strength Anchor Bolt Groups Embedded in Circular Concrete Piers,” MS thesis, The University of Texas at Austin, December.
13. Clayton, N., Currie, R.J., and Moss, R.M. (1990) “Effects of Alkali-Silica Reaction on the Strength of Prestressed Concrete Beams,” Structural Engineer, Vol. 68, No. 15, August, pp. 287-292.
14. Comite Euro-International Du Beton (1994) “Fastenings to Concrete and Masonry Structures – State of the Art Report,” Thomas Telford Books, 249 pp.
15. Connor, R.J. and Hodgson, I.C. (2006) “Field Instrumentation and Testing of High-Mast Lighting Towers in the State of Iowa,” Draft Final Report, Iowa Department of Transportation, January, 59 pp.
87

16. Dexter, R.J. and Ricker, M.J. (2002), Fatigue-Resistant Design of Cantilevered Signal, Sign, and Light Supports,” NCHRP Report 469, Transportation Research Board – National Research Council, Washington, D.C.
17. Fúnez, L.M. (1999) “Field Observation of Bridges with Premature Concrete Deterioration: Structural Implications,” MS thesis, The University of Texas at Austin, December.
18. Hasselwander, G.B., Jirsa, J.O., Breen, J.E., and Lo. K. (1974) “Strength and Behavior of Anchor Bolts Embedded Near Edges of Concrete Piers,” Research Report 29-2F, Center for Transportation Research, The University of Texas at Austin, Austin, Texas, May, 122 pp.
19. Jirsa, J.O., Cichy, N.T., Calzadilla, M.R., Smart, W.H., Pavluvcik, M.P., and Breen, J.E. (1984) “Strength and Behavior of Bolt Installations Anchored in Concrete Piers,” Research Report 305-1F, Center for Transportation Research, The University of Texas at Austin, Austin, Texas, November, 139 pp.
20. Lawrence, B.L., Moody, E.D., Guillemette, R.N., and Carrasquillo, R.L. (1999) “Evaluation and Mitigating Measures for Premature Concrete Distress in Texas Department of Transportation Concrete Elements,” Cement, Concrete, and Aggregates, Vol. 21, No. 1, June, pp. 73-81
21. Malhotra, V. M. (1977) “Contract Strength Requirements – Cores Versus In Situ Evaluation,” Journal of The American Concrete Institute, Vol. 74, No. 4, April, pp. 163-172
22. Memberg, L.S., Klingner, R.E. and Fowler, T.J. (2002) “Bridges with Premature Concrete Deterioration: Damage Indices, Strand-Pullout Tests, and Field Observations,” Research Report 0-1857-4, Center for Transportation Research, The University of Texas at Austin, Austin, Texas, December, 214 pp.
23. Roche, J.M., “Bridges with Premature Concrete Deterioration: Fatigue Testing of Full-Scale, Prestressed Concrete Box Girders Failing in Shear.” MS thesis, The University of Texas at Austin, May.
24. SAP2000 (2005) “Linear and Nonlinear Static and Dynamic Analysis and Design of Three-Dimensional Structures,” Computers & Structures, Inc. Berkeley, CA.
25. Szypula, A. and Grossman, J.S. (1990) “Cylinder vs. Core Strength,” Concrete International, v 12, n 2, February, pp. 55-61.
26. Texas Department of Transportation (2001) “Bridge Design Manual,” December, 428 pp. 27. Texas Highways Magazine (1970) “The Sky’s the Limit,” February. 28. Wood, J.C. and Starnater, E. (2005) “Overhead Structure Inspections,” presented in IBTTA
Maintenance Fall Conference, October, Tampa, FL
88