Embed Size (px)
Citation preview
www.iab.com www.pwc.com/e&m
1
IAB internet advertising revenue report 2017 full year results An industry survey conducted by PwC and sponsored by the Interactive Advertising Bureau (IAB)
May 2018
Any trademarks included are trademarks of their respective owners and are not affiliated with, nor endorsed by, PricewaterhouseCoopers LLP, its subsidiaries or affiliates
PwC | IAB internet advertising revenue report
Contents
Background ........................................................................................................... 1
Executive summary .............................................................................................. 2
Key growth drivers ............................................................................................... 3
Enabling advertising scalability ......................................................................... 4
Revenue continues to grow year over year ........................................................ 7
Detailed findings ................................................................................................... 8
Shift to mobile continues, but rate of growth starts to decline ......................... 9
Historical revenue mix – First half vs. second half ......................................... 10
Ad format – Fourth-quarter 2017 results .......................................................... 11
Ad format – Full year 2017 results ................................................................... 12
Digital video gains while search slips on mobile ............................................. 13
Mobile overtakes desktop in digital video ........................................................ 14
Social media’s share of the pie increased.......................................................... 15
Digital audio achieved new heights .................................................................. 16
Revenues by pricing model ................................................................................ 17
Historical pricing model trends ........................................................................ 18
Advertising market share by media.................................................................. 19
Historical advertising market share .................................................................20
Historical data findings ..................................................................................... 25
PwC | IAB internet advertising revenue report 1
Background
About the IAB internet advertising revenue report
Conducted by PwC Advisory Services LLC (“PwC”) on an ongoing basis, with results released quarterly, the “IAB Internet Advertising Revenue Report” was initiated by the Interactive Advertising Bureau (IAB) in 1996. This report utilizes data and information reported directly to PwC from companies selling advertising on the internet as well as publicly available corporate data.
The results reported are considered to be a reasonable measurement of internet/online/mobile advertising revenues because much of the data is compiled directly from information supplied by companies selling advertising online. The report includes data reflecting desktop and mobile online advertising revenues from websites, commercial online services, ad networks and exchanges, mobile devices, and email providers, as well as other companies selling online advertising.
The report is conducted independently by PwC on behalf of the IAB. PwC does not audit the information and provides no opinion or other form of assurance with respect to the information. Only aggregate results are published and individual company information is held in strict confidence with PwC. Further details regarding scope and methodology are provided in the appendix to this report.
David Silverman PwC
PwC | IAB internet advertising revenue report 2
Executive summary
2017 full year highlights
Internet advertising revenues (“revenues”) in the United States totaled $88.0 billion for the full year (“FY”) of 2017, with Q4 2017 accounting for approximately $26.1 billion and Q3 2017 accounting for approximately $21.8 billion. Revenues for FY 2017 increased 21.4% over FY 2016.
Key trends underlying FY 2017 results
Fourth quarter revenues exhibit strong growth in FY 2017 Internet advertising revenues in the United States totaled $26.1 billion in the fourth quarter of 2017, an increase of 20.0% from the 2017 third quarter total of $21.8 billion and an increase of 20.8% from the 2016 fourth quarter total of $21.6 billion.
The shift to mobile continues Advertising revenues delivered on mobile devices totaled $49.9 billion in FY 2017, a 36.2% increase from the prior full year revenues of $36.6 billion. Advertising delivered on mobile devices now makes up 56.7% of total internet advertising revenues.
“Consumers are increasingly spending a tremendous amount of
time with interactive screens and content–from mobile to desktop and audio
to OTT–and brands are in lockstep with a growing commitment to digital
ad buys. Mobile captured more than half of the total digital ad spend last
year and we can easily expect that share to continue to climb. Video also
saw significant growth. That is no surprise—especially after seeing buyers
clamoring to get into last week’s NewFronts presentations in New York.”
— Randall Rothenberg, President and CEO, IAB
“Digital advertising revenues have been steadily rising for several
years and buyers continue to increase their investment. From
mobile to video, consumers are constantly turning to interactive
screens, whether for information, entertainment, shopping,
sharing, or more.”
— David Silverman, Partner, PwC
PwC | IAB internet advertising revenue report 3
Key growth drivers
Exploring the drivers of growth
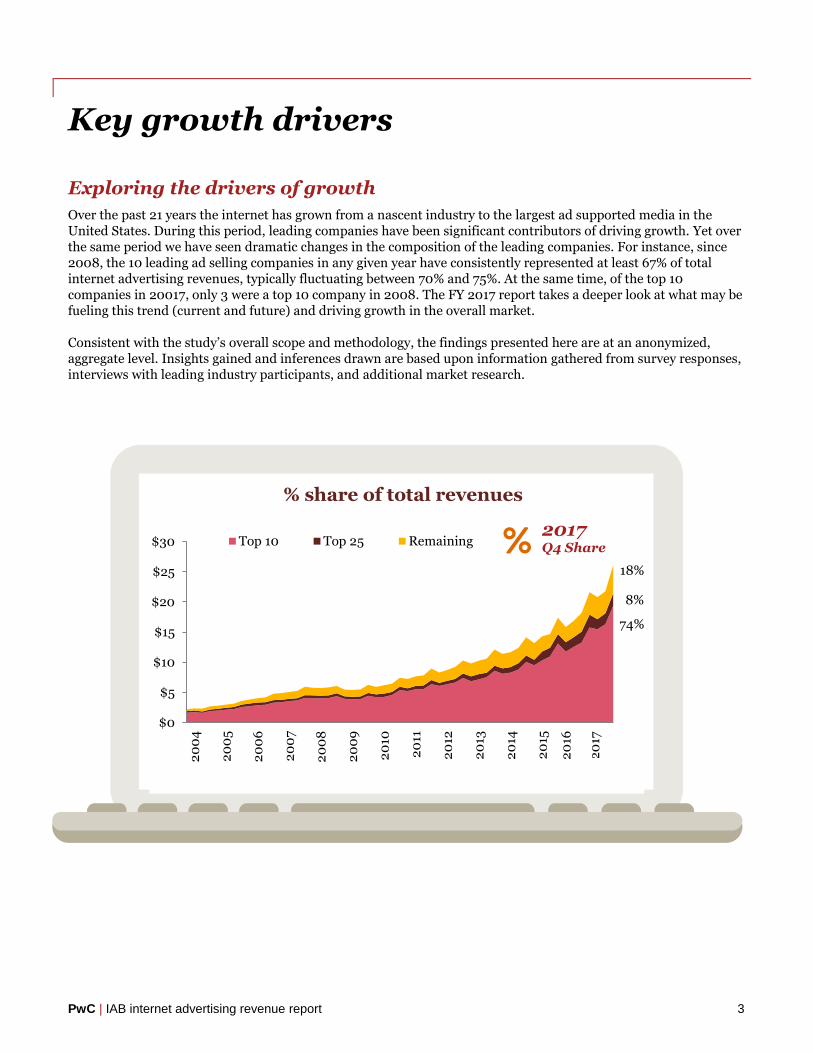
Over the past 21 years the internet has grown from a nascent industry to the largest ad supported media in the United States. During this period, leading companies have been significant contributors of driving growth. Yet over the same period we have seen dramatic changes in the composition of the leading companies. For instance, since 2008, the 10 leading ad selling companies in any given year have consistently represented at least 67% of total internet advertising revenues, typically fluctuating between 70% and 75%. At the same time, of the top 10 companies in 20017, only 3 were a top 10 company in 2008. The FY 2017 report takes a deeper look at what may be fueling this trend (current and future) and driving growth in the overall market.
Consistent with the study’s overall scope and methodology, the findings presented here are at an anonymized, aggregate level. Insights gained and inferences drawn are based upon information gathered from survey responses, interviews with leading industry participants, and additional market research.
$0
$5
$10
$15
$20
$25
$30
2
00
4
20
05
20
06
20
07
20
08
20
09
20
10
20
11
20
12
20
13
20
14
20
15
20
16
Top 10 Top 25 Remaining
18%
8%
74%
% share of total revenues
2017
Q4 Share
20
172
017
PwC | IAB internet advertising revenue report 4
Enabling advertising scalability
Enabling technology
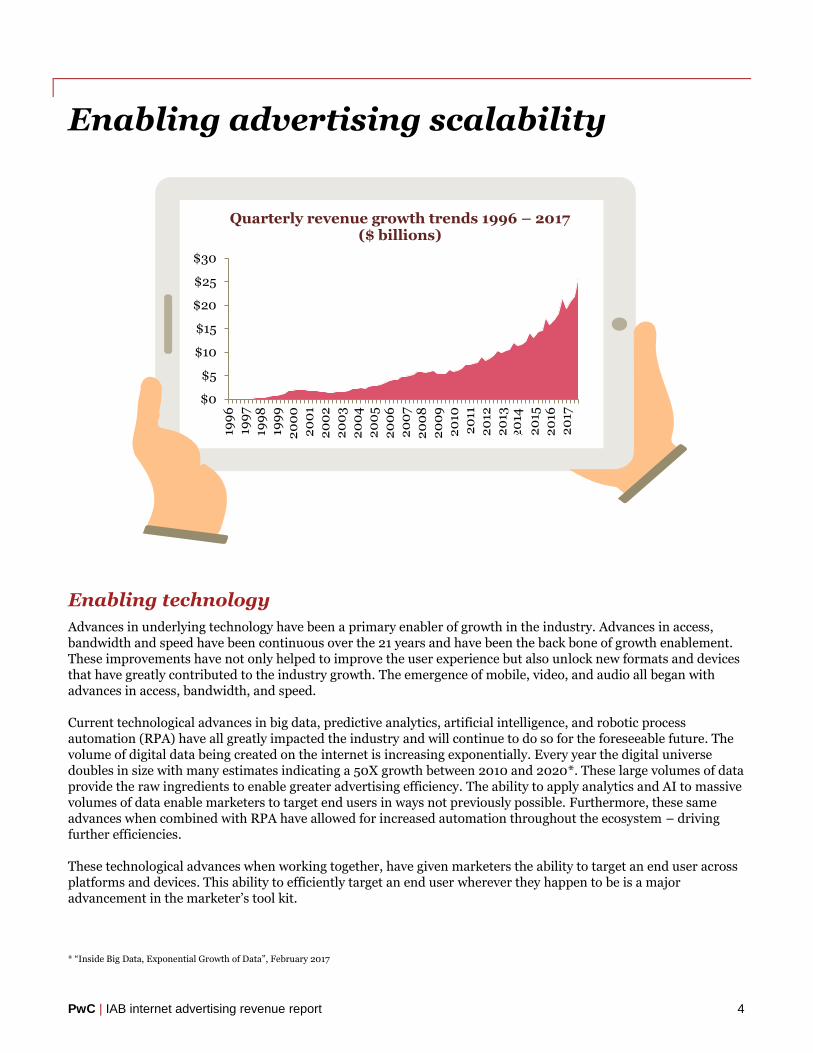
Advances in underlying technology have been a primary enabler of growth in the industry. Advances in access, bandwidth and speed have been continuous over the 21 years and have been the back bone of growth enablement. These improvements have not only helped to improve the user experience but also unlock new formats and devices that have greatly contributed to the industry growth. The emergence of mobile, video, and audio all began with advances in access, bandwidth, and speed.
Current technological advances in big data, predictive analytics, artificial intelligence, and robotic process automation (RPA) have all greatly impacted the industry and will continue to do so for the foreseeable future. The volume of digital data being created on the internet is increasing exponentially. Every year the digital universe doubles in size with many estimates indicating a 50X growth between 2010 and 2020*. These large volumes of data provide the raw ingredients to enable greater advertising efficiency. The ability to apply analytics and AI to massive volumes of data enable marketers to target end users in ways not previously possible. Furthermore, these same advances when combined with RPA have allowed for increased automation throughout the ecosystem – driving further efficiencies.
These technological advances when working together, have given marketers the ability to target an end user across platforms and devices. This ability to efficiently target an end user wherever they happen to be is a major advancement in the marketer’s tool kit.
* “Inside Big Data, Exponential Growth of Data”, February 2017
Quarterly revenue growth trends 1996 – 2017 ($ billions)
$0
$5
$10
$15
$20
$25
$30
199
6
199
719
98
199
9
20
00
20
01
20
02
20
03
20
04
20
05
20
06
20
07
20
08
20
09
20
102
011
20
122
013
20
13
20
152
016
20
17
20
14
PwC | IAB internet advertising revenue report 5
Lastly, advancements in analytics and data visualization have provided advertisers with greater insights into the effectiveness and efficiency of their marketing spend. No matter the medium on which a marketer is advertising, the same questions have always persisted with respect to advertising efficacy: What is working? Where? With whom? At what cost? With real-time feedback, advertisers can now see what is working and quickly adjust their ad campaigns to improve overall effectiveness.
Lots of eyeballs (and ears)
Marketers have always been enamored by large audiences. The larger an audience, the more likely an advertiser is able to reach their relevant target. With the advancements in technology noted above, the ability to target a consumer within a large audience is greatly improved, which has further enhanced the ad buying efficiency.
Large audiences have always converged on popular sites, and in today’s internet the largest beneficiaries have been on popular social media, video, and audio sites as well as shopping and shopping-related, news, and special interest sites. Sites that can bring together large and/or relevant audiences are benefiting the most. Furthermore, advances in programmatic advertising have enabled the aggregation of audiences from disparate sites to more effectively identify and target the relevant end user.
The democratization of advertising
20 years ago, small- and medium-sized businesses (“SMBs”) could not easily advertise without significant upfront expenditure and a substantial risk on return to their marketing and advertising spend. For many such businesses, the cost of advertising was a risk that could not be easily taken. Digital advertising’s evolution has greatly democratized the ability for all businesses, regardless of size and budget, to target audiences based upon geographies (location), demographics, psychographics, and behavior.
Self-service platforms combined with low marketing spend requirements have opened up this mass media to all forms of business; it doesn’t matter if you are a fortune 500 company or a local pizza place. SMBs that were initially attracted to the industry through paid search and certain performance-based ad formats have continued to advertise through growing social media sites, easy-to-use self-service platforms, and industry-specific lead generation platforms. Digital advertising has successfully delivered lower price points with reduced risk, plus the benefit of transparency into advertising effectiveness and ROI.
Through the use of self-service platforms, flexible budgets, and ROI transparency, companies can quickly ramp up or turn down budgeted spend, based upon their achieved ROI. This flexibility greatly lowers the risk associated with the advertising process and has facilitated more inclusive participation.
The impact of the direct brand economy
With the advent of the direct brand economy, an entire genre of companies that did not previously exist are requiring efficient advertisements that can be directed at a specific desired audience. With most of the purchases relating to direct brands being made over the internet, ad campaigns targeted at internet users make perfect sense. Small startups are able to fuel rapid growth by having transparency into the effectiveness of their advertising campaigns and can continue to reinvest in customer acquisition through digital advertising, as long as the ROI remains positive – so long as there is positive ROI, advertising spend increases, facilitating faster and more efficient scalability. This becomes a major driver of growth.
PwC | IAB internet advertising revenue report 6
Emerging growth drivers
Technological advances and new business models make for a healthier, more robust advertising environment. And, while some digital advertising companies are already seeing the benefits, opportunity remains, as not all digital advertising companies and platforms are participating in the innovative solutions at the same rate or with the same reach. Our discussions with leading industry participants suggest that a lack of self-service tools, prohibitive minimum advertising buys, and reliance on direct sales or programmatic platforms that do not cater to small businesses may be restricting the number of advertisers who are aware of and active on all but the most popular platforms. There is room for the further democratization of digital advertising, which may come in the form of the next generation of technological advances.
New technologies like artificial intelligence (AI), augmented reality (AR), virtual reality (VR), and voice-based systems will most certainly create new opportunities for growth within the industry. Continued advances in AI and data & analytics will enable companies to create more personalized experiences than what we see today. VR, AR and voice-based systems will help to create new opportunities for brand engagement and potentially increase the available amount of advertising inventory. Though many of these technologies are still in the early stages, we expect advertisers to be just as exploratory in determining how these technologies can be implemented to connect with current and future customers. As we have seen throughout the brief history of the internet advertising market, the ecosystem has been built on disruption and change. These emerging growth drivers will certainly continue to bring disruption along with opportunity, and companies must be ready to respond.
PwC | IAB internet advertising revenue report 7
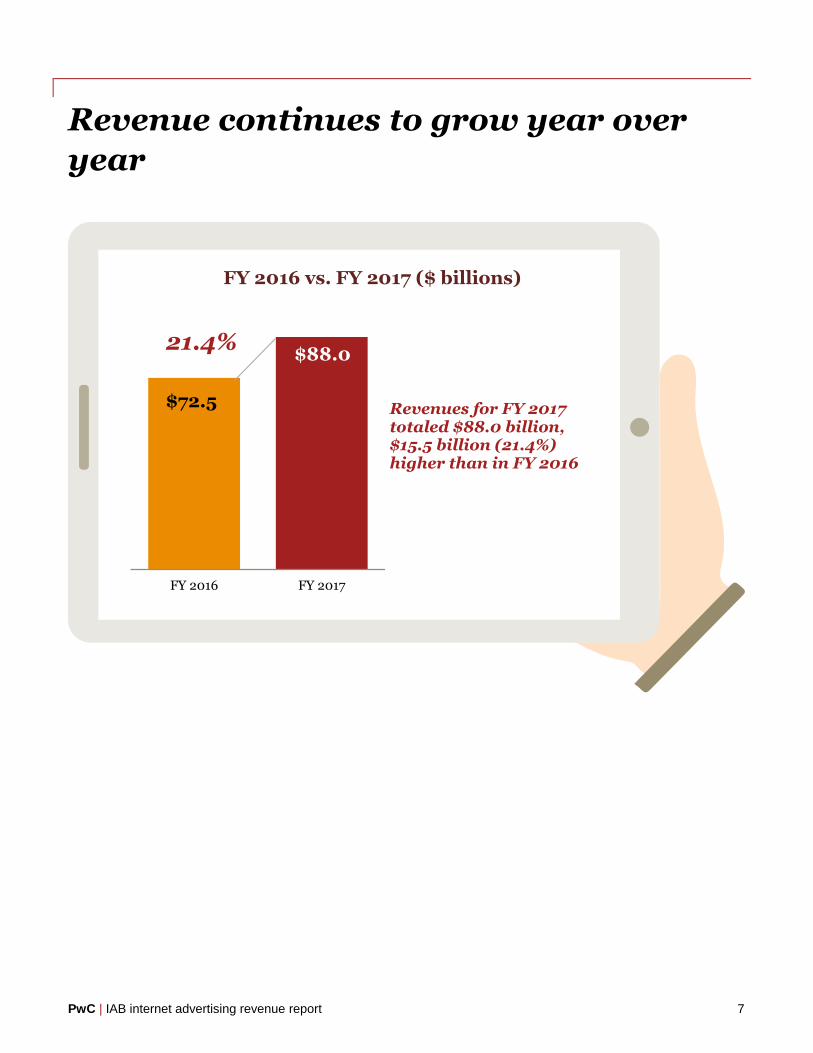
Revenue continues to grow year over
year
FY 2016 vs. FY 2017 ($ billions)
$72.5
$88.0
FY 2016 FY 2017
21.4%
Revenues for FY 2017 totaled $88.0 billion, $15.5 billion (21.4%) higher than in FY 2016
PwC | IAB internet advertising revenue report 8
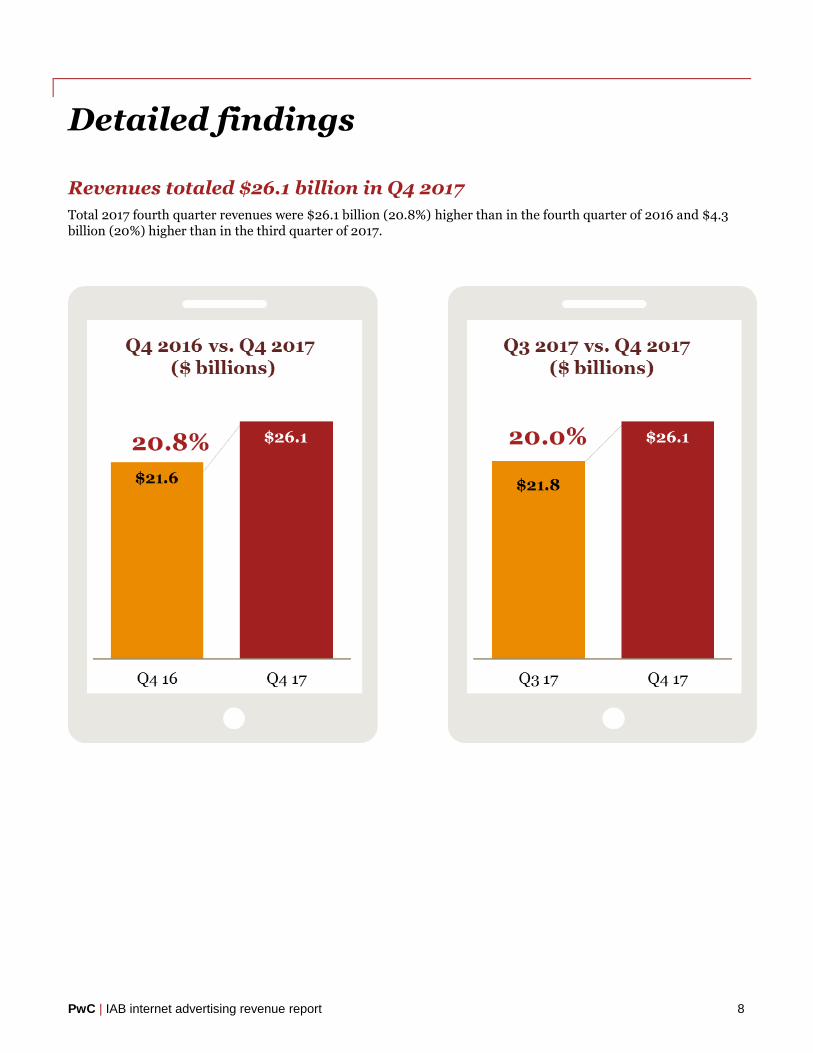
Detailed findings
Revenues totaled $26.1 billion in Q4 2017
Total 2017 fourth quarter revenues were $26.1 billion (20.8%) higher than in the fourth quarter of 2016 and $4.3 billion (20%) higher than in the third quarter of 2017.
PwC | IAB internet advertising revenue report 9
Shift to mobile continues, but rate of
growth starts to decline
Mobile internet advertising dominated total revenues in 2017
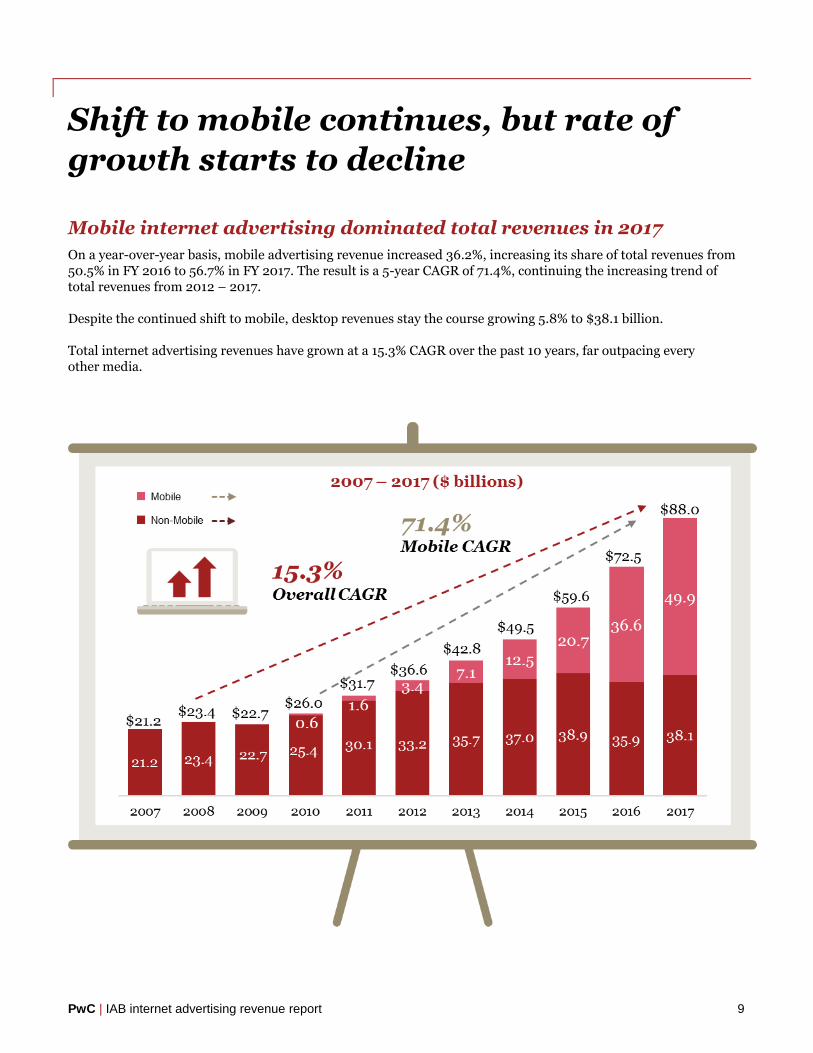
On a year-over-year basis, mobile advertising revenue increased 36.2%, increasing its share of total revenues from 50.5% in FY 2016 to 56.7% in FY 2017. The result is a 5-year CAGR of 71.4%, continuing the increasing trend of total revenues from 2012 – 2017.
Despite the continued shift to mobile, desktop revenues stay the course growing 5.8% to $38.1 billion.
Total internet advertising revenues have grown at a 15.3% CAGR over the past 10 years, far outpacing every other media.
PwC | IAB internet advertising revenue report 10
Historical revenue mix – First half vs.
second half
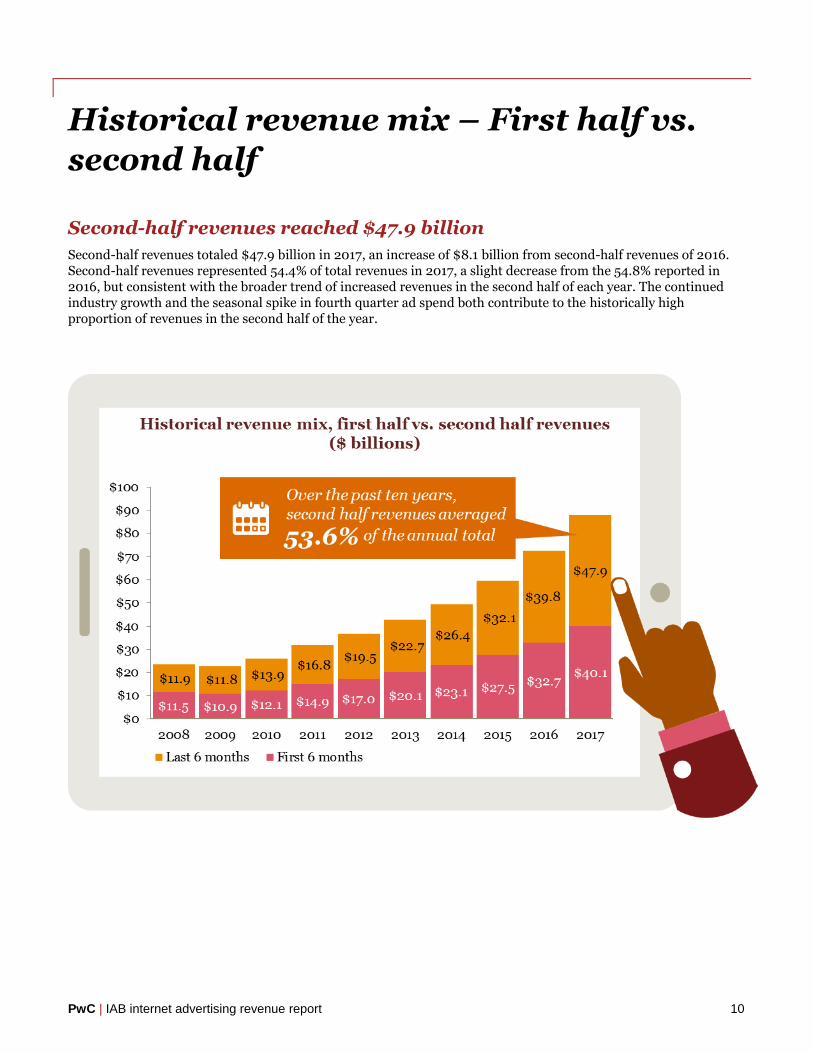
Second-half revenues reached $47.9 billion
Second-half revenues totaled $47.9 billion in 2017, an increase of $8.1 billion from second-half revenues of 2016. Second-half revenues represented 54.4% of total revenues in 2017, a slight decrease from the 54.8% reported in 2016, but consistent with the broader trend of increased revenues in the second half of each year. The continued industry growth and the seasonal spike in fourth quarter ad spend both contribute to the historically high proportion of revenues in the second half of the year.
PwC | IAB internet advertising revenue report 11
Ad format – Fourth-quarter 2017 results
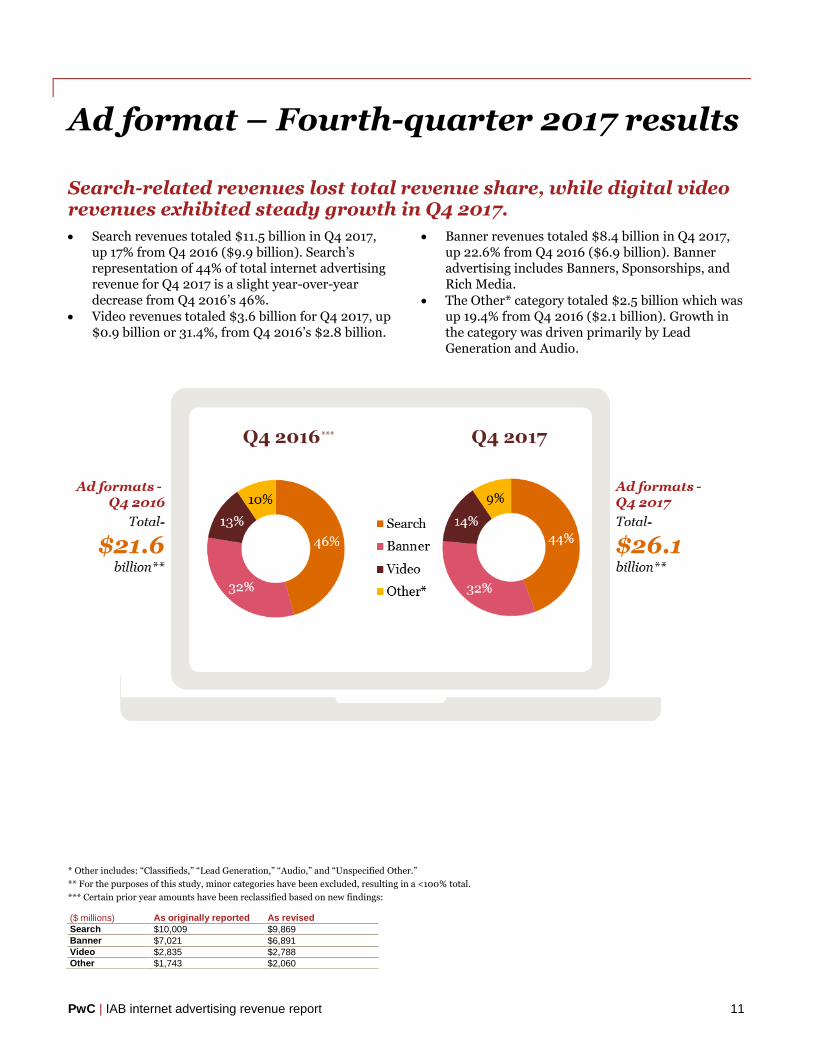
Search-related revenues lost total revenue share, while digital video revenues exhibited steady growth in Q4 2017.
Search revenues totaled $11.5 billion in Q4 2017, up 17% from Q4 2016 ($9.9 billion). Search’s representation of 44% of total internet advertising revenue for Q4 2017 is a slight year-over-year decrease from Q4 2016’s 46%.
Video revenues totaled $3.6 billion for Q4 2017, up $0.9 billion or 31.4%, from Q4 2016’s $2.8 billion.
Banner revenues totaled $8.4 billion in Q4 2017, up 22.6% from Q4 2016 ($6.9 billion). Banner advertising includes Banners, Sponsorships, and Rich Media.
The Other* category totaled $2.5 billion which was up 19.4% from Q4 2016 ($2.1 billion). Growth in the category was driven primarily by Lead Generation and Audio.
* Other includes: “Classifieds,” “Lead Generation,” “Audio,” and “Unspecified Other.”
** For the purposes of this study, minor categories have been excluded, resulting in a <100% total.
*** Certain prior year amounts have been reclassified based on new findings:
($ millions) As originally reported As revised
Search $10,009 $9,869
Banner $7,021 $6,891
Video $2,835 $2,788
Other $1,743 $2,060
***
PwC | IAB internet advertising revenue report 12
Ad format – Full year 2017 results
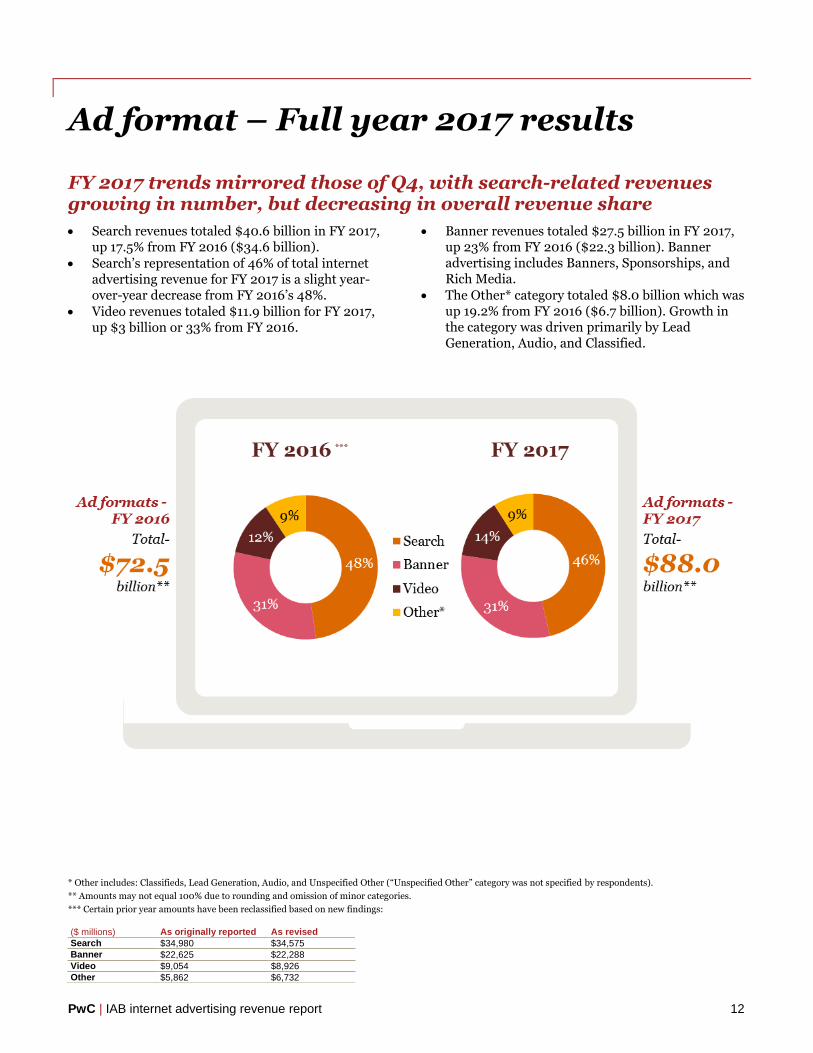
FY 2017 trends mirrored those of Q4, with search-related revenues growing in number, but decreasing in overall revenue share
Search revenues totaled $40.6 billion in FY 2017, up 17.5% from FY 2016 ($34.6 billion).
Search’s representation of 46% of total internet advertising revenue for FY 2017 is a slight year-over-year decrease from FY 2016’s 48%.
Video revenues totaled $11.9 billion for FY 2017, up $3 billion or 33% from FY 2016.
Banner revenues totaled $27.5 billion in FY 2017, up 23% from FY 2016 ($22.3 billion). Banner advertising includes Banners, Sponsorships, and Rich Media.
The Other* category totaled $8.0 billion which was up 19.2% from FY 2016 ($6.7 billion). Growth in the category was driven primarily by Lead Generation, Audio, and Classified.
* Other includes: Classifieds, Lead Generation, Audio, and Unspecified Other (“Unspecified Other” category was not specified by respondents).
** Amounts may not equal 100% due to rounding and omission of minor categories.
*** Certain prior year amounts have been reclassified based on new findings:
($ millions) As originally reported As revised
Search $34,980 $34,575
Banner $22,625 $22,288
Video $9,054 $8,926
Other $5,862 $6,732
***
PwC | IAB internet advertising revenue report 13
Digital video gains while search slips on
mobile
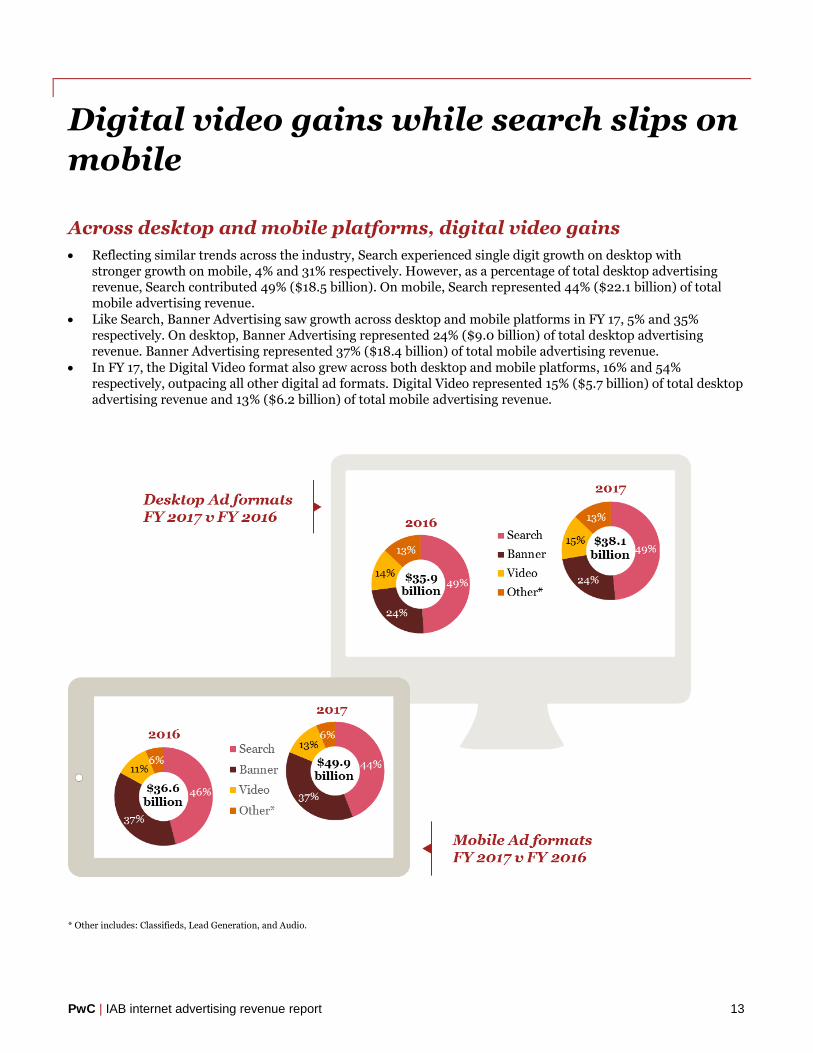
Across desktop and mobile platforms, digital video gains
Reflecting similar trends across the industry, Search experienced single digit growth on desktop with stronger growth on mobile, 4% and 31% respectively. However, as a percentage of total desktop advertising revenue, Search contributed 49% ($18.5 billion). On mobile, Search represented 44% ($22.1 billion) of total mobile advertising revenue.
Like Search, Banner Advertising saw growth across desktop and mobile platforms in FY 17, 5% and 35% respectively. On desktop, Banner Advertising represented 24% ($9.0 billion) of total desktop advertising revenue. Banner Advertising represented 37% ($18.4 billion) of total mobile advertising revenue.
In FY 17, the Digital Video format also grew across both desktop and mobile platforms, 16% and 54% respectively, outpacing all other digital ad formats. Digital Video represented 15% ($5.7 billion) of total desktop advertising revenue and 13% ($6.2 billion) of total mobile advertising revenue.
* Other includes: Classifieds, Lead Generation, and Audio.
PwC | IAB internet advertising revenue report 14
Mobile overtakes desktop in digital
video
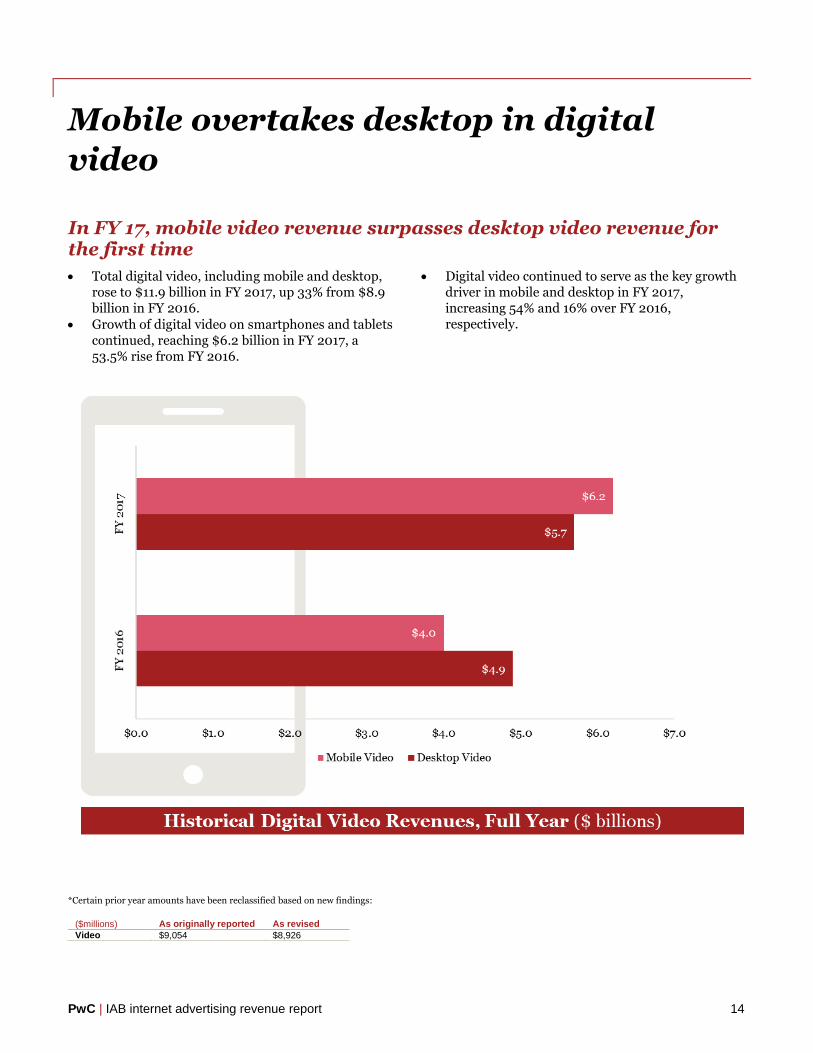
In FY 17, mobile video revenue surpasses desktop video revenue for the first time
Total digital video, including mobile and desktop, rose to $11.9 billion in FY 2017, up 33% from $8.9 billion in FY 2016.
Growth of digital video on smartphones and tablets continued, reaching $6.2 billion in FY 2017, a 53.5% rise from FY 2016.
Digital video continued to serve as the key growth driver in mobile and desktop in FY 2017, increasing 54% and 16% over FY 2016, respectively.
*Certain prior year amounts have been reclassified based on new findings:
($millions) As originally reported As revised
Video $9,054 $8,926
PwC | IAB internet advertising revenue report 15
Social media’s share of the pie increased
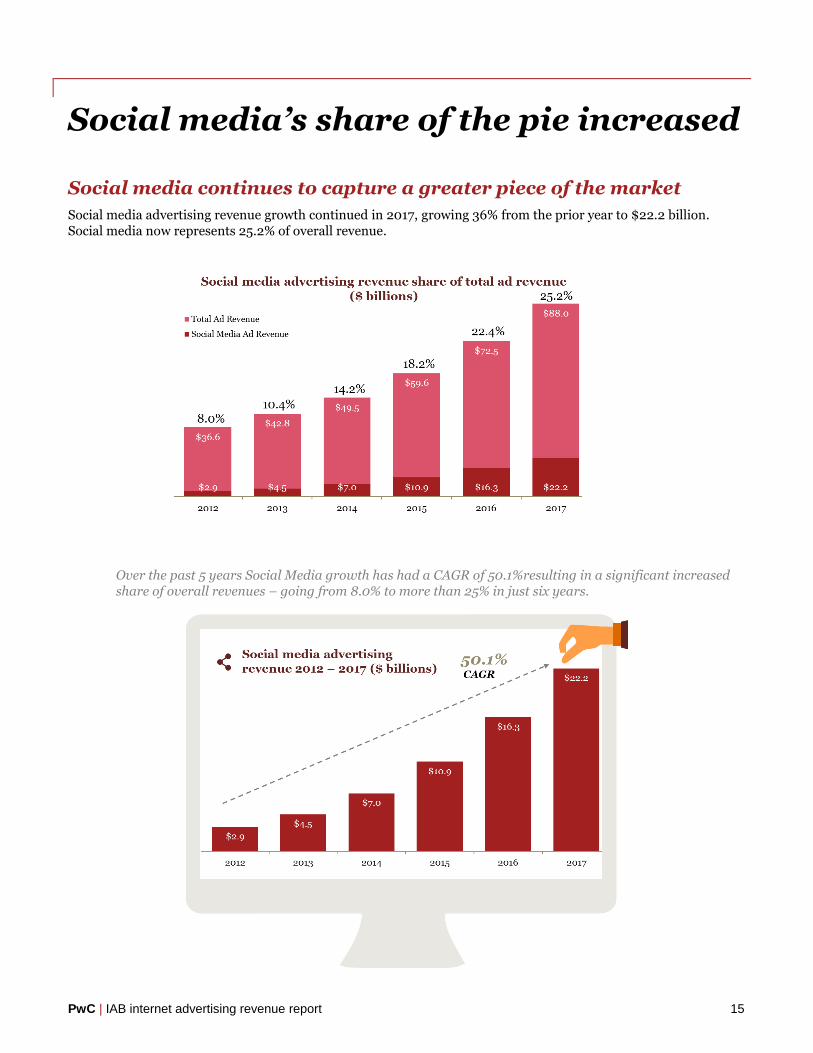
Social media continues to capture a greater piece of the market
Social media advertising revenue growth continued in 2017, growing 36% from the prior year to $22.2 billion. Social media now represents 25.2% of overall revenue.
Over the past 5 years Social Media growth has had a CAGR of 50.1%resulting in a significant increased share of overall revenues – going from 8.0% to more than 25% in just six years.
PwC | IAB internet advertising revenue report 16
Digital audio achieved new heights
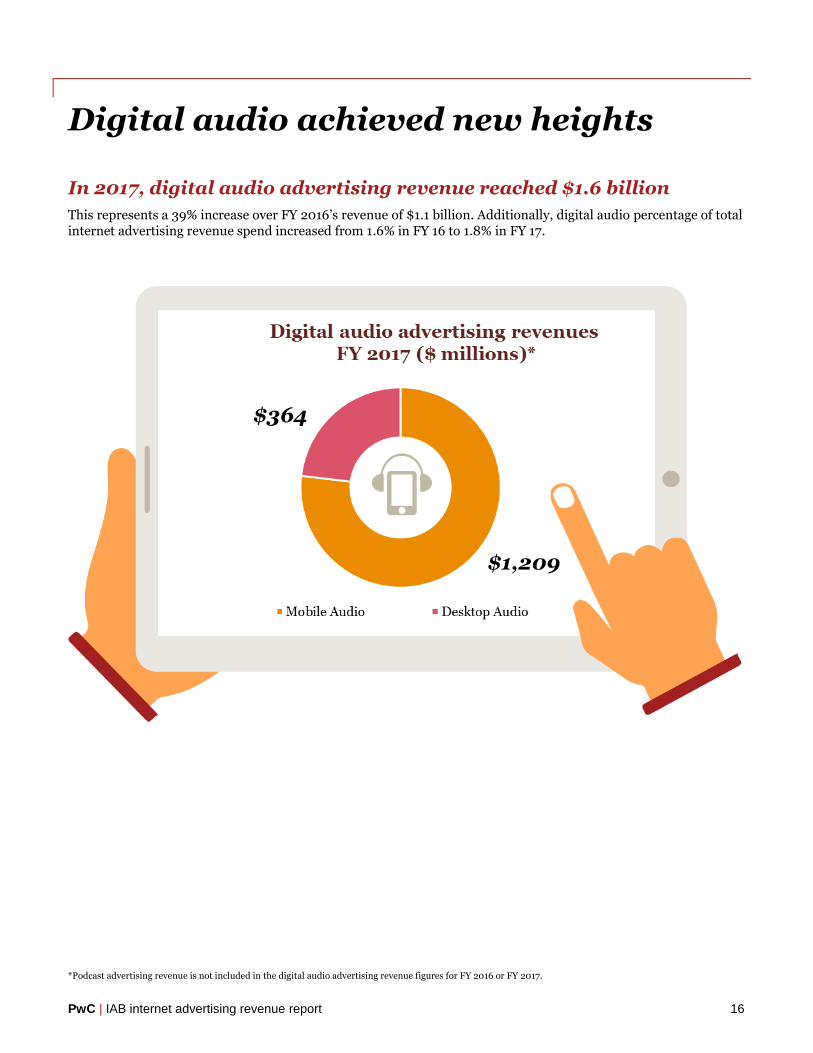
In 2017, digital audio advertising revenue reached $1.6 billion
This represents a 39% increase over FY 2016’s revenue of $1.1 billion. Additionally, digital audio percentage of total internet advertising revenue spend increased from 1.6% in FY 16 to 1.8% in FY 17.
*Podcast advertising revenue is not included in the digital audio advertising revenue figures for FY 2016 or FY 2017.
PwC | IAB internet advertising revenue report 17
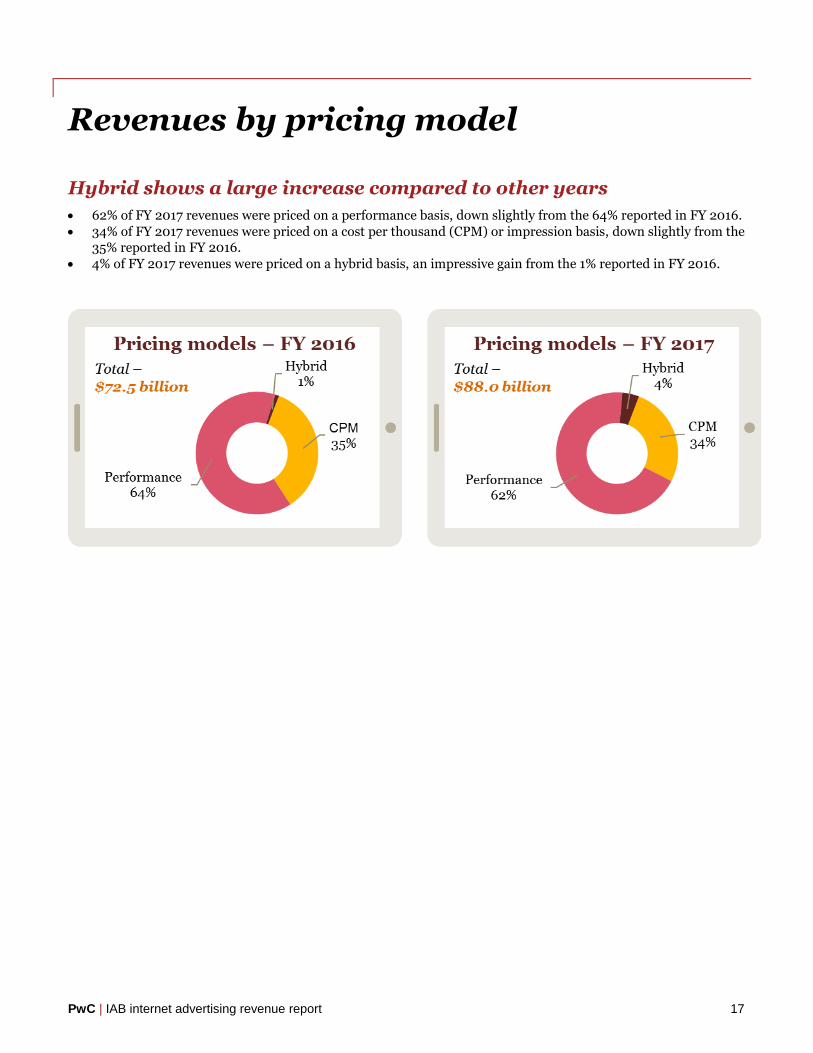
Revenues by pricing model
Hybrid shows a large increase compared to other years
62% of FY 2017 revenues were priced on a performance basis, down slightly from the 64% reported in FY 2016.
34% of FY 2017 revenues were priced on a cost per thousand (CPM) or impression basis, down slightly from the 35% reported in FY 2016.
4% of FY 2017 revenues were priced on a hybrid basis, an impressive gain from the 1% reported in FY 2016.
PwC | IAB internet advertising revenue report 18
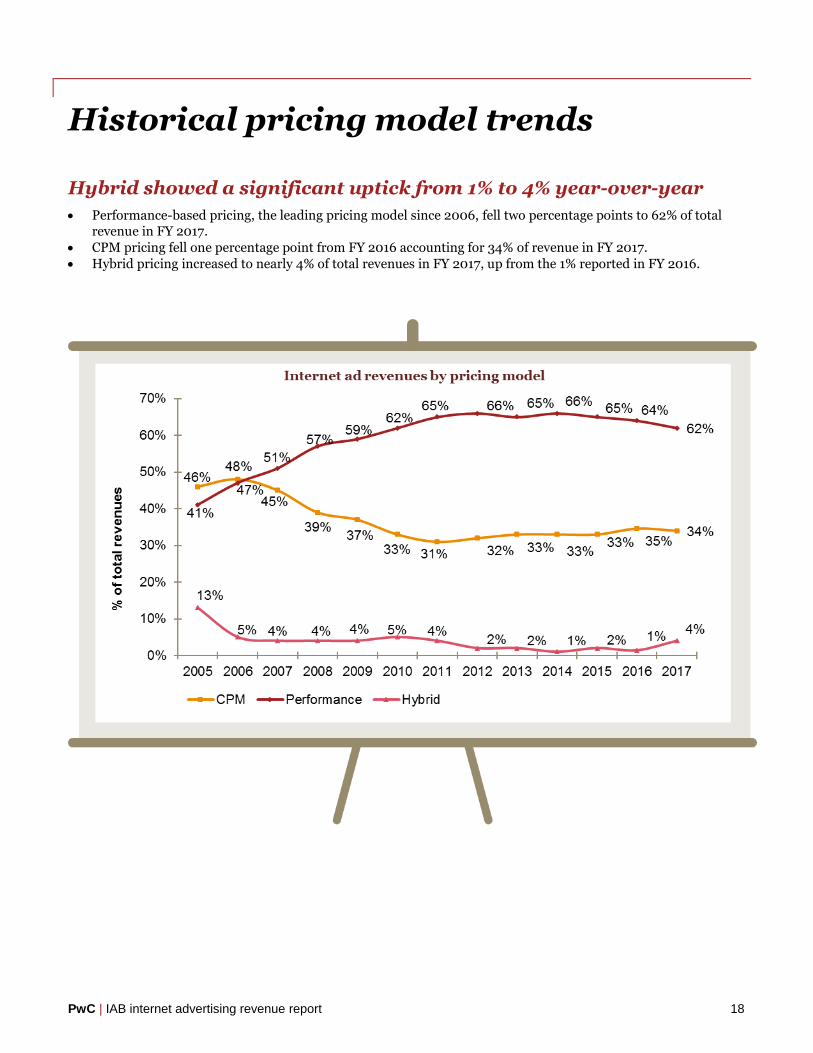
Historical pricing model trends
Hybrid showed a significant uptick from 1% to 4% year-over-year
Performance-based pricing, the leading pricing model since 2006, fell two percentage points to 62% of total revenue in FY 2017.
CPM pricing fell one percentage point from FY 2016 accounting for 34% of revenue in FY 2017.
Hybrid pricing increased to nearly 4% of total revenues in FY 2017, up from the 1% reported in FY 2016.
PwC | IAB internet advertising revenue report 19
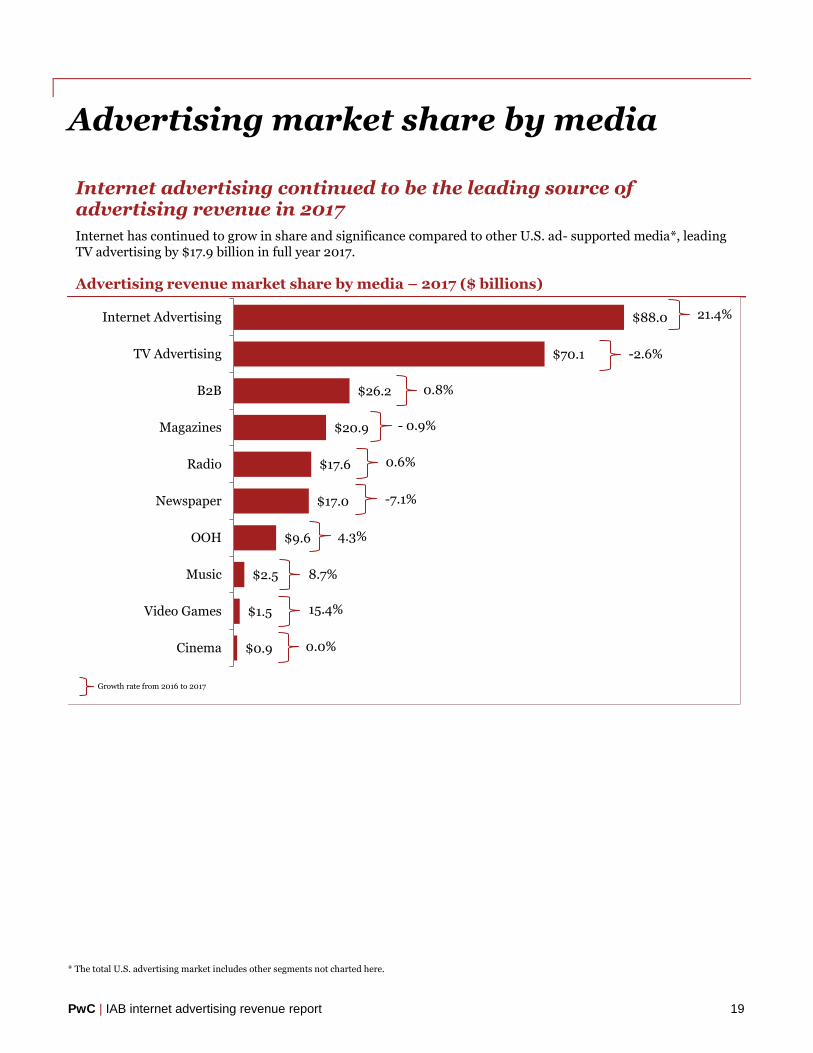
Advertising market share by media
Internet advertising continued to be the leading source of advertising revenue in 2017
Internet has continued to grow in share and significance compared to other U.S. ad- supported media*, leading TV advertising by $17.9 billion in full year 2017.
Advertising revenue market share by media – 2017 ($ billions)
* The total U.S. advertising market includes other segments not charted here.
$0.9
$1.5
$2.5
$9.6
$17.0
$17.6
$20.9
$26.2
$70.1
$88.0
Cinema
Video Games
Music
OOH
Newspaper
Radio
Magazines
B2B
TV Advertising
Internet Advertising 21.4%
-2.6%
0.8%
- 0.9%
0.6%
-7.1%
4.3%
8.7%
15.4%
0.0%
Growth rate from 2016 to 2017
PwC | IAB internet advertising revenue report 20
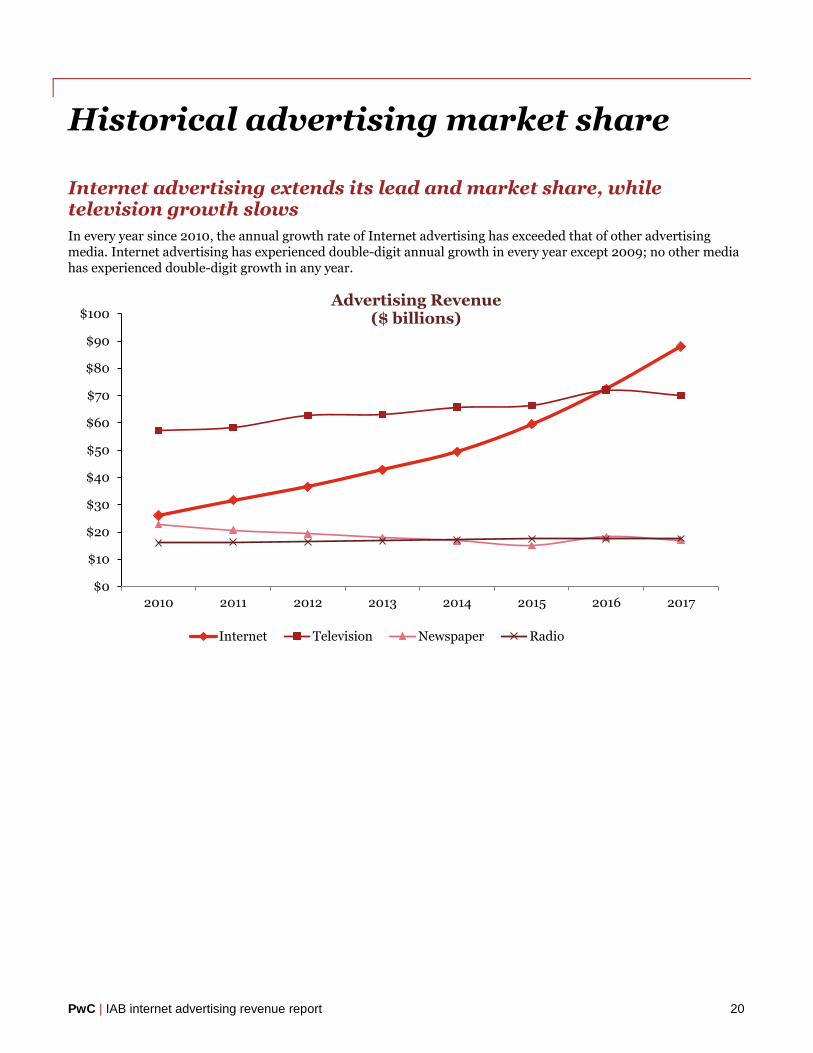
Historical advertising market share
Internet advertising extends its lead and market share, while television growth slows
In every year since 2010, the annual growth rate of Internet advertising has exceeded that of other advertising media. Internet advertising has experienced double-digit annual growth in every year except 2009; no other media has experienced double-digit growth in any year.
$0
$10
$20
$30
$40
$50
$60
$70
$80
$90
$100
2010 2011 2012 2013 2014 2015 2016 2017
Internet Television Newspaper Radio
Advertising Revenue ($ billions)
PwC | IAB internet advertising revenue report 21
Appendix
22
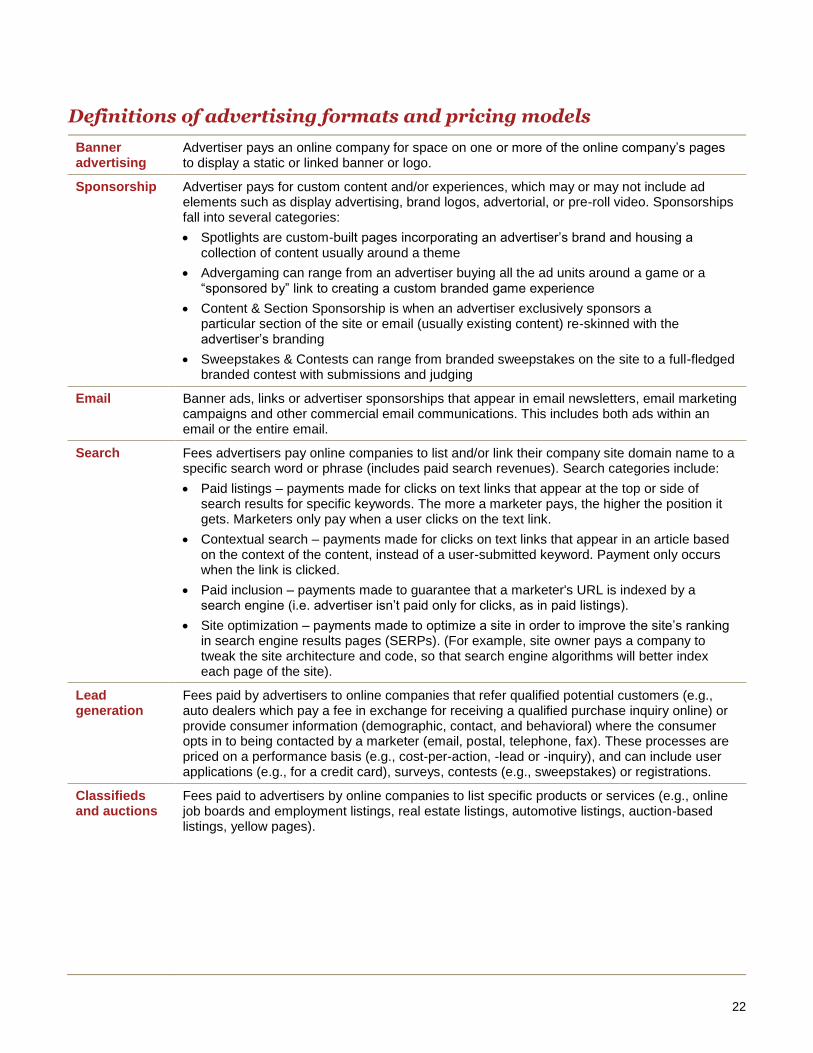
Definitions of advertising formats and pricing models
Banner advertising
Advertiser pays an online company for space on one or more of the online company’s pages to display a static or linked banner or logo.
Sponsorship Advertiser pays for custom content and/or experiences, which may or may not include ad elements such as display advertising, brand logos, advertorial, or pre-roll video. Sponsorships fall into several categories:
Spotlights are custom-built pages incorporating an advertiser’s brand and housing a collection of content usually around a theme
Advergaming can range from an advertiser buying all the ad units around a game or a “sponsored by” link to creating a custom branded game experience
Content & Section Sponsorship is when an advertiser exclusively sponsors a particular section of the site or email (usually existing content) re-skinned with the advertiser’s branding
Sweepstakes & Contests can range from branded sweepstakes on the site to a full-fledged branded contest with submissions and judging
Email Banner ads, links or advertiser sponsorships that appear in email newsletters, email marketing campaigns and other commercial email communications. This includes both ads within an email or the entire email.
Search Fees advertisers pay online companies to list and/or link their company site domain name to a specific search word or phrase (includes paid search revenues). Search categories include:
Paid listings – payments made for clicks on text links that appear at the top or side of search results for specific keywords. The more a marketer pays, the higher the position it gets. Marketers only pay when a user clicks on the text link.
Contextual search – payments made for clicks on text links that appear in an article based on the context of the content, instead of a user-submitted keyword. Payment only occurs when the link is clicked.
Paid inclusion – payments made to guarantee that a marketer's URL is indexed by a search engine (i.e. advertiser isn’t paid only for clicks, as in paid listings).
Site optimization – payments made to optimize a site in order to improve the site’s ranking in search engine results pages (SERPs). (For example, site owner pays a company to tweak the site architecture and code, so that search engine algorithms will better index each page of the site).
Lead generation
Fees paid by advertisers to online companies that refer qualified potential customers (e.g., auto dealers which pay a fee in exchange for receiving a qualified purchase inquiry online) or provide consumer information (demographic, contact, and behavioral) where the consumer opts in to being contacted by a marketer (email, postal, telephone, fax). These processes are priced on a performance basis (e.g., cost-per-action, -lead or -inquiry), and can include user applications (e.g., for a credit card), surveys, contests (e.g., sweepstakes) or registrations.
Classifieds and auctions
Fees paid to advertisers by online companies to list specific products or services (e.g., online job boards and employment listings, real estate listings, automotive listings, auction-based listings, yellow pages).
23
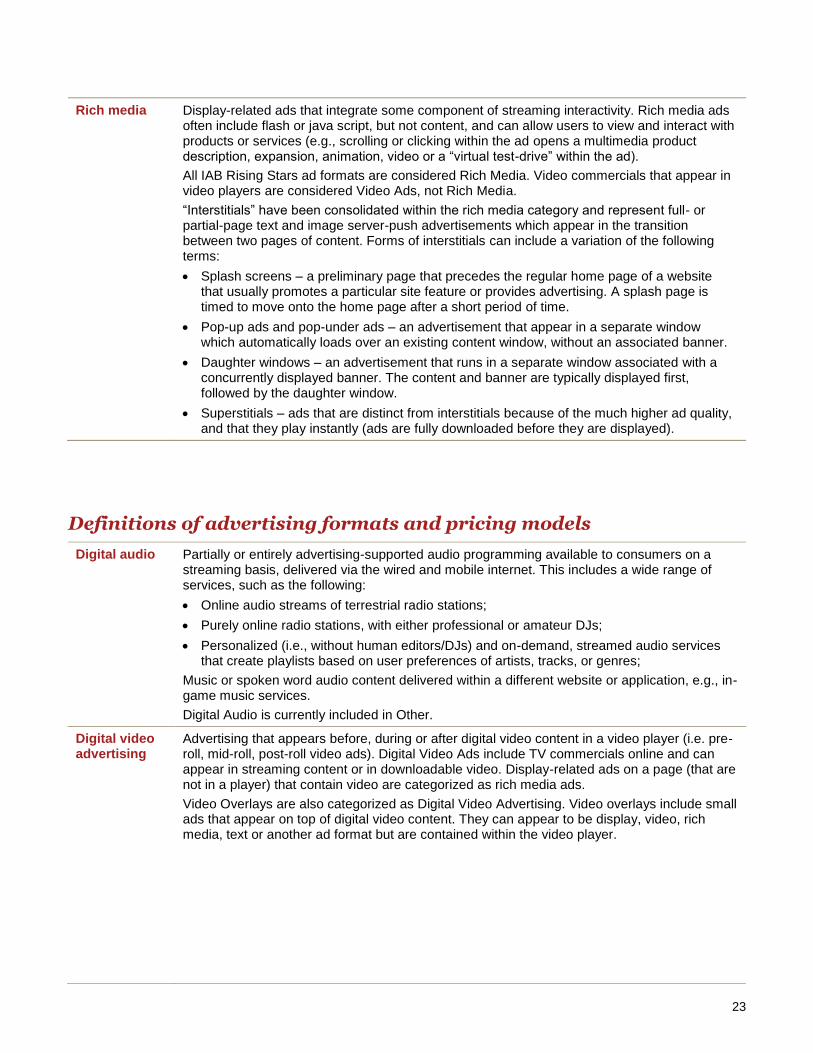
Rich media Display-related ads that integrate some component of streaming interactivity. Rich media ads often include flash or java script, but not content, and can allow users to view and interact with products or services (e.g., scrolling or clicking within the ad opens a multimedia product description, expansion, animation, video or a “virtual test-drive” within the ad).
All IAB Rising Stars ad formats are considered Rich Media. Video commercials that appear in video players are considered Video Ads, not Rich Media.
“Interstitials” have been consolidated within the rich media category and represent full- or partial-page text and image server-push advertisements which appear in the transition between two pages of content. Forms of interstitials can include a variation of the following terms:
Splash screens – a preliminary page that precedes the regular home page of a website that usually promotes a particular site feature or provides advertising. A splash page is timed to move onto the home page after a short period of time.
Pop-up ads and pop-under ads – an advertisement that appear in a separate window which automatically loads over an existing content window, without an associated banner.
Daughter windows – an advertisement that runs in a separate window associated with a concurrently displayed banner. The content and banner are typically displayed first, followed by the daughter window.
Superstitials – ads that are distinct from interstitials because of the much higher ad quality, and that they play instantly (ads are fully downloaded before they are displayed).
Definitions of advertising formats and pricing models
Digital audio Partially or entirely advertising-supported audio programming available to consumers on a streaming basis, delivered via the wired and mobile internet. This includes a wide range of services, such as the following:
Online audio streams of terrestrial radio stations;
Purely online radio stations, with either professional or amateur DJs;
Personalized (i.e., without human editors/DJs) and on-demand, streamed audio services that create playlists based on user preferences of artists, tracks, or genres;
Music or spoken word audio content delivered within a different website or application, e.g., in-game music services.
Digital Audio is currently included in Other.
Digital video advertising
Advertising that appears before, during or after digital video content in a video player (i.e. pre-roll, mid-roll, post-roll video ads). Digital Video Ads include TV commercials online and can appear in streaming content or in downloadable video. Display-related ads on a page (that are not in a player) that contain video are categorized as rich media ads.
Video Overlays are also categorized as Digital Video Advertising. Video overlays include small ads that appear on top of digital video content. They can appear to be display, video, rich media, text or another ad format but are contained within the video player.
24
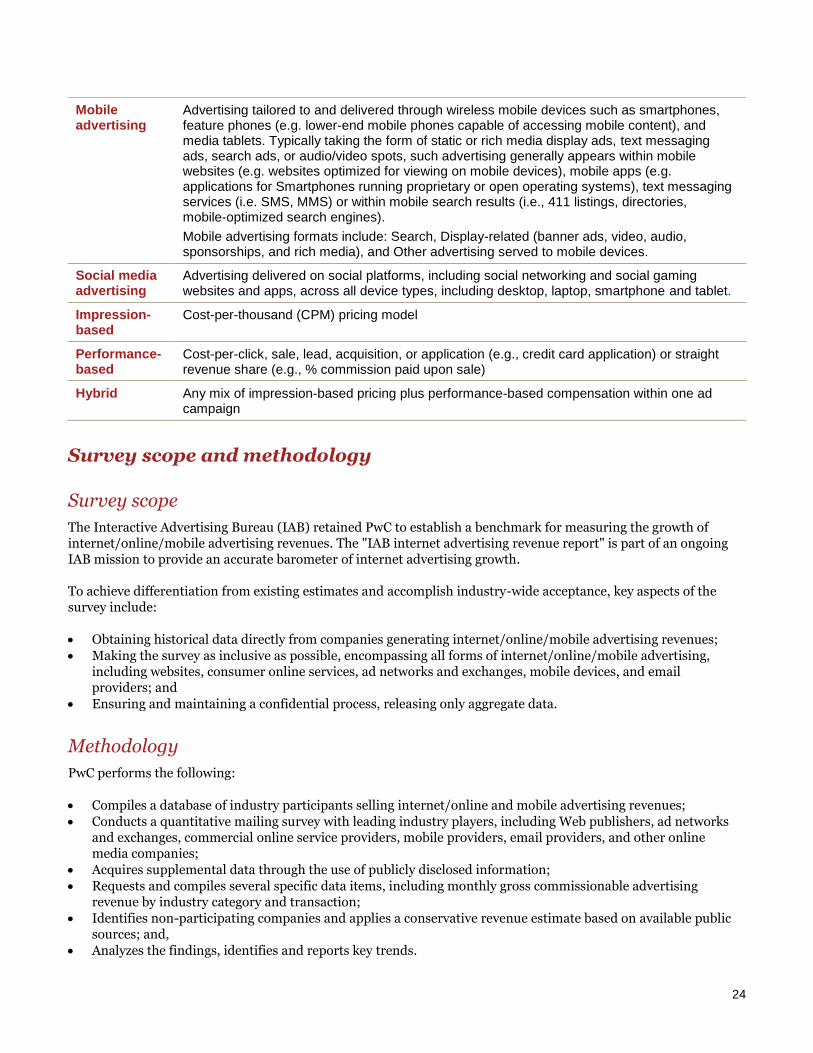
Mobile advertising
Advertising tailored to and delivered through wireless mobile devices such as smartphones, feature phones (e.g. lower-end mobile phones capable of accessing mobile content), and media tablets. Typically taking the form of static or rich media display ads, text messaging ads, search ads, or audio/video spots, such advertising generally appears within mobile websites (e.g. websites optimized for viewing on mobile devices), mobile apps (e.g. applications for Smartphones running proprietary or open operating systems), text messaging services (i.e. SMS, MMS) or within mobile search results (i.e., 411 listings, directories, mobile-optimized search engines).
Mobile advertising formats include: Search, Display-related (banner ads, video, audio, sponsorships, and rich media), and Other advertising served to mobile devices.
Social media advertising
Advertising delivered on social platforms, including social networking and social gaming websites and apps, across all device types, including desktop, laptop, smartphone and tablet.
Impression-based
Cost-per-thousand (CPM) pricing model
Performance-based
Cost-per-click, sale, lead, acquisition, or application (e.g., credit card application) or straight revenue share (e.g., % commission paid upon sale)
Hybrid Any mix of impression-based pricing plus performance-based compensation within one ad campaign
Survey scope and methodology
Survey scope
The Interactive Advertising Bureau (IAB) retained PwC to establish a benchmark for measuring the growth of internet/online/mobile advertising revenues. The "IAB internet advertising revenue report" is part of an ongoing IAB mission to provide an accurate barometer of internet advertising growth.
To achieve differentiation from existing estimates and accomplish industry-wide acceptance, key aspects of the survey include:
Obtaining historical data directly from companies generating internet/online/mobile advertising revenues;
Making the survey as inclusive as possible, encompassing all forms of internet/online/mobile advertising, including websites, consumer online services, ad networks and exchanges, mobile devices, and email providers; and
Ensuring and maintaining a confidential process, releasing only aggregate data.
Methodology
PwC performs the following:
Compiles a database of industry participants selling internet/online and mobile advertising revenues;
Conducts a quantitative mailing survey with leading industry players, including Web publishers, ad networks and exchanges, commercial online service providers, mobile providers, email providers, and other online media companies;
Acquires supplemental data through the use of publicly disclosed information;
Requests and compiles several specific data items, including monthly gross commissionable advertising revenue by industry category and transaction;
Identifies non-participating companies and applies a conservative revenue estimate based on available public sources; and,
Analyzes the findings, identifies and reports key trends.
PwC | IAB internet advertising revenue report 25
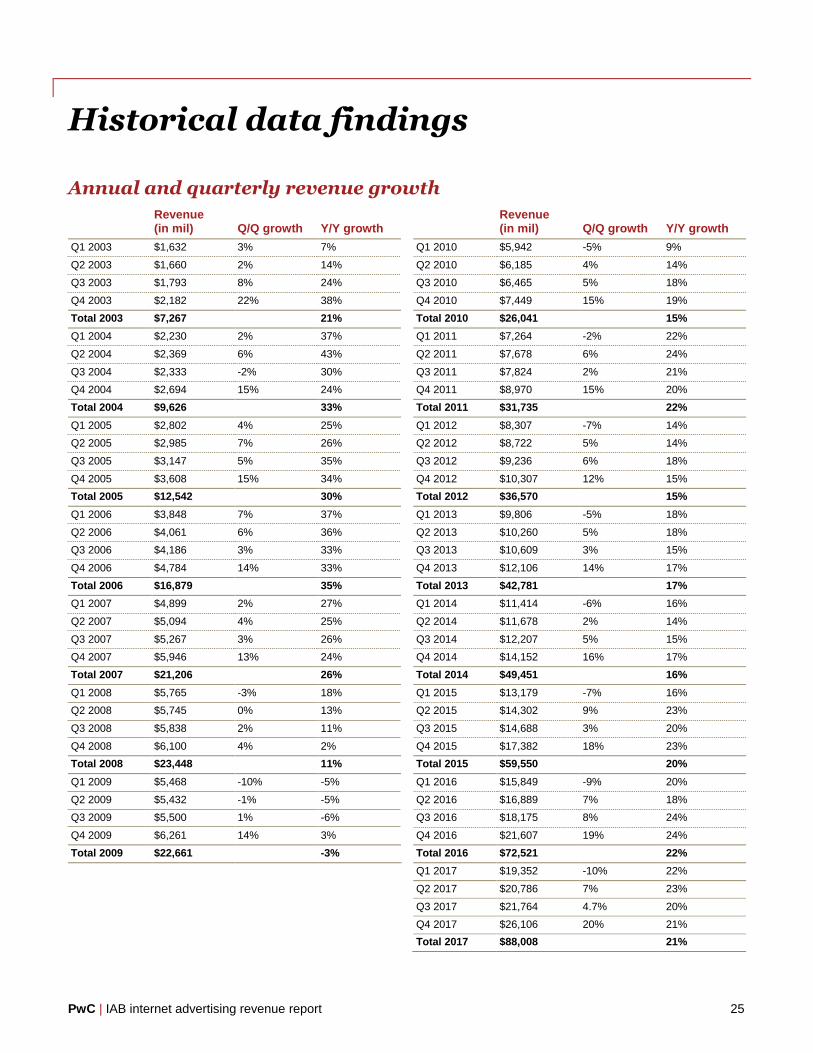
Historical data findings
Annual and quarterly revenue growth
Revenue (in mil) Q/Q growth Y/Y growth
Revenue (in mil) Q/Q growth Y/Y growth
Q1 2003 $1,632 3% 7% Q1 2010 $5,942 -5% 9%
Q2 2003 $1,660 2% 14% Q2 2010 $6,185 4% 14%
Q3 2003 $1,793 8% 24% Q3 2010 $6,465 5% 18%
Q4 2003 $2,182 22% 38% Q4 2010 $7,449 15% 19%
Total 2003 $7,267 21% Total 2010 $26,041 15%
Q1 2004 $2,230 2% 37% Q1 2011 $7,264 -2% 22%
Q2 2004 $2,369 6% 43% Q2 2011 $7,678 6% 24%
Q3 2004 $2,333 -2% 30% Q3 2011 $7,824 2% 21%
Q4 2004 $2,694 15% 24% Q4 2011 $8,970 15% 20%
Total 2004 $9,626 33% Total 2011 $31,735 22%
Q1 2005 $2,802 4% 25% Q1 2012 $8,307 -7% 14%
Q2 2005 $2,985 7% 26% Q2 2012 $8,722 5% 14%
Q3 2005 $3,147 5% 35% Q3 2012 $9,236 6% 18%
Q4 2005 $3,608 15% 34% Q4 2012 $10,307 12% 15%
Total 2005 $12,542 30% Total 2012 $36,570 15%
Q1 2006 $3,848 7% 37% Q1 2013 $9,806 -5% 18%
Q2 2006 $4,061 6% 36% Q2 2013 $10,260 5% 18%
Q3 2006 $4,186 3% 33% Q3 2013 $10,609 3% 15%
Q4 2006 $4,784 14% 33% Q4 2013 $12,106 14% 17%
Total 2006 $16,879 35% Total 2013 $42,781 17%
Q1 2007 $4,899 2% 27% Q1 2014 $11,414 -6% 16%
Q2 2007 $5,094 4% 25% Q2 2014 $11,678 2% 14%
Q3 2007 $5,267 3% 26% Q3 2014 $12,207 5% 15%
Q4 2007 $5,946 13% 24% Q4 2014 $14,152 16% 17%
Total 2007 $21,206 26% Total 2014 $49,451 16%
Q1 2008 $5,765 -3% 18% Q1 2015 $13,179 -7% 16%
Q2 2008 $5,745 0% 13% Q2 2015 $14,302 9% 23%
Q3 2008 $5,838 2% 11% Q3 2015 $14,688 3% 20%
Q4 2008 $6,100 4% 2% Q4 2015 $17,382 18% 23%
Total 2008 $23,448 11% Total 2015 $59,550 20%
Q1 2009 $5,468 -10% -5% Q1 2016 $15,849 -9% 20%
Q2 2009 $5,432 -1% -5% Q2 2016 $16,889 7% 18%
Q3 2009 $5,500 1% -6% Q3 2016 $18,175 8% 24%
Q4 2009 $6,261 14% 3% Q4 2016 $21,607 19% 24%
Total 2009 $22,661 -3% Total 2016 $72,521 22%
Q1 2017 $19,352 -10% 22%
Q2 2017 $20,786 7% 23%
Q3 2017 $21,764 4.7% 20%
Q4 2017 $26,106 20% 21%
Total 2017 $88,008 21%
PwC | IAB internet advertising revenue report 26
About the Interactive Advertising Bureau
The Interactive Advertising Bureau (IAB) empowers the media and marketing industries to thrive in the digital economy. It is comprised of more than 650 leading media and technology companies that are responsible for selling, distributing and optimizing digital advertising and marketing. Together, they account for 86 percent of online advertising in the United States. Working with its member companies, the IAB evaluates and recommends standards and practices and fields critical research on interactive advertising. The organization is committed to professional development, elevating the knowledge, skills, and expertise of individuals across the digital marketing industry. The IAB also educates marketers, agencies, media companies and the wider business community about the value of interactive advertising. Founded in 1996, the IAB is headquartered in New York City.
Overall report guidance provided by IAB leadership
Executive committee
Randall Rothenberg
President and CEO
Scott Schiller
NBC Universal
Rik van der Kooi
Microsoft Advertising
Stu Ingis
Venable LLP
Troy Young
Hearst Magazines Digital Media
Allie Kline
Oath
Meredith Kopit Levien
The New York Times Company
David Moore
Xaxis
David Morri
CBS Corporation
Sridhar Ramaswamy
Vivek Shah
j2 Global
John Toohey
Charter Communications
Lauren Wiener
Tremor Video
Ex-Officio
Founding Chairman
Rich LeFurgy
Archer Advisors
Treasurer
John Toohey
Charter Communications
Secretary
Stu Ingis
Venable LLP
PwC | IAB internet advertising revenue report 27
Board of Directors
Lee Brown
BuzzFeed
Seth Dallaire
Amazon Media Group
Rick Erwin
Acxiom
Rita Ferro
Disney | ABC Television Group
Rajeev Goel
PubMatic
Keith Grossman
Bloomberg
Chris Guenther
NewsCorp
Jed Hartman
The Washington Post
Mark Howard
Forbes Media
Allie Kline
Oath
Meredith Kopit Levien
The New York Times Company
Seth Ladetsky
Turner Broadcasting System
Jeff Lucas
Snapchat
Jean-Philippe Maheu
Peter Naylor
Hulu
Kimberly Norris
Spectrum (Time Warner Cable)
Kirk McDonald
PubMatic
Marian Pittman
Cox Media Group
Penry Price
Sridhar Ramaswamy
Michael Rubenstein
AppNexus
Jonathan Schaaf
Conde Nast
Carrie Siefer
IBM
Samantha Skey
SheKnows Media
Nada Stirratt
John Trimble
Pandora
Jacob Weisberg
Slate
Rick Welday
AT&T AdWorks
Steven Wolfe Pereira
Neustar
Jen Wong
Time Inc. Digital
Troy Young
Hearst Magazines Digital Media
Joe Zawadzki
MediaMath
PwC’s technology and entertainment, media, and communications practices
As business, accounting, and tax advisors to many of the world’s leading Entertainment, Media, and Communications (EMC) and Technology (Tech) companies, PwC (www.pwc.com) has an insider’s view of trends and developments driving the industry. With approximately 1,200 practitioners serving EMC and Tech clients in the United States, PwC is deeply committed to providing clients with industry experience and resources. In recent years, our pioneering work in EMC and Tech has included developing strategies to leverage digital technology, identifying new sources of financing, and marketplace positioning in industries characterized by consolidation and transformation. Our experience reaches across all geographies and segments of the EMC and Tech sectors, including broadband, wireless, the internet, music, film, television, publishing, advertising, gaming, theme parks, computers and networking, and software. With thousands of practitioners around the world, we're always close at hand to provide deep industry knowledge and resources.
Our services include
Business assurance services
Web audience measurement and advertising delivery auditing and advisory
IAB Measurement Certification Compliance auditing
Privacy policy structuring, attestation, and compliance advisory
Mergers & acquisitions assistance
Tax planning and compliance
Capital sourcing and IPO assistance
Marketing & Media operations enablement
© 2018 PwC. All rights reserved. PwC refers to the US member firm or one of its subsidiaries or affiliates, and may sometimes refer to the PwC network. Each member firm is a separate legal entity. Please see www.pwc.com/structure for further details.
For more information, contact one of the following PwC professionals:
PwC has exercised reasonable care in the collecting, processing, and reporting of this information but has not independently verified, validated, or audited the data to verify the accuracy or completeness of the information. PwC gives no express or implied warranties, including but not limited to any warranties of merchantability or fitness for a particular purpose or use and shall not be liable to any entity or person using this document, or have any liability with respect to this document.
This content is for general information purposes only, and should not be used as a substitute for consultation with professional advisors.
New York David Silverman Partner, Assurance Services 646.471.5421 [email protected]
New York Brian Gaffney Manager, Advisory Services 646.471.4722 [email protected]