Embed Size (px)
Citation preview
J Grid Computing (2016) 14:283–297DOI 10.1007/s10723-015-9357-4
IaaSMon: Monitoring Architecture for Public CloudComputing Data Centers
Juan Gutierrez-Aguado · Jose M. Alcaraz Calero ·Wladimiro Diaz Villanueva
Received: 2 June 2014 / Accepted: 23 November 2015 / Published online: 4 March 2016© The Author(s) 2016. This article is published with open access at Springerlink.com
Abstract Monitoring of cloud computing infrastruc-tures is an imperative necessity for cloud providersand administrators to analyze, optimize and discoverwhat is happening in their own infrastructures. Currentmonitoring solutions do not fit well for this purposemainly due to the incredible set of new requirementsimposed by the particular requirements associated tocloud infrastructures. This paper describes in detailthe main reasons why current monitoring solutionsdo not work well. Also, it provides an innovativemonitoring architecture that enables the monitoringof the physical and virtual machines available withina cloud infrastructure in a non-invasive and trans-parent way making it suitable not only for privatecloud computing but also for public cloud comput-ing infrastructures. This architecture has been vali-dated by means of a prototype integrating an existingenterprise-class monitoring solution, Nagios, with the
J. Gutierrez-Aguado · W. Diaz VillanuevaDepartament d’Informatica, Universitat de Valencia, Avda.De la Universitat, s/n 46100 Burjassot, Valencia, Spain
J. Gutierrez-Aguadoe-mail: [email protected]
W. Diaz Villanuevae-mail: [email protected]
J. M. Alcaraz Calero (�)School of Engineering and Computing, Universityof the West of Scotland, Paisley Campus, Paisley,PA1 2BE, Scotlande-mail: [email protected]
control and data planes of OpenStack, a well-knownstack for cloud infrastructures. As a result, our newmonitoring architecture is able to extend the exitingNagios functionalities to fit in the monitoring of cloudinfrastructures. The proposed architecture has beendesigned, implemented and released as open source tothe scientific community. The proposal has also beenempirically validated in a production-level cloud com-puting infrastructure running a test bed with up to128 VMswhere overhead and responsiveness has beencarefully analyzed.
Keywords Cloud computing · Monitoring ·Distributed monitoring · Network management ·Infrastructure-as-a-service
1 Introduction
Cloud computing is changing radically the way inwhich businesses, governments, researches and con-sumers are using computational power. Cloud Compu-ting enables them to make better use of their own com-putational resources (private cloud) and to rent com-putational resources to third-parties on-demand (pub-lic cloud) to satisfy their constantly changing compu-tational requirements. Public cloud infrastructures areassociated to scenarios where cloud users do not haveany control over the management of the physicaltopology of the infrastructures where they are rentingvirtual machines (aka VMs), i.e. virtual topologies.
284 J. Gutierrez-Aguado et al.
However, users have control over their rented VMsand what services are being executed therein.
From the point of view of the cloud provider, itis imperative to analyze, optimize and discover whatis happening in their entire infrastructure. To do so,monitoring tools are essential to identify anomalies,analyze behavior, optimize infrastructure resources,provide feedback to consumer, check infrastructurehealthy, perform auto-scaling of resources [11], allo-cate resources in multi-clouds [9, 15], or monitorService Level Agreement [3]. The vast majority ofmonitoring tools available in the market do not fitfor the purpose of monitoring cloud infrastructures.On the one hand, their architectural design usuallyimposes the installation of a software agent in theresources to be monitored to extract metrics. However,cloud users are especially reluctant to run any kindof services/software in their rented VMs for providinginformation to third parties so that this requirementis simply not acceptable in cloud environments. Onthe other hand, current monitoring tools do not dealefficiently with the new life-cycle associated to vir-tual topologies. For example, current monitoring toolsassume that monitored resources will remain alwayswith the same IP address. Then, if such address is notresponding, it is assumed that resources are shutdownor failing. However, this is not true at all in cloudinfrastructures where IP addresses are being highlyreused and dynamically assigned to different VMs ina matter of seconds. Traditional monitoring solutionswill not realize of this re-use of IP addresses and willconsider the monitored resource always to be sameone even when they are now monitoring a completelydifferent resource. These facts make difficult for cloudproviders to implement effective monitoring solutionsfor their infrastructure and it is required the designof novel non-intrusive monitoring solutions runningin a transparent way from the point of view of thecloud users whereas they provide accurate informa-tion for the cloud provider. This is exactly the mainmotivation of this research work. Our contributionis, to the best of our knowledge, the first attempt tointegrate both the control and data planes of a cloudcomputing infrastructure with an existing monitoringtool to fit in the monitoring of the completely newlife-cycle associated to virtual cloud infrastructures.This novel integration provides an effective monitor-ing solution for public cloud infrastructures allowing
a transparent monitoring of the customer s VMs, andat same time, an agent-based monitoring of the rest ofthe resources such as physical machines, hard disks,etc. The following list of requirements summarizes thekey and unique features and requirements that makethe monitoring of public cloud computing infrastruc-tures a challenge. Some of these items are alreadyavailable in almost all the current monitoring solu-tions; however, some others are simply not supportednowadays:
– R1. To perform a transparent monitoring of VMs(no tools installed in the customer s VM)
– R2. To perform an agent-based monitoring of themanagement VMs
– R3. To perform an agent-based monitoring of thephysical machines
– R4. To enable correlation between metrics fromVMs and physical machines where they are allo-cated.
– R5. To quickly adapt against frequent changes inthe virtual topology using efficient auto-discoveryprotocols.
– R6. To quickly adapt against IP address re-assignation.
– R7. To quickly adapt against changes in VM state(VM life-cycle).
– R8. To integrate the monitoring architecture withthe management plane of the cloud stack to keepcontinuously synchronized the status of the cloudstack and the monitoring tool.
– R9. To integrate the monitoring architecture withthe data plane of the cloud stack to keep continu-ously synchronized the status of the VMs and themonitoring tool.
– R10. To be high scalable, suitable for monitoringlarge amount of resources efficiently.
More than 50 different monitoring solutions havebeen analyzed in this work. None of them meet allthese requirements simultaneous. It is not our purposeto provide a completely new monitoring frameworkdesigned from scratch. An analysis of existing moni-toring tools has been done (lately explained in detailin Section 2) to select a good candidate to be extendedand adapted to fulfill all these requirements and thusmaking it suitable for the monitoring of cloud infras-tructures. According to a recent study performed by
IaaSMon: Monitoring Architecture for Public Cloud Computing Data Centers 285
Dataloop,1 Nagios is the dominant monitoring tool forcloud infrastructures in the market even if it has not yetcompletely being adapted for such purpose. Nagioshas been selected as a base monitoring software tobe extended in this research work due to its flexibil-ity, world-wide acceptance, suitability for large-scaledeployments, due to the incredibly large number ofextensions available and specially due to the factthat auto discovery algorithms of new resources iscompletely customizable.
The proposed architecture described in this con-tribution provides support for all the above list ofrequirements. To achieve it, the architecture is basedon the integration between the monitoring tool, andits resource discovery protocol, and the control anddata planes of the cloud computing infrastructure.This integration is in fact our main contribution. Thearchitecture has been prototypically implemented bymeans of the integration between OpenStack, a well-known enterprise-class cloud computing stack usedfor both private and public cloud computing infras-tructure and Nagios, an enterprise-class distributedmonitoring tool. When users interact with OpenStack,a series of messages are interchanged between thedifferent modules available in the cloud stack. Ourarchitecture intercepts all these messages and extractstopology information to be lately integrated in Nagios.The proposal has been implemented and released asopen source project to the community. It has alsobeen validated in a production-level cloud computinginfrastructure running a mid-size test bed with 128VMs.
To describe the contribution, this paper has beenorganized as follows: Section 2 provides an updatedstate-of-the-art in monitoring solutions for cloudinfrastructures. After that, Section 3 shortly describesthe basic concepts about the different componentsinvolved in the cloud computing infrastructure tohave a self-contained contribution. Then, Section 4provides an overview of a traditional high scalabledistributed monitoring solution to enable the readerto realize what the changes are required to fit incloud computing infrastructures. After that, Section 5is focused on the main contribution, explaining the
1What we learnt talking to 60 companies about monitoring,Information available at http://blog.dataloop.io/2014/01/30/what-we-learnt-talking-to-60-companies-about-monitoring/
design of the monitoring architecture proposed. Then,Section 6 provides implementation details of the pro-posed architecture. Section 7 describes the differenttest beds carried out and the intensive testing donein order to validate both the architecture and proto-type presented. And finally, Section 8 describes someconclusions about this contribution.
2 Related Works
Open source monitoring solutions for cloud infras-tructures are really scarce and only a few proofs ofconcept are available. Brandt et al. [2] provide OVIS, adistributed monitoring infrastructure for High Perfor-mance Computing (HPC).Wuhib and Stadler [18] alsoprovide a distributed monitoring framework for largecloud infrastructures. Kertesz [8] provides an archi-tecture where different cloud providers collect infor-mation to decide where to allocate new resources in afederated environment. Dhingra et al. [6] also providea solution for monitoring resources in cloud infras-tructures. Although these works are good attempts,they cannot really fit in public cloud computing infras-tructures because they impose the installation of soft-ware in the customer s VMs. This is not acceptablein production-level scenarios. Would you enable otherpeople to install software in your machine?
Other approaches such as Moses et al. [14],Romano et at. [17], Massonet et at. [12] and Koeniget al. [10] are designed to monitor specific metricsto provide an added value in the cloud infrastructurelike efficient VM migrations, QoS, Data Location andcross-layer monitoring, respectively. Although theyare good contributions to the state-of-the-art, they areoptimized for specific purposes and do not providesupport for: i) monitoring of the virtualization layer;ii) monitoring for large-scale infrastructures; iii) trans-parent monitoring from the customer s perspective; iv)general purpose and extensible monitoring.
An alternative is to take traditional network mon-itoring tool for IT infrastructures and to adapt themto the new requirements imposed by the public cloudcomputing environment. Nagios,2 Icinga,3 Zennoss,4
2http://www.nagios.org/3https://www.icinga.org/4http://www.zenoss.com/
286 J. Gutierrez-Aguado et al.
Zabbix5 and OpenNMS6 are good examples of tra-ditional free tools whereas Nimsoft Monitoring Solu-tion7 and LiveAction8 are good examples of com-mercial ones. From more than 50 tools have beenanalyzed. Then, those that impose the use of monitor-ing agents like, for example, Pandora FMS, Ganglia,and XyMon have been discarded due to the fact that itis required a transparent monitoring approach for cus-tomer s VMs. It has also been discarded commercialsolutions and those that do not provide source coderequired to enable the integration and/or extension ofthe monitoring tools to fit in cloud infrastructures.As a result, the five free tools previous indicatedwere identified as the best candidates. None of thesetools are suitable for monitoring cloud infrastructuremainly due to the fact that they do not detect: frequentchanges in the topology of the virtual infrastructure,IP address re-assignation to different resources anddestruction of virtual resources. Concretely, Zabbix,Zenoss and OpenNMS come with auto-discovery pro-tocols that are not suitable for virtual topologies forthe same reasons previous described. The proposedarchitecture described in this contribution is basedon the integration of the control and data planes ofthe cloud infrastructure providing a new auto-discoverprotocol. This fact requires the selection of a monitor-ing architecture that enables the customization of suchprotocol and thus these three solutions were discarded.Between Icinga and Nagios, Nagios seems to be thebetter candidate due to its incredible dominance in themarket and due to the fact that it has been proven tobe suitable for monitoring very large enterprise-classinfrastructures. This is the main reason why we haveseleceted Nagios.
Aceto et al. [1] have recently provided a com-plete survey about monitoring architectures for cloudcomputing infrastructures. This survey describes anumber of commercial solutions like CloudWatch,9
AzureWatch,10 CloudKick,11 and CloudStatus,12 toname a few. However, these commercial vendors have
5http://www.zabbix.com/6http://www.opennms.org/7http://www.nimsoft.com/solutions/nimsoft-monitor.html8http://www.actionpacked.com/products/qos-monitor9http://aws.amazon.com/es/cloudwatch/10http://www.paraleap.com/azurewatch11http://www.rackspace.com/cloudkick/12https://status.rackspace.com/
not published how they implement internally theirmonitoring architecture. In fact, the main intentionof this paper is to describe an open-source proto-type which possibly provides most of the servicesavailable in such commercial products. In this sur-vey, it is also described several open-source andcommercial downloadable monitoring architectureslike OpenNebula Monitoring Subsystem [13], Nim-bus Project,13 CloudStack ZenPack,14 Hyperic-HQ,15
PCMONS [5], Sensu,16 Nagios and Dargos [16].Dargos [16] comes with a small set of built-in sen-
sors so that this is a clear disadvantage when comparedwith the available number of plugins already devel-oped for Nagios. Extensibility is a property that mon-itoring systems should fulfil to be suitable for cloudinfrastructures. There are some approximations in theliterature that follows the approach of adapting Nagiosto fit in cloud infrastructures. Aparecida de Chaves etal. [5] developed an architecture designed for runningin private clouds so that the solution does not fulfillthe requirements indicated in Section 1. For instance,they install scripts into the VMs leading to a validsolution only for private clouds where all the VMsbelong to the same organization. However, this is notadmissible in public clouds where VMs are belong-ing to customers. G. Katsaros et al. [7] proposed acomponent for monitoring cloud infrastructure that isnotified through the Nagios Event Broker API. Thiscomponent exposes the data received from Nagiosthrough a REST service. The idea of good, however,authors do not described how Nagios is adapted toreflect the allocation/ de-allocation of VMs and IPaddresses which is one of the main adaptions requiredto fit in cloud infrastructures. Also, there is not anyempirical validation of the proposed architecture sothat it is impossible to validate and reproduce it.Finally, M. Barbosa et al. [4] proposed a set of Nagiosplugins to make Nagios aware of VMs. They pro-posed two strategies to discover VMs: an active checkwhere a plugin is installed in each physical machineand then Nagios execute them periodically usingNRPE;17 and, a passive checks in which each physical
13http://www.nimbusproject.org/downloads/14http://wiki.zenoss.org/ZenPack:CloudStack15http://www.hyperic.com/downloads16http://sensuapp.org/17http://exchange.nagios.org/directory/ Addons/Monitoring-Agents/NRPE–2D-Nagios-Remote-Plugin-Executor/details
IaaSMon: Monitoring Architecture for Public Cloud Computing Data Centers 287
machine runs a cron task that informs Nagios serverthrough NSCA.18 Their solution allows also the map-ping between physical and virtual machines using theNagios Event Broker. This solution involves a signifi-cant generation of network traffic during VM discov-ery phase. Also, it makes Nagios aware of new VMsand any topology changes with a significant delaydetermined by the time interval in active checks or thecron task interval in passive checks which is a cleartrade-off with respect to the network traffic generated.In our solution, VMs are registered in Nagios evenbefore they can be reached by ICMP ping and no addi-tional network traffic is generated in the VM discoveryphase which is a clear advantage and differentiatingpoint.
Ceilometer19 is an OpenStack optional module thatprovides services to collect measurements of the uti-lization of the physical and virtual resources deployedin the clouds infrastructure. Although, this modulehas been designed for billing purposes, it could beconsidered as a monitoring tool suitable for cloudinfrastructures. Ceilometer is integrated in the controlplane of the cloud infrastructure. It can retrieve a num-ber of metrics directly form the physical machines. Italso can extract metrics from the control plane aboutthe virtual machines by interrogating the hypervisorand thus achieving a transparent monitoring. How-ever, Ceilometer has not been designed as monitoringtool and thus, it has not been integrated with the dataplane of the cloud infrastructure. In consequence, itdoes not have real connectivity with the VMs avail-able in the infrastructure. This fact limits significantlythe number of metrics Ceilometer can extract fromthe VMs. Our proposed architecture goes a step for-ward in the state of the art achieving a completeintegration with both control and data planes and thenachieving a wide range of metrics gathered directlyfrom the VMs using agent-less monitoring approach.This is a differentiating aspect of our proposedarchitecture.
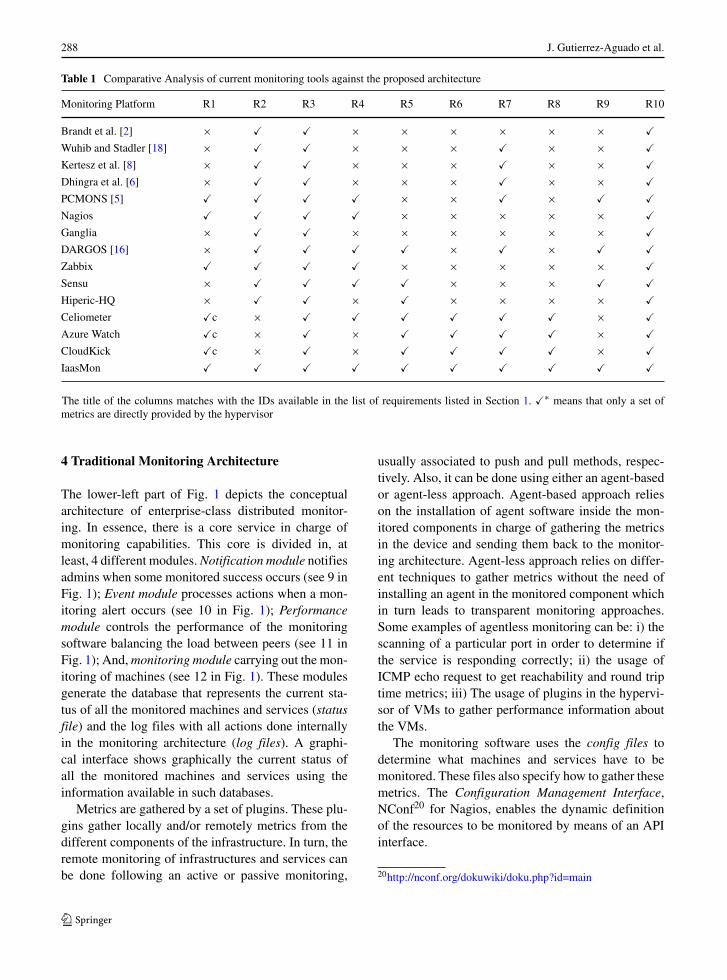
Table 1 shows a complete analysis of the require-ments that a monitoring tool should fulfill to be
18http://exchange.nagios.org/directory/Addons/Passive-Checks/NSCA--2D-Nagios-Service-Check-Acceptor/details19https://wiki.openstack.org/wiki/celiometer
suitable for cloud infrastructures (previously listed inSection 1) compared against all the relevant relatedworks indicated in this section and how the pro-posed architecture is going a step forward in the stateof the art. As the reader can see, IaaSMon is theonly one simultaneously providing support for all therequirements identified.
3 Cloud Computing Architecture
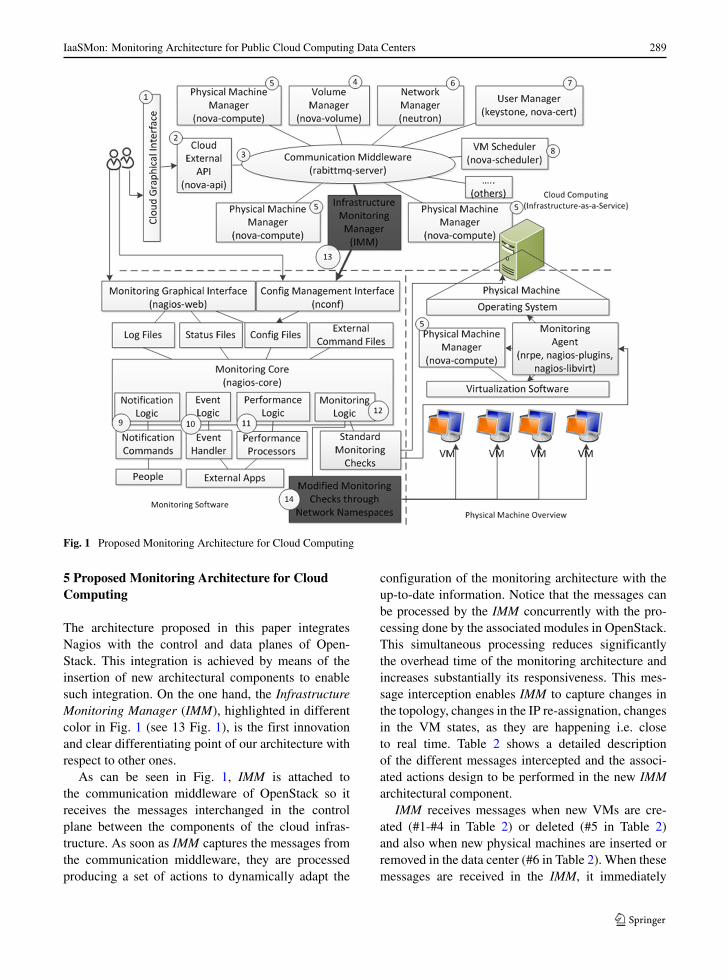
Figure 1shows the basic components available in acloud computing stack for managing cloud infrastruc-tures. Each component in this figure has in parenthesisthe name of such service inside OpenStack, this infor-mation clarifies the correspondence between designand implementation. In summary, there is a graphicalinterface where users can ask for new computationalresources (see 1 in Fig. 1). These requests are receivedby the cloud API (see 2 in Fig. 1) which inserts therequest into the communication middleware (see 3 inFig. 1). This middleware interconnects all the mod-ules available in the cloud stack. Depending on thetype of request, the messages will travel along differ-ent modules in order to achieve its original goal. Thereare modules for: managing volume storage (see 4 inFig. 1) deployed in specialized storage computer; forregistering new physical machines (see 5 in Fig. 1)that lately are used for placing VMs; for managingthe networking of VMs (see 6 in Fig. 1); for manag-ing users and authentication schemes (see 7 in Fig. 1);and finally, there are also services for deciding whereto place new VMs (see 8 in Fig. 1) by means ofscheduling algorithms. We refer the reader to Open-Stack documentation for further details about suchmodules.
Cloud computing systems are designed to workin highly distributed systems so that the commu-nication middleware may provide approaches forasynchronously decoupling the different modulesof the architecture. Generally, this decoupling isachieved using message buses based on queues usedto send/receive messages to/from the different mod-ules. These modules are distributed in the physi-cal machines where the infrastructure is deployed.Besides, the physical machines run a virtualizationlayer that manages VMs. The complete overview ofthis virtualization stack can be seen in the lower-rightside of Fig. 1.
288 J. Gutierrez-Aguado et al.
Table 1 Comparative Analysis of current monitoring tools against the proposed architecture
Monitoring Platform R1 R2 R3 R4 R5 R6 R7 R8 R9 R10
Brandt et al. [2] × � � × × × × × × �Wuhib and Stadler [18] × � � × × × � × × �Kertesz et al. [8] × � � × × × � × × �Dhingra et al. [6] × � � × × × � × × �PCMONS [5] � � � � × × � × � �Nagios � � � � × × × × × �Ganglia × � � × × × × × × �DARGOS [16] × � � � � × � × � �Zabbix � � � � × × × × × �Sensu × � � � � × × × � �Hiperic-HQ × � � × � × × × × �Celiometer �c × � � � � � � × �Azure Watch �c × � × � � � � × �CloudKick �c × � × � � � � × �IaasMon � � � � � � � � � �
The title of the columns matches with the IDs available in the list of requirements listed in Section 1. �∗ means that only a set ofmetrics are directly provided by the hypervisor
4 Traditional Monitoring Architecture
The lower-left part of Fig. 1 depicts the conceptualarchitecture of enterprise-class distributed monitor-ing. In essence, there is a core service in charge ofmonitoring capabilities. This core is divided in, atleast, 4 different modules.Notification module notifiesadmins when some monitored success occurs (see 9 inFig. 1); Event module processes actions when a mon-itoring alert occurs (see 10 in Fig. 1); Performancemodule controls the performance of the monitoringsoftware balancing the load between peers (see 11 inFig. 1); And,monitoring module carrying out the mon-itoring of machines (see 12 in Fig. 1). These modulesgenerate the database that represents the current sta-tus of all the monitored machines and services (statusfile) and the log files with all actions done internallyin the monitoring architecture (log files). A graphi-cal interface shows graphically the current status ofall the monitored machines and services using theinformation available in such databases.
Metrics are gathered by a set of plugins. These plu-gins gather locally and/or remotely metrics from thedifferent components of the infrastructure. In turn, theremote monitoring of infrastructures and services canbe done following an active or passive monitoring,
usually associated to push and pull methods, respec-tively. Also, it can be done using either an agent-basedor agent-less approach. Agent-based approach relieson the installation of agent software inside the mon-itored components in charge of gathering the metricsin the device and sending them back to the monitor-ing architecture. Agent-less approach relies on differ-ent techniques to gather metrics without the need ofinstalling an agent in the monitored component whichin turn leads to transparent monitoring approaches.Some examples of agentless monitoring can be: i) thescanning of a particular port in order to determine ifthe service is responding correctly; ii) the usage ofICMP echo request to get reachability and round triptime metrics; iii) The usage of plugins in the hypervi-sor of VMs to gather performance information aboutthe VMs.
The monitoring software uses the config files todetermine what machines and services have to bemonitored. These files also specify how to gather thesemetrics. The Configuration Management Interface,NConf20 for Nagios, enables the dynamic definitionof the resources to be monitored by means of an APIinterface.
20http://nconf.org/dokuwiki/doku.php?id=main
IaaSMon: Monitoring Architecture for Public Cloud Computing Data Centers 289
Fig. 1 Proposed Monitoring Architecture for Cloud Computing
5 Proposed Monitoring Architecture for CloudComputing
The architecture proposed in this paper integratesNagios with the control and data planes of Open-Stack. This integration is achieved by means of theinsertion of new architectural components to enablesuch integration. On the one hand, the InfrastructureMonitoring Manager (IMM), highlighted in differentcolor in Fig. 1 (see 13 Fig. 1), is the first innovationand clear differentiating point of our architecture withrespect to other ones.
As can be seen in Fig. 1, IMM is attached tothe communication middleware of OpenStack so itreceives the messages interchanged in the controlplane between the components of the cloud infras-tructure. As soon as IMM captures the messages fromthe communication middleware, they are processedproducing a set of actions to dynamically adapt the
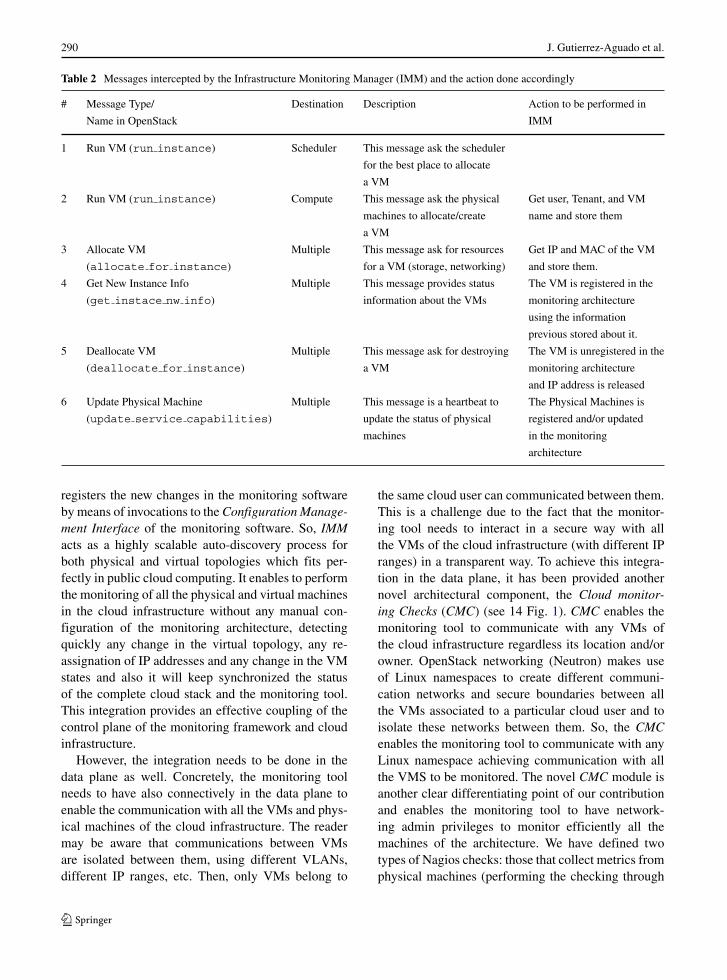
configuration of the monitoring architecture with theup-to-date information. Notice that the messages canbe processed by the IMM concurrently with the pro-cessing done by the associated modules in OpenStack.This simultaneous processing reduces significantlythe overhead time of the monitoring architecture andincreases substantially its responsiveness. This mes-sage interception enables IMM to capture changes inthe topology, changes in the IP re-assignation, changesin the VM states, as they are happening i.e. closeto real time. Table 2 shows a detailed descriptionof the different messages intercepted and the associ-ated actions design to be performed in the new IMMarchitectural component.
IMM receives messages when new VMs are cre-ated (#1-#4 in Table 2) or deleted (#5 in Table 2)and also when new physical machines are inserted orremoved in the data center (#6 in Table 2). When thesemessages are received in the IMM, it immediately
290 J. Gutierrez-Aguado et al.
Table 2 Messages intercepted by the Infrastructure Monitoring Manager (IMM) and the action done accordingly
# Message Type/ Destination Description Action to be performed in
Name in OpenStack IMM
1 Run VM (run instance) Scheduler This message ask the scheduler
for the best place to allocate
a VM
2 Run VM (run instance) Compute This message ask the physical Get user, Tenant, and VM
machines to allocate/create name and store them
a VM
3 Allocate VM Multiple This message ask for resources Get IP and MAC of the VM
(allocate for instance) for a VM (storage, networking) and store them.
4 Get New Instance Info Multiple This message provides status The VM is registered in the
(get instace nw info) information about the VMs monitoring architecture
using the information
previous stored about it.
5 Deallocate VM Multiple This message ask for destroying The VM is unregistered in the
(deallocate for instance) a VM monitoring architecture
and IP address is released
6 Update Physical Machine Multiple This message is a heartbeat to The Physical Machines is
(update service capabilities) update the status of physical registered and/or updated
machines in the monitoring
architecture
registers the new changes in the monitoring softwareby means of invocations to theConfigurationManage-ment Interface of the monitoring software. So, IMMacts as a highly scalable auto-discovery process forboth physical and virtual topologies which fits per-fectly in public cloud computing. It enables to performthe monitoring of all the physical and virtual machinesin the cloud infrastructure without any manual con-figuration of the monitoring architecture, detectingquickly any change in the virtual topology, any re-assignation of IP addresses and any change in the VMstates and also it will keep synchronized the statusof the complete cloud stack and the monitoring tool.This integration provides an effective coupling of thecontrol plane of the monitoring framework and cloudinfrastructure.
However, the integration needs to be done in thedata plane as well. Concretely, the monitoring toolneeds to have also connectively in the data plane toenable the communication with all the VMs and phys-ical machines of the cloud infrastructure. The readermay be aware that communications between VMsare isolated between them, using different VLANs,different IP ranges, etc. Then, only VMs belong to
the same cloud user can communicated between them.This is a challenge due to the fact that the monitor-ing tool needs to interact in a secure way with allthe VMs of the cloud infrastructure (with different IPranges) in a transparent way. To achieve this integra-tion in the data plane, it has been provided anothernovel architectural component, the Cloud monitor-ing Checks (CMC) (see 14 Fig. 1). CMC enables themonitoring tool to communicate with any VMs ofthe cloud infrastructure regardless its location and/orowner. OpenStack networking (Neutron) makes useof Linux namespaces to create different communi-cation networks and secure boundaries between allthe VMs associated to a particular cloud user and toisolate these networks between them. So, the CMCenables the monitoring tool to communicate with anyLinux namespace achieving communication with allthe VMS to be monitored. The novel CMC module isanother clear differentiating point of our contributionand enables the monitoring tool to have network-ing admin privileges to monitor efficiently all themachines of the architecture. We have defined twotypes of Nagios checks: those that collect metrics fromphysical machines (performing the checking through
IaaSMon: Monitoring Architecture for Public Cloud Computing Data Centers 291
the control plane), and those that collect metrics fromvirtual machines (performing the checking through thedata plane - using the namespace of the network wherethe VM are located).
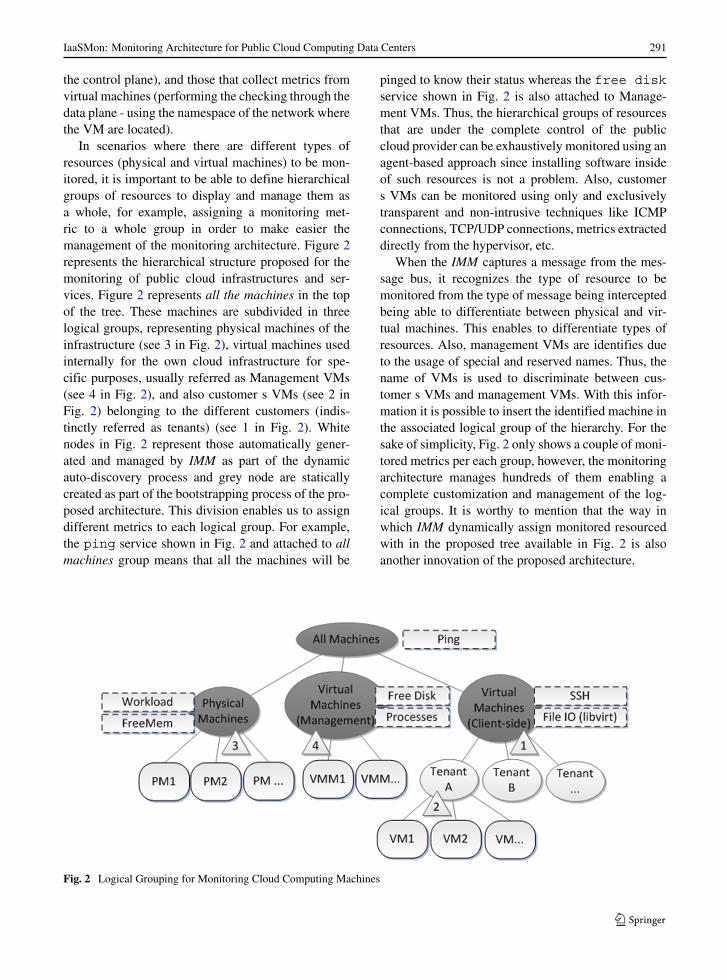
In scenarios where there are different types ofresources (physical and virtual machines) to be mon-itored, it is important to be able to define hierarchicalgroups of resources to display and manage them asa whole, for example, assigning a monitoring met-ric to a whole group in order to make easier themanagement of the monitoring architecture. Figure 2represents the hierarchical structure proposed for themonitoring of public cloud infrastructures and ser-vices. Figure 2 represents all the machines in the topof the tree. These machines are subdivided in threelogical groups, representing physical machines of theinfrastructure (see 3 in Fig. 2), virtual machines usedinternally for the own cloud infrastructure for spe-cific purposes, usually referred as Management VMs(see 4 in Fig. 2), and also customer s VMs (see 2 inFig. 2) belonging to the different customers (indis-tinctly referred as tenants) (see 1 in Fig. 2). Whitenodes in Fig. 2 represent those automatically gener-ated and managed by IMM as part of the dynamicauto-discovery process and grey node are staticallycreated as part of the bootstrapping process of the pro-posed architecture. This division enables us to assigndifferent metrics to each logical group. For example,the ping service shown in Fig. 2 and attached to allmachines group means that all the machines will be
pinged to know their status whereas the free diskservice shown in Fig. 2 is also attached to Manage-ment VMs. Thus, the hierarchical groups of resourcesthat are under the complete control of the publiccloud provider can be exhaustively monitored using anagent-based approach since installing software insideof such resources is not a problem. Also, customers VMs can be monitored using only and exclusivelytransparent and non-intrusive techniques like ICMPconnections, TCP/UDP connections, metrics extracteddirectly from the hypervisor, etc.
When the IMM captures a message from the mes-sage bus, it recognizes the type of resource to bemonitored from the type of message being interceptedbeing able to differentiate between physical and vir-tual machines. This enables to differentiate types ofresources. Also, management VMs are identifies dueto the usage of special and reserved names. Thus, thename of VMs is used to discriminate between cus-tomer s VMs and management VMs. With this infor-mation it is possible to insert the identified machine inthe associated logical group of the hierarchy. For thesake of simplicity, Fig. 2 only shows a couple of moni-tored metrics per each group, however, the monitoringarchitecture manages hundreds of them enabling acomplete customization and management of the log-ical groups. It is worthy to mention that the way inwhich IMM dynamically assign monitored resourcedwith in the proposed tree available in Fig. 2 is alsoanother innovation of the proposed architecture.
Fig. 2 Logical Grouping for Monitoring Cloud Computing Machines
292 J. Gutierrez-Aguado et al.
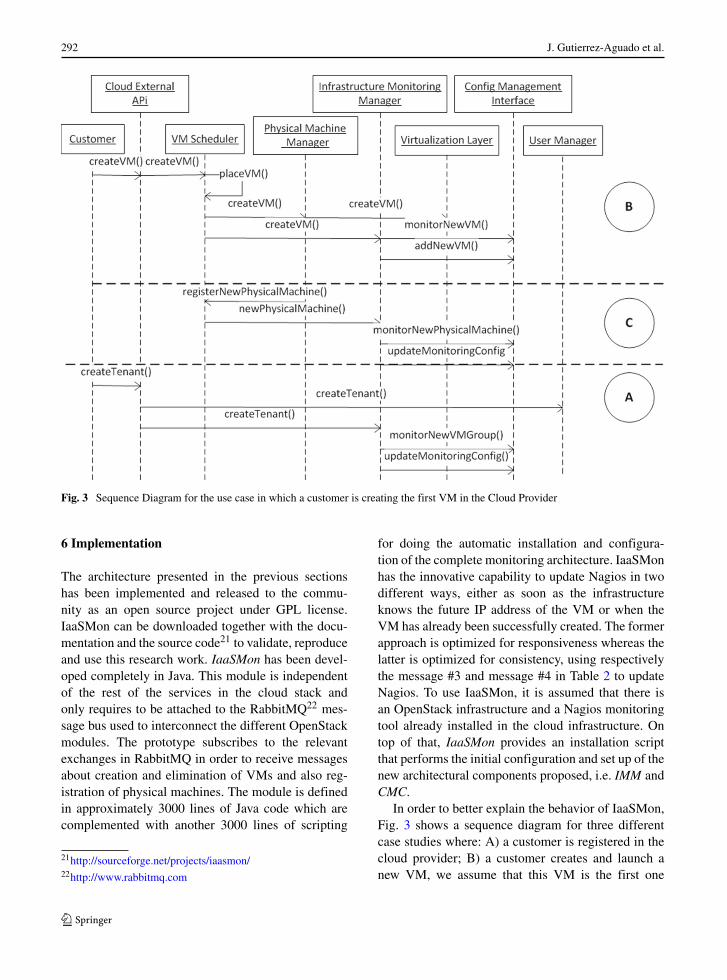
Fig. 3 Sequence Diagram for the use case in which a customer is creating the first VM in the Cloud Provider
6 Implementation
The architecture presented in the previous sectionshas been implemented and released to the commu-nity as an open source project under GPL license.IaaSMon can be downloaded together with the docu-mentation and the source code21 to validate, reproduceand use this research work. IaaSMon has been devel-oped completely in Java. This module is independentof the rest of the services in the cloud stack andonly requires to be attached to the RabbitMQ22 mes-sage bus used to interconnect the different OpenStackmodules. The prototype subscribes to the relevantexchanges in RabbitMQ in order to receive messagesabout creation and elimination of VMs and also reg-istration of physical machines. The module is definedin approximately 3000 lines of Java code which arecomplemented with another 3000 lines of scripting
21http://sourceforge.net/projects/iaasmon/22http://www.rabbitmq.com
for doing the automatic installation and configura-tion of the complete monitoring architecture. IaaSMonhas the innovative capability to update Nagios in twodifferent ways, either as soon as the infrastructureknows the future IP address of the VM or when theVM has already been successfully created. The formerapproach is optimized for responsiveness whereas thelatter is optimized for consistency, using respectivelythe message #3 and message #4 in Table 2 to updateNagios. To use IaaSMon, it is assumed that there isan OpenStack infrastructure and a Nagios monitoringtool already installed in the cloud infrastructure. Ontop of that, IaaSMon provides an installation scriptthat performs the initial configuration and set up of thenew architectural components proposed, i.e. IMM andCMC.
In order to better explain the behavior of IaaSMon,Fig. 3 shows a sequence diagram for three differentcase studies where: A) a customer is registered in thecloud provider; B) a customer creates and launch anew VM, we assume that this VM is the first one
IaaSMon: Monitoring Architecture for Public Cloud Computing Data Centers 293
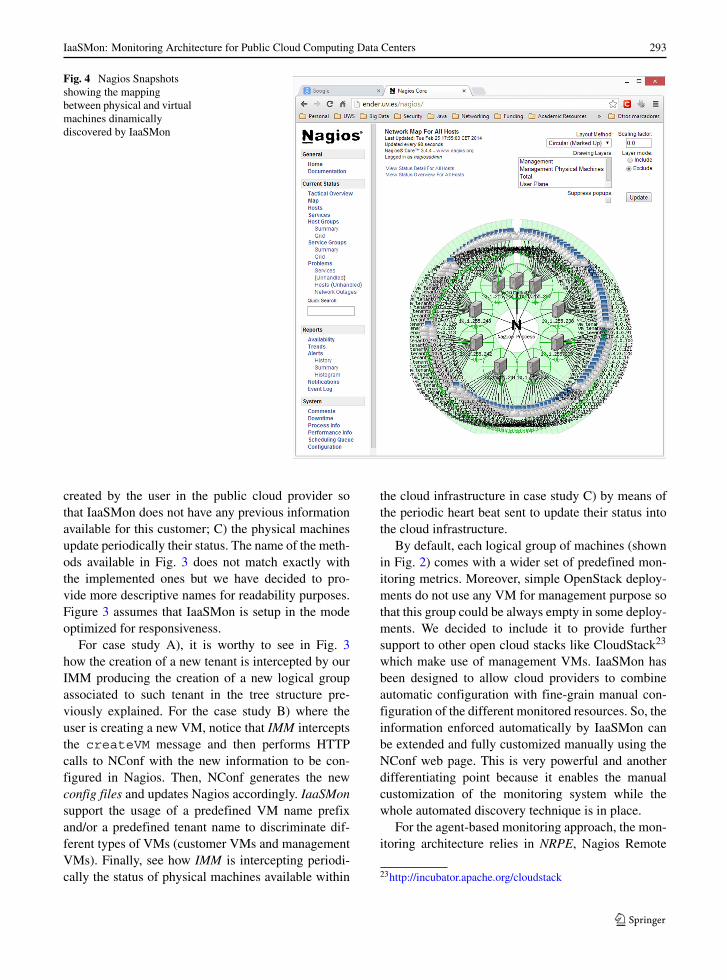
Fig. 4 Nagios Snapshotsshowing the mappingbetween physical and virtualmachines dinamicallydiscovered by IaaSMon
created by the user in the public cloud provider sothat IaaSMon does not have any previous informationavailable for this customer; C) the physical machinesupdate periodically their status. The name of the meth-ods available in Fig. 3 does not match exactly withthe implemented ones but we have decided to pro-vide more descriptive names for readability purposes.Figure 3 assumes that IaaSMon is setup in the modeoptimized for responsiveness.
For case study A), it is worthy to see in Fig. 3how the creation of a new tenant is intercepted by ourIMM producing the creation of a new logical groupassociated to such tenant in the tree structure pre-viously explained. For the case study B) where theuser is creating a new VM, notice that IMM interceptsthe createVM message and then performs HTTPcalls to NConf with the new information to be con-figured in Nagios. Then, NConf generates the newconfig files and updates Nagios accordingly. IaaSMonsupport the usage of a predefined VM name prefixand/or a predefined tenant name to discriminate dif-ferent types of VMs (customer VMs and managementVMs). Finally, see how IMM is intercepting periodi-cally the status of physical machines available within
the cloud infrastructure in case study C) by means ofthe periodic heart beat sent to update their status intothe cloud infrastructure.
By default, each logical group of machines (shownin Fig. 2) comes with a wider set of predefined mon-itoring metrics. Moreover, simple OpenStack deploy-ments do not use any VM for management purpose sothat this group could be always empty in some deploy-ments. We decided to include it to provide furthersupport to other open cloud stacks like CloudStack23
which make use of management VMs. IaaSMon hasbeen designed to allow cloud providers to combineautomatic configuration with fine-grain manual con-figuration of the different monitored resources. So, theinformation enforced automatically by IaaSMon canbe extended and fully customized manually using theNConf web page. This is very powerful and anotherdifferentiating point because it enables the manualcustomization of the monitoring system while thewhole automated discovery technique is in place.
For the agent-based monitoring approach, the mon-itoring architecture relies in NRPE, Nagios Remote
23http://incubator.apache.org/cloudstack
294 J. Gutierrez-Aguado et al.
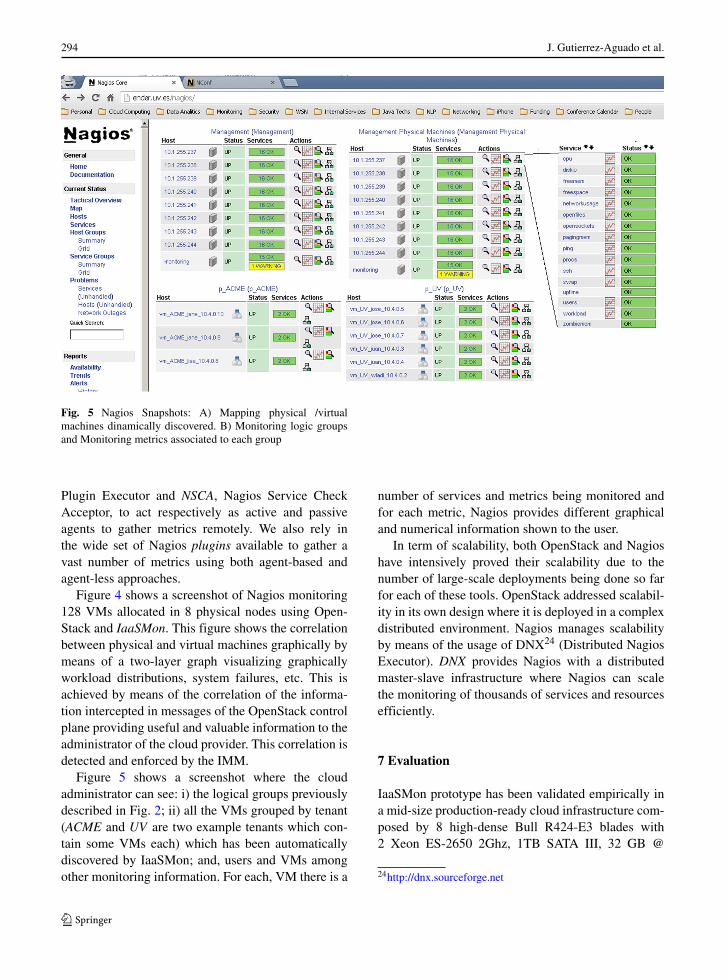
Fig. 5 Nagios Snapshots: A) Mapping physical /virtualmachines dinamically discovered. B) Monitoring logic groupsand Monitoring metrics associated to each group
Plugin Executor and NSCA, Nagios Service CheckAcceptor, to act respectively as active and passiveagents to gather metrics remotely. We also rely inthe wide set of Nagios plugins available to gather avast number of metrics using both agent-based andagent-less approaches.
Figure 4 shows a screenshot of Nagios monitoring128 VMs allocated in 8 physical nodes using Open-Stack and IaaSMon. This figure shows the correlationbetween physical and virtual machines graphically bymeans of a two-layer graph visualizing graphicallyworkload distributions, system failures, etc. This isachieved by means of the correlation of the informa-tion intercepted in messages of the OpenStack controlplane providing useful and valuable information to theadministrator of the cloud provider. This correlation isdetected and enforced by the IMM.
Figure 5 shows a screenshot where the cloudadministrator can see: i) the logical groups previouslydescribed in Fig. 2; ii) all the VMs grouped by tenant(ACME and UV are two example tenants which con-tain some VMs each) which has been automaticallydiscovered by IaaSMon; and, users and VMs amongother monitoring information. For each, VM there is a
number of services and metrics being monitored andfor each metric, Nagios provides different graphicaland numerical information shown to the user.
In term of scalability, both OpenStack and Nagioshave intensively proved their scalability due to thenumber of large-scale deployments being done so farfor each of these tools. OpenStack addressed scalabil-ity in its own design where it is deployed in a complexdistributed environment. Nagios manages scalabilityby means of the usage of DNX24 (Distributed NagiosExecutor). DNX provides Nagios with a distributedmaster-slave infrastructure where Nagios can scalethe monitoring of thousands of services and resourcesefficiently.
7 Evaluation
IaaSMon prototype has been validated empirically ina mid-size production-ready cloud infrastructure com-posed by 8 high-dense Bull R424-E3 blades with2 Xeon ES-2650 2Ghz, 1TB SATA III, 32 GB @
24http://dnx.sourceforge.net
IaaSMon: Monitoring Architecture for Public Cloud Computing Data Centers 295
1600Mhz wired with two gigabit networks over whichwe installed an OpenStack Folsom single-host, Nagios3.4.4, NConf 1.3.0 and our prototype.
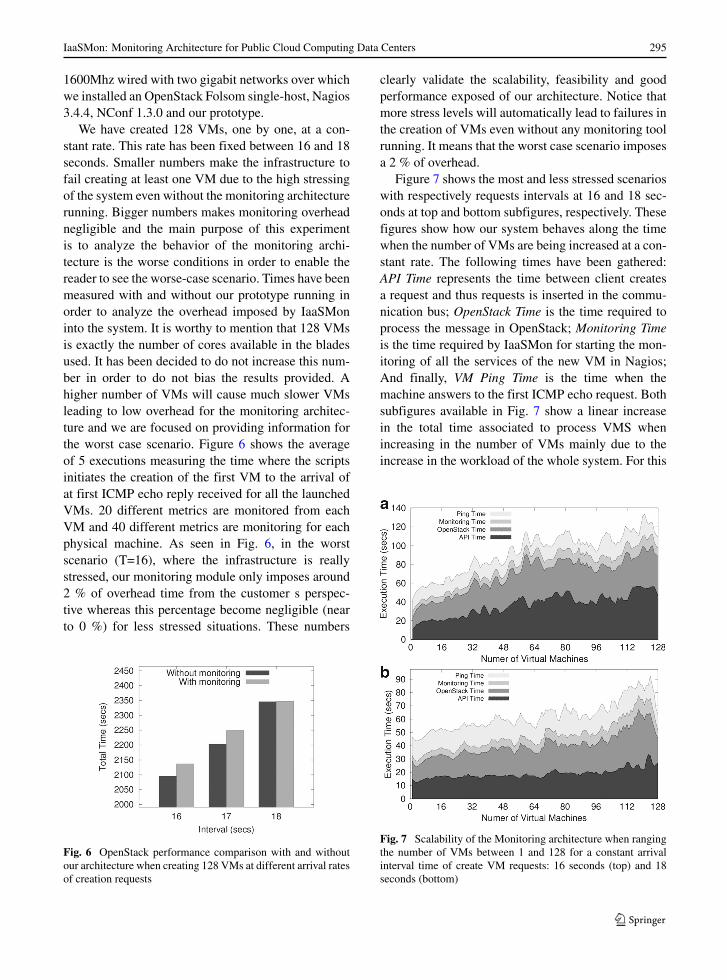
We have created 128 VMs, one by one, at a con-stant rate. This rate has been fixed between 16 and 18seconds. Smaller numbers make the infrastructure tofail creating at least one VM due to the high stressingof the system even without the monitoring architecturerunning. Bigger numbers makes monitoring overheadnegligible and the main purpose of this experimentis to analyze the behavior of the monitoring archi-tecture is the worse conditions in order to enable thereader to see the worse-case scenario. Times have beenmeasured with and without our prototype running inorder to analyze the overhead imposed by IaaSMoninto the system. It is worthy to mention that 128 VMsis exactly the number of cores available in the bladesused. It has been decided to do not increase this num-ber in order to do not bias the results provided. Ahigher number of VMs will cause much slower VMsleading to low overhead for the monitoring architec-ture and we are focused on providing information forthe worst case scenario. Figure 6 shows the averageof 5 executions measuring the time where the scriptsinitiates the creation of the first VM to the arrival ofat first ICMP echo reply received for all the launchedVMs. 20 different metrics are monitored from eachVM and 40 different metrics are monitoring for eachphysical machine. As seen in Fig. 6, in the worstscenario (T=16), where the infrastructure is reallystressed, our monitoring module only imposes around2 % of overhead time from the customer s perspec-tive whereas this percentage become negligible (nearto 0 %) for less stressed situations. These numbers
Fig. 6 OpenStack performance comparison with and withoutour architecture when creating 128 VMs at different arrival ratesof creation requests
clearly validate the scalability, feasibility and goodperformance exposed of our architecture. Notice thatmore stress levels will automatically lead to failures inthe creation of VMs even without any monitoring toolrunning. It means that the worst case scenario imposesa 2 % of overhead.
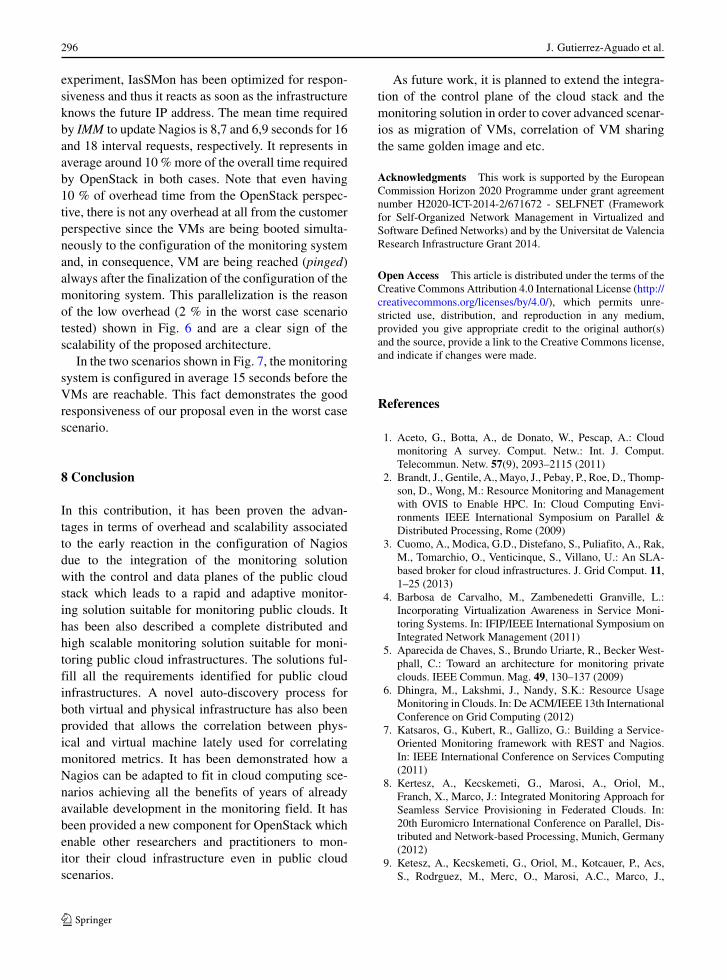
Figure 7 shows the most and less stressed scenarioswith respectively requests intervals at 16 and 18 sec-onds at top and bottom subfigures, respectively. Thesefigures show how our system behaves along the timewhen the number of VMs are being increased at a con-stant rate. The following times have been gathered:API Time represents the time between client createsa request and thus requests is inserted in the commu-nication bus; OpenStack Time is the time required toprocess the message in OpenStack; Monitoring Timeis the time required by IaaSMon for starting the mon-itoring of all the services of the new VM in Nagios;And finally, VM Ping Time is the time when themachine answers to the first ICMP echo request. Bothsubfigures available in Fig. 7 show a linear increasein the total time associated to process VMS whenincreasing in the number of VMs mainly due to theincrease in the workload of the whole system. For this
Fig. 7 Scalability of the Monitoring architecture when rangingthe number of VMs between 1 and 128 for a constant arrivalinterval time of create VM requests: 16 seconds (top) and 18seconds (bottom)
296 J. Gutierrez-Aguado et al.
experiment, IasSMon has been optimized for respon-siveness and thus it reacts as soon as the infrastructureknows the future IP address. The mean time requiredby IMM to update Nagios is 8,7 and 6,9 seconds for 16and 18 interval requests, respectively. It represents inaverage around 10 %more of the overall time requiredby OpenStack in both cases. Note that even having10 % of overhead time from the OpenStack perspec-tive, there is not any overhead at all from the customerperspective since the VMs are being booted simulta-neously to the configuration of the monitoring systemand, in consequence, VM are being reached (pinged)always after the finalization of the configuration of themonitoring system. This parallelization is the reasonof the low overhead (2 % in the worst case scenariotested) shown in Fig. 6 and are a clear sign of thescalability of the proposed architecture.
In the two scenarios shown in Fig. 7, the monitoringsystem is configured in average 15 seconds before theVMs are reachable. This fact demonstrates the goodresponsiveness of our proposal even in the worst casescenario.
8 Conclusion
In this contribution, it has been proven the advan-tages in terms of overhead and scalability associatedto the early reaction in the configuration of Nagiosdue to the integration of the monitoring solutionwith the control and data planes of the public cloudstack which leads to a rapid and adaptive monitor-ing solution suitable for monitoring public clouds. Ithas been also described a complete distributed andhigh scalable monitoring solution suitable for moni-toring public cloud infrastructures. The solutions ful-fill all the requirements identified for public cloudinfrastructures. A novel auto-discovery process forboth virtual and physical infrastructure has also beenprovided that allows the correlation between phys-ical and virtual machine lately used for correlatingmonitored metrics. It has been demonstrated how aNagios can be adapted to fit in cloud computing sce-narios achieving all the benefits of years of alreadyavailable development in the monitoring field. It hasbeen provided a new component for OpenStack whichenable other researchers and practitioners to mon-itor their cloud infrastructure even in public cloudscenarios.
As future work, it is planned to extend the integra-tion of the control plane of the cloud stack and themonitoring solution in order to cover advanced scenar-ios as migration of VMs, correlation of VM sharingthe same golden image and etc.
Acknowledgments This work is supported by the EuropeanCommission Horizon 2020 Programme under grant agreementnumber H2020-ICT-2014-2/671672 - SELFNET (Frameworkfor Self-Organized Network Management in Virtualized andSoftware Defined Networks) and by the Universitat de ValenciaResearch Infrastructure Grant 2014.
Open Access This article is distributed under the terms of theCreative Commons Attribution 4.0 International License (http://creativecommons.org/licenses/by/4.0/), which permits unre-stricted use, distribution, and reproduction in any medium,provided you give appropriate credit to the original author(s)and the source, provide a link to the Creative Commons license,and indicate if changes were made.
References
1. Aceto, G., Botta, A., de Donato, W., Pescap, A.: Cloudmonitoring A survey. Comput. Netw.: Int. J. Comput.Telecommun. Netw. 57(9), 2093–2115 (2011)
2. Brandt, J., Gentile, A., Mayo, J., Pebay, P., Roe, D., Thomp-son, D., Wong, M.: Resource Monitoring and Managementwith OVIS to Enable HPC. In: Cloud Computing Envi-ronments IEEE International Symposium on Parallel &Distributed Processing, Rome (2009)
3. Cuomo, A., Modica, G.D., Distefano, S., Puliafito, A., Rak,M., Tomarchio, O., Venticinque, S., Villano, U.: An SLA-based broker for cloud infrastructures. J. Grid Comput. 11,1–25 (2013)
4. Barbosa de Carvalho, M., Zambenedetti Granville, L.:Incorporating Virtualization Awareness in Service Moni-toring Systems. In: IFIP/IEEE International Symposium onIntegrated Network Management (2011)
5. Aparecida de Chaves, S., Brundo Uriarte, R., Becker West-phall, C.: Toward an architecture for monitoring privateclouds. IEEE Commun. Mag. 49, 130–137 (2009)
6. Dhingra, M., Lakshmi, J., Nandy, S.K.: Resource UsageMonitoring in Clouds. In: De ACM/IEEE 13th InternationalConference on Grid Computing (2012)
7. Katsaros, G., Kubert, R., Gallizo, G.: Building a Service-Oriented Monitoring framework with REST and Nagios.In: IEEE International Conference on Services Computing(2011)
8. Kertesz, A., Kecskemeti, G., Marosi, A., Oriol, M.,Franch, X., Marco, J.: Integrated Monitoring Approach forSeamless Service Provisioning in Federated Clouds. In:20th Euromicro International Conference on Parallel, Dis-tributed and Network-based Processing, Munich, Germany(2012)
9. Ketesz, A., Kecskemeti, G., Oriol, M., Kotcauer, P., Acs,S., Rodrguez, M., Merc, O., Marosi, A.C., Marco, J.,
IaaSMon: Monitoring Architecture for Public Cloud Computing Data Centers 297
Franch, X.: Enhancing federated cloud management withan integrated service monitoring approach. J. Grid Comput.11, 699–720 (2013)
10. Koenig, B., Alcaraz Calero, J.M., Kirchnick, J.: Elasticmonitoring framework for cloud infrastructures. IET Com-mun. 6, 1306–1315 (2011)
11. Lorido-Botran, T., Miguel-Alonso, J., Lozano, J.A.: Areview of auto-scaling techniques for elastic applications incloud environments. J. Grid Comput. 12, 559–592 (2015)
12. Massonet, P., Naqvi, S., Ponsard, C., Latanicki, J., Rochw-erger, B., Villari, M.: A Monitoring and Audit LoggingArchitecture for Data Location Compliance in FederatedCloud Infrastructures. In: IEEE International Parallel &Distributed Processing Symposium, Anchorage, Alaska(2011)
13. Milojicic, D., Llorente, I.M., Opennebula, R.S.M.: A cloudmanagement tool. IEEE Internet Comput. 15(2), 11–14(2011)
14. Moses, J., Iyer, R., Illikkal, R., Srinivasan, S., Aisopos, K.:Shared Resource Monitoring and Throughput Optimization
in Cloud-Computing Datacenters. In: IEEE InternationalParallel & Distributed Processing Symposium, Anchorage,Alaska (2011)
15. Petcu, D.: Consuming resources and services from multi-ple clouds: From terminology to cloudware support. J. GridComput. 12, 321–345 (2014)
16. Povedano-Molina, J., Lopez-Vega, J.M., Lopez-Soler,J.M., Corradi, A., Dargos, L.F.: A highly adaptableand scalable monitoring architecture for multi-tenantclouds. Futur. Gener. Comput. Syst. 29(8), 2041–2056(2013)
17. Romano, L., De Mari, D., Jerzak, Z., Fetzer, C.: ANovel Approach To QoS Monitoring In The Cloud.In: First International Conference on Data Compres-sion, Communications and Processing, Palinuro, Italy(2011)
18. Wuhib, F., Stadler, R.: Distributed Monitoring andResource Management for Large Cloud Environments. In:IFIP/IEEE International Symposium on Integrated NetworkManagement, Dublin, Ireland (2011)