Embed Size (px)
Citation preview

II SUBJECTIVE REACTION
TOr WHOLE-BODY VIBRATION
9BOEING WICHITAHUMAN
Jj.. FACTORSECHNICAL REPORT
, '-6474
HARD COPY
MICROFICIHE /
*'CONTRACT vIONR 2994(00)STCOFFICE OF NAVAL RESEARCH
0
A
I THE BOEING COMPANY AIRPLANE DIVISIOWICHITA IRANCH SEPTEMBER 194

BestAvailable
Copy

SUBJECTIVE REACTION TOWHOT VE-BODY VIBRATION
Robert E. Chaney
Research Accomplished UnderOffice of Naval ResearchContract Nonr- 2994(00)
'Research OnLow Frequency Vibration Effects
On Human Performance"
Principal Invebtigator
J. E. Beaupeurt
HUMAN FACTORS STAFF
THE BOEING COMPANYWichita, Kansas
D3-6474 SEPTEMBER 1964
Reproduction in whole or in part Is permittedfor any purpose of the United States Government

D3-6474Page ii
ABSTRACT
Ten male volunteers were utilized in a study of the perceptionof vibration. Four subjective reaction levels: perceptible,mildly annoying, extremely annoying, and alarming were established.The Boeing Human Vibration facility, modified since previous tests,was used as the test instrument. Experimental controls and testmethods were determined in a preliminary study.
Subjective levels identified are generally at higher accelera-tion values than those of previous research. Possible reasonsfor the differences are discussed. Also, individual valuesestablished at a given subjective level are shown to be influ-enced by the magnitude of the immediately preceeding vibrationlevel. Physiological effects in the main correlate with previousfindings.
Test Design & ConductRobert E. Chaney
Analysis & Report / •Chane
Approved•iA.E. &aaueurt, P.E.
Human Factors Chief
Approved
Chief of Aircraft SystemsStaff

D3-6474Page iii
TABLE OF CONTENTS
Title Page .................. ...................... i
Abstract . . . . . . . . . . . . . . . . . . .. . .
Table of Contents ........... ................... .
List of Figures ................. ................... v
List of Tables ................... ................. vii
References ................ ...................... .. viii
Introduction .............. ....................... 1
Preliminary Tests ............... ................... 2
Visual Effects ................ .................. 2
Auditory Effects .............. ................. 2
Kinesthetic Effects ............. ................ 3
Methodology .................... .................. 4
Experimental Subjects ........... ............... 4
Vibration Apparatus and the Vibration Environment . 4
Vibration Conditions .............. ............. 6
Vibration Fidelity ............ ............... 6
Test Configuration ............ ............... 7
Testing Sequence and Procedure .... .......... .. 16
Data Utilization .......... ................. ... 17
Results ................. ...................... .. 18
Summary and Conclusions ......... ................ ... 33

D3-6474Page iv
Page
Appendices
A - Table Acceleration Curves .... ........... ... 35
B - Instructions to Subjects .... ........... ... 52
C - Individual Subject Curves .... ........... ... 57
Acknowledgement ............. ................... ... 78

D3-6474Page v
LIST OF FIGURES
1. Boeing Human Vibration Facility ........ 5
2. Experimental Test Station Configiration . . 8
3. AdJuStable Back Support . . . . ........ 9
4. Restraining Belt Adjustment .... .......... . .10
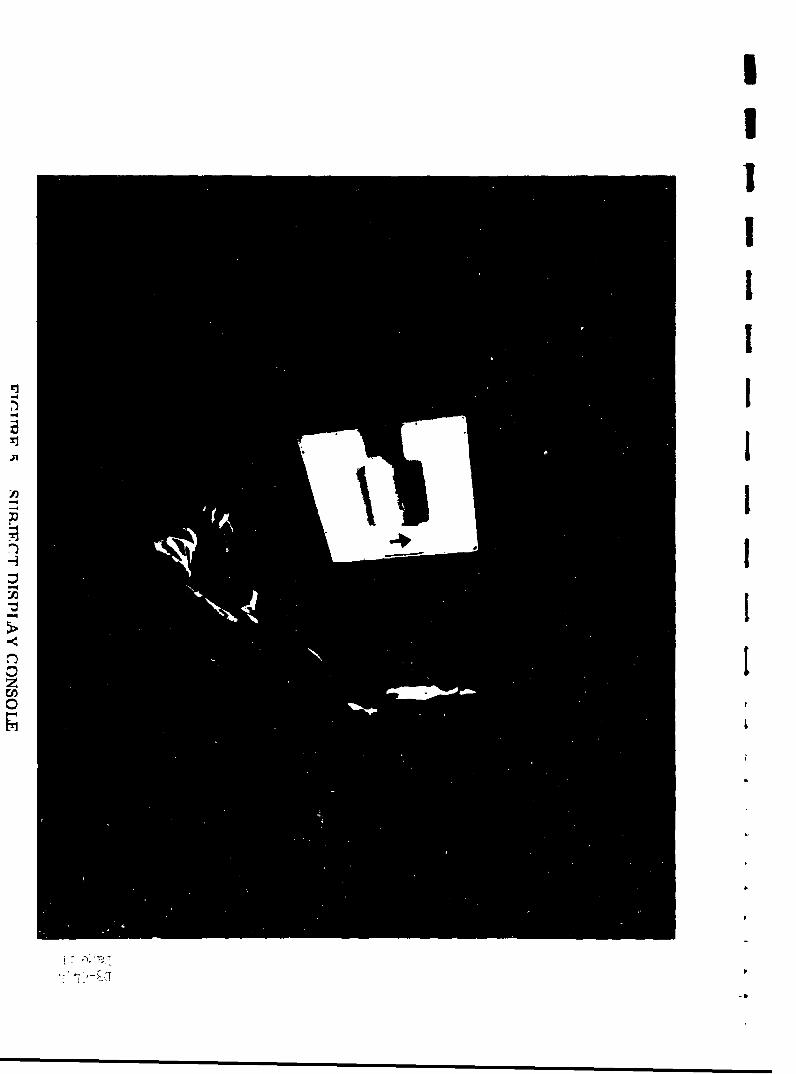
5. Subject Display Console ..... ............ .. 11
6. Vibration Control Handles .... ........... ... 12
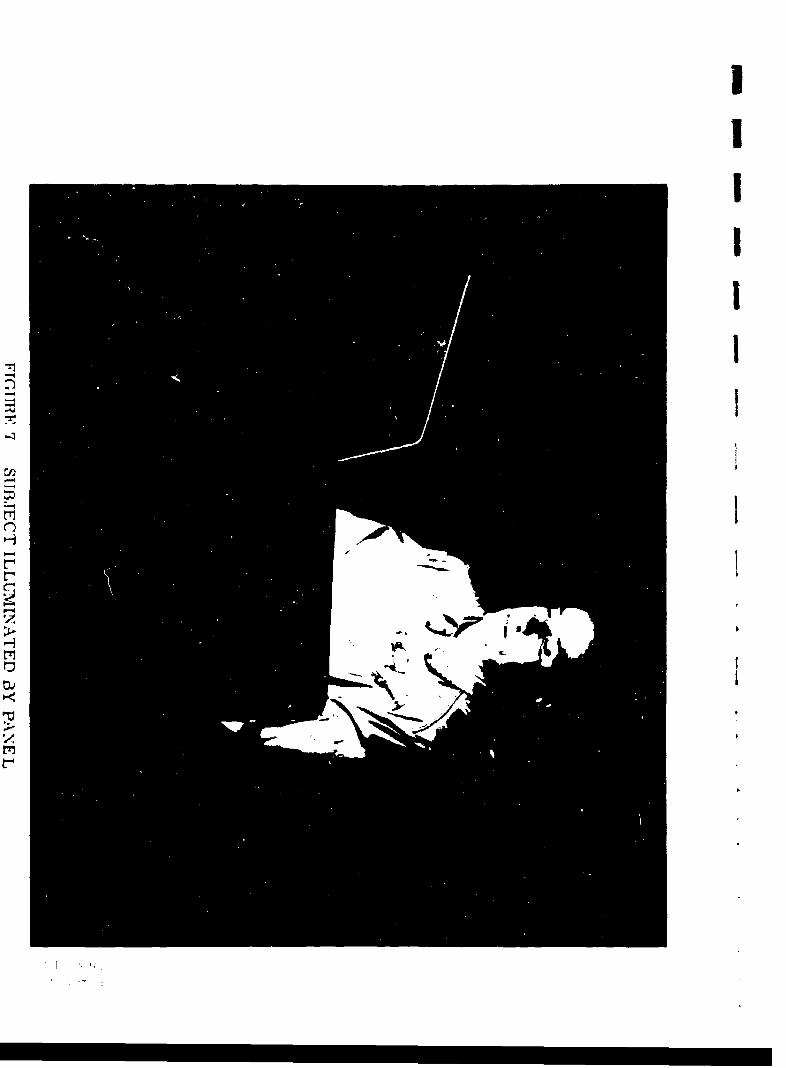
7. Subject Illuminated by Panel ... ........ ... 13
8. Experimenters Station ....... ............ .. 15
9. Subjective Human Vibration Response Curves 19
10. Subjective Curves Related to Velocity,Acceleration, and Displacement .... ....... ... 20
11. Medians, 20th and 8Oth PercentilesEstablished for Perceptible Level of Vibration 21
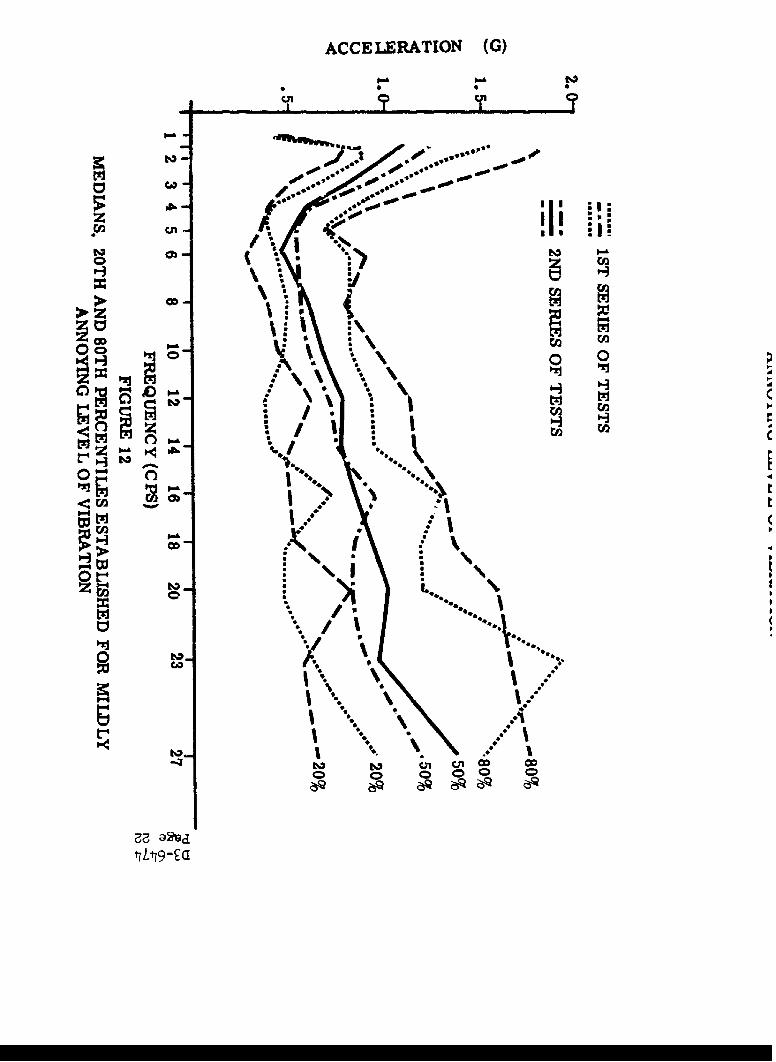
12. Medians, 20th and 80th Percentiles Establishedfor Mildly Annoying Level of Vibration ........ 22
13. Medians, 20th and 8Oth Percentiles Establishedfor Extremely Annoying Level of Vibration . . . 23
14. Medians and 20th Percentiles Established forAlarming Level of Vibration ... ......... .. 24
15. Subjective Response Curves Compared to ShortTime, 1 minute and 3 minute Tolerance Curvesof Ziegenruecker, Magid, and Coermann ... ..... 26
16. Subjective Tolerance Curves of this StudyCompared to those of Goldman ... ......... ... 27
17. Subjective Tolerance Curves of this StudyCompared to those of Gorrill and Snyder . .. . 28

D3-6474Page v1
18. Subjective Tolerance Curves of this StudyCompared to those of Parks and Snyder . . . 29
19. Physiolo-wical Sensations ExperiencedDuring Program ........ .............. ... 31
20. - 35- Table Rc:ponse Curves at Each Frequencyused in Program..... . . .. . ............. 36 - 51
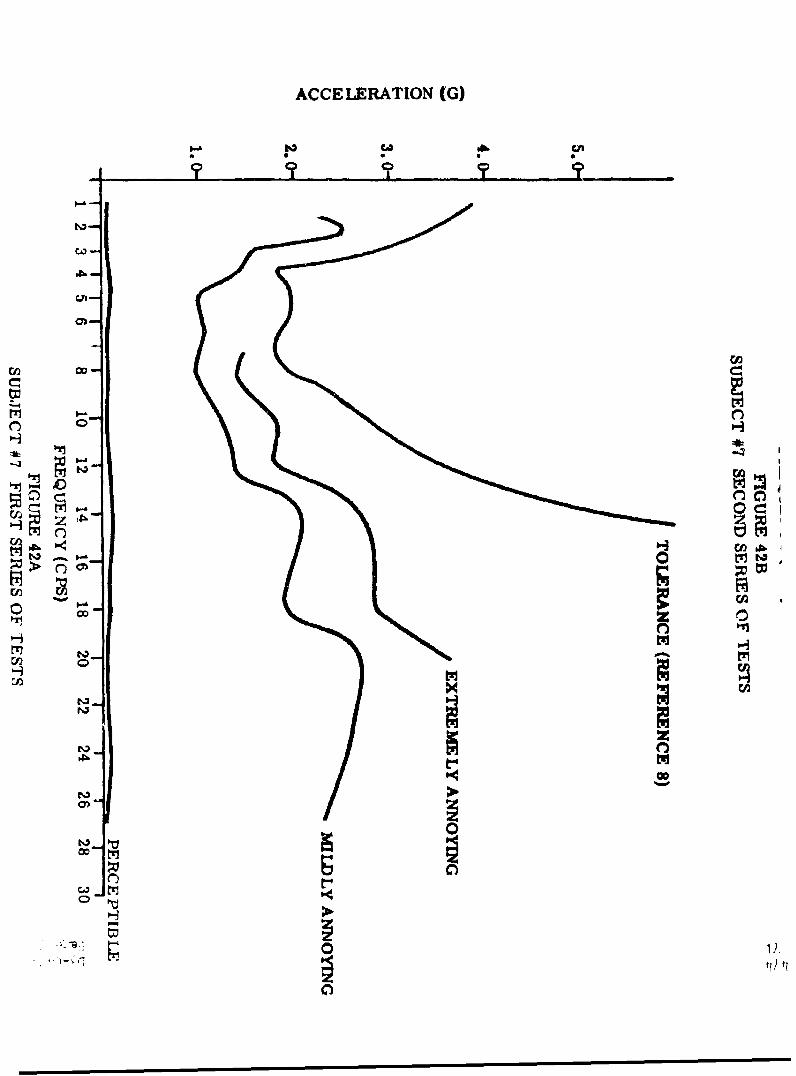
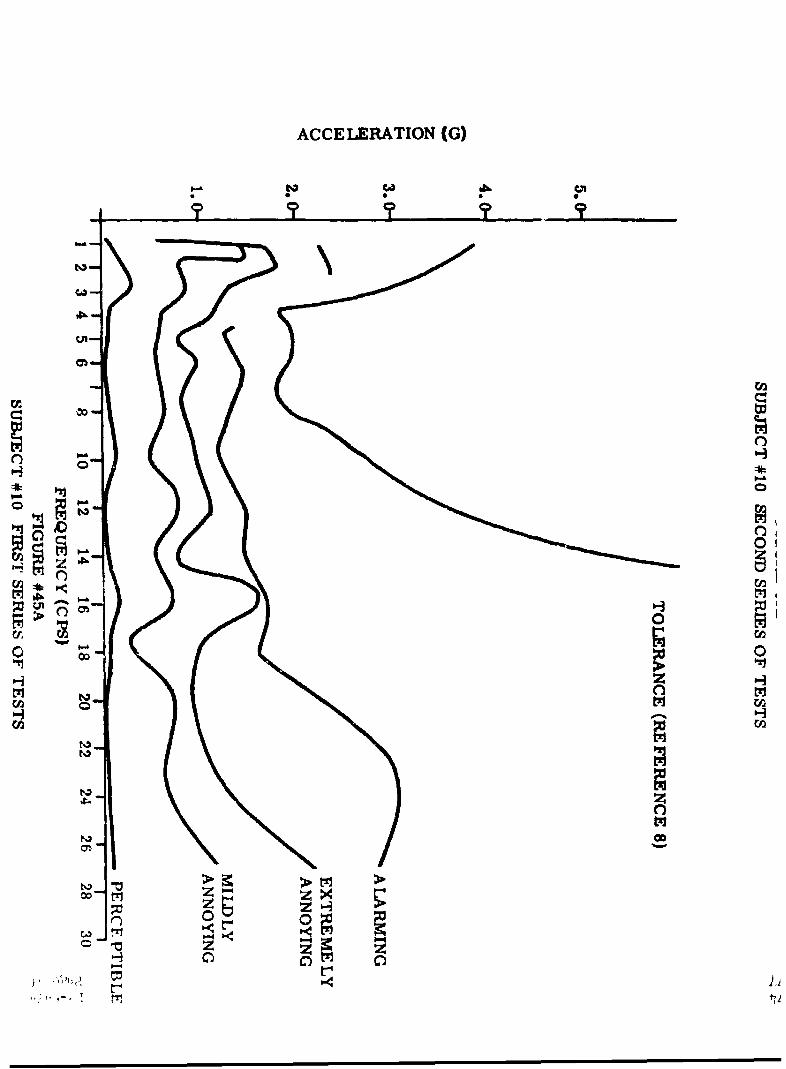
36. - 45. Individual Subject Response Curves . . . . 58 - 77

D3-6474Page vii
LIST OF TABLES
Eage
I. Experimental Subject Data .........
II. Table Acceleration Limits ........ ........ 6

II
PAge v-1 ir
1. Ailcort,. irI:vj B., . .etries :f Pe::or•=-i tn -he f ne-: cr;: re. ,7?,r.ra:1ei; •Th7 Ž!nS. >;ew4Vcrk-tonizo, 1955.
I ~2. 2--cc'z:•••1 ~einý H--."iaano Facility.v
S3. $:la_-imar_, D. E. A Re'tiev, :f eones-2Vibrato:r7 oto::' -e ~ a:- fn _ýe ar_ýe :ý 1 -_ ,cles per
Se:ond. _•KIBeth-esdla, Mi ., Prc:J. :•[-LiRep. No. 1,
-. s~'ll, R. B. ýc Sny'der, F. _. !m:-el :i _ar-jSuyo
Airc....w T_-Ier-_=Ce 'ýC t~wreq•ien2•- Ver:•i-al Vibratilon.|) Beir•i~c~r, e: D3I!•9 TheB.:e• Cmpany, Wichita,
Kansas, J-ay 19ý7, •
M . ;agid, E. B. ý Ccer -arr, R. R., 7 e Re ac- isn of e Eý_=arBody 7: -c-reme ¥bass.lt reensIns-ýitu-e
•. =--,•ilM. j. ; c'.qR. D. One lsu- Tleranc-e in Man"-c',ez-=_SIrn-uSz~idl ViJbra--if_ in the St-_*.ing Positýion.
-ee. D2. e_• •2_•LTDR-£-19!,October 197-2.
v. Farý,3, L. " 7 Sryder, W. --. --. t i •. 5 LowFre3..... " Dc ...... D3-35122-1, Th.e Bcei-g•
Co;euy icitKar-s--c, IJT;ly i)EI.
c. iegzr*e2?-_r 5.Z. MmilE. B. Sh,ýr- Time Hu-man
I eI:-2e S -ns- I I a 1I bWL leh.Re.c
r;Y

D3-6474Page 1
INTRODUCTION
Vibration and its effect on the h:uns.u have been of interest Tovehicle and systen designers for many years. The advent of highperfor-ance, low altitude, and manned space systems however, haveestablished increased interest in the lov frequency, high amplituderegions of the vibration spectrum rather than the high frequency,low amplitude range associated with propeller systems. Researchefforus in LurLn have reflected this tr,:.
A number of studies, 3, 4, 5, 6, 7, & 8, have been performed todetermine human response and tolerance to low frequency sinusoidalvibration, however, results vary considerably with little or no basisprovided to resolve the differences. Sibjects have been testedstanding, seated in different configurations and lying down.Various restraining systems have been used under a variety ofexperimental and environmental conditions. Criteria employedhave been referenced to passenger comfort, land vehicle operation,and left completely unstructured with subjects providing theirindividual interpretations. And finally, subjects have had nocontrol over the vibration received except to stop the vibrationproducing mechanism.
The purpose of this study was to establish a series of subjectivecurves utilizing the descriptive levels of Parks & Snyder 4, whichwould reflect subjective response to sinusoidal vibration in theseated position. An attempt was made to determine, through pre-liminary tests, factors which could influence responses and tocontrol cr specify these factors to a point where resultingcurve positions would reflect only variations in the vibrationreceived.

D3-6474Page 2
PRELIMINARY TESTS
A number Df preliminary tests were conducted in the vibration facilityprior to tne final establishment of a test configuration. These tests,using the investigators, facility engineers and previous vibrationtest participants as subjects were for the express purpose of deter-mining factors which could influence test results and to determinewhich of several alternate methods of control would be most effectivein eliminating or reducing these influences. Summaries of testresults and selected solutions follow.
Visual Effects
Subjects ability to reference the vibrating platform to the non-vibrating environment was found immediately to affect not only deter-ruination of threshold levels (as was suspected) but the "feeling" ofthe intensity of vibration at higher levels and the repeatability ofamplitudes for given levels on successive runs. Elimination of thiscue was handled through painting the test room sage green, color34u92, to minimize specu.ar reflections and by eliminating all lightz;)uuces in the area except those from the display which vibratedwith the subject. All commands to the subject and feedback indica-tions of his control action were incorporated into the display toass.re his attention to the vibrating platform. Also, because of arequirement for visual monitoring by the attending physician, a"Ihalo light" border was incorporated which would provide an adequateamount of subject illumination. Thus, the subjects even if disposedt, (-5 so, cou.ild see nothing in the test area off the vibratingp1 9Itf. 1 mm.
A iditory Effects
Nrises generated by the 'iydraulic pumps, lines, valves, etc. andt.,h1 L.ri•ru~s were found to provide minimal cues at and around
•:rceplible level. Altho'ugh not. normally noticeable, with theiI'opr'r Mt, ,•Ib~htchang-es in pitlch and flow noise could be detecteda:,ý 1 vibration equipment chuiged from a steady to a vibratingf'te. U', cu•es were discCrnibLe ast the vibration Intensity increased.
Uis::ami ,.,ff auditrry cien wnur; accomplished In two steps: Initiallyal'. r ,,2u.ces and the test room were insilated with sound absorb-i±, l ri d:r.ali rnd secondly, z .2,,ralniiig rlises generated in the rangewhere ciýes were provided, were analyzed and masked by addition of a

D3-6474Page 3
Kinesthetic Effects
Related somewhat to auditory effects are the problems associatedwith the wearing of headphones or a belmet. In all tests made,anything worn on the head became annoying in itself or distract-ing to the subject during higher vibration levels. As a conse-quence, a "hot" microphone on the panel and a horn speaker beneaththe display were used for subject-experimenter communicationsduring the reported program.
Also, a source of great variability in the sensation of vibrationwas found associated with the seating position of the subject andthe associated seat and foot rest configurations. Seat back typeand angle and the manner in which the subject utilized it as sup-port produced excessive variation even within the same individual.Foot rest type and angle produced similar differences to a lesserdegree. To minimize differences a single adjustable back restlocated at about the first lumbar vertebra and an adjustable feltcovered foot rest were utilized. Adjustments were thus possiblefor each subject to maintain an angle of approximately 900 betweenbody and upper leg, 1100 between upper and lower leg and 900 be-tween lower leg and toot.
A single lap belt was found most satisfactory as a restrainingdevice, however, differences were noted as belt tension varied.An adjustment mechanism was th is incorporated whereby tension couldbe set at a pre-determined level. Thirty pounds was selected foruse in the tina], tests.
Perhaps the most significant of the preliminary test findings wasthat concerning the control of the vibration input. It was dis-cover'ed that. i1' the subject were allowed to directly control theseverity al' the vibration encountered, apprehension concerning theteot arid equipment was nearly climinated and levels could beeztabli:;h•i "much more accurately" than by any of several othermetlhhd. tied and uued in prvvious programs. Means were thereforeprovided wfcureby the rubjects could control amplitude within pre-determined limits at any selected frequency.

D3-6474Page 4
METHODOLOGY
Experimental Subjectb
Subjects used in the experiment were ten male employees of theAirplane Division of the Boeing Company. Nine of the ten werenew to vibration research; the tenth had participated in severalprevious studies. All subjects were selected through a screeningprocess which included a comprehensive physical examination toassure excellent health of the experimental group. Age, heightand weight of' the subjects are listed in Table I.
TABLE I
Experimental Subject Data
Subject Height Weight
1 28 75 2002 25 74 2153 31 71 1704 3) 70.5 1745 31 69.5 150C) 44 65 156
31 65 155d 32 67.5 1709 42 67.5 169
i'J 3C 65 155
Vibratani AIanratus & the Vibration Environment
Tt,1u. Ti .. !ni, Human Vibration racllity (Figure i) was used to providethLu vibrat.lcni Vor this prok'rwn. The fac:liy is that described ino pruvi,,ou i-, ,"ment (refernenw, 2) wit., al least, two noteworthyrrm,- lIe' Iv. Fnd improvements. Pier .... thln study there had beenc~vi i~ncc tna,. mech'nical and hvrail pr(,perttes of the equipmentwere irntr ,i,. lg diistortion into .he riIn. wave output of the vibra-lii ot.•e primarliy through t able IrA tA,, . Modification of thetabl> glildh.c: to the c ntinh 2rac lUt ll , tiyp and rework of the'2- )ntir ,l turn r-en Ited iU i im.. Im: m veid system.

• • D3-6474
/0/
0Entrance and emergency area
*Experimental & Medical MonitoringStation (One-Way Observation Window)
oVibration Platformi (Chair & ConsoleM ounited).
*Observation Area (Three One-WayViewing Windows)
* Equipment Operator's Station (SignalGeneration, Feed back, & Monitoring).
(Separate subject preparation andinterview room not shown)
FIGURE 1. BOEING HUMAN VIBRATION FACILITY

D3-6474Page 6
I Vibration Conditions
The frequencies used in this study were the same an those used byParks & Snyder : 1., 1-1/2, 2, 3, 4, 5, 6, 8, 10, 12, 14, 16, 18,20, 23, & 27 eps. Amplitides from zero to those necessary to pro-duce selected acceleration limits were possible. Limits wereestablished prior to the start of the test and were selected toavoid possible brodily harxm to subjects. Since limits of physio-logical tolerance were not to be considered, maximum possibleaccelerati ns were set below thoise established by Ziegenrueckerand Maeid g. The limit utilized for each frequency used is listedin Table II.
TABKE I I
Table Accelera.ion LimisPs
Fre cy(o Maximun "" Psr!ble
Ilb
1-1/2 a2.32 2.53 2.04, 5 ) (,, I•i '
1.1.511.12 2.25
14 2.6
Vibrrv,'orn Fird'i,' Y
j c.!'y f vie"tbrv',i"r. lop t t,,o 't..': 2; ,tj],ccz ca be cor, i'IererIA ' J . .•• . ',r ,, . .,ar bea , 1x.e ~ Dr.n r..... e wave f.rr w':r.,Irdttrs• Irnable from
",,"~r ','.rc e : r •re .,ire. w'4W .1 ' , at :'gr. Ir'2'j e ncy1"r,,u wi',h rir':'le-r't ionr• ,w''ie ' ,rrms r,e,•±", rerf'e ', at, bAI tb-,'r, L" ":p.': From. I 't~r•,,, 5 :pp5
.. .1, a ',r w,'t,,. "r,'we. lr w,,rt .-, erea.L e r .fir-.. t..r ./. 1, . in ,,e ran<e -, ', 1, l es F tr 2.rar. and.
.:si-?.j c &1t ,,ILr.§titt 't:. 'TV [r'rr,.-: t ',,-ar,, f'rc eni fire"r.mpa11 1 - . Dt'I [ 1 zA ri'l±ef. r, tr•r, s v." t i'
InP n r fýen f -1 bIx-rmI ,

D3-6474
Page 7
Test Configuration
An illustration of the overall test station confIguration is shownin Figure 2. A specially designed seat was utilized to provide pro-per subject position, with reinforced plywood inserts covered withapproximately 3/4 inch hard felt used in preference to seat cushionsor parachute packs to assure fidelity of the vibration received bythe subject. For back support an adjustable 4 x 8 inch felt coveredsupport was provided near the region of the first lumbar vertebra(Figure 3). The support proved not only extremely comfortablebut also elicited a natural response of sitting erect. A feltcovered adjustable foot rest was also provided which permitted ad-justment of each subject to the desired seating position. Subjectrestraint was provided by a single lap belt, the tension of whichcould be set at any desired level (Figure 4). Thirty pounds wasused throughout this test.
The subject display and controls used in the program are shown inFigures 5 & 6. The display contained the four descriptive termsreferencing the levels to be established which could be illuminatedseparately as required by the experiment, and "up" and "down" arrowswhich provided feedback indications to the subject concerning hiscontrol action in increasing or decreasing vibration amplitude.Amber illumination of either arrow indicated "slow" change (80 secondsfrom 0 to maximum amplitude) and white illumination referred to
" ��st" (40 seconds for total travel). The remaining portion oftne display remained lighted at all times during the test to pro-vide the subject illumination required for monitoring by the attend-irig plhysician (Figure 7).
The only controls utilized by the subject consisted of pistol typehand grips held in each hand. Each grip contained a three position"trigger" switch at the index finger location and a thumb switchlocated on top (Figure 6). Depression of the right or left handtrigger switches respectively, increased or decreased vibrationamplitude, moderate depression producing the slow rate of changeand hard depression evoking the fast. in each case, the appropri-ate irndication appeared on the subject display. Wohen neitherswitc. watb being activated the amplitude remained constant, andirn the ever.t Of sirrultaneous depression, the "down" cozand auto-nvtically took precedence. The right hand thumb switch was usedby the subjects to indicate when an i.-dicated subjective level wasmatch.ed by the existing vibration and served both to notifty theexperimenter of such a ratch and to automatically record, via oscil-lograph, the acceleration bein.g produced. The left th--zb button
I I

I
..I1
zH
H
H
H0z
0z
H
z

t" .
0,
•_ I •,-•.'.a
) •• •

- II
j.
IIIIIII
-4
IJi d
:2I
'4 I
z0
4
-S

z0zH
0
cj�
! i�2;,**,
JT -'�dI,.
1IIIIII
-3
IH5 -
zH
z -

D3-6474Page 14
was a cut-off switch end if pressed for any reason would immedi-ately stop all vibration. Use of this switch was not required onany test during the reported program. Switches were color codedto preclude inappropriate actuation.
Control of the command indications given subjects, communicationcontrol bttween subject, experimenter acid equipment engineer, andmonitoring of subject pulse, EKG, and table acceleration were accomp-lished at the experimenter-physician station (Figure 8). Datarecording and equip'nent set-up were performed at the equipmenLoperator's station.

IVI

;ID3-6474
I Page 16
Testing Sejienck and Procedure
Approximately one week prior to the start of testing, experimentersand the principal, investigator met with subjects to define and orientall involved personnel with the program, its purpose and individualresponsibilities. Copies of initial subject Instructions (AppendixB), program schedules, and subjective level definitionn were pro-vided subjects at this time.
In the teot program all subjects were given Unin essions duringeach of which eight levels (each of the four subjective levels twotimes) were identified at each of four vlbration frequencies. The
t first, test session for each subject. was used for familiarizationto procedures and the facility, with data not utilized. The remain-ing eighl, were divided into two L,est. serle,4. Each ierieo providedtwo readings of all levels at each of the sixteen selected frequen-cies. Frequency presentation and level establishment sequenceswere randomized and counter balanced in all cases.
An experimental session wus comprised of the following sequence ofevents:
ýl 'he auoJect, was given a pre-teot, phynical exn,.nation.2 'Electrocardiogram contacts and leads were attached to the
oubject,(3) Subjoct, donned rlight, coveralln umd took his poiution in
th h' r•aliity.(it) Restraining belt wan not at, the prenribed Lennion "d EKG
leads were connected.5 Instructions and level defitiltiorin were read to the oubject.
(6) A group or i'our tutas (four frequencies) and de-briefingows tkiministored•
(7) Subject, wms given a pont-tesl physic.lp coffee and doughnuts,it cumipo&its de-brief'Ir• t.,d was dialnomted for the day.
A Kivaii ti't, isequtince (ettep 6) .Involved the est,ablishment of each oftier, tour iub,.ut, ivo vibralion levels twice at n preselocted frequency.The n -ih,1rit ., Whini polIt, timel aid roe ly o'tr the tm to, would 'be pre-1iinl t.td )11V' of, tho levolri tirough liuninat.I ,i of' the appropriateportin if' thi, d.lnpley and would adjunt thh vibration severitytin ii,.1,h 111 lt Iuo "kLiatuh ' t, hat. l vel. Whon mat.is fled that thev1lWnil, Ili Wilti liubjr,01 tvuly tqultoi ,L ho doaf'Inttlon providedp depre.-i i.,ii , tl.1h igh, i hand ihiulltib "nVlyrt." butl on recorded the vibration,tuid k•itr•ci itlia expmriiit.ur to indicate tho next level. Approximatelyt.o tecindl Wezle involved in Lhe dat, recording &no new level melec-tlIon plotcesii with nio interruption oi' vibration between levels
1)'II ti'eil
D3-6474Page 17
Between tests, three to five minutes were spent collecting commentsconcerning physiological and psychological response to the vibra-tion. Four tests were completed each session with sessions requir-ing approximately forty-five minutes to complete. Four sessionswere scheduled each test day with the restriction that no subjectencounter vibration on successive days. A physician monitored alltest.s.
Data Utilization
Data taken during, the experiment. contlsted mainly of accelerationcurves recorded on an oscillograph. Four chanrels of informationwere taken from accelerometers mounted on the underside of the seatsurface; two vertical (at different scale factors to provide accur-ate reedinjg.s regard(less of level and for cross-check purposes);one lateral; and one longitudinal. Data from similar accelerometersmountr d on the vibrating platform and continuous table positionwere recorded by electronic pen for back-up and additional cross
check. All curves were read peak to peak and referenced to a 1 Gbene.
Utilizition of the data was for the mont part descriptive in nature.Because of' a common tendency to command the table to "maximum"wnplitode (pre-eatabliahed safety limits) prior to the identifica-tion of higher levels at come frequencies and the consistent pre-nence of one or two atypically high scores at all frequencies,medlau tiaorer were utilized to establinh eubjective curves, Losei (nf1tn tduo to proditermined table limltn precluded use of subject
" r'n., Poht-teut quentionnaire data were uned to determine thephyologl.Iosl orefct• of vibration and to assure continued subjectwtk'x'riltwiding of' level definitilons,

D3-6474Page 18
RESULTS
Subjective Response Curves
The subjective curves established in the program may be seen inFigures 9 & 10. Figure 9 shows the curves on a linear scale;Figure 10 shows them with logarithmic relation to velocity,acceleration, and double amplitude. As may be seen in Figure 9,the "perceptible" level curve maintains within a margin of measure-ment error a constant acceleration level throughout the frequencyrange tested (approximately .05 g). However, the remaining levelsIn ascending order approach the shape of the Phort time tolerancecurve established by Ziegenruecker and Magid p with differencesin acceleration values between adjacent curves at any frequencyabove 8 cps approximately equal.
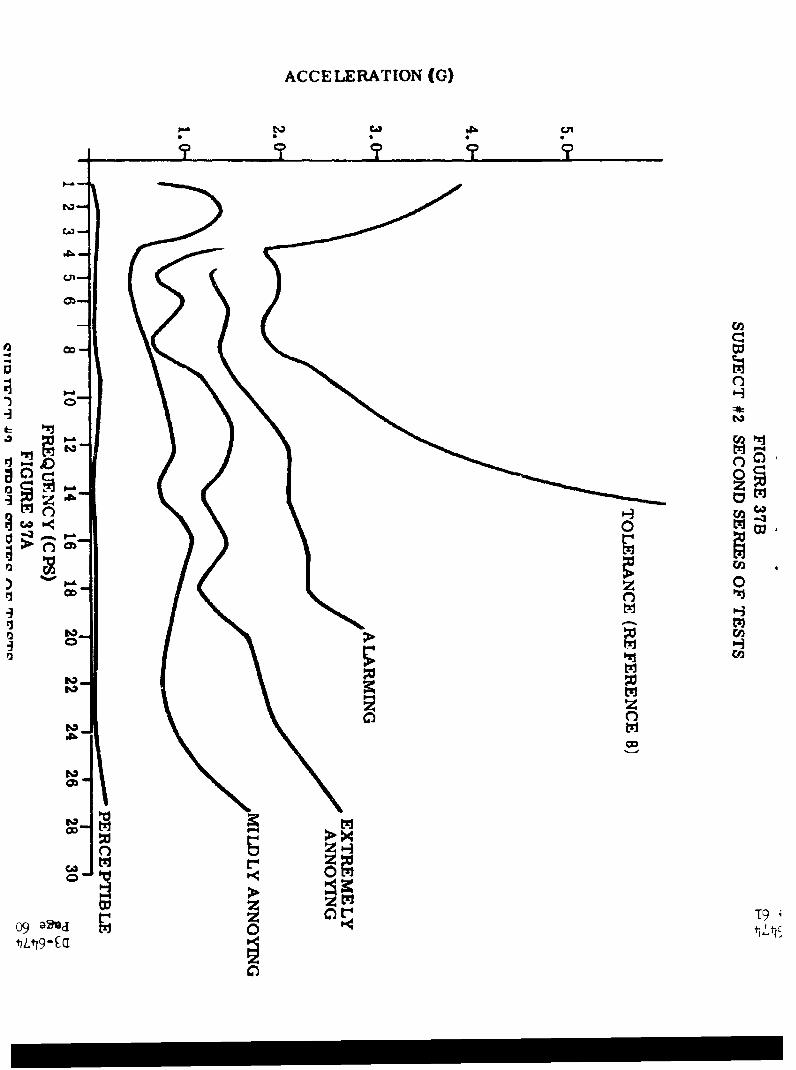
Medians and their respective 20th and 80th percentile curves foreach of the subjective levels established on each of the two seriesof tests are shown in Figures 11 through 14. It may be seen fromthese Figures that vibration "experience" produces an effect pri-marily at levels 1 and 4. At the "perceptible" level subject vari-ability was markedly reduced on the second series of tests and atthe alarming level a considerably higher intensity of vibrationwas required to evoke an "alarming" response. At both "annoying"levels (2 & 3) noticeable changes produced by the prior experiencewere restricted to the frequency range above approximately 20 cpswhere slight, upward shifts occurred during the second test series.
Durinr teat monitoring two apparent influences on the level ofvibration selected by subjects to represent a given definition werenoted: I) the relative severity of the immediately preceedinglnvel esLablished (a higher response made when preceeded by a higherintensity); and 2) the relative position the identification of aparticular level in the series occupied (first vs. second establish-"ment of he loev, ). Tents of' these phenomena showed the first,1.u. the relative intensity of the Immediately preceeding level tohave ia highly significanit effect (pc .001) and the second, i.e., a
otnes sequiience eL'fect to be not. orly non-significant but, non-ux1111,nt.

IACCELERATION (G)
> -I . • I
C4
>6T 0
ý2mq-c

I
D3-6474Page 20
tk. 'I,,,r
V -t ' -tic ~x
7lý 7 4A-
-jl I' X_;
Cr
-- . . i• ...... --... .. ...... . . . ... ....
*. ,' ...... . N., '".....+r"t+" . .". . .... .. .. +. . . " . . ..- ". ..r' •,-
v ' . /. <\,k .• -,, .:'. . +, N -" :., :A "- :7-+
t.1
t4..4 1 4 r r •N.
$ A. - +.,.* ' -"4. .+ ' .. + . "•
N ++,-+ f ".. .,.. ..
1 2 3 456790 20 30-+: 40,
- ' t.'I:" : -- ..
-,,
- ,' C 9/., --
"SUBJECTIVEL CUVE"ELTD O"EOCT
ACCELERI AND DISPLACEME
I ~ ~Ci..• i 2 : rjz+,. '+-x• .twA/ .. , ... X'• > 4.r , r'~E: ::-...
.,.4 . '- ,- -` • . -.\,- .A \- • :A . ," ,9 9'," '" ' .r ,+ .
.] i>L':ŽFREQUENCY ioCiPS)
i FIGURE 10
SUBJECTWVE CURVES RE LATED TO VE LOCITY
ACCELERATION AND DISPLACEMENT
II

ACCELERATION (G3) ACCELERATION (G)
a * * ft *t ft ft 0 0
z
cooc
tziU
00
z 02110i -3011
t0j3 02 4 x
o> 0 L-3
00
C.0
w- CA o.c
Q 0
ACCELERATION (G)
Cl.0
0 co - 9
o - 00
Hn H
M: Z 0.2
4- t--
tti1
Q/0 02Q 0
aftH

ACCELERATION (G)
........ .....
cIcn
I -, ,.,"- . ,Ii :I
. r \ ,. ' "-.. .,,
*A\I.. \ :o ...."" ,,C,, \ :
co
iii'0 0
4*
%4 4
"., .a .. .. ..
0 0
S.4... : /\, '" ....
".4 %% % ]
"-- 4.* ,/ ,/ I *

ACCELERATION (G)
zco
M
m $-A -to
.:1
:n:
coe•Qee %we
""%
.o 0
0 j
i iiii II i
cg4 ***
OZ*%

D3-6474Page 25
Explanation of the difference which proved significant can immedi-ately take two forms: 1) that the direction from which a level isapproached is responsible; and 2) that the subjects frame of refer-ence is varied as a function of the immediately preceeding vibrationlevel encountered. With the method of vibration control utilizedin this program preference is for the second of the possible explana-tions. Subjects had the prerogative in these tests of approachingany level of vibration from either direction merely by going "through"the specified level by means of the controls provided, reversingthe control and approaching from the opposite direction. Mostsubjects, did in fact, apparently prefer to approach all levelsfrom lower amplitudes or by use of self-established bracketingtechniques. (No cues concerning a preferred method were providedby the experimenter). A frame of reference concept on the otherhand, similar to Helson's "adaptation level" theory 1, seems bothplausible and appropriate to the type of perception required by thisstudy and would adequately account for the noted variations ofsubjective experience.
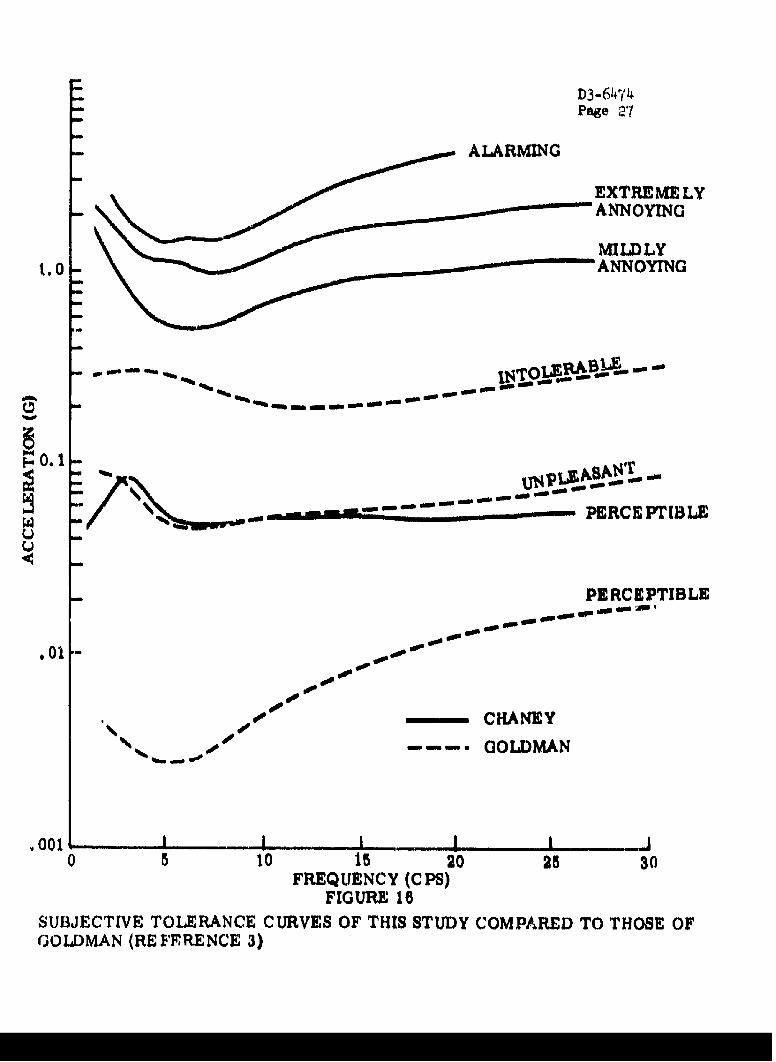
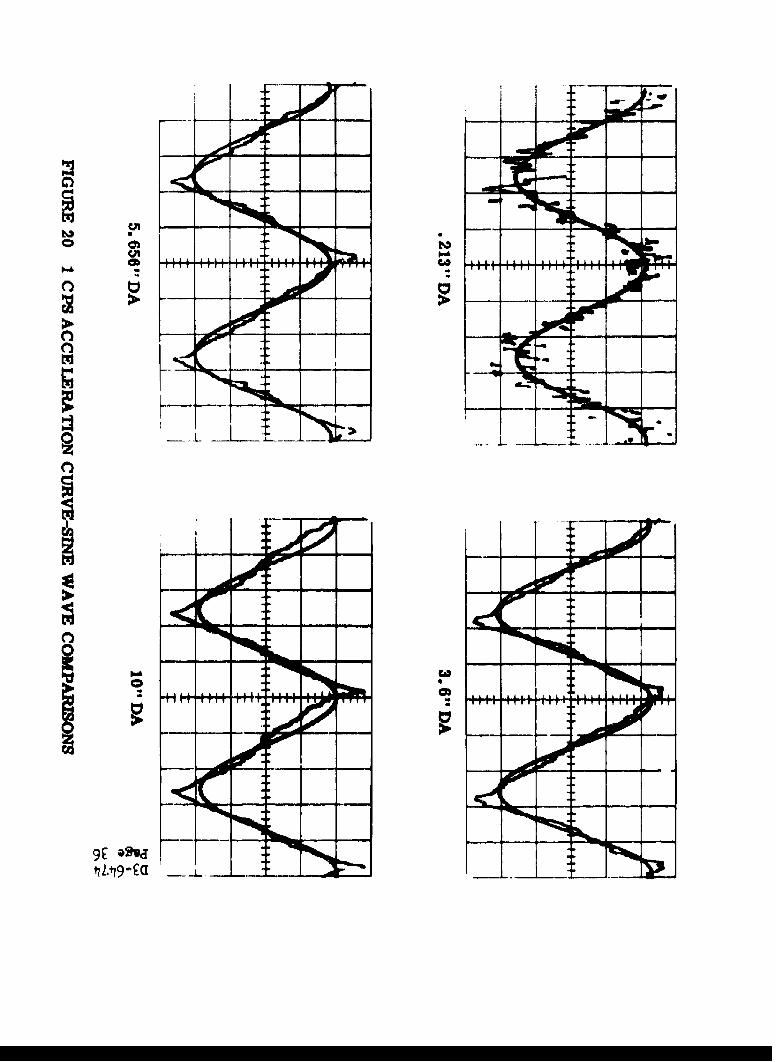
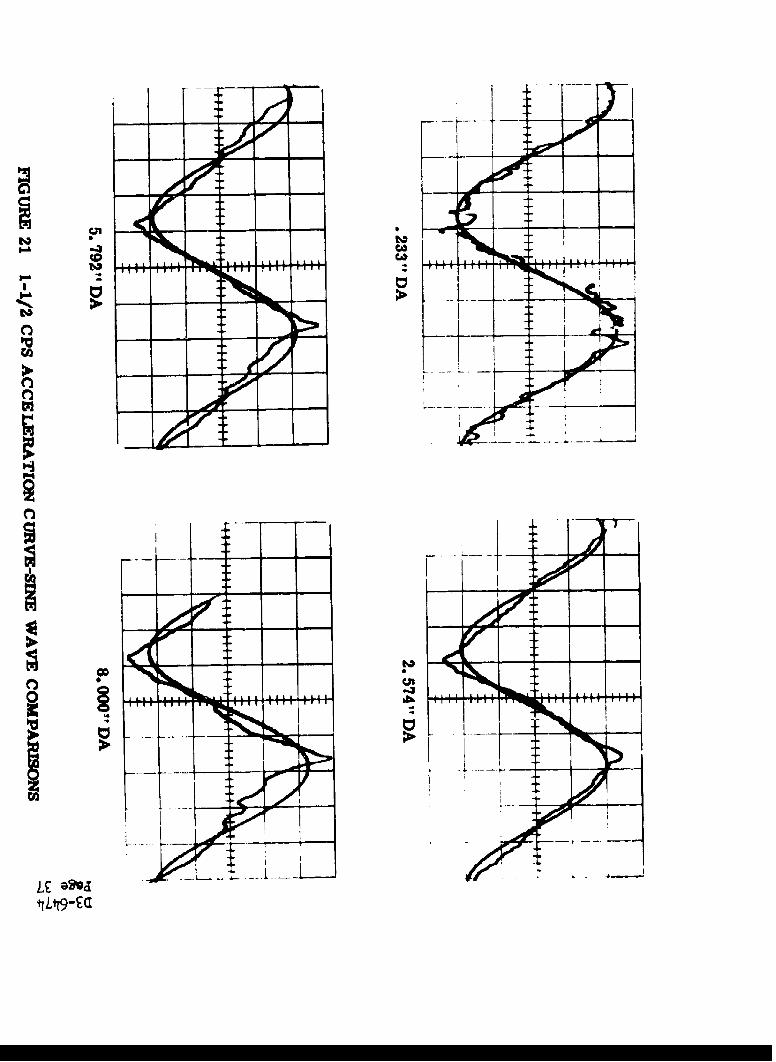
Comparisons of the curves established in this program with those ofsimilar research are shown in Figures 15 through 18. An unexpecteddrop in the "perceptible" level at the low end of the curve becomesapparent on the logarithmic scale of these figures. This drop isprobably due to the detection of vibration harmonics present at thelow levels of the 1, 1-1/2, and 2 cps frequencies. (See Figures 20,21, and 22, Appendix A).
Figure 15 shows the relationship of the curves to the short time,one minute and three minute tolerance curves cf Ziegenruecker, Magid,& Coermann 5, 8. As is evident in the illustration, thc subjectiveresponse curves approach the shape of the short time tolerance curveas intensities and the corresponding judgements increase. Also, itshould be noted that both subjective levels 3 & 4 (extremely annoy-ing and alarming) at certain frequencies have acceleration levelshigher than those established previously as one and three minutetolerance limits. With the random presentation of levels used inthe program and the average time of approximately one minute usedby subjects to establish each level, most subjects actually wereabove the one minute tolerance level for periods in excess of thatspecified. The apparent discrepancy can be explained by examinationof test methods. Whereas, in the Magid et al., studies subjectswere subjected to a constantly increasing vibration to a preselectedpoint at which they remained for the required duration, subjects ofthis study had personal control of the vibration received. Ifvibration became too severe, they could decrease it at will, andas such, knew at all times what levels of vibration to expect.Thus, there were no premature cut-offs and apprehension was markedlyreduced.

*SHORT TIME D3-6474// Page 26
/ • ALARMING
0-- - MIN. EXTREMELY
I •ANNOYING
1.0-
0
PERCEPTIBLE
.01
TOLERANCE CURVES
SUBJECTIVE RESPONSE CURVES
Sool0 0 I I__0 5 10 15 20 25 30
FREQUENCY (C PS)FIGURE 15
SUBJECTIVE RESPONSE CURVES COMPARED TO SHORT TIME,1 MINUTE AND3 MINUTE TOLERANCE CURVES OF ZIEGENRUECKE.R, MAGID & COERMANN(REFERENCE 5, 8)
D3-6474Page 27
S~ALARMING
S~EXTREMELYANNOYING
MILDLY1.0 NOM
-~ 0%
S0.1 f
- - . PERCEPTIBLE
PERCEPTIBLE
.01 do0-o
o o wgow
•00S CHANEY
00--- GOLDMAN
-Ol- ... - ' ,z
.001 10 5 1o 15 20 25 30
FREQUENCY (CPS)FIGURE 16
SUBJECTWE TOLERANCE CURVES OF THIS STUDY COMPARED TO THOSE OFGOLDMAN (RE FERENCE 3)

D3-6474
_..ALARMING
iIG KE INTE N SI'TYN
ý4 0'a ooY ING~i
- -
1.0 EXTREMELY ANNOG
-PRCBE"d I.0BL
DEFINTOO • PERC-PT ILDLY"- ANNOYING1.00 -
Goo 10m 0 25r 14 0 30
PERCEPTIBLE
'U V TUVrHRESSTOLD OF PERCEPTION
.0 1O 0R 0 A N D N ( R EýF E EN--4
.,-=.--CHANEY
--- =-=GORRILL & SNYDER
001•10 2•0 25 8
FREQUENC Y (C PS)
FIG UREC 17/
SUBIJECTIVE TOIEI.ANCE' CURVES OF THIlS STUDY COMPARED TO THOSE OF
GORRILL AND SNYDER (REFERENCE 4)

D3-6474SALARMING Page 29
AANNOYING
.. 0000 MILDLY
I *am ALARMING-0 SOO- 00 -00.0" ."-if -t' EX TR EM E LY
-~ ~ f on-"•-_ .woo 400 -0 , ANNOYING
/N Ma woo "%= - MILDLY- I/'\ -'I'#'./ %ANNOYING
/ %DE FINITE LYPERCEPTIBLE
PERCEPTIBLE
.01-
CHANEYPARKS & SNYDER
.001 10 115 2
FREQUENCY (C PS)
FIGURE 18
SUBJECTIVE TOLERANCE CURVES OF THIS STUDY COMPARED TOTHOSE OF PARKS AND SNYDER (REFERENCE 7)

D3-6474Page 30
Figure 16 shows the response curves in comparison to those ofGoldma, 3. In all cases, the curves derived in this program aredisplaced significantly upward from those assimilated from othersources in Goldman's report. Reasons for the differences can notbe deflinitely oUated, however, several logical possibilities arepresent.
Initially, the subjects of this study were isolated from the vibra-tion platform, both at the body and foot contact points, by 3/4inch hard felt and were denied visual reference to the non-vibratingenvironment. Also, subjects were instructed to reference the levelsestablished only to a personal reaction to the vibration itself,purposefully disregarding referencu to riding comfort or an opera-ti-ial situation. And again, subjects had individual command overthe vibration inputs. Lack of any of these experimental conditionswas found in preliminary tea Las to unnecensarily reduce Individualestimates of the desired vibration effects.
Comparisons of' the curves with similar ones derived by Gorrill andSnyder 4 and Parks and Snyder 7 are shown in Figures 17 & 18. Again,the curves of this program are above those of the other studies,both of which ez ployed ani operational situation in the curve deriva-tions (heavy military type control wheel and column). This fact isprobably the predominant factor producing the noted differences withthe other experimental conditions mentioned in the previous discus-sion as additional possibilities.
Physiological Effects
A summary of physiological sensations experienced by subjects inthe program may be seen in Figure 19. Solid lines indicate areaso. slight pain and dashed lines indicate a composite of othereffects, i.e., itch, pressure, tightness, etc. Little need besaid concerning these effects since they correlate closely githsimilar findings of the Magid & Coermann 5, Mandel & Lowry , andParkos & Snyder 7 studies. One exccntion to the rule, however,seems worthy of mention; the consistent report by two subjects ofslight vertigo at 27 cpe. The actual sensation experienced Is bestexpressed by the "power on stall to the left" phrase used by one ofthe subjects in his explanation. In no case was the sensation sostrong that an accompanying loss of orientation or onset of nauseaoccurred.

e
t - I ti lw R
-il > z
Iiz
ii)
II; IIi_ I II
Co I I
I IIIIi
I_ II
Ii I"cloiiI
NDp-,-
ccjii

D3-6474Page 32
As for the remaining responses, the characteristic shift of effectsupward in the body as frequency increases is present, as are thetypical problems 3f gas exchange and retention. None of the effectsencountered remained beycnd a few minutes after individual testcompletion.

D3-6474
Page 33
StWARY AID CONCLUSIONS
Goldman, Ziegenruecker & Magid, Magid & Coermann, Gorrill & Snyder,Mandel & Lowry, and Parks & Snyder have all established curvesreported to be representative of a's psychological or physiologicalreaction to the vibration environment and yet each set of curves,although in agreement as to critical frequencies, varies significantlyfrom its counterparts in absolute value. This research program wasconducted in an attempt to delineate and resolve bome of the differ-ences of these studies through specification of possible contribu-ting factors and the use of identifiable experimental controls.
Preliminary studies were conducted to determine the effects ofnumerous environmental factors and experimental techniques on thesubjective reaction to vertical vibration. Results of these testswere utilized to eliminate or minimize identified adverse interven-ing variables in a final study which established four subjectivereaction levels; perceptible, mildly annoying, extremely annoying,and alarming, in the range of 1 through 27 cps.
Subjective levels identified are generally at higher accelerationvalues than those of previous studies. Possible reasons for thedifferences including the contributions made by results of prelimin-ary studies are discussed. Also, individual values established ata given subjective level are shown to be influenced by the magnitudeof the immediately preceeding vibration level. Physiological effects,in the main, correlate with previous findings.
At least two findings in addition to the expected results of theprogram become evident in review of the research effort.
1) Preliminary tests prove of inestimable worth to an experi-mental program. In this study, lighting method, auditorycues, seating position, restraint method and force, andmethod of vibration control were all found to vary consid-erably the dependent variable with no change in the inde-pendent. A much higher degree of confidence can be affordedprogram findings as a result cf this relatively small addi-tional effort expended prior to the start of the final tests.
2) Detailed experimental and control techniques must be reportedif results in an area are to be expected to correlate withsimilar research findings. Even valid results are impossibleto interpret without the specification of possible interven-ing variables and the control vor-diio7 ! under which they

D3-6474Page 34
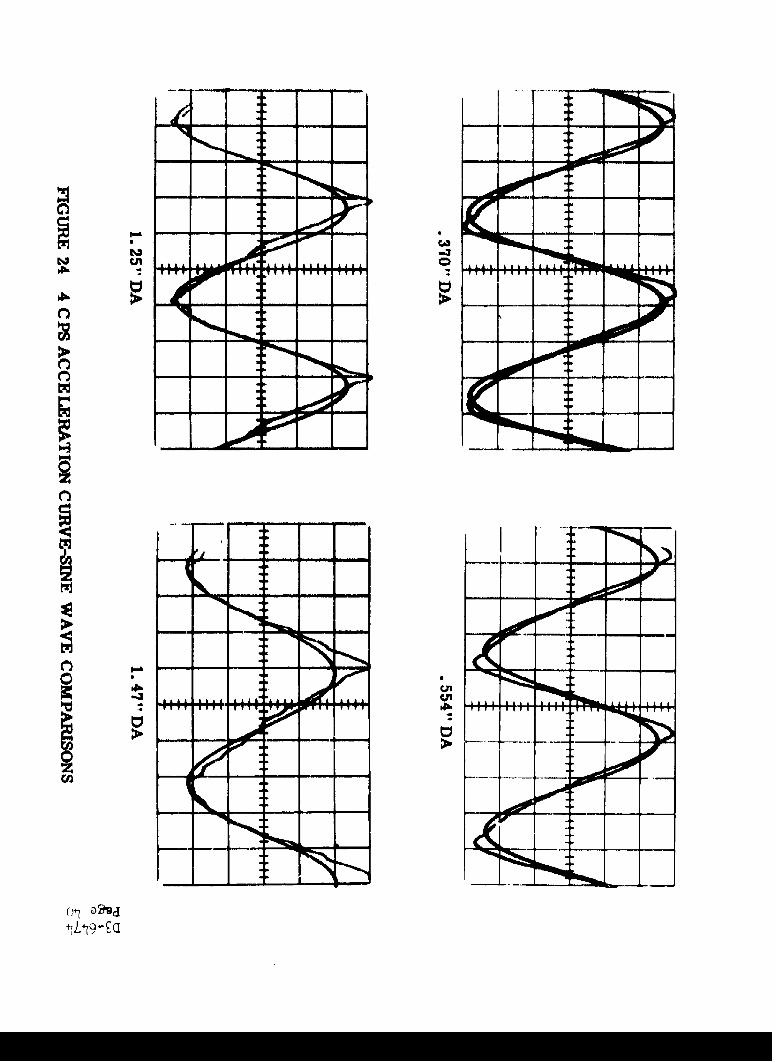
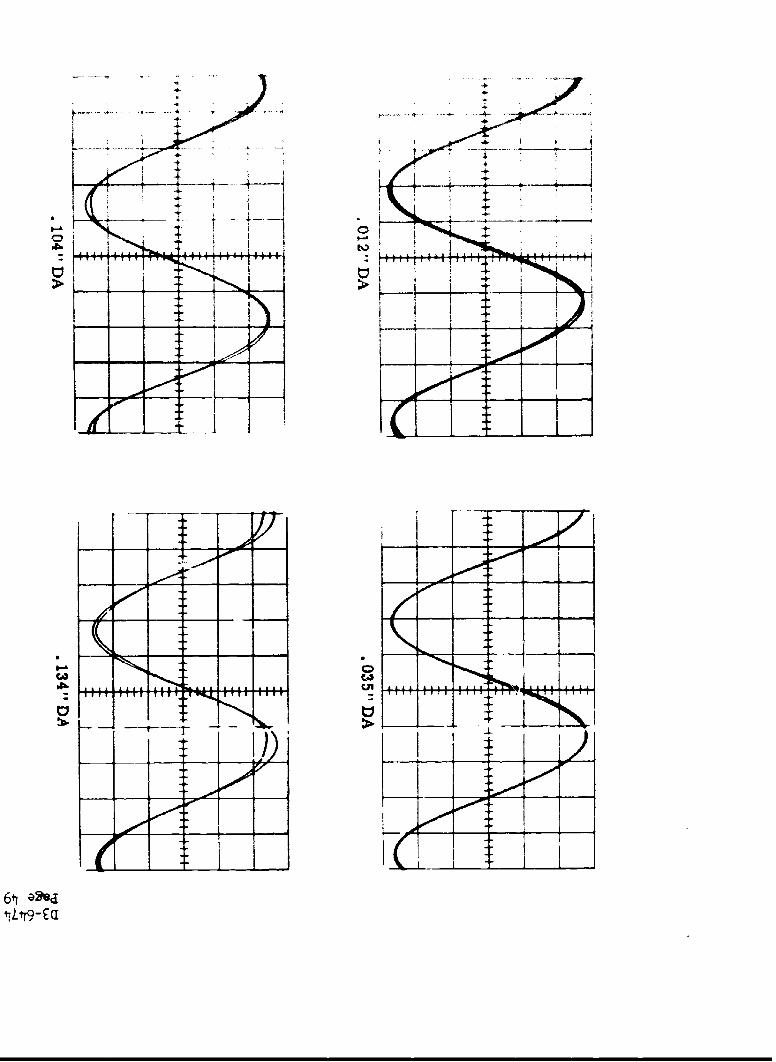
were obtained. Of particular importance in vibrationresearch is the vibration input actually received by thesubjects of the study. Definition by merely frequencyand acceleration (or displacement) are insufficient.Variations in wave form, and system 'noise" in form ofharmonics of the fundamental frequency, can have appreci-able effect upon the individuals reaction to the vibration.Sample acceleration curves of each of the test frequenciesused in this program are included in Appendix A.

D3-6474Page 35
APPENDIX A
TABLE ACCEJERATION WAVE FORM SAMPLES
0
1 14
cCa,
9c
- o
* 0
PIN
0-1
71 - -
aLq9-ua

00
>
0 1+-I TT WT , I'l
MZo
M
z[,r

o -l
C4
I --.--d-
00
cal I .00j l
C - - - ---
-f L 7'___7
- - n
C)q
-"OW
-3ooe+ C

WI-1ý. I <1
pryI I - -I ]t t . .
[--]
0 00
0
C4)
010
iJ
* I-- -

0 -- - -- - -
ii H H l
.. 1'., 1' .. 4
3179 I 029d
0ýq-c

.~~~ r i,,II*NI
- - - - - -... ...
n 60 0
0 1 ýw10I ' l l f i l

1190
111 1111 H
0z
CD,

ca .... .. ... .....I ... OD""iiI H ti iII• ItIi1 K !__II
0v>000
0 do
t!i
S.. . ... . .... .. 0.. 0,9, . . .
"o 00
ýtr aped

C.)A
C4
0n
z
00
C') -
J +,n-C0
.1- 2 ,

/000
C4 C4
0000
1--
0100
-- --- .L .0AA
00
00o-.0 00000
t? D?0

SI iTjz T I T
0 Iiii I
00
_ 0tl CA'
0
o 0.w
4 ,
~cI
tiL1e0-000

-- - - - - -
t ~ i --- ---- ----
0

0o
tL'Tt-3

D -"--".P~e •
APPENDIX 1
INSMhUCTIONS TO SUBJBCTS

SUBJTECTTNTtkIO&
will Le aidi:s us in idc tifir .c m. - 'c -p-'o•.-f the f en-ti,•n ," -e I .valuabie to tne design enicxneer and -.r.-Se per.- ..r.ficeunder vibratory ±nvircnmer-ts. Vitrati:- nwc, ew' i h y,will be asked to identifv at I 7-1'Z frne nc-e--- reefire .nthe accompanying sheet.
It should be noted that the labels proavided re meant only to serveas indicators of the definit.ions to whic-o y,:u will fit the variousvibration intensities. The description ;4ven may not fit your ownpers.-nal interpretation of the labei,. in this case, we are askingyou, for the purpose of this test, to make sure you understand thegiven definition and work toward it. disregardi..g the label.
You will notice that in each definition the word "you" appears,and with g7ood reason. Wqhat we are lookirn for is your interpreta-tion of the defined intensities, not what you think would be truefor others. Also, for this reason we request that you not discussamong yourselves any of the levels r conditions of vibration.Individual reactions are required if we are to accomplish ourob.ectives.
During the test sequences you will be presented, by means of avisual display, a label referencing the definition to which youare to adjust the vibration intensity. You will have 'control ofthe facility and will be able to increase, decrease, or maintainany vibration intuensity within facility lirits. In each test eachidentification will be made twice, bu- order of their appearancewill vary from test to test. Also, since the vibration mechanismis !im-.ied for safety and equipment reasons, some frequencies may
c :-air fo-r yo- the intensity required for one or more of theCn:.s. In these in.stanices, where you request through your-a level tcyvc.i equoiment capability, notification to that
e:-11 will be maan by the exrerimenter and a new definition willeesteu. Yo, w-ill then pr:ceed with the new adjustment.
f ...e -'acilitv is accomplish.ed by means :o-,f two pistol type-•U•, '•it.L'.•±± e eii ita... Each has a LWU positio)n "trigger"
c_ : e infex f.ir, nd a thumb actuated push button
p e trie' switc:. controls upward and downward~rt"e. uectively witn the right and left hand. Hard

7.'vi<-: " Y ,.; ;: iv [: "° , :,<l :" : .•'a: :. y l .t,.5 irrnedi-
" .- , ide - panel is a. arrow pointing* .•. -i:, will &e •inated an• aber ccicr when vou:. a(ctuate the
a 1-i•-" . i ioreaoe vi-Lraot,.n inensity. When theU ' pz &se i-wn nar, t- use '.. hl:jher rate r,, change,
---2--w illinaticn wiil U- vi it The d.wn-pointing arrowleft hand side of the ra.el pr;vides she Lame indications
"-"r l -tan .'ntrol while -neereasirn< vibratio..n intensity.
in in tne vibtiation ad,3- ;swemet ,e are interested in those§eelins orJ wilt, rerard to• vibration as a sensa-
i n vt: w-ito: respect tr, your exteriencin6 this as an environ-:•.ent I!, wi., !o sonmetr ±in else. Thits, do not react to the
r tfacility as a simdator and .judcre its characteristics
a I y were perform.xirnr Some wuinld .f task or operation. Consider-,-e -;ira- J n mrly as a sti us in its own right, keeping your
ernt+ n -_,entered ton the iii-%ted panel. Do not try to evaliate. .... eat-InE y=_•r movement to any fixed object in
.e area. We wan, y:,_L _r iased opinion as to the effect youee r ,e vibraairn. If it nelps r z concentration to close
i--. If, a a- ime, youz cannot find:ai, [ease not~if tle experimenter
m.:i:.e ill -.- •,' vtit "/eext_ ster.Eats ..... r c.n
"-"!,,;niq.es And there-.-- ...... - , " -;. . re-sits, everal items of
V,.-wC prilr to each testoe i:e v ua-> o.ear ao.. remember most if not all
..- i s. _.".....we ass indlgence in
---------------,-........o,• _ oý.3 -. 1 to.e fo'ýr levels":.W-iZ. V . t:ti:>" -:. ..:.v and we have
P- eac:. t.t rer•is.

iLfti j'iflt Ut. WIAi A riFsL become aware.a7 y, are' re;'eiviwý vibration- cin. down
+•o ""ale, ts i -- ot at+ which all senseof vibrati-ri iis.appe ar_:.
2. Mildly This is the !owe-t intensity of vibration atannoying which any -npleasant. or annoying effects are
felt. Below this point you are aware of thevibration, but it arouses no unciesirable feel-ings. Below this point there may even be somepleasant aspects.
3. Extremely This is the lowest intensity of vibration atannoying which unpleasant or annoying effects become
disturbing to a major degree and cannot beignored. You would prefer not to continue atthis intensity without good rearmn.
4. Alarming This is the intersity of vibration at whichyou begin to experience concern for yourphysical well-being. There is not necessarilyany pain present, but there is a distinctdesire to red-ce the vibration severity.You have misgivings about staying at thislevel any longer or going beyond it.
Also, we ask that you sit erect in the chair and not try to reducethe vibration i-kuts through tc.iir• Ut tne legs, lifting off thechair, etc. You may, of course, redu(e' the effects of vibrationr-CCiV-d through techniques of your own choosing, but we ask thatyo; don't attempt to modify what is received.
Too, we have found in previous tests that using the fast rates ofvibration change (hard depression of the appropriate switch), hasworKed most satisfactorily when going between levels. How youchoose to approach and decide upon the exac level of vibrationwhich matches the definition provided is yoir choice, but we askthat yo-li use the fast rates between levels -where large changes arerequired. This is most important in reducing vibration aftermaking selections at the higher levels.

H Wf-ver, j r. a .n... ."I -
rV:.'i •. v , & a'.... h a e a-.ey I r- . rw, ahe.we b-ve 1imits -t au ± a' ,e frequer<'y a.%d
at yC)wi may rea(uori U-." ....... identifyingi L r dei'iebu ieves• I,. c,-.ic: case-, we wil± notifyYD, f "maximnm ampli ude" arýd pr vide y wta new level. Iti s alr P~ssible t rat you can not hi:a vibrati n it ome casewhich yo, u feel matches the definit-in'-e prvaed. In this event ifyo. will notify us of the fact we will aga'n proceed to tue nextle, el.
Are there any iiestions?

APPENDIX C
INDIVIDUAL SUBJECT RES••ONSE CURVES

ACCELERATION (G)
0 0
c-a
ttil
cC.)
'-4j
00
0 6cI

ACCELERATION (G)
I-A
I--
00
'1z
)Ocob
~>c4
W 4
ACCELERATION (G)
p C CA,
000
t!I-4
00
tilH
till
til
t~l z
T9
11Ltr9 -C a
C)

ACCELERATION (G)
\N )SOD,
two
NI
m 0
I-s
z
W M
NZ
_c,2 0
>un

ACCELERATION (G)
SC))
• - 9,C..4
A)
0
zw
> 0 00
oc
C-)
ca 02
0 t" 0
0 9)
~ýLtJ
•-•• iI• • -

ACCELERATION (G)
co
00
ba 0LIo
W
00-G.I

ACCE LERATION (G)
coo
0oc
co 0
tRI3
z
to!
>
0 m
ot- 49
iýq d0 rt
ACCELERATION (G)
- oj
00
'-Aj
00
zz00
00

ACCELERATION (G)
0 9 0
00
I* .h n
0 09
ACCELERATION (G)
00
I>
)z
00
3,1 0

ACCELERATION (G)
I-I?
CJ1D
00
0 0
> Cnw
ttxl
00

ACCELERATION (G)
00
0-
'-0
z
0til
00
00
ACCELERATION (G)
p• IJ A :
t~--
0
0m
00

ACCELERATION (G)
c'
I
Qo-
0
0I
t_4
0~P
-b

ACCELERATION (G)
4k 0
00
o~a -IC
>~ 0
t~4
000Iri(

ACCELERATION (G) I
0- 1,iI
I1 1
0
/I
oI- I)

ACCELERATION (G)
cJ'
i°,
\ -3'Iwo" 0
C4
m m n m m
0 A

ACCELERATION (G) I
P u
~~0
M
%.Wc
00
S'4 1'
.4•
o,
ACCELERATION (G)
c: co ?.-0
- 0cc °
0 °'
~!I
,-z -0
Ld rn
00
0 0
1 / z
0 0

IACCELERATION (G) I
00
co -i
oo •
z 4 ~z
06 0C.4
No o
0 0
immm
D3-6474
Page 78
ACKNOWLEDGEMENT
The following Boeing personnel served as subjectr for thisexperiment. Their interest and cooperation throughout theprogram contributed much to its successful completion andi.S greatly appreciated.
Robert F. Clements Alan E. Lee
Arnold F. Minks Doyle A. Murphy
Joy M. Nelson Waller J. Newby
Eldon N. Raines Robert D. Setter
James D. Solomon Wayne L. White
Recognition s:ofld also be given the following individualsfor their contribution to the program:
Paul E. Pearce - subject preparation and debriefing.
Jim P. Homan - tz'st equipment design and set-up.
Raymond A. Lawn, M.D. - subject medical examinationsand monitoring
Gilbert C. TrLhurst, Ph.D. - Office of Naval Research,Scientific Off ier for :his program, whose suggestionscontributed suictQrtially to he effectiveness of thestudy.