Embed Size (px)
Citation preview

1
Findings from Independent Research Linking the i-Ready Diagnostic and 2015 Florida Standards Assessments
i-Ready and the Florida Standards Assessments

2
* For the analyses conducted in this study, students who scored at achievement level 3 (Passing) or above are considered proficient.
Independent Research Finds a Strong Link between i-Ready and Florida Standards Assessments Following the release of Florida Standards Assessments (FSA) results early in 2016, the Educational Research Institute of America conducted a research study evaluating the relationship between i-Ready Diagnostic and FSA end-of-year assessments. The purpose of this study was to examine the validity evidence supporting the use of i-Ready Diagnostic as a tool for evaluating students’ progress toward learning the knowledge and skills established by the Florida Standards and measured by the Florida Standards Assessments. Researchers analyzed the relationship between i-Ready scores and FSA scores for over 29,000 students in grades 3 through 8. Students in the sample were enrolled in 73 schools in10 districts across the state of Florida.
The research found a high correlation between i-Ready Diagnostic and FSA which significantly exceeded criteria set by the National Center on Response to Intervention (NCRTI). i-Ready was also shown to accurately classify students’ FSA proficiency* status and accurately predict end-of-year proficiency rates based on students’ fall, winter, and spring Diagnostic performance.
Backed by these strong results, educators can confidently use the i-Ready Diagnostic to guide critical decisions in their districts, schools, and classrooms. With the information available in this research and the rich data available in the i-Ready program, educators can:
• Identify students at risk of falling behind and make early intervention decisions to support those students.
• Predict the proportion of students who will be proficient at the school, grade, and class level to guide intervention plans and inform resource allocation decisions.
• Plan future educational strategies and curriculum decisions to help all students reach proficiency.

3
i-Ready Is Highly Correlated with Florida Standards AssessmentsThe strong correlations between the spring i-Ready Diagnostic and the 2015 Florida Standards Assessments—with average correlations of 0.82 for both English Language Arts and Mathematics—far surpass the 0.70 standard set by the National Center on Response to Intervention (NCRTI) for screening tools.
n=24K
Correlations for Spring i-Ready Diagnostic and 2015 FSA
3 4 5 6 7 8
.82.83
.81.82
.83.82
3 4 5 6 7 8
.83 .84.82
.74
.82.85
English Language Arts by Grade 3 4 5 6 7 8
.82.83
.81.82
.83.82
3 4 5 6 7 8
.83 .84.82
.74
.82.85
Mathematics by Grade
Why Correlations Matter Correlations are one of the most commonly used and widely accepted forms of validity evidence. Correlations demonstrate that when students score high on one assessment, they also tend to score high on the other, and similarly, when students score low on one assessment they also tend to score low on the other. A high correlation between two assessments provides evidence that the two tests are measuring similar constructs.
* Due to the large number of students who took a mathematics End-of-Course (EOC) assessment in Algebra or Geometry, rather than the grade 8 FSA Mathematics assessment, the study sample is significantly smaller in grade 8 mathematics than other grades. This also results in a restricted representation of the range of mathematics ability, particularly at the higher end of the scale, as measured by the FSA and i-Ready in grade 8. Such restriction of range is likely the reason for the relatively lower mathematics correlation for this grade.
Average Correlations
Math: 0.82 ELA: 0.82
0.70
Assessment correlations above 0.70 are considered convincing evidence of validity by the NCRTI. In a 2015 study of over 24,000 students’ FSA results, i-Ready consistently exceeded this benchmark.
*

4
i-Ready Accurately Predicts Florida Standards Assessments Proficiency RatesUnderstanding whether or not students are tracking toward proficiency is critical for educators as they plan their educational strategies, allocate scarce resources, and target intervention efforts. In an extensive analysis of i-Ready Diagnostic and spring 2015 FSA scores, i-Ready Diagnostic results were shown to accurately predict students’ FSA results across grades and subjects.
Area Under the Curve (AUC) Analysis The NCRTI states that when the Area Under the Curve (AUC) from ROC analysis is at least 0.85, one assessment is an accurate predictor of another assessment.* Results from the AUC analysis of spring i-Ready Diagnostic and FSA scores are 0.88 or higher for all grades and subjects, surpassing the standard set by NCRTI.
AUC Values Using Spring i-Ready Diagnostic Scores to Predict Proficiency on Florida Standards Assessments
3 4 5 6 7 8
.82 .82 .82 .82.81.83
3 4 5 6 7 8
.83 .83.85 .84.85
.82
3Subject 4 5Grade Level
6 7 80.910.90
0.930.90
0.930.91
0.910.92
0.910.90
0.880.90Reading
Mathematics
* For additional information on ROC analysis and AUC, see the NCRTI website: http://www.rti4success.org/screening-glossary-terms

5
i-Ready’s Proficiency Prediction Model Demonstrates Remarkable Accuracy
i-Ready Diagnostic Accuracy in Predicting FSA ELA Proficiency
GradeFall i-ReadyPredicted
Winter i-ReadyPredicted
Spring i-ReadyPredicted
ObservedFSA
SampleSize
345678
51%51%46%36%34%38%
51%51%47%36%34%37%
51%50%46%36%34%36%
51%50%46%36%34%36%
5,3893,7353,3443,2772,7492,165
GradeFall i-ReadyPredicted
Winter i-ReadyPredicted
Spring i-ReadyPredicted
ObservedFSA
SampleSize
345678
61%59%56%38%38%34%
61%59%57%39%38%34%
61%60%57%39%39%36%
62%60%57%40%39%35%
5,4134,9585,0962,9462,2751,473
GradeFall i-ReadyPredicted
Winter i-ReadyPredicted
Spring i-ReadyPredicted
ObservedFSA
SampleSize
345678
51%51%46%36%34%38%
51%51%47%36%34%37%
51%50%46%36%34%36%
51%50%46%36%34%36%
5,3893,7353,3443,2772,7492,165
GradeFall i-ReadyPredicted
Winter i-ReadyPredicted
Spring i-ReadyPredicted
ObservedFSA
SampleSize
345678
61%59%56%38%38%34%
61%59%57%39%38%34%
61%60%57%39%39%36%
62%60%57%40%39%35%
5,4134,9585,0962,9462,2751,473
Aggregate Proficiency Prediction Based on data collected from districts using i-Ready Diagnostic and taking spring 2015 Florida Standards Assessments, Curriculum Associates partnered with leading academics to develop a regression-based model for predicting FSA proficiency rates. This model is designed to aid educators in predicting students’ FSA results as early in the academic year as possible, with the ultimate goal of helping guide resource allocation and intervention decisions. The prediction model proved to be remarkably accurate across grades and subjects.-
i-Ready’s predicted proficiency rates were remarkably consistent with observed FSA proficiency rates--often within 1% of observed proficiency for the sample.
Note: In the results above, the i-Ready Predicted percentage is the percentage of students estimated to be proficient for each grade, using the logistic regression model. The Observed FSA percentage is the actual observed proficiency rate for the same group of students.
The i-Ready model accurately predicted the observed (or actual) FSA proficiency rates for the sample using Diagnostic data collected during the fall and winter.
i-Ready Diagnostic Accuracy in Predicting FSA Mathematics Proficiency
6
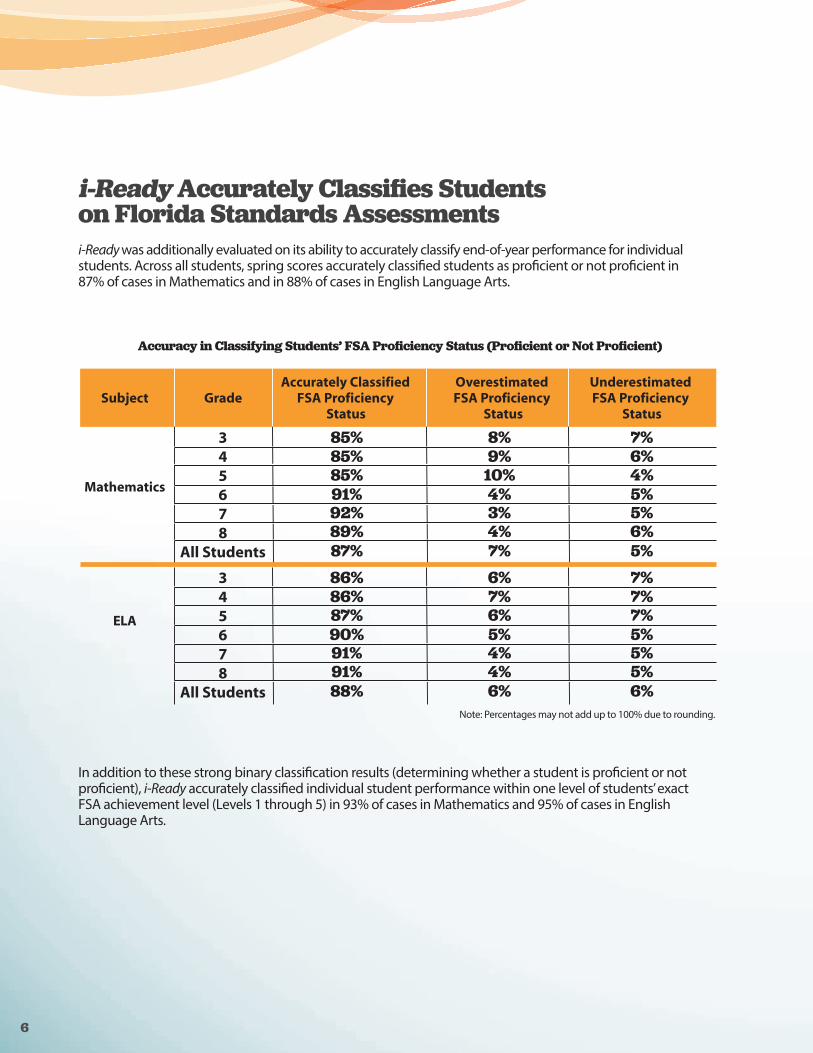
i-Ready Accurately Classifies Students on Florida Standards Assessmentsi-Ready was additionally evaluated on its ability to accurately classify end-of-year performance for individual students. Across all students, spring scores accurately classified students as proficient or not proficient in 87% of cases in Mathematics and in 88% of cases in English Language Arts.
In addition to these strong binary classification results (determining whether a student is proficient or not proficient), i-Ready accurately classified individual student performance within one level of students’ exact FSA achievement level (Levels 1 through 5) in 93% of cases in Mathematics and 95% of cases in English Language Arts.
Accuracy in Classifying Students’ FSA Proficiency Status (Proficient or Not Proficient)
Subject
Mathematics
ELA
GradeAccurately Classified
FSA Proficiency Status
Overestimated FSA Proficiency
Status
Underestimated FSA Proficiency
Status
345678
All Students
345678
All Students
85%85%85%91%92%89%87%86%86%87%90%91%91%88%
8%9%10%4%3%4%7%6%7%6%5%4%4%6%
7%6%4%5%5%6%5%7%7%7%5%5%5%6%
Note: Percentages may not add up to 100% due to rounding.

7
Using i-Ready to Inform DecisionsBased on the analyses explored in this research, the Educational Research Institute of America concluded that:
• i-Ready Diagnostic scores are strongly correlated to the scores on the Florida Standards Assessments in English Language Arts and Mathematics administered to students in 2015.
• i-Ready Diagnostic scores can be used to accurately predict and classify students’ proficiency on the 2015 Florida Standards Assessments in English Language Arts and Mathematics.
Proficiency Prediction in the i-Ready Program
This research further supports i-Ready as an ideal tool for informing critical decisions that ultimately improve district, school, and student achievement. In order to further inform educators’ most critical decisions, Curriculum Associates is building new reporting functionality for the 2016–2017 academic year that will provide a prediction of student proficiency rates (the percentage of students in a grade, school, or district predicted to reach proficiency) on the Florida Standards Assessments based on fall and winter i-Ready Diagnostic results. Reports in i-Ready program will allow districts to:
• Predict student proficiency rates early in the year, when changes to educational strategies and intervention efforts can have the greatest impact.
• Understand challenge areas and direct resources toward groups of students with lagging performance several months in advance of summative assessments.

8
About the ResearchCurriculum Associates contracted with Educational Research Institute of America (ERIA) to conduct a study to evaluate the validity of i-Ready Diagnostic for both Reading and Mathematics. ERIA collected and analyzed i-Ready Diagnostic and FSA scores for over 29,000 students during the 2014–2015 academic year. A total of 10 school districts and 73 different schools across the state of Florida were included in the study. All of the students included in the study were enrolled in grades 3 through 8.
The Florida Standards Assessments included in the research were administered between March and May across most participating schools. The corresponding i-Ready Diagnostics were administered during the 2014–2015 school year in the fall (prior to December), winter (December to mid-March), and spring (mid-March to end of May). The research sample included a diverse range of students enrolled in grades 3 through 8 at 73 elementary and middle schools. The percentage of non-Caucasian students enrolled in the schools ranged from 30% to 96%, with an average of 66%. The percentage of students eligible for the National School Lunch Program (NSLP) ranged from 49% to 99%, with an average of 68%. The percentage of English Language Learners ranged from 1% to 20%, with an average of 7%.
ERIA conducted data analyses using overall scale scores from i-Ready Diagnostic and the scale scores from the 2015 FSA. In addition to scale scores, ELA and Mathematics achievement levels produced by the FSA were used to determine classification accuracy; FSA results place students at one of five levels of achievement, with an attainment of Level 3 considered “Passing.”
The following statistical analyses were conducted:
• Correlations between the i-Ready Diagnostics and the Florida Standards Assessments in ELA and Mathematics were computed for each subject, by grade level.
• Area Under the Curve (AUC) values from Receiver Operating Characteristic (ROC) curve analysis were computed to provide an overall indication of the diagnostic accuracy of the i-Ready Diagnostics.
• Equipercentile linking was conducted between scores on the FSA ELA and Mathematics Assessments and the i-Ready Reading and Mathematics assessments, resulting in concorded scores between the two sets of assessments.
• Classification analyses were conducted for each subject and grade level, using the i-Ready cut scores that were comparable to the FSA achievement levels that resulted from the equipercentile linking of i-Ready and Florida Standards Assessments scores.
For the correlation analyses, the .05 level of significance was used as the level at which results would be considered statistically significant. All tests were statistically significant, with actual results significant at the ≤0.0001 level.
Read the Full Report
To receive a full copy of the research conducted by ERIA, please contact your Curriculum Associates representative or request a copy at [email protected].
Additional Validity Research Supporting the i-Ready Diagnostic
The i-Ready Diagnostic is backed by extensive validity research and consistently achieves industry-leading results when studied alongside rigorous assessments designed to assess college and career readiness standards. Examples of additional i-Ready validity research include:
• 2015 i-Ready Diagnostic Florida Standards Assessments Validity Study (full report) • 2015 i-Ready Diagnostic PARCC Validity Study • 2015 i-Ready Diagnostic SBAC Validity Study• 2013, 2014, and 2015 i-Ready Diagnostic New York State Validity Studies• 2013 linking studies with MetaMetrics Lexile® and Quantile® measures
While this summary focuses on results from the 2015 FSA Validity Study, other validity research is available upon request. For copies of any of these studies, please contact your account team or learn more at www.curriculumassociates.com/products/research.aspx.
9
About i-Ready AssessmentsAt Curriculum Associates, it’s our philosophy that all assessment programs should ultimately serve students and teachers. Our goal is to provide educators with rich, intuitive assessment data that equips teachers to adapt teaching and learning and ultimately makes classrooms more efficient. With this goal in mind, we have developed the i-Ready system of assessments.
The i-Ready System of Assessments
i-Ready offers one assessment system that efficiently meets many needs. Within that system are two kinds of assessment tools: a Diagnostic that provides a global view of K–12 skills, and a grade-specific Standards Mastery measure that maps to a district’s scope and sequence. This two-pronged approach provides districts with both a grade-agnostic view into whether students are on track to reach proficiency and meet annual growth goals, and a grade-level view of students’ mastery of specific skills and standards.
i-Ready Diagnostic was developed in cooperation with leading academics and was built with the input and guidance of hundreds of experienced educators. The i-Ready Diagnostic is also backed by extensive validity research and consistently achieves industry-leading results when studied alongside rigorous assessments designed to assess college and career readiness standards. Educators use the i-Ready Diagnostic to:
• Diagnose student needs at the sub-skill level and prescribe proven instructional resources for each student
• Identify grades, classes, and students at risk of falling behind
• Determine where additional resources are needed, and for which groups
• Organize differentiated small group instruction and identify appropriate instructional resources for each group
• Track student growth over time, ensuring all students are making progress toward long-term academic success
i-Ready Standards Mastery, a new assessment tool launched in the fall of 2015, is designed to provide deep insight into students’ mastery of individual grade-level standards. Educators can use i-Ready Standards Mastery to:
• Monitor students’ ongoing progress through grade-level instruction
• Provide teachers with real-time visibility into students’ learning needs, informing reteaching and remediation
• Understand common misconceptions and errors through detailed response analysis
• Recommend specific instructional resources, drawing from i-Ready and Ready’s proven programs
To learn more about the i-Ready system of assessments, please contact your account team or request information at [email protected].

10
i-Ready Advisorsi-Ready Diagnostic was developed in cooperation with leading academics and was built with the input and guidance of hundreds of experienced educators. In addition to this input, i-Ready Assessments are developed and continuously improved based on the guidance of an expert team of technical advisors. The i-Ready Technical Advisory Committee Members and Expert Curriculum Advisors include:
Dr. Laine Bradshaw, Assistant Professor of Quantitative Methodology in the Educational Psychology Department at the University of Georgia.
• Psychometrician whose research focuses on advancing diagnostic measurement methodology for providing multidimensional information about students’ complex knowledge structures, including concepts they understand as well as misconceptions they have.
• Recipient of the Jason Millman Promising Measurement Scholar Award from the National Council on Measurement in Education.
Dr. Richard Brown, Founder and CEO of West Coast Analytics• Former Associate Professor, Psychometrician, Rossier School of Education of the University
of Southern California.• Former Director of National Center for Research on Evaluation, Standards, and Student Testing
(CRESST) at UCLA.• One of the primary psychometricians for i-Ready Diagnostic since its inception.
Dr. Hua Hua Chang, Professor of Psychology at the University of Illinois at Urbana-Champaign.• Editor-in-Chief of Applied Psychological Measurement, past President of the Psychometric Society
(2012–2013), and a Fellow of the American Educational Research Association. • Currently serves as the director of the Confucius Institute at UIUC, and he was most recently awarded
the Changjiang Scholar Chair Professorship by the Ministry of Education of the People’s Republic of China.
Dr. David Chard, Dean of the Annette Caldwell Simmons School of Education and Human Development at Southern Methodist University.
• Research review panelist at both state and national levels, including panels of the National Science Foundation and U.S. Department of Education.
• Awarded more than $11 million in federal, state, and private grants since 1993.
Dr. James W. Cunningham, Professor Emeritus of Literacy Studies, University of North Carolina at Chapel Hill.
• Widely known for his research on text complexity and reading comprehension. Work has been featured in many prominent publications, including the Journal of Literacy Research and Reading Research Quarterly.
• Elected member of the ILA Reading Hall of Fame.

11
Dr. Mark Ellis, Professor of Education at California State University, Fullerton and Director of the Mathematics and Science Teacher Initiative.• Principal Investigator or co–Principal Investigator for four projects involving innovative approaches
to teacher preparation and teacher development. • Served on the National Council of Teachers of Mathematics (NCTM) Board of Directors from
2011–2014 and contributed to the development of NCTM’s Principles to Actions: Ensuring Mathematical Success for All.
• Has published over 40 articles and in 2015 received NCTM’s Linking Research to Practice Award as co-author of the Mathematics Teaching in the Middle School article, “Multidimensional Mathematics Teaching.”
Dr. Lori Helman, Associate Professor in the Department of Curriculum and Instruction at the University of Minnesota.• Many years of bilingual teaching experience at the early grades; leads new teacher induction programs.• Co-Director of the Minnesota Center for Reading Research.
Dr. Andrew Ho, Professor of Education at the Harvard Graduate School of Education.• Dr. Ho’s research critiques and clarifies educational accountability metrics, including proficiency, growth,
achievement gaps, and value-added.• Member of the National Assessment Governing Board and a recipient of the Jason Millman
Promising Measurement Scholar Award from the National Council on Measurement in Education.
Dr. Stephen Sireci, Professor of Education and Co-Chairperson of the Research and Evaluation Methods Program and Director of the Center for Educational Assessment in the School of Education at the University of Massachusetts Amherst.• His research focuses primarily on educational test development and evaluation, particularly issues
of validity, cross-lingual assessment, standard setting, and computer-based testing.
12