Embed Size (px)
Citation preview

I R S G
RUBBER STATISTICAL
BULLETIN
Vol. 71, No. 10-12
April – June 2017
51 Changi Business Park Central 2, # 06-04/05 The Signature, Singapore 486066
Tel: +65 6588 0463 Fax: +65 6588 0468
Email: [email protected]
Website: http://www.rubberstudy.com

RUBBER STATISTICAL BULLETIN
Published by the International Rubber Study Group
The International Rubber Study Group is an intergovernmental organisation with the status of a
recognised international body in Singapore formally established by a Headquarters Agreement with the
Government of Singapore.
The Group also publishes the Rubber Industry Report on a quarterly basis, World Rubber Industry
Outlook biannually and Secretariat papers on many aspects of the world rubber economy. Each year
proceedings of annual meetings are made available to Member Governments, while reports of the
annual World Rubber Summit are available for sale. Further details can be found on the page entitled
Current Publications.
NOTES ON THE STATISTICAL TABLES
1. Figures are expressed in thousands of tonnes, unless otherwise specified.
(1 tonne = 1 metric ton = 2204.6 lb.)
2. Symbols:- The following symbols are used:
... = not available 0.0 = less than half the unit employed - = nil
YTD = Year to date (i.e. to the last month indicated)
ATD = Average to date
3. Estimates:- Italics are used to indicate estimated figures. Those columns annotated with an
asterisk (*) contain data based on incomplete information, whereas other estimates have been derived
from reported statistics. World totals, which may include discrepancies in officially reported statistics,
are rounded to the nearest 1,000 or 10,000 tonnes and are not in italics.
4. Natural Rubber: - Figures include the dry rubber content of latex + NR content in compound
rubber.
5. Synthetic Rubber:- Figures for "Synthetic Rubber" include copolymers of styrene and
butadiene (SBR) and styrene block-copolymers (SBR, SBS/SIS/SEBS); of acrylonitrile and butadiene
(NBR); of ethylene and propylene (EPDM); of isobutylene and isoprene (butyl rubber IIR); and
polymers of butadiene (BR), isoprene (IR) and chloroprene (CR). Minor amounts of speciality rubbers
are included. Tonnages include the solids content of latices and the SR content of 'masterbatch'.
6. Stocks:- Figures refer to the end of the period shown.
7. Revisions:- As each Bulletin contains all revisions to date, cumulative tables from previous
issues should not be used for comparison.
8. The sequence of regions throughout the Bulletin is as follows:- Asia-Pacific, EMEA (Europe,
Middle East and Africa) and the Americas. The EMEA region is split into two subregions: 28
countries that belong to the European Union (EU-28) and the remaining EMEA countries (EMEA (ex.
EU-28)). Within each region countries are listed alphabetically. The regions and their countries are
listed in a separate document on the website.
9. Many countries provide data to the nearest tonne, which are available from the Secretariat on
request.
10. Please refer to the following page for codes according to the Harmonised System (HS) of
Trade Nomenclature.

RUBBER STATISTICAL BULLETIN
Harmonised System (HS) of Trade Nomenclature
The following list provides HS codes at the 6-digit code level as used in the reporting of trade flows in
the Rubber Statistical Bulletin. Codes are listed here in two groups: Natural Rubber and Synthetic
Rubber.
HS 6-digit CODE COMMODITY DESCRIPTION
Natural rubber:
400110 Natural rubber latex, whether or not pre-vulcanised
400121 Natural rubber in ribbed smoked sheets (RSS)
400122 Technically specified natural rubber (TSR)
400129 Other natural rubber
Natural rubber - rich grades of compound rubber:
400520 Rubber solutions, dispersions n.e.s.
400591 Compounded unvulcanised rubber in plates, sheets or strip
400599 Compounded unvulcanised rubber in primary forms n.e.s.
Synthetic rubber:
400211 Latex of styrene-butadiene rubber (SBR)/carboxylated Styrene
-butadiene rubber (SBR)
400219 Styrene-butadiene rubber (SBR)
400220 Poly-butadiene rubber (BR)
400231 Isobutene-isoprene (butyl) rubber (IIR)
400239 Halo-butyl rubber (HIIR)
400241 Latex of chloroprene (chloro-butadiene) rubber (CR)
400249 Chloroprene (chloro-butadiene) rubber (CR)
400251 Latex of Acrylo-nitrile rubber (NBR)
400259 Acrylo-nitrile rubber (NBR)
400260 Poly-isoprene rubber (IR)
400270 Ethylene-propylene-nonconjugated diene rubber (EPDM)
400280 Mixtures of natural rubber of 4-digit heading 4001 with synthetic-
-rubber of 4-digit heading 4002
400291 Other latex of synthetic rubber
400299 Other synthetic rubber
400510 Compounded rubber, un-vulcanised, in primary forms, or in plates,
-sheets and strips, with carbon-black or silica
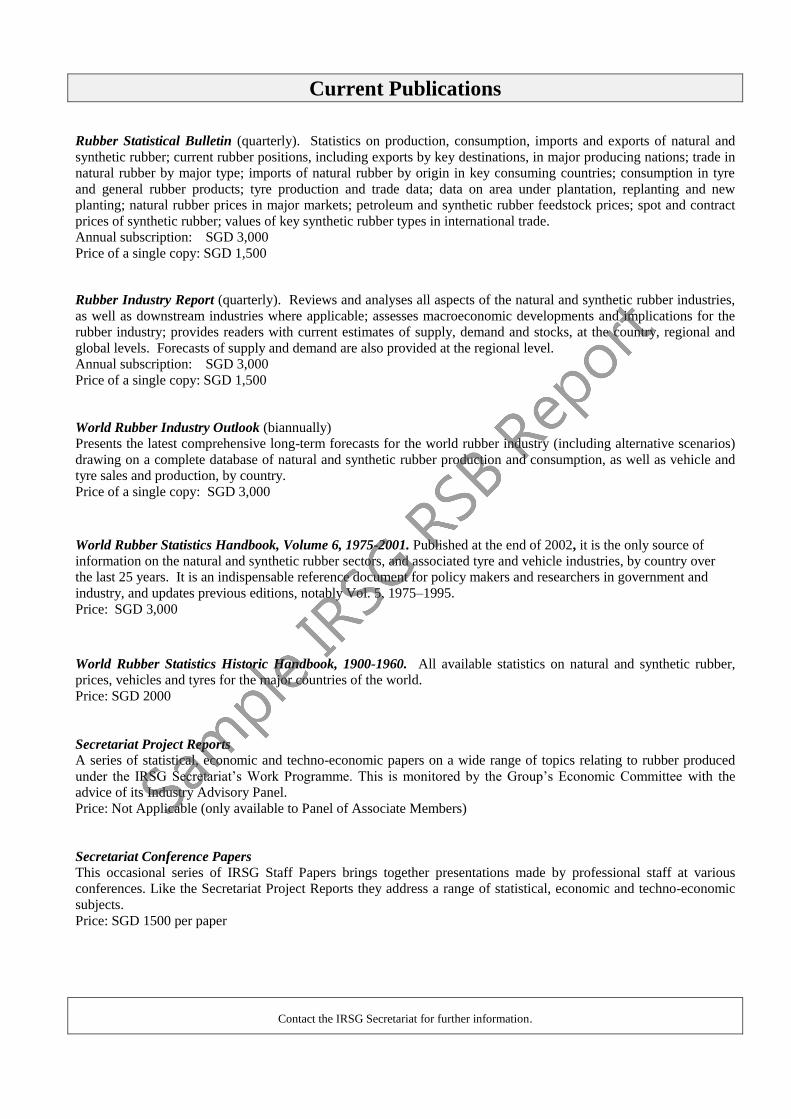
Current Publications
Rubber Statistical Bulletin (quarterly). Statistics on production, consumption, imports and exports of natural and
synthetic rubber; current rubber positions, including exports by key destinations, in major producing nations; trade in
natural rubber by major type; imports of natural rubber by origin in key consuming countries; consumption in tyre
and general rubber products; tyre production and trade data; data on area under plantation, replanting and new
planting; natural rubber prices in major markets; petroleum and synthetic rubber feedstock prices; spot and contract
prices of synthetic rubber; values of key synthetic rubber types in international trade.
Annual subscription: SGD 3,000
Price of a single copy: SGD 1,500
Rubber Industry Report (quarterly). Reviews and analyses all aspects of the natural and synthetic rubber industries,
as well as downstream industries where applicable; assesses macroeconomic developments and implications for the
rubber industry; provides readers with current estimates of supply, demand and stocks, at the country, regional and
global levels. Forecasts of supply and demand are also provided at the regional level.
Annual subscription: SGD 3,000
Price of a single copy: SGD 1,500
World Rubber Industry Outlook (biannually)
Presents the latest comprehensive long-term forecasts for the world rubber industry (including alternative scenarios)
drawing on a complete database of natural and synthetic rubber production and consumption, as well as vehicle and
tyre sales and production, by country.
Price of a single copy: SGD 3,000
World Rubber Statistics Handbook, Volume 6, 1975-2001. Published at the end of 2002, it is the only source of
information on the natural and synthetic rubber sectors, and associated tyre and vehicle industries, by country over
the last 25 years. It is an indispensable reference document for policy makers and researchers in government and
industry, and updates previous editions, notably Vol. 5, 1975–1995.
Price: SGD 3,000
World Rubber Statistics Historic Handbook, 1900-1960. All available statistics on natural and synthetic rubber,
prices, vehicles and tyres for the major countries of the world.
Price: SGD 2000
Secretariat Project Reports
A series of statistical, economic and techno-economic papers on a wide range of topics relating to rubber produced
under the IRSG Secretariat’s Work Programme. This is monitored by the Group’s Economic Committee with the
advice of its Industry Advisory Panel.
Price: Not Applicable (only available to Panel of Associate Members)
Secretariat Conference Papers
This occasional series of IRSG Staff Papers brings together presentations made by professional staff at various
conferences. Like the Secretariat Project Reports they address a range of statistical, economic and techno-economic
subjects.
Price: SGD 1500 per paper
Contact the IRSG Secretariat for further information.
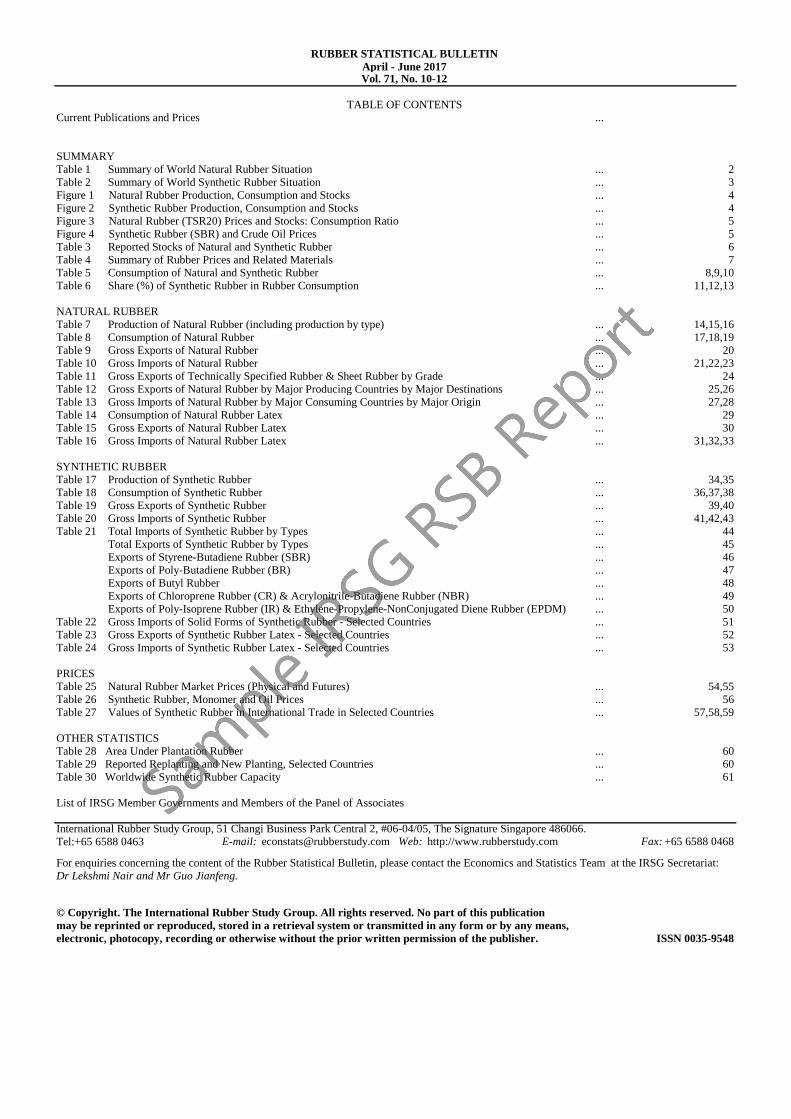
RUBBER STATISTICAL BULLETIN
April - June 2017Vol. 71, No. 10-12
TABLE OF CONTENTS
Current Publications and Prices ...
SUMMARY
Table 1 Summary of World Natural Rubber Situation ... 2
Table 2 Summary of World Synthetic Rubber Situation ... 3
Figure 1 Natural Rubber Production, Consumption and Stocks ... 4
Figure 2 Synthetic Rubber Production, Consumption and Stocks ... 4
Figure 3 Natural Rubber (TSR20) Prices and Stocks: Consumption Ratio ... 5
Figure 4 Synthetic Rubber (SBR) and Crude Oil Prices ... 5
Table 3 Reported Stocks of Natural and Synthetic Rubber ... 6
Table 4 Summary of Rubber Prices and Related Materials ... 7
Table 5 Consumption of Natural and Synthetic Rubber ... 8,9,10
Table 6 Share (%) of Synthetic Rubber in Rubber Consumption ... 11,12,13
NATURAL RUBBER
Table 7 Production of Natural Rubber (including production by type) ... 14,15,16
Table 8 Consumption of Natural Rubber ... 17,18,19
Table 9 Gross Exports of Natural Rubber ... 20
Table 10 Gross Imports of Natural Rubber ... 21,22,23
Table 11 Gross Exports of Technically Specified Rubber & Sheet Rubber by Grade ... 24
Table 12 Gross Exports of Natural Rubber by Major Producing Countries by Major Destinations ... 25,26
Table 13 Gross Imports of Natural Rubber by Major Consuming Countries by Major Origin ... 27,28
Table 14 Consumption of Natural Rubber Latex ... 29
Table 15 Gross Exports of Natural Rubber Latex ... 30
Table 16 Gross Imports of Natural Rubber Latex ... 31,32,33
SYNTHETIC RUBBER
Table 17 Production of Synthetic Rubber ... 34,35
Table 18 Consumption of Synthetic Rubber ... 36,37,38
Table 19 Gross Exports of Synthetic Rubber ... 39,40
Table 20 Gross Imports of Synthetic Rubber ... 41,42,43
Table 21 Total Imports of Synthetic Rubber by Types ... 44
Total Exports of Synthetic Rubber by Types ... 45
Exports of Styrene-Butadiene Rubber (SBR) ... 46
Exports of Poly-Butadiene Rubber (BR) ... 47
Exports of Butyl Rubber ... 48
Exports of Chloroprene Rubber (CR) & Acrylonitrile-Butadiene Rubber (NBR) ... 49
Exports of Poly-Isoprene Rubber (IR) & Ethylene-Propylene-NonConjugated Diene Rubber (EPDM) ... 50
Table 22 Gross Imports of Solid Forms of Synthetic Rubber - Selected Countries ... 51
Table 23 Gross Exports of Synthetic Rubber Latex - Selected Countries ... 52
Table 24 Gross Imports of Synthetic Rubber Latex - Selected Countries ... 53
PRICES
Table 25 Natural Rubber Market Prices (Physical and Futures) ... 54,55
Table 26 Synthetic Rubber, Monomer and Oil Prices ... 56
Table 27 Values of Synthetic Rubber in International Trade in Selected Countries ... 57,58,59
OTHER STATISTICS
Table 28 Area Under Plantation Rubber ... 60
Table 29 Reported Replanting and New Planting, Selected Countries ... 60
Table 30 Worldwide Synthetic Rubber Capacity ... 61
List of IRSG Member Governments and Members of the Panel of Associates
International Rubber Study Group, 51 Changi Business Park Central 2, #06-04/05, The Signature Singapore 486066.
Tel:+65 6588 0463 E-mail: [email protected] Web: http://www.rubberstudy.com Fax: +65 6588 0468
For enquiries concerning the content of the Rubber Statistical Bulletin, please contact the Economics and Statistics Team at the IRSG Secretariat:
Dr Lekshmi Nair and Mr Guo Jianfeng.
© Copyright. The International Rubber Study Group. All rights reserved. No part of this publication
may be reprinted or reproduced, stored in a retrieval system or transmitted in any form or by any means,
electronic, photocopy, recording or otherwise without the prior written permission of the publisher. ISSN 0035-9548

Table 1 Page 2
Excess(+)
Estates Smallholdings Total Total or
Year Production Production Production Consumption Deficit(-) Exports Imports
(a) (b)
2011
2012
2013
2014
2015
2016 Jan.
Feb.
Mar.
Apr.
May.
Jun.
Jul.
Aug.
Sep.
Oct.
Nov.
Dec.
Year
% change on previous year
2017 Jan.
Feb.
Mar.
Apr.
May.
Jun.
Jul.
Aug.
Sep.
Oct.
Nov.
Dec.
YTD
% change on previous year
N.B. - As most figures are partly estimated none are in italics.
(a) Exports of only the producing countries; data include adjustment for NR share in compound rubber and mixture rubber in export to China; exclude border trade discrepancies
(b) Gross Imports of all the countries; data include adjustment for NR share in compound rubber and mixture rubber in China import; exclude border trade discrepancies
SUMMARY OF WORLD NATURAL RUBBER SITUATION
© International Rubber Study Group
Table 2 Page 3
Excess(+)
or
Year Production Consumption Deficit(-) Exports Imports
(a) (b)
2011
2012
2013
2014
2015
2016 Jan.
Feb.
Mar.
Apr.
May.
Jun.
Jul.
Aug.
Sep.
Oct.
Nov.
Dec.
Year
% change on previous year
2017 Jan.
Feb.
Mar.
Apr.
May.
Jun.
Jul.
Aug.
Sep.
Oct.
Nov.
Dec.
YTD
% change on previous year
N.B. - As most figures are partly estimated none are in italics.
(a) Exports of only the producing countries.
(b) Gross Imports of all the countries
SUMMARY OF WORLD SYNTHETIC RUBBER SITUATION
© International Rubber Study Group

Page 4
© International Rubber Study Group
Figure 1: Natural Rubber Production, Consumption and Stocks
0
2
4
6
8
10
12
14
2008 2009 2010 2011 2012 2013 2014 2015 2016
millio
n
ton
nes
NR Production NR Consumption
NR Total Stocks
Figure 2: Synthetic Rubber Production, Consumption and Stocks
0
2
4
6
8
10
12
14
16
18
2008 2009 2010 2011 2012 2013 2014 2015 2016
millio
n
ton
nes
SR Production SR Consumption
SR Total Stocks
Page 5
© International Rubber Study Group
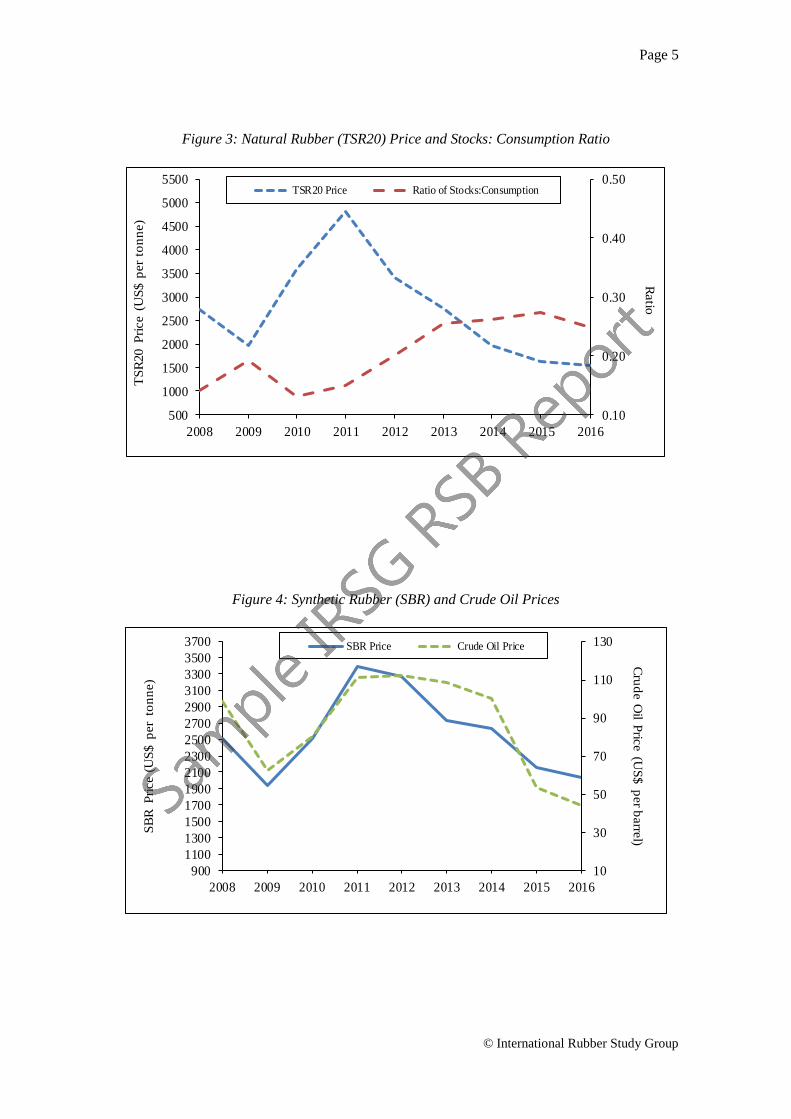
Figure 3: Natural Rubber (TSR20) Price and Stocks: Consumption Ratio
0.10
0.20
0.30
0.40
0.50
500
1000
1500
2000
2500
3000
3500
4000
4500
5000
5500
2008 2009 2010 2011 2012 2013 2014 2015 2016
Ratio
TS
R20 P
rice (
US
$ p
er
ton
ne)
TSR20 Price Ratio of Stocks:Consumption
Figure 4: Synthetic Rubber (SBR) and Crude Oil Prices
10
30
50
70
90
110
130
900
1100
1300
1500
1700
1900
2100
2300
2500
2700
2900
3100
3300
3500
3700
2008 2009 2010 2011 2012 2013 2014 2015 2016
Cru
de O
il Pric
e (U
S$ p
er b
arre
l)S
BR
P
rice (
US
$ p
er
to
nn
e)
SBR Price Crude Oil Price

Table 3 Page 6
China India Japan Malaysia Thailand India Japan
Year (a)
2011
2012
2013
2014
2015
2016 Jan.
Feb.
Mar.
Apr.
May.
Jun.
Jul.
Aug.
Sep.
Oct.
Nov.
Dec.
YTD
% change on previous year
2017 Jan.
Feb.
Mar.
Apr.
May.
Jun.
Jul.
Aug.
Sep.
Oct.
Nov.
Dec.
YTD
% change on previous year
(a) China NR stocks numbers include only reported Shanghai Futures Stocks
REPORTED STOCKS OF NATURAL AND SYNTHETIC RUBBER
Natural Rubber Synthetic rubber
© International Rubber Study Group

Table 4 Page 7
Brent Butadiene Styrene Futures SGX
Crude Oil USA USA USA Germany (a) Japan Bangkok STR20 KL SMR20 Indonesia SIR20 SGX TSR20 TSR20 as %
Year US$/barrel cents/lb cents/lb $/tonne $/tonne $/tonne $/tonne $/tonne $/tonne $/tonne of USA SBR
export unit value
2011
2012
2013
2014
2015
2016 Jan.
Feb.
Mar.
Apr.
May.
Jun.
Jul.
Aug.
Sep.
Oct.
Nov.
Dec.
Year
% change on previous year
2017 Jan.
Feb.
Mar.
Apr.
May.
Jun.
Jul.
Aug.
Sep.
Oct.
Nov.
Dec.
YTD
% change on previous year
(a) Apr 2017 price is based on Extra trade only
SBR Physical
SUMMARY OF RUBBER PRICES AND RELATED MATERIALS
Monomers Synthetic Rubber Natural Rubber
© International Rubber Study Group

Table 5 Page 8
Asia-Pacific
Other
Hong Kong, Rep. of Taiwan, Asia-
Year Australia Bangladesh China China India Indonesia Japan Korea Malaysia Pakistan Philippines Singapore Sri Lanka China Thailand Vietnam Pacific
2011
2012
2013
2014
2015
2016 Jan.
Feb.
Mar.
Apr.
May.
Jun.
Jul.
Aug.
Sep.
Oct.
Nov.
Dec.
Year
% change on previous year
2017 Jan.
Feb.
Mar.
Apr.
May.
Jun.
Jul.
Aug.
Sep.
Oct.
Nov.
Dec.
YTD
% change on previous year
(a) Rules for statistical recording are to be found on the inside cover of this publication under "Notes on Statistical Tables".
CONSUMPTION OF NATURAL AND SYNTHETIC RUBBER (a)
© International Rubber Study Group
Table 5
Year
2011
2012
2013
2014
2015
2016 Jan.
Feb.
Mar.
Apr.
May.
Jun.
Jul.
Aug.
Sep.
Oct.
Nov.
Dec.
Year
% change on previous year
2017 Jan.
Feb.
Mar.
Apr.
May.
Jun.
Jul.
Aug.
Sep.
Oct.
Nov.
Dec.
YTD
% change on previous year
Page 9
EMEA (EU-28)
Belg- Czech- Nether- Other Total
Austria Lux Rep. Denmark Finland France Germany Greece Hungary Italy lands Poland Portugal Romania Slovakia Slovenia Spain Sweden U.K. EU-28 EU-28
CONSUMPTION OF NATURAL AND SYNTHETIC RUBBER (cont'd)
© International Rubber Study Group
Table 5
Year
2011
2012
2013
2014
2015
2016 Jan.
Feb.
Mar.
Apr.
May.
Jun.
Jul.
Aug.
Sep.
Oct.
Nov.
Dec.
Year
% change on previous year
2017 Jan.
Feb.
Mar.
Apr.
May.
Jun.
Jul.
Aug.
Sep.
Oct.
Nov.
Dec.
YTD
% change on previous year
Page 10
EMEA (ex EU-28) Americas
WORLD
Russ'n South Switz- Other Other GRAND
Belarus Egypt Iran Israel Nigeria Fed. Serbia Africa erland Turkey Ukraine EMEA Argentina Brazil Canada Chile Colombia Mexico Peru U.S.A. Venezuela Americas TOTAL
(ex EU-28)
CONSUMPTION OF NATURAL AND SYNTHETIC RUBBER (cont'd)
© International Rubber Study Group

Table 6 Page 11
Asia-Pacific
Other
Hong Kong, Rep. of Taiwan, Asia-
Year Australia Bangladesh China China India Indonesia Japan Korea Malaysia Pakistan Philippines Singapore Sri Lanka China Thailand Vietnam Pacific
2011
2012
2013
2014
2015
2016 Jan.
Feb.
Mar.
Apr.
May.
Jun.
Jul.
Aug.
Sep.
Oct.
Nov.
Dec.
Year
2017 Jan.
Feb.
Mar.
Apr.
May.
Jun.
Jul.
Aug.
Sep.
Oct.
Nov.
Dec.
Year
SHARE (%) OF SYNTHETIC RUBBER IN RUBBER CONSUMPTION
© International Rubber Study Group
Table 6
Year
2011
2012
2013
2014
2015
2016 Jan.
Feb.
Mar.
Apr.
May.
Jun.
Jul.
Aug.
Sep.
Oct.
Nov.
Dec.
Year
2017 Jan.
Feb.
Mar.
Apr.
May.
Jun.
Jul.
Aug.
Sep.
Oct.
Nov.
Dec.
Year
Page 12
EMEA (EU-28)
Belg- Czech- Nether- Other Total
Austria Lux Rep. Denmark Finland France Germany Greece Hungary Italy lands Poland Portugal Romania Slovakia Slovenia Spain Sweden U.K. EU-28 EU-28
SHARE (%) OF SYNTHETIC RUBBER IN RUBBER CONSUMPTION (cont'd)
© International Rubber Study Group

Table 6
Year
2011
2012
2013
2014
2015
2016 Jan.
Feb.
Mar.
Apr.
May.
Jun.
Jul.
Aug.
Sep.
Oct.
Nov.
Dec.
Year
2017 Jan.
Feb.
Mar.
Apr.
May.
Jun.
Jul.
Aug.
Sep.
Oct.
Nov.
Dec.
Year
Page 13
EMEA (ex EU-28) Americas
WORLD
Russ'n South Switz- Other Other GRAND
Belarus Egypt Iran Israel Nigeria Fed. Serbia Africa erland Turkey Ukraine EMEA Argentina Brazil Canada Chile Colombia Mexico Peru U.S.A. Venezuela Americas TOTAL
(ex EU-28)
SHARE (%) OF SYNTHETIC RUBBER IN RUBBER CONSUMPTION (cont'd)
© International Rubber Study Group
Table 7 Page 14
Asia-Pacific
Bangla Indonesia Indonesia Total Malaysia Malaysia Total Papua Philip Sri
Year -desh Cambodia China India Estates Smallholders Indonesia Laos Estates Smallh. Malaysia Myanmar New Guinea -pines Lanka Thailand Vietnam
2011
2012
2013
2014
2015
2016 Jan.
Feb.
Mar.
Apr.
May.
Jun.
Jul.
Aug.
Sep.
Oct.
Nov.
Dec.
Year
% change on previous year
2017 Jan.
Feb.
Mar.
Apr.
May.
Jun.
Jul.
Aug.
Sep.
Oct.
Nov.
Dec.
YTD
% change on previous year
PRODUCTION OF NATURAL RUBBER
© International Rubber Study Group

Table 7
Year
2011
2012
2013
2014
2015
2016 Jan.
Feb.
Mar.
Apr.
May.
Jun.
Jul.
Aug.
Sep.
Oct.
Nov.
Dec.
Year
% change on previous year
2017 Jan.
Feb.
Mar.
Apr.
May.
Jun.
Jul.
Aug.
Sep.
Oct.
Nov.
Dec.
YTD
% change on previous year
PRODUCTION OF NATURAL RUBBER Page 15
EMEA Americas WORLD
Côte Other Other
Cameroon d'Ivoire DR Congo Gabon Ghana Guinea Liberia Nigeria EMEA Bolivia Brazil Colombia Guatemala Mexico Americas TOTAL
PRODUCTION OF NATURAL RUBBER (cont'd)
© International Rubber Study Group

Table 7
Year
2011
2012
2013
2014
2015
2016 Jan.
Feb.
Mar.
Apr.
May.
Jun.
Jul.
Aug.
Sep.
Oct.
Nov.
Dec.
Year
% change on previous year
2017 Jan.
Feb.
Mar.
Apr.
May.
Jun.
Jul.
Aug.
Sep.
Oct.
Nov.
Dec.
YTD
% change on previous year
PRODUCTION OF NATURAL RUBBER Page 16
Sri Guate Sri Côte d' Guate
China India Malaysia Lanka Thailand Brazil -mala India Lanka Thailand Cameroon Ivoire India Thailand -mala
PRODUCTION OF NATURAL RUBBER BY TYPE IN SELECTED COUNTRIES
TECHNICALLY SPECIFIED RUBBER RIBBED SMOKED SHEET LATEX
© International Rubber Study Group

Table 8 Page 17
Asia-Pacific
Other
Rep. of Taiwan, Asia-
Year Australia Bangladesh China India Indonesia Japan Korea Malaysia Pakistan Philippines Sri Lanka China Thailand Vietnam Pacific
2011
2012
2013
2014
2015
2016 Jan.
Feb.
Mar.
Apr.
May.
Jun.
Jul.
Aug.
Sep.
Oct.
Nov.
Dec.
Year
% change on previous year
2017 Jan.
Feb.
Mar.
Apr.
May.
Jun.
Jul.
Aug.
Sep.
Oct.
Nov.
Dec.
YTD
% change on previous year
CONSUMPTION OF NATURAL RUBBER
© International Rubber Study Group

Table 8
Year
2011
2012
2013
2014
2015
2016 Jan.
Feb.
Mar.
Apr.
May.
Jun.
Jul.
Aug.
Sep.
Oct.
Nov.
Dec.
Year
% change on previous year
2017 Jan.
Feb.
Mar.
Apr.
May.
Jun.
Jul.
Aug.
Sep.
Oct.
Nov.
Dec.
YTD
% change on previous year
Page 18
EMEA (EU-28)
Belg- Czech- Nether- Other Total
Austria Lux Rep. Finland France Germany Hungary Italy lands Poland Portugal Romania Slovakia Slovenia Spain Sweden U.K. EU-28 EU-28
CONSUMPTION OF NATURAL RUBBER (cont'd)
© International Rubber Study Group
Table 8
Year
2011
2012
2013
2014
2015
2016 Jan.
Feb.
Mar.
Apr.
May.
Jun.
Jul.
Aug.
Sep.
Oct.
Nov.
Dec.
Year
% change on previous year
2017 Jan.
Feb.
Mar.
Apr.
May.
Jun.
Jul.
Aug.
Sep.
Oct.
Nov.
Dec.
YTD
% change on previous year
Page 19
EMEA (ex EU-28) Americas
Other WORLD
Russ'n South EMEA Other GRAND
Belarus Egypt Iran Israel Nigeria Fed. Serbia Africa Turkey (ex EU-28) Argentina Brazil Canada Chile Colombia Guatemala Mexico Peru U.S.A. Venezuela Americas TOTAL
CONSUMPTION OF NATURAL RUBBER (cont'd)
© International Rubber Study Group

Table 9 Page 20
Asia-Pacific EMEA Americas
Papua Sri Côte d' DR Other
Year Bangladesh Cambodia China India Indonesia Laos Malaysia Myanmar New Guinea Philippines Lanka Thailand Vietnam Cameroon Ivoire Congo Gabon Ghana Guinea Liberia Nigeria EMEA Guatemala
2011
2012
2013
2014
2015
2016 Jan.
Feb.
Mar.
Apr.
May.
Jun.
Jul.
Aug.
Sep.
Oct.
Nov.
Dec.
Year
% change on previous year
2017 Jan.
Feb.
Mar.
Apr.
May.
Jun.
Jul.
Aug.
Sep.
Oct.
Nov.
Dec.
YTD
% change on previous year
GROSS EXPORTS OF NATURAL RUBBER
© International Rubber Study Group

Table 10 Page 21
Asia-Pacific
Other
Rep. of Taiwan, Asia-
Year Australia China India Indonesia Japan Korea Malaysia Pakistan Singapore China Vietnam Pacific
2011
2012
2013
2014
2015
2016 Jan.
Feb.
Mar.
Apr.
May.
Jun.
Jul.
Aug.
Sep.
Oct.
Nov.
Dec.
Year
% change on previous year
2017 Jan.
Feb.
Mar.
Apr.
May.
Jun.
Jul.
Aug.
Sep.
Oct.
Nov.
Dec.
YTD
% change on previous year
GROSS IMPORTS OF NATURAL RUBBER
© International Rubber Study Group
Table 10
Year
2011
2012
2013
2014
2015
2016 Jan.
Feb.
Mar.
Apr.
May.
Jun.
Jul.
Aug.
Sep.
Oct.
Nov.
Dec.
Year
% change on previous year
2017 Jan.
Feb.
Mar.
Apr.
May.
Jun.
Jul.
Aug.
Sep.
Oct.
Nov.
Dec.
YTD
% change on previous year
Page 22
EMEA (EU-28)
Belgium/ Czech Nether- Other Total
Austria Luxembourg Rep. Finland France Germany Hungary Italy lands Poland Portugal Romania Slovakia Slovenia Spain Sweden U.K. EU-28 EU-28
GROSS IMPORTS OF NATURAL RUBBER (cont'd)
© International Rubber Study Group
Table 10
Year
2011
2012
2013
2014
2015
2016 Jan.
Feb.
Mar.
Apr.
May.
Jun.
Jul.
Aug.
Sep.
Oct.
Nov.
Dec.
Year
% change on previous year
2017 Jan.
Feb.
Mar.
Apr.
May.
Jun.
Jul.
Aug.
Sep.
Oct.
Nov.
Dec.
YTD
% change on previous year
Page 23
EMEA (ex EU-28) Americas
Other WORLD
Russ'n South EMEA Other GRAND
Belarus Egypt Iran Israel Fed. Serbia Africa Turkey (ex EU-28) Argentina Brazil Canada Chile Colombia Mexico Peru U.S.A. Venezuela Americas TOTAL
GROSS IMPORTS OF NATURAL RUBBER (cont'd)
© International Rubber Study Group
Table 11 Page 24
INDONESIA INDONESIA
Year (a) 10 20 GP CV TOTAL 5/5L/XL 10 20 CV TOTAL RSS1/1X RSS 2 RSS 3 RSS 4 RSS 5 TOTAL
(b) (b) (c)
2011
2012
2013
2014
2015
2016 Jan.
Feb.
Mar.
Apr.
May.
Jun.
Jul.
Aug.
Sep.
Oct.
Nov.
Dec.
Year
% change on same period
in previous year
2017 Jan.
Feb.
Mar.
Apr.
May.
Jun.
Jul.
Aug.
Sep.
Oct.
Nov.
Dec.
YTD
% change on same period
in previous year
N.B.- Totals may include other grades.
(a) - 3CV, 3L and 3WF. (c) - Includes unspecified block.
(b) - Includes CV grades.
GROSS EXPORTS OF TECHNICALLY SPECIFIED RUBBER & SHEET RUBBER BY GRADE
SHEET RUBBER
THAILANDMALAYSIA THAILAND
TECHNICALLY SPECIFIED RUBBER
© International Rubber Study Group
Table 12 Page 25
From Thailand to: From Indonesia to:
China Japan Rep. of Korea Malaysia EU USA China Japan Rep. of Korea Singapore Germany USA
Year
2011
2012
2013
2014
2015
2016 Jan.
Feb.
Mar.
Apr.
May.
Jun.
Jul.
Aug.
Sep.
Oct.
Nov.
Dec.
Year
% change on previous year
2017 Jan.
Feb.
Mar.
Apr.
May.
Jun.
Jul.
Aug.
Sep.
Oct.
Nov.
Dec.
YTD
% change on previous year
N.B. - Exports to Singapore are largely transshipped to other destinations.
Exports to China include NR share in compound rubber.
From July 2015 onwards exports to China include NR share in mixture rubber
GROSS EXPORTS OF NATURAL RUBBER BY MAJOR PRODUCING COUNTRIES BY MAJOR DESTINATIONS
© International Rubber Study Group

Table 12
Year
2011
2012
2013
2014
2015
2016 Jan.
Feb.
Mar.
Apr.
May.
Jun.
Jul.
Aug.
Sep.
Oct.
Nov.
Dec.
Year
% change on previous year
2017 Jan.
Feb.
Mar.
Apr.
May.
Jun.
Jul.
Aug.
Sep.
Oct.
Nov.
Dec.
YTD
% change on previous year
GROSS EXPORTS OF NATURAL RUBBER BY MAJOR PRODUCING COUNTRIES BY MAJOR DESTINATIONS Page 26
From Malaysia to: From Vietnam to:
China Rep. of Korea France Germany Brazil USA China Rep. of Korea Malaysia Taiwan, EU USA
China
GROSS EXPORTS OF NATURAL RUBBER BY MAJOR PRODUCING COUNTRIES BY MAJOR DESTINATIONS (cont'd)
© International Rubber Study Group

Table 13 Page 27
To China (a) from: To Japan from: To Rep. of Korea from:
Thailand Malaysia Indonesia Vietnam Thailand Indonesia Malaysia Vietnam Thailand Indonesia Malaysia Vietnam
Year
2011
2012
2013
2014
2015
2016 Jan.
Feb.
Mar.
Apr.
May.
Jun.
Jul.
Aug.
Sep.
Oct.
Nov.
Dec.
Year
% change on previous year
2017 Jan.
Feb.
Mar.
Apr.
May.
Jun.
Jul.
Aug.
Sep.
Oct.
Nov.
Dec.
YTD
% change on previous year
(a) China imports include NR share in compound rubber; 2015 July onwards China imprts include NR share in mixture rubber.
GROSS IMPORTS OF NATURAL RUBBER BY MAJOR CONSUMING COUNTRIES BY MAJOR ORIGIN
© International Rubber Study Group
Table 13
Year
2011
2012
2013
2014
2015
2016 Jan.
Feb.
Mar.
Apr.
May.
Jun.
Jul.
Aug.
Sep.
Oct.
Nov.
Dec.
Year
% change on previous year
2017 Jan.
Feb.
Mar.
Apr.
May.
Jun.
Jul.
Aug.
Sep.
Oct.
Nov.
Dec.
YTD
% change on previous year
Page 28
To France from: To Germany from: To USA from:
Indonesia Thailand Malaysia Côte d'Ivoire Malaysia Indonesia Thailand Vietnam Indonesia Thailand Malaysia Liberia
GROSS IMPORTS OF NATURAL RUBBER BY MAJOR CONSUMING COUNTRIES BY MAJOR ORIGIN (cont'd)
© International Rubber Study Group

Table 14 Page 29
Asia-Pacific EMEA (EU-28) EMEA (ex EU-28) Americas
Other WORLD
Rep.of Taiwan, Other Other Total EMEA Other GRAND
Year China India Japan Korea Malaysia Sri Lanka China Thailand Indonesia Asia-Pacific France Germany Italy U.K. EU-28 EU-28 Turkey (ex EU-28) Brazil Canada Mexico U.S.A. Americas TOTAL
2011
2012
2013
2014
2015
2016 Jan.
Feb.
Mar.
Apr.
May.
Jun.
Jul
Aug
Sep
Oct.
Nov.
Dec.
Year
% change on previous year
2017 Jan.
Feb.
Mar.
Apr.
May.
Jun.
Jul
Aug
Sep
Oct.
Nov.
Dec.
YTD
% change on previous year
CONSUMPTION OF NATURAL RUBBER LATEX
© International Rubber Study Group

Table 15 Page 30
Year Indonesia Malaysia Thailand Guatemala
2011
2012
2013
2014
2015
2016 Jan.
Feb.
Mar.
Apr.
May.
Jun.
Jul.
Aug.
Sep.
Oct.
Nov.
Dec.
Year
% change on previous year
2017 Jan.
Feb.
Mar.
Apr.
May.
Jun.
Jul.
Aug.
Sep.
Oct.
Nov.
Dec.
YTD
% change on previous year
GROSS EXPORTS OF NATURAL RUBBER LATEX
© International Rubber Study Group

Table 16 Page 31
Asia-Pacific
Other
Year Rep. of Taiwan, Asia-
China Indonesia Japan Korea Malaysia Pakistan China Pacific
2011
2012
2013
2014
2015
2016 Jan.
Feb.
Mar.
Apr.
May.
Jun.
Jul.
Aug.
Sep.
Oct.
Nov.
Dec.
Year
% change on previous year
2017 Jan.
Feb.
Mar.
Apr.
May.
Jun.
Jul.
Aug.
Sep.
Oct.
Nov.
Dec.
YTD
% change on previous year
N.B. - NR latex flows recorded at d.r.c. basis in tonnes.
GROSS IMPORTS OF NATURAL RUBBER LATEX
© International Rubber Study Group
Table 16
Year
2011
2012
2013
2014
2015
2016 Jan.
Feb.
Mar.
Apr.
May.
Jun.
Jul.
Aug.
Sep.
Oct.
Nov.
Dec.
Year
% change on previous year
2017 Jan.
Feb.
Mar.
Apr.
May.
Jun.
Jul.
Aug.
Sep.
Oct.
Nov.
Dec.
YTD
% change on previous year
Page 32
EMEA (EU-28)
Belgium/ Nether- Other Total
Luxembourg France Germany Italy lands Poland Spain U.K. EU-28 EU-28
GROSS IMPORTS OF NATURAL RUBBER LATEX (cont'd)
© International Rubber Study Group

Table 16
Year
2011
2012
2013
2014
2015
2016 Jan.
Feb.
Mar.
Apr.
May.
Jun.
Jul.
Aug.
Sep.
Oct.
Nov.
Dec.
Year
% change on previous year
2017 Jan.
Feb.
Mar.
Apr.
May.
Jun.
Jul.
Aug.
Sep.
Oct.
Nov.
Dec.
YTD
% change on previous year
Page 33
EMEA (ex EU-28) Americas
Other WORLD
Russ'n EMEA Other GRAND
Fed. Turkey (ex EU-28) Brazil Canada Colombia Mexico U.S.A. Americas TOTAL
GROSS IMPORTS OF NATURAL RUBBER LATEX (cont'd)
© International Rubber Study Group

Table 17 Page 34
Asia-Pacific EMEA (EU-28)
Rep.of Taiwan, Czech Nether
Year China India Indonesia Japan Korea Malaysia Singapore (a) China Thailand Belgium Rep. France Germany Italy -lands
2011
2012
2013
2014
2015
2016 Jan.
Feb.
Mar.
Apr.
May.
Jun.
Jul.
Aug.
Sep.
Oct.
Nov.
Dec.
Year
% change on previous year
2017 Jan.
Feb.
Mar.
Apr.
May.
Jun.
Jul.
Aug.
Sep.
Oct.
Nov.
Dec.
YTD
% change on previous year
(a) Production is displayed only for the period it is a producer
PRODUCTION OF SYNTHETIC RUBBER
© International Rubber Study Group
Table 17
Year
2011
2012
2013
2014
2015
2016 Jan.
Feb.
Mar.
Apr.
May.
Jun.
Jul.
Aug.
Sep.
Oct.
Nov.
Dec.
Year
% change on previous year
2017 Jan.
Feb.
Mar.
Apr.
May.
Jun.
Jul.
Aug.
Sep.
Oct.
Nov.
Dec.
YTD
% change on previous year
PRODUCTION OF SYNTHETIC RUBBER Page 35
EMEA (ex EU-28) Americas
WORLD
Other Total Russian South GRAND
Poland Romania (a) Spain U.K. EU-28 EU-28 Iran Fed. Serbia Africa Argentina Brazil Canada Mexico U.S.A. TOTAL
(a) Production is displayed only for the period it is a producer
PRODUCTION OF SYNTHETIC RUBBER (cont'd)
© International Rubber Study Group
Table 18 Page 36
Asia-Pacific EMEA (EU-28)
Other
Hong Rep. of Taiwan, Asia Belgium/ Czech
Year Australia China Kong, India Indonesia Japan Korea Malaysia Pakistan Philippines Singapore Sri Lanka China Thailand Vietnam -Pacific Austria Luxembourg Rep. Denmark
China
2011
2012
2013
2014
2015
2016 Jan.
Feb.
Mar.
Apr.
May.
Jun.
Jul.
Aug.
Sep.
Oct.
Nov.
Dec.
Year
% change on previous year
2017 Jan.
Feb.
Mar.
Apr.
May.
Jun.
Jul.
Aug.
Sep.
Oct.
Nov.
Dec.
YTD
% change on previous year
CONSUMPTION OF SYNTHETIC RUBBER
© International Rubber Study Group

Table 18
Year
2011
2012
2013
2014
2015
2016 Jan.
Feb.
Mar.
Apr.
May.
Jun.
Jul.
Aug.
Sep.
Oct.
Nov.
Dec.
Year
% change on previous year
2017 Jan.
Feb.
Mar.
Apr.
May.
Jun.
Jul.
Aug.
Sep.
Oct.
Nov.
Dec.
YTD
% change on previous year
Page 37
EMEA (ex EU-28)
Rep. of Nether- Other Total
Finland France Germany Greece Hungary Ireland Italy lands Poland Portugal Romania Slovakia Slovenia Spain Sweden U.K. EU-28 EU-28 Belarus Egypt
CONSUMPTION OF SYNTHETIC RUBBER (cont'd)
© International Rubber Study Group
Table 18
Year
2011
2012
2013
2014
2015
2016 Jan.
Feb.
Mar.
Apr.
May.
Jun.
Jul.
Aug.
Sep.
Oct.
Nov.
Dec.
Year
% change on previous year
2017 Jan.
Feb.
Mar.
Apr.
May.
Jun.
Jul.
Aug.
Sep.
Oct.
Nov.
Dec.
YTD
% change on previous year
Page 38
Americas
WORLD
Russ'n South Switz- Other Other GRAND
Iran Israel Fed. Serbia Africa erland Turkey Ukraine EMEA Argentina Brazil Canada Chile Colombia Mexico Peru U.S.A. Venezuela Americas TOTAL
(ex EU-28)
CONSUMPTION OF SYNTHETIC RUBBER (cont'd)
© International Rubber Study Group
Table 19 Page 39
Asia-Pacific EMEA (EU-28)
Rep.of Taiwan, Belgium- Czech
Year China Indonesia Japan Korea Malaysia Singapore (a) China Thailand Luxem. Rep. France Germany Italy Netherlands Poland Romania (a)
2011
2012
2013
2014
2015
2016 Jan.
Feb.
Mar.
Apr.
May.
Jun.
Jul.
Aug.
Sep.
Oct.
Nov.
Dec.
Year
% change on previous year
2017 Jan.
Feb.
Mar.
Apr.
May.
Jun.
Jul.
Aug.
Sep.
Oct.
Nov.
Dec.
YTD
% change on previous year
(a) Exports are only included, if country is a synthetic rubber producer and only for period it is a producer
EXPORTS OF SYNTHETIC RUBBER
© International Rubber Study Group
Table 19
Year
2011
2012
2013
2014
2015
2016 Jan.
Feb.
Mar.
Apr.
May.
Jun.
Jul.
Aug.
Sep.
Oct.
Nov.
Dec.
Year
% change on previous year
2017 Jan.
Feb.
Mar.
Apr.
May.
Jun.
Jul.
Aug.
Sep.
Oct.
Nov.
Dec.
YTD
% change on previous year
Page 40
EMEA (ex. EU-28) Americas
WORLD
Other Russian South GRAND
Spain U.K. EU-28 EU-28 Iran Fed. Serbia Africa Argentina Brazil Canada Mexico U.S.A. TOTAL
EXPORTS OF SYNTHETIC RUBBER (cont'd)
© International Rubber Study Group

Table 20 Page 41
Asia-Pacific EMEA (EU-28)
Hong Rep.of Sri Taiwan, Other Czech
Year Australia China Kong, India Indonesia Japan Korea Malaysia Pakistan Philippines Singapore Lanka China Thailand Vietnam Asia- Austria Belg-Lux Bulgaria Rep.
China Pacific
2011
2012
2013
2014
2015
2016 Jan.
Feb.
Mar.
Apr.
May.
Jun.
Jul.
Aug.
Sep.
Oct.
Nov.
Dec.
Year
% change on previous year
2017 Jan.
Feb.
Mar.
Apr.
May.
Jun.
Jul.
Aug.
Sep.
Oct.
Nov.
Dec.
YTD
% change on previous year
GROSS IMPORTS OF SYNTHETIC RUBBER
© International Rubber Study Group

Table 20
Year
2011
2012
2013
2014
2015
2016 Jan.
Feb.
Mar.
Apr.
May.
Jun.
Jul.
Aug.
Sep.
Oct.
Nov.
Dec.
Year
% change on previous year
2017 Jan.
Feb.
Mar.
Apr.
May.
Jun.
Jul.
Aug.
Sep.
Oct.
Nov.
Dec.
YTD
% change on previous year
Page 42
Rep. of Other Total
Denmark Finland France Germany Greece Hungary Ireland Italy Netherlands Poland Portugal Romania Slovakia Slovenia Spain Sweden U.K. EU-28 EU-28
GROSS IMPORTS OF SYNTHETIC RUBBER (cont'd)
© International Rubber Study Group

Table 20
Year
2011
2012
2013
2014
2015
2016 Jan.
Feb.
Mar.
Apr.
May.
Jun.
Jul.
Aug.
Sep.
Oct.
Nov.
Dec.
Year
% change on previous year
2017 Jan.
Feb.
Mar.
Apr.
May.
Jun.
Jul.
Aug.
Sep.
Oct.
Nov.
Dec.
YTD
% change on previous year
Page 43
EMEA (ex. EU-28) Americas
WORLD
Russian South Other Other GRAND
Belarus Egypt Iran Israel Norway Fed. Serbia Africa Switzerland Turkey Ukraine EMEA Argentina Brazil Canada Chile Colombia Mexico Peru U.S.A. Venezuela Americas TOTAL
(ex. EU-28)
GROSS IMPORTS OF SYNTHETIC RUBBER (cont'd)
© International Rubber Study Group

Table 21 Page 44
400211 400219 400220 400231 400239 400241 400249 400251 400259 400260 400270 400280 400291 400299 400510
SBR Latex SBR BR Iso-Butyl Halo-Butyl CR Latex CR NBR Latex NBR IR EPDM Mixture Other Latex Other Solid Compound
2011
2012
2013
2014
2015
2016 Jan
Feb
Mar
Apr
May
Jun
Jul
Aug
Sep
Oct
Nov
Dec
Year
% change on previous year
2017 Jan
Feb
Mar
Apr
May
Jun
Jul
Aug
Sep
Oct
Nov
Dec
YTD
% change on previous year
(a) Contact the Secretariat for information on the countries included
TOTAL IMPORTS OF SYNTHETIC RUBBER BY TYPES (a)
© International Rubber Study Group

Table 21 Page 45
400219 400220 400231 & 400239 400249 400251 400259 400260 400270
SBR BR Butyl CR NBR Latex NBR IR EPDM
2011
2012
2013
2014
2015
2016 Jan
Feb
Mar
Apr
May
Jun
Jul
Aug
Sep
Oct
Nov
Dec
Year
% change on previous year
2017 Jan
Feb
Mar
Apr
May
Jun
Jul
Aug
Sep
Oct
Nov
Dec
YTD
% change on previous year
(a) For list of countries included under each type, refer to individual export tables. Data are for producers only and for the period they are producers, and subject to data availability.
TOTAL EXPORTS OF SYNTHETIC RUBBER BY TYPES (a)
© International Rubber Study Group
Table 21 Page 46
Rep. of Taiwan, Czech South GRAND
China Indonesia India Japan Korea Singapore China Thailand Republic France Germany Italy Poland Romania UK EU-28 Russia Serbia Africa Iran Argentina Brazil Mexico USA WORLD
TOTAL
2011
2012
2013
2014
2015
2016 Jan
Feb
Mar
Apr
May
Jun
Jul
Aug
Sep
Oct
Nov
Dec
Year
% change on previous year
2017 Jan
Feb
Mar
Apr
May
Jun
Jul
Aug
Sep
Oct
Nov
Dec
YTD
% change on previous year
(a) Data are for producers only and for the period they are producers, and subject to availability
EXPORTS OF STYRENE - BUTADIENE RUBBER (SBR) (a)
© International Rubber Study Group
Table 21 Page 47
Rep. of Taiwan, Czech South GRAND
China Japan Korea Malaysia Singapore China Thailand Republic France Germany Poland UK EU-28 Iran Russia Africa Brazil USA WORLD
TOTAL (b)
2011
2012
2013
2014
2015
2016 Jan
Feb
Mar
Apr
May
Jun
Jul
Aug
Sep
Oct
Nov
Dec
Year
% change on previous year
2017 Jan
Feb
Mar
Apr
May
Jun
Jul
Aug
Sep
Oct
Nov
Dec
YTD
% change on previous year
(a) Data are for producers only and for the period they are producers, and subject to availability
(b) Global total includes India as well
EXPORTS OF POLY-BUTADIENE RUBBER (BR) (a)
© International Rubber Study Group

Table 21 Page 48
EXPORTS OF ISO-BUTYL RUBBER (IIR) (a) (b)
GRAND GRAND
China Japan Singapore Belgium Russia Canada WORLD China Japan Singapore Belgium France UK EU-28 Russia Canada USA WORLD
TOTAL TOTAL
2011
2012
2013
2014
2015
2016 Jan
Feb
Mar
Apr
May
Jun
Jul
Aug
Sep
Oct
Nov
Dec
Year
% change on previous year
2017 Jan
Feb
Mar
Apr
May
Jun
Jul
Aug
Sep
Oct
Nov
Dec
YTD
% change on previous year
(a) Data are for producers only and for the period they are producers, and subject to availability
(b) Global total includes UK as well
EXPORTS OF HALO-BUTYL RUBBER (IIR) (a)
EXPORTS OF BUTYL RUBBER
© International Rubber Study Group

Table 21 Page 49
GRAND Rep. of Taiwan, GRAND
China Japan Germany USA WORLD China Japan Korea China Germany UK EU-28 Russia Argentina Brazil Mexico USA WORLD
TOTAL TOTAL
2011
2012
2013
2014
2015
2016 Jan
Feb
Mar
Apr
May
Jun
Jul
Aug
Sep
Oct
Nov
Dec
Year
% change on previous year
2017 Jan
Feb
Mar
Apr
May
Jun
Jul
Aug
Sep
Oct
Nov
Dec
YTD
% change on previous year
(a) Data are for producers only and for the period they are producers, and subject to availability
(b) Global total includes India as well
EXPORTS OF ACRYLONITRILE-BUTADIENE RUBBER (NBR) (a)(b)EXPORTS OF CHLOROPRENE RUBBER (CR) (a)
© International Rubber Study Group
Table 21 Page 50
EXPORTS OF POLY-ISOPRENE RUBBER (IR) (a)
South GRAND Rep. of Nether- GRAND
China Japan Russia Africa USA WORLD China Japan Korea lands Russia Brazil USA WORLD
TOTAL TOTAL
2011
2012
2013
2014
2015
2016 Jan
Feb
Mar
Apr
May
Jun
Jul
Aug
Sep
Oct
Nov
Dec
Year
% change on previous year
2017 Jan
Feb
Mar
Apr
May
Jun
Jul
Aug
Sep
Oct
Nov
Dec
YTD
% change on previous year
(a) Data are for producers only and for the period they are producers, and subject to availability
EXPORTS OF ETHYLENE-PROPYLENE-NONCONJUGATED DIENE RUBBER (EPDM) (a)
© International Rubber Study Group

Table 22 Page 51
Asia-Pacific EMEA Americas
Rep. of Taiwan, Belgium/
China Indonesia Japan Korea China Luxembourg France Germany Italy Netherlands Poland Brazil Canada Mexico USA
Year
2011
2012
2013
2014
2015
2016 Jan.
Feb.
Mar.
Apr.
May.
Jun.
Jul.
Aug.
Sep.
Oct.
Nov.
Dec.
Year
% change on previous year
2017 Jan.
Feb.
Mar.
Apr.
May.
Jun.
Jul.
Aug.
Sep.
Oct.
Nov.
Dec.
YTD
% change on previous year
Solid forms of synthetic rubbers are as defined by the Harmonised System (HS) code at the 6-digit level
400219 - stryene butadiene rubber (SBR 400260 - Poly-isoprene rubber (IR)
400220 - Poly-butadiene rubber (BR) 400270 - Ethylene-propylene-nonconjugated diene rubber (EPDM)
400231 - Isobutene-isoprene (butyl) rubber (IIR) 400280 - Mixtures of natural rubber of 4-digit heading 4001 with synthetic-rubber of 4-digit heading 4002
400239 - Halo-butyl rubber (HIIR) 400299 - Other synthetic rubber
400249 - Chloroprene (chloro-butadiene) rubber (CR) 400510 - Compounded rubber, un-vulcanised, in primary forms, or in plates, sheets and strips, with carbon-black or silica
400259 - Acrylo-nitrile rubber (NBR)
GROSS IMPORTS OF SOLID FORMS OF SYNTHETIC RUBBER - SELECTED COUNTRIES
© International Rubber Study Group

Table 23 Page 52
Asia-Pacific EMEA Americas
Rep. of Taiwan, Belgium/ Nether-
Indonesia Japan Korea China Luxembourg Finland France Germany Italy lands Spain UK Brazil USA
2011
2012
2013
2014
2015
2016 Jan.
Feb.
Mar.
Apr.
May.
Jun.
Jul.
Aug.
Sep.
Oct.
Nov.
Dec.
Year
% change on previous year
2017 Jan.
Feb.
Mar.
Apr.
May.
Jun.
Jul.
Aug.
Sep.
Oct.
Nov.
Dec.
YTD
% change on previous year
N.B. - SR latex flows recorded at d.r.c. basis in tonnes.
Latex forms of synthetic rubbers are as defined by the Harmonised System (HS) code at the 6-digit level
400211 - Latex of styrene-butadiene rubber (SBR)/carboxylated Styrene -butadiene rubber (SBR)
400241 - Latex of chloroprene (chloro-butadiene) rubber (CR)
400251 - Latex of Acrylo-nitrile rubber (NBR)
400291 - Other latex of synthetic rubber
GROSS EXPORTS OF SYNTHETIC RUBBER LATEX - SELECTED COUNTRIES

Table 24 Page 53
Asia-Pacific EMEA Americas
Rep. of Taiwan, Belgium/
China Japan Korea China Luxembourg France Germany Italy Netherlands UK Russia Brazil Canada Mexico USA
Year
2011
2012
2013
2014
2015
2016 Jan.
Feb.
Mar.
Apr.
May.
Jun.
Jul.
Aug.
Sep.
Oct.
Nov.
Dec.
Year
% change on previous year
2017 Jan.
Feb.
Mar.
Apr.
May.
Jun.
Jul.
Aug.
Sep.
Oct.
Nov.
Dec.
YTD
% change on previous year
N.B. - SR latex flows recorded at d.r.c. basis in tonnes.
Latex forms of synthetic rubbers are as defined by the Harmonised System (HS) code at the 6-digit level
400211 - Latex of styrene-butadiene rubber (SBR)/carboxylated Styrene -butadiene rubber (SBR)
400241 - Latex of chloroprene (chloro-butadiene) rubber (CR)
400251 - Latex of Acrylo-nitrile rubber (NBR)
400291 - Other latex of synthetic rubber
GROSS IMPORTS OF SYNTHETIC RUBBER LATEX - SELECTED COUNTRIES
© International Rubber Study Group

Table 25 Page 54
SHFE SGX SGX TOCOM TOCOM Indonesia Thailand Thailand Thailand
RMB US $ US $ 000 Yen 000 Yen US $ 000 Baht 000 Baht 000 Baht
Year RSS3 RSS3 TSR20 RSS3 RSS3 SIR20 Conc latex RSS3 STR20
(b) (cif) (c) (c) (c)
2011
2012
2013
2014
2015
2016 Jan.
Feb.
Mar.
Apr.
May.
Jun.
Jul.
Aug.
Sep.
Oct.
Nov.
Dec.
Year
% change on previous year
2017 Jan.
Feb.
Mar.
Apr.
May.
Jun.
Jul.
Aug.
Sep.
Oct.
Nov.
Dec.
YTD
% change on previous year
(a) Notes: New York quotations refer to sellers' asking prices for delivery during the current month; those for Kuala Lumpur are buyers' midday prices f.o.b. in bales; all prices are to the tonne.
Rubber Trade Association of Europe (RTAE) prices are buyers' prices; TOCOM refers to Tokyo Commodities Exchange.
(b) Futures price of RSS3 at date of expiry.
(c) Bangkok prices are forward prices (1 month forward), fob.
PHYSICAL MARKET PRICES
NATURAL RUBBER PRICES (FUTURES AND PHYSICAL MARKETS)(a)
FUTURES MARKET SPOT PRICES
© International Rubber Study Group

Table 25
Year
2011
2012
2013
2014
2015
2016 Jan.
Feb.
Mar.
Apr.
May.
Jun.
Jul.
Aug.
Sep.
Oct.
Nov.
Dec.
Year
% change on previous year
2017 Jan.
Feb.
Mar.
Apr.
May.
Jun.
Jul.
Aug.
Sep.
Oct.
Nov.
Dec.
YTD
% change on previous year
Page 55
India India Malaysia Malaysia Malaysia Malaysia Europe (RTAE) New York New York SGX
000 Rupees 000 Rupees RM RM RM RM Euro US $ US $ TSR20 as %
RSS3 RSS4 SMR L SMR 10 SMR 20 Bulk latex TSR20 RSS 1 TSR 20 of USA SBR
(cif) (a) (cif) (cif) export unit value
NATURAL RUBBER MARKET PRICES (PHYSICAL AND FUTURES MARKETS)(a)
PHYSICAL MARKET PRICES
© International Rubber Study Group

Table 26 Page 56
Brent USA Europe (a) USA Europe USA Europe (a) N E Asia USA Europe (a) N E Asia
Crude Oil Butadiene Butadiene Styrene Styrene SBR 1502 SBR 1502 SBR 1502 BR BR BR
US$ per barrel US cents/lb Euro/tonne US cents/lb Euro/tonne 2000=100 2000=100 2000=100 2000=100 2000=100 2000=100
Year Contract Contract Contract Contract Contract Contract Spot Contract Contract Spot
2011
2012
2013
2014
2015
2016 Jan.
Feb.
Mar.
Apr.
May.
Jun.
Jul.
Aug.
Sep.
Oct.
Nov.
Dec.
Year
% change on previous year
2017 Jan.
Feb.
Mar.
Apr.
May.
Jun.
Jul.
Aug.
Sep.
Oct.
Nov.
Dec.
YTD
% change on previous year
CRUDE OIL AND MONOMER PRICES INDICES OF SR SPOT AND CONTRACT PRICES IN SELECTED REGIONS
SYNTHETIC RUBBER, MONOMER AND OIL PRICES
© International Rubber Study Group
Table 27 Page 57
EXPORTS
Rep. of Rep. of Rep. of
Korea Thailand Germany (b) Russia Mexico USA Indonesia Korea Germany (b) USA France Germany (a) UK Japan USA Poland (a) Korea Russia Brazil USA
2011
2012
2013
2014
2015
2016 Jan
Feb
Mar
Apr
May
Jun
Jul
Aug
Sep
Oct
Nov
Dec
YTD
% change on previous year
2017 Jan
Feb
Mar
Apr
May
Jun
Jul
Aug
Sep
Oct
Nov
Dec
YTD
% change on previous year
(a) all values in US$ per metric tonne
(b) March 2017 price based on Extra trade only
EXPORTS IMPORTS IMPORTS
VALUES OF SYNTHETIC RUBBER IN INTERNATIONAL TRADE IN SELECTED COUNTRIES (a)
EXPORT UNIT VALUES OF EXPORT UNIT VALUES OF EXPORT AND IMPORT UNIT VALUES OF EXPORT AND IMPORT UNIT VALUES OF
STYRENE-BUTADIENE RUBBER (SBR) STYRENE-BUTADIENE RUBBER LATEX (SBR L) SOLUTION STYRENE-BUTADIENE RUBBER (SSBR) EMLUSION STYRENE-BUTADIENE RUBBER (ESBR)

Table 27
2011
2012
2013
2014
2015
2016 Jan
Feb
Mar
Apr
May
Jun
Jul
Aug
Sep
Oct
Nov
Dec
YTD
% change on previous year
2017 Jan
Feb
Mar
Apr
May
Jun
Jul
Aug
Sep
Oct
Nov
Dec
YTD
% change on previous year
Page 58
Rep. of
Korea Thailand Germany (b) Russia USA Japan Singapore Belgium (a) Russia Canada Japan Singapore Belgium (a) Russia Canada USA Japan Germany (a) USA
(a) all values in US$ per metric tonne
(b) March 2017 price based on Extra trade only
VALUES OF SYNTHETIC RUBBER IN INTERNATIONAL TRADE IN SELECTED COUNTRIES (cont'd)
ISO-BUTYL RUBBER (IIR) HALO-BUTYL RUBBER (HIIR) CHLOROPRENE RUBBER (CR)
EXPORT UNIT VALUES OFEXPORT UNIT VALUES OF EXPORT UNIT VALUES OF EXPORT UNIT VALUES OF
POLY-BUTADIENE RUBBER (BR)

Table 27
2011
2012
2013
2014
2015
2016 Jan
Feb
Mar
Apr
May
Jun
Jul
Aug
Sep
Oct
Nov
Dec
YTD
% change on previous year
2017 Jan
Feb
Mar
Apr
May
Jun
Jul
Aug
Sep
Oct
Nov
Dec
YTD
% change on previous year
Page 59
EXPORT UNIT VALUES OF
ACRYLONITRILE-BUTADIENE RUBBER (NBR)
Rep. of Rep. of Taiwan, Rep. of
Japan Korea Russia Mexico USA Korea Malaysia China Thailand Japan Russia USA Japan Korea Netherlands (a) Brazil USA
(a) all values in US$ per metric tonne
(b) March 2017 price based on Extra trade only
ACRYLONITRILE-BUTADIENE RUBBER LATEX (NBR L)
EXPORT UNIT VALUES OF
ETHYLENE-PROPYLENE-NONCONJUGATED DIENE RUBBER (EPDM)
VALUES OF SYNTHETIC RUBBER IN INTERNATIONAL TRADE IN SELECTED COUNTRIES (cont'd)
POLY-ISOPRENE RUBBER (IR)
EXPORT UNIT VALUES OF EXPORT UNIT VALUES OF

Table 28 Page 60
Small- ReportedTotal Mature % sSare Estates Soldings % sSare Yields
Country Year Area Area Mature Area Area S/Soldings (Kg per Sa)
Cambodia 2016China 2016India 2016Indonesia 2016Malaysia (a) 2016Myanmar 2015Philippines 2016Sri Lanka 2016Thailand 2016Vietnam 2016Cameroon 2012Côte d'Ivoire 2016Gabon 2013Ghana 2015Nigeria 2011Brazil 2015Guatemala 2010Mexico 2010
Table 29
Replanting New planting Total area Replanting New planting Total area Replanting New planting Total area Replanting New planting Total areaYear
2010201120122013201420152016
Replanting New planting Total area Replanting New planting Total area Replanting New planting Total area Replanting New planting Total area
2010201120122013201420152016
(a) Mature area of Malaysia represents reported tapped area
(b) Source: ANRPC/IRSG Annual Survey
AREA UNDER PLANTATION RUBBER ('000 Hectares)
REPORTED REPLANTING AND NEW PLANTING, SELECTED COUNTRIES ('000 Hectares)(b)
Vietnam Malaysia
Cambodia India
Thailand Sri Lanka
China Indonesia
© International Rubber Study Group
Table 30 Page 61
Shares of each
country and
Solid Solid EPM/ SB block region of
Country and Area ESBR SSBR BR IR EPDM IIR NBR CR Copolymers TOTAL capacity
China
India
Indonesia
Japan
South Korea
Malaysia
Singapore
Taiwan, China
Thailand
TOTAL Asia-Pacific
Belgium
Czech Republic
France
Germany
Italy
Netherlands
Poland
Spain
UK
Iran
Saudi Arabia
Russia
Serbia
South Africa
TOTAL EMEA
Argentina
Brazil
Canada
Mexico
USA
TOTAL Americas
WORLD GRAND TOTAL
Shares of each elastomer
The above table is reprinted from data published by the International Institute of Synthetic Rubber Producers (IISRP) Inc., in 2016.
The complete report covering worldwide data on the synthetic rubber industry may be obtained from the IISRP Inc.,
- 3535 Briarpark Drive, Suite 250, Houston, Texas 77042, USA. www.iisrp.com
WORLDWIDE SYNTHETIC RUBBER CAPACITIES - 2016 ('000 metric tonnes)
REPORTED AND ESTIMATED CAPACITY BY TYPE AND COUNTRY
© International Rubber Study Group
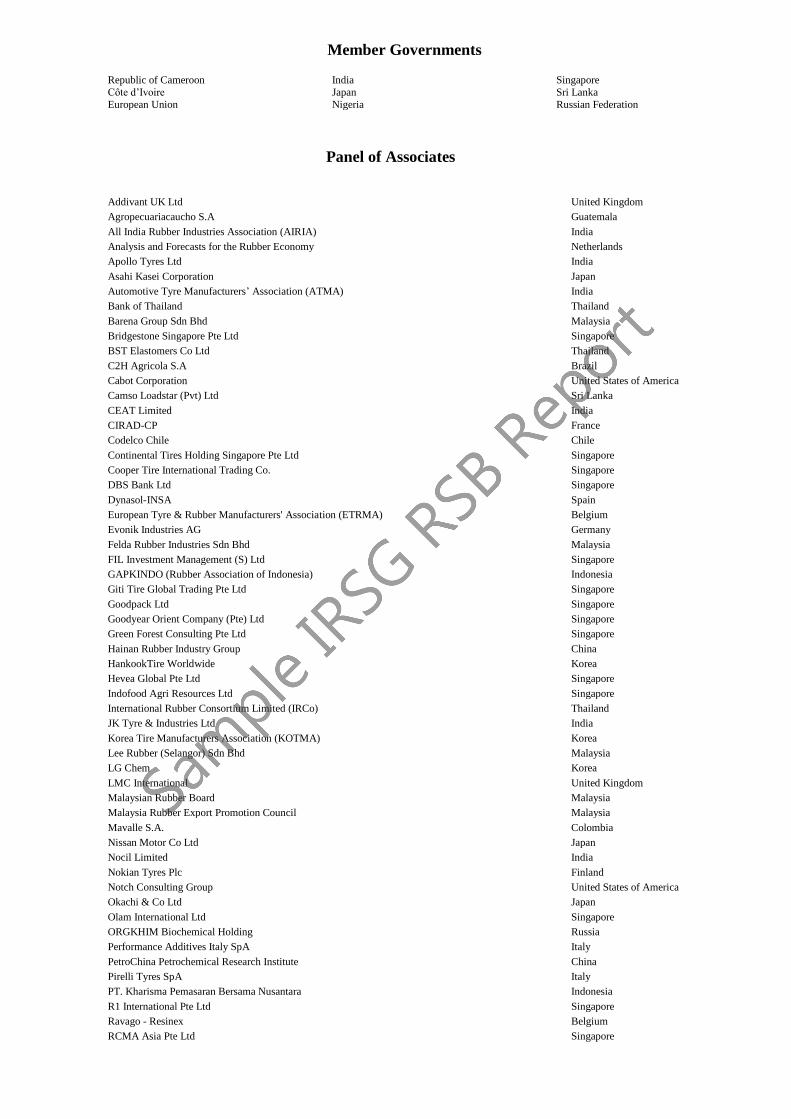
Member Governments Republic of Cameroon India Singapore
Côte d’Ivoire Japan Sri Lanka
European Union Nigeria Russian Federation
Panel of Associates
Addivant UK Ltd United Kingdom
Agropecuariacaucho S.A Guatemala
All India Rubber Industries Association (AIRIA) India
Analysis and Forecasts for the Rubber Economy Netherlands
Apollo Tyres Ltd India
Asahi Kasei Corporation Japan
Automotive Tyre Manufacturers’ Association (ATMA) India
Bank of Thailand Thailand
Barena Group Sdn Bhd Malaysia
Bridgestone Singapore Pte Ltd Singapore
BST Elastomers Co Ltd Thailand
C2H Agricola S.A Brazil
Cabot Corporation United States of America
Camso Loadstar (Pvt) Ltd Sri Lanka
CEAT Limited India
CIRAD-CP France
Codelco Chile Chile
Continental Tires Holding Singapore Pte Ltd Singapore
Cooper Tire International Trading Co. Singapore
DBS Bank Ltd Singapore
Dynasol-INSA Spain
European Tyre & Rubber Manufacturers' Association (ETRMA) Belgium
Evonik Industries AG Germany
Felda Rubber Industries Sdn Bhd Malaysia
FIL Investment Management (S) Ltd Singapore
GAPKINDO (Rubber Association of Indonesia) Indonesia
Giti Tire Global Trading Pte Ltd Singapore
Goodpack Ltd Singapore
Goodyear Orient Company (Pte) Ltd Singapore
Green Forest Consulting Pte Ltd Singapore
Hainan Rubber Industry Group China
HankookTire Worldwide Korea
Hevea Global Pte Ltd Singapore
Indofood Agri Resources Ltd Singapore
International Rubber Consortium Limited (IRCo) Thailand
JK Tyre & Industries Ltd India
Korea Tire Manufacturers Association (KOTMA) Korea
Lee Rubber (Selangor) Sdn Bhd Malaysia
LG Chem Korea
LMC International United Kingdom
Malaysian Rubber Board Malaysia
Malaysia Rubber Export Promotion Council Malaysia
Mavalle S.A. Colombia
Nissan Motor Co Ltd Japan
Nocil Limited India
Nokian Tyres Plc Finland
Notch Consulting Group United States of America
Okachi & Co Ltd Japan
Olam International Ltd Singapore
ORGKHIM Biochemical Holding Russia
Performance Additives Italy SpA Italy
PetroChina Petrochemical Research Institute China
Pirelli Tyres SpA Italy
PT. Kharisma Pemasaran Bersama Nusantara Indonesia
R1 International Pte Ltd Singapore
Ravago - Resinex Belgium
RCMA Asia Pte Ltd Singapore
RCP Technologies Sdn Bhd Malaysia
Regional Rubber Trading Co. Pte Ltd. Singapore
Reliance Industries Limited India
RubberNet (Asia) Pte Ltd Singapore
Schill & Seilacher “Struktol” AG Germany
Semperit Industrial Products (S) Pte Ltd Singapore
Shanghai Tower Commodities Co. Ltd China
Siam Commercial Bank Thailand
SIAT SA Belgium
Sibur LLC Russia
Sime Darby Plantation Sdn Bhd Malaysia
Singapore Exchange (SGX) Singapore
SIPEF NV/SA Belgium
Société des Matières Premières Tropicales (Michelin) Singapore
Société Internationale de Plantations d'hévéas (SIPH) France
Sogescol FR S.A. Switzerland
Southland Global Pte Ltd Singapore
Sri Trang Agro-Industry PLC Thailand
Sumitomo Rubber Industries Ltd Japan
The Japan Automobile Tyre Manufacturers Association Inc (JATMA) Japan
The Japan Rubber Manufacturers Association (JRMA) Japan
The Rubber Economist Ltd United Kingdom
The Rubber Trade Association of Europe (RTAE) United Kingdom
The Rubber Trade Association of Japan (RTAJ) Japan
Timberfarm GmbH Germany
Tire Industry Research United Kingdom
Tokyo Commodity Exchange (TOCOM) Japan
Tong Thai Technical Rubber Co Ltd Thailand
Toyo Tire & Rubber Co Ltd Japan
Toyotsu Chemiplas Corporation Japan
Trigon Gulf FZCO United Arab Emirates
TSRC Corporation Taiwan R.O.C.
U.S. Tire Manufacturers Association United States of America
Versalis SpA Italy
Vietnam Rubber Association Vietnam
wdk Wirtschaftsverband der deutschen Kautschukindustrie e.V. Germany
Weber & Schaer GmbH & Co Germany
Yokohama Rubber Singapore Pte Ltd Singapore