Embed Size (px)
Citation preview
I. ON A NEW METHOD OF MEASURING THE MEAN HEIGHT OF THE OZONE IN THE ATMOSPHERE
BY
JOHN STRONG, California Institute of Technology.
INTRODUCTION.
The amoun t of ozone overhead in the s tratosphere varies from about I to 4 mm. when represented as a layer of pure gas reduced to normal t empera ture and pressure. Ozone present in such a small amount , compared with the other a tmospheric gases (see Table I), would not seem to be an impor tan t consti tuent . On the contrary, it is very impor tant in astrophysics, meteorology, geophysics and biology because of its absorption of ultraviolet light to produce the short wavelength limit for the spect rum of the sun and other astro- nomical bodies at ~ 3000 A. In a paper on atmospheric ozone, Ladenburg 1 writes, " W i t h o u t the presence of ozone in the stratosphere, life on ear th would not exist in its present form. The ultraviolet radiation from the sun exerts strong physiological effects upon every organism, as for example formation of erythems, destruct ion of bacteria, product ion of vitamins. The very shortest wavelengths of the sun have the greatest effect on the human skin. Small changes of the intensity of the sun in this region of the spectrum are bio- logically very (significant). These facts account for the wide interest and the general importance of the s tudy of the atmos- pheric ozone."
The absorption which makes the atmosphere entirely opaque at wavelengths less than 2913 A is due to the Hart ley ozone band. Partial absorption by this Hart ley band extends to the Huggins bands which occupy the spectral region from 3200 to 3300 A. There is also significant ozone absorption in the visible spectrum by the Chappius bands.
The Hart ley and Huggins bands have been employed by
1 R. W. L a d e n b u r g , J . O. S. A., 25, 259 ( I935) . I 2 I
I 2 2 J O H N STRONG. [J. I:. I.
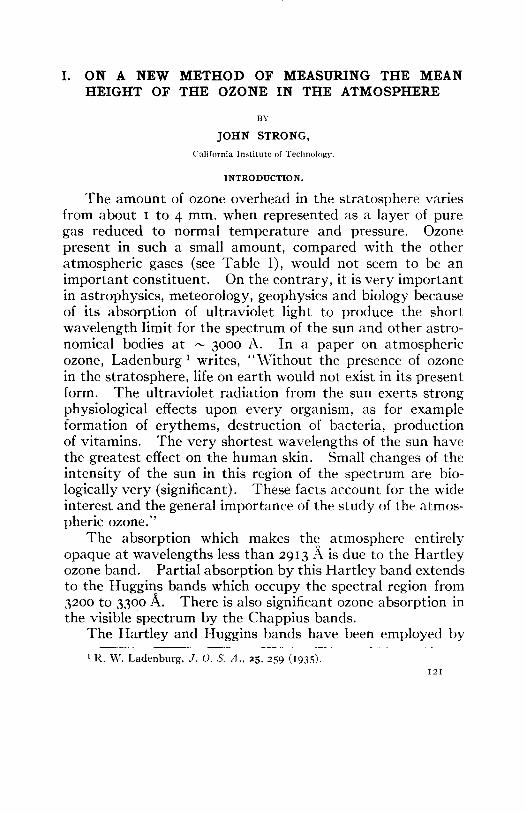
TABLE I.
Composition of the Atmosphere in the Troposphere and Approximate Reduced Thickness of Separate Constituents at N.T.P.
(Authority for per cent. by volume: F. A. Paneth, Quarterly Journal of the Royal Meteorological Society, 63, 433 (1937)).
Constituent. Per cent. by Volume. Reduced Thickness.
Nitrogen 78.09 6200 Meters Oxygen 20.95 I56O " Argon 0.93 79.5 " Water iO-lOO "
Carbon dioxide 0.03 2. 4 " Neon 1.8 X Io -a 15.1 Centimeters Helium 5.3 X 1o -4 4.2 " Krypton I X IO -4 7.9 Millimeters Hydrogen 5 X xo -5 4.0 " Xenon 8 X xo -~ 0.6 " Ozone ~ X IO -~ 1-4 " Radon 6 X IO -ls
Ozone constituent is variable in amount. The value 1 × io -8 per cent. ap- plies to country air near the surface of the ground. I -4 mm is the integrated ozone thickness for the whole atmosphere.
many investigators to s tudy atmospheric ozone. These in- vestigators have used as sources direct sunlight, zenith sky- light, starlight and terrestrial sources such as the hydrogen continuum3
The most significant ozone absorption in the infrared is produced by the strong oscillation-rotation band of the mole-
The investigations of atmospheric ozone are treated and bibliographies are to be found in the following review articles:
C. Fabry and H. Buisson, "M6morial des Sciences Physiques de l'Acad, des Sci. de Paris," Vol. XI, 193o.
F. W. Paul G6tz, "Ergebnisse d. kosm. Physik," Vol. I, I931; Vol. III, p. 253, 1938.
G. B. M. Dobson and A. R. Meetham, "Some Problems of Modern Meteor- ology," Chapter 15, Published by the Royal Meteorological Society; London I934.
R. W. Ladenburg, J . O. S. A., 25, 259 (1935)- "Conference on Atmospheric Ozone held at Oxford, September 9 to t I, 1936,"
Published by the Royal Meteorological Society; London, I936. Rudolf Penndorf, "Beitr/ige zum Ozonproblem," Ver6ffentlichungen der
Geophysikalischen Instituts der Universitat Leipzig, 8, No. 4, 1936. C. L. Pekeris, Bulletin of the American Meteorological Society, 20, 3 (1939). W. W. Coblentz and R. Stair, J. Research N. B. S., 22, 573 (1939).
Feb., I941.] MEAN H E I G H T OF ()ZONE 1N )~TMOSPHERE. I2 3
cute at 9.6 ~. This band falls in a spectral region where the a tmosphere is otherwise relatively t r anspa ren t This band was discovered by K. Angstrom ~ and it has been studied by him as well as by others in the laboratory and in the earth 's a tmosphere 4
All these investigations have built up a considerable fund of information about atmospheric ozone correlating it with meteorological, astronomical and geographical factors
I t has been determined tha t the ozone concentrat ion in the a tmosphere is about I X Io -° per cent. by volume at the surface, and this concentrat ion increases with height and reaches a max imum concentrat ion at about 22 k.m. The total amoun t of ozone in the a tmosphere is about twenty times more than tha t which one would expect from the surface concentrations, assuming uniform distribution. The major par t of the ozone of the a tmosphere is between the surface and a height of 35 k.m. The variations in the amoun t of ozone occur mainly between the heights Io and 20 k.m.
The total amoun t of ozone fluctuates from day to day and it has been definitely determined tha t these fluctuations are associated with meteorological factors: relatively large amounts of ozone are associated with cyclonic depressions, relatively low amounts of ozone with anticyclonic pressure highs; also, abnormally high amounts of ozone are associated with polar air masses, low ozone with tropical air masses.
A pr imary result of the studies of the amoun t of ozone overhead is tha t there is no apparent regular night and day variat ion in the amount . There are, however, fluctuations th roughout the d a y - - a n d indeed, these fluctuations are some- times so pronounced tha t the t e r m s " ozone holes" and "clouds of ozone" have been suggested to describe them.
3 K. Angstrom, Arch. f. Math., Astron. och. Phys., I, 345 and 395 (I9o4). 4 E. Ladenburg and E. Lehmann, Ann. d. Physik, 2i, 305 (I9o6). Eva von Bahr, Ann. d. Physik, 29, 780 (I9o9). F. E. Fowle, Smithsonian Misc. Coll., 68, No. 8, p. 41 (i917). J. Devaux, C. R., x93, I2O7 (I93x); I98, I595 (I934); ~oI, rSOO (I935). Arthur Adel, V. M. Slipher and E. F. Barker, Phys. Rev., 47, 580 (I935). Arthur Adel and C. O. Lampland, Astrophys. J., 9z, 48I (194o). John Strong, Phys. Rev., 55, I I I4 (I939). John Strong and Kenichi Watanabe, Phys. Rev., 57, Io49 (I94o).
I2 4 JOHN STRONG. IJ. E. 1.
There is a very definite annular variation of the amount of ozone overhead. It exhibits a maximum in the local spring of the hemisphere and a minimum in the local fall.
Measurements taken at various stations over the surface of the earth show that the ozone content of the atmosphere increases from the equator to the poles.
Measurements of the vertical distribution of the ozone are not very consistent, but they agree in showing that ozone is a stratified gas, the only one in the atmosphere, and further, they agree in showing that the maximum ozone concentration exists at a height of about 22 k.m. The inconsistency of the results of various observations is perhaps to be expected and explained as due to fluctuations in vertical distribution pro- duced by differing meteorological, astronomical and geograph- ical factors.
PREVIOUS OZONE HEIGHT [MEASUREMENTS.
The mean height of the ozone has previously been deter- mined by three main methods which will be described here briefly.
I. The first method uses direct sunlight. Logarithms of the ratio of intensities at two wave-lengths falling within the Hart ley ozone band are determined throughout a morning or afternoon and these logarithms are plotted, as ordinates, against the corresponding secants of the zenith distance of the sun as abscissa. One obtains a set of points of which the ones corresponding to a relatively high sun lie on a straight line (providing, of course, that meteorological con- ditions are steady throughout the measurements). For values of sec z greater than about 2 the points begin to deviate from this straight line, and these deviations increase rapidly as sec z becomes larger. These deviations are due to the curvature of the earth and to the fact that the ozone exists at an average height, h, which is not negligible in comparison with the radius of the earth p. The optical path length of sunlight in the ozone stratum is not proportional to sec z. Rather, it is proportional to sec ~" where ~" is the angle of incidence which the sunbeam makes with the plane of the stratum. Sec ~" may be considered equal to sec z only when the sun is high.
Feb., I94I.] M E A N H E I G H T OF O Z O N E ]N A T M O S P H E R E . 12 5
Otherwise, z and ~" are related as follows:
sin z sin ~" = h" ( I )
I + p
Sec ~" and sec z are related, so
SeC .~- = s e c z I - - ( s e c 2 z - - I ) . ( 2 ) 0
h Eq. 2 is only valid when sec -~ z >> •
P
The mean height h* is tha t one of several values of h, which on trial yields the best s t ra ight line when the afore- ment ioned logari thms are plot ted against corresponding sec .~, calculated by means of h*.
This me thod of de termining the height of the ozone layer was first applied by Cabannes and Dufay 5 and yielded h* ~ 45-50 k.m. This result appears to have been un- reliable. More recent observations, s employing the same method have since yielded heights of h* ~ 22 k.m. in substan- tial agreement with the heights obtained by other methods.
Three weaknesses of the me thod are: firstly, t ha t it is only applicable when meteorological conditions are s t e a d y - - the method assumes, wi thout prima facie justification, tha t the a m o u n t and height of the ozone remain cons tan t through- out the observat ion period ; and secondly, the method requires a t least a full half day ' s observat ions; and finally, the method is not ve ry a c c u r a t e - - u n d e r favorable condit ions the error of height being at least + 5 k.m.
2. The second method, due to G6tz ~ and named the Umkehr method, uses zenith skyl ight ra ther than direct sun- light. I t will facilitate our unders tand ing of this me thod to consider the relationship, which we would expect to obtain between the distr ibut ion of energy in the near ul traviolet
5 j . Cabannes and J. Dufay, J. de Physique et le Radium, 8, I25 (1927). 6 F. W. P. G6tz, A. R. M e e t h a m and G. M. B. Dobson, Proc. Roy. Soc.,
I45(A), 416 (1934). 7 F. W. P. G6tz, Gerlands Beitr. Geophys., 31, t i 9 (I93I).
I26 JOHN STRONG. [J. [:. I.
spectrum of the zenith skylight and that of the sun. Assume an ozone free atmosphere and of Rayleigh scattering. Let I~ and I8" be the intensities of zenith skylight at 3 I io and 3290 ffk received at the observing station and let I® and I®" be the intensities of direct sunlight at 3IIO and 3290 ~ re- ceived at the observing station. Neglecting the differential loss of energy from the direct solar beam by scattering, the ratio of skylight to sunlight is
L L" - - = B~I 4 and = B~24 (3) Ie Ie"
and, taking ratios and logarithms, we get
I8 ( 3 I I O ~ 4 I(D log ~ = log _ 329O ] q- log IO';" (4)
Now consider the effect of ozone absorption: we have already noted that if observed values of log Io / Io" are plotted as ordinate against sec z, as abscissa, a set of points is obtained, for a relatively high sun, which lie on a straight line. It is observed, as we would expect from Eq. 4, that the effect of ozone absorption on zenith skylight is analogous: again, for a relatively high sun, a plot of log Is/IJ ~ versus sec z yields points lying on a straight line. Line is parallel to the line obtained for direct sunlight but displaced vertically by an amount log (3I IO/329o) 4. The significance of this is tha t the sunlight is scattered by the zenith sky at a level below the ozone s t r a tum-- the total amount of ozone penetrated at a given zenith distance of the sun is, for both the skylight and the sunlight, the same. But as the sun lowers, the change in the sky spectrum by ozone absorption no longer simulates the change produced in the direct solar beam.
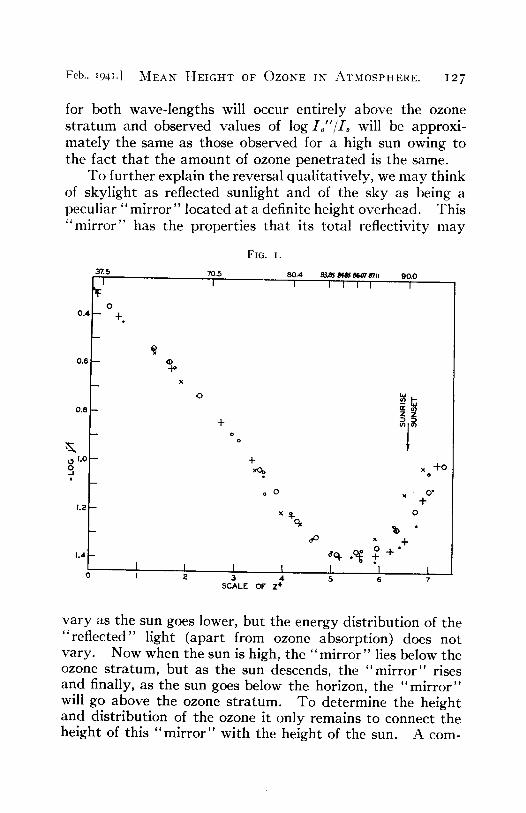
For convenience, G6tz plots log IJ'/I~ as ordinates against z 4 asabscissa. Just before sunset, the values of log I8"/I8 become stationary in respect to z* and for greater values of z there is a reversal of the derivative of log IJ~/I8 and log IJ'/I8 approaches the values that obtained when the sun was high. See Fig. I. This reversal is known as the "Umkehreffekt ."
A reversal is to be expected: when the sun is sufficiently low (z ~ 9o°), the level of scattering of the zenith skylight
Feb., I941.1 ~ I E A N H E I G H T OF OZONE IN ATMOSPHERE. 12 7
for both wave-lengths will occur entirely above the ozone s t ratum and observed values of log Z/'/I, will be approxi- mately the same as those observed for a high sun owing to the fact that the amount of ozone penetrated is the same.
To further explain the reversal qualitatively, we may think of skylight as reflected sunlight and of the sky as being a pecul iar" mirror" located at a definite height overhead. This "mi r ro r " has the properties that its total reflectivity may
I
0 0 . 4 - - _~
0.6 --
0.8--
1.2
1.4--
I 0 !
0 1.0 o, i
F I G . I .
70.5 80 .4 88.85" ~tS~ 86~'/8"/Ii 90 .0 I I I I I I I
,0
+
° o
+ xoo
o 0
x \
+"
K i t I 2 3 4 $
S C A L E OF Z ¢"
xe 4.0
x _~. O°
0
I I 6 7
vary as the sun goes lower, but the energy distribution of the "ref lected" light (apart from ozone absorption) does not vary. Now when the sun is high, the "mi r ro r " lies below the ozone stratum, but as the sun descends, the "mi r ro r " rises and finally, as the sun goes below the horizon, the "mi r ro r " will go above the ozone stratum. To determine the height and distribution of the ozone it only remains to connect the height of this "mi r ro r " with the height of the sun. A com-
I 2 8 J O H N ~TRONG. IJ. [:. ].
plicated analysis is actually involved in reducing the measured Umkehr curve, s
Although an analysis of a composite Umkehr curve, free from casual errors, yields the approximate distribution of ozone in the vertical, 6 an Umkehr curve for a single day, or half-day, allows only the mean height of the ozone to be determined, and this to an accuracy of 4- 1.5 k.m.
The Umkehr method requires, as a minimum, a full half day's observations and in effect it determines the height only at a special time near sunset (or sunrise).
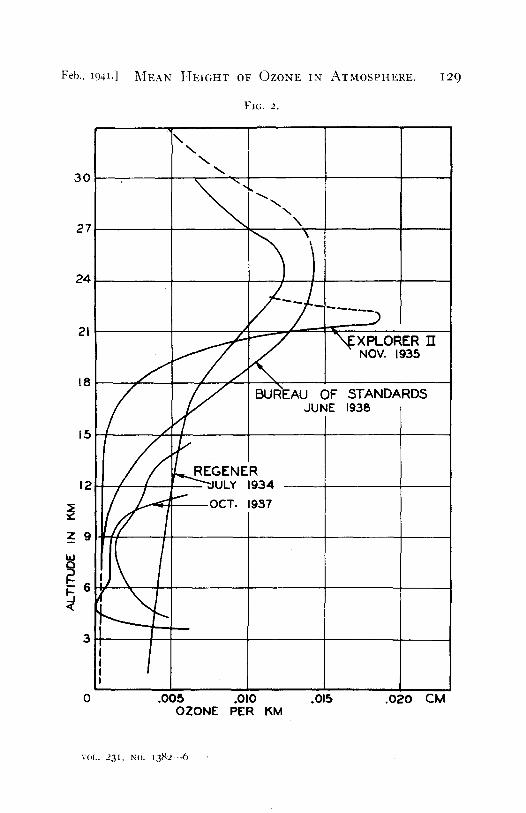
3. The third method employs an apparatus which is carried aloft by means of a manned or unmanned balloon. The ap- paratus continuously measures the ozone overhead as it ascends and these measurements are connected with the height of the balloon by means of a recording barometer, also carried aloft. The method was applied by O'Brien, Mohler and Stewart 9 on the flight of Explorer I I which occurred on November I I, I935. The method has also been applied by the Regeners 10 who sent a quartz spectrograph aloft with unmanned balloons. The method has been applied by Coblentz and Stair n who used unmanned balloons with a photocell-filter technique for measuring the ozone overhead.
These height measurements are now all in substantial agreement in placing the center of gravity of the ozone at a height of about 22 k.m.
In regard to the vertical distribution the stratosphere flight of Explorer I f showed very little ozone below a height of I6 k.m. (See Fig. 2.) The Bureau of Standards' work confirms this result in so far as it shows very little ozone below II k.m. In contrast with this, the earlier Regener result together with the Umkehr results 6 show considerable ozone in the troposphere. However, the later Regener result shows less ozone in the troposphere than the earlier Regener result or the results from the Umkehr method. The opinion of the
8 See reference 6. Also, S. Chapman, Phil. Trans. London, z34 A, 205 (I935). 9 Brian O'Brien, Fred L. Mohler and H. S. Stewart, Jr., National Geographic
Soc. Contr. Tech. Papers, Statosphere Series, No. 2, p. 71 (I936). 10 Erich and Victor H. Regener, Physik. Zeits., 34, 788 (I934). Victor H.
Regener Zeits. fiir Physik., IO9, 642 (I938). 11W. W. Coblentz and R. Stair, J. Research N. B. S., 22, 573 (I939).
Feb., I94I. ] ~ E A N HEIGHT OF OZONE IN ATMOSPHERE.
FIc. 2.
[ 2 9
30
27
\ \
\
\ \
24
21
18
1.5
<PLORER 1"[ NOV. 1935
J OF STANDARDS JUNE 1938
12
Z 9
5 6 <
3
REGENER --~JUCY 1934
1937
0 .005 .010 OZONE PER I<,M
.015 .020 CM
voL. 231 , No. 1382--6
I 3 0 J O H N STRONG. [J. I". I.
author is, with Vassy, 12 tha t the ozone content of the atmos- phere, as regards amount , distr ibution in the vertical, and temperature , is characteristic of the locale (polar or tropical region) where the obtaining air mass originated. Thus the result of the early flight of the Regeners would appear to be characteristic of a polar type air mass, while the result of the flight of Explorer I I would appear to be characteristic of a tropical type air mass.
NEW METHOD OF DETERMINING OZONE HEIGHT.
A new method has been developed for measuring the height of the ozoneY It is the pr imary purpose of this paper to describe this new method and to present some of the results obtained.
In general, the new method employs direct sunlight and the height determinat ion may be made at all positions of the sun. Ten to twenty height determinat ions may be obtained in a day 's observations when the weather is clear. This method, in contrast with all the older methods, makes possible the continuous s tudy of the height of the Ozone during sunny weather regardless of the steadiness of meteorological con- ditions.
In particular, the new method measures the intensity of absorption of sunlight by three absorption bands: absorption in the ultraviolet by the Hart ley band for the purpose of determining the total amoun t of ozone overhead; the absorp- tion in the infrared by the O-band of water vapor at I .I 4 #
in order to find out the total amoun t of water vapor overhead ; and finally, in the infrared, the absorption at 9.6 ~. The solar radiation at this last wave-length is a t tenua ted by both ozone absorption and water vapor absorption. The major par t of the atmospheric absorption here is due to the strong ~r-type oscillation-rotation band of ozone. The remainder of the absorption at 9.6 ~ due to water vapor is accounted for with the help of the O-band measurement .
The new method functions owing to the fact tha t the ultraviolet absorption in the Hart ley band is substantially
~2 Mme A. Vassy and M. E. Vassy, La M~t~orologie, No. I9, Jan.-Feb. (I939). 13John Strong, Phys. Rev., 55, :tII4 (I939). John Strong and Kenichi
Watanabe, Phys. Rev., 57, IO49 (~94o) -
Feb., 194i. ] MEAN HEIGHT OF OZONE IN ATMOSPHERE. I 3 I
independent of total pressure, whereas the infrared absorp- tion by ozone is proportional to the fourth root of the total pressure. It follows that the ultraviolet and infrared meas- urements together determine the average total pressure on the ozone and so determine the average height of the ozone stratum.
THE ULTRAVIOLET MEASUREMENTS.
In the next parts of this paper the various measurements, the apparatus employed to make them, and the control and calibration of the apparatus will be described.
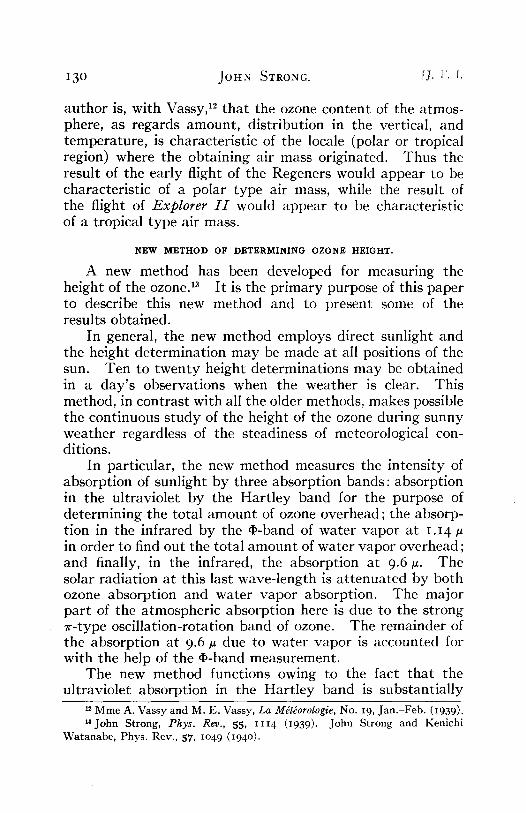
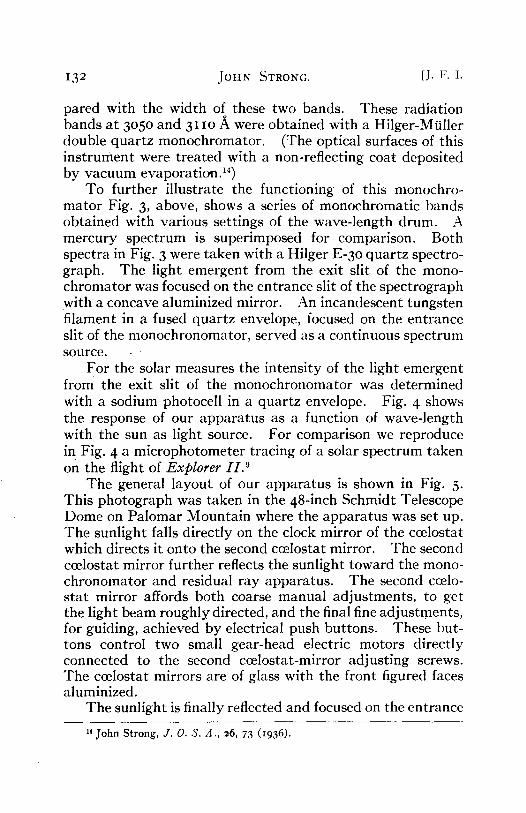
The ultraviolet measurements were made with two bands of radiation of about 6 ,~ width centered at 305 ° and 3ZlO A. The width and position of these bands are shown below in Fig. 3 in comparison with the mercury spectrum. The spac- ing of the two mercury lines 3125 and 313z A is to be corn-
F'm. 3.
6 U3 ~D
O 0 0 . - .
I 3 2 JOHN STRONG. [J. F. I.
pared with the width of these two bands. These radiation bands at 3050 and 3I Io A were obtained with a Hilger-Mfiller double quartz monochromator . (The optical surfaces of this ins t rument were t reated with a non-reflecting coat deposited by vacuum evaporation. 14)
To fur ther illustrate the functioning of this monochro- mator Fig. 3, above, shows a series of monochromat ic bands obtained with various settings of the wave-length drum. A mercury spect rum is superimposed for comparison. Both spectra in Fig. 3 were taken with a Hilger E-3o quartz spectro- graph. The light emergent from the exit slit of the mono- chromator was focused on the entrance slit of the spectrograph with a concave aluminized mirror. An incandescent tungsten filament in a fused quartz envelope, focused on the entrance slit of the monochronomator , served as a continuous spectrum s o u r c e .
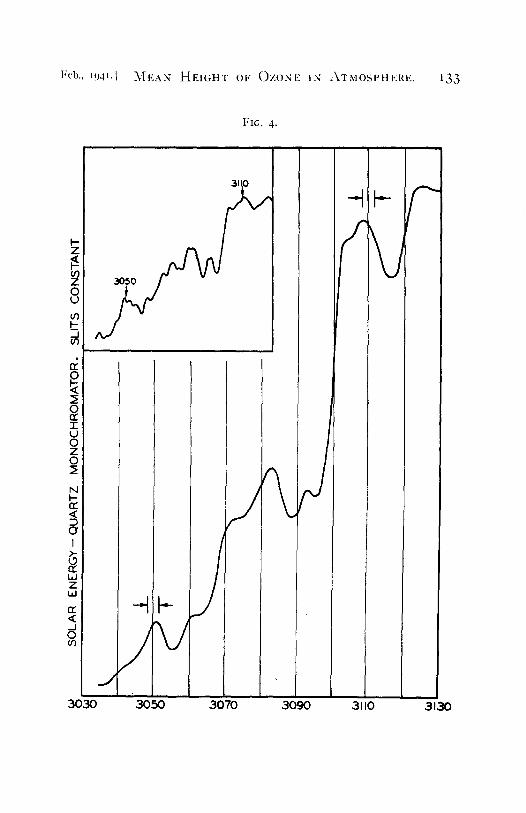
For the solar measures the intensity of the light emergent from the exit slit of the monochronomator was determined with a sodium photocell in a quartz envelope. Fig. 4 shows the response of our appara tus as a function of wave-length with the sun as light source. For comparison we reproduce in Fig. 4 a microphotometer tracing of a solar spectrum taken on the flight of Explorer I1. 9
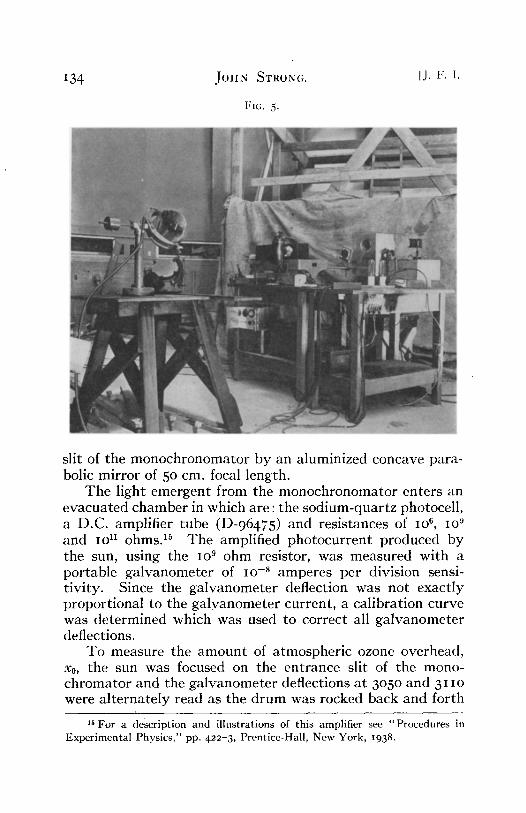
The general layout of our appara tus is shown in Fig. 5. This photograph was taken in the 48-inch Schmidt Telescope Dome on Palomar Mounta in where the appara tus was set up. The sunlight falls directly on the clock mirror of the coelostat which directs it onto the second c~elostat mirror. The second coelostat mirror further reflects the sunlight toward the mono- chronomator and residual ray apparatus. The second ccelo- s tat mirror affords both coarse manual adjustments , to get the light beam roughly directed, and the final fine adjustments , for guiding, achieved by electrical push buttons. These but- tons control two small gear-head electric motors directly connected to the second ccelostat-mirror adjust ing screws. The c~elostat mirrors are of glass with the front figured faces aluminized.
The sunlight is finally reflected and focused on the entrance
14 John Strong, J. O. S. A., z6, 73 (I936).
l:cb., I94~.[ ~ I E A N H E I G H T OF ( ) Z O N E 1N ~ T M O S P H E R E . I 3 3
Fic . 4.
I-- Z
Z 0 U
b
n-
O r r I U 0 Z 0
U I-- o" <
I
I,i z 1.1.1
n-
J 0 o3
3030 3050 3070 3090 3110 3130
I 3 4 JOHN" STRONG. [J. i;. i.
FIG. 5-
slit of the monochronomato r by an aluminized concave para- bolic mirror of 5o cm. focal length.
The light emergent from the monochronomato r enters an evacua ted chamber in which are : the sod ium-quar tz photocell, a D.C. amplifier tube (D-96475) and resistances of 10 6, IO" and IO n ohms. 15 The amplified pho tocur ren t p roduced by the sun, using the Io 9 ohm resistor, was measured with a por table ga lvanomete r of Io .8 amperes per division sensi- t ivi ty . Since the ga lvanomete r deflection was not exact ly proport ional to the ga lvanometer current , a cal ibrat ion curve was de termined which was used to correct all ga lvanomete r deflections.
To measure the amoun t of a tmospher ic ozone overhead, x0, the sun was focused on the ent rance slit of the mono- ch romator and the ga lvanomete r deflections a t 305 ° and 31 Io were a l te rna te ly read as the d rum was rocked back and forth
15 For a description and illustrations of this amplifier see "Procedures in Experimental Physics," pp. 422-3, Prentice-Hall, New York, I938 .
Feb., 194J.] ~"IEAN H E I G H T OF ( ) Z O N E IX A T M O S P H E R E . I 3 5
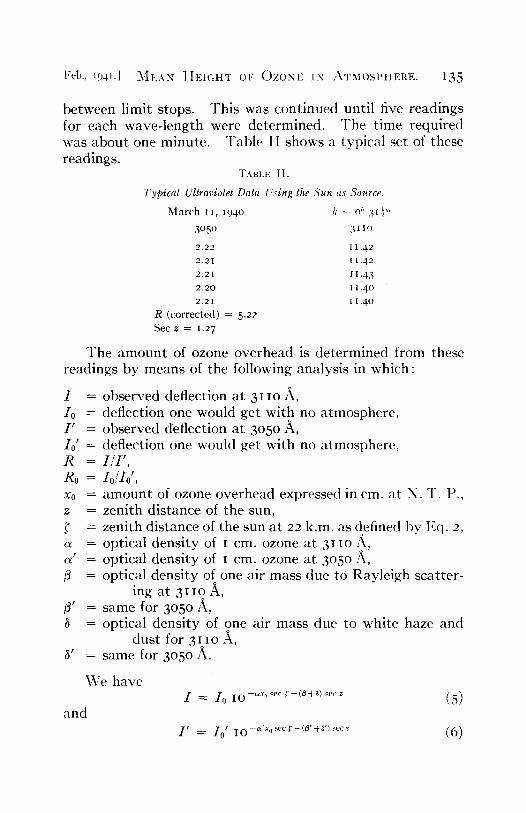
between limit stops. This was cont inued until five readings for each wave- length were determined. The t ime required was a b o u t one minute. Table II shows a typical set of these readings.
TABLE I I.
Typical Ultraviolet Data Using the Sun as Source.
March 1I, I94o h = o t' 3I~"'
305 ° 3I IO
2 . 2 2 t ] ,42
2 .21 1 1.42
2.21 I 1.43
2 . 2 0 I 1 .40
2 . 2 I I 1.40
R (corrected) = 5.22 Sec z = 1.27
/0 -- I t =
I o I =
R =
R o =
No g =
=
=
The a m o u n t of ozone overhead is de te rmined from these readings b y means of the following analysis in which:
observed deflection a t 3I Io A, deflection one would get with no a tmosphere , observed deflection a t 3o5o A, deflection one would get with no a tmosphere , I / I ' ,
I o / l o ' ,
a m o u n t of ozone overhead expressed in cm. at N. T. P., zenith dis tance of the sun, zenith distance of the sun a t 22 k.m. as defined by Eq. 2, optical dens i ty of I cm. ozone a t 311o ~, optical dens i ty of I cm. ozone a t 3o5o A, optical dens i ty of one air mass due to Rayleigh scat ter-
ing at 3XlO A, ~' = same for 3o5o A,
= optical dens i ty of one air mass due to white haze and dus t for 31Io A,
/V = same for 3o5o A.
We have -l = I0 Io ...... 0.~ec ~-!~+~, ~e,~ ( 5 )
and I t = l0 t iO-~'x0secf-(O'+~') . . . . (6)
I36 JOHN STRONG. [J. F. ~[,
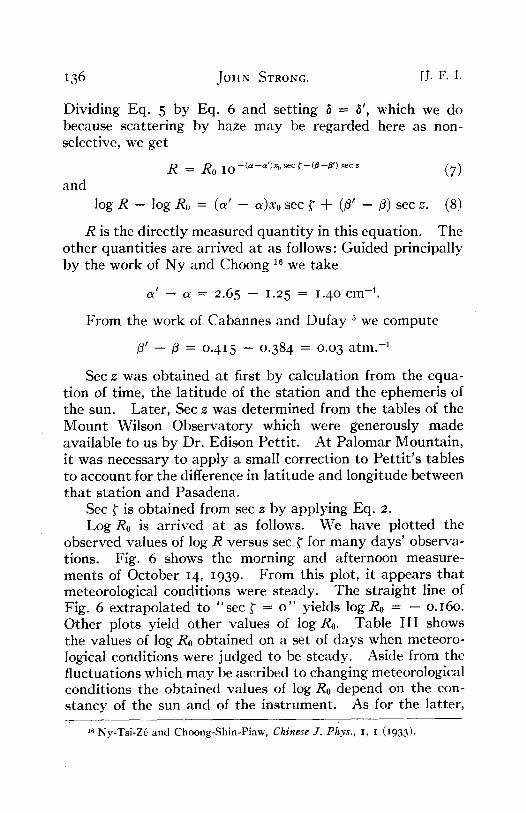
Dividing Eq. 5 by Eq. 6 and set t ing 8 = 6', which we do because scat ter ing by haze m a y be regarded here as non- selective, we get
R = R0 IO -(a-~')xosec~'-(~-B')secz (7)
and
log R - log R0 = ( d - a)Xo sec ~ + (/~' - /~) sec z. (8)
R is the direct ly measured q u a n t i t y in this equat ion. The o ther quant i t ies are arr ived a t as follows: Guided principally b y the work of N y a n d Choong as we take
t a -- a = 2.65 -- 1.25 = 1.4o cm -~.
F rom the work of Cabannes and D u f a y ~ we compute
~' - ~ = o.415 - o.384 = o.o3 a tm. -~
Sec z was ob ta ined a t first b y calculat ion from the equa- tion of time, the la t i tude of the s ta t ion and the ephemeris of the sun. Later, Sec z was de te rmined from the tables of the M o u n t Wilson Obse rva to ry which were generously made avai lable to us b y Dr. Edison Pet t i t . At Pa lomar Mounta in , it was necessary to app ly a small correct ion to Pe t t i t ' s tables to account for the difference in la t i tude and longi tude be tween tha t s ta t ion and Pasadena.
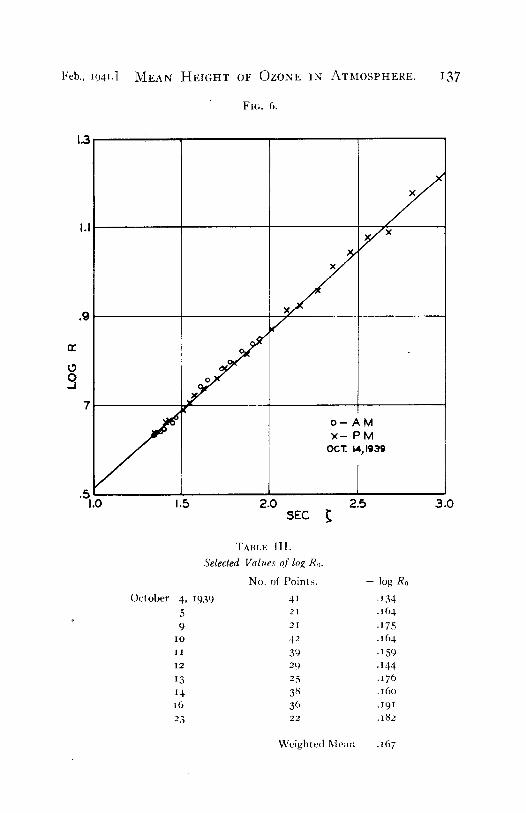
Sec ~ is ob ta ined from sec z by applying Eq. 2. Log R0 is arr ived a t as follows. We have p lo t ted the
observed values of log R versus sec ~" for m a n y days ' observa- tions. Fig. 6 shows the morning and af ternoon measure- ments of October 14, I939. F rom this plot, it appears tha t meteorological condit ions were s teady. The s t ra ight line of Fig. 6 ex t rapola ted to " sec ~" = o " yields log R0 = -- o. 16o. Other plots yield o ther values of log R0. Table I I I shows the values of log R0 obta ined on a set of days when meteoro- logical condit ions were judged to be s teady. Aside from the f luctuat ions which m a y be ascribed to changing meteorological condit ions the obta ined values of log R0 depend on the con- s t ancy of the sun and of the ins t rument . As for the latter,
as Ny-Tsi-Z6 and Choong-Shin-Piaw, Chinese J. Phys., x, I (I933).
Feb., 194[.] ~ I E A N H E I G H T OF O Z O N E I N A T M O S P H E R E .
Fro. 6.
I37
t.3
I.I
.9
n-
O o 7
.5 1.0
/ 1.5
/ 2.0
/ /
!
o - A M x - P M
OCT. I,4,1939
2.5 SEE
3 . 0
TABLE III.
Selected Values of log Ro.
October 4, 1939
5 9
IO
l I
1 2
I3 z4 t6
23
No. of Points.
41 21
2 I
42
3'-) 29 25 38 36 2 2
Weighted Mean
-- log Ro
.J34
.164
.175
.[64
.I59
.I44
.t76 • 16o .z9 z A82
.[67
138 JOHN STRONG. [J- li'. I.
R is observed to change about i per cent. for a deliberate change of I flk in the wave-length settings. We have kept the wave-lengths properly positioned by frequently mapping the spectrum as shown in Fig. 4. The final chosen value of log R0 was
log R0 = - o.I67,
With this value of log R0 we are now prepared to apply Eq. 8 to the interpretation of the observed ratio of the gal- vanometer deflections, R and determine the amount of ozone overhead. We get
log R - o.167 - o.o 3 sec z Xo = (9)
1.4 sec ~"
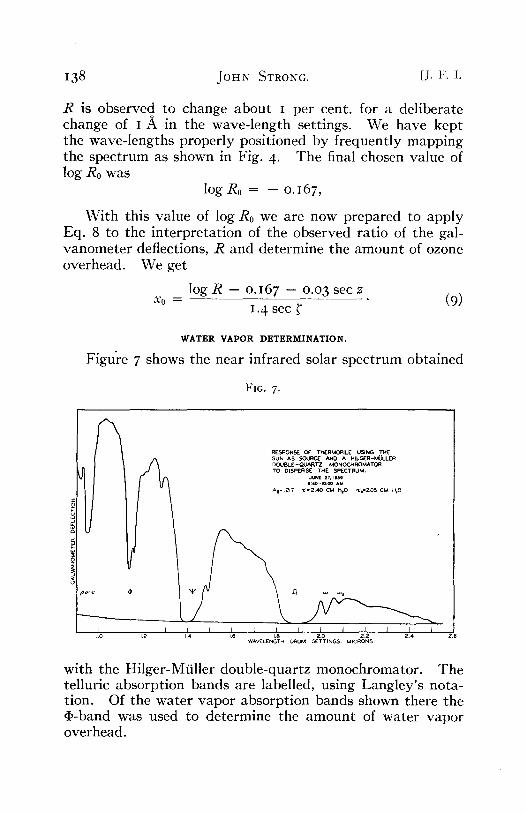
WATER VAPOR DETERMINATION.
Figure 7 shows the near infrared solar spectrum obtained
FIG. 7.
I I 1.0 1!2' i
RESPONE OF THERMOPILE U.~NG THE SUN AS ~ AND A HILGER-MULLER DOUBLE -QUARTZ MONOCHROMATOR TO DISPERSE THE SPECTRUM.
JUN[ =7, io3o 9:,lo -~oloo A~
A~= 217 ~=2.,¢0 CM N=O '1~o=2.05 CM HzO
114 I I I I I I I I I .I I 1.6 i.~ 2.0 2 .2 2 4
WAVELENGTH DRUM SETTINGS. MICRONS
with the Hilger-Mfiller double-quartz monochromator. The telluric absorption bands are labelled, using Langley's nota- tion. Of the water vapor absorption bands shown there the O-band was used to determine the amount of water vapor overhead.
Feb., I94I.] ~ IEAN I { E I G t t T OF OZONE IN ATMOSPHERE. 239
The same ccelostat and focusing mirror described above were used to focus the sun's image on the entrance slit of the monochromator . For the O-band measurement , as con- t ras ted with the ul t raviole t measurement , a d iaphragm was interposed immedia te ly in front of the entrance slit of the monochromator . The d iaphragm had an aper ture equal to abou t one-third tha t of the solar image and its function was to make the solar energy enter ing the slit independent of small errors of guiding of the solar beam.
A small 45 ° mirror placed in the emergent radiat ion from the monochromato r directed the radiat ion lateral ly onto a quar tz lens which in turn focused it on a Kipp and Zonen ther- mopile. This thermopile was connected through a double- pole, double - th row switch to a L. and N. t ype H S galvan- ometer . The ga lvanometer deflection was read b y means of a t rans lucent glass scale on which the reflected and focused image of a s t raight f i lament lamp played. The ga lvanometer scale appears in Fig. 5-
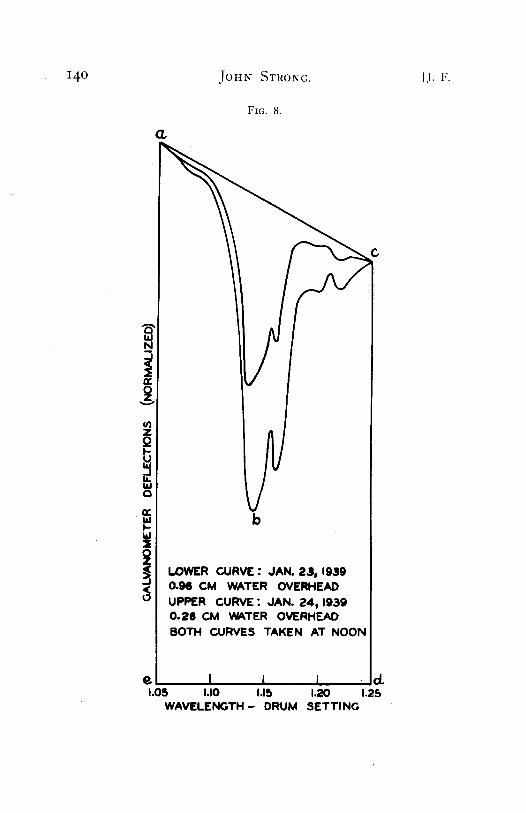
Figure 8 shows the O-band as measured a t Pasadena on two occasions, one when there was ve ry little water vapor overhead and the o ther for more wa te r vapor. The absorp- tion by this band, A . , is, following Fowle, the ratio of the area a b c a to a c d e a. The band limits are ~.o5 and 1.25 ~. We use Fowle 's 17 calibration curve to connect A~ with the a m o u n t of wa te r vapor, r, pene t ra ted by the solar beam.
In rout ine measurements of A~, the slits were widened to give a smooth curve and instead of integrat ing the areas a b c a and a c d e a wi th a planimeter, the ga lvanometer de- flections were reduced by an equivalent algebraic process.
The relation be tween r and the a m o u n t of wa te r vapor overhead, to, is,
r = r0secz . (IO)
THE FAR INFRARED MEASUREMENTS.
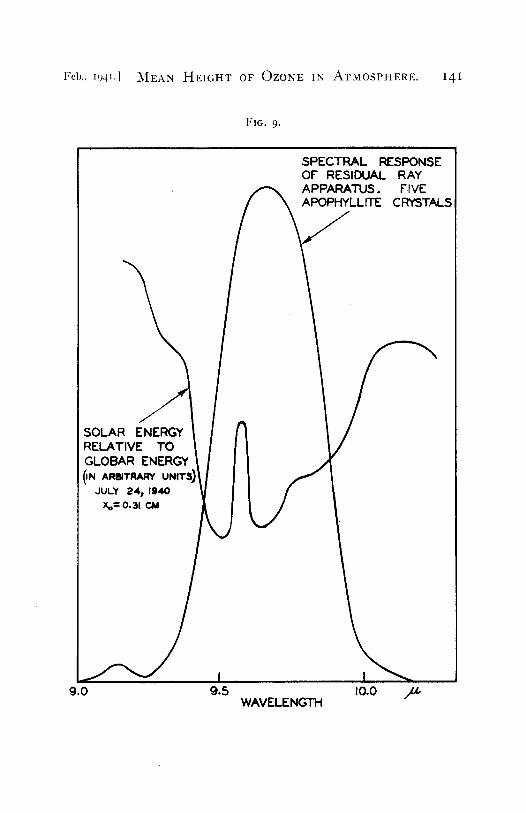
Figure 9 is a grat ing-energy curve of the sun showing the absorpt ion b y the 9.6/~ band of ozone. Super imposed on this curve is the wave- length response curve of a five-crystal residual-ray appa ra tus fitted wi th apophyl l i te crystals. The half-width of this response band is 0.34 t~ and the max i mum
17 F. E. Fowle, Smithsonian Misc. Coll., 68, No. 8 (i917).
I 4 o [J. v.
O.,
JOHN STRONG.
FIG. 8.
(/1 z o
!
C
b
LOWER CURVE : JAN. 23, 1939 0.94 CM WATER OVERHEAD UPPER CURVE : JAN. 24, 1939 0 . 2 6 CM WATER OVERHEAD BOTH CURVES TAKEN AT NOON
e I i i 1.05 I.I0 1.15 1,20 1.25
WAVELENGTH- DRUM SETTING
Feb., ]94 L] ~,IEAN I-IEIGHT OF OZONE IN 25kTMOSPHERE. I4I
FIG. 9,
SPECTRAL RESPONSE OF RESIDUAL RAY APPARATUS. FIVE APOPHYLLITE CRYSTALS
SOLAR ENERGY RELATIVE TO GLOBAR ENERGY IN ARBTRARY UNIT, q
JULY 24~ 1940 Xo= 0.31 CM
9.0 9.5 10.0 /U, WAVELENGTH
I 4 2 J O H N STRONG. [J. F. I.
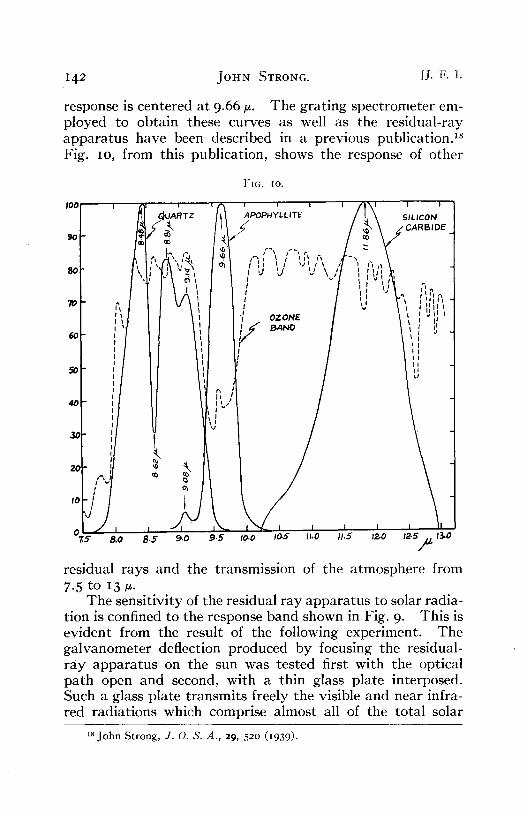
response is centered at 9.66/~. The grat ing spectrometer em- ployed to obtain these curves as well as the residual-ray appara tus have been described in a previous publication. 18 Fig. Io, from this publication, shows the response of other
F I G . I O .
i t ( ' ~ i i
I 0 0 ~ ¢~UARTZ A P O P H Y L L I TE
, o ° t/ ~ r ~
l \ ¢~ I ,J ~ t t, 8O
I t I I I
I O Z O N E
,o : ' I
I I
S I L I C O N • C A R B I D E
4 0 I -,'
zol" . :1 L/? " ;, 0 ; 5 . ,¢" I i ~ , . . . . . . . . o.o 8.s 9.0 9.s io.o ,o~ ii.o , . s 12.o ,2 .~ /u1~0
residual rays and the transmission of the a tmosphere from 7-5 to 13/~.
The sensitivity of the residual ray appara tus to solar radia- tion is confined to the response band shown in Fig. 9. This is evident from the result of the following experiment. The galvanometer deflection produced by focusing the residual- ray appara tus on the sun was tested first with the optical pa th open and second, with a thin glass plate interposed. Such a glass plate t ransmits freely the visible and near infra- red radiations which comprise almost all of the total solar
is John Strong, J . O. S. A., 29, 520 (I939).
Feb., 194I.] M E A N H E I G H T 0F OZONE IN ATMOSPHERE. I43
radiation, but it is opaque to the 9.6 ~ band. The galvan- ometer deflection produced by the short wave-length solar radiation, through the glass plate, was only o.25 per cent. of the deflection obtained with the optical pa th open.
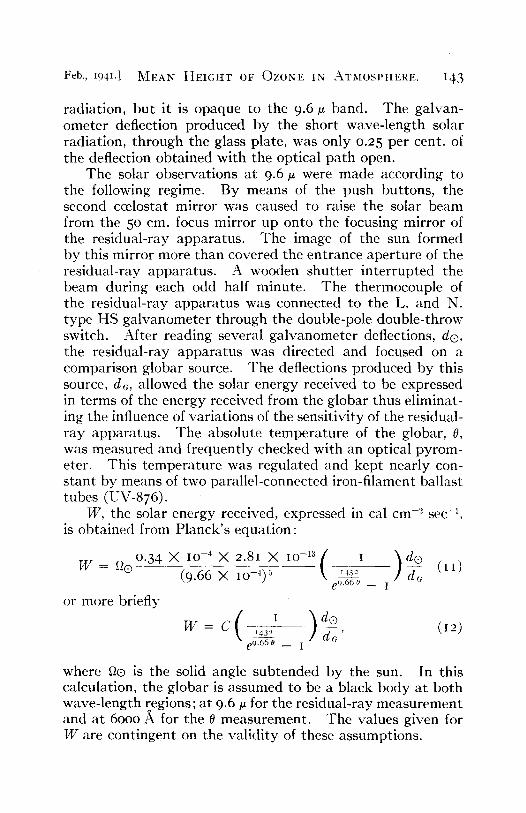
The solar observations at 9.6 ~ were made according to the following regime. By means of the push buttons, the second ccelostat mirror was caused to raise the solar beam from the 50 cm. focus mirror up onto the focusing mirror of the residual-ray apparatus. The image of the sun formed by this mirror more than covered the entrance aperture of the residual-ray apparatus. A wooden shut ter in terrupted the beam during each odd half minute. The thermocouple of the residual-ray appara tus was connected to the L. and N. type HS galvanometer through the double-pole double-throw switch. After reading several galvanometer deflections, do, the residual-ray appara tus was directed and focused on a comparison globar source. The deflections produced by this source, do, allowed the solar energy received to be expressed in terms of the energy received from the globar thus eliminat- ing the influence of variations of the sensitivity of the residual- ray apparatus. The absolute tempera ture of the globar, 0, was measured and frequently checked with an optical pyrom- eter. This tempera ture was regulated and kept nearly con- s tant by means of two parallel-connected iron-filament ballast tubes (UV-876).
W, the solar energy received, expressed in cal cm-'-' sec -x, is obtained from Planck's equat ion:
W = t~o °'34 X IO -4 X 2.8I X IO-Xa ( I ) d O (9.66 X IO--4) a LI32 E (11)
e9.66 0 __ I
or more briefly
W = C 1432 d r ; ' (12) e9.66 0 _ I
where tlo is the solid angle subtended by the sun. In this calculation, the globar is assumed to be a black body at both wave-length regions; a t 9.6 t~ for the residual-ray measurement and at 6ooo A for the 0 measurement . The values given for W are cont ingent on the validi ty of these assumptions.
I 4 4 J O H N STRONG. [J. F. 1.
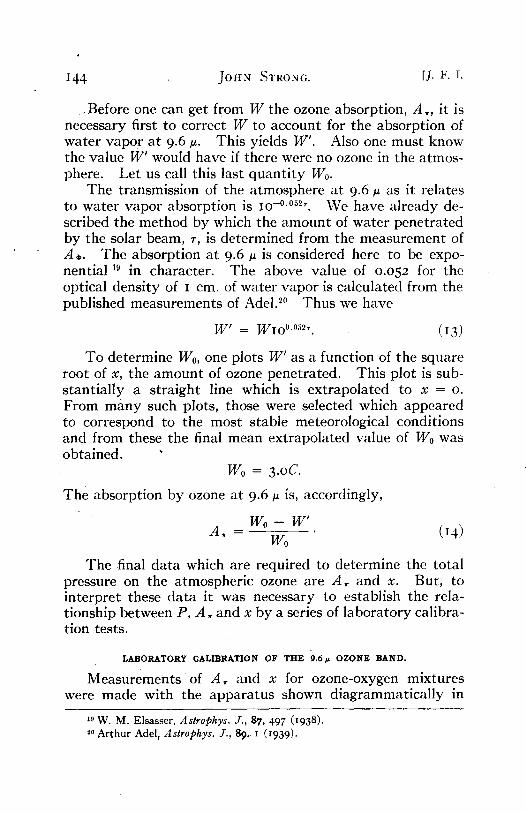
. Before one can get from W the ozone absorption, A, , it is necessary first to correct W to account for the absorption of wate r vapor a t 9.6 u. This yields W'. Also one mus t know the value W' would have if there were no ozone in the atmos- phere. Let us call this last quan t i t y W0.
The transmission of the a tmosphere a t 9.6 u as it relates to wate r vapor absorption is IO -°°~2". We have a l ready de- scribed the me thod by which the a m o u n t of wate r pene t ra ted by the solar beam, r, is de te rmined from the measu remen t of A¢. The absorption at 9.6 u is considered here to be expo- nential 19 in character . The above value of 0.052 for the optical densi ty of I cm. of water vapor is calculated from the published measurements of Adel3 ° Thus we have
W ' = WIo °'°~2T. (13)
To de termine W0, one plots W ~ as a funct ion of the square root of x, the a m o u n t of ozone penet ra ted . This plot is sub- s tant ia l ly a s t raight line which is ext rapola ted to x = o. F rom m a n y such plots, those were selected which appeared to correspond to the most stable meteorological condit ions and from these the final mean extrapola ted value of W0 was obtained.
W0 = 3.oC.
The absorption by ozone at 9.6 ~z is, accordingly,
W0 - W' A. =
w0
The -final da ta which are required to de termine the total pressure on the a tmospher ic ozone are A . and x. But, to in terpret these da ta it was necessary to establish the rela- t ionship between P, A . and x by a series of labora tory calibra- tion tests.
LABORATORY CALIBRATION OF THE 9.6~ OZONE BAND.
Measurements o f A . and x for ozone-oxygen mixtures were made with the appara tus shown d iagrammat ica l ly in
12 W. M. Elsasser, Astrophys. J., 87, 497 (1938). 20 Arthur Adel, Astrophys. J., 89,. i (i939).
Feb., 1941.] ~{EAN HEIGHT OF OZONE IN .'~kTMOSPHERE, I45
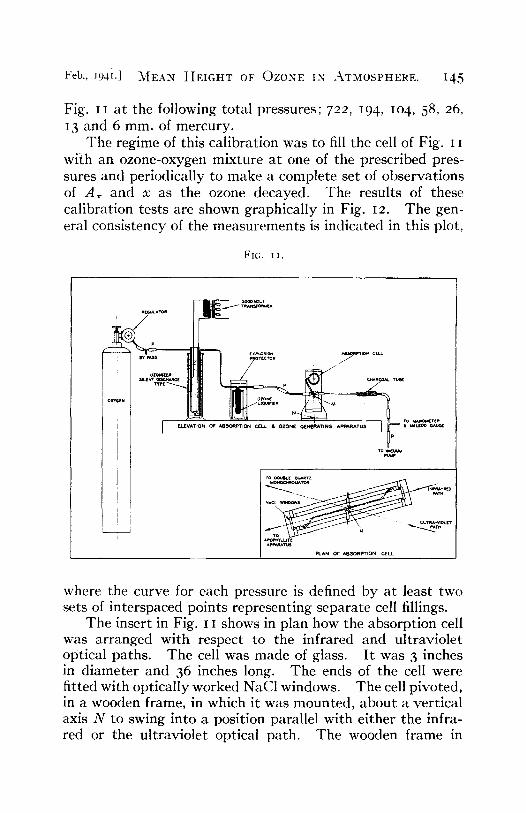
Fig. II at the following total pressures; 722, I94, Io4, 58, 26, 13 and 6 mm. of mercury.
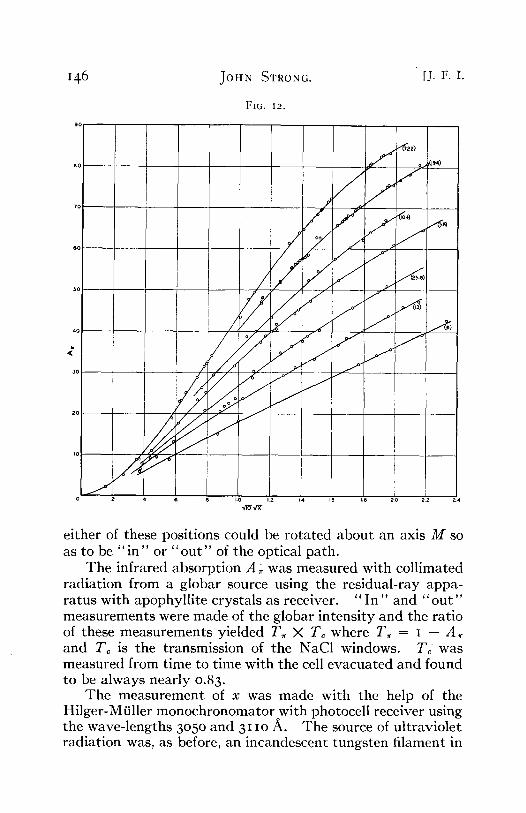
The regime of this calibration was to fill the cell of Fig. I I with an ozone-oxygen mixture at one of the prescribed pres- sures and periodically to make a complete set of observations of A, and x as the ozone decayed. The results of these calibration tests are shown graphically in Fig. I2. The gen- eral consistency of the measurements is indicated in this plot,
FIG. I I .
J o z o ~ z r ~
5 ~ e ~ r
o z o ~
[ L ( V * T I Q N O F A S ~ P T I O N C.I[I~ & O Z O N ( C~NIERATING AP'PARATU$ • ~t~L.l~00
TO p,.~p
• o ooueL~ ~ v z
I I ~ A N o r ~ . S O R p T I O N c ( u - i
where the curve for each pressure is defined by at least two sets of interspaced points representing separate cell fillings.
The insert in Fig. I I shows in plan how the absorption cell was arranged with respect to the infrared and ultraviolet optical paths. The cell was made of glass. It was 3 inches in diameter and 36 inches long. The ends of the cell were fitted with optically worked NaC1 windows. The cell pivoted, in a wooden frame, in which it was mounted, about a vertical axis N to swing into a position parallel with either the infra- red or the ultraviolet optical path. The wooden frame in
I46 JoHN S T R O N G . [J. 17. I.
FIG, 12.
J 2
jJ¢ / / / / /
t f J /
I
I
f
17"
j 4 J
J 7 f
! ]
I i . s 2 0 5 ;2 a 4
either of these positions could be rotated about an axis M so as to be " i n " or " o u t " of the optical path.
The infrared absorption A; was measured with collimated radiation from a globar source using the residual-ray appa- ratus with apophyllite crystals as receiver. " I n " and " o u t " measurements were made of the globar intensity and the ratio of these measurements yielded T~ X Tc where T~ = I - A and Tc is the transmission of the NaC1 windows. Tc was measured from time to time with the cell evacuated and found to be always nearly o.83.
The measurement of x was made with the help of the Hilger-Mtiller monochronomator with photocell receiver using the wave-lengths 3o5o and 3I IO/~. The source of ultraviolet radiation was, as before, an incandescent tungsten filament in
Feb., I94I.] M E A N H E I G H T OF O Z O N E IN A T M O S P H E R E , 147
a quartz envelope. The ultraviolet radiation was focused and collimated with quartz lenses.
Let R be the ratio of the observed deflection at 3 I i o to that at 3o5o fit with the cell "in." Let R0 be the same ratio with the cell "out." The correction of R for the rocksalt windows is made by means of the measured factor I.O2 4. The amount of ozone in the cell expressed as centimeters path length at N. T. P. is given by
log (R X I.O24) -- log Ro X = ( I 6 )
1 . 4 0
R0 was frequently measured as a control. Its value was found to be very constant owing to the fact that the tungsten lamp current was controlled by a Raytheon regulator.
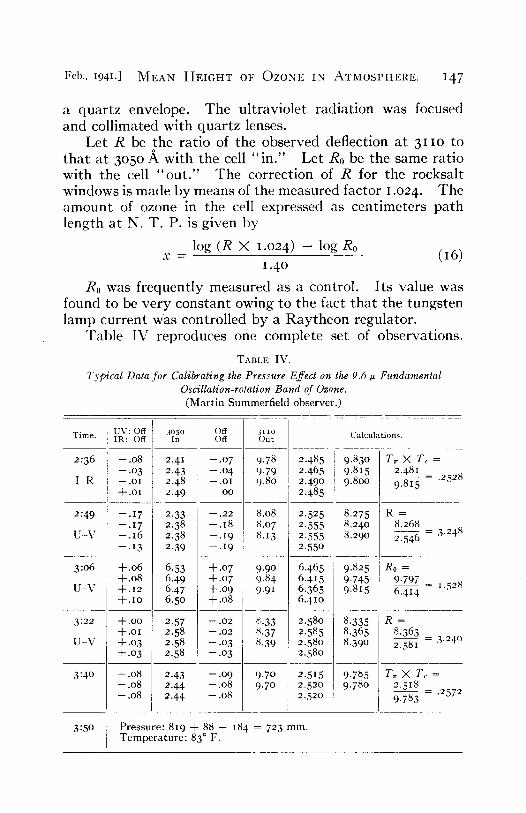
Table IV reproduces one complete set of observations.
TABLE IV.
T y p i c a l Data for Calibrating the Pressure Effect on the 9.6 ~ Fundamental Oscillation-rotation Band of Ozone.
(Mart in Summerfield observer.)
Time.
2:36
I - R
tions.
7"T X Tc = 2.48I
= .2528 9.815
2:49
U - V
e 8.268
-- 3.248 2.546
3:06
U - V
g 0 9.797 6.4x 4 = [.528
3:22 R = 8.363
U - V 2.581 = 3.240
3:4 o
3:50 T e m p e r a t u r e : 83 ° F.
T~-X T o = 2.5x8 9.783 = .2572
148 J O H N STRONG. [J. [;. ].
The increase of the T, X Tc values of Table IV and the decrease of the R is due to the decay of ozone. In using these results the two infrared transmissions and the two ultraviolet ratios were averaged and the averages were assigned to the time of the R0 determination. The total time to take a com- plete set of observations was about one hour and such a set yields one point on the final calibrations curve (Fig. 12).
Incidentally, values of I/X plotted against time gave a nearly straight line showing that the decay of ozone was, in the main, a bimolecular reaction.
For total pressures of 26 mm. and higher, the cell was filled with ordinary t a n k oxygen (99602:4N2) which was passed through the silent discharge ozonizer. The starting amount of ozone was adjusted to x -~ 0.5 cm. The total pressures were determined by means of a mercury manometer.
For total pressures of 26 mm. and lower, pure ozone was first admit ted into the cell. The pure ozone was separated from the oxygen-ozone mixture, produced by the ozonizer, in a preliminary step by means of a trap cooled with liquid air. Later the pure ozone was boiled off into the cell. Then the total pressure was adjusted to the desired value by adding tank oxygen. Total pressures of 26 mm. and lower were measured with a McLeod gauge.
Koroseal tubing 21 served to make all flexible connections and, with pinch clamps, served also to make the connections P shown in Fig. I I which were closed and opened. Mercury in the pressure gauges was protected from tarnishing by a charcoal trap inserted to remove ozone.
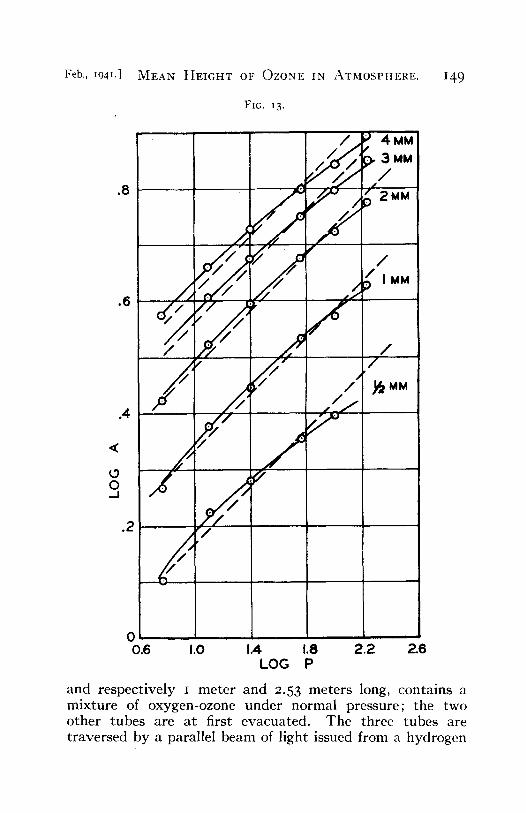
Log A, is plotted against log P in Fig. 13 for x = 0.05, o.I, 0.2, 0. 3 and 0. 4 cm. of ozone. We see in this plot that A , is substantially proportional to pi14. The dashed lines in Fig. 13 have a slope equal to I/4.
PRESSURE EFFECT OF ULTRAVIOLET ABSORPTION.
Among those who have tested the pressure effect of ultra- violet absorption is Vassy 22 who states, "A first tube 8.8 cm. long, in line with two others of the same diameter a s t h e first
21 John Strong, Rev. Sci. Instruments, IO, lO4 (1939). E. Vassy, "Conference on Atmospheric Ozone Held at Oxford, September 9
to I I, 1936, ' ' p. 26, published by the Royal Meteorological Society; London, I936.
Feb., I94t.1 ~[EAN HEIGHT OF ()ZONE IN ATMOSPHERE. I49
FZG. 13.
<
0 0 _J
/ ~ 4MM
L/
/ IMM
./fi / _ / " /(>4" /
/ NMM .4 / ' I - /~ ' /
¢
7 / .21
0 0.6 1.0 1.4 1.8 2 .2 2.6
LOG P
and respect ively I meter and 2.53 meters long, contains a mixture of oxygen-ozone under normal pressure; the two other tubes are a t first evacuated . The three tubes are t raversed by a parallel beam of light issued from a hydrogen
I 5 0 JOHN STRONG. [J. F. I.
tube. A spectrum is taken, and the mixture is made to expand into the two other tubes. (This was made in two times to prevent explosions.) Then another spectrum is taken, which was proved by microphotometr ic measurement to be identical with the first.
" . . . The ratio of pressure was I/4o; the lower pressure was the pressure in the atmosphere at a height of about 27 k.m., i.e. slightly above the center of gravi ty of atmospheric ozone. Therefore, it is not necessary to consider pressure effect in measurements concerning the thickness of the ozone layer."
This conclusion is, indeed, what we might expect consider- ing tha t the rotational detail of the ozone absorption has never been resolved in the solar spectrum and further, tha t the Hart ley band exhibits an abnormally high absorption coefficient--the optical density of ozone in the center of the Hart ley band (at 2553 A) is a = 63 (a layer of ozone gas at N. T. P. of only .oo2" thickness reduces incident light to I/2 its value). High absorption in molecular bands is associated with diffusiveness of s t ructure and this in turn implies that the absorption will follow Beer's law and be independent of total pressure.
However, since the existence of a zero pressure effect in the ultraviolet is of pr imary importance for the application of the new method of measuring the height of the ozone, it seemed desirable to get fur ther experimental evidence.
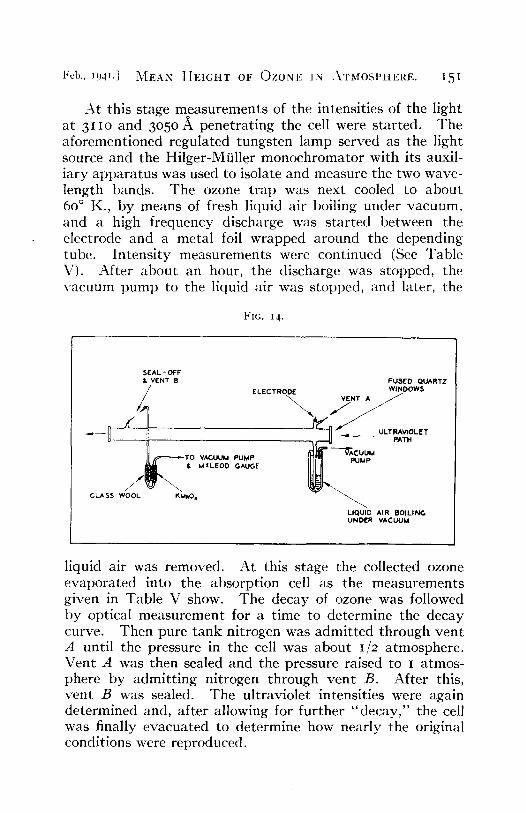
The glass absorption cell shown in Fig. 14 was used to get evidence. This cell was two inches in diameter and forty inches long. I t was fitted with two quartz windows, an a t tached pumping line with oxygen generator, two vents for admi t t ing nitrogen to raise the total pressure in the cell, and an electrode and depending glass tube for generating and collecting liquid ozone by Goldstein's me thodY
The regime of measurement was to evacuate the cell and clean it with a discharge. Then oxygen was generated by heating KMnO4 until about o.I5 cm. of mercury pressure was at tained. The cell was then sealed off at B in such a manner as to afford a capillary vent for later readmit t ing gas.
23 E. Goldstein, Ber. d. Deutsch. chem. Gesellsch., 36, 3042 (I9o3).
Feb., ~94~.1 M E A N H E I G H T OF OZONE 1N ~3tTMOSPHERE. I S I
At this stage measurements of the intensities of the light at 3ZlO and 3o5o fit penetrating the cell were started. The aforementioned regulated tungsten lamp served as the light source and the Hilger-Mtiller monochromator with its auxil- iary apparatus was used to isolate and measure the two wave- length bands. The ozone trap was next cooled to about 6o ° K., by means of fresh liquid air boiling under vacuum, and a high frequency discharge was started between the electrode and a metal foil wrapped around the depending tube. Intensity measurements were continued (See Table V). After about an hour, the discharge was stopped, the vacuum pump to the liquid air was stopped, and later, the
FIG. 14 .
SEAL - OFF & VENT B
] I ~ T O VACUUM PUMP / ~ \ ~ , & MSLEOD GAUGE
GLASS WOOL RrvlnO 4
FUSED QUARTZ (LECT~ODE WINDOWS
\ vENT A
fr'---acooM
LIQUID AIR BOILING UNDER VACUUM
liquid air was removed. At this stage the collected ozone evaporated into the absorption cell as the measurements given in Table V show. The decay of ozone was followed l)y optical measurement for a time to determine the decay curve. Then pure tank nitrogen was admitted through vent A until the pressure in the cell was about 1/2 atmosphere. Vent A was then sealed and the pressure raised to z atmos- phere by admitt ing ni t rogen through vent B. After this, vent B was sealed. The ultraviolet intensities were again determined and, after allowing for further "decay ," the cell was finally evacuated to determine how nearly the original conditions were reproduced.
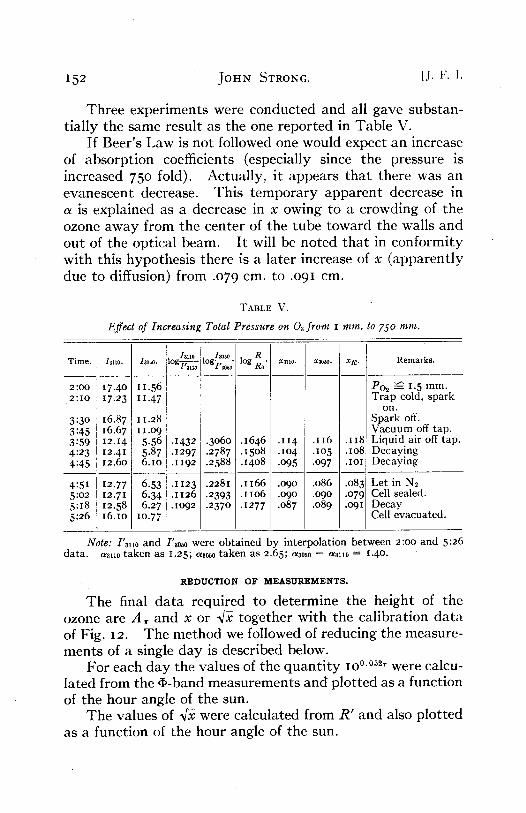
152 JOHN STRONG. [J. F. 1.
Three exper iments were conduc ted and all gave substan- t ially the same result as the one repor ted in Table V.
If Beer 's Law is not followed one would expect an increase of absorpt ion coefficients (especially since the pressure is increased 75o fold). Actually, it appears tha t there was an evanescent decrease. This t empora ry apparen t decrease in a is explained as a decrease in x owing to a crowding of the ozone a w a y from the center of the tube toward the walls and out of the optical beam. It will be noted tha t in conformi ty with this hypothes is there is a later increase of x (apparen t ly due to diffusion) from .o79 cm. to .o91 cm.
TABLE V.
Effect of Increasing Total Pressure on 03 from I ram. to 750 mm.
Time.
2 : 0 0 2 : 1 0
3:30 3:45 3:59 4:23 4:45
4:51 5:02 5:18 5:26
/air0.
17.4o 17.23
16.87 16.6 7 12.14 12.41 I2.6o
12.77 12.71 I2.58 16.IO
ho~o.
11.56 I 1 . 4 7
11.28 I I . o9 : 5.56 5.87 6.1o
6.53 6.34 6.27
1o.77
1~11o L°gv~u;
.1432
.1297
.1192
.1123
.1126
.lO92
I~0~0 lOgl,sos- ~ "
.3060
.2787
.2588
.2281
.2393
.2370
log --~"
.1646
.15o8
.14o8
.1166
.1IO6
.1277
XaII0.
.II 4
.lO4
.095
.090
.090
.o87
X ~ . X~.
.116 .118
.lO5 .lO8
.097 .IOI
.086 .083
.090 .079 • 089 .o9I
Remarks.
Po2 ----- 1.5 mm. Tr~.p cold, spark
on. Spark off. Vacuum off tap. Liquid air off tap. Decaying Decaying
Let in N2 Cell sealed. Decay Cell evacuated.
Note: 1'311o and I'3050 were obtained by interpolation between 2:0o and 5:26 data. eXSll0 taken as 1.25; cx35~0 taken as 2.65; cz3050 - a3110 = 1.4o.
R E D U C T I O N OF M E A S U R E M E N T S .
The final da ta required to determine the height of the ozone are A . and x or ~/2 together wi th the cal ibrat ion da ta of Fig. I2. The me thod we followed of reducing the measure- ments of a single day is described below.
For each day the values of the quan t i t y lO °'°53" were calcu- lated from the ~-band measurements and p lo t ted as a function of the hour angle of the sun.
The values of nix were calculated from R ' and also p lo t ted as a funct ion of the hour angle of the sun.
Feb., I94I.] MEAN HEIGHT OF OZONE IN ATMOSPHERE. 153
Likewise, values of da were plot ted as a function of the hour angle of the sun.
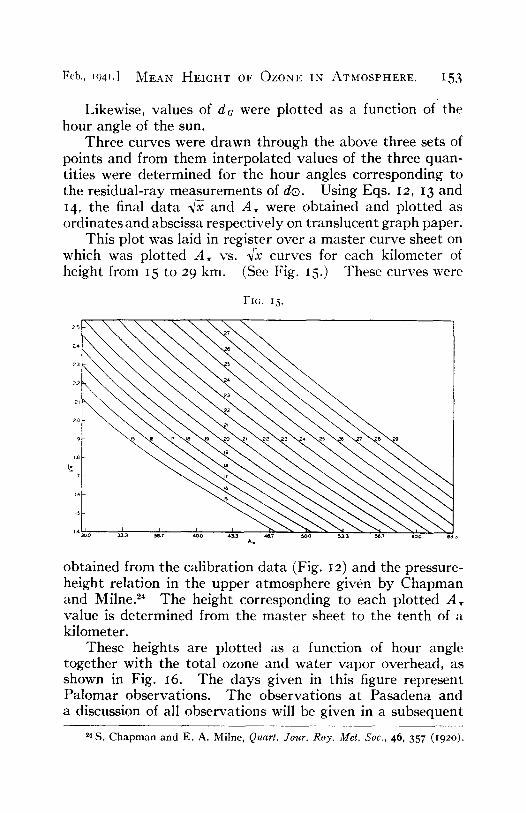
Three curves were drawn through the above three sets of points and from them interpolated values of the three quan- tities were determined for the hour angles corresponding to the residual-ray measurements of do. Using Eqs. I2, I3 and 14, the final data 4x and At were obtained and plot ted as ordinates and abscissa respectively on translucent graph paper.
This plot was laid in register over a master curve sheet on which was plot ted A , vs. 4)c curves for each kilometer of height from 15 to 29 km. (See Fig. I5.) These curves were
FIG. 15,
7
2~ 5
2 0
le
300 .~3,3 3e.7 40,0 ,,~X3 ,',e.7 500 5.33 ~ , 7 60.0 e ~ 3 A .
obtained from the calibration da ta (Fig. 12) and the pressure- height relation in the upper a tmosphere given by Chapman and Milne3 4 The height corresponding to each plot ted A , value is determined from the master sheet to the ten th of a kilometer.
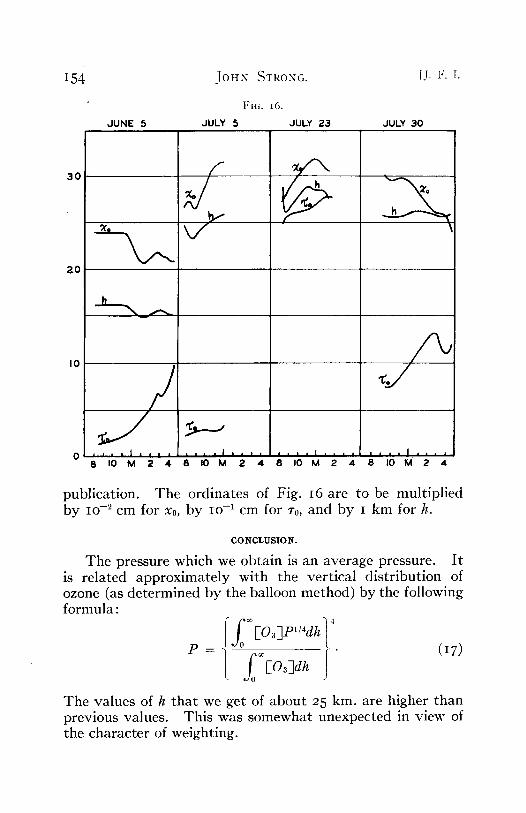
These heights are plot ted as a function of hour angle together with the total ozone and water vapor overhead, as shown in Fig. 16. The days given in this figure represent Palomar observations. The observations at Pasadena and a discussion of all observations will be given in a subsequent
24 S. Chapman and E. A. Milne, Quart. Jour. Roy. Met. Soc., 46, 357 (I92o).
I54
JUNE 5
JOHN STRONG. ]J. I:. I.
FIG. 16. JULY ,5 JULY 2 3 JULY 3 0
3 0
2 0
I0
A
0 , , , , l , , , , , , , . I 1 , , . , I
8 I0 M 2 4. 8 I0 M 2 4 8 I0 M 2 4 8 I0 M 2 4
publication. The ordinates of Fig. I6 are to be mult ipl ied b y IO -2 cm for x0, b y IO -1 cm for r0, and b y I km for h.
CONCLUSION.
The pressure which we obta in is an average pressure. I t i s related approx imate ly wi th the vert ical d is t r ibut ion of ozone (as de termined b y the balloon method) by the following formula:
P--~-l ~ J" (I7)
The values of h tha t we get of abou t 2 5 km. are higher than previous values. This was somewhat unexpected in view of the character of weighting.
Feb., i941.1 MEAN HEIGHT OF ()ZONE IN ATMOSPHERE. I55
The present method of measuring the height is subject to several uncertainties.
First, the effect of a total pressure obtained by means of an ozone rich mixture of oxygen is taken to be the same as the effect of a total pressure produced by stratosphere air in which the ozone concentration is very small.
Secondly, the effect of temperature is entirely neglected. The calibration experiments were conducted at about 27 ° C., whereas the ozone in the stratosphere exists at sub-zero tem- peratures. The cooling of ozone to a lower temperature will modify the distribution of intensity in the r-band.
A third possible source of error is in the determination of W0. This quanti ty is assumed to be constant from day to day, and it is believed the value 3 C. is not in error by more than IO per cent.
The pressure effect on the q~-band and the pressure effect of water absorption at 9.6 # have been ignored. This is justifiable only if these pressure effects are the same. If these pressure effects are the same, r represents a spectro- scopically significant thickness and that is exactly what we wish for substitution in the expression Io °'°~2~.
It should be noted that the method as applied here uses an apparatus which operates on a preselected wave-length band at 9.6 ~ and the method assumes constancy of the solar emission. There are several possibilities of improving the determination of A ~ and these are now being explored.
In conclusion I wish to acknowledge the helpful collabora- tion of Dr. Keniehi Watanabe who, in addition to assisting in the development of this method, has made measurements both at Pasadena and on Palomar Mountain over an extended period of time which are the subject of a forthcoming paper by him.
I wish t o acknowledge my gratitude to Mr. Marcus H. Brown and Mr. Raymond L. Chaplin for preparing the optical surfaces for the apparatus and for making the rocksalt windows.