Embed Size (px)
Citation preview
!I
1-
..
.’
I,.
II
~~.
I!-
:
I
I
I
1.F-
1,
1.
~ CRKI(ING,.
\
, SERIAL ,NO. SSC.57,, 1’
“1
,,,,,” Second ,,
‘,
PROGRESS RwoRT
(Proiect SR-1 18)
on
OF’ SIMPLE STRUCTURAL GEOMETRIES:
Investigation of Welded Ship Details,.’ ‘1.
,’). ‘1
,, ., ,.
!“, ! ‘ by,.. , ,,
S. T. Carpenter and R. ‘F. Linsenmeyer,, ’,’ : ,’‘1
1‘,
Under
m’R
,..
SWARTHMORE COLLEGE ‘“,’
,,’
Bureau of Ships Contract NObs-50250 “
,.
SHIP
(BuS~ps Proiect NS-731 -034).,,
,.”.
,’
j,
‘,
for,,
STRUCTURECOMMITTEE
Convened by
The Secretary .of the Treasury
,-
,’
,,
,-’
i’ttember,Age*cies—Sl@ Structure
Bureau of Ships; Dept. of Navy
Com”nsittee,.
‘,Military S-m Transportation Service, Dept. of Navy
United St&es Coast Guard, Treasury Dept.“1
Maritime Administration, Dept. o~ Commerce,,
American. Bureau of”$hipping . .
‘1 ‘, 1“ ,,
,, :’1“
,,,! JUNE 15, 1953
,,.’ ,,,,.,$
.,
Address Correspo&erwe
Secretary
Skip Structure Committee
U.S. Coast Guard Headquarters
Washington 25, b. C.
,,
I
,,-
To:
SHIP STRUCI’”LJRE COMMITTEE
MEMBER AGENCIES:
BURIAU OF SHIPS, DEPT. or NAVY
MILITARY SEA TRANSPORTATION SERVICE. Dwr. S5P NAVY
UNITED STATES COAST GUARD, TRGA6URY DWT.
MARITIME AD MINIWRATIOPJ. DEPT. OF GOMUCRCE
AMERICAN BUREAU OF 5HIPPIW
1 June 1953
ADDRESS CORRESPONDENCE TO:
SCCRCTARV
SHIP 5TRuc7u RE COMhII’tTItl
U. S. COAST GUARD HEADOUARTER9
WASHINGTON 28, D. C.
Dear Sir:
As part of its research program related tothe improvement of hull structures of ships, theShip Structure Committee is sponsoring an investi-gation on the “Cracking of Simple Structural Geome-tries” at Swarthmore College. Herewith is a copyof the Second Progress Report, SSC-57, of the inves-tigation entitled l’Crackingof Simple StructuralGeometries; Investigation of Welded Ship Detailsf’by S. T. Carpenter and R. F. Linsermeyer.
Any questions, commentsy criticism or othermatters pertaining to the Report should be addressedto the Secretary, Ship Structure Committee.
This Report is being distributed to thoseindividuals and agencies associated with and in-terested in the work of the Ship Structure Committee.
Yours sincerely,
K. K. COWART \Rear AdmiralT U. S. Coast GuardChairman, Ship Structure
Committee
Second
PROGRESS REPORT(Project SR-118)
on
CRACKING OF SIMPLE STRUCTURAL GEOMETRIES:
Investigation of’Welded Ship Details
by
S. T. Carpenter and R. F. Linsenmeyer
under
Department of the NavyBureau of””Ships
Contract lWbs-50250
with
Swarthmore College
Bureau of
SHIP
Ships Project IW-731-034-
for
STRUCTURE COMMITTEE
.— .—
TABLE OF CONTENTS
. .
Abstract . <). .
List of Figures
List of’Tables
Introduction . .
General ProgramType YW SpecimensType Z Specimens
Materials . . . .
Imtmmerlta,tim .
Test Data e ‘.e i)
Discuss3.onof TestUltimate Load .
R
0
0
0
*
e
n
0
a
0
0
0
0
.
.
e
0
Q
0
0
●
m
0
Results7 W Specimens
Energy to Maximum Load . .Energy to Fracture Load . .Transition Temperatures . .
●
☛
☛
●
9
●
●
0
*
●
●
●
●
●
0
Discussion of Test Results, Type Z SpecimensTypeZ-s . e a m m o * O*9
Flat l%r Stresses, TypeTypeZ-E’. ..o.O.Type z-13Me o “ c G . 0Trees Z-Cl and Z-C2 . .Tj@TypeType
Overall
summary
Z-D o 0 * o e. *
Z-E . . . . . . 0Z-T . . . . a . .
Discussicm9 Type Z
Statements . . . .
Bibliography . . . . . 0 0
Acknowledgments . . . . .
Z-3 eS*
Q*
*O
O*
-a
O-
00
0.7
Specimens
Appendix A - Tables of Basic Data
Appendix B!- Load Elongation Diagrams
*.●
0
0
*
0
0
a
●
*
*
*
*
0
●
e
●
o
*
●
●
●
0
●
o
●
●
*
*
0
0
0
a
o
0
*
0
●
0
Pagei
ii
iv
1
445
9
15
17
202022225
27273&36
28
~j
44
44
53
56
57
Appendix C - Specimens and Specimen Fabrication
ABSTRACT
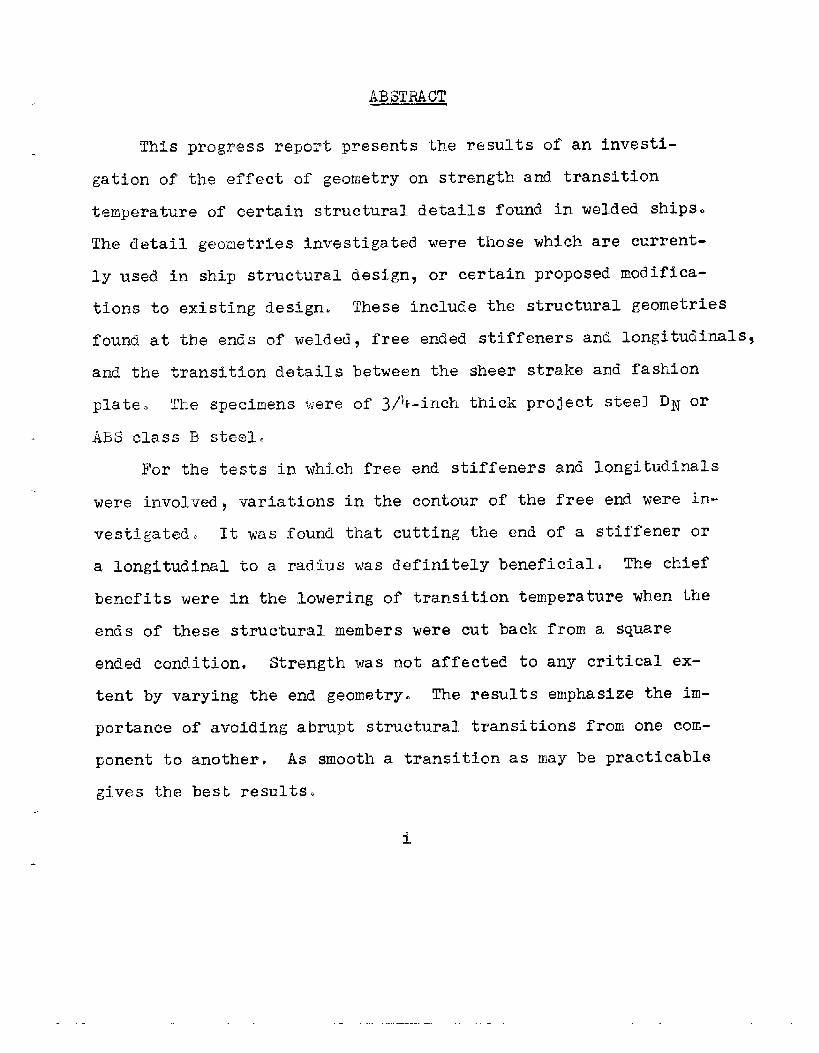
This progress report presents the results of an investi-
gation of the effect of geometry on strength and transition
temperature of certain structural details found in welded ships.
The detail geometries investigated were those which are current-
ly used in ship structural design, or certain proposed modifica-
tions to existing design. These include the structural geometries
found at the ends of welded, free ended stiffeners and longitudinal,
and the transition details between the sheer strake and fasb.ion
plate. The specimens were of S/\-inch thick project steel DN or
ABS class B ste~lo
For the tests in which free end stiffeners and Iongitudinals
were involved, variations in the contour of the free end were in-
vestigatedi It was found that cutting the end of a stiffener or
a longitudinal to a radius was definitely beneficial. The chief
benefits were in the lowering of transition temperature when the
ends of these structural members were cut back from a square
ended condition. Strength was not affected to any critical ex-
tent by varying the end geometry. The results emphasize the im-
portance of avoiding abrupt structural transitions from one com-
ponent to another, As smooth a transition as may be practicable
gives the best results.
LIST OF FIGURES
4 Side Ear Ed D~$ail va~~at~on~t DN st~@l L= ● ● ● ● 3
~ Side Bar End Detail Variations, ABS-B Steel . . . . 7
12 Plate J. A5S-B Steell Layout . . . .:. . . . . . . 14
13 Photograph of Clip Gages and Spool ExtensometerInstallation . * o ● o 0 ● ● s ● 00 ● o 16
14 Photograph of Specimen in Temperature ControlChamber. a . . a o 0 0 0 0 0 ~ Q o 0 0 0 18
lJ SR-4 Strain Gage Locations . . 0 0 *,Q,D 0 0 * ● m 19
16 Summary M~imum Loads and Energies vs. Temperaturesfor Types Y and W Specimens . * o 0 0 0 21
17 Scaling Pattern of Specimen XZ-3 . . . . . . . . . 28
18 Scaling Pattern of Specimen X2-B . . . . . . . . . 28
19 Scaling pattern of Specimen XZ-C1 . 0 0 a a . 0 ~ Q 28
20 Scaling pattern of specimen XZ-C2 . . . . . . . . . 28
21 Scaling Pattern of Specimen XZ-D . . . . . 0 0 * o 29
ii
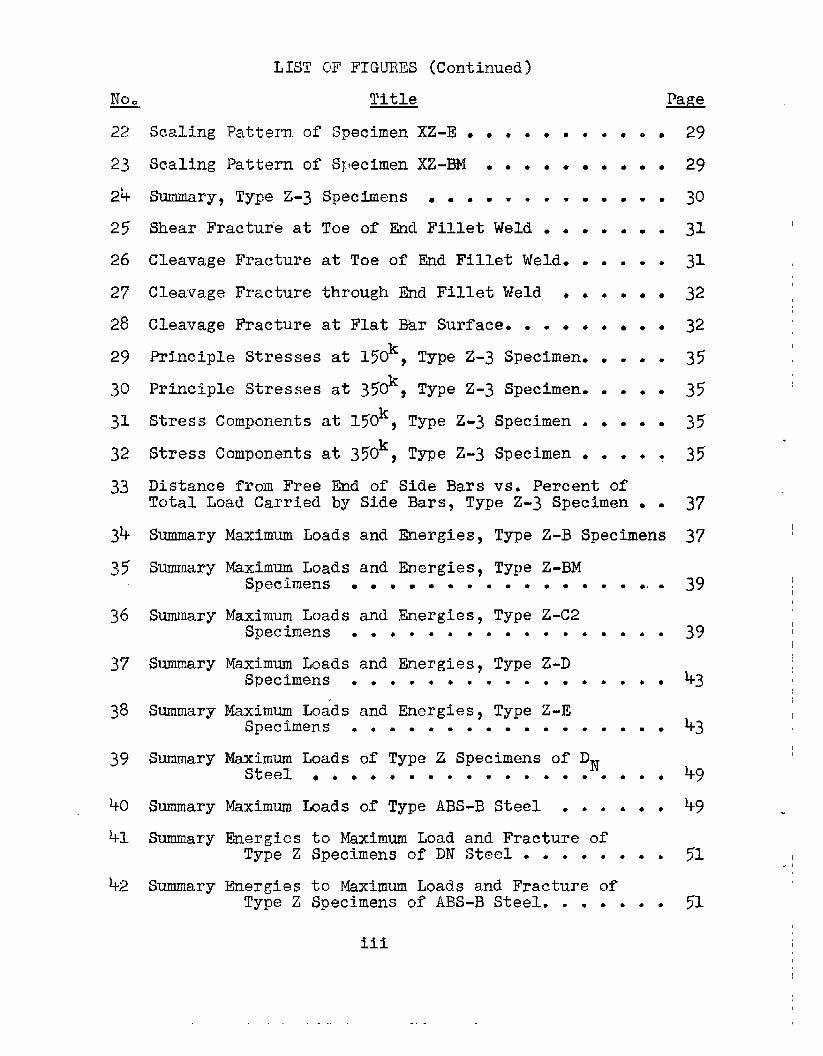
LIST OF FIGURES (Continued)
~ Title
22 Scaling Pattern,of Specimen XZ-E . . . . . . . . . .
23 Scaling Pattern of S}lecimenX2-EM . . . . . . . . .
2% Summary, Type Z-3 Specimens . . . . . . . . . . . .
2J Shear Fractur”eat Toe of End Fillet Weld . . . . . .
26 Cleavage Fracture at Toe of End Fillet Weld. . . . .
27 Cleavage Fracture through End Fillet Weld . . . . .
28 Cleavage Fracture at Flat Ear Surface. . . . . . . .
29 Principle Stresses at lsOkl Type Z-3 Specimen. . . .
SO Principle Stresses at 350k, Type Z-3 Specimen. . . .
31 Stress Components at lrOk, Type Z-3 Specimen . . . .
32 Stress Components at 350k, Type Z-3 Specimen . . . .
33 Distance from Free End of Side Bars vs. Percent ofTotal Load Carried by Side Bars3 Type Z-3 Specimen .
34 Summary
35 Summary
36 Summary
37 Summary
38 Summary
39 Summary
40 Summary
41 iWlmnaTY
%2 Summary
. 29
● 30
. 31
● 31
. 32
. 32
● 35
● 35
● 35
, 35
● 37
Maximum Loads and Energies, Type Z-B Specimens 37
Maximum Loads and Energies, Type Z-BMSpecimens . . . . . . . . . . . . . . . ... 39
Maximum Loads and Energies, Type Z-C2Specimens . . . . . . . . . . . . . . . . . 39
Maximum Loads and Energies, Type Z-DSpecimens . . . . . . . . . , . . . . . . . 43
Maximum Loads and Energies, Type Z-ESpecimens . . . . . . . . . . . . . . . . . 43
Maximum Loads of Type Z Specimens of DNSteel . . . . . . . . . . . . . . . . . . . 49
Maximum Loads of Type ABS-B Steel . . . . . . 49
EnergiesType Z
EnergiesType Z
to Maximum Load and Fracture ofSpecimens of DN Steel . . . . . . . . 51
to Maximum Loads and Fracture ofSpecimens of ABS-B Steel. . . . . . . 51
iii
-.
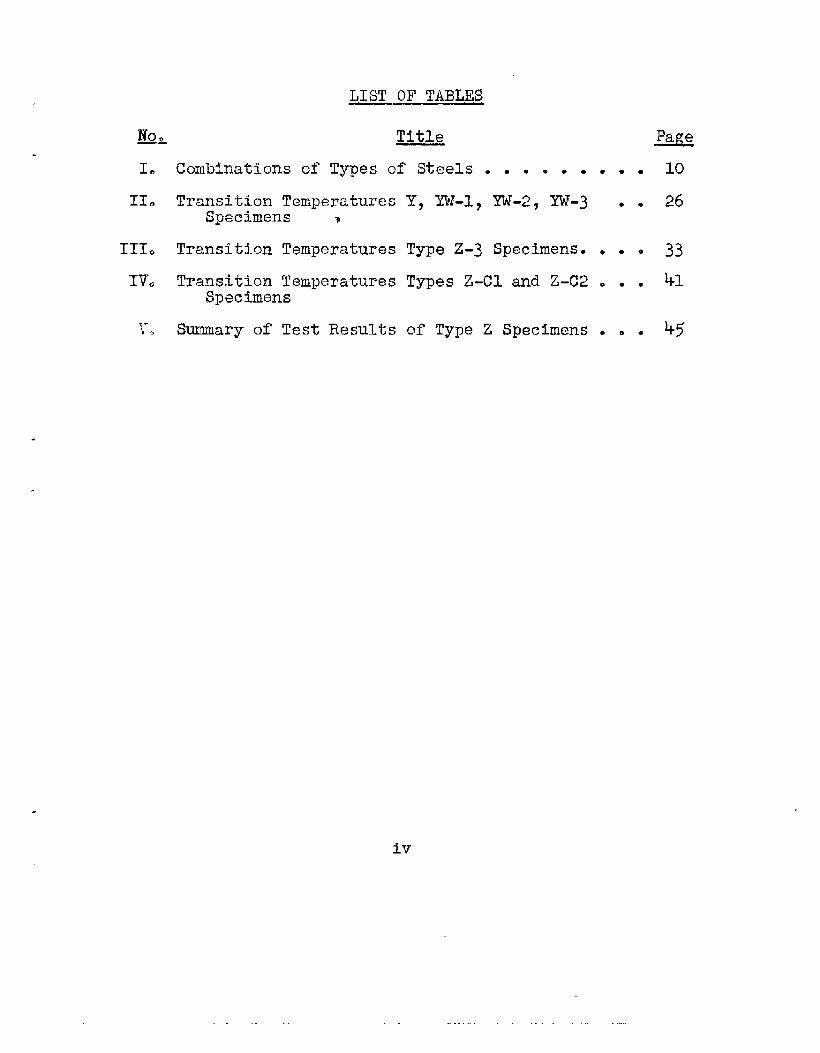
LIST OF TABLES
~ Title Page
1. Combinations of Types of’Steels . . . . . . . . . 10
11. Transition TemperaturesSpecimens ~
111. Transition Temperatures
IV. Transition TemperaturesSpecimens
l-. $mary of Test Results
Y7 YW-lj YW-2, YW-3 . . 26
Type Z-3 Specimens. . . . 33
Types Z-Cl and Z-C2 . . . 41
of Type Z Specimens . . . 45
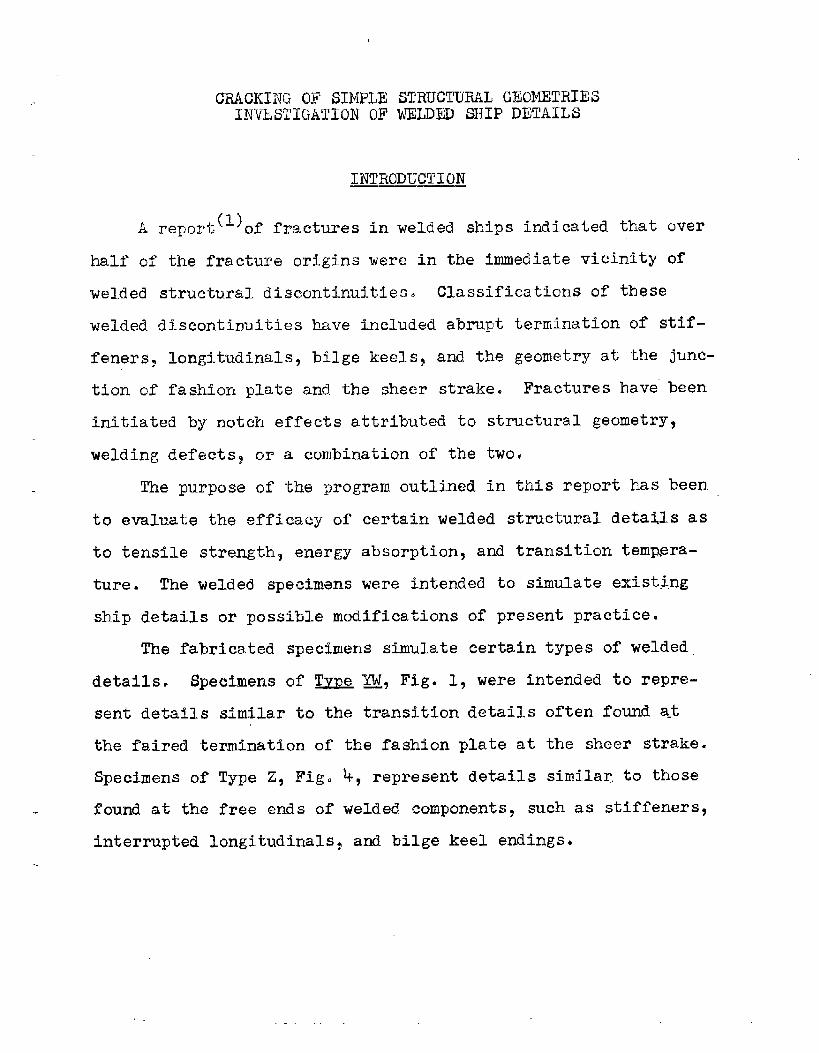
CRACKING OF SIMPLE STRUCTURAL GEOMETRIESINVESTIGATION OF WELDED SHIP DETAILS
INTRODUCTION
A Tepd+) of fractures in welded ships indicated that over
half of the fracture o~igins were in the immediate vicinity of
welded structural discontinuities. Classifications of these
welded discontinuities have included abrupt termination of stif-
feners~ Iongitudinals, bilge keelsl and the geomet~y at the junc-
tion of fashion plate and the sheer strake. Fractures have been
initiated by notch effects attributed to structural geonetryt
welding defects9 or a combination of the two,
The purpose of the program outlined in this report has been
to evaluate the efficacy of certain welded structural details as
to tensile strengthj energy absorption, and transition tem~era-
ture. The welded specimens were intended to simulate existing
ship details or possible modifications of present practice,
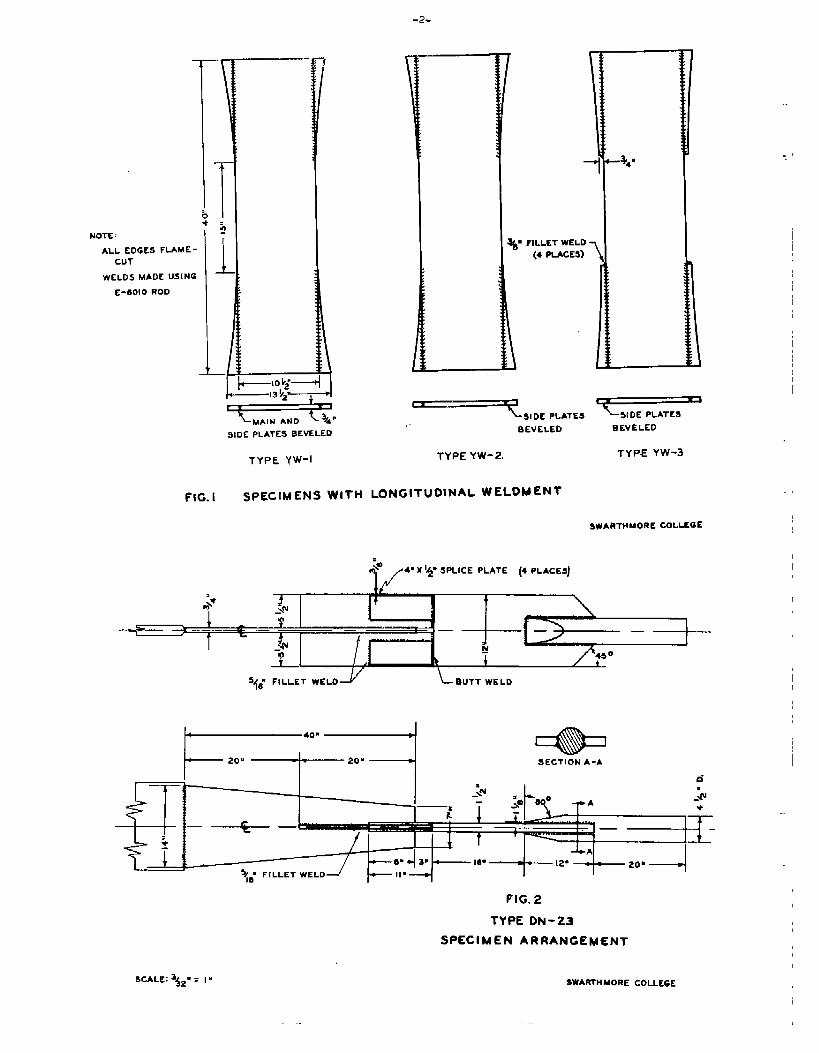
The fabricated specimens simulate certain types of welded,
details. Specimens of Tvne ~, Fig. 1, were intended to repre-
sent details similar to the transition details often found a.t
the faired termination of the fashion plate at the sheer strake.
Specimens of Type 23 Fig. 4, represent details similar,to those
found at the free ends of welded components, such as stiffeners,
interrupted Iongitudinalsa and bilge keel endings.
-2.
NOTE :
ALL EDGES FLAME.CUT
wELDS MADE USING
E-11010 ROD
—-
~ o k2”——13 !’2—
.
9 FILLET WELD(4-ACES)
SIDE PLATES BEVELED BEVELED
TYPE YW-I TYPE YW-2,
FIG. I SPECIMENS WITH LONGITUDINAL WELOMENT
BEVELED
TYPE YW-3
SWARTHBAORE COLLEGE
f’/+=- ‘LATEP ‘LA-$)
546”“LLET‘ELDJ L E4UTT WELD
Ft== SECTION A-A
FIG.2
TYPE DN - 23
SPECIMEN ARRANGEMENT
SwA~Ht40RE COLLEGE
.1
..
-3-
,4“X If SPLICE PMTE (4 PLACES)
‘*+ 4
L!
5{{ FILLET WELD -Y L ❑ uTT WELD
FIG. 3
NOTE! TYPE ABS-B-Z3ALL EDGES FLAME–CUT
WELDS MADE USING E–0010 RODSPECIMEN ARRANGEMENT
SCALE: ~z” = 1-, SWAmHMORE COLLEGE
5<&’ FILLET WELO
f— > 4 — J — ——
IITYPE ZCI
NOTE: ALL EDGES FLAME-CUT. .WELD5 MADE USING E- IJoIO ROO
FIG. 4 END18211
DETAIL vARIATIONS FOR TYPE
SPECIMENS
SWARTHMORE COLLEGE
-4-
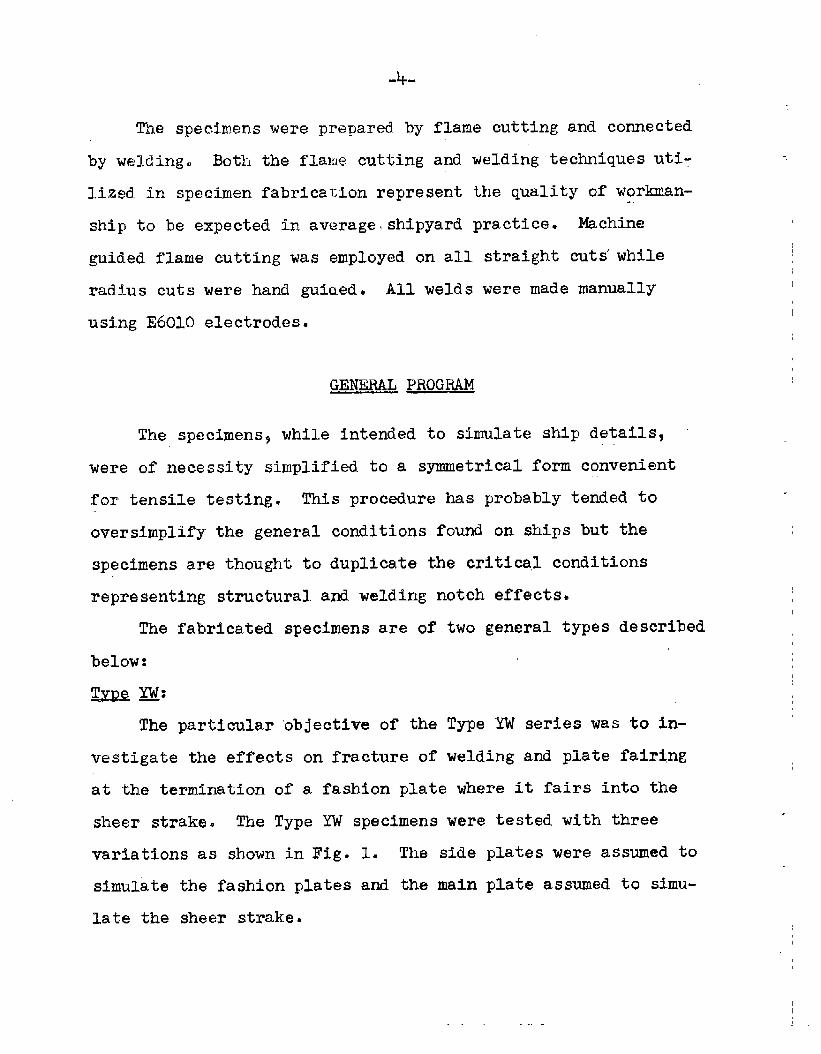
The specimens were prepared by
by welding. Both the flame cutting
flame cutting and connected
and
Iized in specimen fabrical:ionrepresent
ship to be expected in averageishipyard
welding techniques uti-
the quality of worlanan-
practice. Machine
guided flame cutting was employed cm all straight cuts’while
radius cuts were hand guiaed. All welds were made manually
using E601O electrodes.
GENERAL PROGRAM
The specimens9 while intended to simulate ship details,
were of necessity simplified to a symmetrical form convenient
for tensile testing. This procedure has probably tended to
oversimplify the general conditions found on ships but the
specimens are thought to duplicate the critical conditions
representing structural.and welding notch effectsz
The fabricated specimens are of two general types described
below:
- M:
The particular “objectiveof the Type YW series was to in-
vestigate the effects on fracture of welding and plate fairing
at the termination of a fashion plate where it fairs into the
sheer strake. The Type YW specimens were tested with three
variations as shown in Fig. 1. The side plates were assumed to
simulate the fashion plates and the main plate assumed to simu-
late the sheer strake.
Typa YW-i7 with both the side and main plates beveled in
prepara~ion for Welding$ represents the original specimen design.
Type YW-2~ where orfiythe side plates were beveled$ was a modi-
fication of Type YW-I and may be more representative ofstand.ard
practice. For both ‘typesthe wdds were made using run-off plates.
The side plates were faired by flame cutting after welding with
the cuts intersecting the butt w@lds. Thus$ tha plate and weld
metal at th faired terminations had heat effects of both welding
and flame cutting~ as well as tha surface roughness associated
with cutting.
Typ~ W-3 had the side plates beveled9 but instead of fairi~g
the side plates into the main plates a square 3/%hI. end offset
of sida plates from the main plate was established. A 3/8-in.
fillet weld was mada across this offset. This specimen was de-
signed to compare ‘theeffects of an abrupt transition of the side
and main plates with the f%ired transitions of Types Y’W-land W-2.
All specimens of the Type YW series were fabricated using
3/+-in. thick DN steel. The main plates of the specimens were
10~ in, wide and 40 in, long. Each of the four side plates was
3-h. wide and 12+ in. long before flame cutting to the final con-
tours as previously described and shown in Fig. 1. The specimens
were fabricated using E6010 welding rod.
ZXR9 2$
Tho purpose of’tests of Type Z specimens was to ascertain
the effects on fracture of certain details and geometry occurring
-6-
at the ends of abruptly t~rminated welded structural members.
Specimens in this categor:,veprasmt frm ended stiffeners, inter- ‘
rupted Iongitudinals, anclLilge keel em.dings. The scope of the
Type Z specimens was lim~mi to end variations found either to ba
actually ifiservice OT to certain variations which htld promism
of practical adaptability for modifying ships now in service or in
new designs.
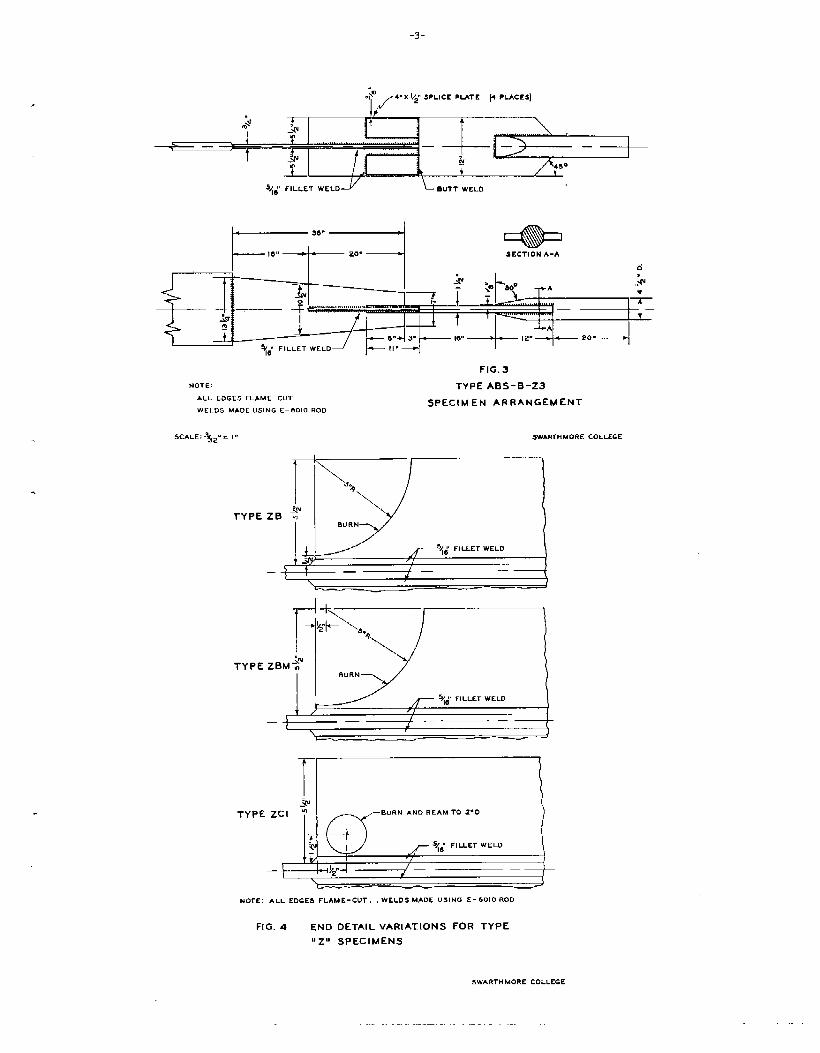
The ganeral design of tho Type Z specimens finally adopted is
given in FigsO 2 to 59 inclusive. Figs. 2 and 3 signify the typi-
cal specimen
specifically
and loading arrangements for all end variations but
show the flat bar md condition termed Type Z-3? wher~
the flat bars are square ended. The tensile loading was applied
through the flat bars at one end and through the main plates at the
other end. Tha tap~red 3/4-in* thick main
width and area to assur~ that a large part
through the flat bars would ba retained by
ends, thus p~oviding for a localization of
plate provided a reduced
of tho load introduced
ths bars until the frea
strain on the end weld.
A
detail
single specimen intended to simulate a bilge keel ending
was designed as shown in Fig. 6. The 3/4-in. main plate of
ABS-33steel was cut to the same geometry as the main plates of the
Type Z specimens as previously dascribedz The l/2-in. side barsl ~
howevery were replaced by structural Tee sections which w=~ modi-
fied as shown in Fig. 6 to meet the requirements of the specimen
design. The Tee sections were cut from a standard 12-in. I-beam
weighing 50 lbs. PEW ft. The resulting Tea sections had flange
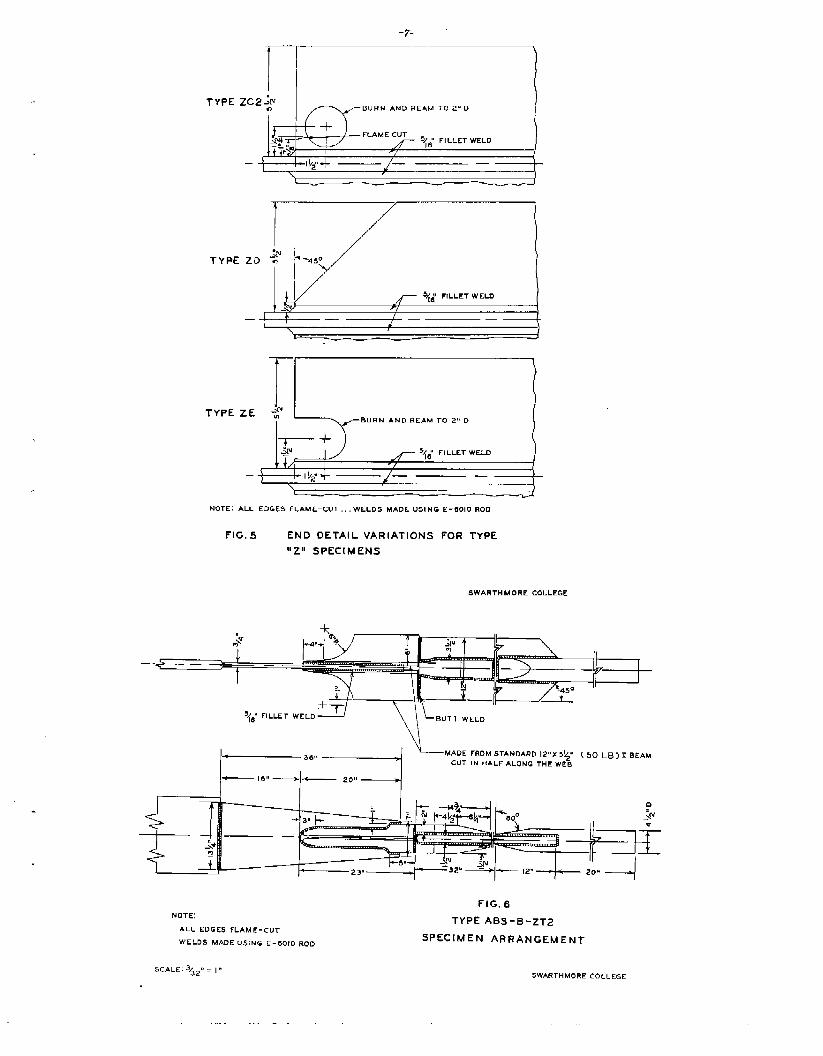
TTYPE ZE -~
BURN AND REAM TO 2,8 D
~+
—
NOTE: ALL EDGES FLAME–CUT ,., WELDS MADE USING E.6010 Ron
FIG. 5 END DETAIL vARIATIONS FOR TYPE
“Z” SPECIMENS
SWARTHMORE COLLEGE
+
L MADE FROM STANDARD 121,X5~ ( 513 LB) T BEAMCUT IN HALF ALoNG THE WEB
FIG.13NOTE:
TYPE ABS-E-ZT~ALL EDGEs rLAME-~uT
SPECIMEN ARRANGEMENTWELDS MADE U$,NG E-~o, o ROD
SCALE: 3~21~ = I ‘,SWART14MORE COLLEGE
-8-
widths of 5.477 in. and denths of 6 in.
Tees were reduced to 4 in., and the ends
radius.
The flange widths of the
were cut back on a ~-in.
Specimens of Type Z Frogra)nwere fabricated using a tapered
3/4-ine thick main plate of either ‘N PrQj@ct steel O; ABS grade B ~
steel. The flat bars were of l/2-in. thick DN project steel or D
project steel which was subsequently normalized. The tapered main
plates maintained a 1(1~-in.width at the intersection with the flat ~
bars and were 40 in. long for DN steel or 36 in. long for ABS-B
steel as shown in Figs. 2 and 3. The flat bars were J&in. wide
and 24$n. long$ with 20 in. of the total length being attached to
the main plates with j/16-in. fillet welds. The flat bars were re--,
inforced over an n-in. length to avoid the possibility of fracture
at the ends of the tapered main plates (see Figs. 2 and 3). 1-
The flat bars were cut to the end contours shown in Figs. 4
and J after the specimens had been fabricated. Specimens of type
Z-3 are those which had no further change of end contour and were
tested in the square ended conditi+n.
Specimens of Type ~ are th~se which had the flat bar end
contours flame cut to a ~-in. radius. (he modification, Type ZB,
placed the center of the radius
the other, Type ZBM, placed’the
the end of the flat bar. These
Specimms of Type ZC-1 are
hole flame cut in the flat bars
at the end of the flat bary while
center of the radius l/2-in. from .
end details are shown in Fig. 4.
those which had a 2-in. diameter “
near the juncture with the tapered
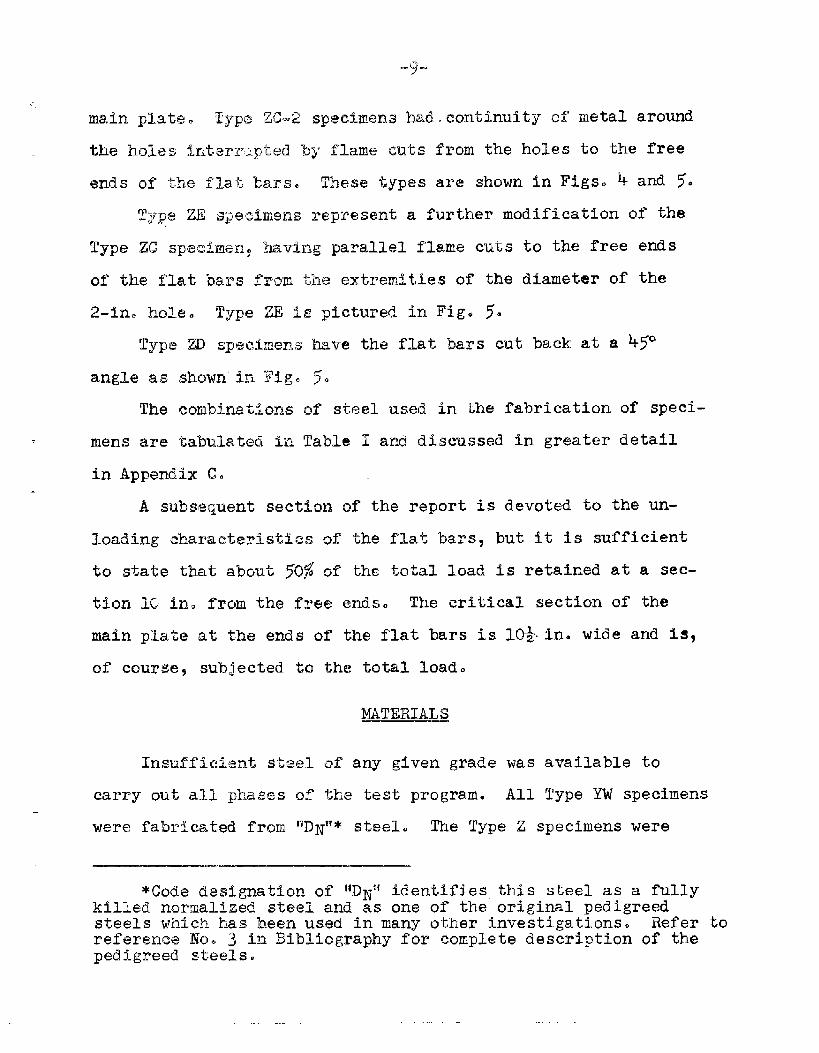
to the free ends
diameter of the
Type ~ sP@cimens have the flat bars cut back at & 45”’
angle as shown”in Fig. ~.
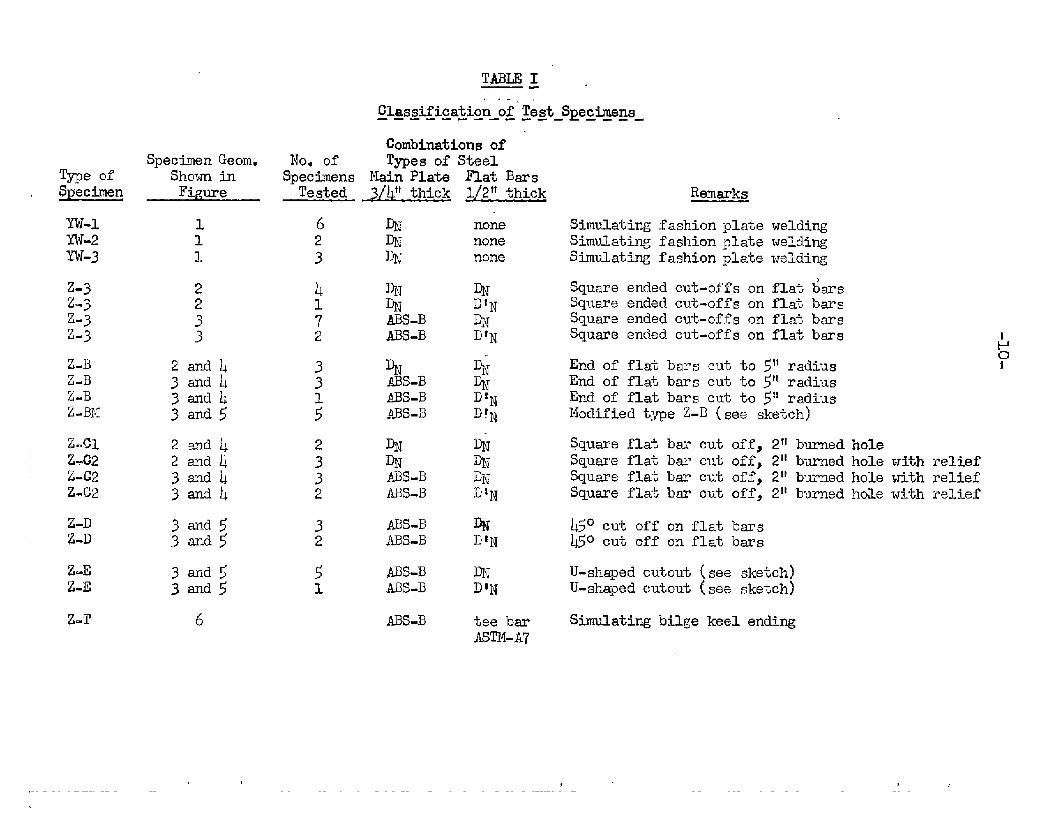
The combinations of steel used in the fabrication of speci-
mens are tabulatefiin Table I and discussed in greater detail
in Appendix C.
A subse~uent section of the report is devoted to the un-
loading characteristics of’the flat bars, but it is sufficient
to state that about ~OfiOF th~ I:otalload is retained at a sec-
tion K in. from the free cuds. The criiical section of the
main plate at the ends of the flat bars is 10~ in. wide and is3
of course~ subjected.to the total load.
MATERIALS
Insufficient ste~l of any given grade was available to
carry out all phas=s of the test program. All Type YW specimens
were fabricated from ‘BDN’**Steel. The Type Z specimens were
*Code designation of ‘~~~‘~identifies this steel as a fullykilled normalized steel and as one of the”original pedigreedsteels which has h.eenused in many other investigations. Refer torefererma No. 3 in Bibliography for complete description of thepedigreed steels.
TABLEI .—.,----
C_l~s5~icationof TestSpecimens----- ---- ---
TypeofSpecimen
w-lY-w?YW-3
Z-3Z-3Z-3Z-3
Z-BZ-EZ-BZ-BM
z-cl
Z.4%Z-+2X2Z-C2
2-DZ-D
Z-E2-E
Z-T
SpecimenGeorII.ShowninFigure
111
2233
3 and~sands
6
CombinationsofNo. Of Typesof SteelSpecimensMainPlate FlatBarsTested.3/4“ thick l/2tithick
6 DN none2 m none3 m none
3 % %3 A13S-13 %1 hBs-B 11~~5 MN-B D!lj
3 MS-B %2 ADS-B DIN
ABS-B tee.barASTM-A7
Remerks
SimulatingfashionplateSimulatingfashicmplateSimulatingfashionplate
Squareendedcut-offsonSquareendedcut-offsonSquareendedcut-offsonSquareendedcut-offson
weldingweldingwelding
flat6arsflatb~sflatbarsflatbars .1
Py
End of flatbarscutto ~’~radiusEnd of flatbarscutto 5“ radiusEnd of flatbarscutto 5!1radiusModifiedtypeZ-II(seesketch)
Squareflatbarcutoff>211burnedholeSquareflatbar cutoff,211burnedholewithrelielSquareflatbarcutoff$211burnedholewithreliefSquareflatbarcutoffs2~~btcmedholewithrelief
b~” CU_h off on flatbars450cutoffm flatbars
U-shapedcutout(seesketch)U-shapedcutout.(seesketch)
Simulatingbilgekeelending
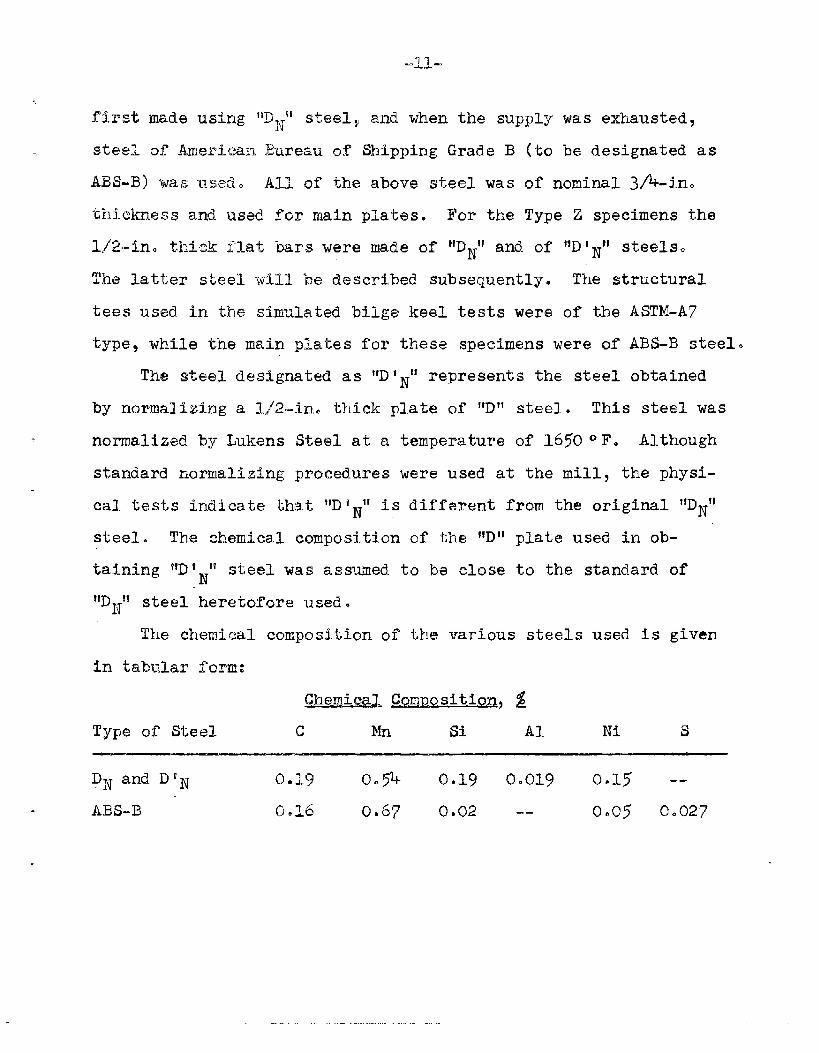
first
. steel
-u-’
made using fWN~~steely and when the supply was exhausted,
of Ameriean ,BureauQ,fShipping Grade B (to be designated as
ABS-B) was used. All or the above ste~l was of nominal 3/4-in.
thickness an,dused for main plates. For the Type Z specimens the
l/2-in. thick flat,bars were made of *’DN”and of “DIN’tsteels.
The latter steel will be d~scribed subsequently. The structural
tees used in the simulated ‘bilgekeel tests were of the ASTM-A7
“type,while the main plates for these specimens were of ABS-B steel.
The steel designated as ItDIN”represents the steel obtained
by normalizing a li2-in. thick plate of ‘~D1fsteel.. This steel was
normaliz~d by Lukens Ste&l at a temperature of 16S0 “F. Although
standard riormalizingprocedures were used at the mi119 the physi-
cal tests indicate that “D~N11iS different from the Original “DN”
steel. The chemical composition of the ~lD’lplate used in ob-
taining ‘~D’N’tsteel was assumed.to be close to the standard of
The cherniealcomposition of’the various steels used is given
in tabular forms
Ghemica~ C9Qml)ositi0% %
Type or steel c Itn Si Al Iii s
pN and DIN 0.19 0.J54 0.19 0.019 0.15 --
ABS-E 0.L6 0,67 0.02 -- 0.05 0.027
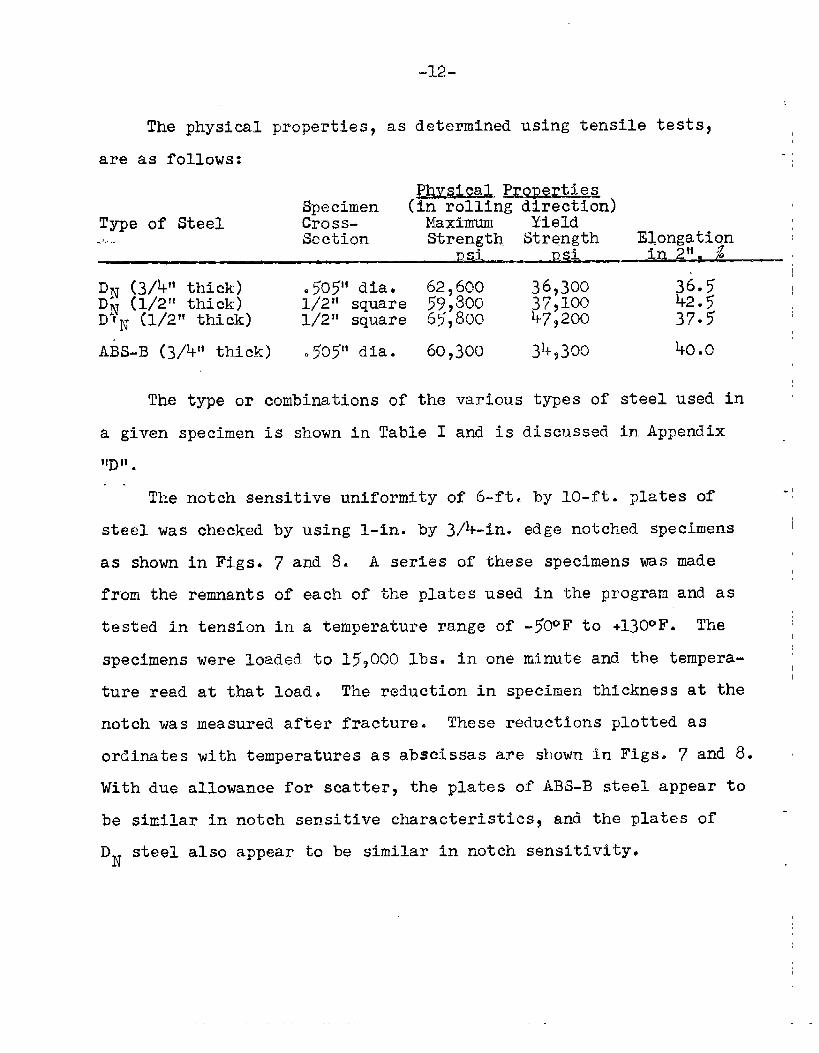
-12-
The physical properties, as determined using tensile tests~
are as follows:.!
~~ ~ro~ertiesSpecimen (i:a~~ng d~ir;;ion)
Type of Steel crass-.!,. Section Strength strqngth Elongation ~
wSi Dsi, in 2“. J
DN (3/4’1thick) .505” dia. IDN (1/2’1thick)
62,600 36,3oo $;.?l/2~’square 59,300 37,100
37:5 ~DIN (1/2” thick) 1/2” square 65,800 475200
AiS-B (3/4’1thick) .~Oj” dia. 60,300 3LF9300 40.0
The type or combinations of the various types of steel used in
a given specimen is shown in Table I and is discussed in APPendix .
11~11 .
. .
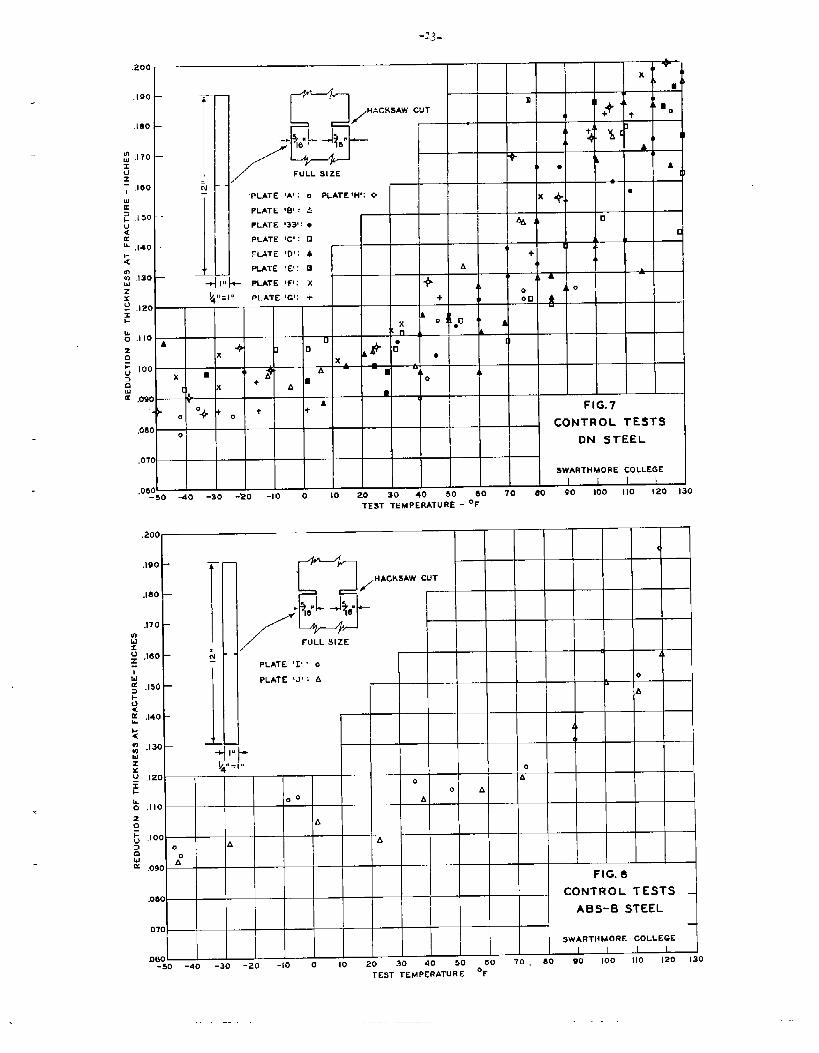
The notch sensitive uniformity of 6-ft. by 10-ft. plates of-1
steel was checked by using l-in. by 3/h-in. edge notched specimens I
as shown in Figs. 7 and 8. A series of these specimens was made
from the remnants of each of the plates used in the program and as
tested in tension in a temperature range of -50°F to +1300F. The
specimens were loaded to 159000 lbs. in one minute and.the tempera-
tmre read at that load. The reduction in specimen thickness at the
notch was measured after fracture. These reductions plotted as
ordinates with temperatures as abscissas are shown in Figs. 7 and 8.
With due allowance for scatter, the plates of ABS-B steel appear to
be similar in notch sensitive characteristics, and the plates of “
DN steel also appear to be similar in notch sensitivity.
.200
.100 –
.!80 —
.170 –u)Idx; .160 -
T
.150 —
.140 -
.13o—
.12 o—
,11o—
,10 o—0
,09o—AO
.0 ao —
.0 70 —
D C!o —-50 -4
/ FULL SIZE
PLATE ‘A’ : 0 PLATE ‘H’: +
PLATE IW : A~
i-
I“
,
FIG.7
CONTROL TESTS
DN STEEL
SWARTHMORE COLLEGE
c
B ~/HACKSAW CUT
+ ~dL+
/’” FULL SIZE
A
PLATE ‘I’ 0
PLATE ‘J’ : Ao
A
ii
<1
*
0 —
0 A
0 A~o A
—
A
A A
FIG. 6
CONTROL TESTS
AEIS-B STEEL
SWARTHMORE cOLLEGE
I I I I
-30 -20 -10 0 10 20 30 40 so 00 70 . ao 90 100 110 I 20 130
TE$T TEMPERATURE ‘F
*
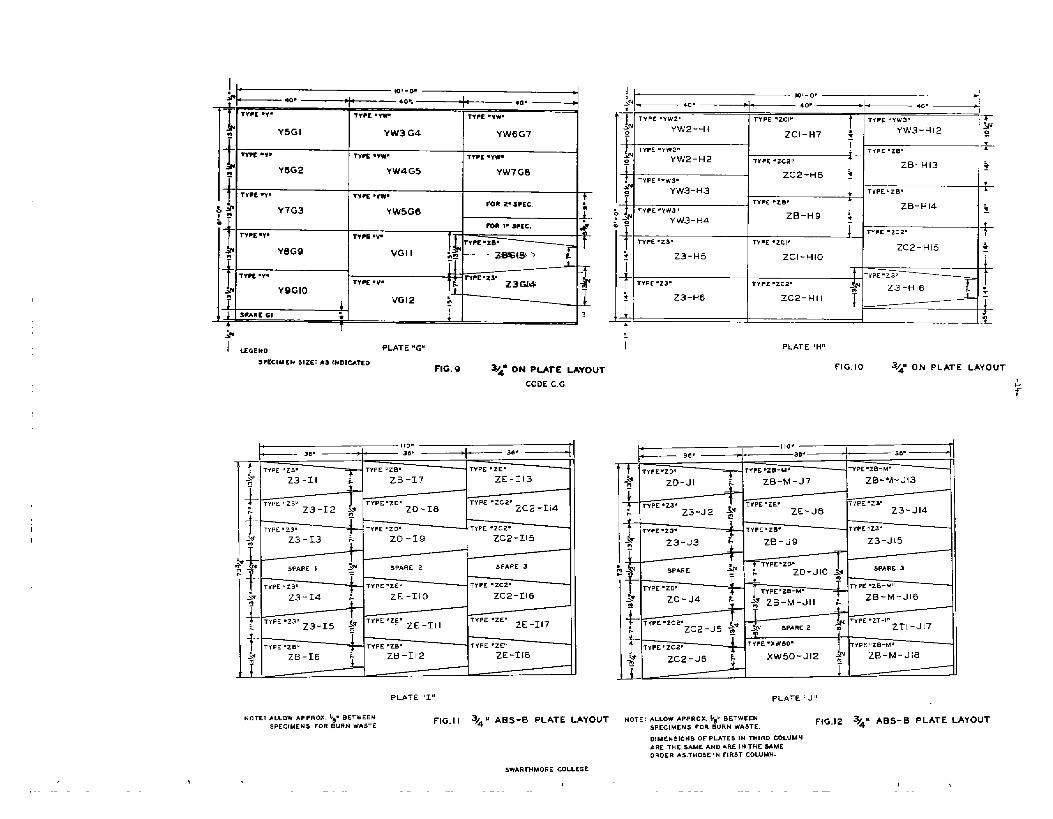
~’
PLATE ‘G”
FIG. Q 3/4” ON PLATE LAYOUT
CODEC.G,
b .,
,.
~
PLATE “I”
NOTE: ALLOW AFFRO?.. & BETWEEU FIG.11 3,4 uSPEC1MEN5 FOR BURN WASTE
_,w _
$ii
.ETYPE .yw3~
2* YW3-H4
TYPE .Z3”
% Z3 -!+5
TYPE .Z.3.
~ Z3-h’6
1t
TYPE UZ B.
rYPE .Zn.ZB-H14 +
ZB-H9 i 1
I TYPE.ZC.?- -bTYPE.ZCI,ZC2-H15
Zcl-1-llo+
TYPE-z3~TYPE .zc2~ G ~ Z3-H16 L :
ZC2-H II1 1
3
PLATE ‘,Hrl
FIG.10 3/4” 0!4 PLATE LAYOUT
< 410.4 36, 38. 2-6.
i - – “
TYPE ‘ZDU rvPc ‘ZB-MP TYPE%W-M.
-:ZO-JI L ZB-M-J7 za-M-Ji3
iTYPE ’23. TTPE.ZE, TYPE. z3~
: Z3-J2 ~ ZE-J8 Z3-J14
TYPE .23. TYPE ‘ZW TrPc .23”
_\ Z3-J3 & ZB-J9n
Z3-J[5
Tv’PE.ZD.~-
}
SPARE & : ZD-JIO ;*SPARE 3
--
L -
TYPE .ZD1 TYPE ‘ZB-M.TYPE ,ZB-M -
:\* ZO-J4 L \* 2B-M-J IIZB-M-J16
-~ L
+ TYpE.zc2.zc2_J5 p >@ TYPE .ZT-1”
SPARE 2 m ZTI-J17
1-TTPE ‘ZC2V TYPE .XW50. TYPE<,ZO-MU
-.* ZC2-J6 ~ XW50-J12 ~ ZB-M-J185
J
PLATE “J”
ABS-B PLATE LAYOUT NOTE : ALLOW APPROX. & BETw EEN FtG.12 3&” ABSSPECIMENS FOR BURN wA5TE.
-B PLATE LAYOUT
D!MEUSIONS OF PLATES IN THIRD COLUMNARC THE 5AME ANDA REIU THE SAMEoRDER AS THOSE!N FIR5T COLUMN.
SWARTHMORE COLLEGE
1
should be as follows: tensile
sq. in.; yield point--* ,000
-on in 2.in●--22 to 30$.
measured with increasing
spool type extensometerq
this purpose with the
The ~~~mgatian of each specimen w’as
load over the ent~re specimen length. A
sensitive to O.00~ in..,was employed for
terminal p~~intsof the extensometer located on the pulling beads.
Since the pulling heads had a much greater cross-sectional area
than the specimen~ the elongations registered on the extensaneter
entirety to
series were
gage over a
the elongation of the specimen.
further instrumented by using
16-in. gage length spanning
were attributed in their
tip~otaensof the YW
the Swarthmore SRJ+ clip
the reduced width portion of the specimen, Four such gages were
attached cm one face of the plate. Fig. 13 is a photograph of a
typical installation of l%ja,rthmoreclip gages and spool extensonet+e~.
The specimens wGre surrounded.by an insulated tampe~ature con-
trol chanber wh~.cbhad double glazed plexiglass windws. The spec-
imn y:a~f~e= to e~~rigate~~~th~ut~~in.g rest+rainkd by the chamber.
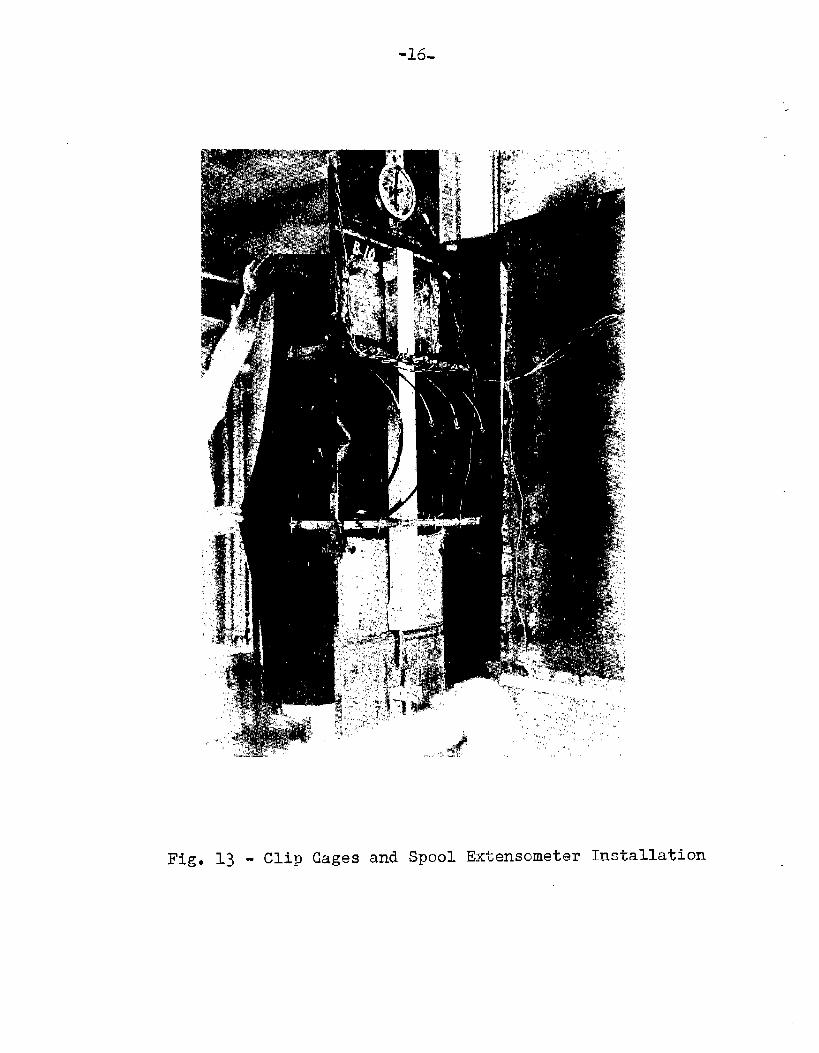
Fig, 13 - Clip Gages and Spool Exten~cmeter In~tallati~n
The Specimms WG37P waled. to the testing tempemtme by air which
was circulatd through a closed system consisting of the chamber?
insulated h.os=emnectionsq and an insulated box containing dry
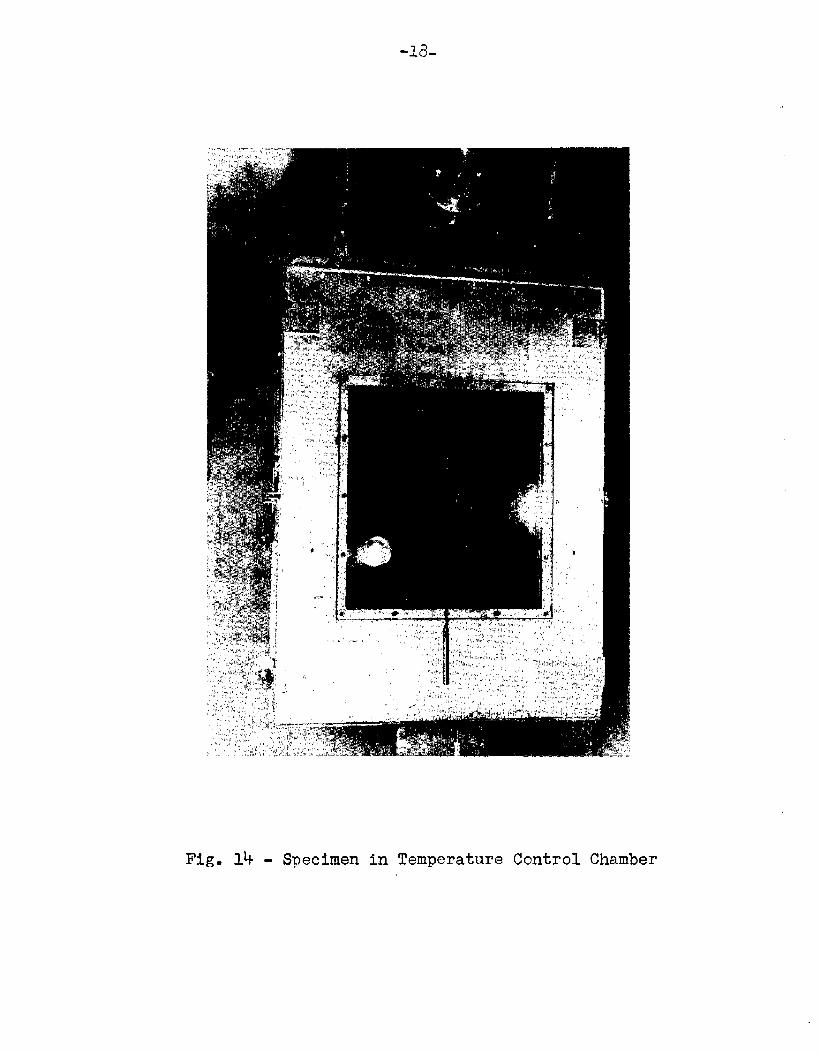
ice. The specimen temperature at the beginning of each test was
maintained until fracture. Fig. ,14i’sa photog~aph of a Type Z,n
specimen in the temperature control chamber.
The tcxupere.turesof the specimens were determi~ed by the use
of copper-constantan thermocouples inserted into holes drilled
with a ?%0 drill l/8.in. into the plate and were located in the
$min plate and the flat bars. The thermocouples were insulated
from the air in the chamber by a plastic asphaltic cement.
The specimens were tes{’ed.in”a600qO00-lb,‘capacityBaldwin
%uthwark testing machine.
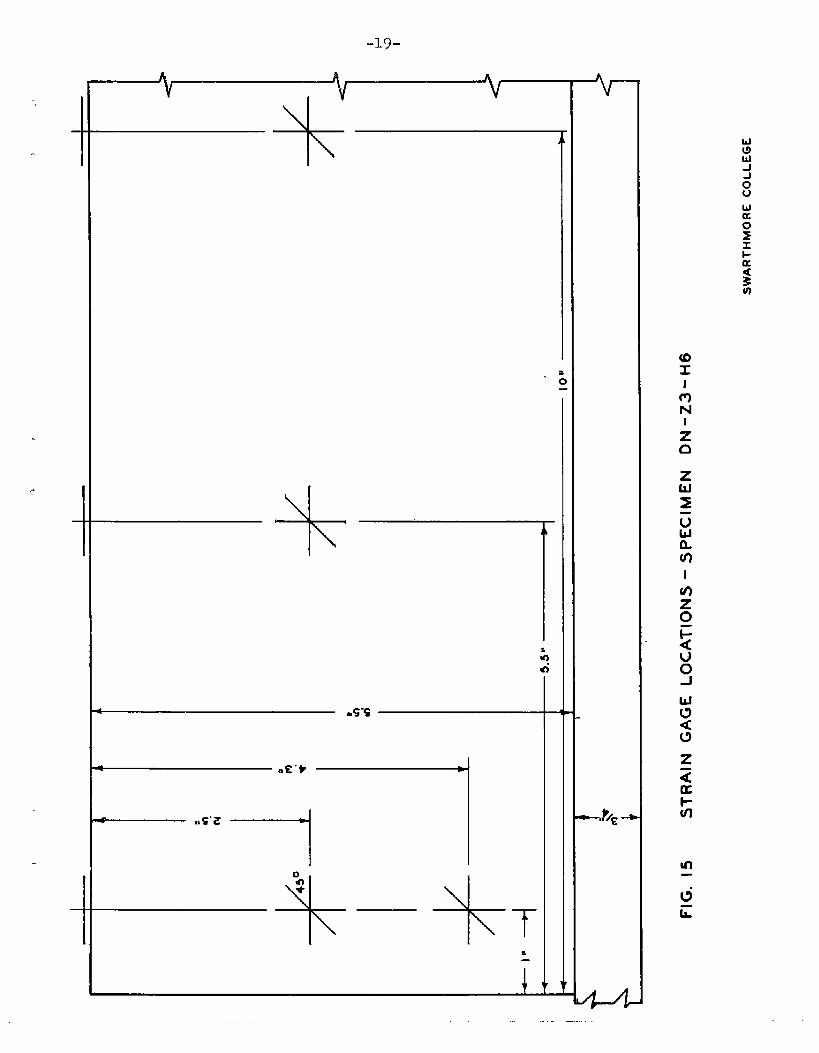
The first specimen of Type Z-3 was tested with SR-4 electric
strain gages cemented to one flat bar to determine the elastic
stress distribution within the plate and the direction of the ‘
principal stresses. The gages were located in the positions shown
in Fig. Ij.
TEST DATA— ——
The tesk data are recorded in the tables of Appendix A. The
data include test temperatures, maximum and fracture Ioadsq char-
acter of”~raet<ures~total specimen elongation.sat maximum and
fracture loads$ and.energy absorption to maximum and fracture loads.
-L3-
Fig. 14 - Specimen in Temperature Ccntrol Chamber
..
I
1T
:
.-
m
-20-
The energies to maximum and fracture loads were computed from
the areas under the load vs. elongation curves shown in Appendix B. ,~
The character of the fracture is given in terms of the per-1
centage of the fracture surface exhibiting a shear type of frac-
ture. The remainder of the fracture
type● The shear type Qf fracture is
grained appearance with all fracture
surface was of the cleavage
characterized by a silky~ fineI
surfaces being inclined at ap-
proximately ~~~ to the plane of the plate.
.DISCUSSION OF TEST RESULTS
TYPE YW~P~~NS——
Ultimate Load
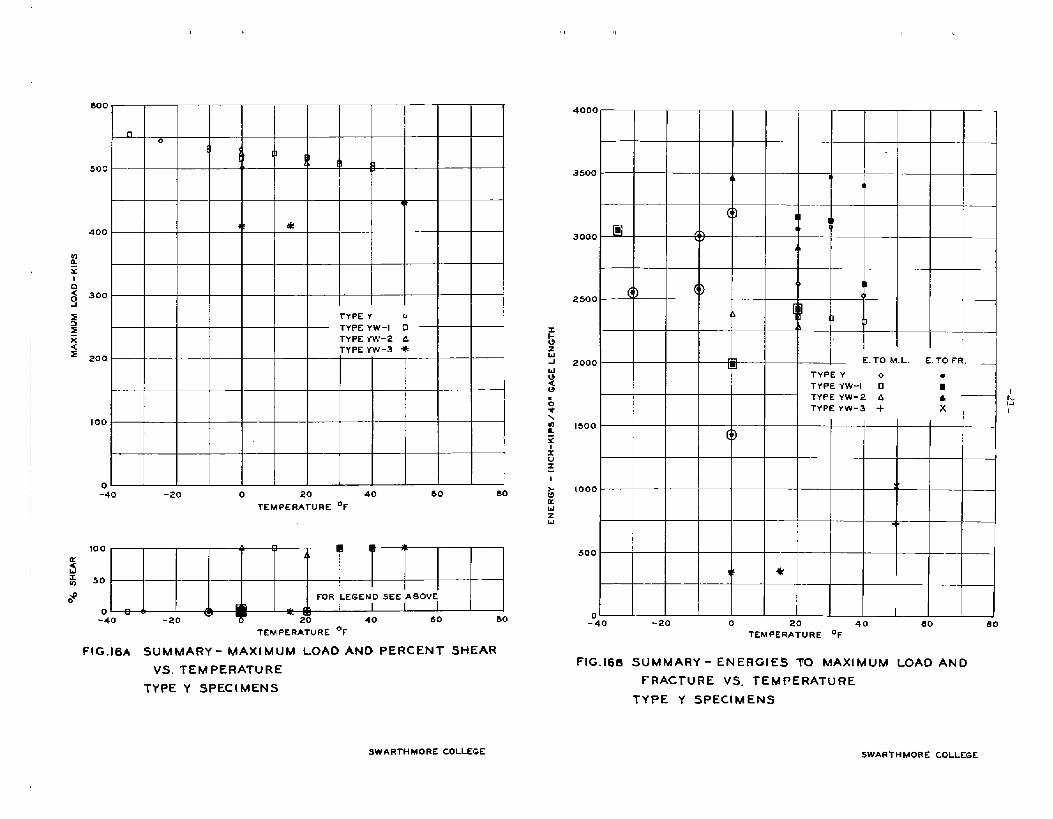
Welded specimens of Types Y_W-land YW-2 had the same external
geometry as the specimens of the unwelded Type Y series previously
reported.(2) The r~sults of the Type Y series, unwelded and un-
notched specimens, were used as a base of comparison for previously
made edge notched specimens$ and hence are useful here for com-
parative purposes. The results for Type Y are plotted on Figs. 16A
and 16B* The maxiraumloads for specimens of the Types YW-1 and YW-2
series appear to be directly comparable to the maximum loads ex-
hibited by specimens of the Type Y series at the same test tempera-
tures. The maximum tensile loads for speoimens of each of these
three series are plotted in Fig. 16. Plate beveling and longitudi-
nal welding had little effect on strength when compared with the
Type Y series which had no weldment.
h ,, ‘,
600
n0
I~,
1
500I I /, ,
~k
Jf400
*
mgx1
a: ~~o
2
~ TYPE Y o
z TYPE YW-I U
% TYPE YVJ-2 A! < TYPE YV.I-3 *
z 200
!
1
1
I 00
II
o-40 -20 0 20 40 60 80
TEMPERATURE *F
100
~ “ ‘]--m 50
$ FOR LEGEND SEE ABOVE
*
-040v
m i I
-20 20 40 60 80
TEMPERATURE ‘F
FIG.16A SUMMARY- MAXIMUM LOAD AND PERCENT’ SHEAR
VS. TEMPERATURE
TYPE Y SPECIMENS
4000
35004k
h ‘
@ m1
~3000 ch ?
G)2s00 1 i
di1
I1-0zuJ 2000 r n E.TO M.L.
@‘ 4’
E. TOFR. _wo TYPE Y 0<
●
mTYPE YW-I ❑ I
*0
TYPE YW-2 A A
*;:
TYPE YW-3 +\
x2 1500
z
&uz
1
z1000
muzu +“
500
~E *
-040 -20 0 20 40 60 00TEMPERATURE ‘F
FIG.16B SUMMARY- ENERGIES TO MAXIMUM LOAD AND
FRACTURE VS. TEMPERATURE
TYPE Y SPECIMENS
SWARTHMORE COLLEGE SWARTHMORC COLLEGE
-22-
$pecimens of the Y’W-land YW-2 series exhibited the trend
shown by the Type Y
mum loads generally
An exception to the
series with respect to maximum loads. Maxi-
increased as test temperatures’werelowered.
gmeral increase in maximum load values for
the Type YW-1 specimens appears to occur around ths transition
temperature where a lower maximum load was noted than at higher
and lower temperatures. The
with decreasing temperatures
tensile coupons;(21 however7
tendency toward increasing loads
was noted in 3/k-in. square unnotched
the 3/%-in. square coupons did not
exhibit a drop off in load value, nor did they show a transition
from shear to cleavage modes of fracture in the range of test
temperatures.
The 5\16-irL.fillet welds and the S/h-in. offsets at the ends
of the side platas of the YW-3 specimens had decidedly detrimental
effects 011 strength. Two specimens tested at O°F and +15°F ex-
hibited maximum loads which were approximately 100 kips lower than
the YW-1 and YW-2 specimens tested at about the same temperatures.
The effects of plate beveling, which established the cross-
sectional form of the longitudinal weldmentz were apparently of
little significance in limiting values of maximum load. Abrupt
changes in external specimen geometry, however, combined with
fillet welds at the point of offset, appeared to be more important
factors in limiting the maximum load.
.,
~~~~ g“~ “t@ k’IMimuqQ22CL
Relationshil:sbetween energy to maximum loadt measured over
the S~~CiKlfX.i length of k-in. ~ and test temperature for specimens
CJfTypes Y’ii-ly“YW-27and YW-~ are shown in Fig. 16B. The results
for unwelded speciw~ms of Type Y$(2) having the same geometry as
Types 33/-1and YW-2:,are also plotted.in Fig. 16B. The scatter
of the limited data makes the inte~pretation of the results diffi-
cult.
The energy to maximum load for welded specimens of Types 3%--1
and YW-2 generally have slig”htlylower values at most test tempera-
tures than the energies reported for unwelded Type Y. The exceptions
occur a,t0“ J?and at -35°F, where a single specimen of Type W-l
with a cleavage fracture, had.an energy to maximum load which was
higher than that for any other specimen. The phenomenon of high
energy values at low temperatures accompanied by cleavage fracture
has previous~y been reported by the investigators.‘2] A close
grouping of the energy val.u~sfor the three geometrically similar
types occurs at the approxiuata transition temperature +20QF, and
the great~st dispersion of er~ergyvalues occurs just below the
transi-tiontempera-burezone at 00F.
Due to limited tests of Type W-2, no conclusive comparisons
can be made with Type 13&l. It appears9 h.oweverythat the effects
of welding and plate beveling reduces the energy absorbing capacity
by only a small amount when results are compared with unwelded
specimens of the same external geometry.
The three specmens of Type YW-3, with a ~/16-in. fillet
weld and a 3/h-in. offset at the end of the side platesy had
values of energy to maximum load which fell far below the energy
values for the Types YW-1, YW-29 and Y at the same test tempera-
tures. The energy absorbing capacity of specimens of Type X%3
appears to be about X3z of that of YW-1 and W-2.
It is therefore apparent$ given a free choice of details?
that an abrupt change in geometry as exemplified by the details
of Type YW-3 should be avoided. Type YW-3 is definitely inferior
in both load and energy capacity.
Ener~y ~ Fracture
A graphical representation of values of energy to fracture
of specimens of Types YW-19 YW-23
Energy to fracture values for the
tally similar series of Type Y is
Values of energy to fracture
and YT?-3is given in Fig. 16B.
previously reported geometri-
also shown.I
must be viewed considering the
type of fracture, i.e., shear
always attain a higher energy
maximum load! while specimens
sumed to have the same energy
the shear type of fracture is
exemplifies this feature.
or cleavage. Specimens in shear
value at fracture load than that at
failing in complete cleavage are as-
as at maximum load. The tenacity of ~
well known$ and energy to fracture
For Types YW13 YW-2~ and Y9 it would appear that the energies “
to fracture are roughly equivalent at all test temperatures. In
contrast9 specimens “cfType YW-3 exhibited energies to fracture
..2~-
“q~ rl~ the mergy “valuesfor speclmenS Ofwt~ichwere less tl-a:”j.<~,~.
~ ‘YT1-1and Yki-2.Type. As was the case with maximum load and
ellerg’yto maximum loadl external specimen gecmetrj~again seens to
be the more important parameter ir~limiting the amount of energy
absorbed tm fracture.
Transition -eratua~r
The criteria used to evaluate transition temperature for
specimms of the YW series were based on fracture appearance,
energy to ~axiD=uBIaad.,and energy to fractu”eo The estimated
transition temperatu~ws for each of the criteria a~e shown in
Table 11.
The transition temperatures as represented by fracture ap-
pearance are the temperatures taken fron sketched curves (not
shown) of per cent shear vs. temperature based on data as shown
in Fig. 16 and represent the temperature at which a “50~shear
mum
vs.
Transition temperatures based on values of energy to maxi-
Ioad or to fracture were taken from sketched curves of energies
ten~eratums based on da.tashown in Figs. 16A and.16EI. Transi-
tion tempsratuu~s represant the temperatures at the points on the
.sketch=dcurves where the mdinates approximately represented the
average of high and low values of energy.
The two t~sts of specinens of Type YW-2 at OaF and.+20QF
indicated IOC)Zstmar fractures thus making it impossible to
evaluate the transition temperatru% for Type YW-2 except to state
..~~,-
that it is lower than OCF, ‘ypeYW-1 sp~cim~ns indicated a transi-=’
tian temperature at about ,V~”F based on fracture appearance and
+lO°F based on energy.
The
buted to
the butt
the main
Otiy the
created.
the weld
fracture
higher transitim csmperature for TlypeYW-1 may be attri-
a difference in severity of the weld notch at the end of
weld. For Type YW-1 the part of the butt weld lying in
plate groove ends abruptly~ whereas for Type YW-2 where
side plate was beveled a less severe weld notch was
The fracture in all Ill-lspecimens initiated through
termination; but for the two specimens of Type YW-2$
occurred above the termination for the test at +20Q)Fand
in the main plate, several inches below the termination for the
test at O“F. This change in location of fracture$ coupled with
the fact that both fractures were of the shear typej lends confir-
mation to the lesser severity of localized effects for 3%T-2.
Specimens of Type YW-~7 due to the increased severity of
localized effects at the offset$ show a higher transition temper-
ature than for YW-1 or YW..2. With only three t&sts of Type YW-3~
it is possible to establish only an approximate value of the
transition temperature at about 35°F.
TABLE 11.
Transition TemperatumsType YW and Y Specimens
DN Steel
Transition Temperature, OFType of Based on Based on Based onS~ecimen Fracture A~~earance Ener~Y to max. -1gad Energy to Fracture
2!jQ indeterwinate indeterminateYw:l 250 100 lljoYW-2 lower than 0° lower than 0° lower than OaYW-3 35’ indeterminate 35“
I
I
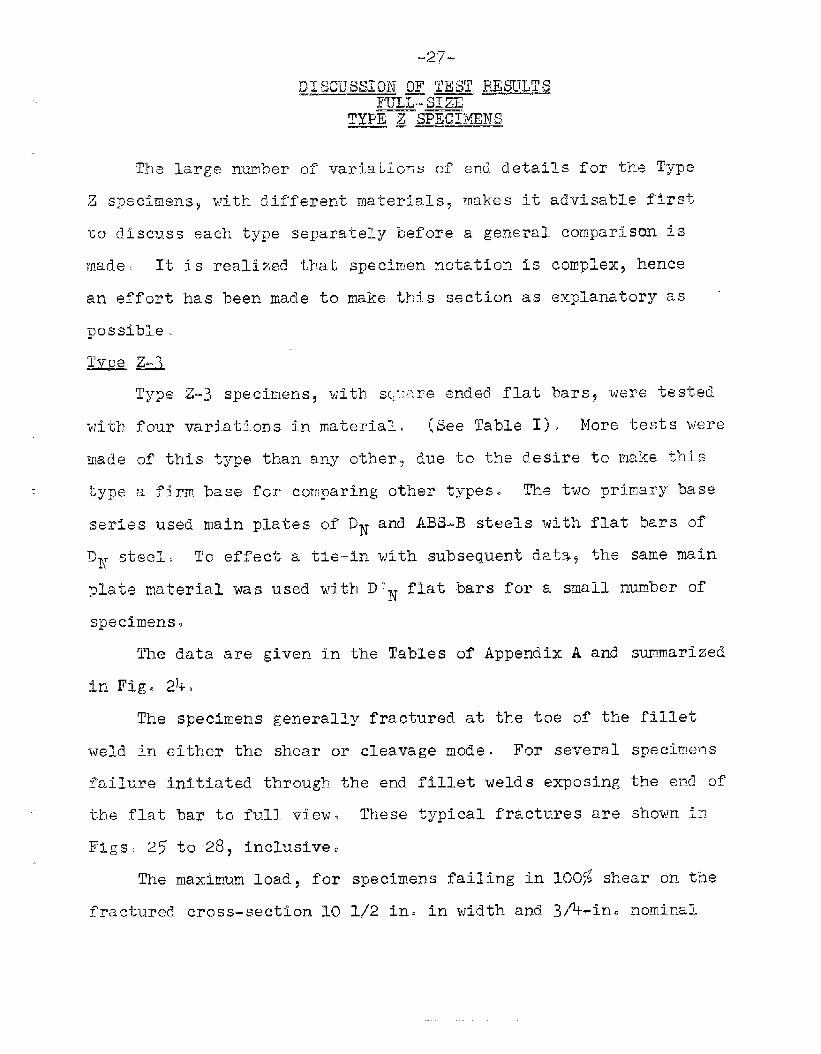
Thislar~e number of variations of end details for the Type
z specimens? with different materials, makes It advisable first
to discuss each type separately before a general cor~parisunis
made. It is realized that specimen notation is complex? hence
an effort has been made to make this section as explanatory as
possible.
Type Z-3 specinens7 with sciu::reGnded flat bars? wem tes-~ed
with fou~ variations in materialt (See Table 1) i More tests were
made of this type than any other3 due to the desire to make this
type a firm base for comparing other types. The two primary bass
series used main pSates c)f~N and ABS-,Bsteels with flat bars of
~N ~tee~i To effect a tie=in with subsequent dat%7 the same main
plate material was used with D]W flat bars for a small number ofA
specimens.
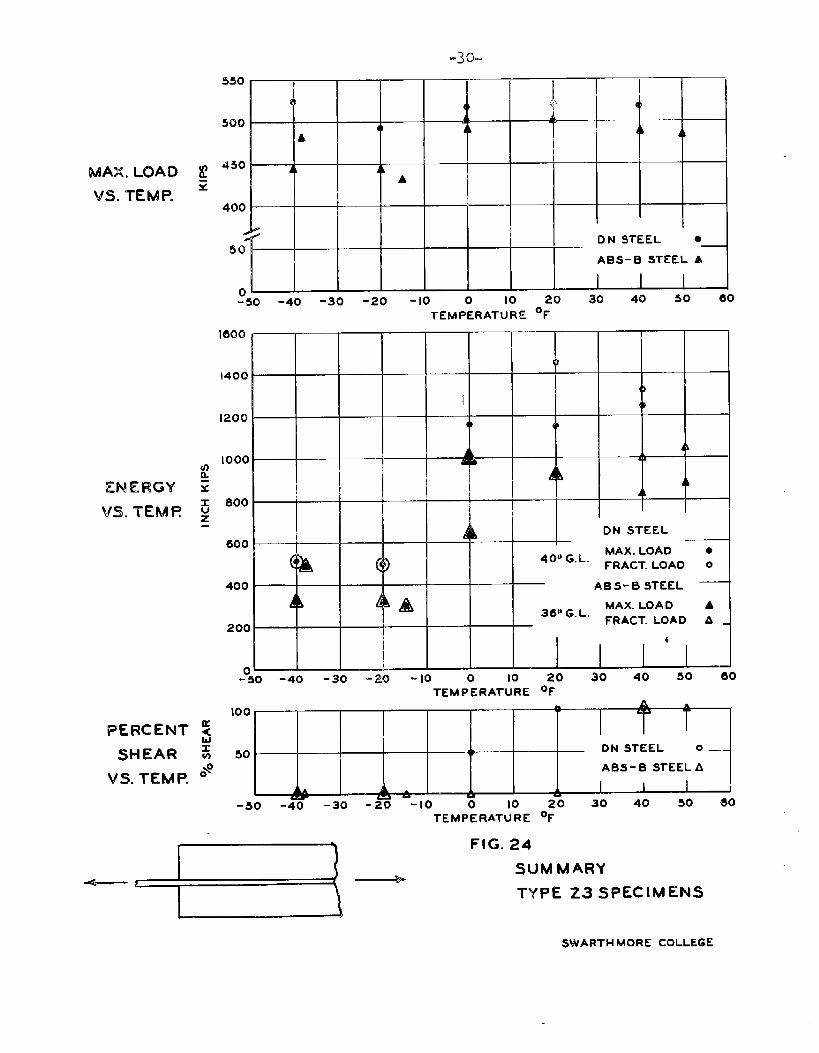
The data are given in the ‘Tablesof Appendix A and summarized
in Fig? 29+,
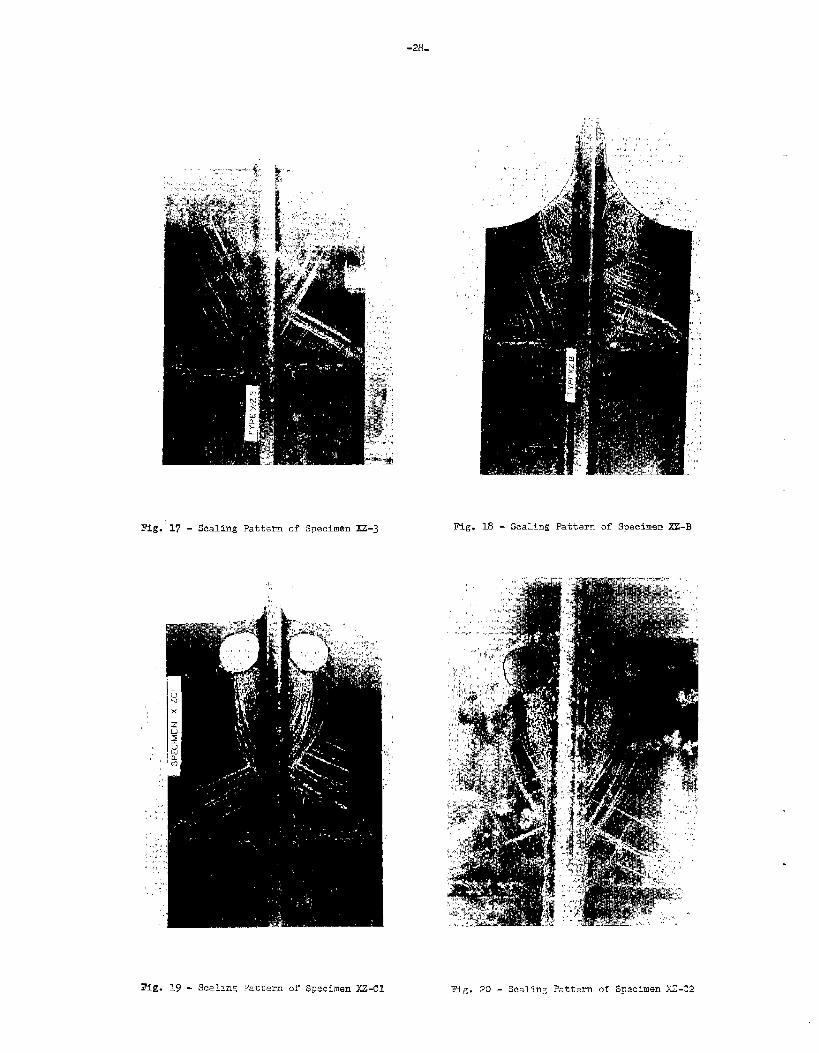
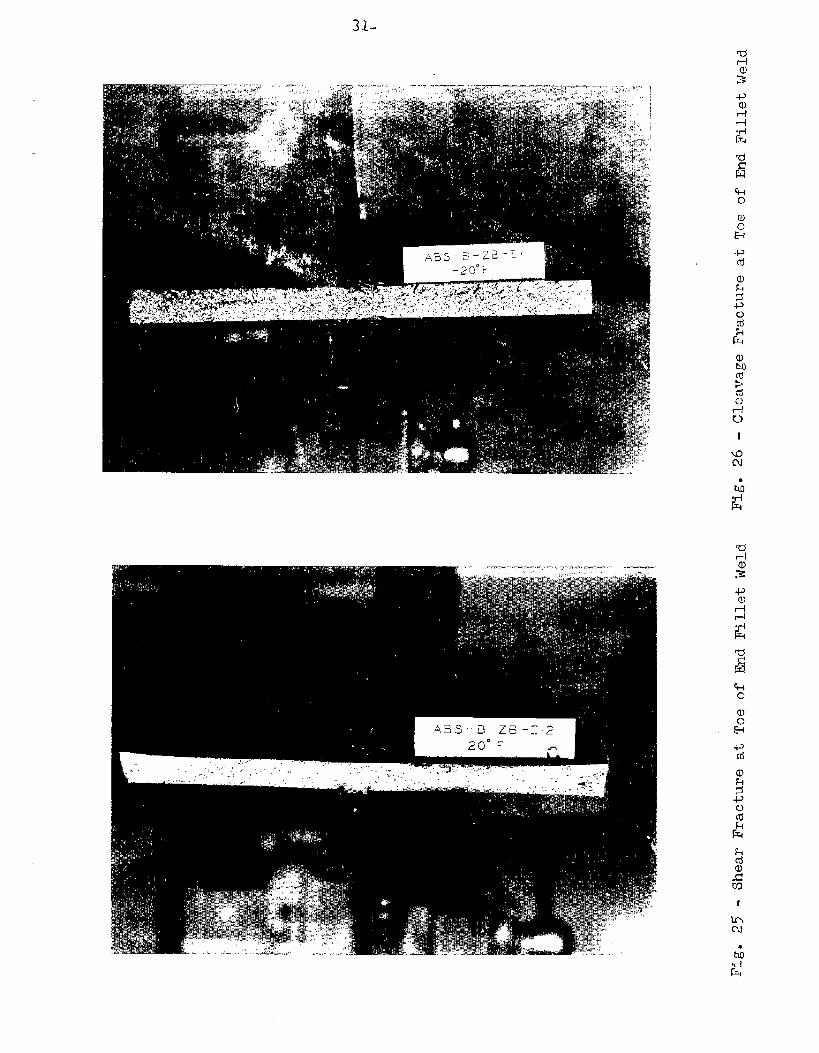
The specimens generally fractured at the toe of the fillet
weld in either the shear or cleavage mode. For several specimens
fai~~re in~tiat.edthrough the end fillet welds exposing the end Gf
the flat bar to full view, These typical fractures are shown in
Figs, 25 to 281 inclusive,
The maximum load, for specimens failing in
fractured cross-section 30 1/2 in. in width and
-28-
,,, .!
Fig. 17 - Scaling Pattern of Specimen XZ-3 Fig. 18 - ScaLh~ Pattern of S~ecimen Z-E
,, .,,,
!>,,
!.%,.,, !,.”,,“, ,
“ “<
,, ,,,
Fig. 20 - Scaiing Pa~tmvl or Specimen XZ-C2
-29.
Fie. 17
,.,‘,,, , a!
~,,,..,,....... ... ,,,, ,:,,.,...... ,..,,,—,,.,..,, b,,, ’,”,, ,,, ,,, , ,1’ +,,, ,,
w
. ,
,,
.. .r;
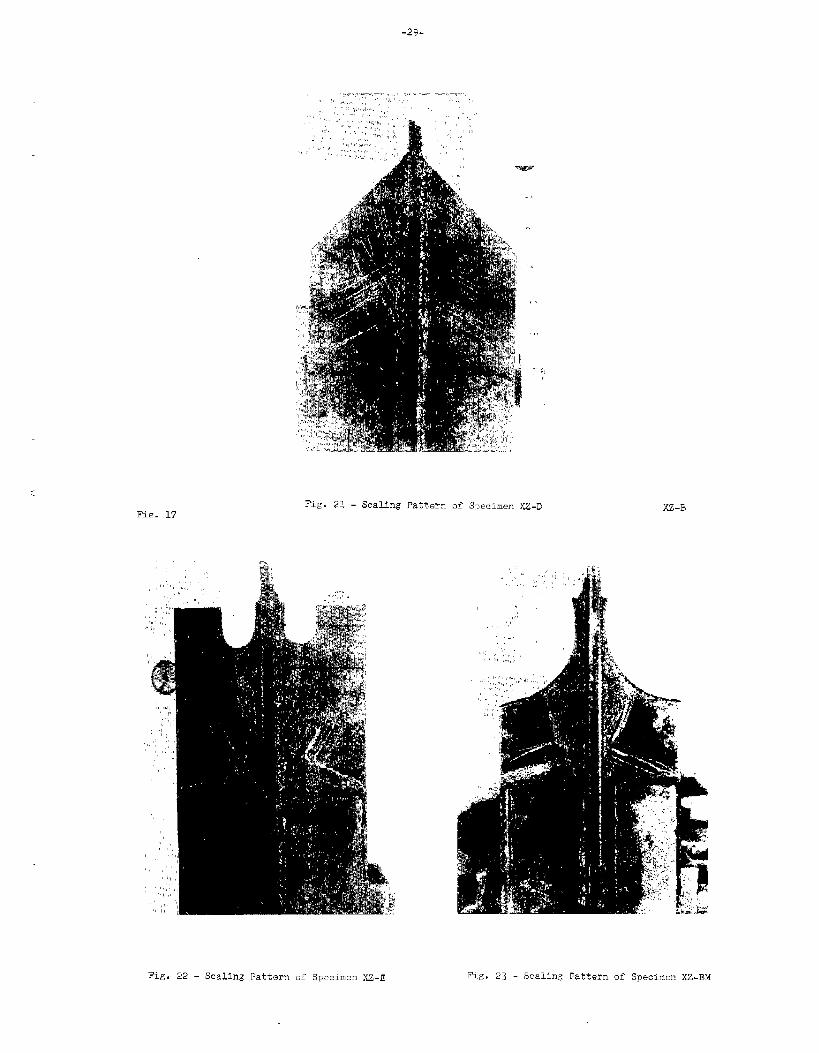
Fig. 21 - Scaling Pattern of Specimen U-E
‘<,,!,,,, ,,. . 1 .,6,,
‘, ;,,.,,, ,. .,!
,,
‘,
,,!
‘)’
X2-B
Fig. 22 - Scaling Pattern GI SFscimen X2-E Fig, 23 - Scalin~ Pattern of Specimen X2-EM
bAAX.LOAD
vs. TEMP.
ENERGY
vs.TEMR
PERCENT
SHEAR
VS. TEMP.
550
5004k Ak
450A
400
DN STEEL e!30
ABS-B STEEL A
I I10 20 30 4~ 5~ GO
TEMPERATURE ‘F
DN STEEL
MAX. LOAD
1
●
40U G.L.FRACT. LOAD ~
ABS-B STEEL
36’’ G.L.MAX. LOAD A
— FRACT. LOAD A
+
-%0 -40 “30 - m -10 0 10 20 30 40 so GOTEMPERATuRE ‘F
100A A A
150 ‘
ON STEEL 0—
$0 ABS - B STEEL A
A 1 I Iw
-50 -40 -30 -20 -10 0 10 20 30 40 so @oTEMPERATURE ‘F
--”FIG. 24
SUMMARY
TYPE 23 SPECIMENS
SWARTH MORE COLLEGE
31-
rdl-la).>..
.P(’u
vcd
2
‘%0
a)
r..-Pcd
al
2-Pc.)
:t%
I
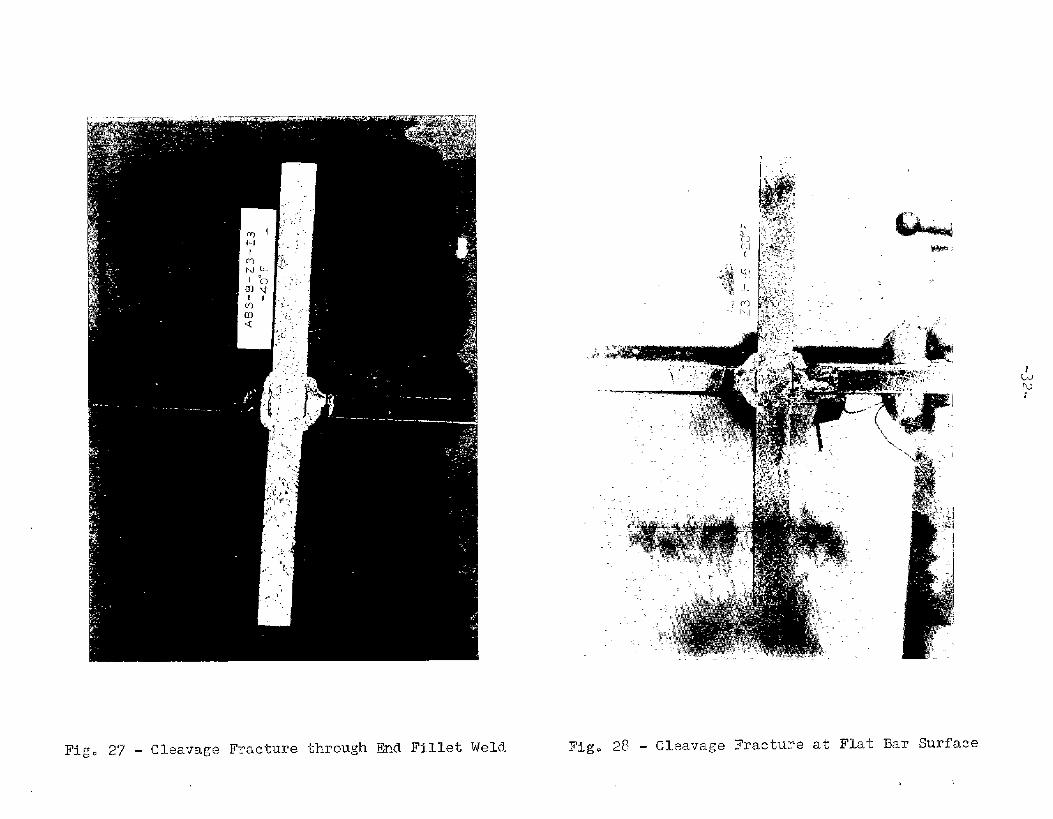
Fig. 27 - Cleavage.FracturethroughIMd FilletWeld
k
Fig. 28 - CleavageFractureat Flat Ba~ Surface
-33-
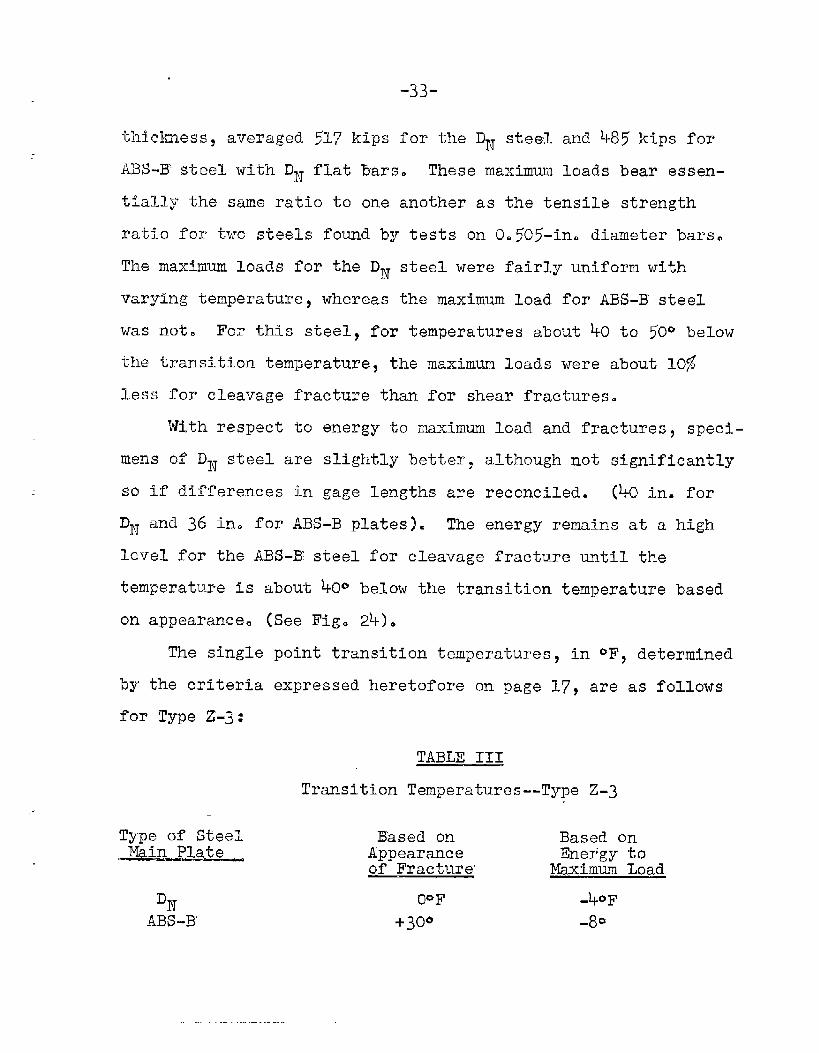
thichess, averaged 517 kips for the DN steel and 485 kips for
ABS-lTsteel with DN flat bars. These maximum loads bear essen-
tj.all,ythe same ratio to one another as the tensile strength
ratio for two steels found by tests on 0.~05-in. diameter bars.
The maximum loads for the DN steel were fairly uniform with
varying temperature, whereas the maximum load for ABS-E steel
was not. For this steel, for temperatures about 40 to jO” below
the transition temperature, the maximum loads were about 10f
less for cleavage fracture than for shear fractures.
With respect to energy to maximum load and fractures, speci-
KHLS d? DN steel are slightly better, although not significantly
so if’differences in gage lengths are reconciled. (40 in= for
DN and 36 in. for ABS-B plates]. The energy remains at a high
level for the ABS-E steel for cleavage fracture until the
temperate Is about @ below the transition temperature based
on appearance. (See Fig. 2~E).
The single
by the criteria
for Type Z-3:
Type of SteelMain Plate——
point transition temperatures, in ~F, determined
expressed heretofore on page 17, are as follows
TABLE 111
Transition Temperatures--Type Z-3
Based on Based onAppearance Energy toof Fracture” Maximum Load
DNABS-B’
~o”F -40F
+300 -80
-34-
The transition temperatures for DN steel by the two criteria
are consistent; however, since energy remained high for a few
tests using ABS-B steel where cleavage fractures occurred, the two
criteria establish widely different transition temperatures for
ABS-B steel.
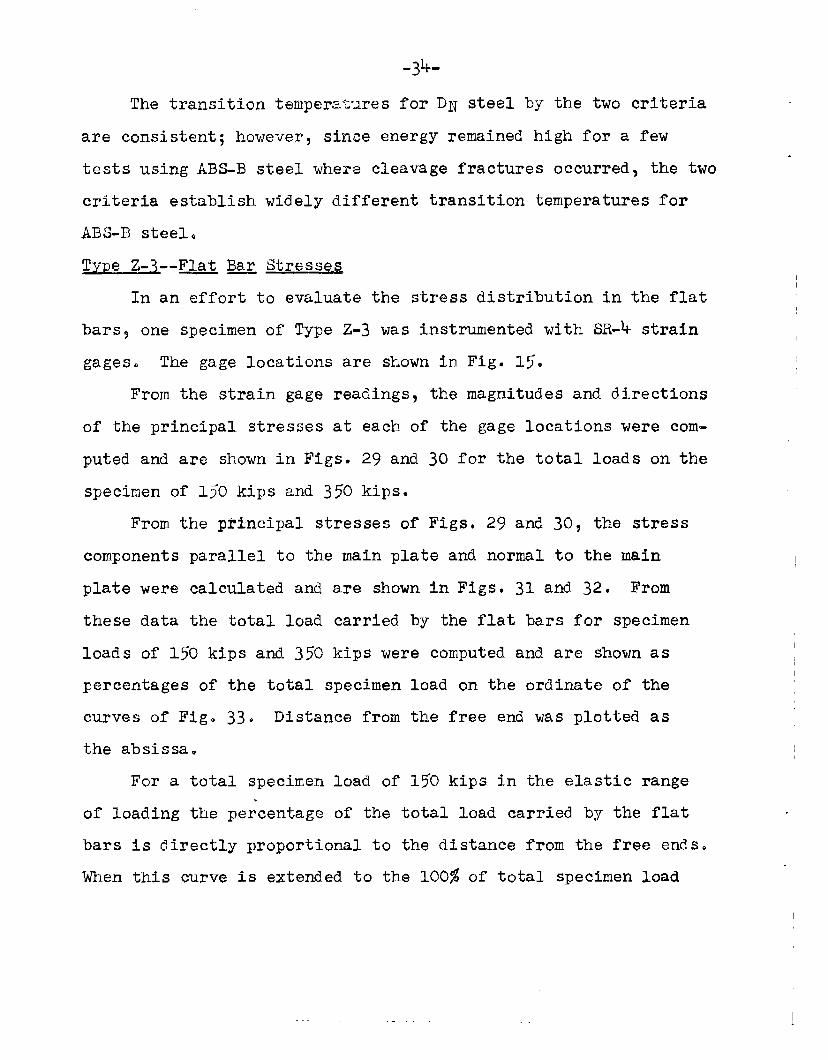
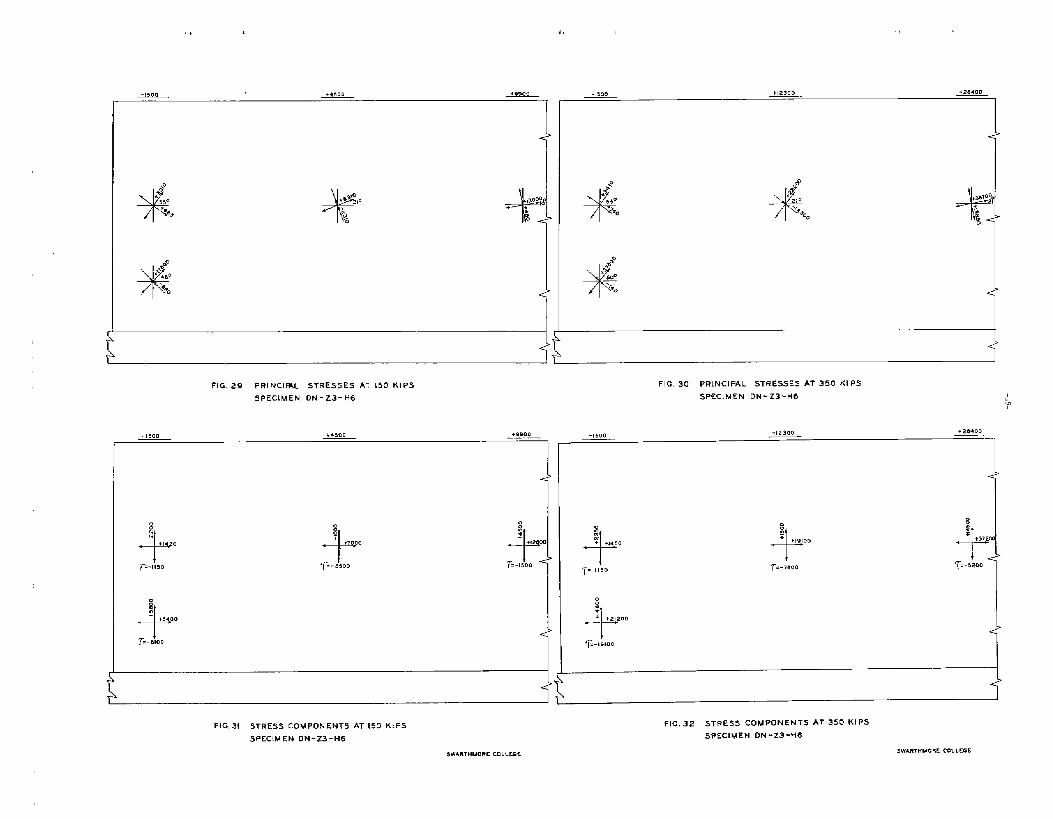
Type Z-3--Flat Bar Stresses—.
In an effort to evaluate the stress distribution in the flat
barsy one specimen of Type Z-3 was instrumented with SR-4 strain
gages. The gage locations are shown in Fig. 15.
From the strain gage readings, the magnitudes and directions
of the principal stresses at each of the gage locations were com-
puted and are shown in Figs. 29 and 30 for the total loads on the
specimen of 1S0 kips and 350 kips.
From the principal stresses of Figs. 29 and 30, the stress
components parallel to the main plate and normal to the main
plate were calculated and are shown in Figs. 31 and 32. From
these data the total load carried by the flat bars for specimen
loads of 150 kips and 350 kips were computed.and are shown as
percentages of the total specimen load on the ordinate of the
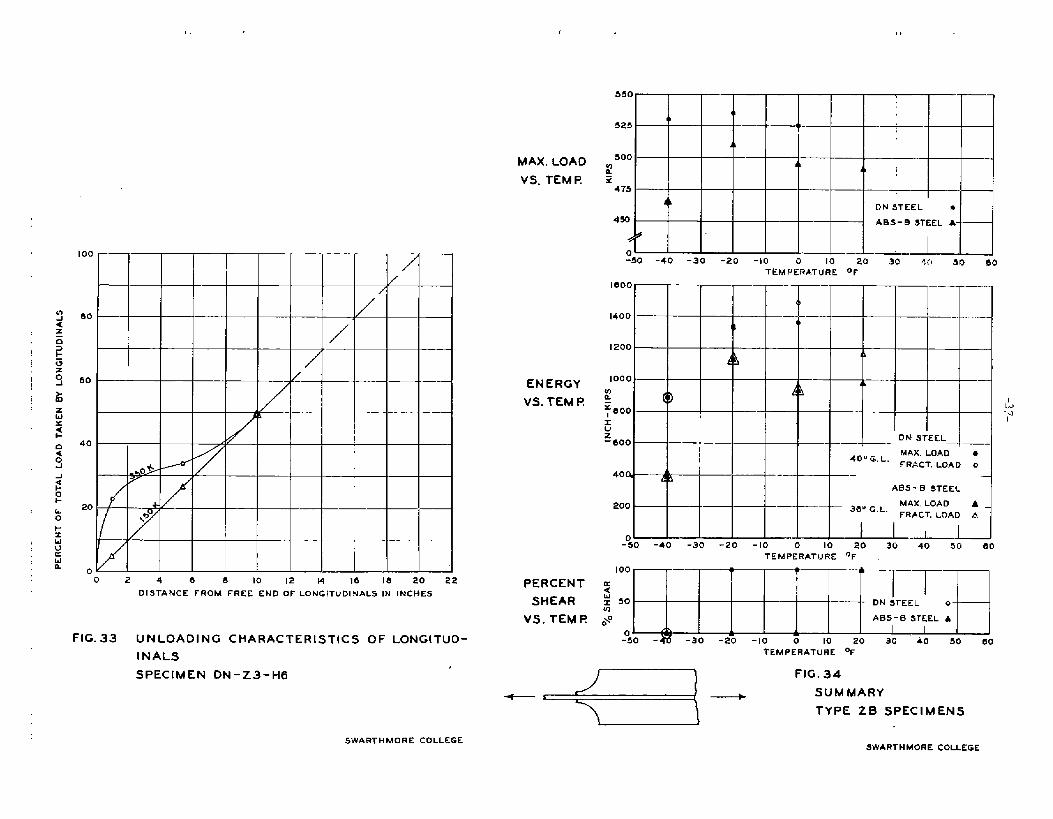
curves of Fig. 33. Distance from the free end was plotted as
the absissa.
For a total specimen load of 150 kips in the elastic range
of loading the percentage of the total load carried by the flat
bars is directly proportional to the distance from the free ends.
When this curve is extended to the 100% of total specimen load
r,,,
-,500 +4500 ~
$
#
.55°*8.J
FIG. 29 PRINCI%L STRESSES AT !50 KIPS
SPECIMEN DN-Z3-H0
:
-1-Q
‘ ‘7000
r=-:500
FIG,3! STRESS COMPONENTS AT 150 KIPS
5PEC{MEM ON- Z3-H6
FIG, 30 PRINCIPAL STRESSES AT 350 KIPS
SPECIMEN DN-Z3-H0
-1500 ,12300 +20400—
SWARTHMORE COLLEGE
-+I
FIG.32 STRESS COMPONENTS AT 350 KIPS
SPECIMEN DN-Z3-HU
-y5-
ValUR9 the distance frcm the free ends as shown by the absissa
is 20 irlchesawhich is to be expected since tb.emain plate
t~rminates 20 j.neh~sfrom the free ends of the flat bars. (See
Fig. 2]. TIE transfer of load from
plate is accomplished through shear
either side of”the flat bars. From
it would ap~ear that these shearing
the flat bars to the main
along the fillet welds on
the 150-kip curve of Fig. 33~
stresses are uniformly dis-
tributed along the side fillet welds to the main plate in the
elastic range of loading.
At a total specimen load of 350 kips, parts of the main
plate have reached yield point stresses,and the percentages of
the total load carried by the flat bars as computed from the
strasses of Fig. 32 are as shown by the 3~0-kip curve of Fig. 33.
The shearing stressesa rather than ‘beinguniformly distributed as
in”the elastic range of loading, tend to increase in intensity
near the end fillet weld at the free ends of the flat bars.
Tv~e Z-B
The flat bars of the Type Z-B specimens had their free ends
flam~ cut to a ~-in. radius in contrast to the square cut-offs
of Type z-3. The data are given in the Tables of Appendix Ay
and the summary of all data is shown graphically in Fig. 34.
The tests are few in number and permit only ~eneral observa-
tion and inferences to be made. Howeverp the few tests give a
background to compare results with Type Z-3. Quantitatively
—..-
(, ,,
MAX. LOAD
VS. TEMP.
.-.Iuv
//
80
/
60 /
40
7
20 +
o0 2 4 e 8 10 12 M 16 18 20 22
DISTAFJCE FROM FREE END OF LO NGITUDI!4ALS IN INCHES
FIG. 33 UNLOADING CHARACTERISTICS OF LONGITUD-
INAL
SPECIMIEN ON-Z3-H6
.$WAl?THMORE COLLEGE
ENERGY
VS. TEM R
PERCENT
SHEAR
VS. TEMF?
!350
ab4I
525 —
Ab
500$5 A,a A,
z475
4 ON STEEL *
4Y3 ABS-B STEEL A
~ ~
o ——-50 -40 -30 -20 -10 0 10 20 30 ~fl 50 eio
TEMPERATURE ‘F-.
1600 —
c5
14004I
I 200
d hii
1000Ah
w& 4 h
:aoo
@A~
xuz ON STEEL-800
MAX. LOAD ●40 UG, L.
f RACT. LOAD o
4oa Am
AES-B STEEL
200 36U G,L.MAX, LOAD A
FRACT. LOAD A
-% o
1
-40 -30 -20 -10 -o 10 20 30 40 50 eo
TEMPERATURE ‘F
100
K~
x 50WI
AOS-B STEEL A*\O
10 20 30 40 50 60
TEMPERATURE ‘F
,~ FIG. 34-
--%5– SUMMARY
TYPE ZB SPECIMENS
SWARTHMORE COLLEGE
them appears to be a small imp~avemeritin average load capacity
fcl’rboth D~ and ABS”13steel. EnergyWise an overall improvement
or increas% is noted compared with Type Z-37 with high energy
far fraature in the claavags mode for ABS-B steel when tempera-
tures are 10 to ~u“T ~t,=~wawtransition temperature determined
from appearance of fracture.
Transition temperatures show the most significant chang~
of any plmysical prop=rty relative to Type Z-3* Due to l~mited
data$ the transition temperature was established on the basis
of fracture appearanc~ on~y. The transition temperatures ares
for DN ~tee~~ -soT; and for ABS-B steelg +lO°FO These t~mperatures =
are 30~and 20°~ respectively below the Type Z-3 results. Since
one expects transition temperature to be affected by localization
of strains in the region of the end weld~ it appears that the end
relief afforded by Type Z-B is effective in reducing local
triaxiality.
~
Type Z-EM is a modification of Type Z-B. (See Fig. h). It
was suggested that this detail would be a better detail for mod-
ifying existiEg ships than Type Z-B.
As will be seen by reference to the data in Table VI--Aof
Appendix A and Fig. 35 summar~zfng these data? no significant
changes are noted in comparison with Type Z-B except that the
transition temperature is approximately 250F9 a rise of 25~F
compared.with Type Z-B; but since the data reports only one
MAX. LOAD ~
VS. TEMP. :
ENERGY
VS. TEME
,. ,
575-
550
523
hd
Jhi L
500 i ,
475
:50 -40 -30 -20 -10 0 10 20 30 40TEMPERATURE %
50 80 70
1800
1400di
1200
1 4i,
*E1000x ./i&g 800-- ! h .!Jh
000 CUERGY TO MAE, LOAD 2—
EMERGY TO FRACTURE A
400
20 0
-050 -40 -30 -20 -lo 0 10 20 30 40 50 60 7(TEMPERATURE ‘F
100
PERCENT {
SHEAR $ 50
VS. TEMF 0’0
-050 -40 -30 -20 -lo 0 10 20 30 40 50 60 7(TEMPERATURE ‘F
-e”
FIG.35 SUMMARY
TYPE ZBM SPECIMENS
ABS-B STEEL
SWART 14MORE COLLEGE
14
MAX, LOAD
VS TEMP.
ENERGY
VS. TEMP.
,,
-50 -40 -30 -20 -10 0 10 20 30 40 50TEMFZRATUflE ‘F
1600
4> k
Iw —
4I1200 - #b
:b
; Iom m J ~
I i L
s
zu aoo —z- -
/ h
600 . —.
400 OH STEEL
40U G.L. TO MAX, LOAD ●
TO FRAC7. LOAD 0
200 I—AB S-B STEEL
SaII G. I-. To ~~Ax. LoAO ATO FRACT. LO&O A
o — I
- so -40 -30 -20 20 30 40 50TZ’MOPERA?U R E ‘°F
PERCENTSHEAR
1004)
a
VS. TEMP.; so 1m DN STEEL ●
ABS-B STEEL A~$~ o A L & I
-50 -40 -30 -20 –lo o lo_ 20 30 40 50
sWARTHMORE COLLEGE
-4fJ-
warranted.
~
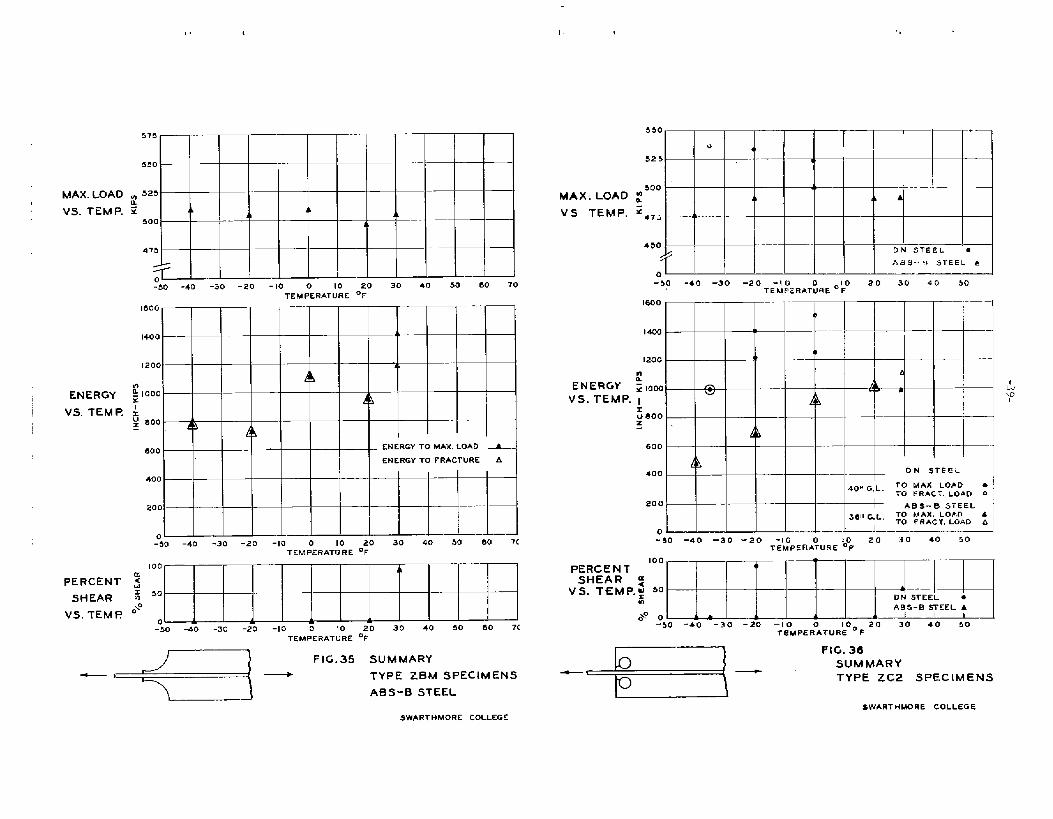
Figs. ~-and 5 show the end details for Types Z-Cl and Z-C2.
Each type had a 2-in. diameter hole burned in the flat bar at
the square end. For Z-C2 a straight flame cut was made from
the free end ~f bar to intersect the hole. Thus two degrees
of end restraint are introduced with Type Z-C2 expected to
place less load on the end weld, as is clearly indicated in
the photographs of l?igs.19and 20. The data for Type Z-Cl
and Z.C2 are given in Table III-A of App~ndix A. Fig. 36
summarizes these data for Type Z-C2. No plot is presented for
Type Z-Cl since only two tests were made.
It is belie~ed that the two typesa Z-Cl and Z-C2$ are
about equal in load capacity for a given steel. With respect
to energy to maximum load, Type Z==C1is slightly inferior to
Type Z-C2. In any event$ the absorbed energies are in the
same range as that found for Type Z-3.
In view of the slight differences noted above in strength
and energy absorption, it is of the utmost significance to not=
that the transition temperatures show wide differences. They
are summarized in Table IV.
&Q
*R3Sed on only
With D.Nmain plates
%
‘NT
AB&”Ei
z-cl and Z-C2 Specimens
one specimen failing in more t?canOX shear
Type Z-C2 has the lower transition tam-
p~~~~~~~. This is aI-I imdjkCatiCYJ that,less Ioealizaticm or tri-
axiality exists at the WLldweld, apparently due to the destroying
of the ~Ontinuity of metal aroumd. the hole. Observat:icnsrelated
to this? for the exploratory Z series specimnsz ~ollfirmthe
present findings. Type Z-C2 with main plates of ABS-B steel has
‘higherthan
follows the
Finally, the comparison of transition temperatures with the
base series of Type Z-s indicates an expectailcyof lower transi-
tion 4Lempsratures for D~ steel plates. For ABS-B steel nothing
pcsitive can he reported about the relief afforded by the end
d~tails af Type ZI&2 SirLCe the transition temperature based on
limited tests was approximately equal to that of Typ9 Z-3C
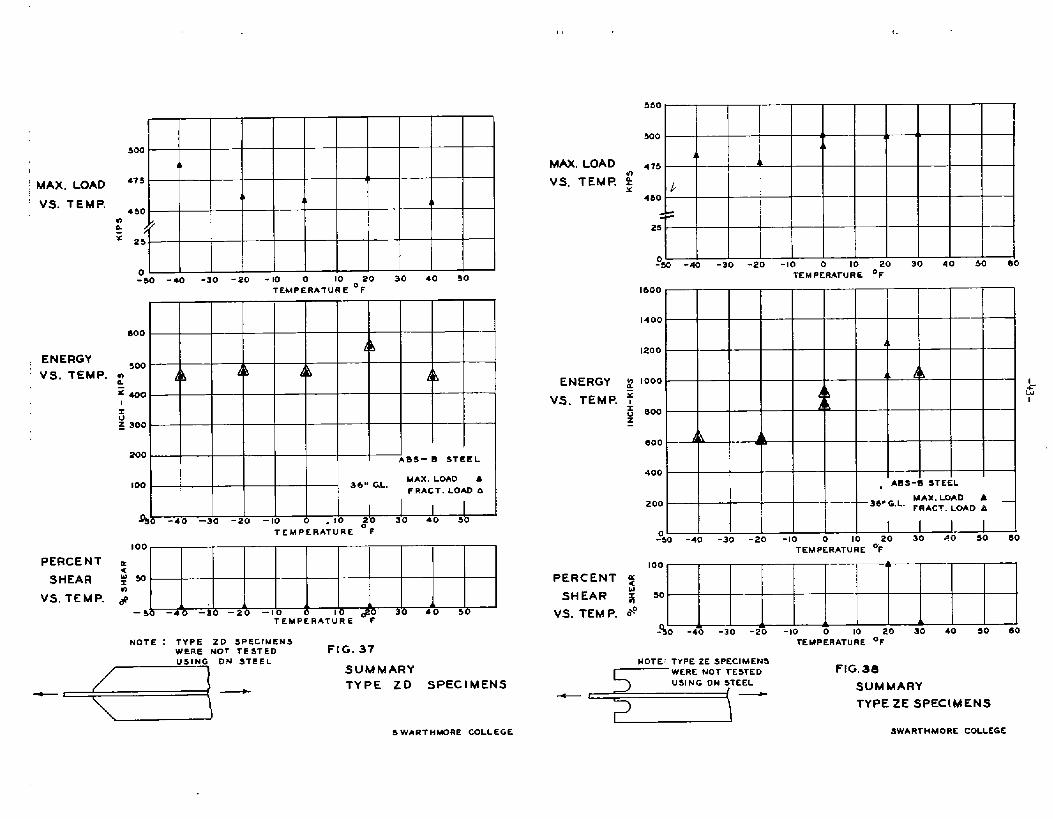
TTIDeZ-D
Tlw mds of the flat bars for Type Z-D specimens were cut
-k2-
off an a b5° angle. The data for five tests? all exhibiting
cleavage fraeture$ are given in Appendix A and plotted in
Figure 370
The average maximum load of Type Z-D for cleavage fracture,
with main plates of ABfi-Bsteel~ was slightly lower than the
maximum load for Type Z-3 for cleavage fracture. Energy absorp-
tion of the plates is slightly lower for Z-D than for Z-3.
The transition temperature could not be determined from the
limited data but is above +kO”F. With this temperature unknown
it is difficult to assess the value of cutting off the end bars
cm the 45°’angle. This end modification is apparently poorer in
this respect than the end variations discussed before. This
statement mustq howevery be qualified by pointing out that
several specimens had D’N
steel flat bars. The D1N
steel had.a
higher yield stress than DN steel; consequently? the test made
at +~GF and showing cleavage fracture may be misleading.
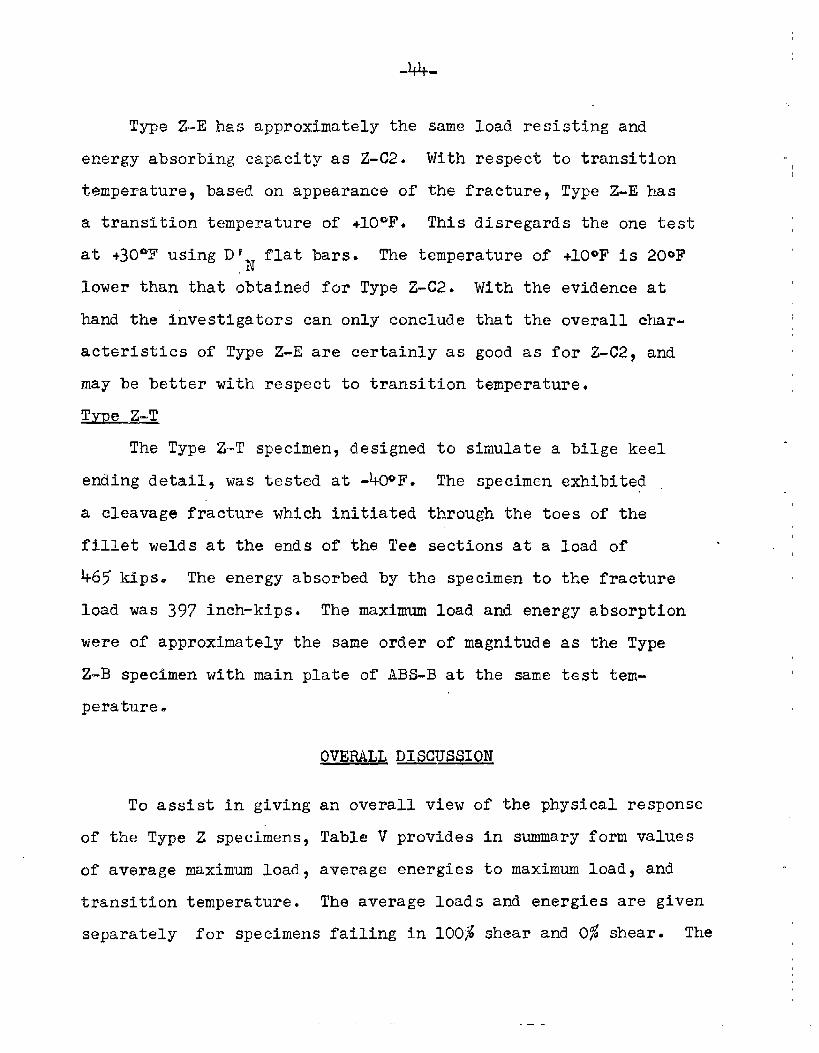
-e Z-E
The Type Z-E specimen was introduced into the program
the results of Types Z-Cl and Z-C2 had indicated that Z-C2
after
had.a
lower transition temperature apparently due to the destroying of
continuity of the 2-in. diameter hole. This led to investigating
the effects of a U-shaped cut-out, which was expected to possess
the same characteristics as z-C2, Refer to Fig, 5 for the end
details. The data are given in Appendix A and also plotted in
Fig. 38. It should.be noted that the main plates were of AES-B
steel.
1
: MAX, LOAD
‘ VS. TEMP.
, ENERGYVS. TEMP.
PERCENT
SHEAR
VS, TEMP.
. .TEMPERATURE ‘F
800
i h500
* I!k Lka 6h A~4001ru~ 300
200 .ABS - B STEEL
too 34” CL.MAX. LOAD A
FRACT. LOAD a
40 -40 -30 -20 -10I
& . 10 go 30 40 30
TEMPERATURE ‘f
NOTE : TYPE ZD SPECtMI?NSWERE MOT TESTED FIG. 37USING DFJ STEEL
-e––
SUMMARYTYPE 20 SPECIMENS
MAX. LOAD
VS, TEME
ENERGY
VS. TEMP.
ma.x
TEMPERATURE ‘F
1600
1400
i h1200
1000 -AL d 4
~I
000
000 dL A
400, ADS-U STEEL
200se. = ~, MAX. LOAD b
FRACT. LOAO A
%0 -40 -30 -20 -10 0 10 20 30 46 so ao
TEMPERATURE *F
100
PERCENT :
SHEAR :~VS. TEM P. ~“
A A-%0 -4% -30 -2% -10 0 10 20 30 40 so 60
TEMPERATURE ‘F
NoTE: TYPE ZE SPECIMENSt wERE NOT TESTED FIG.38
‘s’ SUMMARY
TYPE ZE SPECIMENS
SWARTHMORE COLLEGE
-44-
Type Z-E has approximately the
energy absorbing capacity as Z-C2.
temperature, based on appearance of
a transition temperature of +lOQF.
same load resisting and
With respect to transition
the fracture, Type Z-E has
This disregards the one test
at +30QF using D!,N
flat bars. The temperature of +1OOF is 20~F
lower than that obtained for Type Z-C2. With the evidence at
hand the investigators can only conclude that the overall char-
act~ristics of Type Z-E are certainly as good as for Z-C2, and
may be better with respect to transition temperature.
T~~e Z-T
The Type Z-T specimen, designed to simulate a bilge keel
ending detail, was tested at -40~F.
a cleavage fracture which initiated
fillet welds at the ends of the Tee
The specimen exhibited
through the toes of the
sections at a load of
%65 kips. The energy absorbed by the specimen to the fracture
load was 397 inch-kips. The maximum load and energy absorption
were of approximately the same order of magnitude as the Type
Z-B specimen with main plate of ABS-B at the same test tem-
perature.
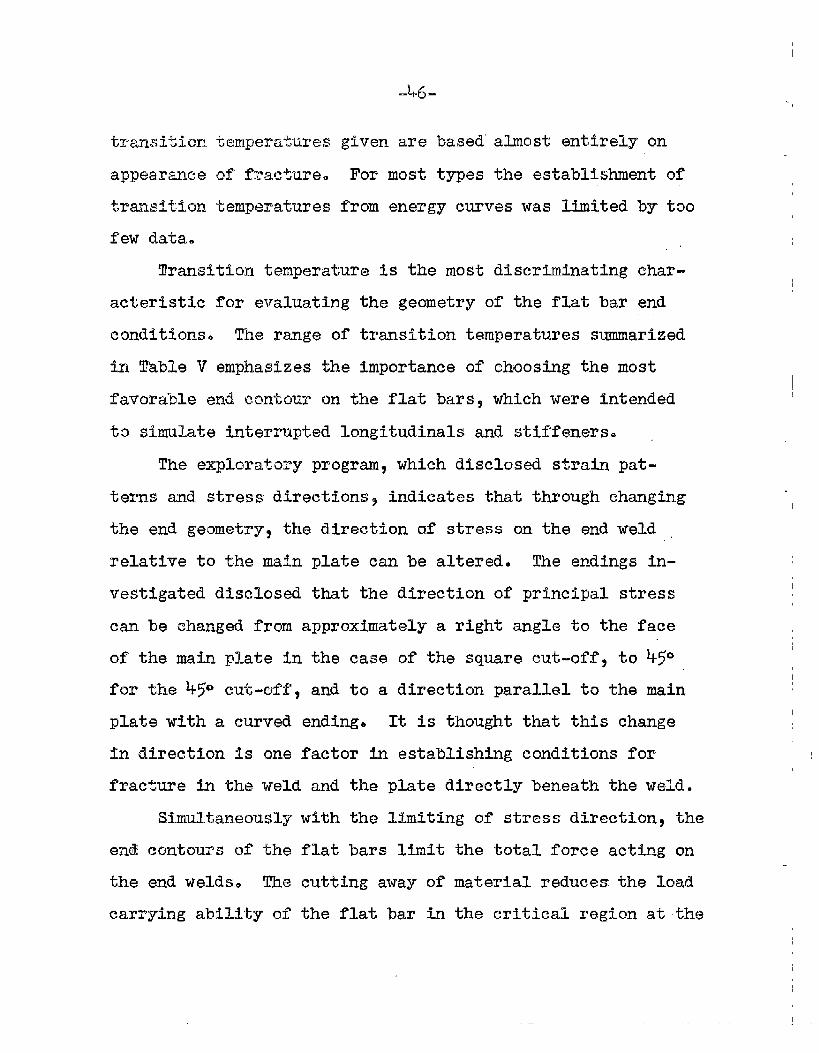
Qmh&LDIscu=I~N
To assist in giving an overall view of the physical response
of the Type Z specimens, Table V provides in summary form values
of average maximum load7 average energies to maximum loadl and
transition temperature. The average loads and energies are given
separately for specimens failing in 100~~shear and Ox shear. The
—
-k5-
Oa
1 )
o0
08+
#-. -n,-.I-If-loll+
w“ w
nNN
5’ l-l
-k6-
given are “based’almost entirely on
For
from
most types the establishment of
energy curves was limited by too
Transition temperature is the most discriminating char-
acteristic for evaluating the geometry of the flat bar end
conditions. The ~ange of transition temperatures summarized
i~ Thble V emphasizes the importance of choosing the most
favorable end contour on the fZat bars~ which were intended
to simulate interrupted longitudinal and stiffeners.
The exploratory program, which disclosed strain pat-
terns and stress directions indicates that through changing
the end geometry, the direction of stress on the end weld
relative to the main plate can be altered. The endings in-
vestigated disclosed that the direction of principal stress
can be changed from approximately a right angle to the face
of the main plate in the case of’the square cut-off, to 45°
for the %5” crrt-o-ff,and to a direction parallel to the main
plate with a curved ending. It is thought that this change
i“ndirection 1s one factor in establishing conditions for
fracture in the weld and the plate directly beneath the weld.
end
the
Simultaneously with the limiting of stress direction, the
c~ntour~ of the flat bars limit the total force acting on
end welds. The cutting away of material reduces the load
carrying ability of the flat bar in the critical region at -the
f“mc’kuredmmss-s+ctim.o This second effect is integrated with
tlw Stl%s!sdirecEiQll;i.e.y with a reduced flat bar cross-section
cd?a given Contm’tirtstress direction and nagnitude may be con-
tPollGdo A favorable Combination will lower transition tempera-
tqme~ as evidenced by tileresults for Type Z-BY and increase the
exp~ctarmy af’ductile ac”bionIn the main plate. Test results
roughly follow t“hismasmi~g but do n,otp:ecisely confirm it.
For reawns stated beforeq the Type Z-3 (square cut-off
flat bars) was made t~~ebase for comparison purposes. For2-,/..
nain plates af DN
st~~lt snd modi~ications of types Z-13~Z-Cl
and X-W resulted in lower transition temperatures than for Z-3.
The radius contour cL’Type Z-B depressed the transition tempera-
ture by tk.egreatest anounto Although the radius contour of
Type Z-B was the most ben~ficial~ the Type Z-C2 flat bar
termination with flame cut,hole was essentially equal to Type
Z-B in depressing transition temperature.
For specimens using main plates of ABS-B steelz benefits
of IOWRT transition temperature are shown for Types Z-B and
Z-Eo Type Z-C2 was equal to Type Z-~v whereas Type Z-BM was
only slightly beneficial in lowering transition temp~rature.
Type Z.Da with flat bars cut off at 45az had a higher transition
temperature than the square cut-off of series Z-SO It should
temperatures of all specimens
than those of DN steel for all end
tests were made.
-48--
The Type Z-BM specimens, with end contour cut to a radius
with a slightly ~lpt~~nedend? ~=’e exPected to be as good! ~el-
ative to transition temperature, as Type Z-B, where the up-
turned end was eliminated. Limited tests did not ccnfirrnthis
opinion, However, the differences in transition temperature
may be due to the DtN flat bars used in all Z-BM specimens.
In comparing the transition temperatures of Types Z-Cl
and Z-C2 with 2-in. diameter burned holes, having main plates
of DN stee13 the straight cut from end of flat bar to the
circular hole as in Type Z-C2 was beneficial in lowering
transition temperature.
comparisons between the
of tests of Type Z-Cl.
For ABS-B steel plates no direct
two types were possible due to lack
Comparing the
Type Z-3, with ABS-B steel it appears
accrue, Thus for DN steel the detail
and for ABS-B steel it does not.
results of Z–C2 with
that no definite benefits
of Z-C2 appears beneficial,
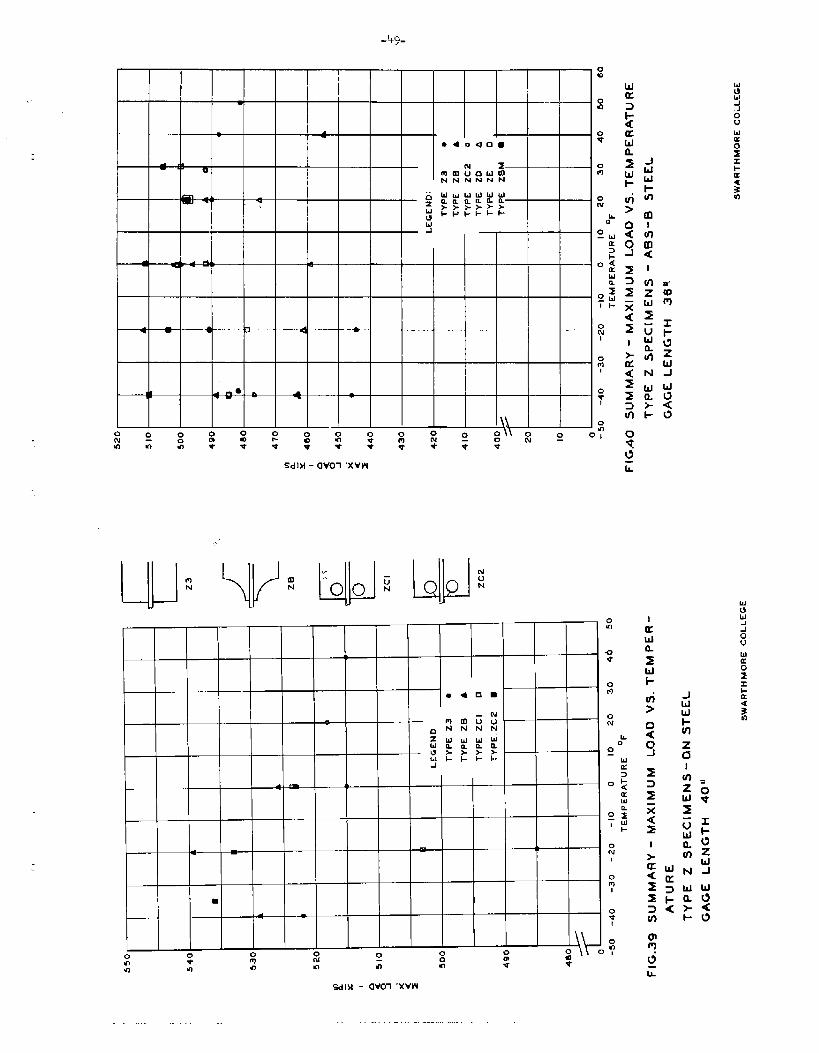
The effects of various flat bar endings on maximum load
(see Table V) and the graphical summaries of Figs, 39 and 40
permit certain generalizations to be made.
First, the maximum load, within the limits of reliability
of test results, does not appear to be significantly affected
by the end contours, although there is an indication that the
end radius of Type Z-B is better than square cut-offs in this
respect. Since Type Z-B is definitely preferential to Z-3
with respect to transition temperature, its improved load
.49.
—
wa
?u5n
—
ti>
ill
—
I I1 —
L-uuN
Id
lda0z
vId0.mN
0
0%’
SdlM - avol “Xvw
-50-
performance also provides a sound reason for favoring this detail.
Second, the average maximum loads, in general, are nearly
s-likefor either cleavage failures or shear failures for a given
type of specimen and kind of steel. Average loads as high, or
often higher, for cleavage failure than for shear failure are
not a new finding and have been reported before by this lab-
oratory.(2) A close examination of the maximum load tabulations
for varying temperatures (plotted in Figs. 39 and 40)”revals
much scatter in loads for both the shear and cleavage modes.
In general, the low load values for the cleavage mode occurred
at a temperature 20 to 30°F lower than the transition.
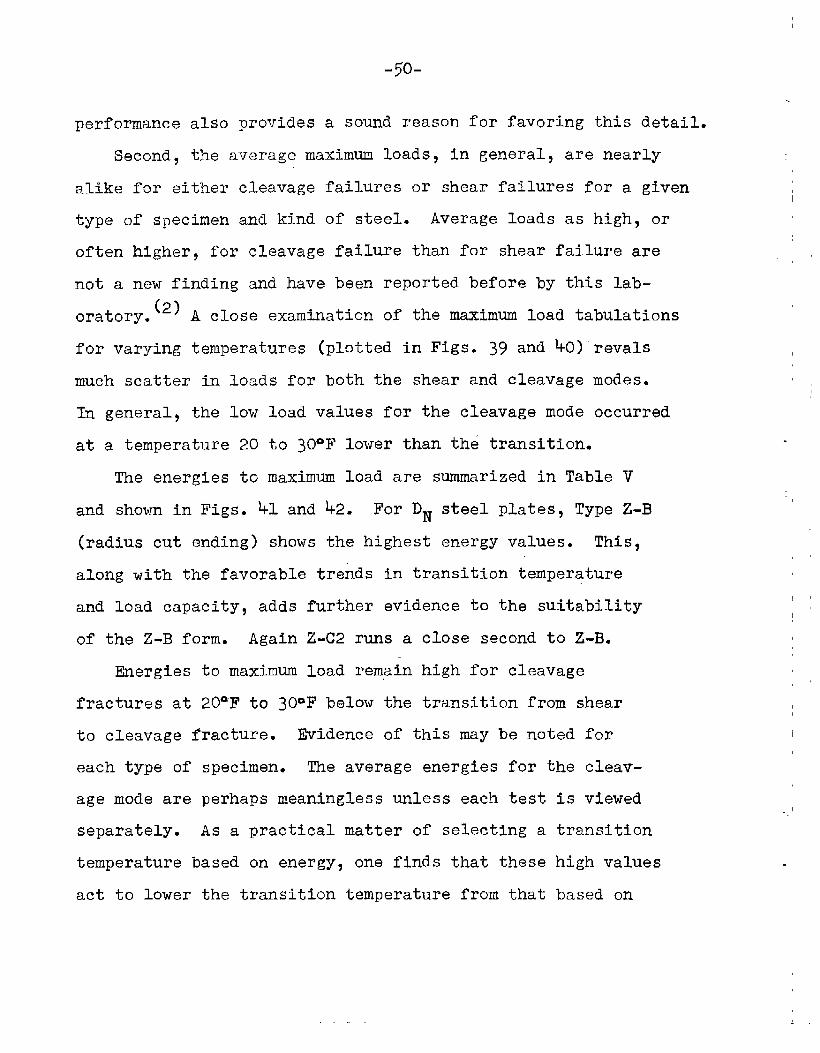
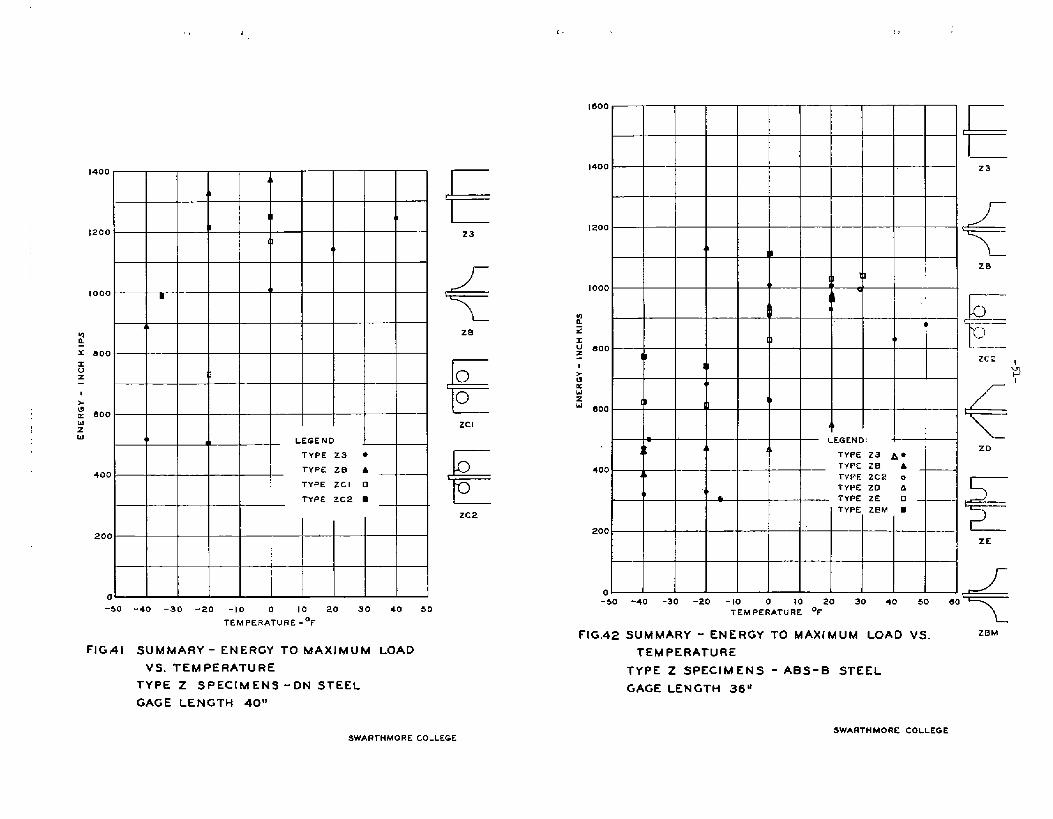
The energies to maximum load are summarized in Table V
and shown in Figs. 41 and 42. For DN steel plates, Type Z-B
(radius cut ending) shows the highest energy values. This,
along with the favorable tre~ds in transition temperature
and load capacity, adds further evidence to the suitability
of the Z-B form. Again Z-C2 runs a close second to Z-B.
Energies to maximum load remain high for cleavage
fractures at 20°F to 30QF below the transition from shear
to cleavage fracture. Evidence of this may be noted for
each type of specimen. The average energies for the cleav-
age mode are perhaps meaningless unless each test is viewed
separately. As a practical matter of selecting a transition
temperature based on energy, one finds that these high values
act to lower the transition temperature from that based on
-50 -40 -30 -20 -lo 0 10 20 30 40 50
TEMPERATURE-°F
FIGAI sUMMARY- ENERGY TO MAXIMUM LOAD
VS. TEMPERATURE
TYPE Z SPECIMENS -ON STEEL
GAGE LENGTH 40”
23
+za
ko0Zcl
ZC2TYPE zaw ■
200
0 I I-50 -40 -30 -20 -10 0 10 20 30 40 50 80
TEMPERATURE ‘F
FIG.42 SUMMARY - ENERGY TO MAXIMUM LOAD VS.
TEMPERATURE
TYPE Z SPECIMENS - ABS-6 STEEL
GAGE LENGTH 36U
Z3
Y
+ZB
+ZBM
SWARTHMORE COLLEGESWARTHMOR E COLLEGE
-52-
fracture appearance For the square ended TYPe Z-3 of DN steel?
the transition lxam;wratureso determined is 4QF lower and for
the ABS-B steel$ 38@F lower than values based on fracture ap-
pearance. Thusa on an energy basis, the ABS-J3steel would have
a @F lower transition temperature than the DN steel, whereas
the ABS-13steel had a transition temperature 30QF higher than
DN steel based on fracture appearance+ This 1S an an~malY
that cannot be further investigated for other types because
of limited data.
-..
-53-
~ STATE~NTs
It cftea appears warranted to limit the reliability and
applicability of test results by qualifying statements. If
that were to be done here, it would be essential to notes (a)
that the main plates of all specimens were narrow relative to
tiheilet,ails;(b] that the edges of the nain plate, represent-
ing a hull or bulkhead plate w~re free from lateral restraint;
and (c) that limited tests were made as dictated by economy and,.
available steel. All of these reservations would make certain
conclusions relatiV~ to full-size Ship detaiis un~ertain. Howeverl
since all of these conditions were appropriately noted when es-
tablishing this investigation it is hoped that this work may
point out the direction that future work should take or that the
present data may be utilized in at l~ast a qualitative manner
for guiding immediate practical considerations where geometrical
notches are involved.
(1) Test results confim the long standing “beliefthat abrupt
changes in structural geometry can only have detrimental effects.
While abrupt changes in structural geometry are critical, as has
been clearly demonstrated by a large number of actual casualties,
little has been known about the actual relief that could be
furnished by modifications
that anything short of the
ition, from one structural
in geometry. The test results indicate
most practical smooth structural trans-
component to another, impairs load
-5+
capacity~ energy absorption, and raises transition temperature*
(2] The structural notch effect of abrupt or gradually
faired terminations of structural components, as exemplified by
free ended longitudinal or stiffeners, is a result of the com-
pounding of concentrations of stress and the direction of that
stress at the termination Favorable combinations of this com-
pound effect tend to eliminate the structural notch. A favorable
combination of the compounding effects can be attained when the
stress direction at the free end of a longitudinal is as nearly
parallel to the hull or bulkhead plating as possible, in con-
j~ction with a decrease in the magnitude of this stress. The
direction may be controlled by smooth contour endings and the
stress magnitude reduced by a reduction in end cross-sectional
area. It has been found that the most favorable combination
results when the end contour of a longitudinal is cut to a
radius.
(3) Transition temperature was the most important char-
acteristic in comparing the results of variable end geometry
of t~.eType Z specimens. Load and energy absorption were
less critically affected by changes in type of endings.
(4) The study reported herein does not lend itself to a
critical separation of geometrical and welding notch effects.
It is essential to keep in mi~ that the most favorable g@ometric
condition would be nullified by a weld of poor penetration.
(~) While it was not the overall purpose of this program to
“55-
compare the notch sensitivity of DN and AM-B steels? such a
comparison can be made. The ABS-B steel used was definitely
inferior to DN steel on a transition temperature basis. The
other characteristics of ABS-B compared with DNq such as load
capacity and energy absorption, is more favorabl~.
.56.
BIBLIOGRAPHY
1. Progress Summary~ “Investigation of Fractured Steel Plates
Removed from Welded Ships“ SSC Report, Serial No. NBS-31
Dated June ,1~1951$ Williams, M. L., Myerson, M. R.,
Klugej G. L.~ and Dale, L. R.
2. First Progress Report, “Cracking of Simple Structural
Geometries~ The Effects of Edge Notch Geometry on Flat
Steel Plates’~zSSC Report, Serial No. SSC-51, Dated May 12,
1952~ Carpenter, S. T., and Linsenmeyer, R. F., Swarthmore
college.
3. Progress Report on Correlation of Laboratory Tests with
Full Scale Ship Plate Fracture Tests, Pennsylvania State
Collegea Research Project SR-96, SSC Report, Serial No.
SSC-9, March 19, 1947, by M. Gensamer, E. P. JSlier,
T. A. Praterq F. C. Wagner, J. O. Mack, and J. L. Fisher
—,
-57-
ACKNOWLEDGMENTS
The investigation and report were ~d@r the direct
supervision of Samuel T. Carpenter, Chairman of the I)apartment
of Civil Engineering, Swarthmore College, with Professor
Roy F. Linsenmeyer as an investigator and collaborator.
Tests were conducted under the supervision of R. F. Linsenmeyer
and E. Kasten.
Theodore Bartholomew and Eugene Urban hav~ prepared all
test specimens and assisted in testing. Drawings of the report
were made by John Calvin. Frances M. Wills has performed all
the stenographic duties.
The investigators are deeply indebted to Mr. James B.
Robertson, Jr., and to the members of the Advisory Committee
representing the Ship Structure Committee, for their many
contributions.

APPENDIX A
Tables of Basic Data
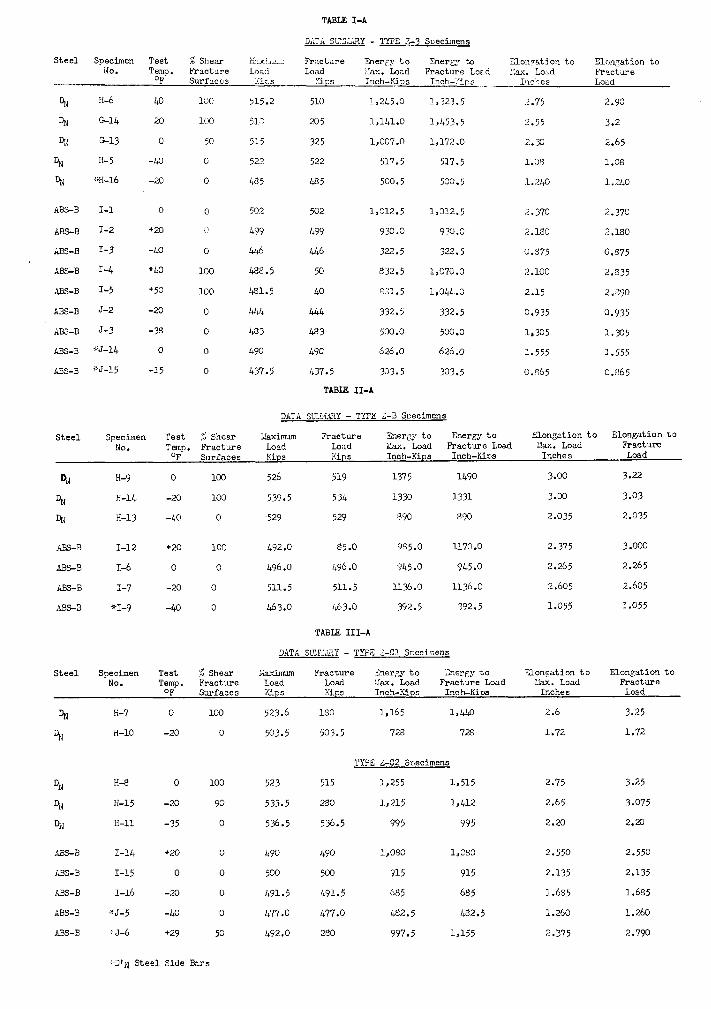
TABLE I-A
DLTA SLWUHY - TYFE 2-3 Specimens
Steel Specimen Test S Shear X3xil,,w. Fracture ‘merz.yto EnerLy tcNo. Temp. FractLre Loaci Load :=.. Load FractureLozd
‘F Surfaces Kius :ics Inch-,Kips Inch-.(ips..~,
~l~,~,afiti~~ to !lOn@. ion t0%x. Lo:-d Fracture
_ Inches Load
2.75 2.90
.?.55 3.2
2.y3 2.65
1,08 1.08
1.240 1.2/+0
2.370 2.37(3
2.MO 2.180
0.(375 0.5’75
2.100 2.835
2.15 2.890
0.935 0.935
1,305 1.305
1.555 1.555
0.865 0.s65
%
%
2:<
%
%
ASS-B
ABS-B
ABS-B
AM-B
ADS-B
AES-B
AN-B
AN-B
ASS-B
Steel
H-6
G14
G-13
H-5
w-16
1-1
I-2
1-3
I-4
I-5
J-2
J-3
:,J-14
x-J-15
m
20
0
-/+0
-20
100
100
50
0
0
515.2
51?
515
522
U35
510
205
325
522
485
1,245.0
1,141.0
1,007.0
517.5
500.5
1,323.5
1.3453.5
1,172.0
517.5
500.5
1,012.5
930.0
322.5
1,070.0
1,04.4.0
332.5
500.0
626.0
303.5
0
+20
-40
+40
+50
-20
-38
0
-15
0
~,
o
100
100
0
0
0
0
5r)Q
L99
446
W.5
481.5
w+
483
490
L37.5
502
/+99
446
50
40
w+
W3
490
1,37.5
1,012.5
930.0
322.5
832.5
8:;1.5
332.5
5!)0.0
626.0
303.5
TABLE II-A
DATA sOZWIY - TY?E Z-B Specimens
Specimen Test ;;Shear ;~w Fracture ‘?mer~vto Energy t 0 Elongationto Elongationto
No. TeJ#J. Fracture Load Load Max, Load FractureLead Ik.x.Load Fracture
Surfaces Kips I(ips Inch-Kips Inch-Kits Inches Load
q~ H-9 o 109 526 519 1375 1490 3.00 3.22
‘N H-U+ -2C 100 539.5 534 1330 1331 3.m 3.03
% H-13 -40 0 529 529 390 890 2.035 2.035
ABS-B 1-12 +20 100 492.0 85.0 9Q5.O 1170.0 2.375 3.000
ABS-B I-6 o 0 L96.0 /+96.0 9+5.0 %5.0 2.265 2.265
ASS-B I-7 -20 0 511.5 511.5 Im6.o 1136.0 2.605 2.6o5
ABS-3 *I-9 -40 0 463.0 !+63.0 392.5 392.5 1.055 1.055
TABLE III-A
DATA SIJl!l.”A?I- TYFE .Z-C1,%ecimens
Steel Specimen Test ~ Shear :!’&&lwn Fracture Enerr~,t0 :ner~y toNo.
FJonqationto ElongationtoTemp. Fracture Load Load &x. Load FractureLoadOF
Xax. LoadSurfaces r~ps
FractureKips Inch-Kips Inch-l(ips Inches Load
180 1,165 1,f+40
503.5 728 72s
2.6
1.72
3.25
1.72
%
‘JN
%qi
%
ABS-B
AF3S-B
ABS-B
ABS-B
ASS-B
ti-7 o 100
H-10 -20 0
523.6
503.5
TYFE Z,-C2Specimens
515 1,255 1,515
220 1,215 1,412
536.5 995 995
H-8 o 100
H-15 -20 90
H-n -35 0
523
533.5
536.5
2.75
2.65
2,20
3.25
3.075
2.20
1-14 +20 o
1-15 0 0
1-16 -20 0
~fJ-5 -!.!0 o
<J-6 +29 50
490 1,080 l,ogo
5(X) 915 915
/+91.5 685 685
477.0 482.5 482.5
280 997.5 1,155
2.550
2.135
1.685
1.260
2.375
2.550
2.135
1,685
1.260
2.790
490
500
491,5
477.0
492,0
:’DINSteel Side Sars
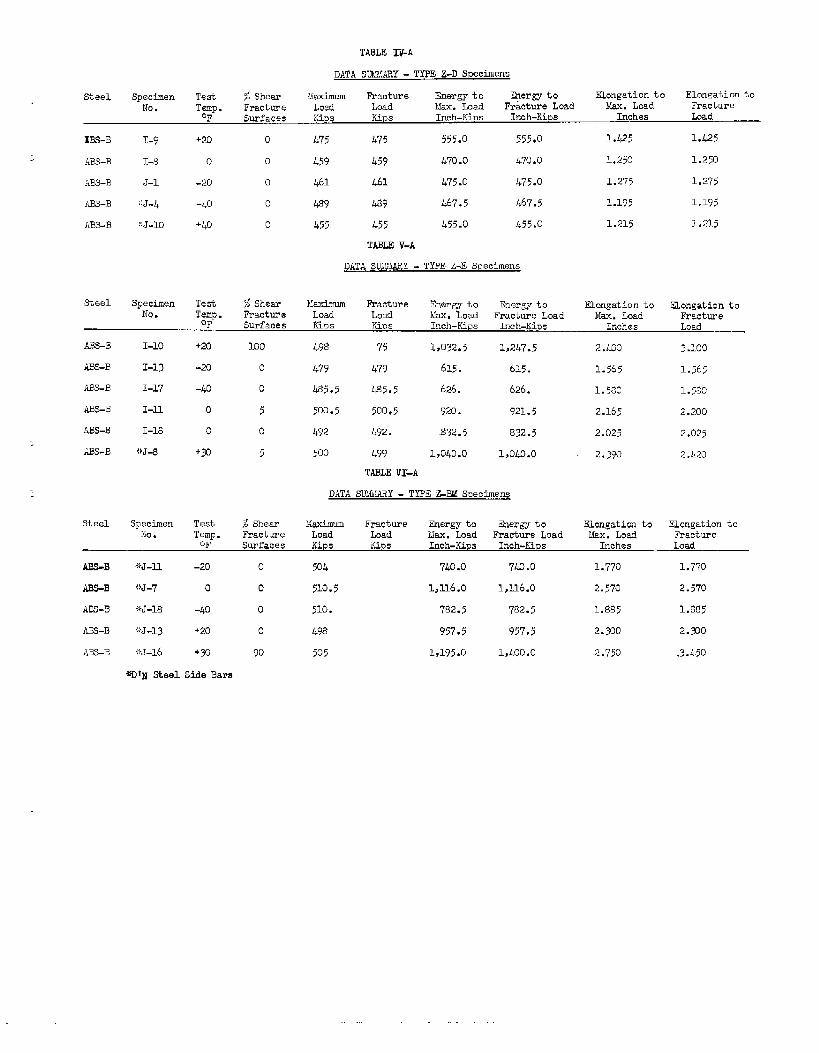
TABLE WA
DATA SLMW!RY - TYPE Z-D Specimens
Steel Specimen Test % Sheax Maximum Fracture Energy to Ehergy to Elongation to Elongation to
No. Temp. Fracture Load Load Max. Load Fracture Load Max. Load Fracture
OF Surfaces Kips Kips Inch-Kips Inch-Kips Inches Load
lW)-B 1-9 +20 o L’75 475 555.0 555*O 1.425 1.425
AM-B I-Q o 0 459 L59 .!470.0 L70.0 1.250 1.250
AR-B J-1 -20 0 1+61 461 1+75.0 475.0 1.275 1.275
l.Bs-B ;,J-4 -Lo o 4$X 489 @7.5 1+67.5 1.195 1.195
ABS-3 ;~J-10 +40 o 455 455 455.0 k55.o 1.215 1.215
TABLEV-A
DATA somA.1.lY- TYPE 2-E Specimens
Steel Specimen Test $ shear Maximum Fr~cture ~ergy to Energy to Elongation to Elongation toNo. Temp. Fracture Load Load lIkx.load Fracture Load Max. Load Fracture
OF Surfaces Kips Kips Inch-KiDs Inch-Kius Inch&s Load
ABS-B 1-10 +20 100 49Q 75 1N32.5 L247.5 2.l@o 3.100
AES-B 1-13 -20 0 k77 479 615. 615. 1.565 1.565
ME-B 1-17 -40 0 485.5 485.5 626. 626. 1.520 1.5<30
ABS-B I-H o 5 500.5 500.5 920. 921.5 2.165 2.200
ABS-B 1-18 0 0 L92 492. .832.5 832.5 2.025 2.025
A.Bs-B +J_8 +30 5 500 L99 1,0!!+0.0 1,040.0 2.390 2 .L20
TABLE VI-A
DATA SWLARY - TYPE Z--W!Snecimens
Stsel Spectien Test $ Shear Maximum Fracture Energy to Ener&y to Elongation toNo. Temp. Fracture
Elongation toLoad Load Uax. bad Fracture Load Max. Load
oF Surfaces Kips KipsFracture
Inch-Kips Inch.Kips Inches Load
AE,s-B .+*J-YJ -20 0 504 7W.O [email protected] 1.770 1.770
MS-B W-7 o 0 510.5 I,U6.O I,U6.O 2.570 2.570
AES-B +:J-lS -m o 510. 7%2.5 782.5 1.885 1.885
ABS-B w-13 +20 o 498 957*5 957*5 2.300 2.30
LES-B {*J-16 +9 90 505 1,195.0 1,400.0 2.750 .3.450
*D~N Steel Side Bars
spec.NO.
G-5
G5
G-7
M
C-4
F-10
Tg;p. % Shear. Fracture
Surfaces
40 100
30 100
20 0
15 100
0 0
-35 0
:.
Spec. Tsmp. % ShearNo. ‘F. Fracture
!- Surfaces
H-1 m 90
H-2 0 100
Spec. T~p. % ShearNo. Fracture
Surfaces
H-IL 15 0
H-3 o 0
FLU +50 100
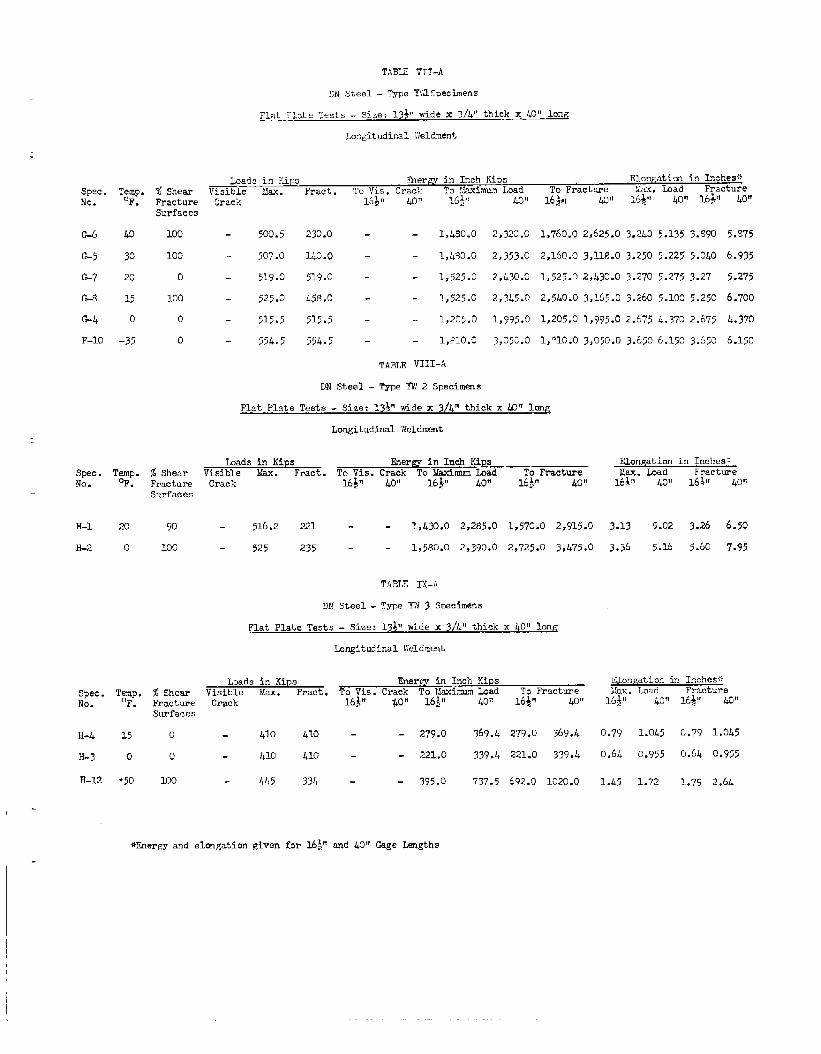
Loada in Kips l%er~ in Inch Kipa EloMation ifiInches+Visible Ma. Fract. Tc Vis. Crack ?0 !Ioxim<.nLoad To Fracture Max. Load Fracture
Crack 1~+,, &()!1 @,$ 40” 1.6JDJ 40 15+” w 16}’I ~ot,
500.5 230.0 - - 1,480.0 2,329,0 1,760.0 2,625.0 3,243 5.135 3.890 5.875
507.0 U+o.o - l,4~o.o 2,353.0 2,160.0 3,118.0 3.250 5.2255.040 6.935
519.0 519.0 - - 1,525.0 2,430.0 1,525.0 2,430.0 3.270 5.275 3.27 5.275
525.0 /+58.0 - - 1,.525.0 2,3L5.o 2,5/40.0 3,165.0 3.260 5.100 5.250 6.700
515.5 515.5 - - 1,205.0 S,?95.0 1,205.0 1,995.0 2.675 L.370 2.675 14.370
554.5 554.5 - - 1,$ ’10.0 3,05L.O 1, O1O.O 3,050.0 3.65o 6.150 3.&50 6.150
TABLE VIII-A
D?iSteel - Type W 2 Specimens
Flat Plate Tests - Size: 13$” tide x 3/4f~ thick x LO’t long
Loads in KipsVisible Max. Fract.Crack
516.2 221
52.5 23>
Longitudiml Weldment
Enerm in Inch Kips Elongation in Inches-=To Vis. Crack To Maximum Load To Fracture Max. Load Fracture16JJN ~olt 165” ~ofl 16$,1 &o t, 16iII 40” lb ~n ~~11
l,LX.O 2,285.0 1,570.0 2,915.0 3.13 5.02 3.26 6.50
1,580.0 2,390.0 2,725.0 3,475.0 3.36 5.16 5.6G 7.95
TABLE IX-A
DN Steel - Type W 3 Scecimens
Flat Plate Tests - Size: 13~,,tide x 3/L” thick x 40” hw
Long?t udinal Keldment
Loads in Kips Enerfl in Inch KiPsVisible Max.
ElonEatioc in IEChCS~-Fract. TO Vis. Crack To Maxinzm Load To Fracture M=. Load Fracture
Crack 16$” $01! 16#! @,t 16$” &oll @, ko,, 16$1, ~ott
410 /!10 - 279.0 369.1+ 279.0 369.L 0.79 1.045 C.79 1.olb5
111o Llo - - 221.0 339.4 221.0 339.k 0.6L 0.955 o.61+ C.955
445 334 - - 395.0 737.5 692.0 1020.0 1..L5 1.72 1.79 2.6L
*Energy and elon.gation given for 16~r1and 45‘lOagc Lengths

APPENDIX B——
LOAD ELONGATION DIAGRAMS
I,—. -..
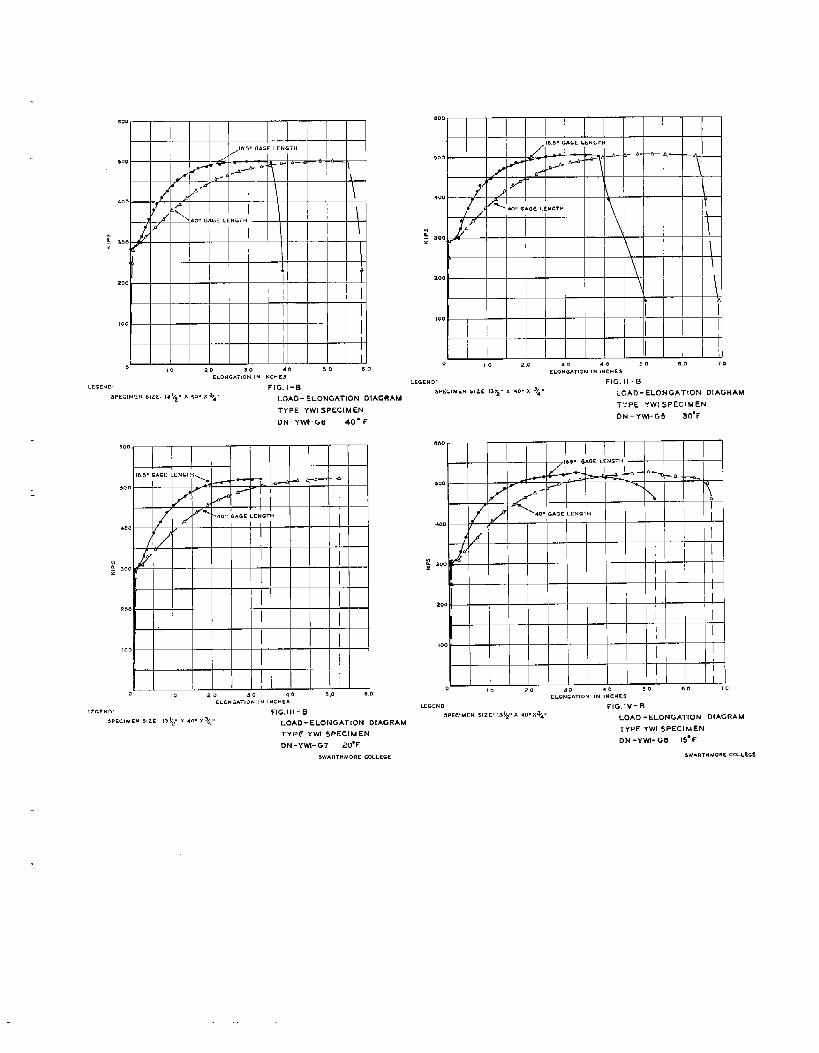
0 ,0 20 30 40 50 00ELOMGAT,ON IN INCHES
LEGEND. FIG. I-BSPECIMENS,ZE. 131$,,X 40” X+,,, LOAD- ELONGATION DIAGRAM
TYPE YWI SPECIMEN
DN-YWI-G6 40” F
000
,00
400
; =Oox
200
100
0 I o 2.0 ,0 40 50 8.0 70ELONGATION IN INCHES
LEGLND: FIG. 11-BSPECIMENSIZE. 13$2-x 40,, X 34,, LOAD-ELONGATION DIAGRAM
TYPE YWI SPECIMEN
DN-YWI-G5 30”F
600
I 1 I I I I I I
400
.! 300f
200
100
0 ,0 >0 30 40 5,0 0.0ELOMGAT,ON IN INCHES
L: Gc.b, FIG, III-BSPECIMENSIZE 13b2,,Y 40,,x~~,, LOAD -E LOld GATION DIAGRAM
TYPE YWI SPECIMEN
ON-YWI-G7 20*F
WJARTHIAORECOLLEGE
2x
0 !0 2.0 +0 50 e .0 70
ELO%ON IN INCHES
LEGEND FIG, Iv-BSPECIMEMSIZE, !9!2,, X 40<nX+4u LOAO ‘ELONGATION OIAGRAM
TYPE YWI SPECIMEN
DN-YWI-GS 15*F
9WAFITHMORE COLLEGE
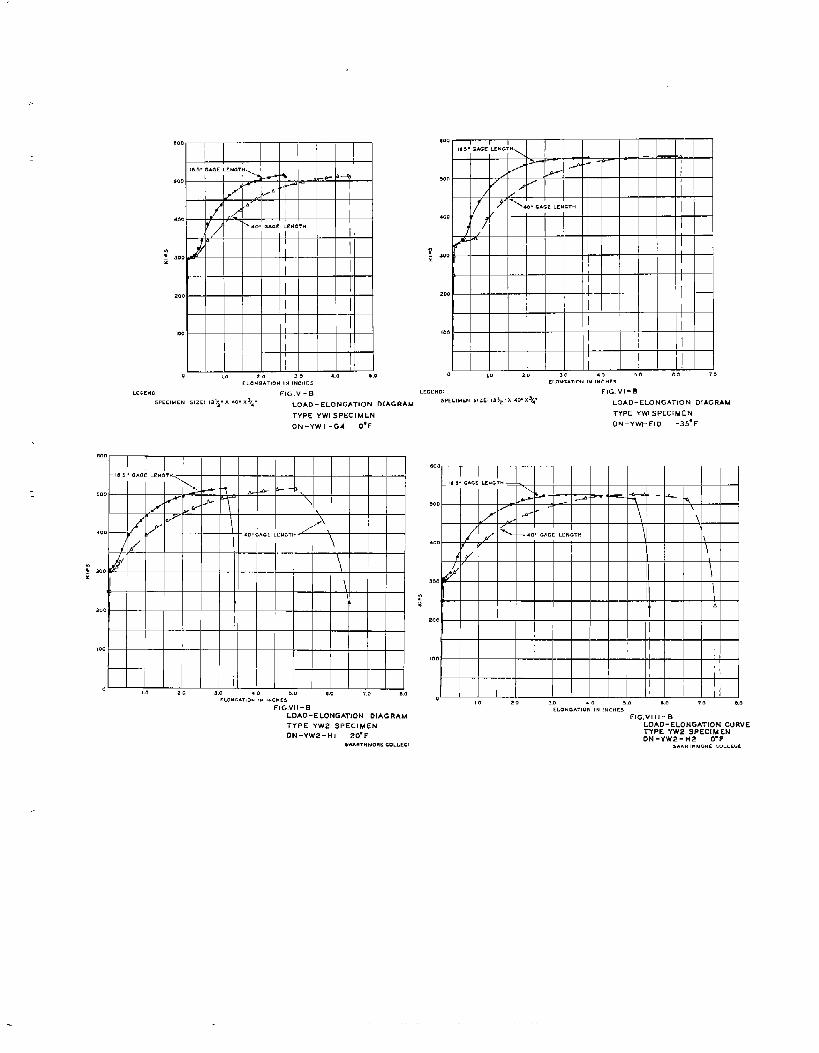
Eoo
*OO
400
.! 300*
200
100
0 ,.0 20 30 4,0 5.0CL0NGbT80N tti INCHES
000
500
,00
aoo
200
100
0 ,,0 2 D 50 t.o 70CLO::ATION IN I::HE5
LCGCND FIG. V-B LEGEND FIG. vi-B
SPECIMLN 51ZE: ,2!2,,x 40,, + LOAD - ELONGATION DIAGRAM
TYPE YWI SPECIMEN
DN-YWI -G4 o*F
5PECIMEN 51Zt: 19$2>,X 40” X~4- LOAD-ELONGATION DIAGRAM
TYPE YWI SPECIMEN
DN-YWI-FIO -35” F
m o
500
..0
m:.
300
:z
zoo
,00
ELONGATION!, I“G.ICS 0
FIG,VI I-B10 20 3.0 .0
CLOMCATION ,!4 ,MCHE5LOAO-ELONGATION DIAGRAM FIG, vI1l. B
,.0 ..0 ,. a.
TYPE YW2 SPECIMEN0N–YW2– HI 20” F
SWAPTHUORCCOLLtGl
LOAD-ELONGATION CURVETYPE YW2 SPEC[M ENDN-YW2-H2 O“F
,WARTHMORC.oLLtGt
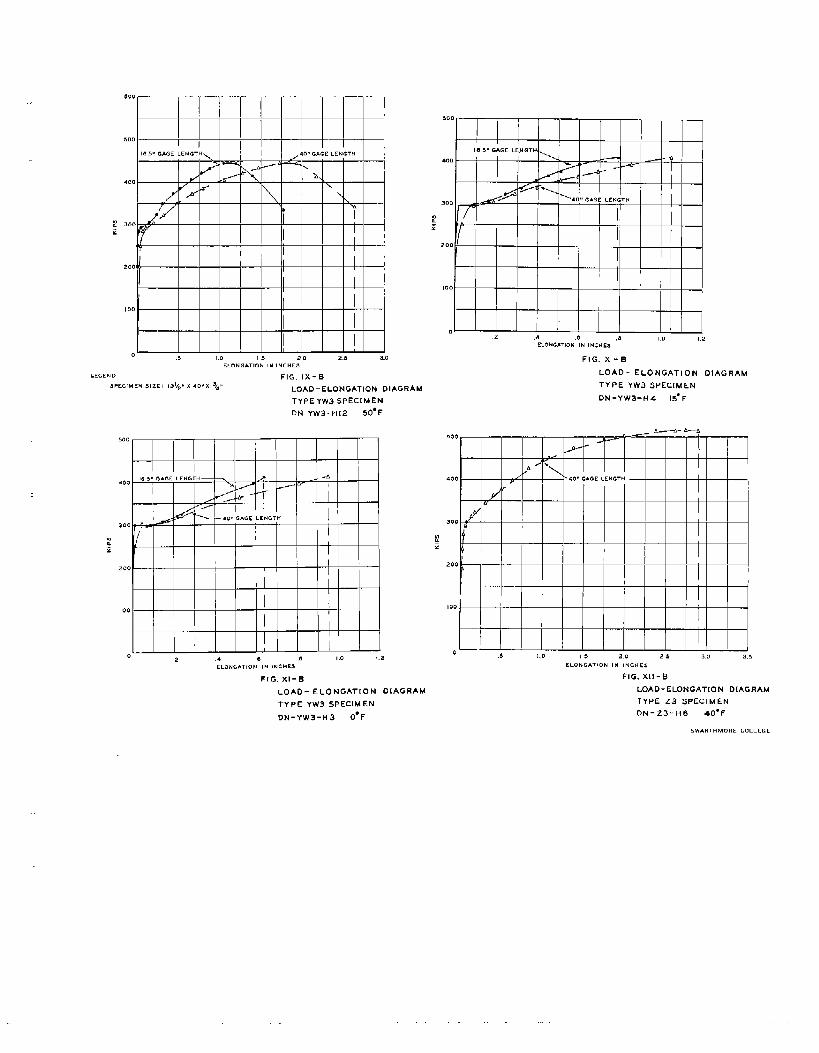
000
500 --—
400
f ~oo ?
zi
.200
100
0 .5 I ,0 !$ 20 2,5 3.0ELONGATION (N INCHES
LEGEUD FIG, IX-B5FECIMEN SIZE: !31/2,,X 40,’X 3,4’, LOAD-ELONGATION DIAGRAM
TYPE YW3 SPECIMEN
DN-Yw3-H12 50” F
500
●OO
300
:z
200
100
02 .4 e a I ,0 1,2
ELONGATION IN tNCMPS
FIG. XI-B
LOAD- ELONGATION DIAGRAM
TYPE Yw3 5PECIM EN
DN-YW3-H3 O*F
Soo
400
300
200
100
0,2 ,4 .0 .8 1.0 1,2
ELOUCAVON IN !MCME3
FIG. X-B
LOAD- ELONGATION DIAGRAM
TYPE YW3 SPECIMEN
ON- YW3-ti4 15” F
500—- A—b
400
300
200
100
0 .5 !,0 15 2.0 2s 3.0 3.5ELONGATION IN IN C14ES
FIG. XI I-B
LOAD-ELONGATION DIAGRAM
TYPE Z3 SPECIMEN
DN-Z3-H6 40” F
SWARTHMOFIE COLLEGE
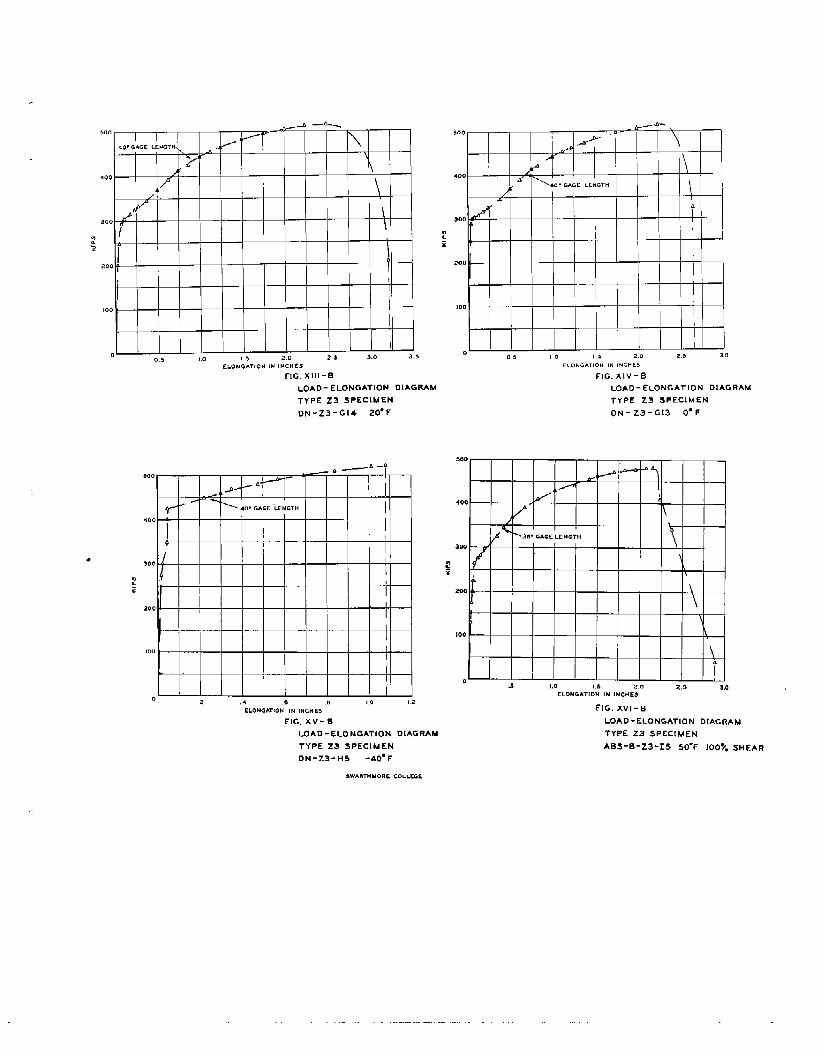
—b-
!.00I I dk---
40” GAGE LENGTH.A
r’---
? ‘\
400/x
/ ~
A\
300 ~
2z
;
*
~
200 ~
II
100
00,8 1.0 ,.5 2,0 25 3.0 3.5
ELONGATION IN INCHES
FIG. XIII-B
SooAA- \
\ ,
/ f-s-~
\400 dr
n’0.G6 GE u NG1’H
/ < IA
300 — - 1
:;
200
100
Io
05 10 1,5 2.0 2.5 S.O
ELONGATION IN tNCHE9
FIG. XI V-B
LOAD-ELONGATION DIAGRAM LOAD-ELONGATION DIAGRAM
TYPE 23 SPECIMEN TYPE 23 SPECIMEN
DN-z3-G14 20” F DN-z3-G13 O-F
.
~ —~ -f500, —
I I I I L--t- 7 I I I
r-“400
I
300
2?
200
}
100 I
I
I0
2 ,4 .e .8 1,0 1.2
ELOUGATION IN INLHE3
FIG. xV-B
..9 1,0 1.s 2,0 2,5
ELONGATION IN INCHES
FIG. XVI-B
LOAO-ELONGATION
3,0
DIAGRAM
LOAO-ELONGATION DIAGRAM TYPE 23 SPECIMEN
TYPE 23 SPECIMEN ABs-B-Z3-15 50*F 1007. SHEAR
DN-Z3-H5 -40” F
2,WARTHUORE COLLEGE
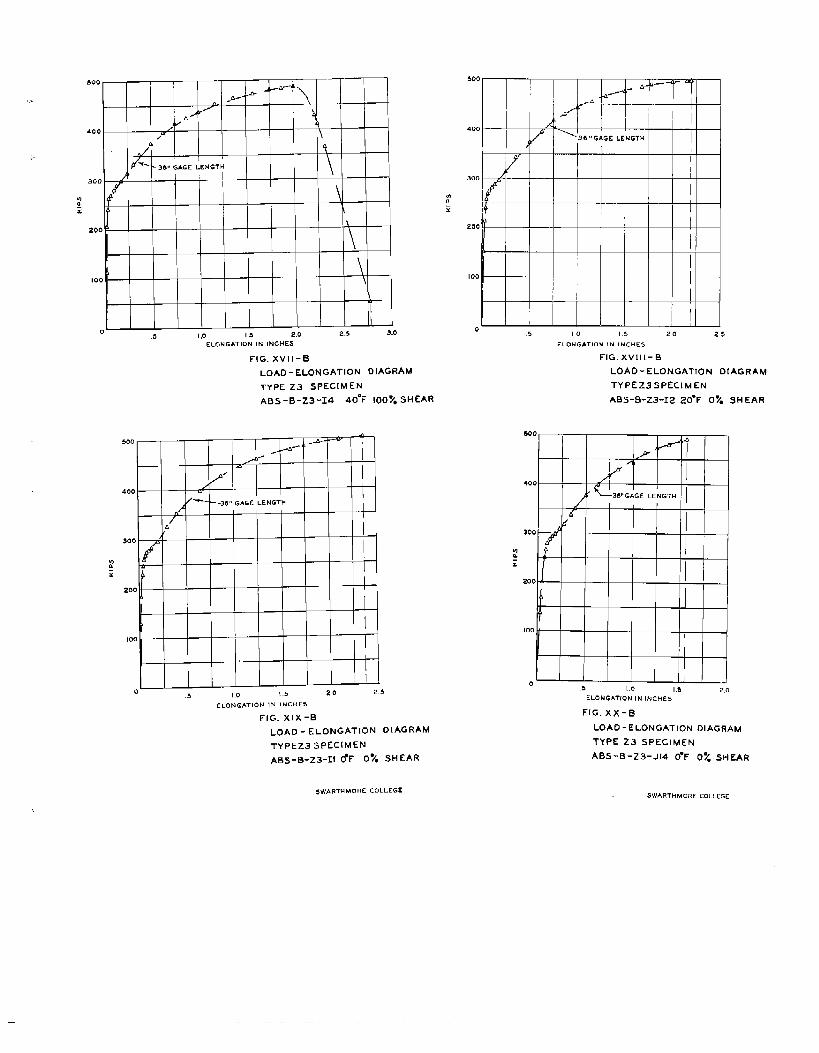
500A ,&--+
a,/
J-- >~% “T
A>
400 / .,
/ \1,
J ‘1
d- - 36= GAGE LENGTH
300 / ‘
m kf \ ,gx b
20 0’ ‘\
\10 0
\
I
o.5 1,0 1.5 2.0 2,5 3,0
ELONGATION IN INCHES
FIG. XVII-B
LOAD-ELONGATION DIAGRAM
TYPE 23 5PEC1MEN
AB5-B-Z3-14 40”F 100% SHEAR
500~- . i I
/ ->--
d J“_?,
400/ ]
/ ‘‘36,> GAGE LEHGT H
/A
300 /
~*
:
20 0
100
0 .5 1.0 I .5 20 2.$
EL0NG4T10N IN !NcHE3
FIG. XI X-B
LOAD-ELONGATION DIAGRAM
TYPE Z3 SPECIMEN
AB5-B-Z3-11 CfF O?, SHEAR
500
II <. =---’ b-‘- “~ -qA
#-I
400
) ~
/? :
~ 36i)GAGE LENGTH I
j’ I300 .—
fII
i200
100
..,5 10 1.5 20 25
ELONGATION IN INCHES
FIG, xv III-B
LOAO-Elongation DIAGRAM
TYPEZ3SPECIMEN
ABS-EI-Z3-12 zO”F 0% SHEAR
500@
/-1 ,
400 / F
/ ‘<
308) GAGE LE NGTH
d-
300 P d
f~
t
:
200
/
100I
I
o1
,5 1.0 1,5 2,0ELONGATION IN INCHES
FIG.xx-B
LOAD-ELONGATION OIAGRAM
TYPE 23 SPECIMEN
AB5-B-Z3-J14 O-F O% SHEAR
$wAWHMOPC COLLEGESWARTHM08E COLLEGE
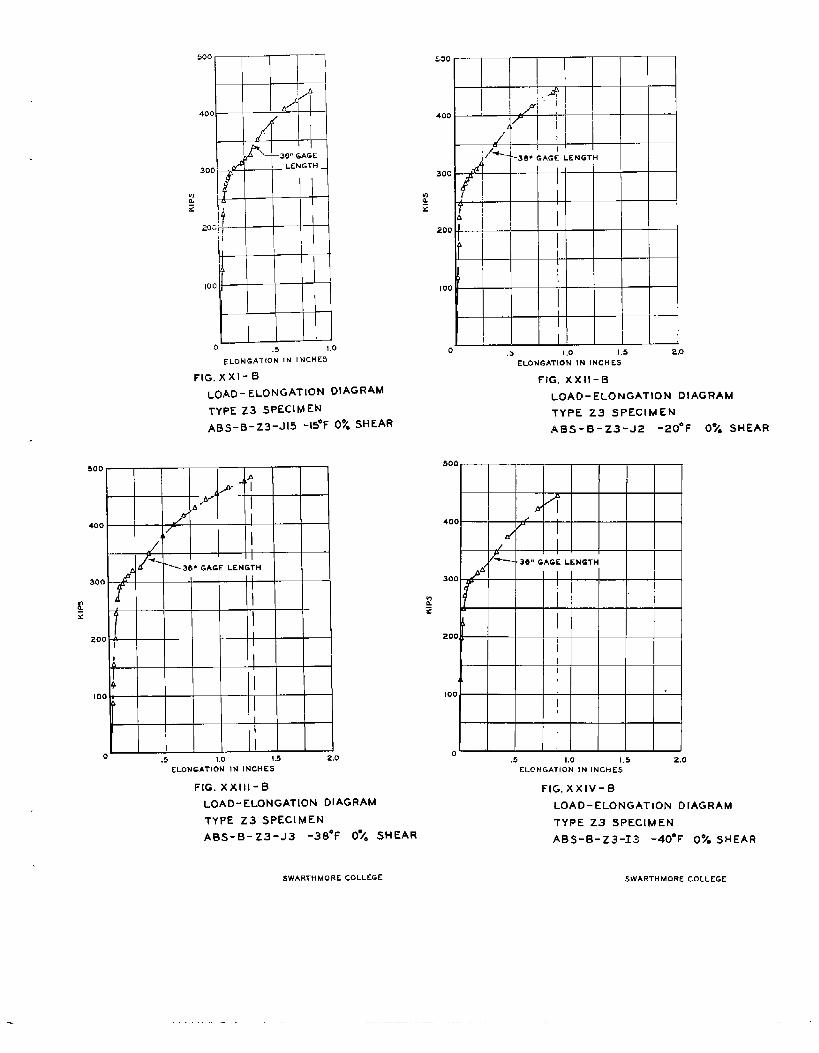
500
1
.——
#
400 ~f
1
I
—36” GAGE
30 0 / A LENGTH _
~ /’n
z4
20 +
[
L
100
I
o .5 1.0
ELoNGATION IN lNCHEs
FIG. XXI-6
LoAD - ELONGATION DIAGRAM
TYpE Z3 sPECIMEN
ABS-B-Z3-J15 -15*F 0% SHEAR
500
,,/ “‘fA“
400 Y !
IhT
/II
# ~=36- GAGE LENGTH
300 I
cf
:
.20 0I
I4
4
10Oi
0“ .5 1.0 I .5 2.0
ELONGATION IN INCHES
FIG. XX III-B
LOAD-ELONGATION DIAGRAM
TYPE Z3 SPECIMEN
ABS-B-Z3-J3 -38*F 0~, SH EAR
>“”——..
-.—
i J ‘:@il
4007
L,
~i
/ I
/+---1
’36* GAGE LIZMGT H
300
1
200 -
>
100
0 ,5 I ,0 1.5 2.0
ELONGATION IN INCHLS
FIG. XX II-B
LOAD-ELONGATION DIAGRA
TYPE 23 SPECIMEN
ABS-E-Z3-J2 -20e F 0%
500-
N 2400 1
d p/
?- .36s8 GAGE LENGTHb’
300 I
I200
100
“,5 1,0 1.5 2.0
ELONGATION IN INCHES
FIG. XXIV-B
LOAD-ELONGATION D[
TYPE Z3 SPECIMEN
ABS-B-Z3-13 -40”F
M
SHEAR
AGRAM
0% sHEAR
SWARTHMORC COLLEGE $WARTHMORE COLLEGE
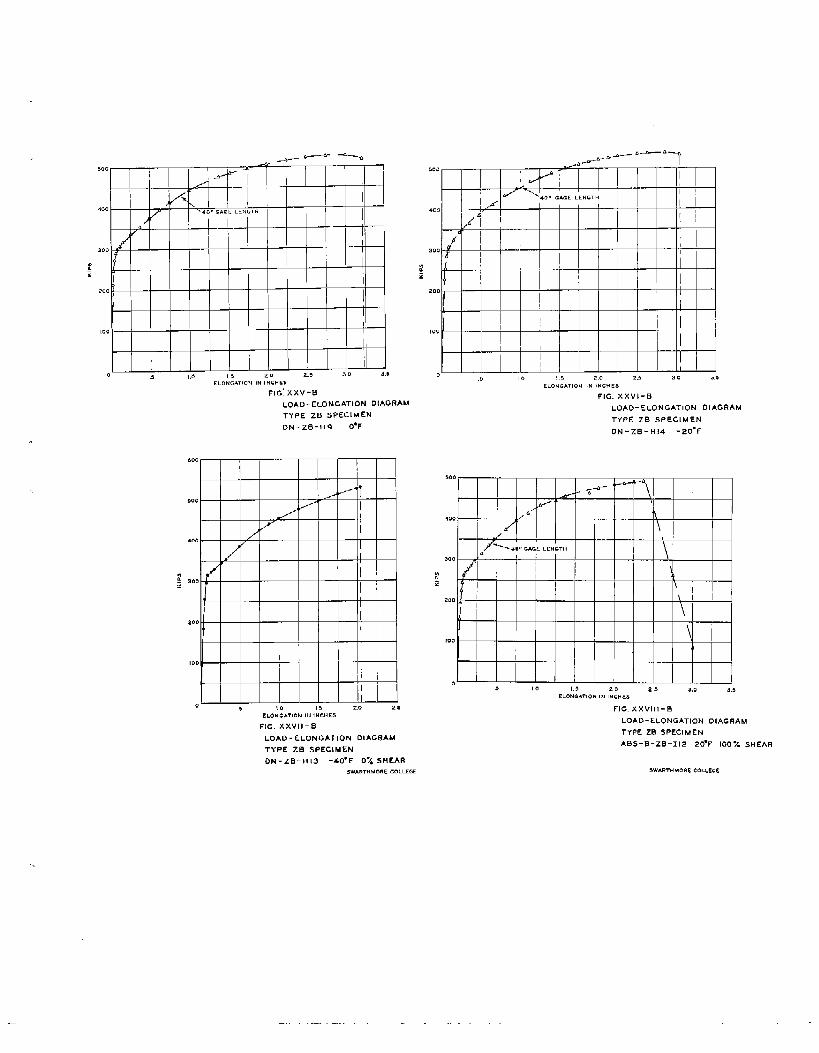
50
40
30
i’2
20
10
5
ELONGATION IN INCHES
FIG: XXV-B
LOAD-ELONGATION DIAGRAM
TYPE ZB sPECIMEN
DN-ZB-HQ O*F
600
aoo
400
“: aoox
200
100
0 s 10 ,5 2.0 25CLONC+TION IN INCHES
FIG, XXVI I-B
LOAO-ELONGATION DIAGRAM
TYPE ZB SPECIMEN
ON- ZB-H[3 -40” F O% SHEAR
SWA~THtiORE COLLEGE
500
+00
300
i’:
200
100
0 . 10 !.5 2.0 23 30 3,5ELONGATION IN INCHES
FIG. XXV I-B
LOAO-ELONGATION DIAGRAM
TYPE ZB SPECIMEN
DNUZB-H!4 -20”F
500
400
300
?~
200
100
.9 10 1,5 20 25 3,0 3.5
CLONGAT,ON IN INCHES
FIG.XXVIII-S
LOAD-ELONGATION DIAGRAM
TYPE ZB SPECIMEN
AB$-B. zB-112 20”F IOOY. SHEAR
SWARTHMORE COLLEGE
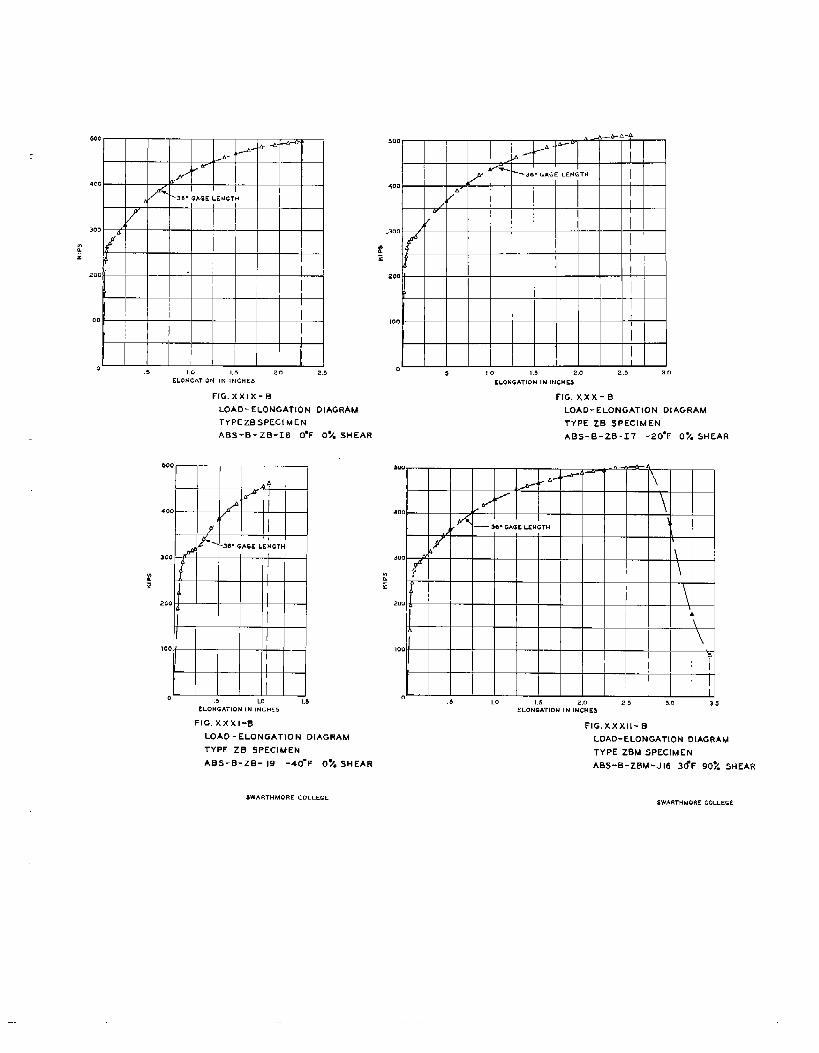
500.& 4- -~’
.9- ‘+
F
400 a
x -t
b ’38” GAGE LENGTH!
300 &
:
:
zoo
100
0 ,5 1.0 1.5 20 2.5ELOMGATION IN INCHES
FIG. XXIX-B
LOAD-ELONGATION DIAGRAM
TYPE zBSPECI MEN
ABs-B-Z6-16 o*F 0% SHEAR
500
a
/ I
400 P
+~
f
@ 2
L ’36. G4GE LENGTH
300 I
t{ I 2
:
/
1 E
200
100
0 ,5 1,0 1.5ELONGATION IN ItKHES
FIG. XX XI-B
LOAD-ELONGATION DIAGRAM
TYPE ZB SPECIMEN
AES-B-ZB - 19 -40-F O~. SHEAR
500~_c-A.A
I
I >.~+“ ‘“-l/ ’36.GAG E LEFJGTH
4004“
f/
w
.300 / ~
[
zoo I
!I
100 — — — — — — — — — — - —
05 !0 i .5 2.0 2.5 3.0
ELONGATION IN IFJCHES
FIG. XX X-B
LOAD-ELONGATION DI
TYPE ZB SPECIMEN
ABs-B-ZB-17 -20”F
AGRAM
0% SHEAR
n-”N400 / \
if+
J ‘— 36. GA(3E LENGTH
f
k
b2?00 M
t
\
200 . , \\
A\
100b
o.3 Lo 1,3 2,0 25 3.0 35
ELONGATION IN IUCHES
FIG. xx XII-B
LOAD-ELONGATION DIAGRAM
TYPE Z9M SPECIMEN
ABs-B-zBM-J16 3&F 90% SHEAR
SWARTHMORE COLLEGESWARTHMORE COLLEGE
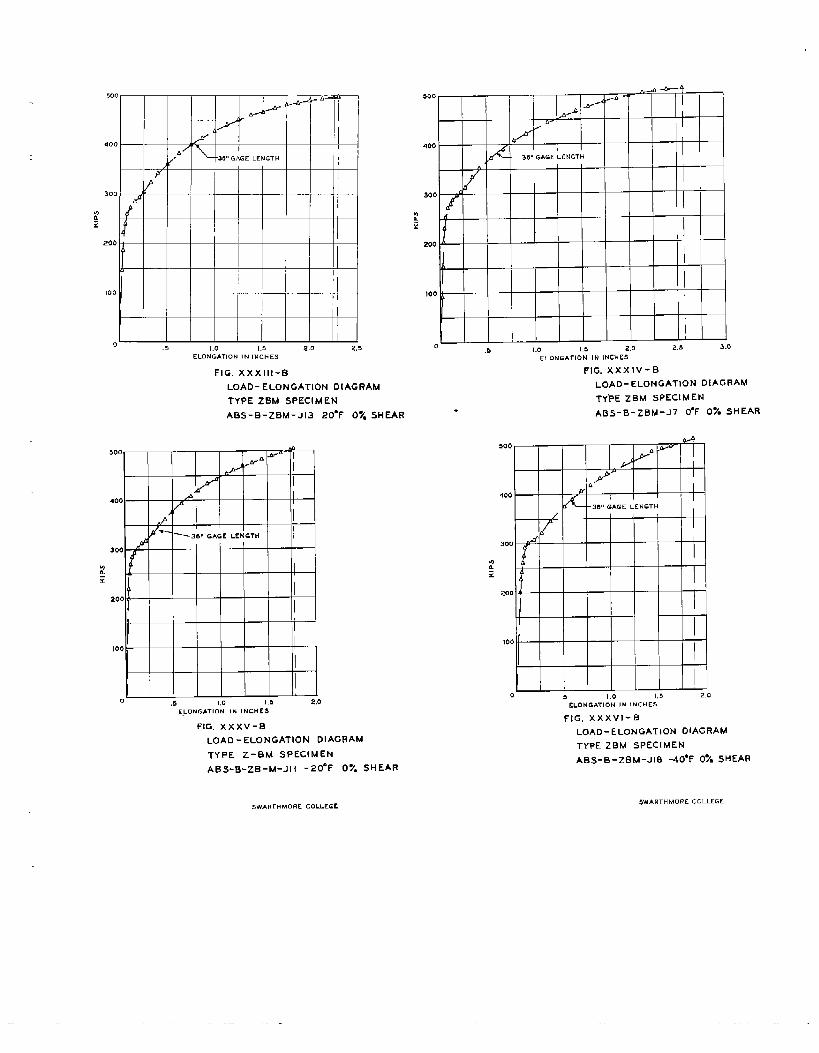
500 A~’
+ +-
i*--J+“
1,
400 —— /
b“‘3 fl” GAGE LENGTH
.. ) L — — — — — — - —
300 /
(f—. . —... -
2 tz
!200
—
100
I
I0 .5 1,0 1,5 2,0 2,3
ELONGATION IN INCHES
FIG. XX XIII-B
LOAD- ELONGATION DIAGRAM
TYPE ZBM SPECIMEN
ABS-B-ZBM-J13 20”F O% SHEAR
500A
.~”- -1.A@
a
400 +
) t
6
*P-
’38” GAGE LENGTH
300 H’@
~
z
i200
I
100
0 ,5 1,0 1.5 2,0
LLONGATION IN INCHES
FIG. XX XV-B
LOAD-ELONGATION DIAGRAM
TYPE Z-BM SPECIMEN
ABS-B-ZB-M-JII -20”F 0% SHEAR
500 .,,. — d++
/ “A
/w
I400
—30,, GAGE LCNGTH
300 0
f
~ dx
200 ~
L
100
0.5 1.0 1.5 2.0 2,5 3.0
ELONGhTION IN lNCHEs
FIG. XX XIV-6
LOAD-ELONGATION DIAGRAM
TYPE zBM sPECIMEN
AB5-B-ZBM-J7 O-F 0% SHEAR.
500@
n .n-
>d F
b
400
-32$,, GAGE LENGTH
/ I
b1
300
fa
%z
1
200 . .
100
0 .5 1,0 1,5 2.0
ELONGATION III INCHES
FIG. XX XVI-6
LOAD-ELONGATION OIAGRAM
TYPE ZBM SPECIMEN
ABS-B-ZOM-J18 -40*F 0% SHEAR
SWAF!THMORE COLLEGE5WARTHMORC COLLEGE
..-
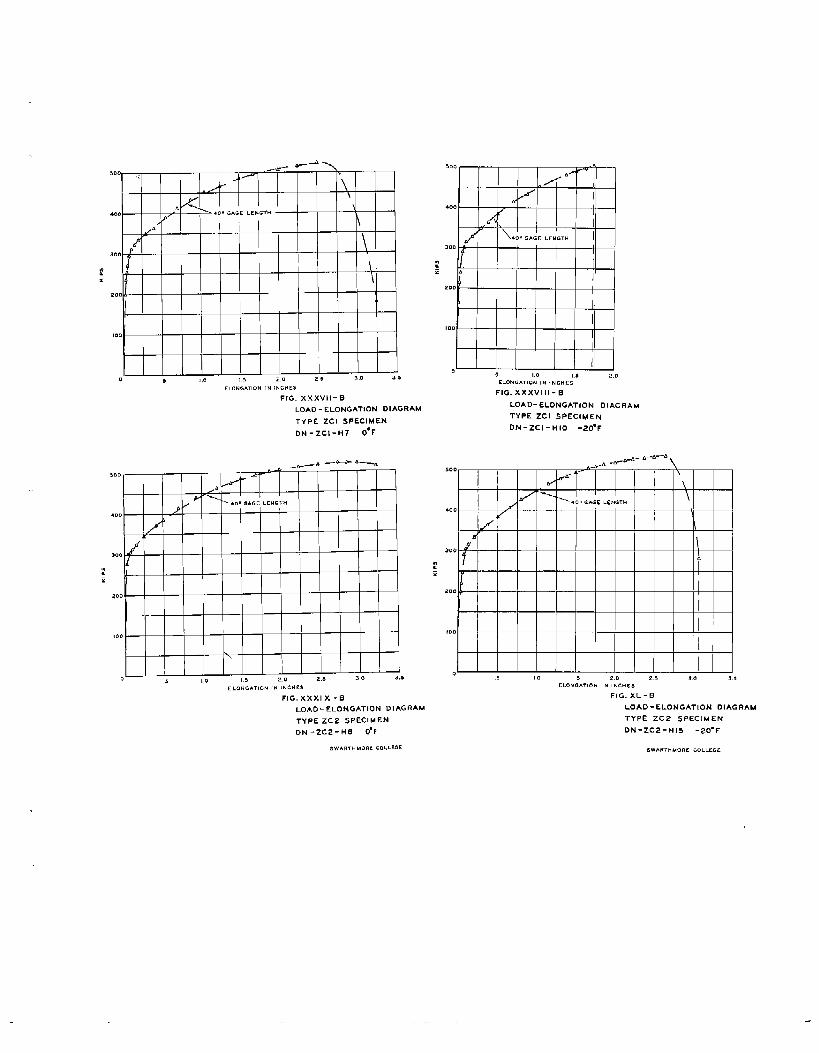
:.
5
ELONGATION IN INCHES
FIG. XX XVII-B
LOAD - ELONGATION DIAGRAM
TYPE ZCI SPECIMEN
DN-ZC1-H7 o*F
.. ,.ELONiATl ON IN (.cu~~
FIG, xX XIX -B
LOAD-ELONGATION DIAGRAM
TYPE ZC2 SPECIMEN
DN-ZC2-Ha O-F
FIG. XX XVIII-B
LOAD-ELONGATION DIAGRAM
TYPE ZCI SPECIMEN
DN-ZCI-HIO -20” F
500
.00
300
:;
zoo
,00
0., ,0 I 5 2,0 2.5 >.0 3.9
LLONG.T, ON IN !NCHCS
FIG. XL-B
LOAD-ELONGATION OIAGRAM
TYPE ZC2 SPECIMEN
DN-ZC2-H15 -20” F
$WARTHMOflE COLLEGE
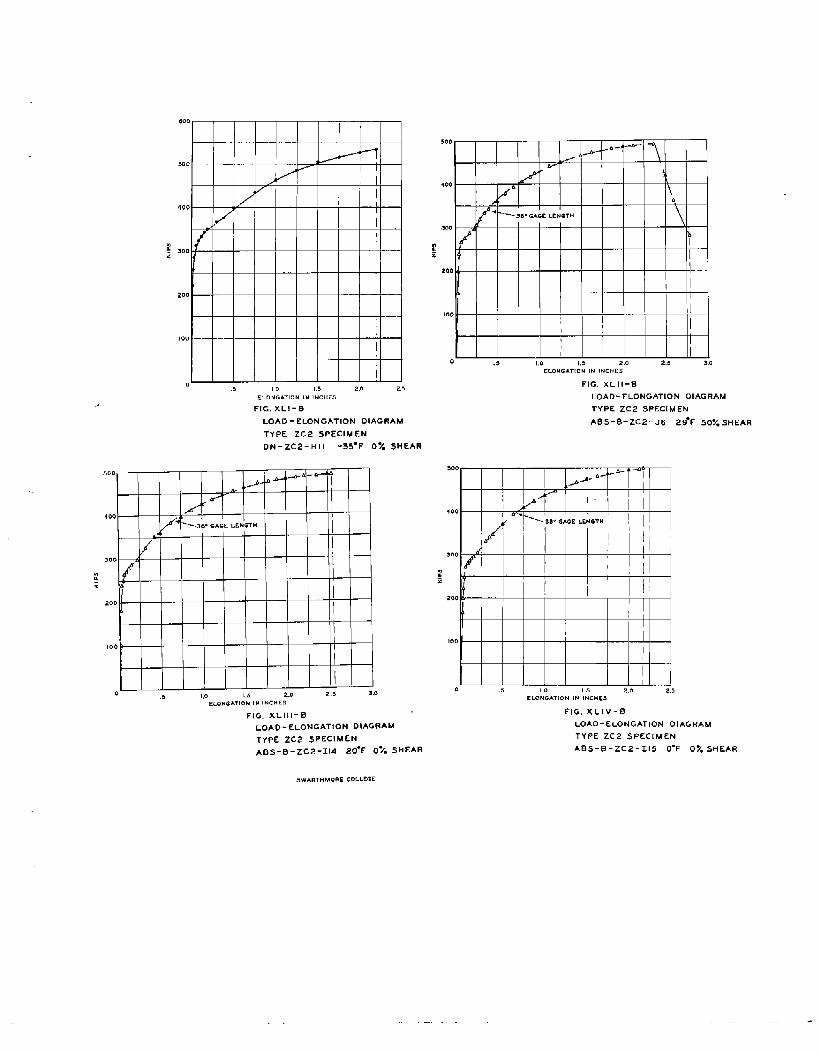
600
500/ ‘--T
> -----
/-’ ~
0--
/
400 I
I
.s 300i
,.-.
I200 - I
III00
III
0.5 10 1.5 2,0 2,3
ELONGATION IN INCHES
FIG. XL I-B
LOAD-ELONGATION DIAGRAM
TYPE ZC2 SPECIMEN
DN-ZC2-HII -35-F 0“/. 5H EAR
?z
0 ,5 1,0 1.5 2.0 2.5 3,0
ELONGATION IN IPJCHE5
FIG. XL III-B1
LOAD-ELONGATION OIAGRAM
TYPE ZC2 SpEc[MEN
ABS-B-ZC2-114 20”F 0% SHEAR
ELONCATIO”N IN INCHES
FIG. XL II-B
LOAD-ELONGATION DIAGRAM
TYPE ZC2 SPECIMEN
ABS-B-ZC2-J6 29-F 507. SHEAR
/4’” 1
300
f
dI
“1;
I
200
100
I
10 ,5 1.0 1.5 2,0 2,5
ELONGATION IN INCHES
FIG. XL IV-B
LOAD-ELONGATION OIAGRAM
TYPE ZC2 SPECIMEN
ABS-B-ZC2- 115 O-F O~SHEAR
sWARTHMORE COLLEGE
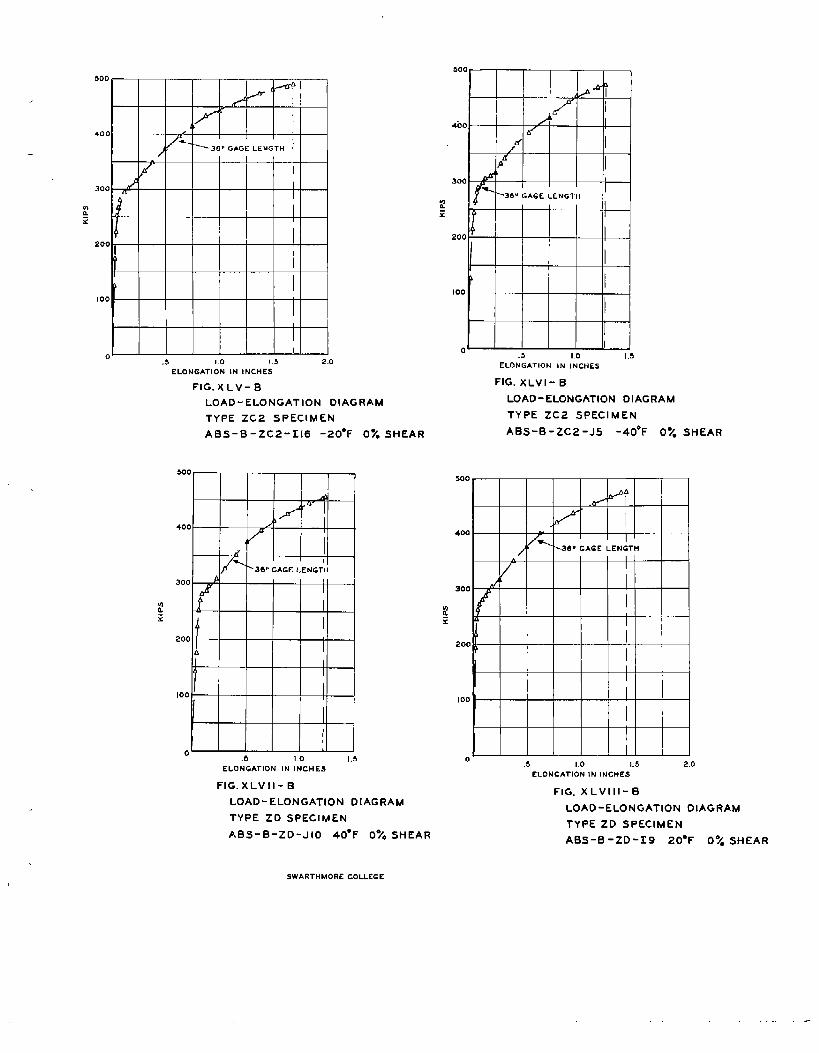
500+~-”
,+-i‘1r
1
400I
/ y%
~3131S GflGE LENG TH
300 2a
03& 1x
200I
1
100
Io
.s 1.0 !,s 2.0
ELONGATION IN INCHES
FIG. xLV-B
LOAD-ELONGATION DIAGRAM
TYPE ZC2 SPECIMEN
ABs-B-ZC2-116 -20”F O~. SHEAR
500
r~A
400 / i
i
2
\ I‘3ei, GAGE LENGTH
300
#
b
a& f
z
200
4
d,
100 #
o,5 Lo 1.5
ELONGATION IN INCHES
FIG. XLVII-B
LOAD-ELONGATION D[AGRAM
TYPE ZD SPECIMEN
ABS-B-ZD-JIO 40”F 0~0 SHEAR
900
n
-“”””-:7’“ ;4bo -
d
d
dP
300 k’
~36” GAGE LENGTH
2 IE
200
I1
100
0I
.5 1.0 1,5ELONGATION IN INCHES
FIG. XLVI - B
LOAD-ELONGATION DIAGRAM
TYPE ZC2 SPECIMEN
ABS-B-ZC2-J5 -40*F 0% SHEAR
500-
A
/ ‘1
I400
I
/’ ~- ‘30,, GAGE LENGTH
300 d ~
2E
200
100
0.5 I ,0 1.5 2.0
ELONGATION IN INCHES
FIG. XL VIII-B
LOAD-ELONGATION DIAGRAM
TYPE ZD SPECIMEN
ABS-B-ZD-T9 20”F 0% S!i EAR
SWARTHMORE COLLEGE
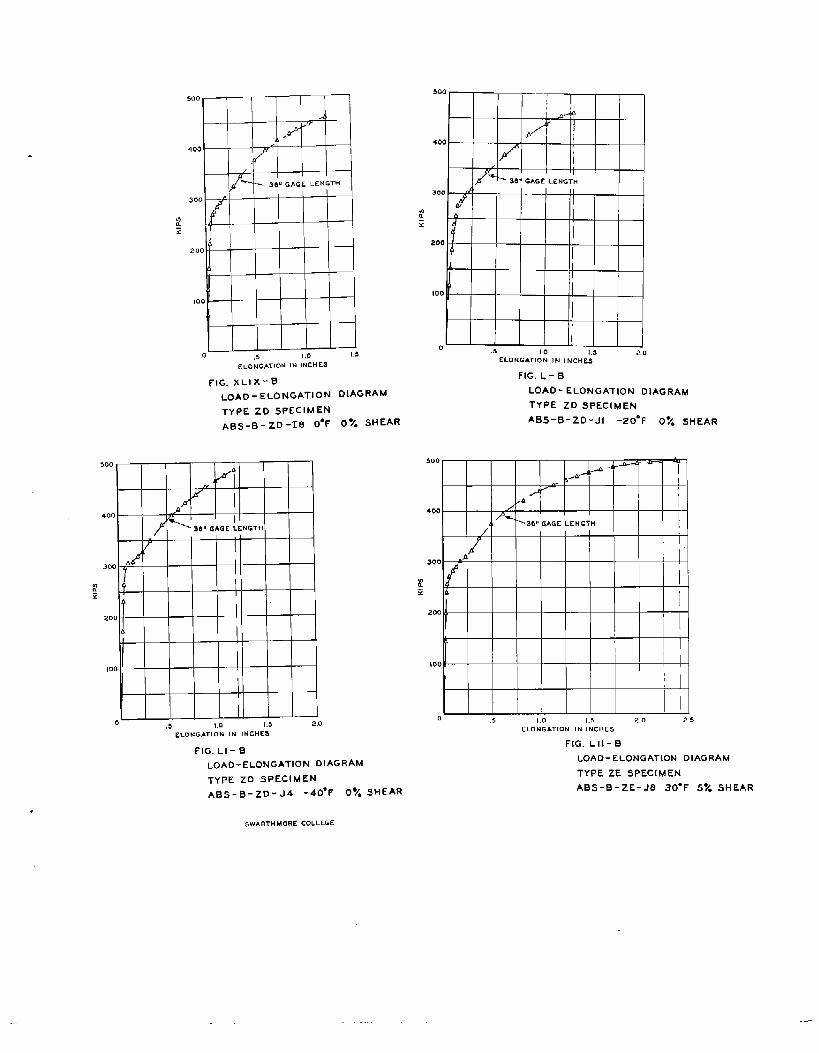
500500
-—.—
A .I
A
,2 “> P400
400 — -—
/ I/
%
Pf 3 6“ GAGE LEN GTH --30” GAGE LENGTH
300 - J, I300
&
n : &m
4 ::
200 f
20 0 ~
J
100100
00 ,5 1,0 1,s .5 10 1,5 2.0
ELONGATION IN INcHLs~LONGATION IN INCHES
FIG. L - BFIG. XL IX-S
LOAD-ELONGATION DIAGRAMLOAD-ELONGATION DIAGRAM
TYPE ZD SPECIMENTYPE ZD SPECIMEN
ABS-B-ZD -18 O*F 0%% SHEARABS-B-ZD-JI -20” F 0~. SHEAR
500
I
#’A*
400 — — “
f eI
36,, GAGE LENGTH
(
300
r& ?x
A
20 0-
,5
100
I
0 ,5 I ,0 1.5 2,0
ELONGATION IN lNCHEs
FIG. LI-B
LOAD-ELONGATION DIAGRAM
TYpE 20 SPECIMEN
AB5-B-ZD-J4 -4o”F 0% SHEAR
500
/b> ,+ -’ ‘-A--+ +-~
5
/ ~
I
4
400 / ‘P-
t, ~36,, GAGE LENCT H
/
300 /
tz A
200
100
0 .5 I ,0 1,5 20 2.5ELONGATION IN INCHES
FIG. LII-B
LOAD-ELONGATION DIAGRAM
TYPE ZE SPECIMEN
ABS-B-ZE-J8 30” F 5% SHEAR
5wARTHMORE COLLEGE
.-
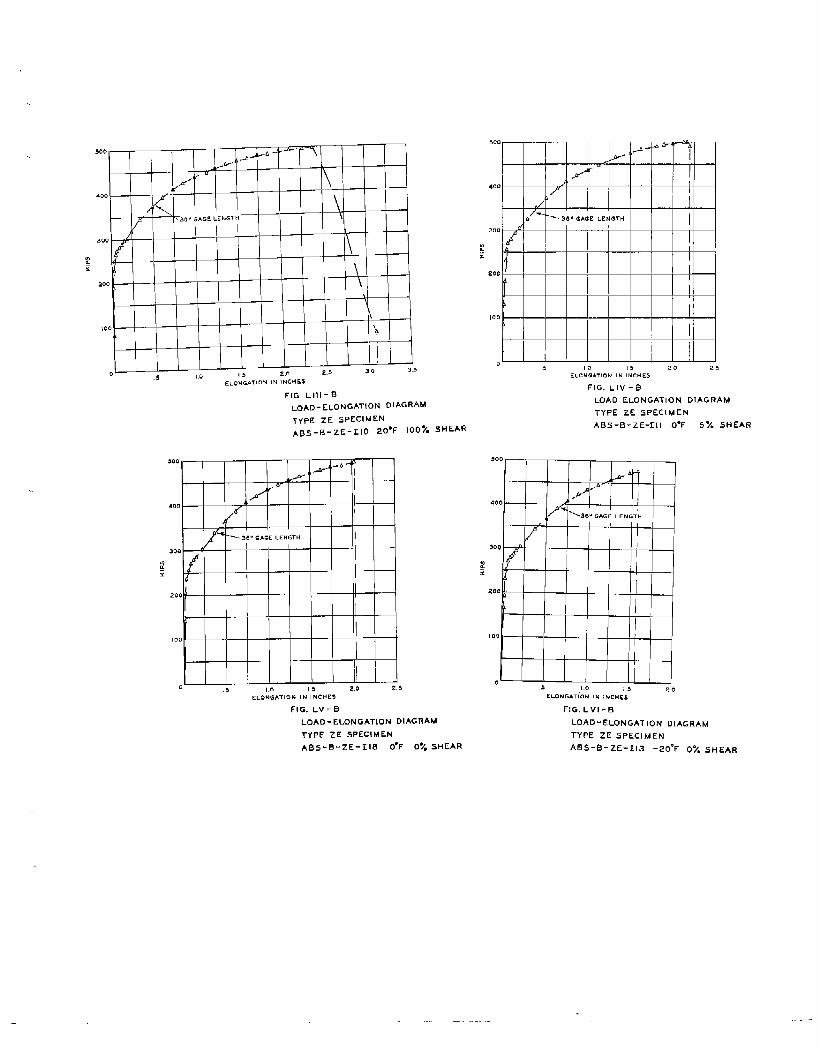
300 .A J -a-’ ‘ \
.4 ~a--“
,,/-’‘“ \400
/\
>30,, GAGE LLNGT H \
\
30 0 /
\
20 0
— I
\
, 00h
.- —
I
0 !.5 2.0 2,5 30 3.5.5 1.0
ELONGATl ON IN INc HL$
FIG. LIII-B
LOAD-ELONGATION DIAGRAM
TYPE ZE SPECIMEN
ABS-B-ZE-110 20”F 100% SHEAR
900 &/’ ‘-4 I
7’ ‘r-4 I
400 (b ]
f’d
w~38q, GAGE LENGTH
300
f*
d
200
\
100
0 .5 1,0 1.5 2.0 2,5
ELONGATION IN INCHES
FIG. LV-B
LOAD-ELONGATION DIAGRAM
TYPE ZE SPECIMEN
ABs-B-ZE-118 O*F 07, SHEAR
5C0-J- A
4-- A
A---<‘
/’ ‘ -400 /’ I
,/ ‘[( “f-‘ 3.5° GAGE LENGTH
300 —
f o
1—x
200
1003
010 15 20 25
ELONGhTlON IN INCHES
FIG. LIV-B
LOAD ELONGATION DIAGRAM
TYPE ZE SPECIMEN
ABs-B-z E-111 O*F 5% SHEAR
500
-A ~
,, / ‘
4 -A
400
/’ ~36” GAGE LENG TM
/’
1
30o I
~x
zoo
P
100I
II
0.9 1,0 1,5 20
ELONGATiON (N INCHES
F[G. LVI-B
LOAD-ELONGATION DIAGRAM
TYPE ZE SPECIMEN
ABS-B-ZE-113 -2o”F 0~. S HEAR
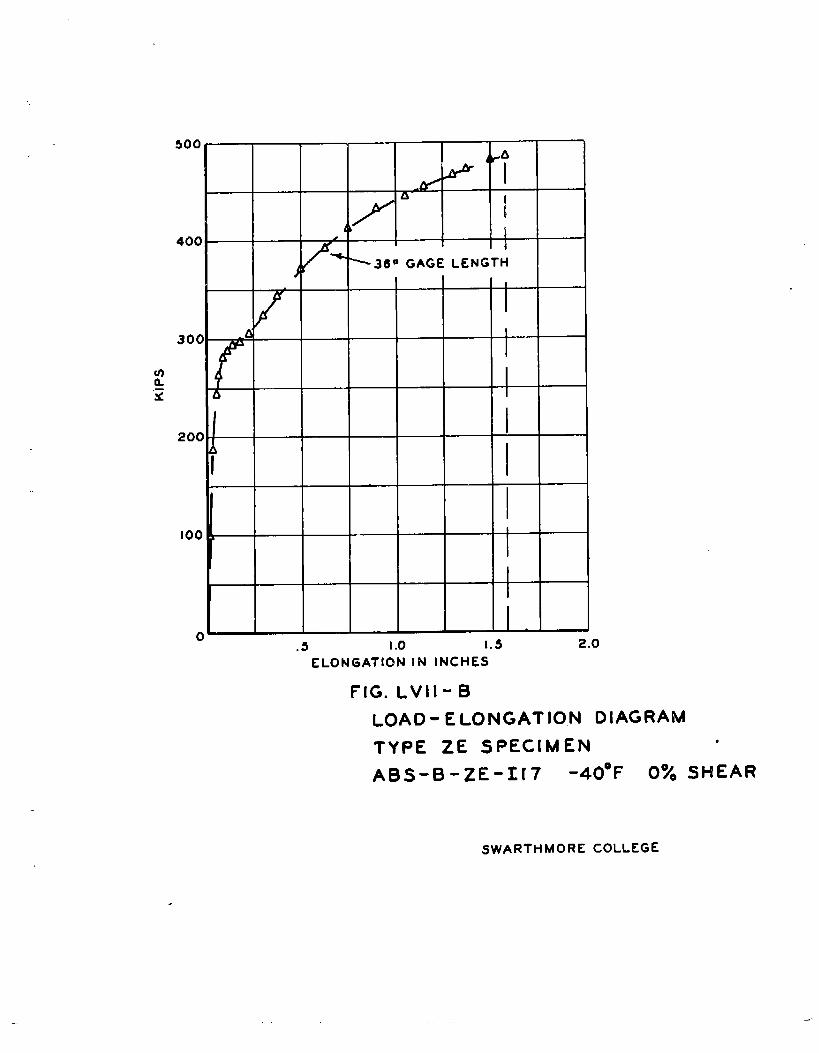
500 “
4r A
A-1th
400 1I
)=360 GAGE LENGTH
I
300 n‘
m&z b
200a
I
100
0.5 1.0 1.5 2.0
ELONGATION IN INCHES
FIG. LVII-B
LOAD-ELONGATION DIAG
TYPE ZE SPECIMEN
ABS-B” ZE-1[7 -40”F
RAM●
O% SHEAR
SWARTHMORE COLLEGE
APPENDIX C——
SPECIMENS AND SPECIMEN.— — FABRICATION
The general specimen Types, YW and Z, have been described
before and drawings have been presented wlnichshow the geometry
involved. However, due to the great number of variations in
geometry and materials used, Table I classifies the test speci-
mens in a more explicit manner.
Specimens of the YW series were fabricated by flame cutting
the main platel 10 l~f2in. by 4-0in. by 3/k in.~ and four side
plates$ 1 li2 in. by 12 1/2 in. by 3/4 in. Specimens of the
YM-1 series were further prepared by flame cutting double bevels
on the 10 li2-in. by 40-in. plate from the end for a distance of
12 1/2 in. along the sides$ and flame cutting double bevels on
one edge of each of the side plates; while specimens of the YW-2
and YW-3 series had only the side plates beveled. The side plates
were then welded to the main plate! a.n.dthe specimen faired by
flame cutting tangent to the nain plate. The side plates of
specimens of Type YW-3 were cut tangent to the main plate~ but
a 3/4-in. shoulder remained between the side plate and the main
plate. Fig. 1 shows the specimen geometries and fabrication
technique.
Specimens of Type Z-3 (See Figs. 2 and 3) were designed to
represent a square cut-off of an interrupted longitudinal or
stiffener. It was thought that the restraint at the ends of the
.- —,
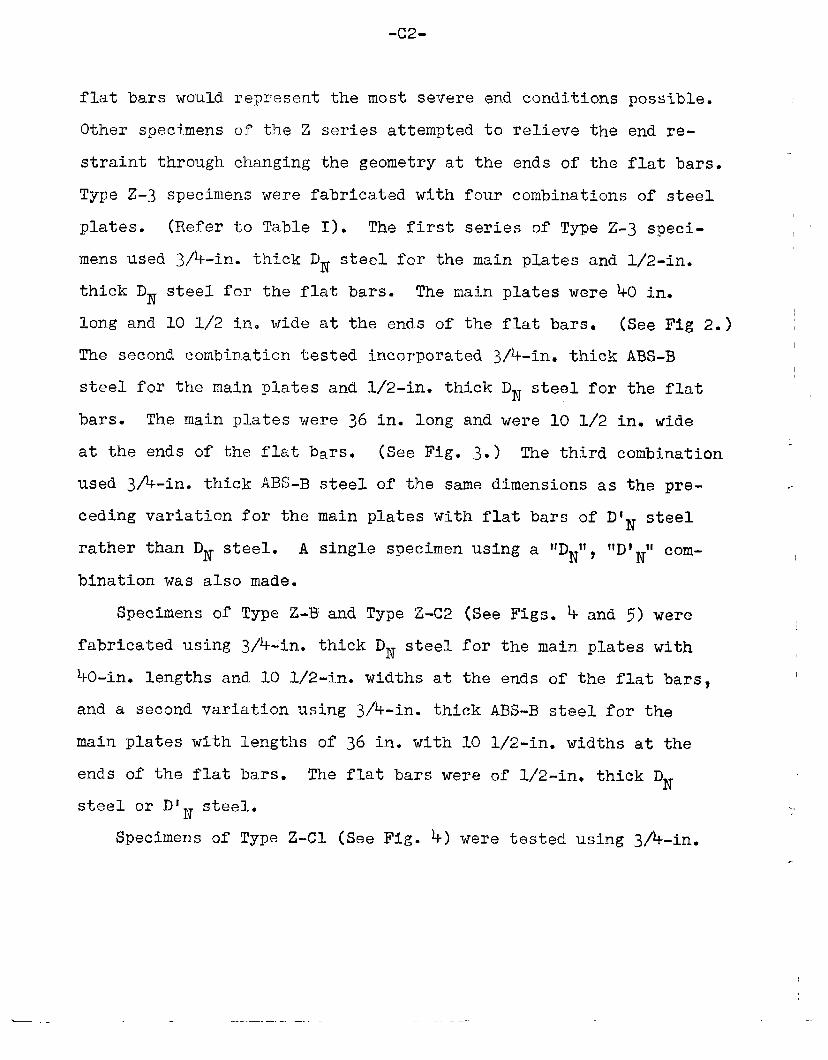
-c2-
flat bars would rep~esent the most severe end conditions possible.
Other specimens of the Z series attempted to relieve the end re-
straint through changing the geometry at the ends of the flat bars.
Type Z-3 specimens were fabricated with fou~ combinations of steel
plates. (Refer to Table I). The first series of Type Z-3 speci-
mens used 3\\-in. thtck DN steel for the main plates and l/2-in.
thick DN steel for the flat bars. The main plates were %0 in.
long and 10 1/2 in. wide at the ends of the flat bars. (See Fig 2.) ~I
The second combination tested incorporated 3/4-in. thick ABS-B
steel for the main plates and l/2-in. thick DN steel for the flat
bars. The main plates were 36 in. long and were 10 1/2 in. wideI
at the ends of the flat bars. (See Fig. 3.) The third combination;
used 3/%in. thick ABS-B steel of the same dimensions as the pre- .-
eeding variation for the main plates with flat bars of D’N steel
rather than DN steel. A single specimen using a !lDN~l,‘lD~N1icom- 1
bination was also made.
Specimens of Type Z-B and Type Z-C2 (See Figs. k and 5) were
fabricated using 3/4-in. thick DN steel for the main plates with
40-in. lengths and 10 l/2-in. widths at the ends of the flat bars,
and a second variation using ~/4-in. thick ABS-B steel for the
main plates with lengths of 36 in. with 10 l/2-in. widths at the
ends of the flat ba~s. The flat bars were of l/2-in. thick DN
steel or D’N steel. ..
Specimens of Type Z-Cl (See Fig. 4) were tested using 3/%-in.
—._
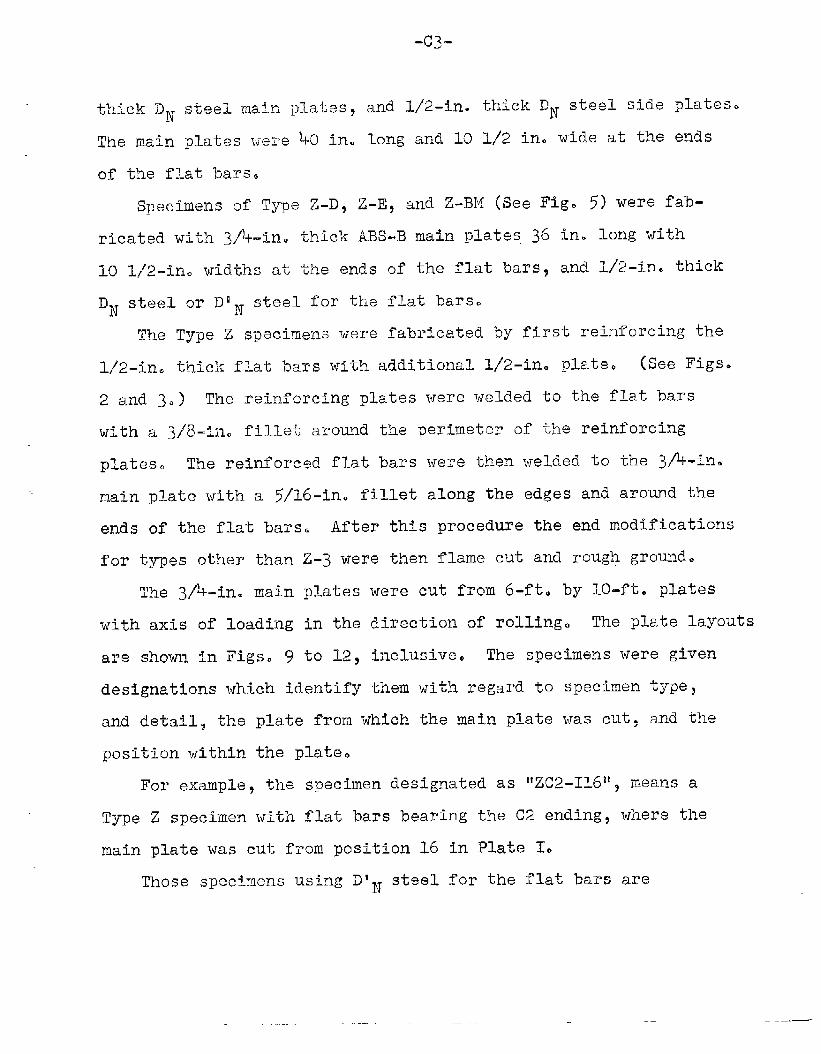
thick DN steel -mainpIat~s~ and ~/2-ine thick DITsteel side plates.
The main plates were hO in. long and 10 1/2 in. wide at the ends
of the flat bars.
Specimens o??Type Z-DY Z-E, and Z-BM (See Fig. 5) were fab-
ricated with 3/]+-in.thick ABS-B main Plates.36 in. long with
10 l/.2-in.widths at the ends of the flat barsl and lf12-in.thick
DN steel or D~q steel for the flat bars..L
The Type Z specimens were fabricat~d by first rein~orcing the
~\2_in0 thick flat b?.rswith additional l/2-in. pb.te. (See Figs.
2 and 3.) The ~einf~rcing plates wer@ weld@d ‘hothe flat bars
with a 3/8-in. fillet around the perimeter of the reinforcing
plates. The reinforc@ flat bars were then welded to the 3/4-in.
main plate with a 5/16-in. fillet along the edges and around the
ends Or the flat bars. After this procedure the end modifications
for types other than Z-s were then flame cut and rough gro~de
The 3\4-in. main plates were cut from 6-ft. by ~0-ft. plates
with axis of loading in the direction of rolling. The plate layouts
are shown in Figs. 9 to 12~ inclusive The specimens were given
designations which identify them with regard to specimen type~
and detail~ the plate from which the main plate was cut? and the
position within the plate.
For example, the specimen designated as ‘12X2-116119 means a
Type Z specimen with flat bars bearing the C2 ending, w’herethe
main plate was cut from position 16 in Plate 10
Those specimens using D’l~~tee~ for the flat bal-~are
“c4-
identified by an asterisk :n the tables of Appe.nd.ixA.
In addition to the specimens described above and listed
in Table 17 certain specimens
program dealing with the Type
l\2 the scale shown in Fig. 2
thick hot rolled steel plates
thick hot rolled steel plates
were made for an exploratory
Z endings. The specimens were
and were fabricated using 3\8-in.
for the main plates and l/2-in.
for the side bars. one speci-
men was made of each of the end detail variations shown in
Figs. 27 4, and 5.
...
—-, ._._. _