Embed Size (px)
Citation preview

I N O X L E I S U R E L T D .
Q 3 & 9 M O N T H S - F Y 2 0 1 8 R E S U L T S U P D A T E

Disclaimer
2
This presentation and the following discussion may contain “forward looking statements” by Inox Leisure Limited (“ILL” or “theCompany”) that are not historical in nature. These forward looking statements, which may include statements relating to future stateof affairs, results of operations, financial condition, business prospects, plans and objectives, are based on the current beliefs,assumptions, expectations, estimates, and projections of the management of ILL about the business, industry and markets in which ILLoperates.
These statements are not guarantees of future performance, and are subject to known and unknown risks, uncertainties, and otherfactors, some of which are beyond ILL’s control and difficult to predict, that could cause actual results, performance or achievementsto differ materially from those in the forward looking statements.
Such statements are not, and should not be construed, as a representation as to future performance or achievements of ILL. Inparticular, such statements should not be regarded as a projection of future performance of ILL. It should be noted that the actualperformance or achievements of ILL may vary significantly from such statements.
Due to rounding-off, figures presented throughout this document may not add up precisely to the totals provided and percentagesmay not precisely reflect the rounded-off figures.
All financial figures, upto and including FY15 are as per IGAAP and for FY16 and thereafter are as per IND-AS. Revenues for FY13 toFY15 are shown net of entertainment tax, to be consistent with the revenues under IND-AS for FY16 and thereafter.
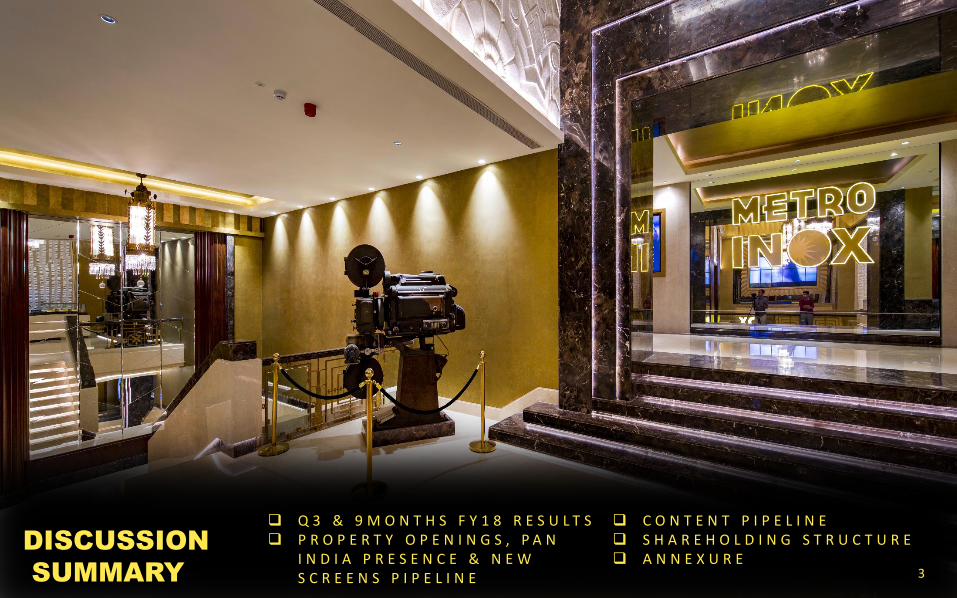
3
Q 3 & 9 M O N T H S F Y 1 8 R E S U L T S P R O P E R T Y O P E N I N G S , P A N
I N D I A P R E S E N C E & N E W S C R E E N S P I P E L I N E
C O N T E N T P I P E L I N E S H A R E H O L D I N G S T R U C T U R E A N N E X U R E
DISCUSSION
SUMMARY

Q3 & 9M FY18 Result Highlights
4
Q3 FY18 YoY Comparison
298.0
325.9
280 .0
285 .0
290 .0
295 .0
300 .0
305 .0
310 .0
315 .0
320 .0
325 .0
330 .0
Q3FY17 Q3FY18
31.7 46.3
10.6%14.2%
0.0%
2.0%
4.0%
6.0%
8.0%
10.0%
12.0%
14.0%
16.0%
-
5.0
10.0
15.0
20.0
25.0
30.0
35.0
40.0
45.0
50.0
Q3FY17 Q3FY18
EBITDA EBITDA Margin
3.8 13.2
1.3%
4.0%
0.0%
0.5%
1.0%
1.5%
2.0%
2.5%
3.0%
3.5%
4.0%
4.5%
-
5.0
10.0
15.0
20.0
25.0
30.0
35.0
40.0
45.0
50.0
Q3FY17 Q3FY18
PAT PAT Margin
Revenue from Operations EBITDA PAT
9M FY18 YoY Comparison
9% 46% 251%
Revenue from Operations EBITDA PAT
Note: EBITDA excludes Other Income (non-operating)
10% 38% 88%
932.2
1,024.5
880 .0
900 .0
920 .0
940 .0
960 .0
980 .0
1,00 0.0
1,02 0.0
1,04 0.0
9MFY17 9MFY18
121.0 166.6
13.0%16.3%
0.0%
2.0%
4.0%
6.0%
8.0%
10.0%
12.0%
14.0%
16.0%
18.0%
-
20.0
40.0
60.0
80.0
100 .0
120 .0
140 .0
160 .0
180 .0
9MFY17 9MFY18
EBITDA EBITDA Margin
30.3 56.9
3.2%
5.6%
0.0%
1.0%
2.0%
3.0%
4.0%
5.0%
6.0%
-
10.0
20.0
30.0
40.0
50.0
60.0
9MFY17 9MFY18
PAT PAT Margin
All figures in INR Crs., unless specified
5
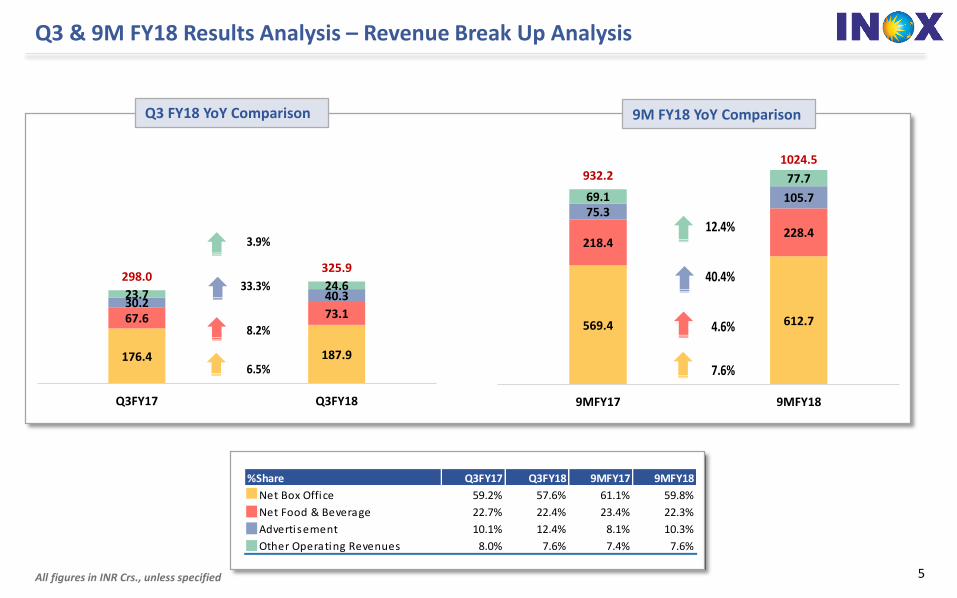
Q3 & 9M FY18 Results Analysis – Revenue Break Up Analysis
176.4 187.9
67.6 73.130.2
40.323.724.6
298.0325.9
0.0
100.0
200.0
300.0
400.0
500.0
600.0
700.0
800.0
Q3FY17 Q3FY18
569.4 612.7
218.4228.4
75.3105.769.1
77.7932.21024.5
-100.0
100.0
300.0
500.0
700.0
900.0
1100.0
9MFY17 9MFY18
%Share Q3FY17 Q3FY18 9MFY17 9MFY18
Net Box Office 59.2% 57.6% 61.1% 59.8%
Net Food & Beverage 22.7% 22.4% 23.4% 22.3%
Advertisement 10.1% 12.4% 8.1% 10.3%
Other Operating Revenues 8.0% 7.6% 7.4% 7.6%
3.9%
33.3%
8.2%
6.5%
12.4%
40.4%
4.6%
7.6%
Q3 FY18 YoY Comparison 9M FY18 YoY Comparison
All figures in INR Crs., unless specified

6
Q3FY18 Results Analysis – Top 5 Movies in INOX
TOP 5 Movies in INOX
GBOC – Gross Box Office Collection
Top 5 films accounted for 52% of Q3 FY18 GBOC revenues (53% in Q3 FY17)
Q3FY18 Tiger Zinda Hai Golmaal Again Judwaa-2 Secret Superstar Fukrey Returns
Footfalls (Lacs) 16.98 18.64 9.53 6.76 8.08
GBOC (INR Crs.) 41.51 38.16 17.01 15.04 14.32
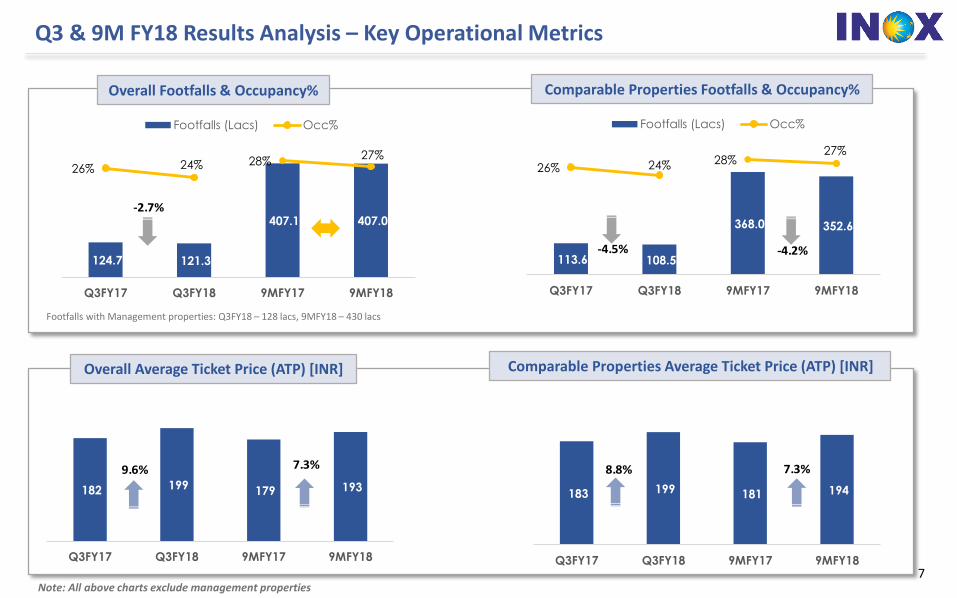
Q3 & 9M FY18 Results Analysis – Key Operational Metrics
7
Overall Footfalls & Occupancy%
124.7 121.3
407.1 407.0
26% 24% 28%27%
3%
8%
13%
18%
23%
28%
33%
-
50.0
100.0
150.0
200.0
250.0
300.0
350.0
400.0
450.0
500.0
Q3FY17 Q3FY18 9MFY17 9MFY18
Footfalls (Lacs) Occ%
Comparable Properties Footfalls & Occupancy%
113.6 108.5
368.0 352.6
26% 24% 28%27%
3%
8%
13%
18%
23%
28%
33%
-
50.0
100.0
150.0
200.0
250.0
300.0
350.0
400.0
450.0
500.0
Q3FY17 Q3FY18 9MFY17 9MFY18
Footfalls (Lacs) Occ%
182 199 179 193
-
50
100
150
200
250
300
Q3FY17 Q3FY18 9MFY17 9MFY18
183 199 181 194
-
50
100
150
200
250
300
Q3FY17 Q3FY18 9MFY17 9MFY18
Overall Average Ticket Price (ATP) [INR] Comparable Properties Average Ticket Price (ATP) [INR]
Footfalls with Management properties: Q3FY18 – 128 lacs, 9MFY18 – 430 lacs
Note: All above charts exclude management properties
-2.7%
9.6% 7.3%
-4.5% -4.2%
8.8% 7.3%

8
Q3 & 9M FY18 Results Analysis – Key Operational Metrics
Spend Per Head (SPH) [INR] Food & Beverages – Net Contribution (%)
Advertisement Revenue [INR Crs.] Other Operating Revenue [INR Crs.]
63 70 63 66
-
10
20
30
40
50
60
70
80
90
100
Q3FY17 Q3FY18 9MFY17 9MFY18
76.1% 75.8% 75.8% 76.0%
0.0%
10.0%
20.0%
30.0%
40.0%
50.0%
60.0%
70.0%
80.0%
90.0%
100.0%
Q3FY17 Q3FY18 9MFY17 9MFY18
30.2 40.3
75.3
105.7
(10.0)
10.0
30.0
50.0
70.0
90.0
110.0
130.0
150.0
Q3FY17 Q3FY18 9MFY17 9MFY18
23.7 24.6 69.1 77.7
-
20.0
40.0
60.0
80.0
100.0
120.0
140.0
160.0
180.0
200.0
Q3FY17 Q3FY18 9MFY17 9MFY18
5.5%
33.3% 40.4% 3.9% 12.4%
10.5%

9
Q3 & 9M FY18 Results Analysis – Key Operational Metrics
Film Distributor Share [%]
45.7% 46.9%44.6% 45.5%
36.0% 36.8% 35.1% 35.9%
0.0 %
10. 0%
20. 0%
30. 0%
40. 0%
50. 0%
60. 0%
70. 0%
Q3FY17 Q3FY18 9MFY17 9MFY18
Distributor Share On NBOC Distributor Share On GBOC
NBOC (Net Box Office Collections) , GBOC (Gross Box Office Collections)
5.1 5.6 16.1 16.4 11.3 11.6
34.2 35.1
10.2 10.0
32.6 33.3
13.5 11.8
39.9 34.8
40.1 39.0
122.7 119.7
(1 0.0)
10.0
30.0
50.0
70.0
90.0
110 .0
130 .0
Q3FY17 Q3FY18 9MFY17 9MFY18
Employee Benefits Property Rent & Conducting Fees
CAM, Power & Fuel, R&M Other Overheads
Other Overheads Per Operating Screen (INR Lacs)
-12.5%
-2.5%
2.9%
9.6%
-12.6%
2.3%
2.7%
1.9%

10
Introducing the all new 7 STAR
METRO INOX MUMBAI’S GREATEST LOVE STORY…
• 6 S c r e e n s , 1 2 7 1 s e a t s
• K I D D L E S - M u m b a i ’ s f i r s t k i d s t h e a t r e
• C a f e U N W I N D
• A d v a n c e d 4 K P r o j e c t i o n
• A u g m e n t e d R e a l i t y
• D o l b y A t m o s
• V o l f o n i 3 D

New Properties Opened – Q3FY18
11
Property Names Opened Property Screens Seats
Pune Heritage Mall Q1FY18 1 4 662
Greater Noida Omaxe Mall Q2FY18 1 5 1,223
Mumbai Worli Atria Q3FY18 1 5 167
Kolhapur Reliance Mall Q3FY18 1 4 870
Ghaziabad Shipra Mall Q3FY18 1 3 1,153
YTD Openings 5 21 4,075
Mumbai Atria (21st Oct 2017)5 Screens 167 Seats
Ghaziabad Shipra Mall (22nd Dec 2017)3 Screens 1,153 Seats
Kolhapur Reliance (29th Nov 2017)4 Screens 870 Seats

Track Record of Aggressive Expansion
12
8 12 25 35 5176 91
119
239 257 279310
372420
468 488
2 3 6 9 14 22 26 32
63 68 72 7996
107118 122
-100
-50
0
50
100
0
100
200
300
400
500
600FY
03
FY04
FY05
FY06
FY0
7
FY08
FY09
FY10
FY11
FY12
FY13
FY14
FY15
FY16
FY1
7
Jan
-18
Screens Properties
Note: Includes Acquisition of 89 Cinemas in FY07, Fame in FY11 and Satyam in FY15
ON AN AVERAGE ADDITION OF 3 SCREENS EVERY MONTH OVER THE LAST DECADE

PAN India Presence
13
ONE OF THE LARGEST MULTIPLEX CHAIN OPERATOR IN INDIA
* Includes 8 management properties with 29 screens and 7,370 seats
KERALA |1 Property | 6 Screens
19States
60Cities
122Properties
488Screens
121,281Seats
JHARKHAND | 1 Property | 4 Screens
WEST BENGAL | 14 Properties | 55 Screens
ODISHA | 1 Property | 3 Screens
CHHATTISGARH | 2 Properties | 8 Screens
TELANGANA | 2 Properties | 11 Screens
ANDHRA PRADESH | 7 Properties | 28 ScreensKARNATAKA |10 Properties | 40 Screens
GOA | 4 Properties | 14 Screens
MAHARASHTRA | 27 Properties | 118 Screens
GUJARAT | 16 Properties | 67 Screens
MADHYA PRADESH | 4 Properties | 16 Screens
RAJASTHAN | 13 Properties | 43 Screens
HARYANA | 5 Properties | 16 Screens
TAMIL NADU | 3 Properties | 14 Screens
UTTAR PRADESH | 6 Properties | 24 Screens
DELHI | 4 Properties | 13 Screens
PUNJAB | 1 Property | 6 Screens
Assam | 1 Property | 2 Screens

New Screen Pipeline
14
Properties Screens SeatsProperties Properties Screens Seats FY17 118 468 118,285
Pune Heritage (Opened 26th Apr17) 1 4 662 Additions - Apr17 to Dec17 5 21 4,075
Greater Noida Omaxe (Opened 14th Jul17) 1 5 1,223 Expected - Jan18 to Mar18 5 22 4,747
Mumbai Atria (Opened 21st Oct17) 1 5 167 FY18** 127 510 126,028
Kolhapur Reliance (Opened 29th Nov17) 1 4 870 Additions Post FY18 102 622 113,331 Ghaziabad Shipra (Opened 22nd Dec17) 1 3 1,153 Leading to 229 1,132 239,359
Coimbatore 1 9 2,088
Gurgaon 1 3 619
Bhubaneswar 1 3 612
Nadiad 1 3 649
Navi Mumbai 1 4 779 Total 10 43 8,822
FY18 Pipeline
STRONG VISIBILITY FROM NEW SCREENS PIPELINE BACKED BY SIGNED AGREEMENTS
** Note;• 612 seats and 1 screen reduced as Bengaluru Shankarnag was closed due to Completion of the Lease Tenure• 112 seats reduced in Bharuch Bluechip in Gujarat due to conversion into recliner seats• 51 seats reduced in Malleshwaram, Bengaluru due to renovation• 220 seats reduced in Metro, Mumbai due to renovation• 84 seats reduced in Bengaluru Garuda due to renovation

Content Pipeline – January 2018
15
1921
Release Date: 12th January 2018Cast: Zareen Khan, Karan KundraDirector: VikramBhattBanner: Reliance Entertainment, Motion Picture Capital
Thaana SerndhaKootam (Tamil)
Release Date:12th January 2018Cast: Surya, KeerthySureshDirector: VighneshShivanBanner: Studio Green
Padmaavat
Release Date: 25th January 2018Cast: DeepikaPadukone, RanveerSinghDirector: Sanjay LeelaBhansaliBanner: BhansaliProductions
Kaalakaandi
Release Date: 12th January 2018Cast: Saif Ali Khan, Vijay RaazDirector: AkshatVermaBanner: CinestaanFilm Company Pvt.Ltd., Flying Unicorn Entertainment
Mukkabaaz
Release Date: 12th January 2018Cast: Vineet Kumar Singh, Zoya HussainDirector: AnuragKashyapBanner: Eros InternationalPhantom FilmsColour Yellow Productions
The Post
Release Date:12th January 2018Cast: Meryl Streep, Tom Hanks, Sarah PaulsonDirector: Steven SpielbergBanner: Amblin Entertainment, DreamWorks, Participant Media

16
Content Pipeline – February 2018
Aiyaary
Release Date: 9th February 2018Cast: Siddharth Malhotra, Manoj BajpayeeDirector: Neeraj PandeyBanner: Reliance Entertainment,Plan C Studios,Friday Filmworks,Jayantilal Gada
Maze Runner : The Death Cure (3D Imax)
Release Date:2nd February 2018Cast: Dylan O Brian, Kaya Skodelario, Thomas BrodieDirector: Wes BallBanner: Gotham Group, Temple Hill Entertainment,TSG Entertainment
Hichki
Release Date: 23th February 2018Cast: Rani MukherjeeDirector: Siddharth P. MalhotraBanner: Yash Raj Films
Black Panther (3D Imax)
Release Date:16th February 2018Cast: Chadwick Boseman, Michael B Jordon, Lupita NyongDirector: Ryan CooglerBanner: Marvel Studios
Padman
Release Date: 9th February 2018Cast: Akshay Kumar, Sonam Kapoor, Radhika ApteDirector: R BalkiBanner: MrsFunnybones Movies
Sonu Ke Titu Ki Sweety
Release Date:23rd February 2018Cast: Karthik Aaryan, Nusrat Bharucha, Sunny Singh NajjarDirector: Luv RanjanBanner: T-Series, Luv Films

17
Content Pipeline – March 2018
Drive
Release Date: 2nd March 2018Cast: Sushant Singh Rajput, Jacquline FernandesDirector: Tarun MansukhaniBanner: Dharma Productions, Fox Star Studios
Raid
Release Date: 16th March 2018Cast: Ajay Devgan, Illiana D CruzDirector: Rajkumar GuptaBanner: T-Series Super Cassettes Industries Ltd.,Panorama Studios
Pacific Rim : Uprising
Release Date:23th March 2018Cast: Scott Eastwood, John BogeyaDirector: Steven S DenightBanner: Legendary Pictures, UpperRoom Entertainment Limited, DDY
Baaghi 2
Release Date:30th March 2018Cast: Tiger Shroff, Disha PataniDirector: Ahmed KhanBanner: NadiadwalaGrandson Entertainment, Fox Star Studios
Pari
Release Date: 2nd March 2018Cast: Anushka Sharma, Paambarta ChatterjeeDirector: Prosit RoyBanner: Clean Slate Films, KriArj Entertainment,KYTA Productions
Parmanu - The Story Of Pokhran
Release Date: 2nd Mar 2018Cast: John Abraham, Boman Irani, Diana PentyDirector: Abhishek SharmaBanner: KriArj Entertainment, J A Entertainment, KYTA Productions, Zee Studios

18
Content Pipeline – April 2018
October
Release Date: 13th April 2018Cast: Varun Dhawan, Banita SandhuDirector: Shoojit SircarBanner: Rising Sun Films, Sony Pictures Networks Productions,KriArj Entertainment
Rampage
Release Date: 20th April 2018Cast: Jeffrey Dean Morgan, Dwayne Johnson, Jake LacyDirector: Brad PeytonBanner: New Line Cinema, Twisted Media, Wrigley Pictures
2.0
Release Date:14th April 2018Cast: Rajinikanth, Akshay Kumar, Amy JacksonDirector: S ShankarBanner: LycaProductions
Avengers: Infinity War
Release Date:27th April 2018Cast: Karen Gillan, Pom Klementieff, Tessa ThompsonDirector: Anthony Russo, Joe RussoBanner: Marvel Studios
Manikarnika – The Queen Of Jhansi
Release Date:27th April 2018Cast: Kangana Ranaut, Suresh OberoiDirector: KrishBanner: Zee Studios,Kairos Kontent Studios
Bharat Ane Nenu(Telugu)
Release Date: 27th April 2018Cast: Mahesh Babu,Kiara Advani. Director: Koratala SivaBanner: DVV Danayya

Shareholding Structure
19
Source: BSE
Public/Others, 11.65%
INOX Benefit Trust, 4.51%
DII, 18.68%
FII, 16.46%
Promoter & Promoter
Group, 48.70%
% Shareholding as of Dec 2017
Source: Company Source: Company
Key Institutional Investors – Dec 2017 % Holding
DSP Blackrock MF 7.0%
Reliance MF 4.0%
Aditya Birla Sunlife 3.5%
Kuwait Investment Authority Fund 3.0%
Goldman Sachs India Ltd. 2.6%
Morgan Stanley 2.4%
ICICI Prudential MF 1.6%
RAMS Equities Portfolio Fund 1.4%
Sundaram MF 1.3%
AADI Financial Advisors LLP 1.0%
Market Data As on 25th Jan 2018
Market Capitalisation (INR Crs.) 2,576
Price (INR) 267.1
No. of Shares Outstanding (Crs.) 9.6
Face Value (INR) 10.0
52 week High/Low (INR) 309.20/213.30
Source: BSE
0
50
100
150
200
250
300
350
Share Price Performance (INR)

20
Annexure
INOX Metro, Mumbai Kiddles

Annexure: Consolidated P&L Statement
21
Particulars (INR Crs.) Q3 FY18 Q3 FY17 YoY % Q2FY18 QoQ % 9M FY18 9M FY17 YoY % FY17
Revenue from Operations 325.9 298.0 9.4% 311.3 4.7% 1,024.5 932.2 9.9% 1,220.7
Exhibi tion Cost 90.5 83.4 8.5% 88.5 2.3% 286.0 265.0 7.9% 345.3
Food & Beverages Cost 17.7 16.1 9.5% 16.8 5.5% 54.9 52.8 3.9% 68.1
Employee Benefi ts Expense 24.7 21.3 15.9% 23.3 5.9% 70.9 64.7 9.6% 86.4
Lease Rental & Hire Charges 51.1 46.9 8.8% 48.5 5.3% 151.7 137.4 10.4% 185.8
CAM, Power & Fuel , R&M 43.8 42.5 3.1% 47.5 -7.8% 143.9 130.9 9.9% 174.5
Other Expenses 51.8 56.0 -7.4% 42.3 22.5% 150.5 160.3 -6.1% 214.6
EBITDA 46.3 31.7 46.0% 44.4 4.2% 166.6 121.0 37.7% 146.1
EBITDA Margin % 14% 11% 356 bps 14% -7 bps 16% 13% 328 bps 12%
Depreciation & Amortisation 21.7 21.4 1.5% 21.5 1.2% 64.8 62.5 3.7% 84.1
Impairment Loss on PP&E - - 0.7 -100.0% 1.3 - 1.3
Other Income 3.0 2.2 38.0% 2.9 3.9% 8.2 6.8 21.1% 9.1
Finance Cost 7.3 6.5 12.2% 7.3 -0.7% 21.8 18.1 20.3% 25.3
Exceptional Items - - - - - -
Share of Profi t from Joint Ventures (0.0) 0.1 -119.0% (0.0) 187.7% (0.0) 0.1 -120.2% 0.1
PBT 20.3 6.1 233.7% 17.8 13.5% 87.0 47.3 83.9% 44.6
Current Tax 7.0 1.3 437.4% 6.7 4.9% 31.6 17.1 85.2% 14.7
Deferred Tax 0.0 1.0 -95.6% (0.6) -108.1% (1.6) (0.0) 3074.8% 0.9
Tax perta ining to earl ier years - - - - - (1.6)
PAT 13.2 3.8 251% 11.7 13% 56.9 30.3 88% 30.6
PAT Margin % 4.0% 1.3% 278 bps 3.8% 29 bps 5.6% 3.2% 231 bps 2.5%
Earnings Per Share (EPS) 1.43 0.41 251% 1.28 12% 6.20 3.30 88% 3.33
All figures in INR Crs., unless specified

Annexure: Consolidated Balance Sheet Statement
22
Assets (INR Crs.) Mar-17 Sep-17
Non-Current Assets:
Property, Plant & Equipment 672.8 670.8
Capital work-in-progress 62.6 72.0
Goodwill 17.5 17.5
Other Intangible Assets 12.4 11.7
Investments in Joint Ventures 0.1 0.1
Other Investments 1.2 1.0
Loans 69.0 71.7
Other Financial Assets 71.8 81.4
Deferred Tax Assets (Net) 48.3 37.6
Tax Assets (Net) 5.5 8.4
Other Non Current Assets 77.6 77.6
Total Non Current Assets 1,039 1,050
Current Assets:
Inventories 9.1 9.3
Other Investments 10.7 67.6
Trade Receivables 46.6 68.8
Cash and Bank Balances 9.8 16.8
Bank Balances Other than above 3.4 2.2
Loans 4.4 4.3
Other Financial Assets 0.3 0.3
Other Current Assets 21.0 18.4
Total Current Assets 105.3 187.7
Total Assets 1,144.1 1,237.2
Equity & Liabilities (INR Crs.) Mar-17 Sep-17
Equity:
Equity Share Capital 96.2 96.2
Other Equity 489.0 533.5
Interest in Inox Benefit Trust, at cost (32.7) (32.7)
Equity attributable to owners of the company 552.5 597.0
Non-Controlling Interest 0.0 0.0
Total Equity 552.5 597.0
Non-current liabilities:
Borrowings 291.9 270.0
Other Financial Liabilities 3.1 2.6
Provisions 10.0 10.2
Other Non-current Liabilities 82.9 80.5
Total of Non-Current Liabilities 388.0 363.3
Current Liabilities:
Borrowings - -
Trade Payables 88.4 102.4
Other Financial Liabilities 64.8 98.0
Other Current Liabilities 36.0 59.9
Provisions 14.4 16.5
Current Tax Liabilities (Net) 0.0 0.0
Total of Current Liabilities 203.6 276.9
Total Equity & Liabilities 1,144.1 1,237.2

Annexure: Brief Profile
23
• Inox Leisure Limited (ILL), incorporated in 1999, is one of the largest multiplex operator in India• ILL is a part of Inox Group which is diversified across industrial gases, engineering plastics, refrigerants, chemicals, cryogenic engineering,
renewable energy and entertainment sectors• ILL currently operates 122 properties (488 screens and 121,281 seats) located in 60 cities across India, being the only multiplex operator
having such a diverse presence across PAN India• The company accounts for ~20% share of the multiplex screens in India and ~8% share of domestic box office collections• The company has aggressively scaled up through organic and inorganic expansion over last decade growing from 2 properties – 8 screens in
FY03 to 122 properties – 488 screens at present, virtually adding on an average 3 screens every month over more than a decade.
Business Overview
• One of the largest multiplex chains in India• Most diversified distribution of multiplexes in India• Premium multiplex properties, state of the art technology and unmatched service and ambience• Strong partnerships with more than 50 leading Indian and Global brands, offering high growth potential for advertising and
other ancillary revenues• Strong management team and recognized and trusted corporate group
Key Strengths
• Consolidated Revenues, EBITDA and PAT were Rs 1,220.7 cr, Rs 146.1 cr and Rs 30.6 cr in FY17• Strong balance sheet with Gross Debt of Rs 317.0 cr, Net Debt of Rs 293.45 cr and Equity of Rs 552.5 cr in FY17 with net D/E ratio of 0.5x
Strong Financials
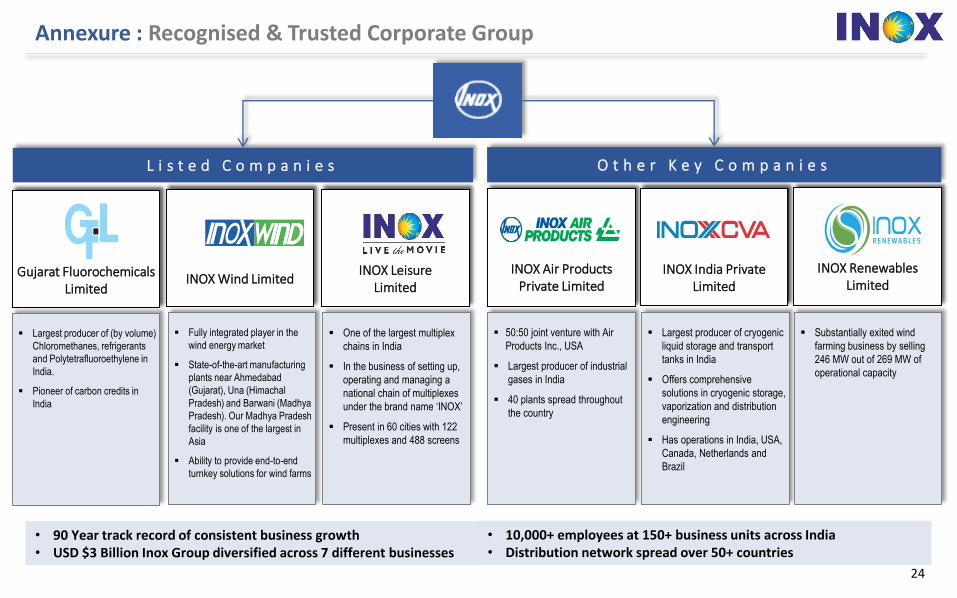
Annexure : Recognised & Trusted Corporate Group
24
Substantially exited wind
farming business by selling
246 MW out of 269 MW of
operational capacity
L i s t e d C o m p a n i e s O t h e r K e y C o m p a n i e s
INOX LeisureLimited
Largest producer of (by volume)
Chloromethanes, refrigerants
and Polytetrafluoroethylene in
India.
Pioneer of carbon credits in
India
INOX Air Products Private Limited
50:50 joint venture with Air
Products Inc., USA
Largest producer of industrial
gases in India
40 plants spread throughout
the country
One of the largest multiplex
chains in India
In the business of setting up,
operating and managing a
national chain of multiplexes
under the brand name ‘INOX’
Present in 60 cities with 122
multiplexes and 488 screens
Gujarat FluorochemicalsLimited
Largest producer of cryogenic
liquid storage and transport
tanks in India
Offers comprehensive
solutions in cryogenic storage,
vaporization and distribution
engineering
Has operations in India, USA,
Canada, Netherlands and
Brazil
INOX India PrivateLimited
INOX RenewablesLimited
Fully integrated player in the
wind energy market
State-of-the-art manufacturing
plants near Ahmedabad
(Gujarat), Una (Himachal
Pradesh) and Barwani (Madhya
Pradesh). Our Madhya Pradesh
facility is one of the largest in
Asia
Ability to provide end-to-end
turnkey solutions for wind farms
INOX Wind Limited
• 90 Year track record of consistent business growth• USD $3 Billion Inox Group diversified across 7 different businesses
• 10,000+ employees at 150+ business units across India• Distribution network spread over 50+ countries

East; 9; 15%
West; 21; 35%North; 18; 30%
South; 12; 20%
Annexure: PAN India Presence
25
East; 19; 15%
West; 51; 42%
North, 29, 24%
South, 23, 19%
East; 72; 15%
West; 215; 44%
North; 102; 21%
South, 99, 20%
East; 18,805 ; 15%
West; 53,060 ; 44%North; 26,326 ; 22%
South; 23,090 ; 19%
Well DiversifiedDistribution of
Multiplexesacross India
Access toWide Variety of
Regional Content
Lower Dependencyon Hindi and English
Content
Includes 8 management properties with 29 screens and 7,370 seats
122 Properties 60 cities
488 Screens 121,281 Seats

Annexure: Strong Brand Partnerships
Automobiles Ecommerce & TelecomBFSIMedia FMCG Consumer Durables Others

Financial Summary
27
9.4%
11.5%
6.1%
14.9%
7.3%5.7%
10.3%
3.8%
16.8%
5.7%
FY13 FY14 FY15 FY16 FY17
ROCE % ROE %
663.2 762.8
895.4
1,160.6 1,220.7
FY13 FY14 FY15 FY16 FY17
98.0 122.0 122.7
189.1 146.1
14.8% 16.0% 13.7% 16.3% 12.0%
FY13 FY14 FY15 FY16 FY17
EBITDA EBITDA Margin %
18.5
36.9 20.0
81.0
30.6
2.8%4.8%
2.2%7.0%
2.5%
FY13 FY14 FY15 FY16 FY17
PAT PAT Margin %
281.0 242.2 241.2 267.0 317.0
324.6 390.9 676.2 522.3 552.5
0.8 0.6
0.3 0.4 0.5
FY13 FY14 FY15 FY16 FY17
Equity Debt Net Debt to Equity
68.9% 64.3% 61.6% 61.4% 61.3%
21.4% 21.3% 21.3% 22.9% 23.3%
4.9% 6.5% 9.1% 7.8% 7.9%
4.9% 7.9% 8.0% 7.8% 7.6%
FY13 FY14 FY15 FY16 FY17
NBOC F & B Advertising Others
ROE: PAT/Avg. Equity, ROCE: EBIT/Avg. Capital Employed [(Capital Employed = Equity + Total Debt)Net Debt = Total Debt – Cash –Bank – Liquid MF Investments
REVENUES EBITDA PAT
REVENUES - SEGMENT BREAKUP LEVERAGE ANALYSIS RETURN METRICS
All figures in INR Crs., unless specified

28
Thank YouBalesh Talapady GM – Business AnalysisINOX Leisure Ltd.Contact+91-22-4062 6927Email: [email protected]
INOX Metro, Mumbai