Embed Size (px)
Citation preview
I n d i c a t o r s o f
S u s t a i n a b l e
C o m m u n i t y
A status report on long-term cultural, economic, and environmental healthfor Seattle/King County
Sustainable Seattle
1 9 9 8

Project ManagersAaron BestHans Van DusenRichard Conlin
Editor & Graphic DesignerKara Palmer
Research InternsLeif BrotemMark Charette
Writers,Researchers & AnalystsMark AalfsJesse ArnoldDonald BollingerSara BreslowSusan CannonNea CarrollSheila CrofutSusan ErnsdorffUte GiglerChristy HalvorsonLee HatcherDiane HornJulie KoehlingerBrad LiljequistChris MaagColleen PachecoDavid ReynoldsJohn RobertsAmy SnoverCathy Tuttle
Linoleum Block ArtPaula Gill
Media & PublicityEmelie PeineScott Walter
Board of Directors (2003)Kirvil Skinnarland, PresidentSuzie Haberland, Vice-PresidentCynthia Figge, SecretaryBen Packard, TreasurerMark AalfsMark GriffinTerry KakidaRick KrochalisLang MarshLinda MaxsonTerry RustanSean SchmidtChristy Halvorson Shelton
Sustainable Seattle1109 First Avenue, Suite 400ASeattle, Washington USA 98101Tel: (206) 622-3522Fax: (206) [email protected]
Reprinted March 2004
Sustainable SeattleSeattle, WashingtonEarth Day, 1998
Dear Reader,
We’re proud to present Sustainable Seattle’s Indicators of Sustainable Community
1998. In your hands you hold an international award-winning document that has
inspired similar efforts in communities around the world.This is our third indicators report since 1993, each produced by volunteer citizens
of Seattle and King County. Our next report—due out in 2002—will be the first of
the new millenium.*We present these 40 indicators with the challenge of getting them all moving in a
positive direction. Since all the indicators connect to each other, improving any
of them will keep us moving toward sustainability.We hope the information here will enhance your understanding of these crucial
topics and inspire you to continue strengthening and sustaining our community.
As always, Sustainable Seattle welcomes your participation in this effort.Sincerely,
The Indicators Task Team
*As of the reprint date in early 2004, Sustainable Seattle has not produced a new Indicators report since this 1998 version.
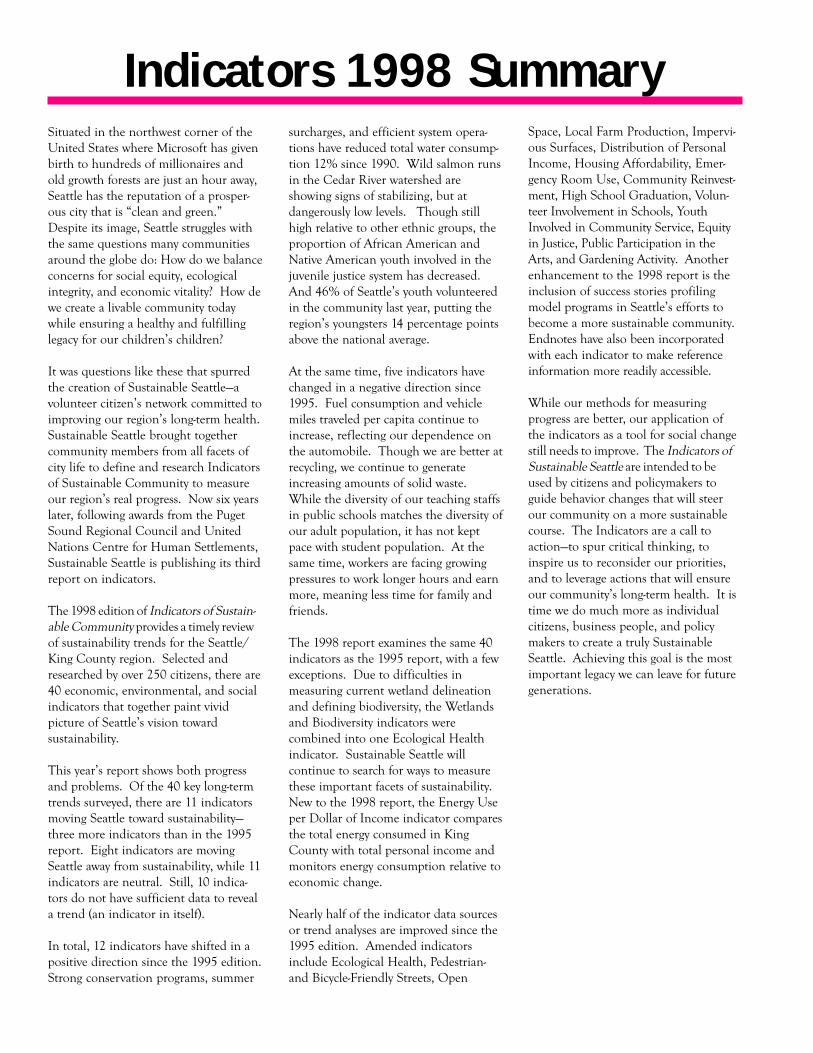
Situated in the northwest corner of theUnited States where Microsoft has givenbirth to hundreds of millionaires andold growth forests are just an hour away,Seattle has the reputation of a prosper-ous city that is “clean and green.”Despite its image, Seattle struggles withthe same questions many communitiesaround the globe do: How do we balanceconcerns for social equity, ecologicalintegrity, and economic vitality? How dewe create a livable community todaywhile ensuring a healthy and fulfillinglegacy for our children’s children?
It was questions like these that spurredthe creation of Sustainable Seattle—avolunteer citizen’s network committed toimproving our region’s long-term health.Sustainable Seattle brought togethercommunity members from all facets ofcity life to define and research Indicatorsof Sustainable Community to measureour region’s real progress. Now six yearslater, following awards from the PugetSound Regional Council and UnitedNations Centre for Human Settlements,Sustainable Seattle is publishing its thirdreport on indicators.
The 1998 edition of Indicators of Sustain-able Community provides a timely reviewof sustainability trends for the Seattle/King County region. Selected andresearched by over 250 citizens, there are40 economic, environmental, and socialindicators that together paint vividpicture of Seattle’s vision towardsustainability.
This year’s report shows both progressand problems. Of the 40 key long-termtrends surveyed, there are 11 indicatorsmoving Seattle toward sustainability—three more indicators than in the 1995report. Eight indicators are movingSeattle away from sustainability, while 11indicators are neutral. Still, 10 indica-tors do not have sufficient data to reveala trend (an indicator in itself).
In total, 12 indicators have shifted in apositive direction since the 1995 edition.Strong conservation programs, summer
surcharges, and efficient system opera-tions have reduced total water consump-tion 12% since 1990. Wild salmon runsin the Cedar River watershed areshowing signs of stabilizing, but atdangerously low levels. Though stillhigh relative to other ethnic groups, theproportion of African American andNative American youth involved in thejuvenile justice system has decreased.And 46% of Seattle’s youth volunteeredin the community last year, putting theregion’s youngsters 14 percentage pointsabove the national average.
At the same time, five indicators havechanged in a negative direction since1995. Fuel consumption and vehiclemiles traveled per capita continue toincrease, reflecting our dependence onthe automobile. Though we are better atrecycling, we continue to generateincreasing amounts of solid waste.While the diversity of our teaching staffsin public schools matches the diversity ofour adult population, it has not keptpace with student population. At thesame time, workers are facing growingpressures to work longer hours and earnmore, meaning less time for family andfriends.
The 1998 report examines the same 40indicators as the 1995 report, with a fewexceptions. Due to difficulties inmeasuring current wetland delineationand defining biodiversity, the Wetlandsand Biodiversity indicators werecombined into one Ecological Healthindicator. Sustainable Seattle willcontinue to search for ways to measurethese important facets of sustainability.New to the 1998 report, the Energy Useper Dollar of Income indicator comparesthe total energy consumed in KingCounty with total personal income andmonitors energy consumption relative toeconomic change.
Nearly half of the indicator data sourcesor trend analyses are improved since the1995 edition. Amended indicatorsinclude Ecological Health, Pedestrian-and Bicycle-Friendly Streets, Open
Space, Local Farm Production, Impervi-ous Surfaces, Distribution of PersonalIncome, Housing Affordability, Emer-gency Room Use, Community Reinvest-ment, High School Graduation, Volun-teer Involvement in Schools, YouthInvolved in Community Service, Equityin Justice, Public Participation in theArts, and Gardening Activity. Anotherenhancement to the 1998 report is theinclusion of success stories profilingmodel programs in Seattle’s efforts tobecome a more sustainable community.Endnotes have also been incorporatedwith each indicator to make referenceinformation more readily accessible.
While our methods for measuringprogress are better, our application ofthe indicators as a tool for social changestill needs to improve. The Indicators ofSustainable Seattle are intended to beused by citizens and policymakers toguide behavior changes that will steerour community on a more sustainablecourse. The Indicators are a call toaction—to spur critical thinking, toinspire us to reconsider our priorities,and to leverage actions that will ensureour community’s long-term health. It istime we do much more as individualcitizens, business people, and policymakers to create a truly SustainableSeattle. Achieving this goal is the mostimportant legacy we can leave for futuregenerations.
Indicators 1998 Summary
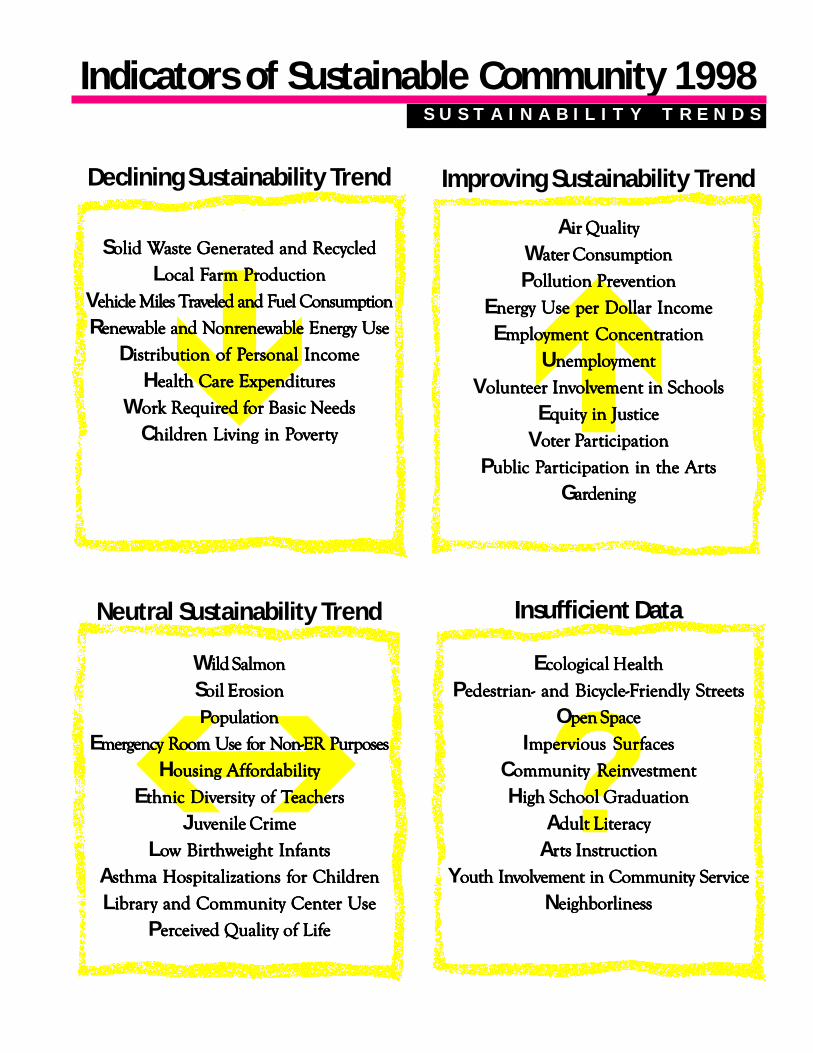
Air Qualityir Qualityir Qualityir Qualityir Quality
Watatatatater Consumer Consumer Consumer Consumer Consumppppptiontiontiontiontion
Pollution Prollution Prollution Prollution Prollution Preveveveveventionentionentionentionention
Enernernernernergy Use per Dollar Incomegy Use per Dollar Incomegy Use per Dollar Incomegy Use per Dollar Incomegy Use per Dollar Income
Emmmmmploploploploployment Concentryment Concentryment Concentryment Concentryment Concentrationationationationation
Unemnemnemnemnemploploploploploymentymentymentymentyment
Voluntoluntoluntoluntolunteer Ineer Ineer Ineer Ineer Invvvvvolvolvolvolvolvement in Scement in Scement in Scement in Scement in Schoolshoolshoolshoolshools
Eqqqqquity in Jusuity in Jusuity in Jusuity in Jusuity in Justiceticeticeticetice
Vooooottttter Per Per Per Per Parararararticipationticipationticipationticipationticipation
Public Public Public Public Public Parararararticipation in the Articipation in the Articipation in the Articipation in the Articipation in the Artststststs
Gararararardeningdeningdeningdeningdening
Solid Wolid Wolid Wolid Wolid Wasasasasasttttte Genere Genere Genere Genere Generatatatatated and Red and Red and Red and Red and Recyecyecyecyecycledcledcledcledcled
Local Focal Focal Focal Focal Farm Prarm Prarm Prarm Prarm Productionoductionoductionoductionoduction
Vehicle Miles Tehicle Miles Tehicle Miles Tehicle Miles Tehicle Miles Trrrrraaaaavvvvveled and Feled and Feled and Feled and Feled and Fuel Consumuel Consumuel Consumuel Consumuel Consumppppptiontiontiontiontion
Reneeneeneeneenewwwwwable and Nable and Nable and Nable and Nable and Nonronronronronreneeneeneeneenewwwwwable Enerable Enerable Enerable Enerable Energy Usegy Usegy Usegy Usegy Use
Disisisisistribution of Ptribution of Ptribution of Ptribution of Ptribution of Pererererersonal Incomesonal Incomesonal Incomesonal Incomesonal Income
Health Carealth Carealth Carealth Carealth Care Expenditure Expenditure Expenditure Expenditure Expenditureseseseses
Wororororork Rk Rk Rk Rk Reqeqeqeqequiruiruiruiruired fed fed fed fed for Basic Nor Basic Nor Basic Nor Basic Nor Basic Needseedseedseedseeds
Childrhildrhildrhildrhildren Living in Pen Living in Pen Living in Pen Living in Pen Living in Pooooovvvvvererererertytytytyty
?
Indicators of Sustainable Community 1998
Ecological Healthcological Healthcological Healthcological Healthcological Health
Pedesedesedesedesedestrian- and Bicytrian- and Bicytrian- and Bicytrian- and Bicytrian- and Bicycle-Fcle-Fcle-Fcle-Fcle-Friendly Sriendly Sriendly Sriendly Sriendly Strtrtrtrtreeeeeeeeeetststststs
Open Spacepen Spacepen Spacepen Spacepen Space
Immmmmperperperperpervious Survious Survious Survious Survious Surfffffacesacesacesacesaces
Community Rommunity Rommunity Rommunity Rommunity Reineineineineinvvvvvesesesesestmenttmenttmenttmenttment
High Scigh Scigh Scigh Scigh School Grhool Grhool Grhool Grhool Graduationaduationaduationaduationaduation
Adult Litdult Litdult Litdult Litdult Literererereracyacyacyacyacy
Arrrrrts Insts Insts Insts Insts Instructiontructiontructiontructiontruction
Youth Inouth Inouth Inouth Inouth Invvvvvolvolvolvolvolvement in Community Serement in Community Serement in Community Serement in Community Serement in Community Servicevicevicevicevice
Neighborlinesseighborlinesseighborlinesseighborlinesseighborliness
Declining Sustainability Trend
Wild Salmonild Salmonild Salmonild Salmonild Salmon
Soil Eroil Eroil Eroil Eroil Erosionosionosionosionosion
Populationopulationopulationopulationopulation
Emermermermermergency Rgency Rgency Rgency Rgency Room Use foom Use foom Use foom Use foom Use for Nor Nor Nor Nor Non-ER Puron-ER Puron-ER Puron-ER Puron-ER Purposesposesposesposesposes
Housing Afousing Afousing Afousing Afousing Affffffororororordabilitydabilitydabilitydabilitydability
Ethnic Divthnic Divthnic Divthnic Divthnic Divererererersity of Tsity of Tsity of Tsity of Tsity of Teaceaceaceaceacherherherherhersssss
Juvuvuvuvuvenile Crimeenile Crimeenile Crimeenile Crimeenile Crime
Looooow Birw Birw Birw Birw Birthwthwthwthwthweight Infeight Infeight Infeight Infeight Infantsantsantsantsants
Asssssthma Hospitthma Hospitthma Hospitthma Hospitthma Hospitalizations falizations falizations falizations falizations for Childror Childror Childror Childror Childrenenenenen
Libribribribribrararararary and Community Centy and Community Centy and Community Centy and Community Centy and Community Center Useer Useer Useer Useer Use
Perererererceivceivceivceivceived Quality of Lifed Quality of Lifed Quality of Lifed Quality of Lifed Quality of Lifeeeee
Neutral Sustainability Trend Insufficient Data
Improving Sustainability Trend
S U S T A I N A B I L I T Y T R E N D S
“The gross national product includes
air pollution and advertising for cigarettes, and ambulances to clear our highways of carnage.
It counts special locks for our doors, and jails for the people who break them.
The gross national product includes the destruction of the redwoods and the death of Lake Superior.
It grows with the production of napalm and missiles with nuclear warheads....
And if the gross national product includes all this, there is much that it does not comprehend.
It does not allow for the health of our families, the quality of their education, or the joy of their play.
It is indifferent to the decency of our factories and the safety of streets alike.
It does not include the beauty of our poetry or the strength of our marriages, the intelligence of our
public debate or the integrity of our public officials....
The gross national product measures neither our wit nor our courage,
neither our wisdom nor our learning,
neither our compassion nor our devotion to country.
It measures everything, in short, except that which makes life worthwhile;
and it can tell us everything about America—except whether we are proud to be Americans.”
—Robert F. Kennedy
Table of ContentsIntroduction........................................................................................1Environment
Success Story: Green Places for People, Peregrines, and Potatoes.................8Sustainability Trends.......................................................................9Wild Salmon................................................................................10Ecological Health..........................................................................11Soil Erosion.................................................................................12Air Quality...................................................................................13Pedestrian- and Bicycle-Friendly Streets.............................................14Open Space near Urban Villages........................................................15Impervious Surfaces......................................................................16
Population & ResourcesSuccess Story: Northwest Environmental Businesses Band Together.............20Sustainability Trends.....................................................................21Population..............................................................................22Water Consumption.......................................................................23Solid Waste Generated and Recycled..................................................24Pollution Prevention......................................................................25Local Farm Production...................................................................26Vehicle Miles Traveled and Fuel Consumption........................................27Renewable and Nonrenewable Energy Use............................................28
EconomySuccess Story: Plymouth Helps the Homeless with More than Shelter............32Sustainability Trends.....................................................................33Energy Use Per Dollar of Income........................................................34Employment Concentration.............................................................35Unemployment.........................................................................36Distribution of Personal Income........................................................37Health Care Expenditures................................................................38Work Required for Basic Needs.........................................................39Housing Affordability.....................................................................40Children Living in Poverty................................................................41Emergency Room Use for Non-ER Purposes...........................................42Community Reinvestment................................................................43
Youth & EducationSuccess Story: Rainier Beach High School’s Teaching Academy...................46Sustainability Trends.....................................................................47High School Graduation..................................................................48Ethnic Diversity of Teachers.............................................................49Arts Instruction............................................................................50Volunteer Involvement in Schools......................................................51Juvenile Crime.............................................................................52Youth Involvement in Community Service............................................53Equity in Justice...........................................................................54Adult Literacy..............................................................................55
Health & CommunitySustainability Trends.....................................................................59Low Birthweight Infants..................................................................60Asthma Hospitalizations for Children..................................................61Voter Participation........................................................................62Library and Community Center Usage.................................................63Public Participation in the Arts..........................................................64Gardening Activity.........................................................................65Neighborliness.........................................................................66Perceived Quality of Life.................................................................67
Sustainable Seattle Indicators Story..............................................................69Glossary, Anatomy of an Indicator, 1992 Civic Panel Members...............................71

OverviewThe Indicators of Sustainable Communityare the product of a creative communitydialogue about our common future.Hundreds of Seattle-area volunteers haveinvested thousands of hours to designand research this integrated “reportcard” on long-term trends in our region.The initiative started over seven yearsago, when community leaders from allfacets of city life came together to discussdefinitions of sustainability and howcitizens might develop their own ways tomeasure Seattle’s long-term health.
At the time, sustainability was a relativelynew concept to most people. Interna-tionally, the Brundtland Commissionreport, Our Common Future, and itsclassic definition of sustainable develop-ment: “meeting the needs of the presentwithout comprising the ability of futuregenerations to meet their own needs,”had put the notion of sustainability onthe map. However, governments in theUnited States had expressed littleinterest, thereby leaving a majority ofcitizens uninformed.
It was the challenge of integratingeconomic, environmental, and socialgoals and the opportunity to define newmeasurements of progress that movedSeattle citizens to continue meeting andgive birth to the volunteer civic effortcalled Sustainable Seattle. Building fromthe excitement and discussions of thatinitial gathering, the group decided as itsfirst task to define, research, and publisha set of “Indicators of SustainableCommunity.” Focusing on how tomeasure sustainability proved a tangibleproject for developing a commonunderstanding of its meaning. More-over, indicators would provide importantinformation to serve as a foundation forcivic activism and future policy work.
Both the participatory process used todefine the indicators and the extraordi-nary volunteer energy devoted toresearch them are hallmarks of thiscitizen-led initiative to hold policymakers
and the general public accountable forthe city’s well-being over time.
Locally, the Indicators have heightenedpolicymakers’ awareness of sustainabilityand influenced both the City of Seattleand King County in developing theirown sets of indicators (which includesome from the Sustainable Seattle list).In 1996, the Puget Sound RegionalCouncil presented Sustainable Seattlewith a Vision 2020 award for leadershipin integrating economic and environ-mental goals. Internationally, Sustain-able Seattle has been honored with anExcellence in Indicators award from theUnited Nations Centre for HumanSettlements at the 1996 Habitat IIconference.
Taken together, the Indicators give us apicture of our community’ssustainability, which we define as “long-term health and vitality—cultural,economic, environmental and social.”Studying these trends points us toward anew way of thinking about how we liveand about what kinds of progress weneed and want to make.
For the foreseeable future, we willcontinue to face many difficult deci-sions: How do we protect our environ-ment, meet everyone’s basic needs, keepour economy dynamic, and maintain ajust society? How do we make difficulttrade-offs and balanced judgments thattake everyone’s interests into account,including those of our children andgrandchildren?
The purpose of this report is to help usdirect our course toward the future wewant. The Indicators of SustainableCommunity are meant to inspire us to act,as a community, in our own interestsand on behalf of those who come afterus. They provide important informationto catalyze new behaviors and to renewour sense of hope.
Introduction“This is my textbook.I think I will have been
successful if at theend of the year,we’ve moved all
these indicators up.”—King County Executive
Ron Sims
Sustainable Seattle Indicators 1998 Introduction 1
Understanding“Sustainability”
The term “sustainable” was first used intalking about how people use resources.For example, if we catch more fish thanare reproduced every year, our fisherieswill eventually decline, or even disappear(as is already happening). Overfishing—like overgrazing or excess logging—is notsustainable, because we cannot continuedoing it forever.
Over the years, people have found manymore applications for this concept. Forexample, deficit spending is not sustain-able, because you cannot keep spendingmoney you do not have. Pollution is notsustainable, because toxins build up inwater, air, and soil faster than nature canbreak them down. When unsustainabletrends like these are accelerating, there iscause for genuine alarm.
In fact, many kinds of growth—such ashuman population, the number of carson the road, the amount of garbage weproduce, or the percentage of childrenborn into poverty—cannot possiblycontinue over the long-term. Eventuallywe will run out of money or space forroads, landfills for garbage, or theresources and facilities to address thesocial problems caused by inequity.There are limits to growth. Though itmay be difficult to numerically definethese limits, we know it would bephysically impossible for this kind ofgrowth to continue indefinitely. At acertain point, the system would simplybreak down.
In addition to physical limits, there aremoral limits to consider. How do werespond to increasing juvenile crime?What should we do about rising levels ofpoverty? Is it morally acceptable to allowa species of salmon to go extinct? It isimperative that we wrestle with suchquestions, and hold ourselves to thehighest ethical standards achievable.
However, the concept of limits does notapply to human creativity, or economicingenuity, or the overall vitality of a
community and its political process. Wecan continue to develop these indefinitely.
For all these reasons, sustainability ismore a direction than a destination. It isa process of continually improving theway we live in order to respect the realityof limits, whether those limits areimposed by nature or embraced voluntar-ily by people living together in coopera-tion and democracy.
A Brief History ofSustainability
During the late 1970s and early 1980s, anumber of independent scientists,activists, and policymakers were workingon responses to the linked problemsconcerning issues of environment (thehealth of nature) and development (theprogress of humanity). They began to usethe term “sustainability” to describe thegoal of jointly addressing economicdevelopment and ecological healthconcerns.
In 1987, the United Nations’ “WorldCommission on Environment andDevelopment” released its report OurCommon Future, which brought the terms“sustainability” and “sustainable develop-ment” into widespread use. Our CommonFuture (or the “Brundtland Report,” afterthe Commission’s Chair, NorwegianPrime Minister Grö Harlem Brundtland)defined sustainable development as“development which meets the needs ofthe present without endangering theability of future generations to meet theirown needs.”
This definition is the one used mostoften throughout the world. Togetherwith the principles the Commissionestablished, it incorporates five keyconcepts:
1. The needs of the future must not besacrificed to the demands of thepresent.
2. Humanity’s economic future is linkedto the integrity of natural systems.
“Our vision is of a life sustain-ing Earth. We are committedto achievement of a dignified,
peaceful, and equitableexistence. A sustainableUnited States will have a
growing economy that pro-vides equitable opportunitiesfor satisfying livelihoods and asafe, healthy, high quality oflife for current and future
generations. Our nation willprotect its environment, itsnatural resource base, and
the functions and viability ofnatural systems on which all
life depends.”—President’s Council onSustainable Development
2 Introduction Sustainable Seattle Indicators 1998
3. The present world system is notsustainable because it is not meetingthe needs of many, especially the poor.
4. Protecting the environment is impos-sible unless we improve the economicprospects of the Earth’s poorestpeoples.
5. We must act to preserve as manyoptions as possible for future genera-tions, since they have the right todetermine their own needs forthemselves.
At the June, 1992 United Nations’Conference on Environment andDevelopment, commonly referred to asthe “Earth Summit,” representativesfrom nearly every nation on Earthadopted these principles in the form ofinternational treaties and agreements.At the same time, a “Global Forum” ofcitizens’ groups from around the worlddeveloped grass-roots initiatives designedto monitor governments and pushsustainability efforts beyond whattraditional activities were able to do.
The Sustainable Seattle IndicatorsProject was in part a local response tothese global efforts. It was envisioned asa first step in the process of assessing ourprogress toward (or away from) long-termsustainability; identifying key steps wecan take to improve our progress; andmaking these changes real.
What AreIndicators?
New measurements of progress are beingheralded by government agencies,businesses, and civil society as key toolsfor moving us along the sustainabilitypath. Indicators are bits of informationthat highlight what is happening in alarger system. They are small windowsthat together provide a glimpse of the“big picture.”
Sustainability indicators providefeedback on the overall health of ourcommunity in the same way that bodytemperature and blood pressure tell usabout our personal health. From these
indicators, we seek more detailed informa-tion or a diagnosis as well as identifycoordinated actions. Engine gauges suchas oil pressure, engine temperature, andbattery charge are another metaphor.They tell us whether an engine is workingproperly and give some initial direction asto where to look to fix problems.Likewise, sustainability indicators show ushow our community “engine” is running.They tell us which direction a criticalaspect of our community, economy, orenvironment is going: forward orbackward, increasing or decreasing,improving or deteriorating, or staying thesame.
Like the dials of an aircraft’s instrumentpanel, indicators can be useful tools. Bydesigning them carefully, watching themclosely, and interpreting them wisely, weknow the status of our flight and canmake good decisions about where to go.Without indicators, we’re just “flying bythe seat of our pants.”
Indicators reflect the vision of importantvalues and can inspire changes inbehavior. They can act as leverage pointswithin systems. Their presence orabsence, accuracy or inaccuracy, use ornon-use can affect the behavior of anentire system. For example, when a newU.S. law went into effect that requiredevery large plant emitting toxic pollut-ants to list those pollutants publicly sothat surrounding communities wereaware, an indicator was inadvertentlycreated. Local newspapers beganpublishing the “top ten polluters.”Companies responded quickly to get offthe list, and toxic emissions decreasedrapidly even though there was not aspecific law against them. The presenceof information was sufficient to changebehavior.
Similarly, when new Dutch houses werebuilt with electric meters in the fronthall where they were easily visible,instead of down in the cellar where theywere normally placed, householdelectricity use dramatically decreased byone-third. Again, simply having theinformation available affected behavior.
“If you cry ‘Forward!’you must be sure to make
clear the direction in whichto go. Don’t you see that if
you fail to do that andsimply call out the word toa monk and a revolutionary,
they will go in preciselyopposite directions?”
—Anton Chekov
Sustainable Seattle Indicators 1998 Introduction 3
4 Introduction Sustainable Seattle Indicators 1998
Criteria forIndicators
Indicators are as varied as the types ofsystems they monitor. However, thereare certain characteristics that effectiveindicators have in common.
• Relevant. They fit the purpose formeasuring, telling you somethingabout the system you need to know.In the case of Sustainable Seattle, theyillustrate something basic andfundamental to the long-termcultural, economic, environmental, orsocial health of a community overgenerations.
• Reflect community values. The crucialrole of indicators is communication.Perhaps more important thanproviding data, indicators illustratecommunity values and elicit reac-tions. Good indicators are expressedin imaginable, not eye-glazingnumbers, and resonate with theintended audience.
• Attractive to local media. The presspublicizes them and uses them tomonitor and analyze communitytrends.
• Statistically measurable. Data exist thatare relevant to this geographic area,and preferably comparable to othercities, counties or communities. Ifdata are not readily available, apractical method of data collection ormeasurement exists or can be created.
• Logically or scientifically defensible.Understandable rationales exist forusing the specific indicator and fordrawing general conclusions from it.
• Reliable. You must be able to trustwhat the indicator shows. Forexample, a gas gauge that shows it ishalf full when it is really empty maycause you to run out of gas in aninconvenient place. In addition,indicators should be measuredconsistently over time, so that you havecomparable data.
• Leading. Indicators must give youinformation while there is still time toact. Carbon emissions is an exampleof an indicator that provides informa-tion in advance. Global temperaturechange, “global warming,” is theconcern, but because of lags in theresponse of the physical system andshort-term fluctuations that masklong-term trends, temperature mayrespond only after decades ofatmospheric change.
• Policy-relevant. Does the indicatorhave relevance for policy decisions forall stakeholders in the system,including the least powerful ones?Can anything be done to affect theindicator? Should it be includedanyway to suggest improved policyresponsiveness?
A Work In ProgressThis report provides a timely review ofsustainability trends in the Seattle/KingCounty region. The 40 indicatorsrepresented were selected from a list of99 recommended by a “Civic Panel” of150 citizens convened in 1992. See theIndicators Story on page 69. Of theoriginal set, several indicators have beenadded or deleted in response to newinformation or valuable criticism. Still,the intent of the Civic Panel is reflected.
The data we collected is our best effort atidentifying and displaying relevantinformation, ranging from readilyaccessible public data, to new synthesesbased on existing research, to publicopinion polling and other subjectiveinformation. The geographic scale ofeach indicator depends on the context andaccessibility of the data. Some indicatorsrefer to the Seattle city limits, others lookat King County (our first choice, whenavailable), and still others place Seattle in astatewide context. Each indicator hasbeen researched by a Sustainable Seattlevolunteer and reviewed by local experts.When uncertainty exists about theindicator, its data, or its interpretation, wesay so. But we include even some “flawed”indicators to bring attention to theimportance of the topic and the need forbetter ways to measure it.
“The indicators a societychooses to report to itselfabout itself are surprisingly
powerful. They reflectcollective values and inform
collective decisions. Anation that keeps a watch-
ful eye on its salmon runs orthe safety of its streetsmakes different choices
than does a nation that isonly paying attention to itsGNP. The idea of citizenschoosing their own indica-
tors is something newunder the sun—something
intensely democratic.”—Donella H. Meadows
Each indicator measures an importantdimension of sustainability. It is significantto remember that just as “the map is notthe territory,” the indicators are not thesame things as the systems they attempt tomeasure. These numbers, charts, andgraphs represent, in very simple terms, amuch more complex reality. Reflectedhere are the individual lives of millions ofpeople, animals, and other living things; acomplicated economic system; and manyof the conflicts and commonalitiesexpressed in community and political life.
The indicators, taken together, provide uswith a snapshot of our community, butthere is no abstract set of data or compre-hensive theory that can take the place ofpeople’s direct experiences. This collectionis not intended to be a comprehensive list;indeed, no scientifically-tested or refinedmodel of sustainability exists. In fact,since the world is always changing, so willthe picture of a sustainable society.
These Indicators will be updated andimproved on a regular basis. Wecontinue to invite your feedback andcriticism.
Exploring LinkagesIndicators help us understand linkages—the ways in which different parts of oursocial, economic, and environmentalsystems affect each other. They help ussee the truth behind John Muir’sdictum, that “everything is hitched toeverything else in the universe.”
For example, can we say our economy issustainable if, despite its growth, we havegrowing numbers of children in poverty,or a dwindling supply of natural resources?Can we make good decisions about thefuture of our neighborhoods withoutthinking about trends in juvenile crime orthe use of the automobile?
All of these systems are linked togetherin complex chains of cause-and-effect.Consider this scenario: when child povertyrates are high, more youth are likely toenter into a life of crime. High crime ratesmake parents less likely to let their childrenwalk or bike to school, and more likely todrive them. Increased driving means more
leaks and spills of motor oil or radiatorfluid, some of which will find its way intolocal streams where salmon live. Tracinglinkages can help us understand thedecline of salmon in our streams and thepoverty of children may be related inmore ways than we have previouslythought.
We encourage readers of this report toexplore the concept of linkages on theirown. One suggestion is to consider anindividual action and the chain of effectsit might have. For example, whatindicators might be affected if you choseto walk to the store instead of driving?You could (1) help improve air quality,(2) reduce the use of nonrenewableenergy, (3) save money, leaving it in thebank as community capital, or (4)potentially reduce the number of hoursyou need to work. If you walked orbiked regularly, you could (5) improveyour health (and perhaps reduce healthcare expenditures) and (6) becomefriendly with more of your neighbors. Anumber of these activities might (7)improve your perceived quality of life.
Throughout this report we have brieflynoted key linkages to each individualindicator. We do not presume to haverigorously measured these linkages, butbelieve that exploring and understand-ing them is critical to building asustainable society. By keeping thewhole picture in mind, in all its com-plexity, we can begin to address prob-lems at their roots, and act with greaterclarity and wisdom over time.
“What unites us is that weare all citizens of this greatcity, Seattle. We make it
great, and democratic, andhumane, by playing our
parts in this web of relation-ships, and by building andstrengthening the networkthat we call community.
Government cannot make acity good, nor compel
people to act for the com-mon good. Governmentcan punish negative acts,
and can encourage, exhort,educate, and inspire
people. But then citizensmust choose to work for
that good, and governmentmust welcome and facili-tate that participation and
partnership.”—Seattle City Councilmember
Richard Conlin
Sustainable Seattle Indicators 1998 Introduction 5
Applications forThese Indicators
To be successful in their purpose, theseIndicators must be used to guide change—in what we pay attention to as a commu-nity, in our priorities, in our collectivedecision-making and policy development,and in our individual and organizationalbehavior. We would like to see theIndicators influence elected officials,media, policymakers, businesses, socialorganizations, and the general public.Below are suggestions for their applica-tion.
• Local Media. To ensure a well-informedcitizenry, we would like to see localnewspapers and broadcasters coveringthe long-term trends affecting ourregion, how those trends link together,and what we each can do to movethem toward sustainability.
• Public Policy. We believe politicaldebate needs to be informed by anincreased concern for long-termsustainability, and by the integrated,“whole-systems” perspective that theIndicators portray.
• Business and Economic Development.The Indicators can help economicdecision-makers think more systemati-cally about how their decisions areaffecting a broader range of issuesthan “the bottom line.” They can alsobe used for market analysis, to spurthe development of products andservices that will advance progresstoward a more sustainable society.
• Education. These Indicators can beused as teaching tools to educatestudents about sustainability andsystems thinking. They can also serveas a model for additional researchprojects, such as devising a set ofinstitutional indicators (as one areaschool Lakeside has begun to do).
• Civil Society. Local non-profits andvolunteer groups can link their workto the broader cause of creating amore sustainable society, and use theIndicators as a benchmark for evaluat-
ing the success of their efforts ordesigning their programs. Foundationsand philanthropic organizations canuse the Indicators to help set theirfunding priorities.
• Personal Lifestyle. Indicators canchallenge us personally to explorehow the way we live affects the worldand moves the indicators in a positiveor negative direction. They can helpus better understand how eachindividual makes a difference, andguide us in taking actions as individu-als and in our community.
How You Can UseThese Indicators
You can personally use these indicators to:
• Educate yourself about importanttrends in our culture, economy,environment, and social well-beingthat may influence movement towardor away from sustainability.
• Examine your own choices andactions in terms of how they contrib-ute to these trends, discuss theseissues with your friends and col-leagues, and make conscious deci-sions.
• Assess the policies and activities ofbusinesses, organizations, agencies, orinstitutions you are affiliated with interms of how they affect these trends,or develop your own organization-specific indicators.
The central point is to identify an areawhere you’d like to focus on making apositive difference—and just do it!
“Small actions and choicescan have major, althoughunpredictable effects indetermining what comesnext. Among the possibili-
ties is that the thousands ofexperiments and millions ofchoices to live more con-
sciously will coalesce into anew civilization that fosterscommunity, provides possi-
bilities for meaning, andsustains life for the planet.”
—Sarah Van Gelder, EditorYES! A Journal of Positive
Futures
6 Introduction Sustainable Seattle Indicators 1998
E n v i r o n m e n t
Since 1990, Seattle has permanently protected more than 500 acres of new public open space, including pocket parks,
salmon streams, great blue heron nesting sites, and communitygardens. These areas not only provide havens for wildlife butalso for humans.
As one citizen noted, “For people living in areas where they’resurrounded by other people, cars, noise, filth, and pollution, it’simportant to be able to get to some place for dreaming.” Theprojects range in size from the large West Duwamish Greenbelt,where more than 175 acres have been protected, to the tinyBelltown P-Patch, a community garden occupying only one-tenth of an acre.
In 1989, voters in King County approved the Open Space andTrails Bond to acquire neighborhood parks, greenbelts, creeks,wildlife corridors, and community gardens in Seattle andaround the county. The bond provided Seattle about $40million for purchasing open space and trails, but the OpenSpace Program obtained matching funds to raise the total tonearly $100 million.
Seattle’s Open Space Program has been a local success story inthe last seven years, far exceeding its original goal of 286 acresof new public open space. Through purchases, agreements, anddonations, the program has preserved 382 acres of open spacein about 70 project areas, and government agencies havetransferred an additional 143 acres to the program. Beforecompleting its acquisition work this year, the program plans toadd another 45 acres to the 525 acres already protected, nearlydoubling its 1989 target.
Open space acquisitions provide habitat for native wildlife,protect wetlands, tidelands, river estuaries, stream corridors,and salmon-spawning sites. Urban trees and green space canimprove both air and water quality. In addition, these placesoffer essential habitat for humans by providing urban dwellers a
respite from concrete and buildings. Parks, community gardens,and natural areas give people places to relax, play, picnic, stroll,and explore. Open spaces create areas for residents to meettheir neighbors and help foster a sense of community. For kidsthese places provide adventures in the wild as well as educa-tional opportunities to use natural areas as outdoor classrooms.
Though the Open Space Program has far exceeded its originalgoals, acquisition has not always been easy. Often desirableplaces were not for sale, so the city had to approach the propertyowners, and negotiations for some sites lasted years.
Community members helped the program overcome manyobstacles. Citizens interested in open space often helped thecity locate sites, and neighborhood support aided the acquisi-tion process. Although 1989 bond funds are no longer availablefor new acquisitions and a King County Conservation andRecreation bond failed in 1996, opportunities exist for protect-ing, enhancing, and increasing open space in Seattle.
Open Space Program staff members stress the critical impor-tance of citizen involvement in restoration and maintenance ofthe new open spaces. Many sites need community stewards tokeep them in good condition, and other areas could usevolunteers to help clean and restore forests, creeks, and parks.The Adopt-A-Park program is a great way for citizens, busi-nesses, and schools to get involved in the future of Seattle’sopen spaces. In addition to safeguarding existing open spaces,interested citizens can advocate for more open space by gettinginvolved in the neighborhood planning process, the dispositionof surplus school properties, and regional transit planning.
Local neighborhood groups, such as the Thornton CreekAlliance in north Seattle, as well as citywide organizations likeOpen Space Advocates have played a key role in ensuring thepreservation of parks and natural areas throughout the city.
With adequate protection and community involvement, urbanopen spaces will continue to provide special places for peopleand wildlife both now and in years to come. As an open spacesupporter explained, “In the city, the population grows andgrows. To have a place with beauty and with the greenbelt isideal, not just for our generation, but for future generations.”
“Public open spaces are places where theseeds of sustainable communities take
root—where people become neighbors andwhere cities become more livable.”
—Trust for Public Land’s Green Cities Initiative
GrGrGrGrGreen Places feen Places feen Places feen Places feen Places for Por Por Por Por People,eople,eople,eople,eople,PPPPPerererereregrines, and Pegrines, and Pegrines, and Pegrines, and Pegrines, and Poooootttttatatatatatoesoesoesoesoes
Story by Christina Halvorson
S U C C E S S S T O R I E S
8 Environment Sustainable Seattle Indicators 1998
?
?
?
?
Environment
Wild Salmon
Ecological Health
Soil Erosion
Air Quality
Pedestrian- & Bicycle-Friendly Streets
Open Space near UrbanVillages
Impervious Surfaces
S U S T A I N A B I L I T Y T R E N D S
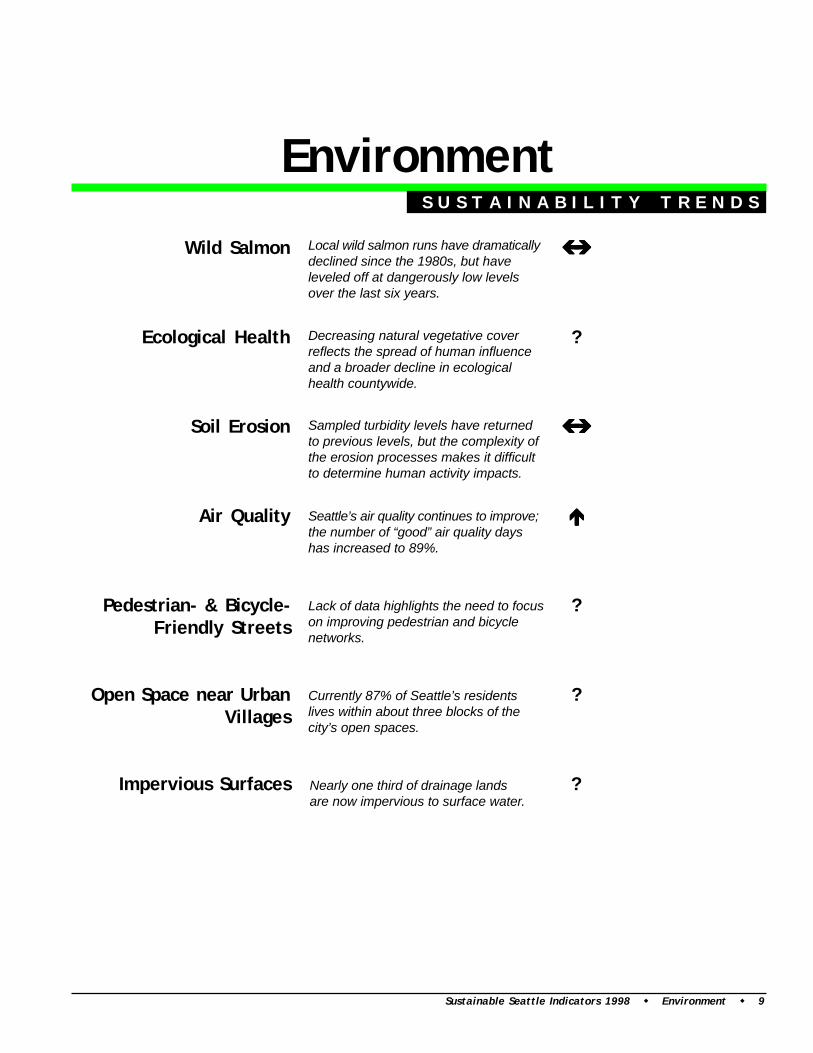
Local wild salmon runs have dramaticallydeclined since the 1980s, but haveleveled off at dangerously low levelsover the last six years.
Decreasing natural vegetative coverreflects the spread of human influenceand a broader decline in ecologicalhealth countywide.
Sampled turbidity levels have returnedto previous levels, but the complexity ofthe erosion processes makes it difficultto determine human activity impacts.
Seattle’s air quality continues to improve;the number of “good” air quality dayshas increased to 89%.
Lack of data highlights the need to focuson improving pedestrian and bicyclenetworks.
Currently 87% of Seattle’s residentslives within about three blocks of thecity’s open spaces.
Nearly one third of drainage landsare now impervious to surface water.
Sustainable Seattle Indicators 1998 Environment 9
Wild Salmon
10 Environment Sustainable Seattle Indicators 1998
Sustainability trend Local wild salmon runs have dramatically declined since the 1980s but have leveled off at dangerously low levels over the last six years.
Description Wild Salmon are an important economic resource and fundamental environmental indicator, as well as a cultural symbol to those living in the Northwest. Native Americans have long revered wild salmon as a link to the earth and as a food resource. From the first immigrants to present day sport and commercial fishers, salmon have been a source of astonishment and nourishment. Unlike hatchery-raised salmon that spend much of their lives in a controlled, human-made environment, wild salmon are totally dependent on the health of the freshwater environment for reproduction. They need clean water and a passable stream. Wild salmon have evolved to meet the specific natural characteristics of their local environment; for example, their eggs are adapted to specific gravel size and water chemistry. Changes in bottom conditions, local plants and animals, and water chemistry—such as those that accompany urban or suburban development—usually result in a reduced number of fish surviving. Decreased genetic diversity caused by the loss of a salmon stock in one stream can affect the viability of stocks in adjacent habitats. The health of wild salmon populations is thus an indicator of overall environmental health in a watershed.
Definition Sockeye and Chinook salmon from the Cedar River and Coho salmon from three creeks in the Lake Washington basin were chosen as representative examples for surviving King County salmon runs. Cedar River Sockeye were actually introduced early in this century, but are now considered wild. Washington State Department of Fish
and Wildlife provided salmon return numbers and escapement estimates for these drainages. 1
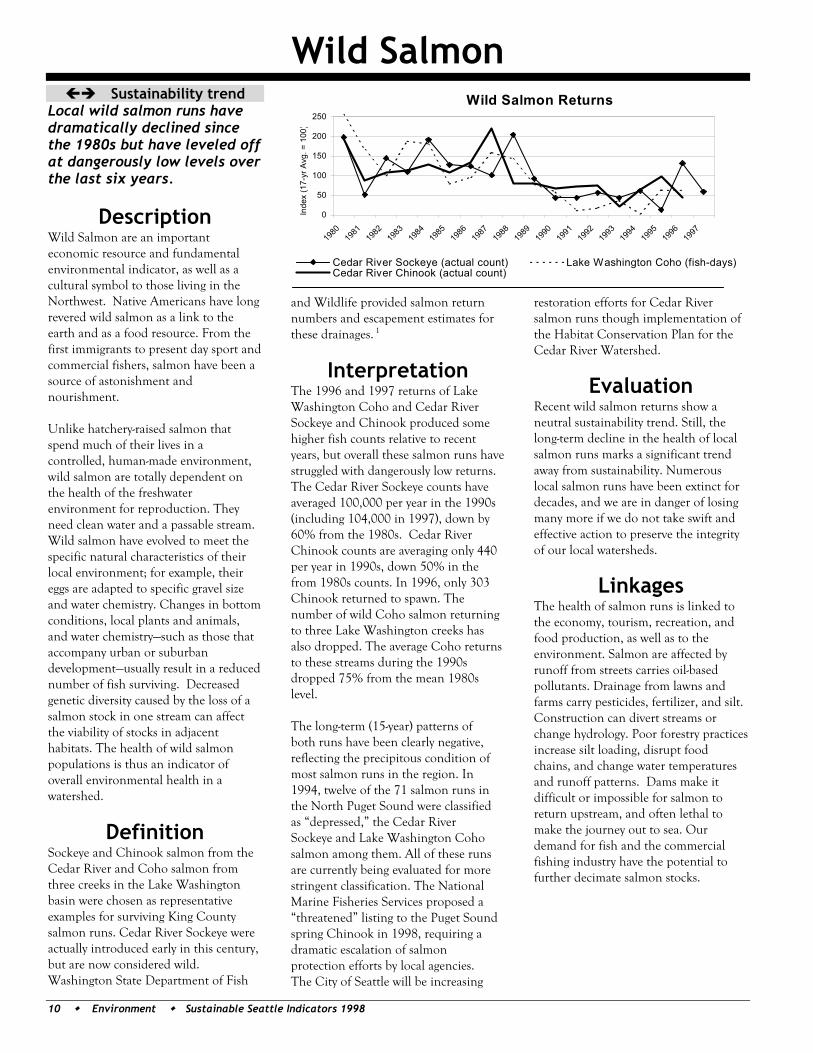
Interpretation The 1996 and 1997 returns of Lake Washington Coho and Cedar River Sockeye and Chinook produced some higher fish counts relative to recent years, but overall these salmon runs have struggled with dangerously low returns. The Cedar River Sockeye counts have averaged 100,000 per year in the 1990s (including 104,000 in 1997), down by 60% from the 1980s. Cedar River Chinook counts are averaging only 440 per year in 1990s, down 50% in the from 1980s counts. In 1996, only 303 Chinook returned to spawn. The number of wild Coho salmon returning to three Lake Washington creeks has also dropped. The average Coho returns to these streams during the 1990s dropped 75% from the mean 1980s level. The long-term (15-year) patterns of both runs have been clearly negative, reflecting the precipitous condition of most salmon runs in the region. In 1994, twelve of the 71 salmon runs in the North Puget Sound were classified as “depressed,” the Cedar River Sockeye and Lake Washington Coho salmon among them. All of these runs are currently being evaluated for more stringent classification. The National Marine Fisheries Services proposed a “threatened” listing to the Puget Sound spring Chinook in 1998, requiring a dramatic escalation of salmon protection efforts by local agencies. The City of Seattle will be increasing
restoration efforts for Cedar River salmon runs though implementation of the Habitat Conservation Plan for the Cedar River Watershed.
Evaluation Recent wild salmon returns show a neutral sustainability trend. Still, the long-term decline in the health of local salmon runs marks a significant trend away from sustainability. Numerous local salmon runs have been extinct for decades, and we are in danger of losing many more if we do not take swift and effective action to preserve the integrity of our local watersheds.
Linkages The health of salmon runs is linked to the economy, tourism, recreation, and food production, as well as to the environment. Salmon are affected by runoff from streets carries oil-based pollutants. Drainage from lawns and farms carry pesticides, fertilizer, and silt. Construction can divert streams or change hydrology. Poor forestry practices increase silt loading, disrupt food chains, and change water temperatures and runoff patterns. Dams make it difficult or impossible for salmon to return upstream, and often lethal to make the journey out to sea. Our demand for fish and the commercial fishing industry have the potential to further decimate salmon stocks.
Wild Salmon Returns
0
50
100
150
200
250
1980
1981
1982
1983
1984
1985
1986
1987
1988
1989
1990
1991
1992
1993
1994
1995
1996
1997
Inde
x (1
7-yr
Avg
. = 1
00)
Cedar River Sockeye (actual count) Lake Washington Coho (fish-days)Cedar River Chinook (actual count)
Ecological Health
Sustainable Seattle Indicators 1998 Environment 11
? Sustainability trend Decreasing natural vegetative cover reflects the spread of human influence and a broader decline in ecological health countywide.
Description A sustainable community preserves natural systems because they offer a richness that nurtures the human spirit as well as protects air and water quality. Healthy landscapes are necessary to sustain the complex myriad of plant and animal species that share our habitat. We are dependent on the surrounding landscapes for many resources such as food, water, and wood products; for recreational opportunities and aesthetic values; and for vital natural processes such as water retention and recycling, air cleansing, and nutrient cycling. For example, the City of Seattle requires an intact, healthy watershed for the storage and purification of our drinking water; this watershed service saves Seattle $400 million in treatment equipment. By measuring the health of local landscapes, we can evaluate our effects on natural systems in and around Seattle.
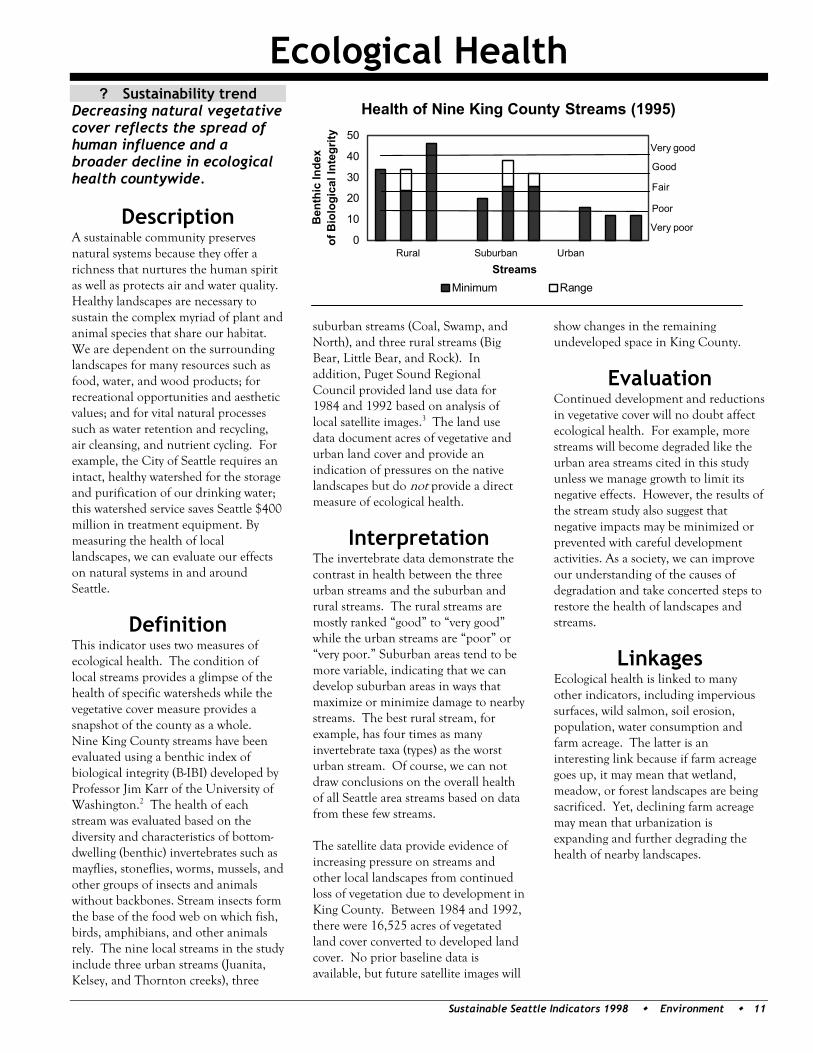
Definition This indicator uses two measures of ecological health. The condition of local streams provides a glimpse of the health of specific watersheds while the vegetative cover measure provides a snapshot of the county as a whole. Nine King County streams have been evaluated using a benthic index of biological integrity (B-IBI) developed by Professor Jim Karr of the University of Washington.2 The health of each stream was evaluated based on the diversity and characteristics of bottom-dwelling (benthic) invertebrates such as mayflies, stoneflies, worms, mussels, and other groups of insects and animals without backbones. Stream insects form the base of the food web on which fish, birds, amphibians, and other animals rely. The nine local streams in the study include three urban streams (Juanita, Kelsey, and Thornton creeks), three
suburban streams (Coal, Swamp, and North), and three rural streams (Big Bear, Little Bear, and Rock). In addition, Puget Sound Regional Council provided land use data for 1984 and 1992 based on analysis of local satellite images.3 The land use data document acres of vegetative and urban land cover and provide an indication of pressures on the native landscapes but do not provide a direct measure of ecological health.
Interpretation The invertebrate data demonstrate the contrast in health between the three urban streams and the suburban and rural streams. The rural streams are mostly ranked “good” to “very good” while the urban streams are “poor” or “very poor.” Suburban areas tend to be more variable, indicating that we can develop suburban areas in ways that maximize or minimize damage to nearby streams. The best rural stream, for example, has four times as many invertebrate taxa (types) as the worst urban stream. Of course, we can not draw conclusions on the overall health of all Seattle area streams based on data from these few streams. The satellite data provide evidence of increasing pressure on streams and other local landscapes from continued loss of vegetation due to development in King County. Between 1984 and 1992, there were 16,525 acres of vegetated land cover converted to developed land cover. No prior baseline data is available, but future satellite images will
show changes in the remaining undeveloped space in King County.
Evaluation Continued development and reductions in vegetative cover will no doubt affect ecological health. For example, more streams will become degraded like the urban area streams cited in this study unless we manage growth to limit its negative effects. However, the results of the stream study also suggest that negative impacts may be minimized or prevented with careful development activities. As a society, we can improve our understanding of the causes of degradation and take concerted steps to restore the health of landscapes and streams.
Linkages Ecological health is linked to many other indicators, including impervious surfaces, wild salmon, soil erosion, population, water consumption and farm acreage. The latter is an interesting link because if farm acreage goes up, it may mean that wetland, meadow, or forest landscapes are being sacrificed. Yet, declining farm acreage may mean that urbanization is expanding and further degrading the health of nearby landscapes.
Health of Nine King County Streams (1995)
0
10
20
30
40
50
Streams
Ben
thic
Inde
x of
Bio
logi
cal I
nteg
rity
Minimum Range
Rural UrbanSuburban
Very good
Good
Fair
Poor
Very poor

Soil Erosion
12 Environment Sustainable Seattle Indicators 1998
Sustainability trend Sampled turbidity levels have returned to previous levels, but the complexity of the erosion processes makes it difficult to determine human activity impacts.
Description Soil erosion occurs naturally due to landslides, slumps, or other mass wasting events or by the force of moving water and wind. Human activities can accelerate erosion through urban development, construction activities, farming, and timber harvesting. Streams and rivers are the primary transport pathways of eroded soil, carrying the sediment to downstream areas. Accumulation of sediment can alter drainage patterns, damage structures, and degrade aquatic habitat and water quality in streams, lakes, wetlands, and floodplains.
Definition The erosion, transport, and deposition of soil are complex processes involving highly variable natural and human elements. The largest erosion events usually occur as a result of floods and heavy precipitation, making them seasonally distributed and not necessarily predictable. Soil type, slope conditions, vegetation, conveyance pathway, water velocity, and downstream conditions all interact to determine where erosion will occur or where eroded soil may deposit. Monitoring sediment loads carried by streams and rivers requires an understanding of the relationship between the bed load, total suspended solids, and turbidity. Bed load is the sediment that is transported in a stream very close to the bed surface. Total suspended solids are the weight of particles that are suspended in the stream flow. Turbidity is the amount of material suspended in the water, measured by the amount of light that penetrates the water column. Increases to any one of these parameters can signal an increase in the amount of
sediment reaching the stream. A more accurate indicator of erosion is to evaluate the three parameters together to account for seasonal and localized variability. No comprehensive assessment of erosion and sedimentation trends in King County has been conducted to date. In the interim, data were taken from water quality studies conducted from 1984 through 1993 in which monthly turbidity readings at sites located on major streams and rivers within King County were collected.4
Interpretation Analysis of this selected data indicates that turbidity increased at all stations on the Cedar River, Duwamish River, Green River, Sammamish River, and the Lake Washington Ship Canal after 1987 but then returned to historical averages by 1990. With the exception of the Green River, all the waterways included in the indicator returned to their approximate 1984 levels by 1993.
Evaluation Due to the complexity of the seasonal nature and frequency of natural erosion processes, it is difficult to determine increases in erosion rates attributable to human activities and the long-term relationship to sustainability. Most nonpoint soil erosion results from agriculture, logging, and construction. In addition, changes in dam management on the Cedar River might impact the sediment measurements downstream. Analysis of trends requires baseline data for comparison
and data collection over a much longer period of time. Further investigation of other parameters such as bed load and total suspended sediment is necessary to accurately predict changes in erosion related to human activities.
Linkages Soil erosion is linked to indicators of impervious surfaces, vehicle miles traveled, ecological health, and population. Soil erosion impacts the health and productivity of farms, forests, and water bodies in King County. Erosion from agricultural lands can reduce the productivity of farms and pastures. Loss of forest soils and sediments from mass wasting and slope erosion in the Cascade mountains and foothills can negatively effect forest regeneration, thereby reducing the long-term viability of the forest ecosystem and the forest products industry. Soil erosion degrades aquatic habitat and water quality, reducing wild salmon and other water-dependent populations, as well as altering the aesthetic and recreational capacity of our waters.
Turbidity LevelsAverage of Five Selected Sites in King County
0
1
2
3
4
5
1984 1985 1986 1987 1988 *1989 1990 1991 1992 1993N
et T
urbi
dity
Uni
ts
Air Quality
Sustainable Seattle Indicators 1998 Environment 13
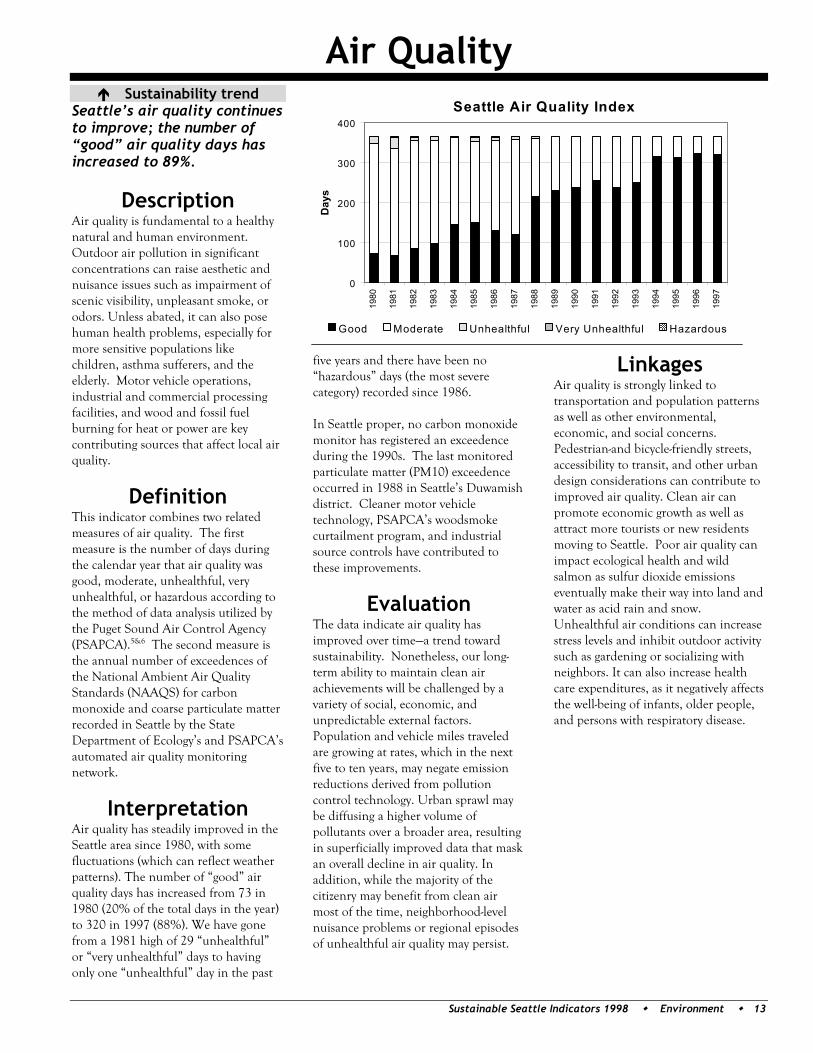
Sustainability trend Seattle’s air quality continues to improve; the number of “good” air quality days has increased to 89%.
Description Air quality is fundamental to a healthy natural and human environment. Outdoor air pollution in significant concentrations can raise aesthetic and nuisance issues such as impairment of scenic visibility, unpleasant smoke, or odors. Unless abated, it can also pose human health problems, especially for more sensitive populations like children, asthma sufferers, and the elderly. Motor vehicle operations, industrial and commercial processing facilities, and wood and fossil fuel burning for heat or power are key contributing sources that affect local air quality.
Definition This indicator combines two related measures of air quality. The first measure is the number of days during the calendar year that air quality was good, moderate, unhealthful, very unhealthful, or hazardous according to the method of data analysis utilized by the Puget Sound Air Control Agency (PSAPCA).5&6 The second measure is the annual number of exceedences of the National Ambient Air Quality Standards (NAAQS) for carbon monoxide and coarse particulate matter recorded in Seattle by the State Department of Ecology’s and PSAPCA’s automated air quality monitoring network.
Interpretation Air quality has steadily improved in the Seattle area since 1980, with some fluctuations (which can reflect weather patterns). The number of “good” air quality days has increased from 73 in 1980 (20% of the total days in the year) to 320 in 1997 (88%). We have gone from a 1981 high of 29 “unhealthful” or “very unhealthful” days to having only one “unhealthful” day in the past
five years and there have been no “hazardous” days (the most severe category) recorded since 1986. In Seattle proper, no carbon monoxide monitor has registered an exceedence during the 1990s. The last monitored particulate matter (PM10) exceedence occurred in 1988 in Seattle’s Duwamish district. Cleaner motor vehicle technology, PSAPCA’s woodsmoke curtailment program, and industrial source controls have contributed to these improvements.
Evaluation The data indicate air quality has improved over time—a trend toward sustainability. Nonetheless, our long-term ability to maintain clean air achievements will be challenged by a variety of social, economic, and unpredictable external factors. Population and vehicle miles traveled are growing at rates, which in the next five to ten years, may negate emission reductions derived from pollution control technology. Urban sprawl may be diffusing a higher volume of pollutants over a broader area, resulting in superficially improved data that mask an overall decline in air quality. In addition, while the majority of the citizenry may benefit from clean air most of the time, neighborhood-level nuisance problems or regional episodes of unhealthful air quality may persist.
Linkages Air quality is strongly linked to transportation and population patterns as well as other environmental, economic, and social concerns. Pedestrian-and bicycle-friendly streets, accessibility to transit, and other urban design considerations can contribute to improved air quality. Clean air can promote economic growth as well as attract more tourists or new residents moving to Seattle. Poor air quality can impact ecological health and wild salmon as sulfur dioxide emissions eventually make their way into land and water as acid rain and snow. Unhealthful air conditions can increase stress levels and inhibit outdoor activity such as gardening or socializing with neighbors. It can also increase health care expenditures, as it negatively affects the well-being of infants, older people, and persons with respiratory disease.
Seattle Air Quality Index
0
100
200
300
400
1980
1981
1982
1983
1984
1985
1986
1987
1988
1989
1990
1991
1992
1993
1994
1995
1996
1997
Day
sGood Moderate Unhealthful Very Unhealthful Hazardous
Pedestrian- & Bicycle-Friendly Streets
14 Environment Sustainable Seattle Indicators 1998
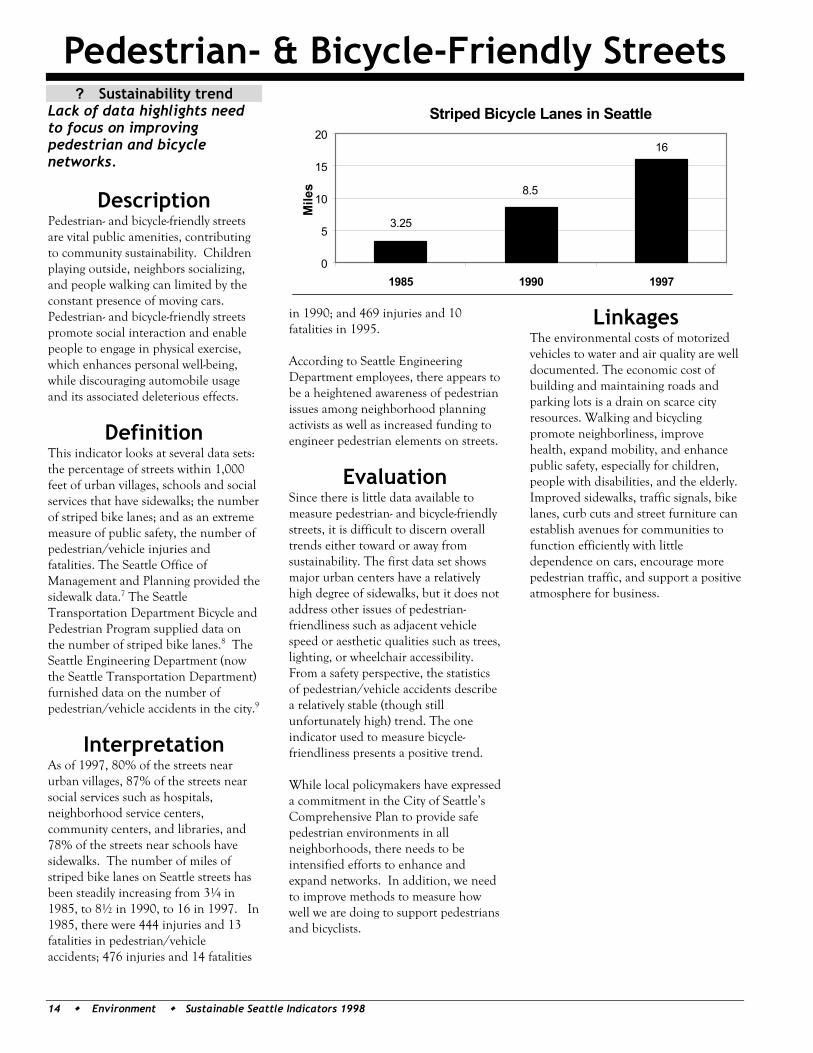
? Sustainability trend Lack of data highlights need to focus on improving pedestrian and bicycle networks.
Description Pedestrian- and bicycle-friendly streets are vital public amenities, contributing to community sustainability. Children playing outside, neighbors socializing, and people walking can limited by the constant presence of moving cars. Pedestrian- and bicycle-friendly streets promote social interaction and enable people to engage in physical exercise, which enhances personal well-being, while discouraging automobile usage and its associated deleterious effects.
Definition This indicator looks at several data sets: the percentage of streets within 1,000 feet of urban villages, schools and social services that have sidewalks; the number of striped bike lanes; and as an extreme measure of public safety, the number of pedestrian/vehicle injuries and fatalities. The Seattle Office of Management and Planning provided the sidewalk data.7 The Seattle Transportation Department Bicycle and Pedestrian Program supplied data on the number of striped bike lanes.8 The Seattle Engineering Department (now the Seattle Transportation Department) furnished data on the number of pedestrian/vehicle accidents in the city.9
Interpretation As of 1997, 80% of the streets near urban villages, 87% of the streets near social services such as hospitals, neighborhood service centers, community centers, and libraries, and 78% of the streets near schools have sidewalks. The number of miles of striped bike lanes on Seattle streets has been steadily increasing from 3¼ in 1985, to 8½ in 1990, to 16 in 1997. In 1985, there were 444 injuries and 13 fatalities in pedestrian/vehicle accidents; 476 injuries and 14 fatalities
in 1990; and 469 injuries and 10 fatalities in 1995. According to Seattle Engineering Department employees, there appears to be a heightened awareness of pedestrian issues among neighborhood planning activists as well as increased funding to engineer pedestrian elements on streets.
Evaluation Since there is little data available to measure pedestrian- and bicycle-friendly streets, it is difficult to discern overall trends either toward or away from sustainability. The first data set shows major urban centers have a relatively high degree of sidewalks, but it does not address other issues of pedestrian-friendliness such as adjacent vehicle speed or aesthetic qualities such as trees, lighting, or wheelchair accessibility. From a safety perspective, the statistics of pedestrian/vehicle accidents describe a relatively stable (though still unfortunately high) trend. The one indicator used to measure bicycle-friendliness presents a positive trend. While local policymakers have expressed a commitment in the City of Seattle’s Comprehensive Plan to provide safe pedestrian environments in all neighborhoods, there needs to be intensified efforts to enhance and expand networks. In addition, we need to improve methods to measure how well we are doing to support pedestrians and bicyclists.
Linkages The environmental costs of motorized vehicles to water and air quality are well documented. The economic cost of building and maintaining roads and parking lots is a drain on scarce city resources. Walking and bicycling promote neighborliness, improve health, expand mobility, and enhance public safety, especially for children, people with disabilities, and the elderly. Improved sidewalks, traffic signals, bike lanes, curb cuts and street furniture can establish avenues for communities to function efficiently with little dependence on cars, encourage more pedestrian traffic, and support a positive atmosphere for business.
Striped Bicycle Lanes in Seattle
16
3.25
8.5
0
5
10
15
20
1985 1990 1997
Mile
s
Open Space near Urban Villages
Sustainable Seattle Indicators 1998 Environment 15
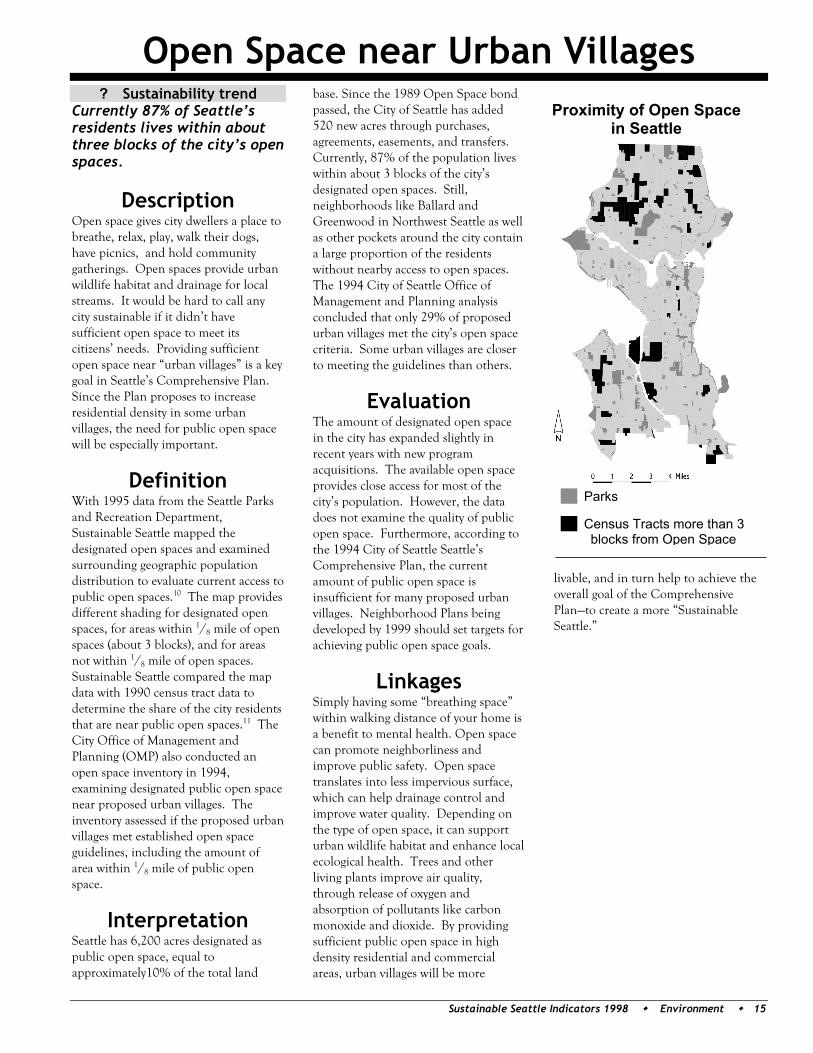
? Sustainability trend Currently 87% of Seattle’s residents lives within about three blocks of the city’s open spaces.
Description Open space gives city dwellers a place to breathe, relax, play, walk their dogs, have picnics, and hold community gatherings. Open spaces provide urban wildlife habitat and drainage for local streams. It would be hard to call any city sustainable if it didn’t have sufficient open space to meet its citizens’ needs. Providing sufficient open space near “urban villages” is a key goal in Seattle’s Comprehensive Plan. Since the Plan proposes to increase residential density in some urban villages, the need for public open space will be especially important.
Definition With 1995 data from the Seattle Parks and Recreation Department, Sustainable Seattle mapped the designated open spaces and examined surrounding geographic population distribution to evaluate current access to public open spaces.10 The map provides different shading for designated open spaces, for areas within 1/8 mile of open spaces (about 3 blocks), and for areas not within 1/8 mile of open spaces. Sustainable Seattle compared the map data with 1990 census tract data to determine the share of the city residents that are near public open spaces.11 The City Office of Management and Planning (OMP) also conducted an open space inventory in 1994, examining designated public open space near proposed urban villages. The inventory assessed if the proposed urban villages met established open space guidelines, including the amount of area within 1/8 mile of public open space.
Interpretation Seattle has 6,200 acres designated as public open space, equal to approximately10% of the total land
base. Since the 1989 Open Space bond passed, the City of Seattle has added 520 new acres through purchases, agreements, easements, and transfers. Currently, 87% of the population lives within about 3 blocks of the city’s designated open spaces. Still, neighborhoods like Ballard and Greenwood in Northwest Seattle as well as other pockets around the city contain a large proportion of the residents without nearby access to open spaces. The 1994 City of Seattle Office of Management and Planning analysis concluded that only 29% of proposed urban villages met the city’s open space criteria. Some urban villages are closer to meeting the guidelines than others.
Evaluation The amount of designated open space in the city has expanded slightly in recent years with new program acquisitions. The available open space provides close access for most of the city’s population. However, the data does not examine the quality of public open space. Furthermore, according to the 1994 City of Seattle Seattle’s Comprehensive Plan, the current amount of public open space is insufficient for many proposed urban villages. Neighborhood Plans being developed by 1999 should set targets for achieving public open space goals.
Linkages Simply having some “breathing space” within walking distance of your home is a benefit to mental health. Open space can promote neighborliness and improve public safety. Open space translates into less impervious surface, which can help drainage control and improve water quality. Depending on the type of open space, it can support urban wildlife habitat and enhance local ecological health. Trees and other living plants improve air quality, through release of oxygen and absorption of pollutants like carbon monoxide and dioxide. By providing sufficient public open space in high density residential and commercial areas, urban villages will be more
livable, and in turn help to achieve the overall goal of the Comprehensive Plan—to create a more “Sustainable Seattle.”
Proximity of Open Space in Seattle
Parks Census Tracts more than 3
blocks from Open Space
Impervious Surfaces
16 Environment Sustainable Seattle Indicators 1998
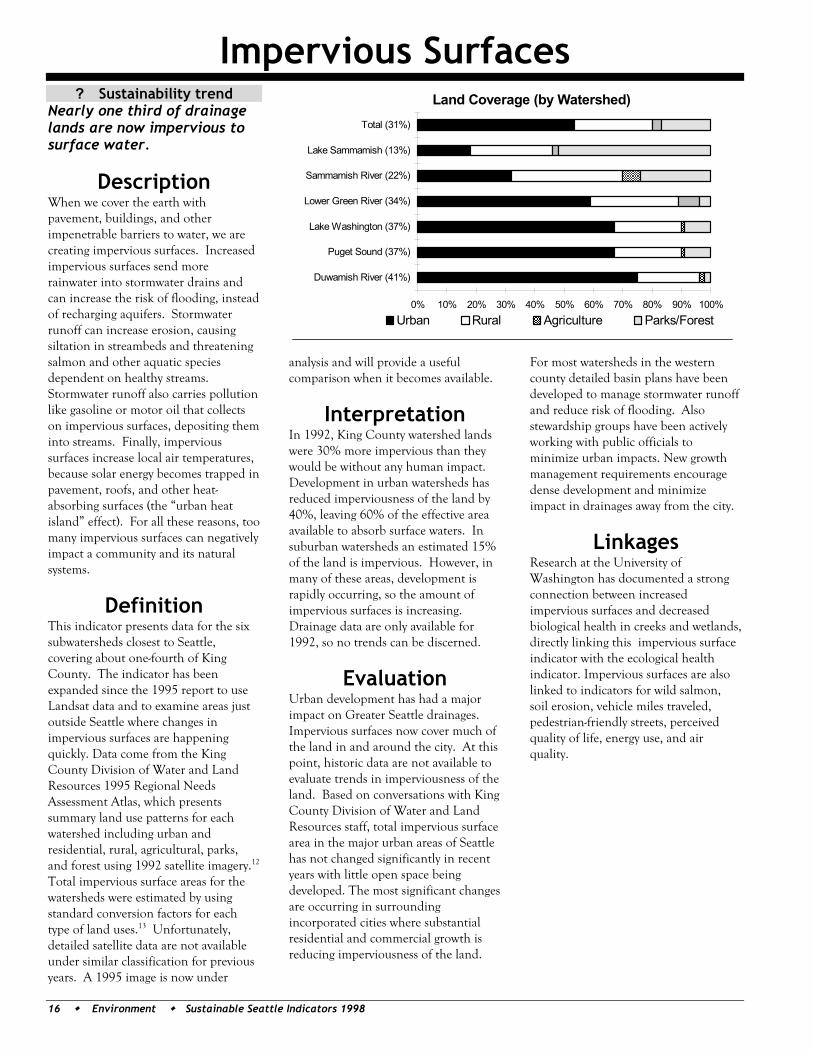
? Sustainability trend Nearly one third of drainage lands are now impervious to surface water.
Description When we cover the earth with pavement, buildings, and other impenetrable barriers to water, we are creating impervious surfaces. Increased impervious surfaces send more rainwater into stormwater drains and can increase the risk of flooding, instead of recharging aquifers. Stormwater runoff can increase erosion, causing siltation in streambeds and threatening salmon and other aquatic species dependent on healthy streams. Stormwater runoff also carries pollution like gasoline or motor oil that collects on impervious surfaces, depositing them into streams. Finally, impervious surfaces increase local air temperatures, because solar energy becomes trapped in pavement, roofs, and other heat-absorbing surfaces (the “urban heat island” effect). For all these reasons, too many impervious surfaces can negatively impact a community and its natural systems.
Definition This indicator presents data for the six subwatersheds closest to Seattle, covering about one-fourth of King County. The indicator has been expanded since the 1995 report to use Landsat data and to examine areas just outside Seattle where changes in impervious surfaces are happening quickly. Data come from the King County Division of Water and Land Resources 1995 Regional Needs Assessment Atlas, which presents summary land use patterns for each watershed including urban and residential, rural, agricultural, parks, and forest using 1992 satellite imagery.12 Total impervious surface areas for the watersheds were estimated by using standard conversion factors for each type of land uses.13 Unfortunately, detailed satellite data are not available under similar classification for previous years. A 1995 image is now under
analysis and will provide a useful comparison when it becomes available.
Interpretation In 1992, King County watershed lands were 30% more impervious than they would be without any human impact. Development in urban watersheds has reduced imperviousness of the land by 40%, leaving 60% of the effective area available to absorb surface waters. In suburban watersheds an estimated 15% of the land is impervious. However, in many of these areas, development is rapidly occurring, so the amount of impervious surfaces is increasing. Drainage data are only available for 1992, so no trends can be discerned.
Evaluation Urban development has had a major impact on Greater Seattle drainages. Impervious surfaces now cover much of the land in and around the city. At this point, historic data are not available to evaluate trends in imperviousness of the land. Based on conversations with King County Division of Water and Land Resources staff, total impervious surface area in the major urban areas of Seattle has not changed significantly in recent years with little open space being developed. The most significant changes are occurring in surrounding incorporated cities where substantial residential and commercial growth is reducing imperviousness of the land.
For most watersheds in the western county detailed basin plans have been developed to manage stormwater runoff and reduce risk of flooding. Also stewardship groups have been actively working with public officials to minimize urban impacts. New growth management requirements encourage dense development and minimize impact in drainages away from the city.
Linkages Research at the University of Washington has documented a strong connection between increased impervious surfaces and decreased biological health in creeks and wetlands, directly linking this impervious surface indicator with the ecological health indicator. Impervious surfaces are also linked to indicators for wild salmon, soil erosion, vehicle miles traveled, pedestrian-friendly streets, perceived quality of life, energy use, and air quality.
Land Coverage (by Watershed)
0% 10% 20% 30% 40% 50% 60% 70% 80% 90% 100%
Duwamish River (41%)
Puget Sound (37%)
Lake Washington (37%)
Lower Green River (34%)
Sammamish River (22%)
Lake Sammamish (13%)
Total (31%)
Urban Rural Agriculture Parks/Forest
Sustainable Seattle Indicators 1998 Environment 17
Environment Notes 1 Ron Egan and Chuck Baranski, Washington State Fish and Wildlife Department, private communication, July 22,1997. 2 James Karr, University of Washington, private communication, August and December 1997. 3 Jay Clark, Puget Sound Regional Council, private communication, August 1997. 4 King County Water and Land Resources Division, Quality of Local Lakes and Streams. (Seattle, WA: 1994). 5 Puget Sound Air Pollution Control Agency, 1995 Air Quality Data Summary (Seattle, WA: December 1996). 6 Stella Neham, Puget Sound Air Pollution Control Agency, private communication, October 1997. 7 Seattle Office of Management and Planning, Sidewalks and Related Storm Drainage Improvements: SLI #49, (Seattle, WA: June 1997). 8 Peter Lagerway, Seattle Transportation Department, Bicycle Program, private communication, July 1997. 9 Seattle Transportation Department, Seattle Traffic Accidents Summary: 1996 (Seattle, WA: 1997). 10 Seattle Parks and Recreation Department, unpublished geographic data, 1995. 11 U.S. Bureau of the Census Web data: 1990 (http://www.census.gov/). 12 King County Water and Land Resources Division and Regional Needs Assessment, Atlas of the Watersheds of King County (Seattle, WA: July 1995). 13 Chris Pyle, King County Water and Land Resources Division, private communication, August 1997.

R e s o u r c e s
P o p u l a t i o n &
The technological abilities, environmental ethic, and geo- graphical location of the Pacific Northwest make it a likely
laboratory for fostering sustainability. It’s no wonder thatpeople are expecting Northwest businesses to lead the way to aneconomy that’s clean, green, and efficient.
The Northwest Environmental Business Council (NEBC) is anewly formed regional trade group for businesses whosebusiness is the environment. Environmental businesses fromWashington, Oregon, Idaho, Montana, and Alaska are eligibleto join NEBC.
Member businesses receive professional support, marketingleads, discounted services, and advertising. NEBC committeesalso work to encourage dialogue between industry and regula-tors and work on legislation affecting environmental businesses.
“NEBC members are mostly consulting and engineering firms,”said Mike McDowell, president of NEBC, “though there are anincreasing number of environmental technology and pollutionprevention firms.”
McDowell said that there is reluctance on the part of membercompanies to be out in the lead on environmental issuesbecause companies don’t want to be seen as using the politicalprocess to raise revenues. However, regional business organiza-tions such as NEBC can take a more activist role, he said.NEBC is now working with the Asia Pacific Economic Coopera-tion Center for Sustainable Development and may offer jointbusiness memberships with the Alternative Energy Association.
NEBC looks beyond the Pacific Northwest to help membersmarket themselves internationally. Such marketing is growingincreasingly important, as demand for environmental serviceswithin the U.S. levels off, and demand in overseas markets suchas Asia grows dramatically. McDowell says that NEBC isworking on developing foreign markets, especially in Asia. “Weare trying to position ourselves as leaders in that area. It’s adifficult process because we don’t have many companies (shortof the big international companies) that have a lot of interna-tional experience.”
According to a recent report by the Washington State Depart-ment of Community, Trade and Economic Development,nearly 500 environmental industry companies are located in
Washington State, employing more than 27,000 people. Most ofthese companies are small and specialized; nearly a third have 10or fewer employees and more than half have fewer than 50employees. Altogether, the industry generates annual revenuesof at least $3 billion. Worldwide, the environmental-industrymarket is projected to top $600 billion by the year 2000,compared to about $300 billion in 1993. This corresponds toan annual growth rate of over 10%.
In 1997, the state-level industry associations elected to createNEBC to leverage their resources and serve the Pacific North-west region as a whole. The Washington EnvironmentalIndustry Association (WEIA) is one of those organizations. TheWEIA web page lists 53 member businesses from the City ofSeattle and 164 from the state of Washington. WEIA will nolonger exist as its own entity. Instead, it is moving its member-ship into NEBC.
More information about WEIA can be found online atwww.weia.org or by calling 206-528-3410. More informationabout NEBC and member businesses can be found on its webpage at www.nebc.org or by calling 503-227-6361.
NNNNNorororororthwthwthwthwthwesesesesest Ent Ent Ent Ent EnvirvirvirvirvironmentonmentonmentonmentonmentalalalalalBusinesses Band TBusinesses Band TBusinesses Band TBusinesses Band TBusinesses Band Togeogeogeogeogethertherthertherther
Story by Aaron Best
S U C C E S S S T O R I E S
20 Population & Resources Sustainable Seattle Indicators 1998
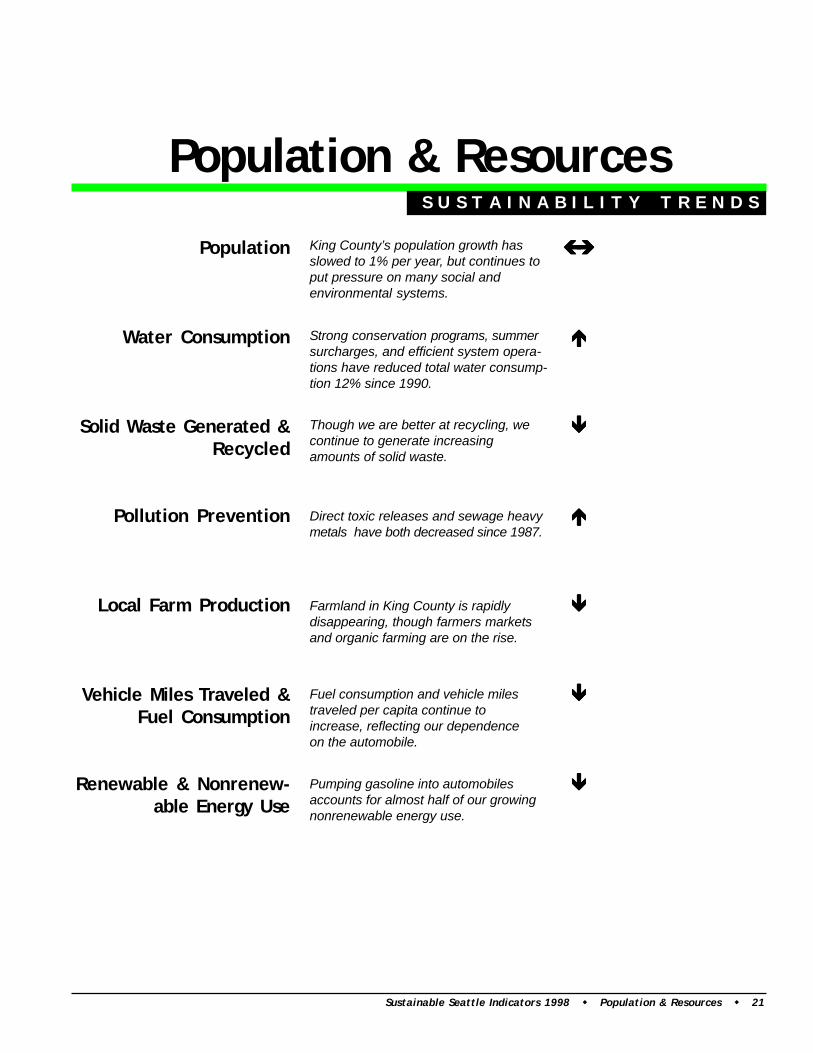
Population
Water Consumption
Solid Waste Generated &Recycled
Pollution Prevention
Local Farm Production
Vehicle Miles Traveled &Fuel Consumption
Renewable & Nonrenew-able Energy Use
Population & ResourcesS U S T A I N A B I L I T Y T R E N D S
King County’s population growth hasslowed to 1% per year, but continues toput pressure on many social andenvironmental systems.
Strong conservation programs, summersurcharges, and efficient system opera-tions have reduced total water consump-tion 12% since 1990.
Though we are better at recycling, wecontinue to generate increasingamounts of solid waste.
Direct toxic releases and sewage heavymetals have both decreased since 1987.
Farmland in King County is rapidlydisappearing, though farmers marketsand organic farming are on the rise.
Pumping gasoline into automobilesaccounts for almost half of our growingnonrenewable energy use.
Fuel consumption and vehicle milestraveled per capita continue toincrease, reflecting our dependenceon the automobile.
Sustainable Seattle Indicators 1998 Population & Resources 21
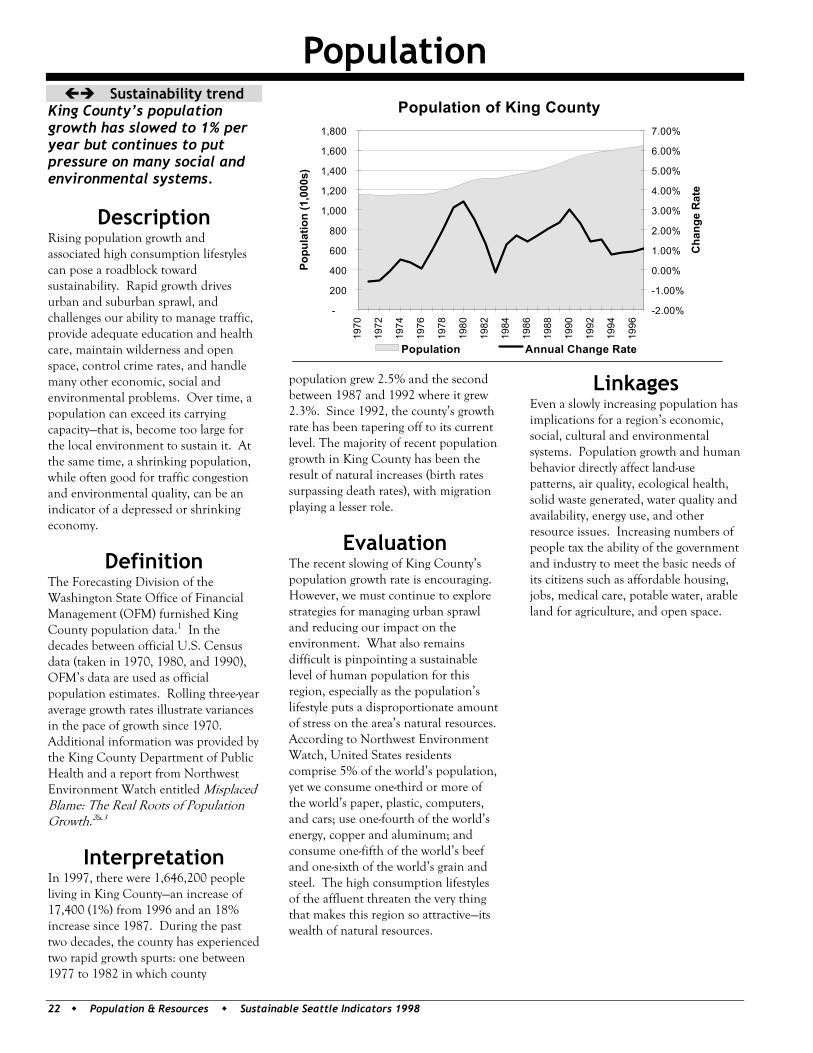
Population
22 Population & Resources Sustainable Seattle Indicators 1998
Sustainability trend King County’s population growth has slowed to 1% per year but continues to put pressure on many social and environmental systems.
Description Rising population growth and associated high consumption lifestyles can pose a roadblock toward sustainability. Rapid growth drives urban and suburban sprawl, and challenges our ability to manage traffic, provide adequate education and health care, maintain wilderness and open space, control crime rates, and handle many other economic, social and environmental problems. Over time, a population can exceed its carrying capacity—that is, become too large for the local environment to sustain it. At the same time, a shrinking population, while often good for traffic congestion and environmental quality, can be an indicator of a depressed or shrinking economy.
Definition The Forecasting Division of the Washington State Office of Financial Management (OFM) furnished King County population data.1 In the decades between official U.S. Census data (taken in 1970, 1980, and 1990), OFM’s data are used as official population estimates. Rolling three-year average growth rates illustrate variances in the pace of growth since 1970. Additional information was provided by the King County Department of Public Health and a report from Northwest Environment Watch entitled Misplaced Blame: The Real Roots of Population Growth.2&3
Interpretation In 1997, there were 1,646,200 people living in King County—an increase of 17,400 (1%) from 1996 and an 18% increase since 1987. During the past two decades, the county has experienced two rapid growth spurts: one between 1977 to 1982 in which county
population grew 2.5% and the second between 1987 and 1992 where it grew 2.3%. Since 1992, the county’s growth rate has been tapering off to its current level. The majority of recent population growth in King County has been the result of natural increases (birth rates surpassing death rates), with migration playing a lesser role.
Evaluation The recent slowing of King County’s population growth rate is encouraging. However, we must continue to explore strategies for managing urban sprawl and reducing our impact on the environment. What also remains difficult is pinpointing a sustainable level of human population for this region, especially as the population’s lifestyle puts a disproportionate amount of stress on the area’s natural resources. According to Northwest Environment Watch, United States residents comprise 5% of the world’s population, yet we consume one-third or more of the world’s paper, plastic, computers, and cars; use one-fourth of the world’s energy, copper and aluminum; and consume one-fifth of the world’s beef and one-sixth of the world’s grain and steel. The high consumption lifestyles of the affluent threaten the very thing that makes this region so attractive—its wealth of natural resources.
Linkages Even a slowly increasing population has implications for a region’s economic, social, cultural and environmental systems. Population growth and human behavior directly affect land-use patterns, air quality, ecological health, solid waste generated, water quality and availability, energy use, and other resource issues. Increasing numbers of people tax the ability of the government and industry to meet the basic needs of its citizens such as affordable housing, jobs, medical care, potable water, arable land for agriculture, and open space.
Population of King County
-
200
400
600
800
1,000
1,200
1,400
1,600
1,800
1970
1972
1974
1976
1978
1980
1982
1984
1986
1988
1990
1992
1994
1996
Popu
latio
n (1
,000
s)-2.00%
-1.00%
0.00%
1.00%
2.00%
3.00%
4.00%
5.00%
6.00%
7.00%
Cha
nge
Rat
e
Population Annual Change Rate
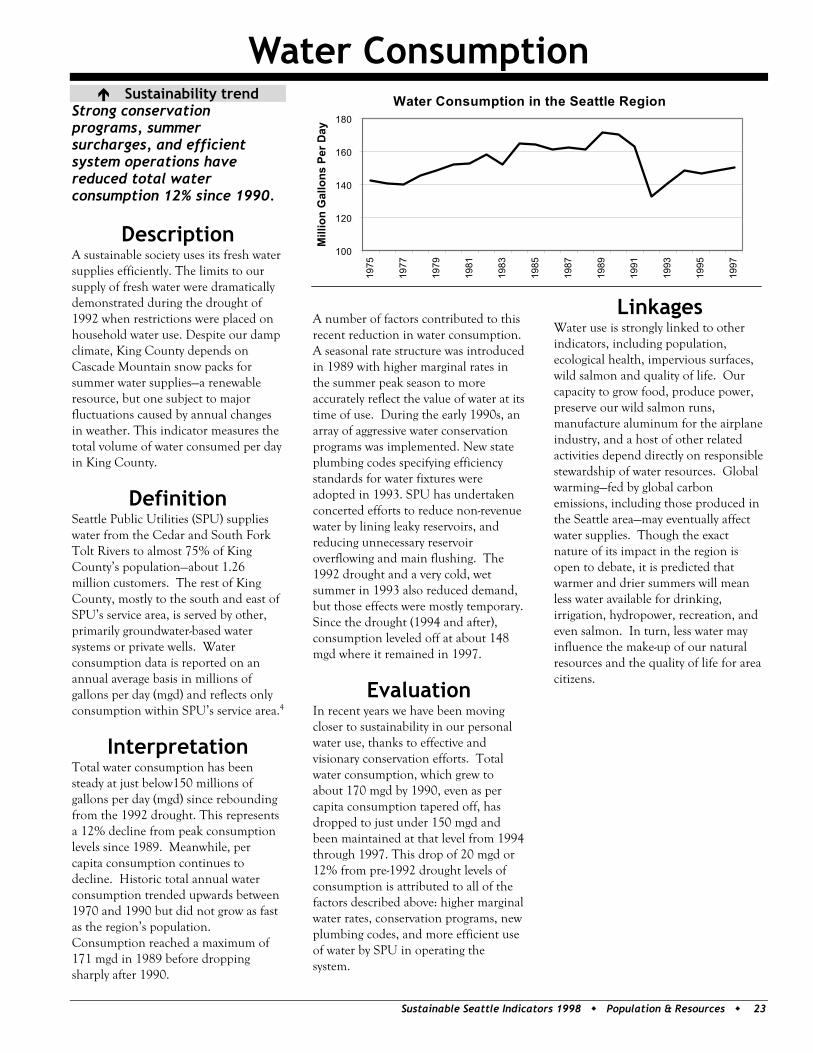
Water Consumption
Sustainable Seattle Indicators 1998 Population & Resources 23
Sustainability trend Strong conservation programs, summer surcharges, and efficient system operations have reduced total water consumption 12% since 1990.
Description A sustainable society uses its fresh water supplies efficiently. The limits to our supply of fresh water were dramatically demonstrated during the drought of 1992 when restrictions were placed on household water use. Despite our damp climate, King County depends on Cascade Mountain snow packs for summer water supplies—a renewable resource, but one subject to major fluctuations caused by annual changes in weather. This indicator measures the total volume of water consumed per day in King County.
Definition Seattle Public Utilities (SPU) supplies water from the Cedar and South Fork Tolt Rivers to almost 75% of King County’s population—about 1.26 million customers. The rest of King County, mostly to the south and east of SPU’s service area, is served by other, primarily groundwater-based water systems or private wells. Water consumption data is reported on an annual average basis in millions of gallons per day (mgd) and reflects only consumption within SPU’s service area.4
Interpretation Total water consumption has been steady at just below150 millions of gallons per day (mgd) since rebounding from the 1992 drought. This represents a 12% decline from peak consumption levels since 1989. Meanwhile, per capita consumption continues to decline. Historic total annual water consumption trended upwards between 1970 and 1990 but did not grow as fast as the region’s population. Consumption reached a maximum of 171 mgd in 1989 before dropping sharply after 1990.
A number of factors contributed to this recent reduction in water consumption. A seasonal rate structure was introduced in 1989 with higher marginal rates in the summer peak season to more accurately reflect the value of water at its time of use. During the early 1990s, an array of aggressive water conservation programs was implemented. New state plumbing codes specifying efficiency standards for water fixtures were adopted in 1993. SPU has undertaken concerted efforts to reduce non-revenue water by lining leaky reservoirs, and reducing unnecessary reservoir overflowing and main flushing. The 1992 drought and a very cold, wet summer in 1993 also reduced demand, but those effects were mostly temporary. Since the drought (1994 and after), consumption leveled off at about 148 mgd where it remained in 1997.
Evaluation In recent years we have been moving closer to sustainability in our personal water use, thanks to effective and visionary conservation efforts. Total water consumption, which grew to about 170 mgd by 1990, even as per capita consumption tapered off, has dropped to just under 150 mgd and been maintained at that level from 1994 through 1997. This drop of 20 mgd or 12% from pre-1992 drought levels of consumption is attributed to all of the factors described above: higher marginal water rates, conservation programs, new plumbing codes, and more efficient use of water by SPU in operating the system.
Linkages Water use is strongly linked to other indicators, including population, ecological health, impervious surfaces, wild salmon and quality of life. Our capacity to grow food, produce power, preserve our wild salmon runs, manufacture aluminum for the airplane industry, and a host of other related activities depend directly on responsible stewardship of water resources. Global warming—fed by global carbon emissions, including those produced in the Seattle area—may eventually affect water supplies. Though the exact nature of its impact in the region is open to debate, it is predicted that warmer and drier summers will mean less water available for drinking, irrigation, hydropower, recreation, and even salmon. In turn, less water may influence the make-up of our natural resources and the quality of life for area citizens.
Water Consumption in the Seattle Region
100
120
140
160
180
1975
1977
1979
1981
1983
1985
1987
1989
1991
1993
1995
1997
Mill
ion
Gal
lons
Per
Day
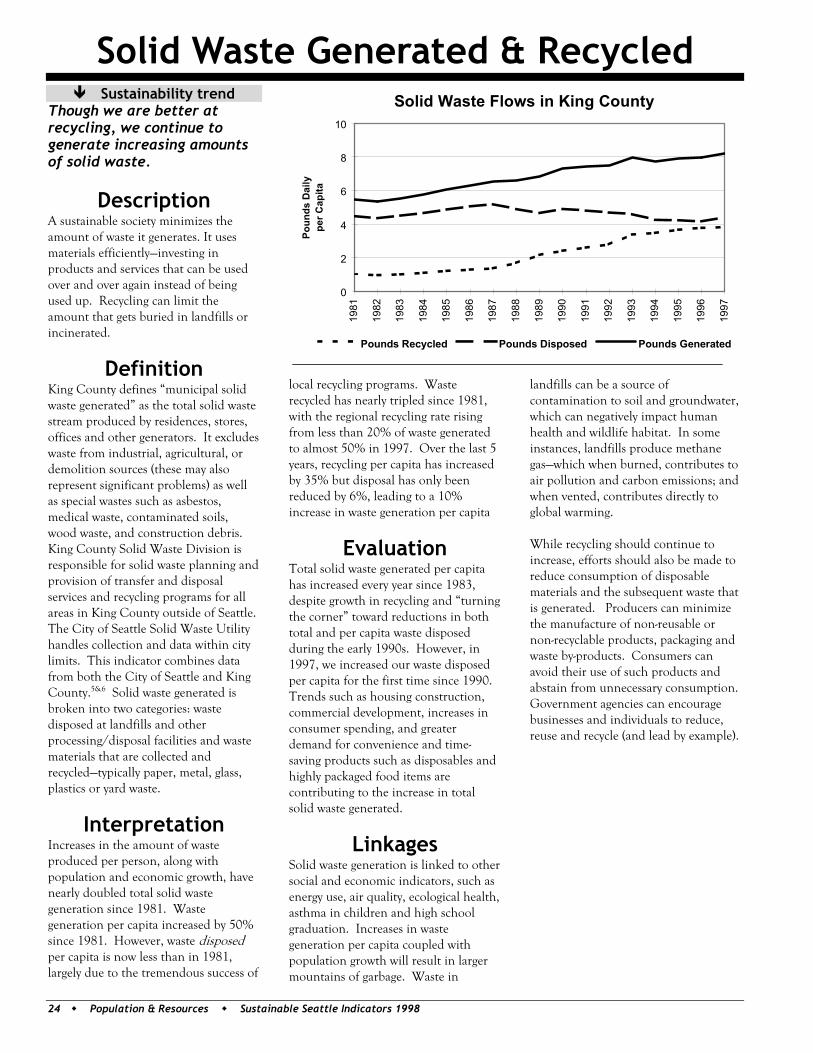
Solid Waste Generated & Recycled
24 Population & Resources Sustainable Seattle Indicators 1998
Sustainability trend Though we are better at recycling, we continue to generate increasing amounts of solid waste.
Description A sustainable society minimizes the amount of waste it generates. It uses materials efficiently—investing in products and services that can be used over and over again instead of being used up. Recycling can limit the amount that gets buried in landfills or incinerated.
Definition King County defines “municipal solid waste generated” as the total solid waste stream produced by residences, stores, offices and other generators. It excludes waste from industrial, agricultural, or demolition sources (these may also represent significant problems) as well as special wastes such as asbestos, medical waste, contaminated soils, wood waste, and construction debris. King County Solid Waste Division is responsible for solid waste planning and provision of transfer and disposal services and recycling programs for all areas in King County outside of Seattle. The City of Seattle Solid Waste Utility handles collection and data within city limits. This indicator combines data from both the City of Seattle and King County.5&6 Solid waste generated is broken into two categories: waste disposed at landfills and other processing/disposal facilities and waste materials that are collected and recycled—typically paper, metal, glass, plastics or yard waste.
Interpretation Increases in the amount of waste produced per person, along with population and economic growth, have nearly doubled total solid waste generation since 1981. Waste generation per capita increased by 50% since 1981. However, waste disposed per capita is now less than in 1981, largely due to the tremendous success of
local recycling programs. Waste recycled has nearly tripled since 1981, with the regional recycling rate rising from less than 20% of waste generated to almost 50% in 1997. Over the last 5 years, recycling per capita has increased by 35% but disposal has only been reduced by 6%, leading to a 10% increase in waste generation per capita
Evaluation Total solid waste generated per capita has increased every year since 1983, despite growth in recycling and “turning the corner” toward reductions in both total and per capita waste disposed during the early 1990s. However, in 1997, we increased our waste disposed per capita for the first time since 1990. Trends such as housing construction, commercial development, increases in consumer spending, and greater demand for convenience and time-saving products such as disposables and highly packaged food items are contributing to the increase in total solid waste generated.
Linkages Solid waste generation is linked to other social and economic indicators, such as energy use, air quality, ecological health, asthma in children and high school graduation. Increases in waste generation per capita coupled with population growth will result in larger mountains of garbage. Waste in
landfills can be a source of contamination to soil and groundwater, which can negatively impact human health and wildlife habitat. In some instances, landfills produce methane gas—which when burned, contributes to air pollution and carbon emissions; and when vented, contributes directly to global warming. While recycling should continue to increase, efforts should also be made to reduce consumption of disposable materials and the subsequent waste that is generated. Producers can minimize the manufacture of non-reusable or non-recyclable products, packaging and waste by-products. Consumers can avoid their use of such products and abstain from unnecessary consumption. Government agencies can encourage businesses and individuals to reduce, reuse and recycle (and lead by example).
Solid Waste Flows in King County
0
2
4
6
8
10
1981
1982
1983
1984
1985
1986
1987
1988
1989
1990
1991
1992
1993
1994
1995
1996
1997
Poun
ds D
aily
pe
r Cap
ita
Pounds Recycled Pounds Disposed Pounds Generated
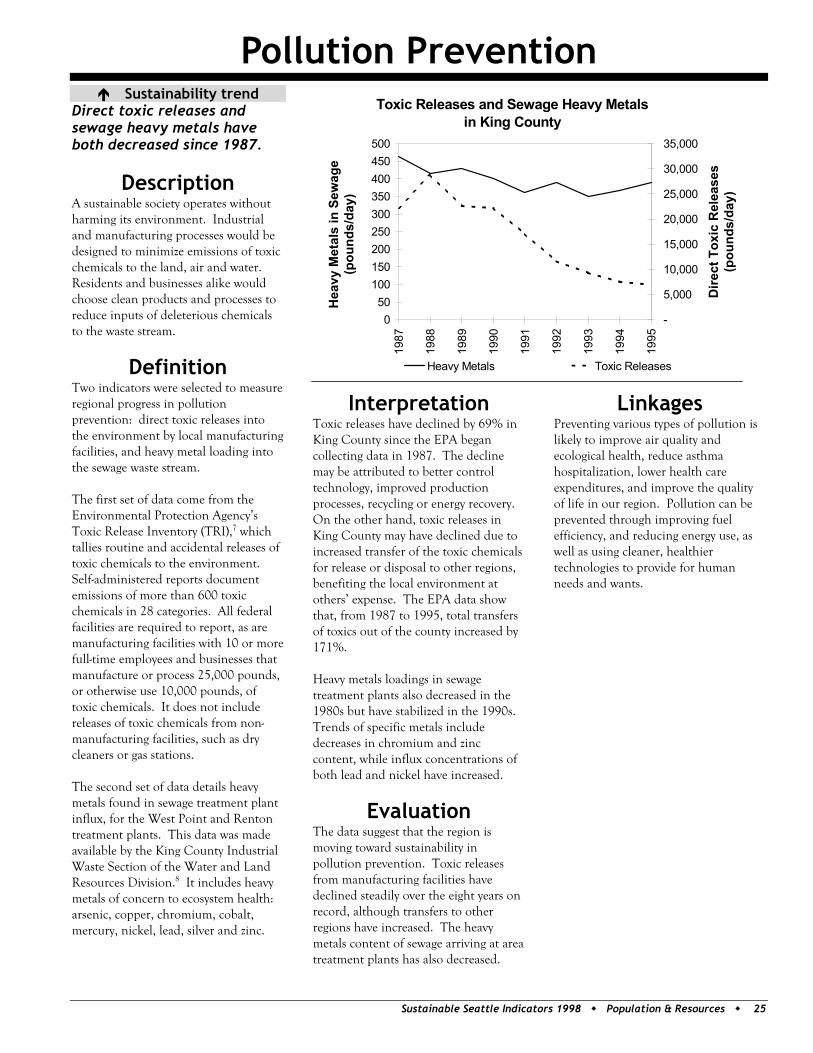
Pollution Prevention
Sustainable Seattle Indicators 1998 Population & Resources 25
Sustainability trend Direct toxic releases and sewage heavy metals have both decreased since 1987.
Description A sustainable society operates without harming its environment. Industrial and manufacturing processes would be designed to minimize emissions of toxic chemicals to the land, air and water. Residents and businesses alike would choose clean products and processes to reduce inputs of deleterious chemicals to the waste stream.
Definition Two indicators were selected to measure regional progress in pollution prevention: direct toxic releases into the environment by local manufacturing facilities, and heavy metal loading into the sewage waste stream. The first set of data come from the Environmental Protection Agency’s Toxic Release Inventory (TRI),7 which tallies routine and accidental releases of toxic chemicals to the environment. Self-administered reports document emissions of more than 600 toxic chemicals in 28 categories. All federal facilities are required to report, as are manufacturing facilities with 10 or more full-time employees and businesses that manufacture or process 25,000 pounds, or otherwise use 10,000 pounds, of toxic chemicals. It does not include releases of toxic chemicals from non-manufacturing facilities, such as dry cleaners or gas stations. The second set of data details heavy metals found in sewage treatment plant influx, for the West Point and Renton treatment plants. This data was made available by the King County Industrial Waste Section of the Water and Land Resources Division.8 It includes heavy metals of concern to ecosystem health: arsenic, copper, chromium, cobalt, mercury, nickel, lead, silver and zinc.
Interpretation Toxic releases have declined by 69% in King County since the EPA began collecting data in 1987. The decline may be attributed to better control technology, improved production processes, recycling or energy recovery. On the other hand, toxic releases in King County may have declined due to increased transfer of the toxic chemicals for release or disposal to other regions, benefiting the local environment at others’ expense. The EPA data show that, from 1987 to 1995, total transfers of toxics out of the county increased by 171%. Heavy metals loadings in sewage treatment plants also decreased in the 1980s but have stabilized in the 1990s. Trends of specific metals include decreases in chromium and zinc content, while influx concentrations of both lead and nickel have increased.
Evaluation The data suggest that the region is moving toward sustainability in pollution prevention. Toxic releases from manufacturing facilities have declined steadily over the eight years on record, although transfers to other regions have increased. The heavy metals content of sewage arriving at area treatment plants has also decreased.
Linkages Preventing various types of pollution is likely to improve air quality and ecological health, reduce asthma hospitalization, lower health care expenditures, and improve the quality of life in our region. Pollution can be prevented through improving fuel efficiency, and reducing energy use, as well as using cleaner, healthier technologies to provide for human needs and wants.
Toxic Releases and Sewage Heavy Metals in King County
050
100150200250300350400450500
1987
1988
1989
1990
1991
1992
1993
1994
1995
Hea
vy M
etal
s in
Sew
age
(pou
nds/
day)
-
5,000
10,000
15,000
20,000
25,000
30,000
35,000
Dire
ct T
oxic
Rel
ease
s (p
ound
s/da
y)
Heavy Metals Toxic Releases
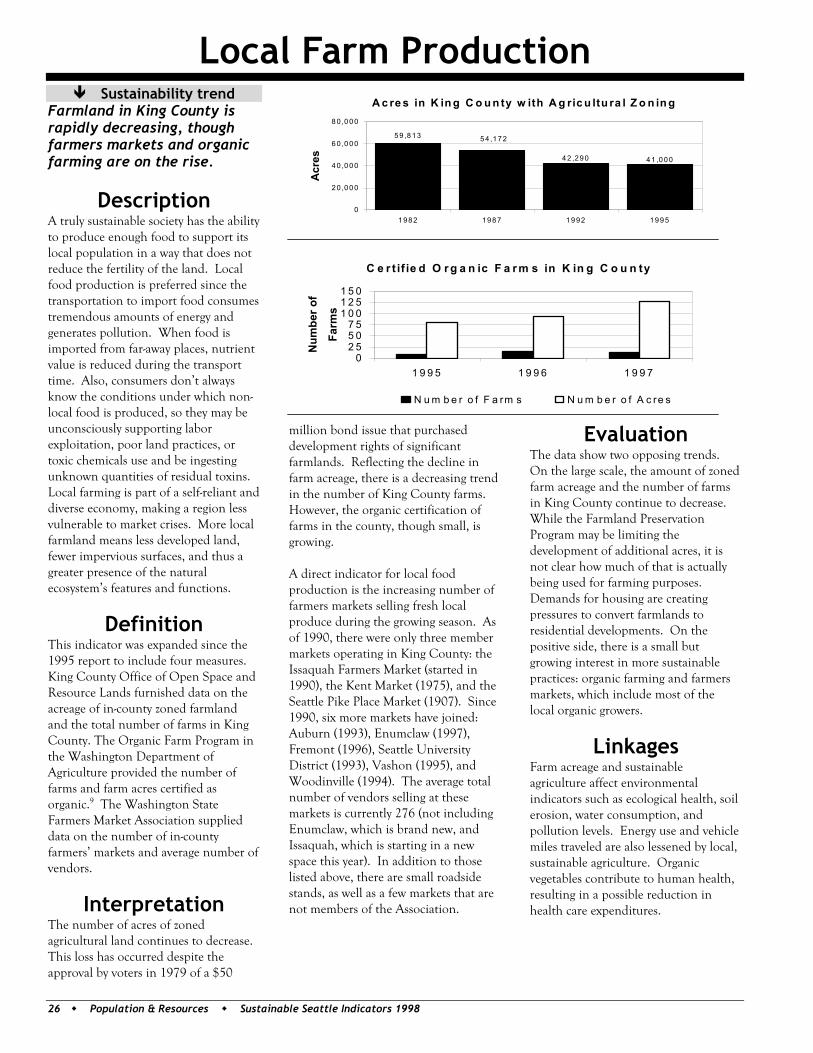
Local Farm Production
26 Population & Resources Sustainable Seattle Indicators 1998
Sustainability trend Farmland in King County is rapidly decreasing, though farmers markets and organic farming are on the rise.
Description A truly sustainable society has the ability to produce enough food to support its local population in a way that does not reduce the fertility of the land. Local food production is preferred since the transportation to import food consumes tremendous amounts of energy and generates pollution. When food is imported from far-away places, nutrient value is reduced during the transport time. Also, consumers don’t always know the conditions under which non-local food is produced, so they may be unconsciously supporting labor exploitation, poor land practices, or toxic chemicals use and be ingesting unknown quantities of residual toxins. Local farming is part of a self-reliant and diverse economy, making a region less vulnerable to market crises. More local farmland means less developed land, fewer impervious surfaces, and thus a greater presence of the natural ecosystem’s features and functions.
Definition This indicator was expanded since the 1995 report to include four measures. King County Office of Open Space and Resource Lands furnished data on the acreage of in-county zoned farmland and the total number of farms in King County. The Organic Farm Program in the Washington Department of Agriculture provided the number of farms and farm acres certified as organic.9 The Washington State Farmers Market Association supplied data on the number of in-county farmers’ markets and average number of vendors.
Interpretation The number of acres of zoned agricultural land continues to decrease. This loss has occurred despite the approval by voters in 1979 of a $50
million bond issue that purchased development rights of significant farmlands. Reflecting the decline in farm acreage, there is a decreasing trend in the number of King County farms. However, the organic certification of farms in the county, though small, is growing. A direct indicator for local food production is the increasing number of farmers markets selling fresh local produce during the growing season. As of 1990, there were only three member markets operating in King County: the Issaquah Farmers Market (started in 1990), the Kent Market (1975), and the Seattle Pike Place Market (1907). Since 1990, six more markets have joined: Auburn (1993), Enumclaw (1997), Fremont (1996), Seattle University District (1993), Vashon (1995), and Woodinville (1994). The average total number of vendors selling at these markets is currently 276 (not including Enumclaw, which is brand new, and Issaquah, which is starting in a new space this year). In addition to those listed above, there are small roadside stands, as well as a few markets that are not members of the Association.
Evaluation The data show two opposing trends. On the large scale, the amount of zoned farm acreage and the number of farms in King County continue to decrease. While the Farmland Preservation Program may be limiting the development of additional acres, it is not clear how much of that is actually being used for farming purposes. Demands for housing are creating pressures to convert farmlands to residential developments. On the positive side, there is a small but growing interest in more sustainable practices: organic farming and farmers markets, which include most of the local organic growers.
Linkages Farm acreage and sustainable agriculture affect environmental indicators such as ecological health, soil erosion, water consumption, and pollution levels. Energy use and vehicle miles traveled are also lessened by local, sustainable agriculture. Organic vegetables contribute to human health, resulting in a possible reduction in health care expenditures.
A c re s in K in g C o u n ty w ith A g ric u ltu ra l Z o n in g
54 ,172
41 ,00042 ,290
59 ,813
0
20 ,000
40 ,000
60 ,000
80 ,000
1982 1987 1992 1995
Acr
es
C e r t if ie d O r g a n ic F a r m s in K in g C o u n ty
02 55 07 5
1 0 01 2 51 5 0
1 9 9 5 1 9 9 6 1 9 9 7
Num
ber o
f
Farm
s
N u m b e r o f F a rm s N u m b e r o f A c re s
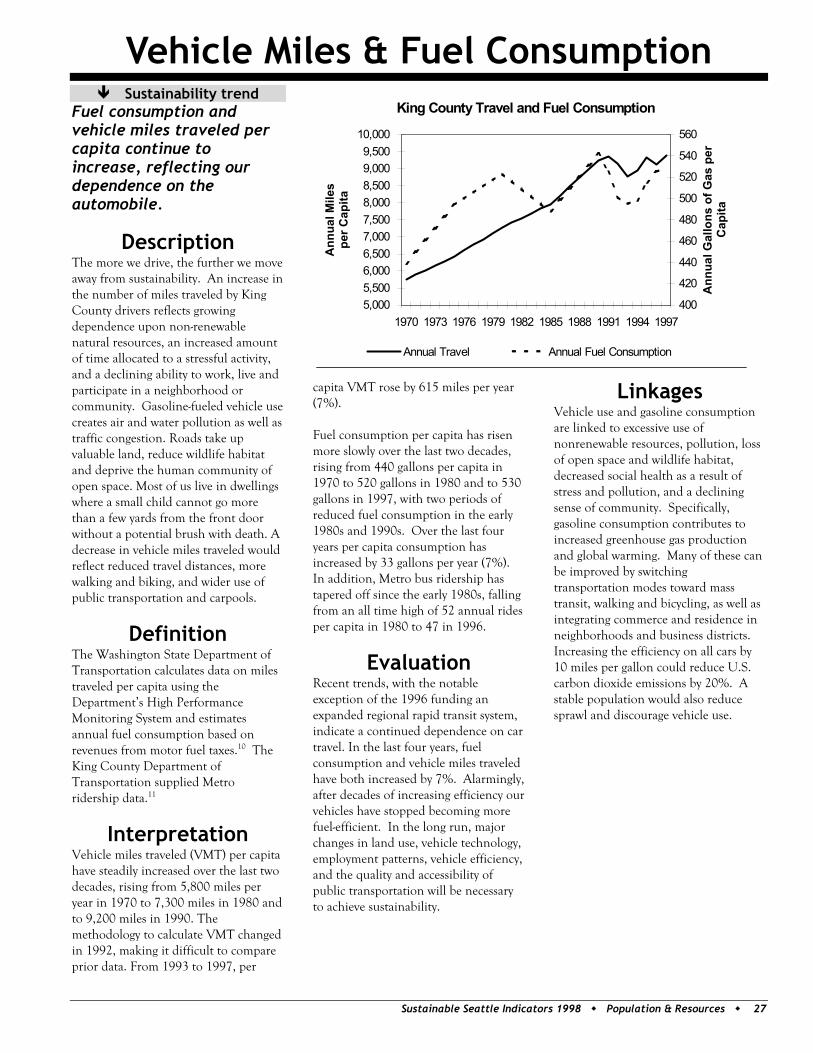
Vehicle Miles & Fuel Consumption
Sustainable Seattle Indicators 1998 Population & Resources 27
Sustainability trend Fuel consumption and vehicle miles traveled per capita continue to increase, reflecting our dependence on the automobile.
Description The more we drive, the further we move away from sustainability. An increase in the number of miles traveled by King County drivers reflects growing dependence upon non-renewable natural resources, an increased amount of time allocated to a stressful activity, and a declining ability to work, live and participate in a neighborhood or community. Gasoline-fueled vehicle use creates air and water pollution as well as traffic congestion. Roads take up valuable land, reduce wildlife habitat and deprive the human community of open space. Most of us live in dwellings where a small child cannot go more than a few yards from the front door without a potential brush with death. A decrease in vehicle miles traveled would reflect reduced travel distances, more walking and biking, and wider use of public transportation and carpools.
Definition The Washington State Department of Transportation calculates data on miles traveled per capita using the Department’s High Performance Monitoring System and estimates annual fuel consumption based on revenues from motor fuel taxes.10 The King County Department of Transportation supplied Metro ridership data.11
Interpretation Vehicle miles traveled (VMT) per capita have steadily increased over the last two decades, rising from 5,800 miles per year in 1970 to 7,300 miles in 1980 and to 9,200 miles in 1990. The methodology to calculate VMT changed in 1992, making it difficult to compare prior data. From 1993 to 1997, per
capita VMT rose by 615 miles per year (7%). Fuel consumption per capita has risen more slowly over the last two decades, rising from 440 gallons per capita in 1970 to 520 gallons in 1980 and to 530 gallons in 1997, with two periods of reduced fuel consumption in the early 1980s and 1990s. Over the last four years per capita consumption has increased by 33 gallons per year (7%). In addition, Metro bus ridership has tapered off since the early 1980s, falling from an all time high of 52 annual rides per capita in 1980 to 47 in 1996.
Evaluation Recent trends, with the notable exception of the 1996 funding an expanded regional rapid transit system, indicate a continued dependence on car travel. In the last four years, fuel consumption and vehicle miles traveled have both increased by 7%. Alarmingly, after decades of increasing efficiency our vehicles have stopped becoming more fuel-efficient. In the long run, major changes in land use, vehicle technology, employment patterns, vehicle efficiency, and the quality and accessibility of public transportation will be necessary to achieve sustainability.
Linkages Vehicle use and gasoline consumption are linked to excessive use of nonrenewable resources, pollution, loss of open space and wildlife habitat, decreased social health as a result of stress and pollution, and a declining sense of community. Specifically, gasoline consumption contributes to increased greenhouse gas production and global warming. Many of these can be improved by switching transportation modes toward mass transit, walking and bicycling, as well as integrating commerce and residence in neighborhoods and business districts. Increasing the efficiency on all cars by 10 miles per gallon could reduce U.S. carbon dioxide emissions by 20%. A stable population would also reduce sprawl and discourage vehicle use.
King County Travel and Fuel Consumption
5,0005,5006,0006,5007,0007,5008,0008,5009,0009,500
10,000
1970 1973 1976 1979 1982 1985 1988 1991 1994 1997A
nnua
l Mile
s pe
r Cap
ita
400
420
440
460
480
500
520
540
560
Ann
ual G
allo
ns o
f Gas
per
C
apita
Annual Travel Annual Fuel Consumption
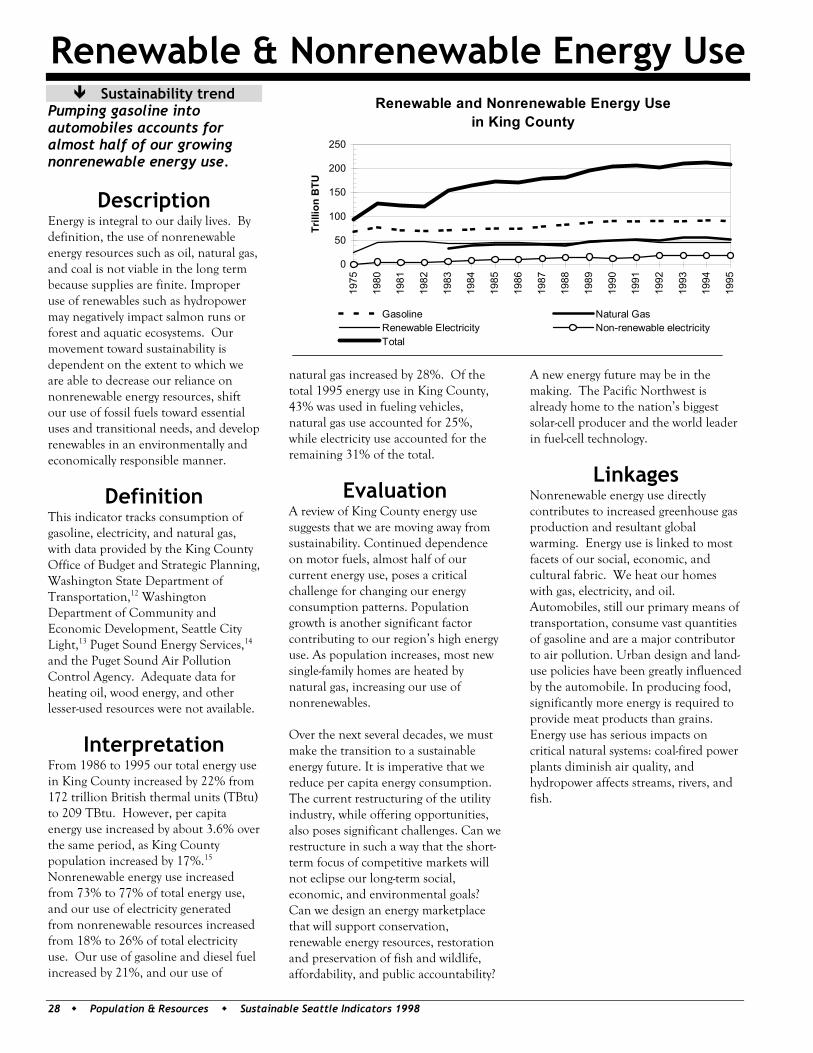
Renewable & Nonrenewable Energy Use
28 Population & Resources Sustainable Seattle Indicators 1998
Sustainability trend Pumping gasoline into automobiles accounts for almost half of our growing nonrenewable energy use.
Description Energy is integral to our daily lives. By definition, the use of nonrenewable energy resources such as oil, natural gas, and coal is not viable in the long term because supplies are finite. Improper use of renewables such as hydropower may negatively impact salmon runs or forest and aquatic ecosystems. Our movement toward sustainability is dependent on the extent to which we are able to decrease our reliance on nonrenewable energy resources, shift our use of fossil fuels toward essential uses and transitional needs, and develop renewables in an environmentally and economically responsible manner.
Definition This indicator tracks consumption of gasoline, electricity, and natural gas, with data provided by the King County Office of Budget and Strategic Planning, Washington State Department of Transportation,12 Washington Department of Community and Economic Development, Seattle City Light,13 Puget Sound Energy Services,14 and the Puget Sound Air Pollution Control Agency. Adequate data for heating oil, wood energy, and other lesser-used resources were not available.
Interpretation From 1986 to 1995 our total energy use in King County increased by 22% from 172 trillion British thermal units (TBtu) to 209 TBtu. However, per capita energy use increased by about 3.6% over the same period, as King County population increased by 17%.15 Nonrenewable energy use increased from 73% to 77% of total energy use, and our use of electricity generated from nonrenewable resources increased from 18% to 26% of total electricity use. Our use of gasoline and diesel fuel increased by 21%, and our use of
natural gas increased by 28%. Of the total 1995 energy use in King County, 43% was used in fueling vehicles, natural gas use accounted for 25%, while electricity use accounted for the remaining 31% of the total.
Evaluation A review of King County energy use suggests that we are moving away from sustainability. Continued dependence on motor fuels, almost half of our current energy use, poses a critical challenge for changing our energy consumption patterns. Population growth is another significant factor contributing to our region’s high energy use. As population increases, most new single-family homes are heated by natural gas, increasing our use of nonrenewables. Over the next several decades, we must make the transition to a sustainable energy future. It is imperative that we reduce per capita energy consumption. The current restructuring of the utility industry, while offering opportunities, also poses significant challenges. Can we restructure in such a way that the short-term focus of competitive markets will not eclipse our long-term social, economic, and environmental goals? Can we design an energy marketplace that will support conservation, renewable energy resources, restoration and preservation of fish and wildlife, affordability, and public accountability?
A new energy future may be in the making. The Pacific Northwest is already home to the nation’s biggest solar-cell producer and the world leader in fuel-cell technology.
Linkages Nonrenewable energy use directly contributes to increased greenhouse gas production and resultant global warming. Energy use is linked to most facets of our social, economic, and cultural fabric. We heat our homes with gas, electricity, and oil. Automobiles, still our primary means of transportation, consume vast quantities of gasoline and are a major contributor to air pollution. Urban design and land-use policies have been greatly influenced by the automobile. In producing food, significantly more energy is required to provide meat products than grains. Energy use has serious impacts on critical natural systems: coal-fired power plants diminish air quality, and hydropower affects streams, rivers, and fish.
Renewable and Nonrenewable Energy Usein King County
0
50
100
150
200
250
1975
1980
1981
1982
1983
1984
1985
1986
1987
1988
1989
1990
1991
1992
1993
1994
1995
Trill
ion
BTU
Gasoline Natural GasRenewable Electricity Non-renewable electricityTotal
Sustainable Seattle Indicators 1998 Population & Resources 29
Population & Resources Notes 1 Washington State Office of Financial Management, 1997 Population Trends, Table 3. Components of Population Change by County, 1990-97. (Olympia, WA: September 1997). 2 Seattle-King County Department of Public Health, 1995 Survey on Teen Pregnancy (Seattle, WA: November 1997). 3 Alan T. Durning and Christopher D. Crowther, Misplaced Blame: The Real Roots of Population Growth (Seattle, WA: Northwest Environmental Watch, July 1997). 4 Bruce Florey, Seattle Public Utilities, private communication, July and December 1997. 5 Bill Reed, King County Solid Waste Division, private communication, July 1997. 6 Lisa Perrin, Seattle Public Utilities, private communication, July 1997. 7 Environmental Protection Agency, United States Toxics Release Inventory, 1987-1995. Online at http://www.epa.gov/opptintr/tri/. 8 Heavy metal content of influx provided by the King County Industrial waste section of the Water and Land Resources Division. 9 Miles McAvoy, Organic Farm Program, Washington Department of Agriculture, private communication, May 1997. 10 Dan Falter, Washington State Department of Transportation, private communication, July and November 1997. 11 Teddi Reynolds, King County Department of Transportation, private communication, August 1997. 12 Washington State Department of Transportation, Gasoline use in 1997 – special tabulation, contact Dan Falter. 13 Seattle City Light, Electricity use - special tabulation, contact Labh Sachdev. 14 Puget Energy Services. Annual Reports (1983 to 1996), contact Karen Burrows. The percentage of renewable and non-renewable for years 1994 and 1995 was not available as of August 4, 1997. Placeholder values of .55 for renewable, .45 for non-renewable were used as approximations. This value is the average of the percentage splits for years 1988-1993. 15 Washington State Office of Financial Management, 1997 Population Trends, Table 3. Components of Population Change by County, 1990-97 (Olympia, WA: September 1997).

E c o n o m y
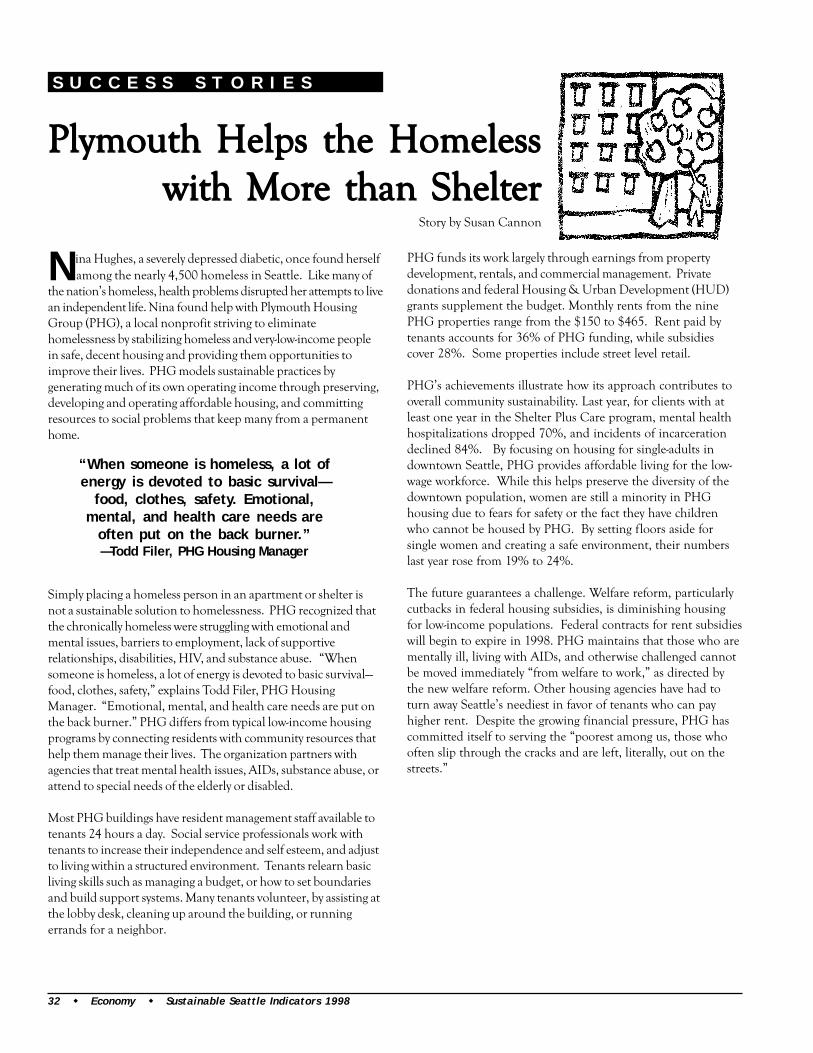
Nina Hughes, a severely depressed diabetic, once found herself among the nearly 4,500 homeless in Seattle. Like many of
the nation’s homeless, health problems disrupted her attempts to livean independent life. Nina found help with Plymouth HousingGroup (PHG), a local nonprofit striving to eliminatehomelessness by stabilizing homeless and very-low-income peoplein safe, decent housing and providing them opportunities toimprove their lives. PHG models sustainable practices bygenerating much of its own operating income through preserving,developing and operating affordable housing, and committingresources to social problems that keep many from a permanenthome.
Simply placing a homeless person in an apartment or shelter isnot a sustainable solution to homelessness. PHG recognized thatthe chronically homeless were struggling with emotional andmental issues, barriers to employment, lack of supportiverelationships, disabilities, HIV, and substance abuse. “Whensomeone is homeless, a lot of energy is devoted to basic survival—food, clothes, safety,” explains Todd Filer, PHG HousingManager. “Emotional, mental, and health care needs are put onthe back burner.” PHG differs from typical low-income housingprograms by connecting residents with community resources thathelp them manage their lives. The organization partners withagencies that treat mental health issues, AIDs, substance abuse, orattend to special needs of the elderly or disabled.
Most PHG buildings have resident management staff available totenants 24 hours a day. Social service professionals work withtenants to increase their independence and self esteem, and adjustto living within a structured environment. Tenants relearn basicliving skills such as managing a budget, or how to set boundariesand build support systems. Many tenants volunteer, by assisting atthe lobby desk, cleaning up around the building, or runningerrands for a neighbor.
PHG funds its work largely through earnings from propertydevelopment, rentals, and commercial management. Privatedonations and federal Housing & Urban Development (HUD)grants supplement the budget. Monthly rents from the ninePHG properties range from the $150 to $465. Rent paid bytenants accounts for 36% of PHG funding, while subsidiescover 28%. Some properties include street level retail.
PHG’s achievements illustrate how its approach contributes tooverall community sustainability. Last year, for clients with atleast one year in the Shelter Plus Care program, mental healthhospitalizations dropped 70%, and incidents of incarcerationdeclined 84%. By focusing on housing for single-adults indowntown Seattle, PHG provides affordable living for the low-wage workforce. While this helps preserve the diversity of thedowntown population, women are still a minority in PHGhousing due to fears for safety or the fact they have childrenwho cannot be housed by PHG. By setting floors aside forsingle women and creating a safe environment, their numberslast year rose from 19% to 24%.
The future guarantees a challenge. Welfare reform, particularlycutbacks in federal housing subsidies, is diminishing housingfor low-income populations. Federal contracts for rent subsidieswill begin to expire in 1998. PHG maintains that those who arementally ill, living with AIDs, and otherwise challenged cannotbe moved immediately “from welfare to work,” as directed bythe new welfare reform. Other housing agencies have had toturn away Seattle’s neediest in favor of tenants who can payhigher rent. Despite the growing financial pressure, PHG hascommitted itself to serving the “poorest among us, those whooften slip through the cracks and are left, literally, out on thestreets.”
“When someone is homeless, a lot ofenergy is devoted to basic survival—
food, clothes, safety. Emotional,mental, and health care needs are
often put on the back burner.”—Todd Filer, PHG Housing Manager
Plymouth Helps the HomelessPlymouth Helps the HomelessPlymouth Helps the HomelessPlymouth Helps the HomelessPlymouth Helps the Homelesswith Morwith Morwith Morwith Morwith More than Shelte than Shelte than Shelte than Shelte than Sheltererererer
Story by Susan Cannon
S U C C E S S S T O R I E S
32 Economy Sustainable Seattle Indicators 1998
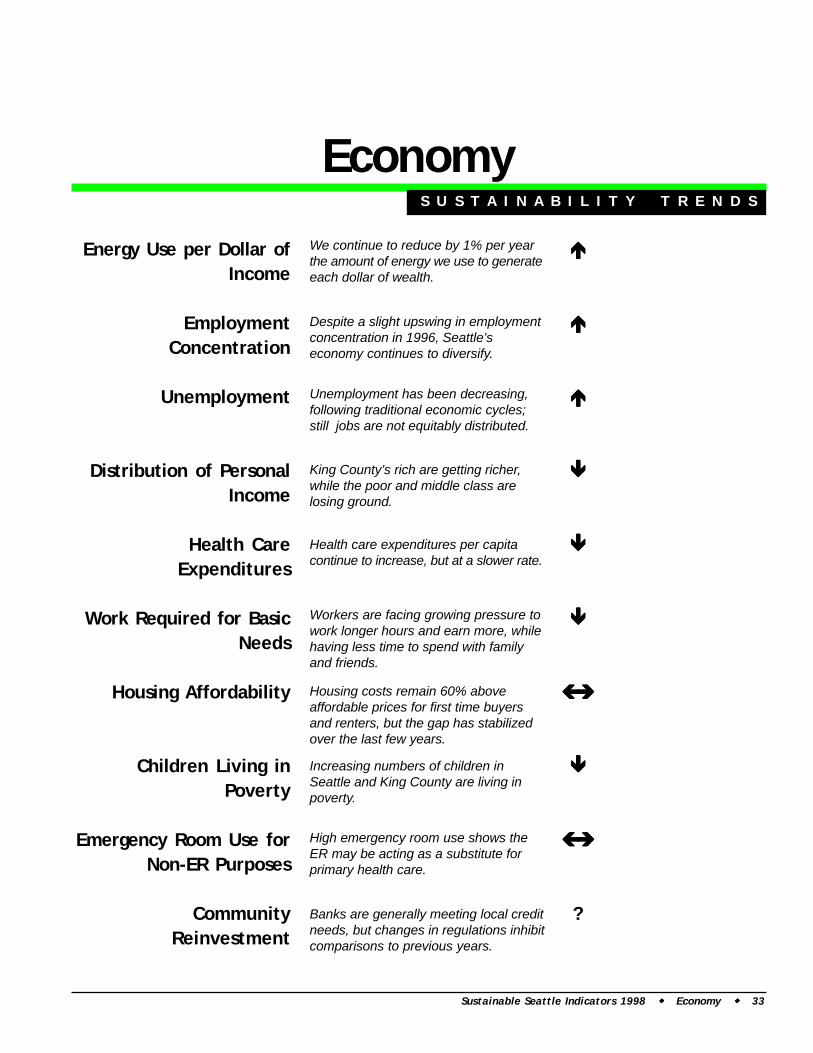
Economy
Energy Use per Dollar ofIncome
EmploymentConcentration
Unemployment
Distribution of PersonalIncome
Health CareExpenditures
Work Required for BasicNeeds
Housing Affordability
Children Living inPoverty
Emergency Room Use forNon-ER Purposes
CommunityReinvestment
?
S U S T A I N A B I L I T Y T R E N D S
We continue to reduce by 1% per yearthe amount of energy we use to generateeach dollar of wealth.
Despite a slight upswing in employmentconcentration in 1996, Seattle’seconomy continues to diversify.
Unemployment has been decreasing,following traditional economic cycles;still jobs are not equitably distributed.
King County’s rich are getting richer,while the poor and middle class arelosing ground.
Health care expenditures per capitacontinue to increase, but at a slower rate.
Banks are generally meeting local creditneeds, but changes in regulations inhibitcomparisons to previous years.
High emergency room use shows theER may be acting as a substitute forprimary health care.
Increasing numbers of children inSeattle and King County are living inpoverty.
Housing costs remain 60% aboveaffordable prices for first time buyersand renters, but the gap has stabilizedover the last few years.
Workers are facing growing pressure towork longer hours and earn more, whilehaving less time to spend with familyand friends.
Sustainable Seattle Indicators 1998 Economy 33
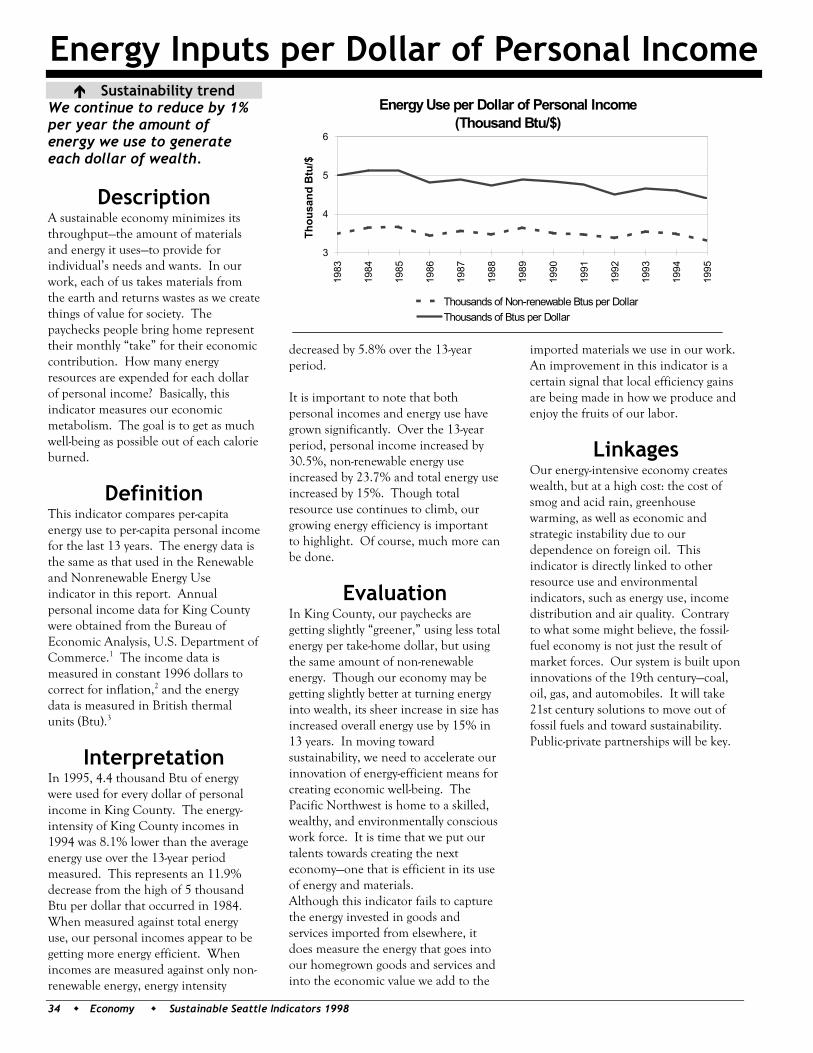
Energy Inputs per Dollar of Personal Income
34 Economy Sustainable Seattle Indicators 1998
Sustainability trend We continue to reduce by 1% per year the amount of energy we use to generate each dollar of wealth.
Description A sustainable economy minimizes its throughput—the amount of materials and energy it uses—to provide for individual’s needs and wants. In our work, each of us takes materials from the earth and returns wastes as we create things of value for society. The paychecks people bring home represent their monthly “take” for their economic contribution. How many energy resources are expended for each dollar of personal income? Basically, this indicator measures our economic metabolism. The goal is to get as much well-being as possible out of each calorie burned.
Definition This indicator compares per-capita energy use to per-capita personal income for the last 13 years. The energy data is the same as that used in the Renewable and Nonrenewable Energy Use indicator in this report. Annual personal income data for King County were obtained from the Bureau of Economic Analysis, U.S. Department of Commerce.1 The income data is measured in constant 1996 dollars to correct for inflation,2 and the energy data is measured in British thermal units (Btu).3
Interpretation In 1995, 4.4 thousand Btu of energy were used for every dollar of personal income in King County. The energy-intensity of King County incomes in 1994 was 8.1% lower than the average energy use over the 13-year period measured. This represents an 11.9% decrease from the high of 5 thousand Btu per dollar that occurred in 1984. When measured against total energy use, our personal incomes appear to be getting more energy efficient. When incomes are measured against only non-renewable energy, energy intensity
decreased by 5.8% over the 13-year period. It is important to note that both personal incomes and energy use have grown significantly. Over the 13-year period, personal income increased by 30.5%, non-renewable energy use increased by 23.7% and total energy use increased by 15%. Though total resource use continues to climb, our growing energy efficiency is important to highlight. Of course, much more can be done.
Evaluation In King County, our paychecks are getting slightly “greener,” using less total energy per take-home dollar, but using the same amount of non-renewable energy. Though our economy may be getting slightly better at turning energy into wealth, its sheer increase in size has increased overall energy use by 15% in 13 years. In moving toward sustainability, we need to accelerate our innovation of energy-efficient means for creating economic well-being. The Pacific Northwest is home to a skilled, wealthy, and environmentally conscious work force. It is time that we put our talents towards creating the next economy—one that is efficient in its use of energy and materials. Although this indicator fails to capture the energy invested in goods and services imported from elsewhere, it does measure the energy that goes into our homegrown goods and services and into the economic value we add to the
imported materials we use in our work. An improvement in this indicator is a certain signal that local efficiency gains are being made in how we produce and enjoy the fruits of our labor.
Linkages Our energy-intensive economy creates wealth, but at a high cost: the cost of smog and acid rain, greenhouse warming, as well as economic and strategic instability due to our dependence on foreign oil. This indicator is directly linked to other resource use and environmental indicators, such as energy use, income distribution and air quality. Contrary to what some might believe, the fossil-fuel economy is not just the result of market forces. Our system is built upon innovations of the 19th century—coal, oil, gas, and automobiles. It will take 21st century solutions to move out of fossil fuels and toward sustainability. Public-private partnerships will be key.
Energy Use per Dollar of Personal Income(Thousand Btu/$)
3
4
5
6
1983
1984
1985
1986
1987
1988
1989
1990
1991
1992
1993
1994
1995
Thou
sand
Btu
/$Thousands of Non-renewable Btus per DollarThousands of Btus per Dollar
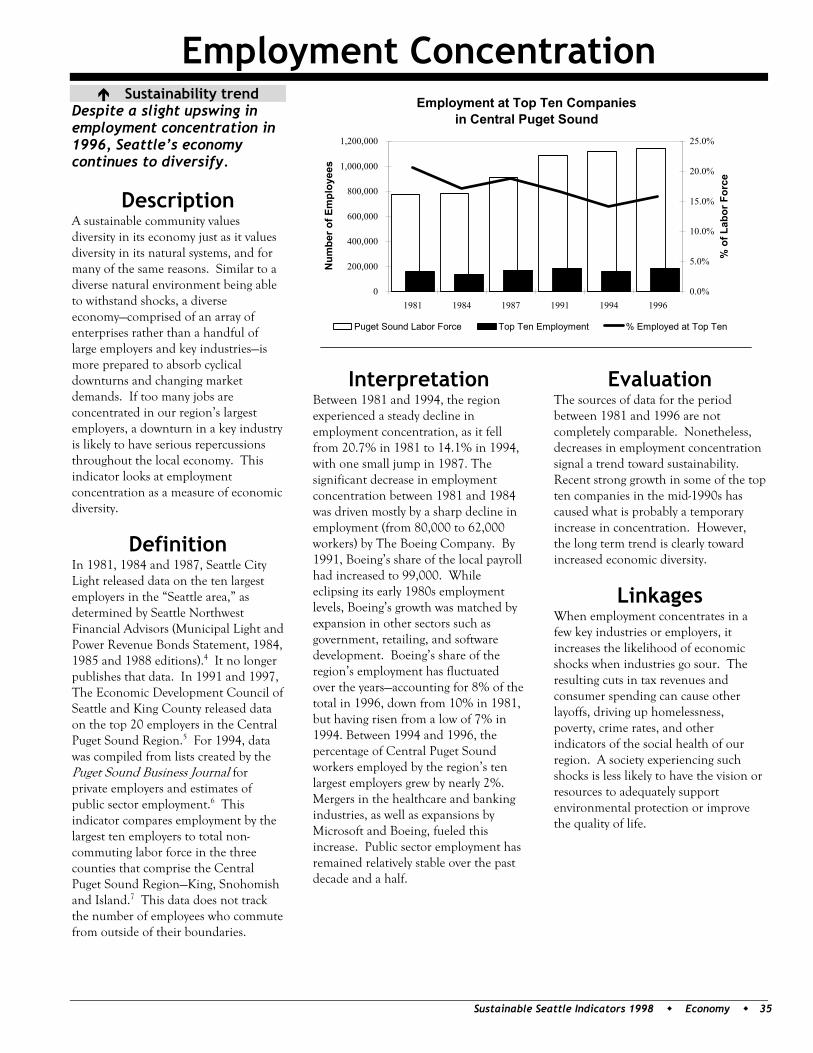
Employment Concentration
Sustainable Seattle Indicators 1998 Economy 35
Sustainability trend Despite a slight upswing in employment concentration in 1996, Seattle’s economy continues to diversify.
Description A sustainable community values diversity in its economy just as it values diversity in its natural systems, and for many of the same reasons. Similar to a diverse natural environment being able to withstand shocks, a diverse economy—comprised of an array of enterprises rather than a handful of large employers and key industries—is more prepared to absorb cyclical downturns and changing market demands. If too many jobs are concentrated in our region’s largest employers, a downturn in a key industry is likely to have serious repercussions throughout the local economy. This indicator looks at employment concentration as a measure of economic diversity.
Definition In 1981, 1984 and 1987, Seattle City Light released data on the ten largest employers in the “Seattle area,” as determined by Seattle Northwest Financial Advisors (Municipal Light and Power Revenue Bonds Statement, 1984, 1985 and 1988 editions).4 It no longer publishes that data. In 1991 and 1997, The Economic Development Council of Seattle and King County released data on the top 20 employers in the Central Puget Sound Region.5 For 1994, data was compiled from lists created by the Puget Sound Business Journal for private employers and estimates of public sector employment.6 This indicator compares employment by the largest ten employers to total non-commuting labor force in the three counties that comprise the Central Puget Sound Region—King, Snohomish and Island.7 This data does not track the number of employees who commute from outside of their boundaries.
Interpretation Between 1981 and 1994, the region experienced a steady decline in employment concentration, as it fell from 20.7% in 1981 to 14.1% in 1994, with one small jump in 1987. The significant decrease in employment concentration between 1981 and 1984 was driven mostly by a sharp decline in employment (from 80,000 to 62,000 workers) by The Boeing Company. By 1991, Boeing’s share of the local payroll had increased to 99,000. While eclipsing its early 1980s employment levels, Boeing’s growth was matched by expansion in other sectors such as government, retailing, and software development. Boeing’s share of the region’s employment has fluctuated over the years—accounting for 8% of the total in 1996, down from 10% in 1981, but having risen from a low of 7% in 1994. Between 1994 and 1996, the percentage of Central Puget Sound workers employed by the region’s ten largest employers grew by nearly 2%. Mergers in the healthcare and banking industries, as well as expansions by Microsoft and Boeing, fueled this increase. Public sector employment has remained relatively stable over the past decade and a half.
Evaluation The sources of data for the period between 1981 and 1996 are not completely comparable. Nonetheless, decreases in employment concentration signal a trend toward sustainability. Recent strong growth in some of the top ten companies in the mid-1990s has caused what is probably a temporary increase in concentration. However, the long term trend is clearly toward increased economic diversity.
Linkages When employment concentrates in a few key industries or employers, it increases the likelihood of economic shocks when industries go sour. The resulting cuts in tax revenues and consumer spending can cause other layoffs, driving up homelessness, poverty, crime rates, and other indicators of the social health of our region. A society experiencing such shocks is less likely to have the vision or resources to adequately support environmental protection or improve the quality of life.
Employment at Top Ten Companies in Central Puget Sound
0
200,000
400,000
600,000
800,000
1,000,000
1,200,000
1981 1984 1987 1991 1994 1996
Num
ber o
f Em
ploy
ees
0.0%
5.0%
10.0%
15.0%
20.0%
25.0%
% o
f Lab
or F
orce
Puget Sound Labor Force Top Ten Employment % Employed at Top Ten
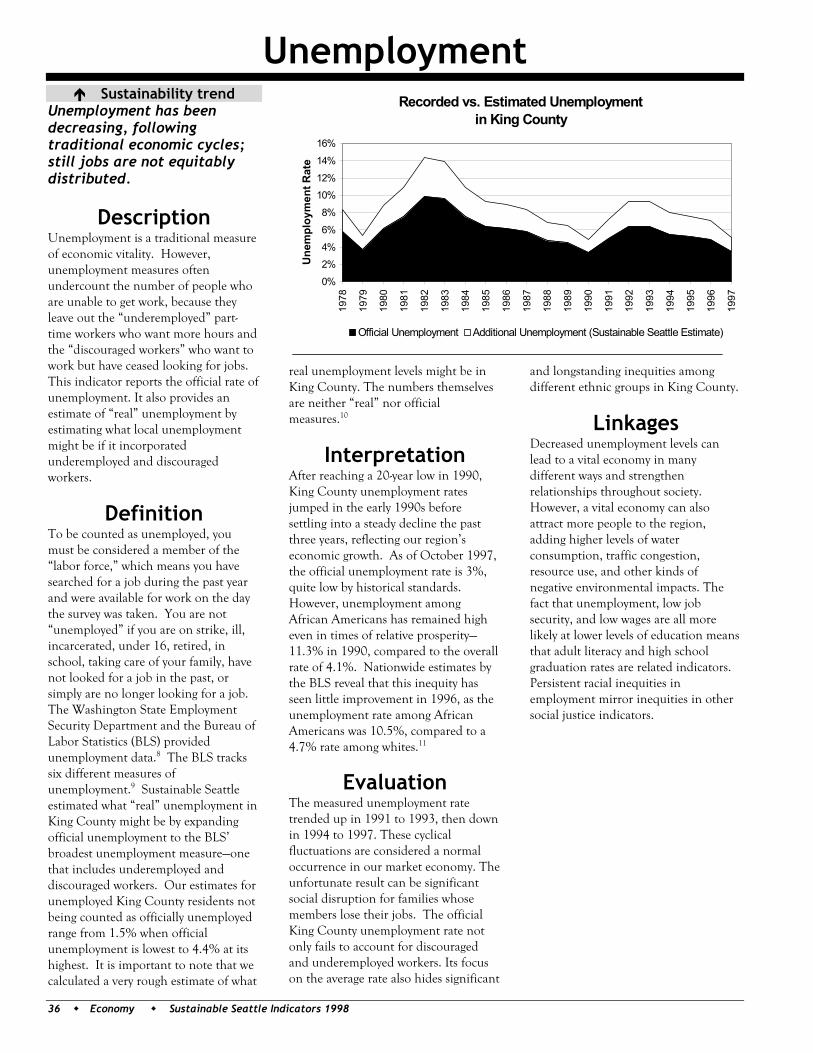
Unemployment
36 Economy Sustainable Seattle Indicators 1998
Sustainability trend Unemployment has been decreasing, following traditional economic cycles; still jobs are not equitably distributed.
Description Unemployment is a traditional measure of economic vitality. However, unemployment measures often undercount the number of people who are unable to get work, because they leave out the “underemployed” part-time workers who want more hours and the “discouraged workers” who want to work but have ceased looking for jobs. This indicator reports the official rate of unemployment. It also provides an estimate of “real” unemployment by estimating what local unemployment might be if it incorporated underemployed and discouraged workers.
Definition To be counted as unemployed, you must be considered a member of the “labor force,” which means you have searched for a job during the past year and were available for work on the day the survey was taken. You are not “unemployed” if you are on strike, ill, incarcerated, under 16, retired, in school, taking care of your family, have not looked for a job in the past, or simply are no longer looking for a job. The Washington State Employment Security Department and the Bureau of Labor Statistics (BLS) provided unemployment data.8 The BLS tracks six different measures of unemployment.9 Sustainable Seattle estimated what “real” unemployment in King County might be by expanding official unemployment to the BLS’ broadest unemployment measure—one that includes underemployed and discouraged workers. Our estimates for unemployed King County residents not being counted as officially unemployed range from 1.5% when official unemployment is lowest to 4.4% at its highest. It is important to note that we calculated a very rough estimate of what
real unemployment levels might be in King County. The numbers themselves are neither “real” nor official measures.10
Interpretation After reaching a 20-year low in 1990, King County unemployment rates jumped in the early 1990s before settling into a steady decline the past three years, reflecting our region’s economic growth. As of October 1997, the official unemployment rate is 3%, quite low by historical standards. However, unemployment among African Americans has remained high even in times of relative prosperity—11.3% in 1990, compared to the overall rate of 4.1%. Nationwide estimates by the BLS reveal that this inequity has seen little improvement in 1996, as the unemployment rate among African Americans was 10.5%, compared to a 4.7% rate among whites.11
Evaluation The measured unemployment rate trended up in 1991 to 1993, then down in 1994 to 1997. These cyclical fluctuations are considered a normal occurrence in our market economy. The unfortunate result can be significant social disruption for families whose members lose their jobs. The official King County unemployment rate not only fails to account for discouraged and underemployed workers. Its focus on the average rate also hides significant
and longstanding inequities among different ethnic groups in King County.
Linkages Decreased unemployment levels can lead to a vital economy in many different ways and strengthen relationships throughout society. However, a vital economy can also attract more people to the region, adding higher levels of water consumption, traffic congestion, resource use, and other kinds of negative environmental impacts. The fact that unemployment, low job security, and low wages are all more likely at lower levels of education means that adult literacy and high school graduation rates are related indicators. Persistent racial inequities in employment mirror inequities in other social justice indicators.
Recorded vs. Estimated Unemployment in King County
0%
2%
4%
6%
8%
10%
12%
14%
16%
1978
1979
1980
1981
1982
1983
1984
1985
1986
1987
1988
1989
1990
1991
1992
1993
1994
1995
1996
1997
Une
mpl
oym
ent R
ate
Official Unemployment Additional Unemployment (Sustainable Seattle Estimate)
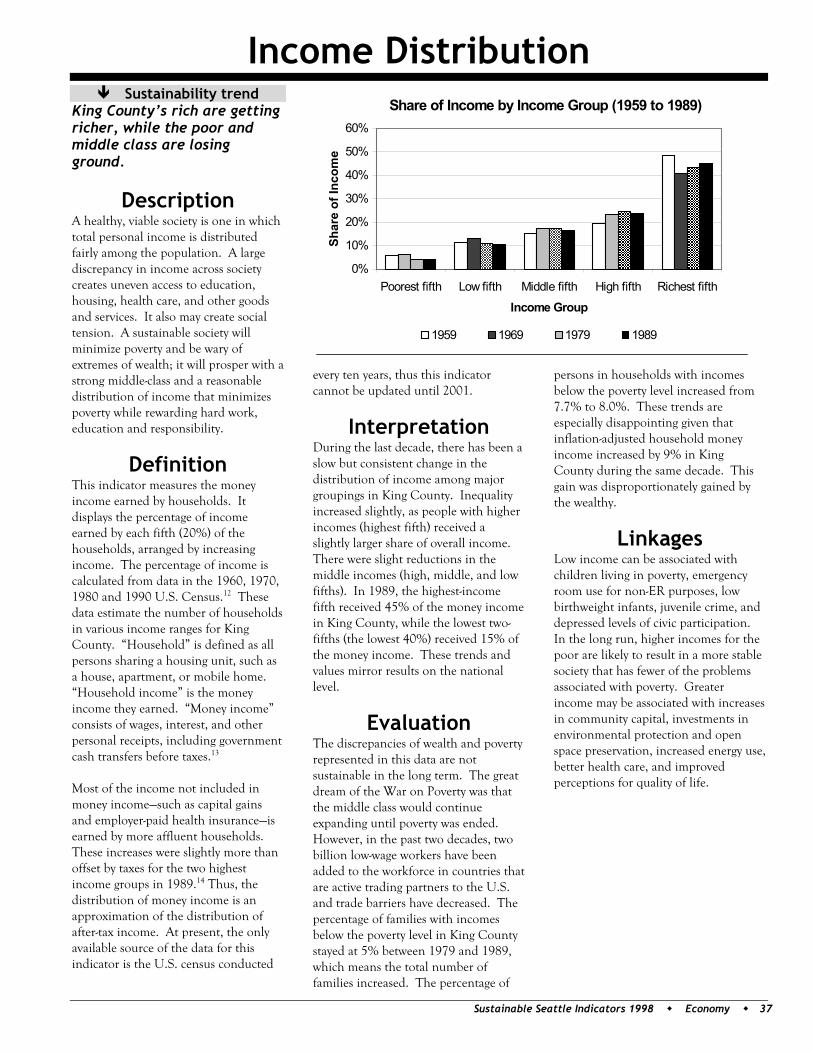
Income Distribution
Sustainable Seattle Indicators 1998 Economy 37
Sustainability trend King County’s rich are getting richer, while the poor and middle class are losing ground.
Description A healthy, viable society is one in which total personal income is distributed fairly among the population. A large discrepancy in income across society creates uneven access to education, housing, health care, and other goods and services. It also may create social tension. A sustainable society will minimize poverty and be wary of extremes of wealth; it will prosper with a strong middle-class and a reasonable distribution of income that minimizes poverty while rewarding hard work, education and responsibility.
Definition This indicator measures the money income earned by households. It displays the percentage of income earned by each fifth (20%) of the households, arranged by increasing income. The percentage of income is calculated from data in the 1960, 1970, 1980 and 1990 U.S. Census.12 These data estimate the number of households in various income ranges for King County. “Household” is defined as all persons sharing a housing unit, such as a house, apartment, or mobile home. “Household income” is the money income they earned. “Money income” consists of wages, interest, and other personal receipts, including government cash transfers before taxes.13 Most of the income not included in money income—such as capital gains and employer-paid health insurance—is earned by more affluent households. These increases were slightly more than offset by taxes for the two highest income groups in 1989.14 Thus, the distribution of money income is an approximation of the distribution of after-tax income. At present, the only available source of the data for this indicator is the U.S. census conducted
every ten years, thus this indicator cannot be updated until 2001.
Interpretation During the last decade, there has been a slow but consistent change in the distribution of income among major groupings in King County. Inequality increased slightly, as people with higher incomes (highest fifth) received a slightly larger share of overall income. There were slight reductions in the middle incomes (high, middle, and low fifths). In 1989, the highest-income fifth received 45% of the money income in King County, while the lowest two-fifths (the lowest 40%) received 15% of the money income. These trends and values mirror results on the national level.
Evaluation The discrepancies of wealth and poverty represented in this data are not sustainable in the long term. The great dream of the War on Poverty was that the middle class would continue expanding until poverty was ended. However, in the past two decades, two billion low-wage workers have been added to the workforce in countries that are active trading partners to the U.S. and trade barriers have decreased. The percentage of families with incomes below the poverty level in King County stayed at 5% between 1979 and 1989, which means the total number of families increased. The percentage of
persons in households with incomes below the poverty level increased from 7.7% to 8.0%. These trends are especially disappointing given that inflation-adjusted household money income increased by 9% in King County during the same decade. This gain was disproportionately gained by the wealthy.
Linkages Low income can be associated with children living in poverty, emergency room use for non-ER purposes, low birthweight infants, juvenile crime, and depressed levels of civic participation. In the long run, higher incomes for the poor are likely to result in a more stable society that has fewer of the problems associated with poverty. Greater income may be associated with increases in community capital, investments in environmental protection and open space preservation, increased energy use, better health care, and improved perceptions for quality of life.
Share of Income by Income Group (1959 to 1989)
0%
10%
20%
30%
40%
50%
60%
Poorest fifth Low fifth Middle fifth High fifth Richest fifth
Income Group
Shar
e of
Inco
me
1959 1969 1979 1989
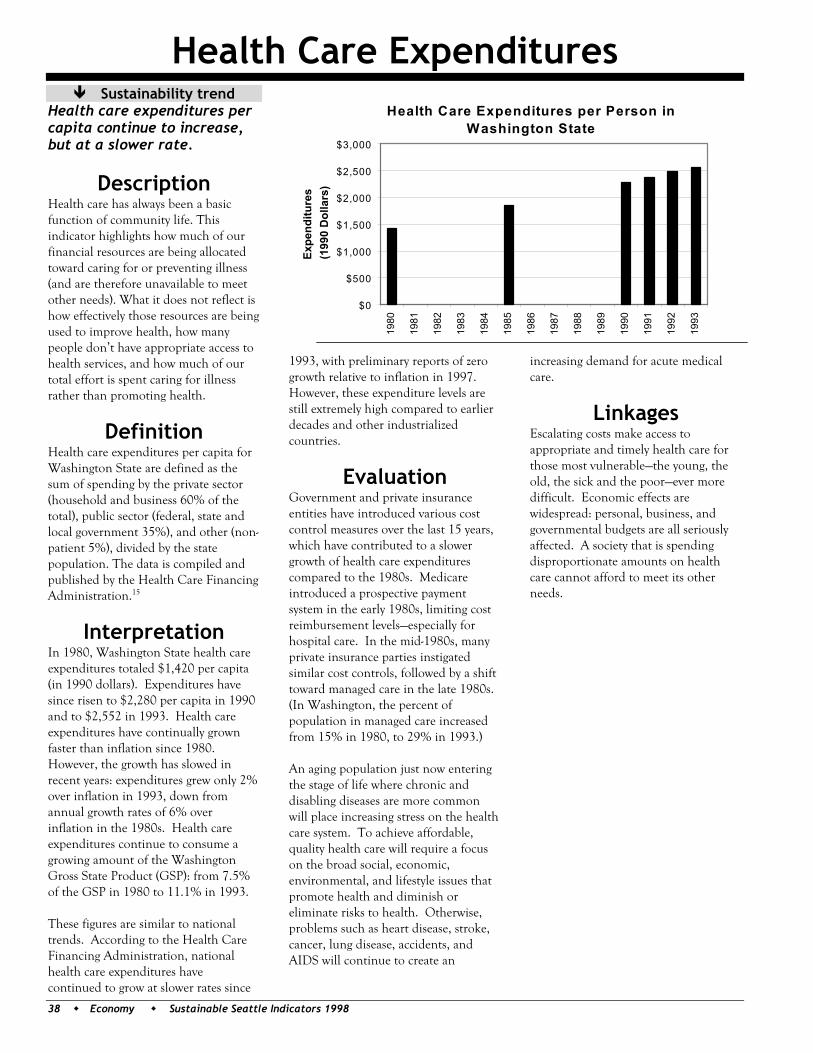
Health Care Expenditures
38 Economy Sustainable Seattle Indicators 1998
Sustainability trend Health care expenditures per capita continue to increase, but at a slower rate.
Description Health care has always been a basic function of community life. This indicator highlights how much of our financial resources are being allocated toward caring for or preventing illness (and are therefore unavailable to meet other needs). What it does not reflect is how effectively those resources are being used to improve health, how many people don’t have appropriate access to health services, and how much of our total effort is spent caring for illness rather than promoting health.
Definition Health care expenditures per capita for Washington State are defined as the sum of spending by the private sector (household and business 60% of the total), public sector (federal, state and local government 35%), and other (non-patient 5%), divided by the state population. The data is compiled and published by the Health Care Financing Administration.15
Interpretation In 1980, Washington State health care expenditures totaled $1,420 per capita (in 1990 dollars). Expenditures have since risen to $2,280 per capita in 1990 and to $2,552 in 1993. Health care expenditures have continually grown faster than inflation since 1980. However, the growth has slowed in recent years: expenditures grew only 2% over inflation in 1993, down from annual growth rates of 6% over inflation in the 1980s. Health care expenditures continue to consume a growing amount of the Washington Gross State Product (GSP): from 7.5% of the GSP in 1980 to 11.1% in 1993. These figures are similar to national trends. According to the Health Care Financing Administration, national health care expenditures have continued to grow at slower rates since
1993, with preliminary reports of zero growth relative to inflation in 1997. However, these expenditure levels are still extremely high compared to earlier decades and other industrialized countries.
Evaluation Government and private insurance entities have introduced various cost control measures over the last 15 years, which have contributed to a slower growth of health care expenditures compared to the 1980s. Medicare introduced a prospective payment system in the early 1980s, limiting cost reimbursement levels—especially for hospital care. In the mid-1980s, many private insurance parties instigated similar cost controls, followed by a shift toward managed care in the late 1980s. (In Washington, the percent of population in managed care increased from 15% in 1980, to 29% in 1993.) An aging population just now entering the stage of life where chronic and disabling diseases are more common will place increasing stress on the health care system. To achieve affordable, quality health care will require a focus on the broad social, economic, environmental, and lifestyle issues that promote health and diminish or eliminate risks to health. Otherwise, problems such as heart disease, stroke, cancer, lung disease, accidents, and AIDS will continue to create an
increasing demand for acute medical care.
Linkages Escalating costs make access to appropriate and timely health care for those most vulnerable—the young, the old, the sick and the poor—ever more difficult. Economic effects are widespread: personal, business, and governmental budgets are all seriously affected. A society that is spending disproportionate amounts on health care cannot afford to meet its other needs.
Health Care Expenditures per Person in Washington State
$0
$500
$1,000
$1,500
$2,000
$2,500
$3,000
1980
1981
1982
1983
1984
1985
1986
1987
1988
1989
1990
1991
1992
1993
Expe
nditu
res
(199
0 D
olla
rs)
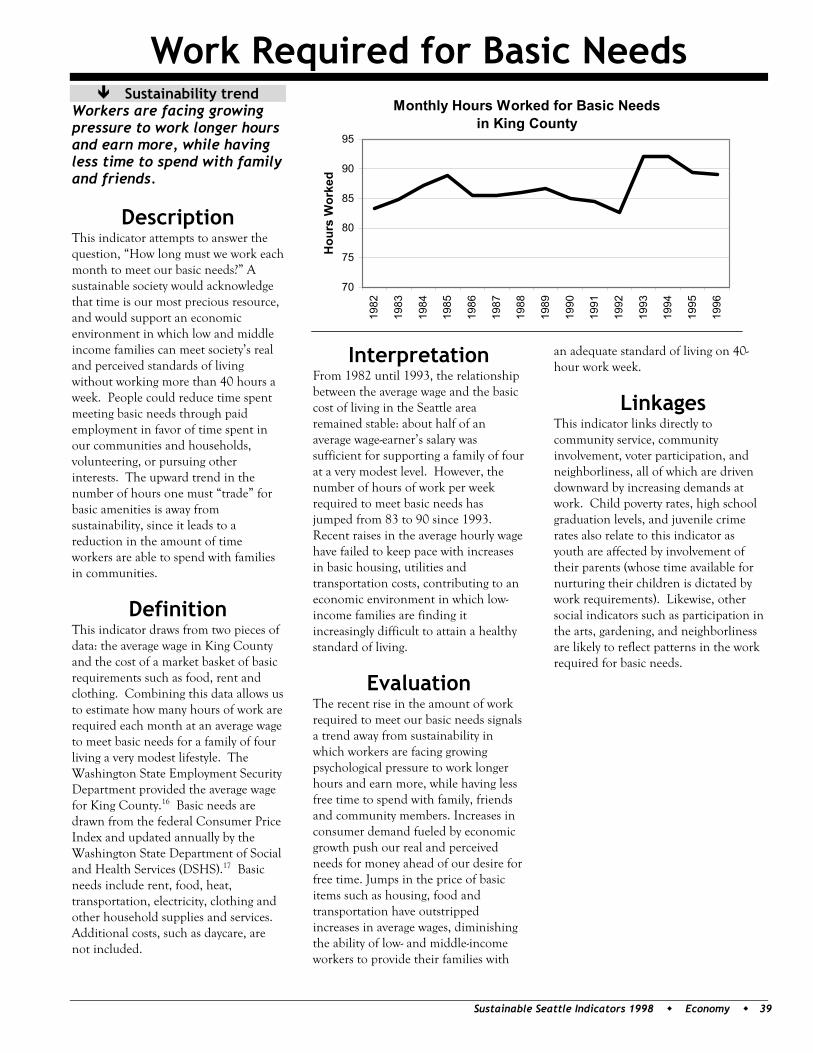
Work Required for Basic Needs
Sustainable Seattle Indicators 1998 Economy 39
Sustainability trend Workers are facing growing pressure to work longer hours and earn more, while having less time to spend with family and friends.
Description This indicator attempts to answer the question, “How long must we work each month to meet our basic needs?” A sustainable society would acknowledge that time is our most precious resource, and would support an economic environment in which low and middle income families can meet society’s real and perceived standards of living without working more than 40 hours a week. People could reduce time spent meeting basic needs through paid employment in favor of time spent in our communities and households, volunteering, or pursuing other interests. The upward trend in the number of hours one must “trade” for basic amenities is away from sustainability, since it leads to a reduction in the amount of time workers are able to spend with families in communities.
Definition This indicator draws from two pieces of data: the average wage in King County and the cost of a market basket of basic requirements such as food, rent and clothing. Combining this data allows us to estimate how many hours of work are required each month at an average wage to meet basic needs for a family of four living a very modest lifestyle. The Washington State Employment Security Department provided the average wage for King County.16 Basic needs are drawn from the federal Consumer Price Index and updated annually by the Washington State Department of Social and Health Services (DSHS).17 Basic needs include rent, food, heat, transportation, electricity, clothing and other household supplies and services. Additional costs, such as daycare, are not included.
Interpretation From 1982 until 1993, the relationship between the average wage and the basic cost of living in the Seattle area remained stable: about half of an average wage-earner’s salary was sufficient for supporting a family of four at a very modest level. However, the number of hours of work per week required to meet basic needs has jumped from 83 to 90 since 1993. Recent raises in the average hourly wage have failed to keep pace with increases in basic housing, utilities and transportation costs, contributing to an economic environment in which low-income families are finding it increasingly difficult to attain a healthy standard of living.
Evaluation The recent rise in the amount of work required to meet our basic needs signals a trend away from sustainability in which workers are facing growing psychological pressure to work longer hours and earn more, while having less free time to spend with family, friends and community members. Increases in consumer demand fueled by economic growth push our real and perceived needs for money ahead of our desire for free time. Jumps in the price of basic items such as housing, food and transportation have outstripped increases in average wages, diminishing the ability of low- and middle-income workers to provide their families with
an adequate standard of living on 40-hour work week.
Linkages This indicator links directly to community service, community involvement, voter participation, and neighborliness, all of which are driven downward by increasing demands at work. Child poverty rates, high school graduation levels, and juvenile crime rates also relate to this indicator as youth are affected by involvement of their parents (whose time available for nurturing their children is dictated by work requirements). Likewise, other social indicators such as participation in the arts, gardening, and neighborliness are likely to reflect patterns in the work required for basic needs.
Monthly Hours Worked for Basic Needs in King County
70
75
80
85
90
95
1982
1983
1984
1985
1986
1987
1988
1989
1990
1991
1992
1993
1994
1995
1996
Hou
rs W
orke
d
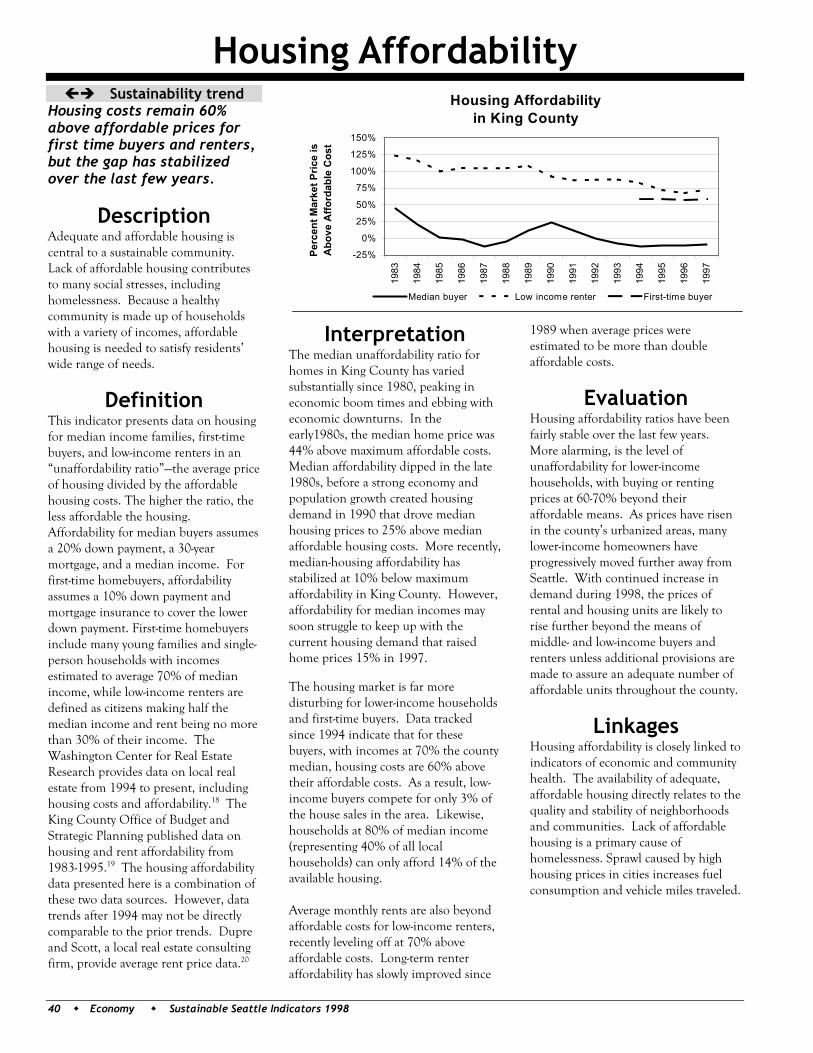
Housing Affordability
40 Economy Sustainable Seattle Indicators 1998
Sustainability trend Housing costs remain 60% above affordable prices for first time buyers and renters, but the gap has stabilized over the last few years.
Description Adequate and affordable housing is central to a sustainable community. Lack of affordable housing contributes to many social stresses, including homelessness. Because a healthy community is made up of households with a variety of incomes, affordable housing is needed to satisfy residents’ wide range of needs.
Definition This indicator presents data on housing for median income families, first-time buyers, and low-income renters in an “unaffordability ratio”—the average price of housing divided by the affordable housing costs. The higher the ratio, the less affordable the housing. Affordability for median buyers assumes a 20% down payment, a 30-year mortgage, and a median income. For first-time homebuyers, affordability assumes a 10% down payment and mortgage insurance to cover the lower down payment. First-time homebuyers include many young families and single-person households with incomes estimated to average 70% of median income, while low-income renters are defined as citizens making half the median income and rent being no more than 30% of their income. The Washington Center for Real Estate Research provides data on local real estate from 1994 to present, including housing costs and affordability.18 The King County Office of Budget and Strategic Planning published data on housing and rent affordability from 1983-1995.19 The housing affordability data presented here is a combination of these two data sources. However, data trends after 1994 may not be directly comparable to the prior trends. Dupre and Scott, a local real estate consulting firm, provide average rent price data.20
Interpretation The median unaffordability ratio for homes in King County has varied substantially since 1980, peaking in economic boom times and ebbing with economic downturns. In the early1980s, the median home price was 44% above maximum affordable costs. Median affordability dipped in the late 1980s, before a strong economy and population growth created housing demand in 1990 that drove median housing prices to 25% above median affordable housing costs. More recently, median-housing affordability has stabilized at 10% below maximum affordability in King County. However, affordability for median incomes may soon struggle to keep up with the current housing demand that raised home prices 15% in 1997.
The housing market is far more disturbing for lower-income households and first-time buyers. Data tracked since 1994 indicate that for these buyers, with incomes at 70% the county median, housing costs are 60% above their affordable costs. As a result, low-income buyers compete for only 3% of the house sales in the area. Likewise, households at 80% of median income (representing 40% of all local households) can only afford 14% of the available housing. Average monthly rents are also beyond affordable costs for low-income renters, recently leveling off at 70% above affordable costs. Long-term renter affordability has slowly improved since
1989 when average prices were estimated to be more than double affordable costs.
Evaluation Housing affordability ratios have been fairly stable over the last few years. More alarming, is the level of unaffordability for lower-income households, with buying or renting prices at 60-70% beyond their affordable means. As prices have risen in the county’s urbanized areas, many lower-income homeowners have progressively moved further away from Seattle. With continued increase in demand during 1998, the prices of rental and housing units are likely to rise further beyond the means of middle- and low-income buyers and renters unless additional provisions are made to assure an adequate number of affordable units throughout the county.
Linkages Housing affordability is closely linked to indicators of economic and community health. The availability of adequate, affordable housing directly relates to the quality and stability of neighborhoods and communities. Lack of affordable housing is a primary cause of homelessness. Sprawl caused by high housing prices in cities increases fuel consumption and vehicle miles traveled.
Housing Affordability in King County
-25%
0%
25%
50%
75%
100%
125%
150%
1983
1984
1985
1986
1987
1988
1989
1990
1991
1992
1993
1994
1995
1996
1997
Perc
ent M
arke
t Pric
e is
A
bove
Affo
rdab
le C
ost
Median buyer Low income renter First-time buyer
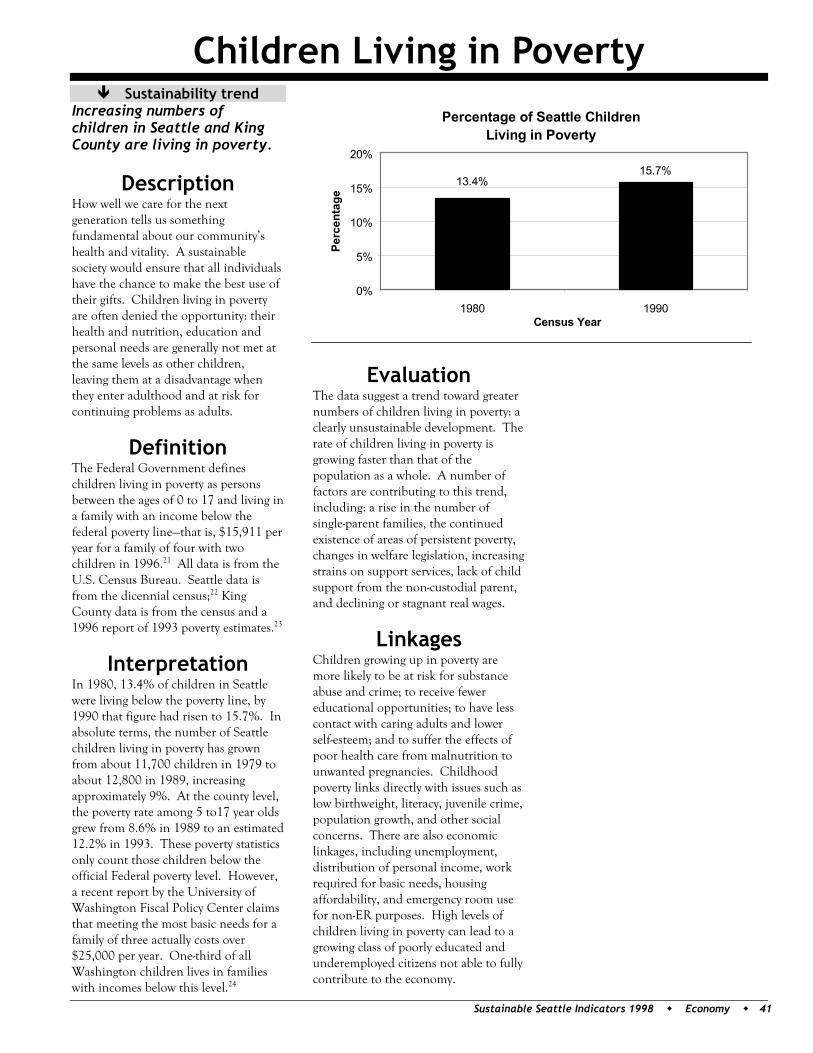
Children Living in Poverty
Sustainable Seattle Indicators 1998 Economy 41
Sustainability trend Increasing numbers of children in Seattle and King County are living in poverty.
Description How well we care for the next generation tells us something fundamental about our community’s health and vitality. A sustainable society would ensure that all individuals have the chance to make the best use of their gifts. Children living in poverty are often denied the opportunity: their health and nutrition, education and personal needs are generally not met at the same levels as other children, leaving them at a disadvantage when they enter adulthood and at risk for continuing problems as adults.
Definition The Federal Government defines children living in poverty as persons between the ages of 0 to 17 and living in a family with an income below the federal poverty line—that is, $15,911 per year for a family of four with two children in 1996.21 All data is from the U.S. Census Bureau. Seattle data is from the dicennial census;22 King County data is from the census and a 1996 report of 1993 poverty estimates.23
Interpretation In 1980, 13.4% of children in Seattle were living below the poverty line, by 1990 that figure had risen to 15.7%. In absolute terms, the number of Seattle children living in poverty has grown from about 11,700 children in 1979 to about 12,800 in 1989, increasing approximately 9%. At the county level, the poverty rate among 5 to17 year olds grew from 8.6% in 1989 to an estimated 12.2% in 1993. These poverty statistics only count those children below the official Federal poverty level. However, a recent report by the University of Washington Fiscal Policy Center claims that meeting the most basic needs for a family of three actually costs over $25,000 per year. One-third of all Washington children lives in families with incomes below this level.24
Evaluation The data suggest a trend toward greater numbers of children living in poverty: a clearly unsustainable development. The rate of children living in poverty is growing faster than that of the population as a whole. A number of factors are contributing to this trend, including: a rise in the number of single-parent families, the continued existence of areas of persistent poverty, changes in welfare legislation, increasing strains on support services, lack of child support from the non-custodial parent, and declining or stagnant real wages.
Linkages Children growing up in poverty are more likely to be at risk for substance abuse and crime; to receive fewer educational opportunities; to have less contact with caring adults and lower self-esteem; and to suffer the effects of poor health care from malnutrition to unwanted pregnancies. Childhood poverty links directly with issues such as low birthweight, literacy, juvenile crime, population growth, and other social concerns. There are also economic linkages, including unemployment, distribution of personal income, work required for basic needs, housing affordability, and emergency room use for non-ER purposes. High levels of children living in poverty can lead to a growing class of poorly educated and underemployed citizens not able to fully contribute to the economy.
Percentage of Seattle Children Living in Poverty
15.7%13.4%
0%
5%
10%
15%
20%
1980 1990Census Year
Perc
enta
ge
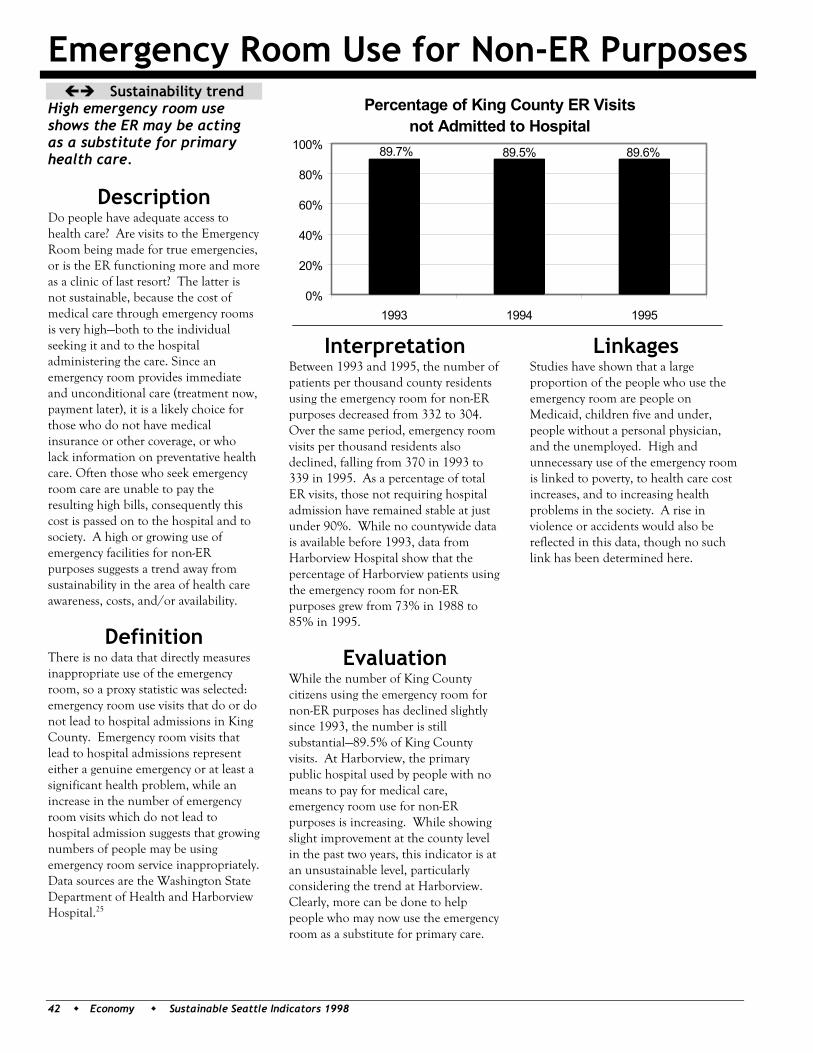
Emergency Room Use for Non-ER Purposes
42 Economy Sustainable Seattle Indicators 1998
Sustainability trend High emergency room use shows the ER may be acting as a substitute for primary health care.
Description Do people have adequate access to health care? Are visits to the Emergency Room being made for true emergencies, or is the ER functioning more and more as a clinic of last resort? The latter is not sustainable, because the cost of medical care through emergency rooms is very high—both to the individual seeking it and to the hospital administering the care. Since an emergency room provides immediate and unconditional care (treatment now, payment later), it is a likely choice for those who do not have medical insurance or other coverage, or who lack information on preventative health care. Often those who seek emergency room care are unable to pay the resulting high bills, consequently this cost is passed on to the hospital and to society. A high or growing use of emergency facilities for non-ER purposes suggests a trend away from sustainability in the area of health care awareness, costs, and/or availability.
Definition There is no data that directly measures inappropriate use of the emergency room, so a proxy statistic was selected: emergency room use visits that do or do not lead to hospital admissions in King County. Emergency room visits that lead to hospital admissions represent either a genuine emergency or at least a significant health problem, while an increase in the number of emergency room visits which do not lead to hospital admission suggests that growing numbers of people may be using emergency room service inappropriately. Data sources are the Washington State Department of Health and Harborview Hospital.25
Interpretation Between 1993 and 1995, the number of patients per thousand county residents using the emergency room for non-ER purposes decreased from 332 to 304. Over the same period, emergency room visits per thousand residents also declined, falling from 370 in 1993 to 339 in 1995. As a percentage of total ER visits, those not requiring hospital admission have remained stable at just under 90%. While no countywide data is available before 1993, data from Harborview Hospital show that the percentage of Harborview patients using the emergency room for non-ER purposes grew from 73% in 1988 to 85% in 1995.
Evaluation While the number of King County citizens using the emergency room for non-ER purposes has declined slightly since 1993, the number is still substantial—89.5% of King County visits. At Harborview, the primary public hospital used by people with no means to pay for medical care, emergency room use for non-ER purposes is increasing. While showing slight improvement at the county level in the past two years, this indicator is at an unsustainable level, particularly considering the trend at Harborview. Clearly, more can be done to help people who may now use the emergency room as a substitute for primary care.
Linkages Studies have shown that a large proportion of the people who use the emergency room are people on Medicaid, children five and under, people without a personal physician, and the unemployed. High and unnecessary use of the emergency room is linked to poverty, to health care cost increases, and to increasing health problems in the society. A rise in violence or accidents would also be reflected in this data, though no such link has been determined here.
Percentage of King County ER Visits not Admitted to Hospital
89.6%89.5%89.7%
0%
20%
40%
60%
80%
100%
1993 1994 1995
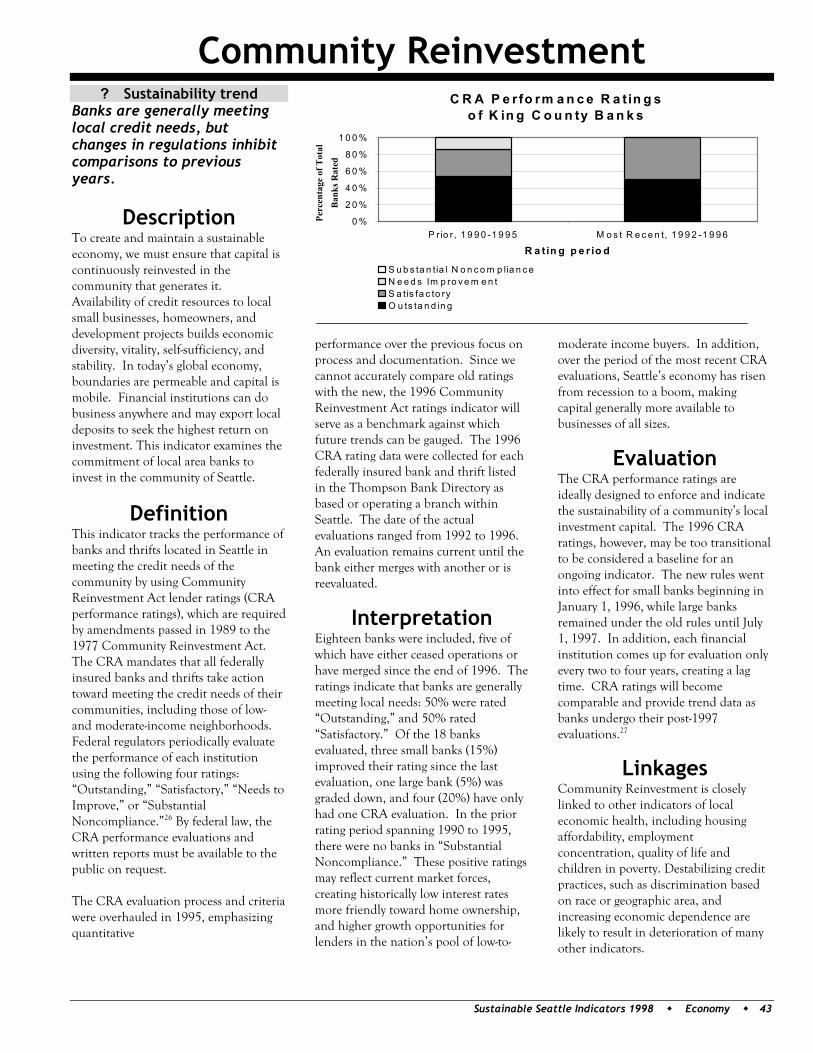
Community Reinvestment
Sustainable Seattle Indicators 1998 Economy 43
? Sustainability trend Banks are generally meeting local credit needs, but changes in regulations inhibit comparisons to previous years.
Description To create and maintain a sustainable economy, we must ensure that capital is continuously reinvested in the community that generates it. Availability of credit resources to local small businesses, homeowners, and development projects builds economic diversity, vitality, self-sufficiency, and stability. In today’s global economy, boundaries are permeable and capital is mobile. Financial institutions can do business anywhere and may export local deposits to seek the highest return on investment. This indicator examines the commitment of local area banks to invest in the community of Seattle.
Definition This indicator tracks the performance of banks and thrifts located in Seattle in meeting the credit needs of the community by using Community Reinvestment Act lender ratings (CRA performance ratings), which are required by amendments passed in 1989 to the 1977 Community Reinvestment Act. The CRA mandates that all federally insured banks and thrifts take action toward meeting the credit needs of their communities, including those of low- and moderate-income neighborhoods. Federal regulators periodically evaluate the performance of each institution using the following four ratings: “Outstanding,” “Satisfactory,” “Needs to Improve,” or “Substantial Noncompliance.”26 By federal law, the CRA performance evaluations and written reports must be available to the public on request. The CRA evaluation process and criteria were overhauled in 1995, emphasizing quantitative
performance over the previous focus on process and documentation. Since we cannot accurately compare old ratings with the new, the 1996 Community Reinvestment Act ratings indicator will serve as a benchmark against which future trends can be gauged. The 1996 CRA rating data were collected for each federally insured bank and thrift listed in the Thompson Bank Directory as based or operating a branch within Seattle. The date of the actual evaluations ranged from 1992 to 1996. An evaluation remains current until the bank either merges with another or is reevaluated.
Interpretation Eighteen banks were included, five of which have either ceased operations or have merged since the end of 1996. The ratings indicate that banks are generally meeting local needs: 50% were rated “Outstanding,” and 50% rated “Satisfactory.” Of the 18 banks evaluated, three small banks (15%) improved their rating since the last evaluation, one large bank (5%) was graded down, and four (20%) have only had one CRA evaluation. In the prior rating period spanning 1990 to 1995, there were no banks in “Substantial Noncompliance.” These positive ratings may reflect current market forces, creating historically low interest rates more friendly toward home ownership, and higher growth opportunities for lenders in the nation’s pool of low-to-
moderate income buyers. In addition, over the period of the most recent CRA evaluations, Seattle’s economy has risen from recession to a boom, making capital generally more available to businesses of all sizes.
Evaluation The CRA performance ratings are ideally designed to enforce and indicate the sustainability of a community’s local investment capital. The 1996 CRA ratings, however, may be too transitional to be considered a baseline for an ongoing indicator. The new rules went into effect for small banks beginning in January 1, 1996, while large banks remained under the old rules until July 1, 1997. In addition, each financial institution comes up for evaluation only every two to four years, creating a lag time. CRA ratings will become comparable and provide trend data as banks undergo their post-1997 evaluations.27
Linkages Community Reinvestment is closely linked to other indicators of local economic health, including housing affordability, employment concentration, quality of life and children in poverty. Destabilizing credit practices, such as discrimination based on race or geographic area, and increasing economic dependence are likely to result in deterioration of many other indicators.
C R A P e r fo rm a n c e R a tin g s o f K in g C o u n ty B a n k s
0 %
2 0 %
4 0 %
6 0 %
8 0 %
1 0 0 %
P r io r , 1 9 9 0 -1 9 9 5 M o s t R e c e n t, 1 9 9 2 -1 9 9 6
R a tin g p e r io d
Perc
enta
ge o
f Tot
al
Ban
ks R
ated
S u b s ta n tia l N o n c o m p lia n c eN e e d s Im p ro v e m e n tS a tis fa c to ryO u ts ta n d in g
44 Economy Sustainable Seattle Indicators 1998
Economy Notes 1 Regional Economic Information Service, Bureau of Economic Analysis, Table CA05 – Personal Income by Major Source and Earnings by Industry, 1969-1995. Online at http://www.lib.virginia.edu/socsci/reis/. 2 Bureau of Labor Statistics, Consumer Price Index—All Urban Consumers. Online at http://stats.bls.gov/. 3 A Btu is the amount of heat energy it takes to raise one pound of water by one degree Fahrenheit. 4 Seattle Northwest Financial Advisors, via Seattle City Light, Municipal Light and Power Revenue Bonds Statement. (Seattle, WA: 1984, 1985, and 1988). 5 Richard Chapman, Economic Development Council of Seattle and King County, private communication, July 18, 1997. 6 Puget Sound Business Journal, Book of Lists, (Seattle, WA: 1995). 7Washington State Employment Security Department, Employment and Payrolls in Washington State, by County and Industry. Online at http://www.wa.gov/esd/. 8 Unemployment data 1978 to 1995 from Washington State Employment Security Department, King County, Selected Economic Data, 1970-1995. Online at http://www.wa.gov/esd/lmea/labrmrkt/sed/kingsed.txt. Unemployment data 1996 to 1997 from Bureau of Labor Statistics(BLS), Local Area Unemployment Statistics. Online at www.bls.gov/. The unemployment figure for 1997 is the average monthly unemployment from Jan-Oct 1997. Note: The Washington Employment Security Department and the BLS data are from the same data set. The BLS site is referenced because it has more recent unemployment numbers (i.e. years 1996 and 1997). 9 Unpublished tabulations of U-5b (official unemployment) and U-7 unemployment from the Current Population Survey. Prepared and sent by Steve Haugen, Bureau of Labor Statistics, August 6, 1997. In 1994, the BLS revised the different categories of unemployment; there are now six. 10 The Bureau of Labor Statistics keeps statistics on various types of unemployment. The official national unemployment rate until 1993 was data series U-5b. The broadest defined national unemployment rate until 1993 was U-7, which adds to U-5b those people who want to and are available to work, and those who are employed part time yet want full-time employment. The number for Sustainable Seattle’s estimated unemployment is based on a linear regression of the difference between national U-7 and U-5b unemployment as it relates to national U-5b unemployment levels. We assume that the ratio of these national figures holds for the King County area, an assumption that may not be true. The correlation between the U-7 U-5b “difference” and the U-5b rates was .74; this means that about half of the variation in one rate explains the variation in the other. Our regression analysis yields estimates of additional unemployment of 1.5% when unemployment was lowest, and 4.4% when unemployment was highest. Though the BLS unemployment measures changed in 1994, we still use the older measures because the old measures have been in use for a much longer time. For years 1994 to
1997, the official unemployment rate is from a new U-3 data series. We apply our regression numbers to the U-3 data. Recent data is therefore a less accurate estimate than the pre-1994 data. 11 Unemployment by race from Bureau of Labor Statistics, Labor Force Statistics from the Current Population Survey. Online at http://stats.bls.gov/. 12 U.S. Census Bureau, City and County Data Book, 1990 Census. (Washington D.C.: 1990) 13 Definitions are from U.S. Census Tables or the Statistical Abstract of the U.S. 14 The American Almanac, Table No. 731, “Money Income of Households,” p. 462. 15 Katherine Levit et. al., “State Health Expenditure Accounts,” Health Care Financing Review, Fall 1995. 16 Washington State Employment Security Department, King County, Selected Economic Data, 1970-1995. Online at http://www.wa.gov/esd/lmea/labrmrkt/sed/kingsed.txt. 17 Economic Services Administration, Department of Social and Health Services, Annual Program Briefing Book, Fiscal Year 1995. Table 29, (Olympia, WA: 1995) p. 96. 18 Washington Center for Real Estate Research, Washington State’s Housing: A Supply and Demand Assessment. On-line at http://cbeunix.wsu.edu/~wcrer/ 19 King County Office of Budget and Strategic Planning, 1997 Annual Growth Report (Seattle, WA: 1997). 20 Dupre + Scott, Apartment Vacancy Trends (Seattle, WA: 1998). 21 U.S. Census Bureau, Current Population Survey, Poverty Thresholds: 1996. Online at http://www.census.gov/. 22 U.S. Census Bureau, City and County Data Book, 1990 Census, (Washington, D.C.: 1990). 23 U.S. Census Bureau, County Income and Poverty Estimates, Estimates for Washington State: 1993. Online at http://www.census.gov/ftp/pub/hhes/www/saipe/saipe93/estimate/estimate.html. 24 McIntire, Brandon, Deweese et. al. Policy Choices for Working Families in Washington: A Baseline Analysis of State Economic Support for Working Families. University of Washington Fiscal Policy Center, (Seattle, WA: March 1997) p. 1. 25 King County data from Vicki Hohner, Washington State Department of Health (DOH), obtained from DOH archives, August 1997. Harborview Hospital data from Larry Zalin, Harborview Community Relations, private communication. 26 Standards are size dependent. Large banks and thrifts are evaluated on the performance of the products and services they offer based on three tests: a lending test, a service test, and an investment test. Small banks with assets less than $250 million or affiliated with a holding company of assets less than $1 billion are evaluated by more streamlined standards. 27 According to the Board of Governors of the Federal Reserve system, the new CRA regulations provide clearer, more consistent and objective standards. Some bank officers argue that, under the new rules, it will be more difficult for small banks to receive an Outstanding rating. Also, the decreased emphasis on qualitative information
will give a less accurate measure of the bank’s contribution to the community’s well-being.

E d u c a t i o n
Y o u t h &
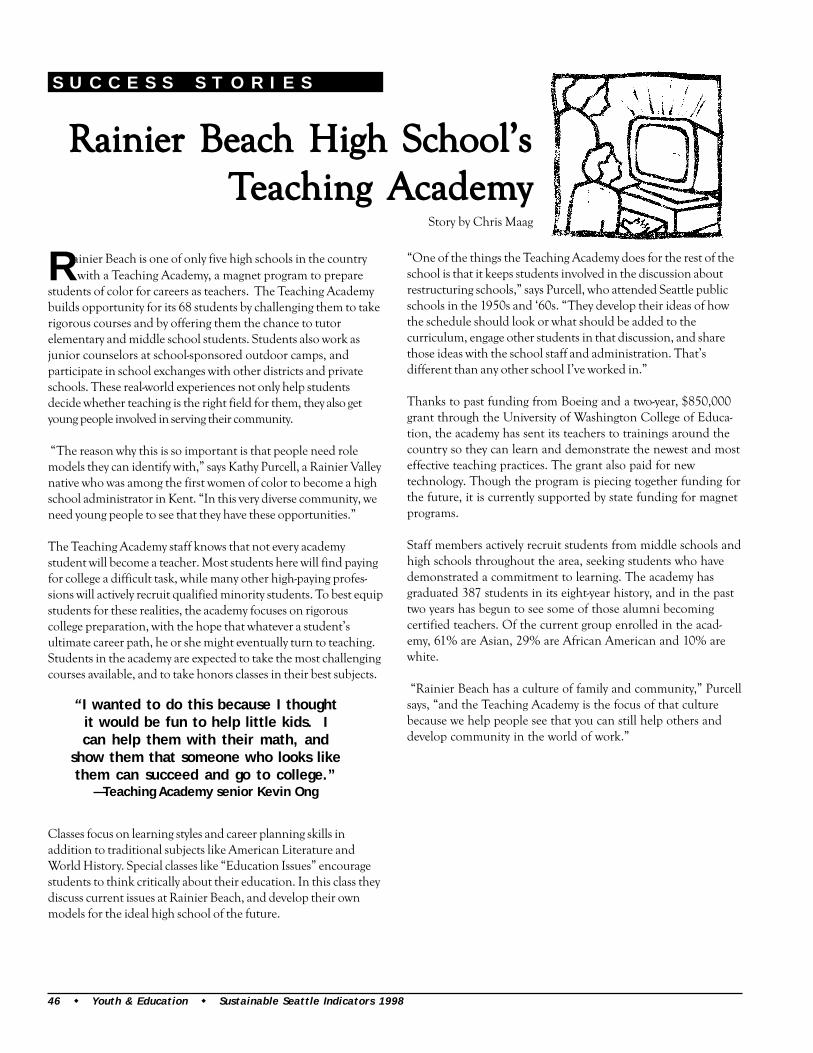
Rainier Beach is one of only five high schools in the country with a Teaching Academy, a magnet program to prepare
students of color for careers as teachers. The Teaching Academybuilds opportunity for its 68 students by challenging them to takerigorous courses and by offering them the chance to tutorelementary and middle school students. Students also work asjunior counselors at school-sponsored outdoor camps, andparticipate in school exchanges with other districts and privateschools. These real-world experiences not only help studentsdecide whether teaching is the right field for them, they also getyoung people involved in serving their community.
“The reason why this is so important is that people need rolemodels they can identify with,” says Kathy Purcell, a Rainier Valleynative who was among the first women of color to become a highschool administrator in Kent. “In this very diverse community, weneed young people to see that they have these opportunities.”
The Teaching Academy staff knows that not every academystudent will become a teacher. Most students here will find payingfor college a difficult task, while many other high-paying profes-sions will actively recruit qualified minority students. To best equipstudents for these realities, the academy focuses on rigorouscollege preparation, with the hope that whatever a student’sultimate career path, he or she might eventually turn to teaching.Students in the academy are expected to take the most challengingcourses available, and to take honors classes in their best subjects.
Classes focus on learning styles and career planning skills inaddition to traditional subjects like American Literature andWorld History. Special classes like “Education Issues” encouragestudents to think critically about their education. In this class theydiscuss current issues at Rainier Beach, and develop their ownmodels for the ideal high school of the future.
“One of the things the Teaching Academy does for the rest of theschool is that it keeps students involved in the discussion aboutrestructuring schools,” says Purcell, who attended Seattle publicschools in the 1950s and ‘60s. “They develop their ideas of howthe schedule should look or what should be added to thecurriculum, engage other students in that discussion, and sharethose ideas with the school staff and administration. That’sdifferent than any other school I’ve worked in.”
Thanks to past funding from Boeing and a two-year, $850,000grant through the University of Washington College of Educa-tion, the academy has sent its teachers to trainings around thecountry so they can learn and demonstrate the newest and mosteffective teaching practices. The grant also paid for newtechnology. Though the program is piecing together funding forthe future, it is currently supported by state funding for magnetprograms.
Staff members actively recruit students from middle schools andhigh schools throughout the area, seeking students who havedemonstrated a commitment to learning. The academy hasgraduated 387 students in its eight-year history, and in the pasttwo years has begun to see some of those alumni becomingcertified teachers. Of the current group enrolled in the acad-emy, 61% are Asian, 29% are African American and 10% arewhite.
“Rainier Beach has a culture of family and community,” Purcellsays, “and the Teaching Academy is the focus of that culturebecause we help people see that you can still help others anddevelop community in the world of work.”
“I wanted to do this because I thoughtit would be fun to help little kids. Ican help them with their math, and
show them that someone who looks likethem can succeed and go to college.”
—Teaching Academy senior Kevin Ong
S U C C E S S S T O R I E S
Rainier BeacRainier BeacRainier BeacRainier BeacRainier Beach High Sch High Sch High Sch High Sch High School’shool’shool’shool’shool’sTTTTTeaceaceaceaceaching Ahing Ahing Ahing Ahing Academcademcademcademcademyyyyy
Story by Chris Maag
46 Youth & Education Sustainable Seattle Indicators 1998
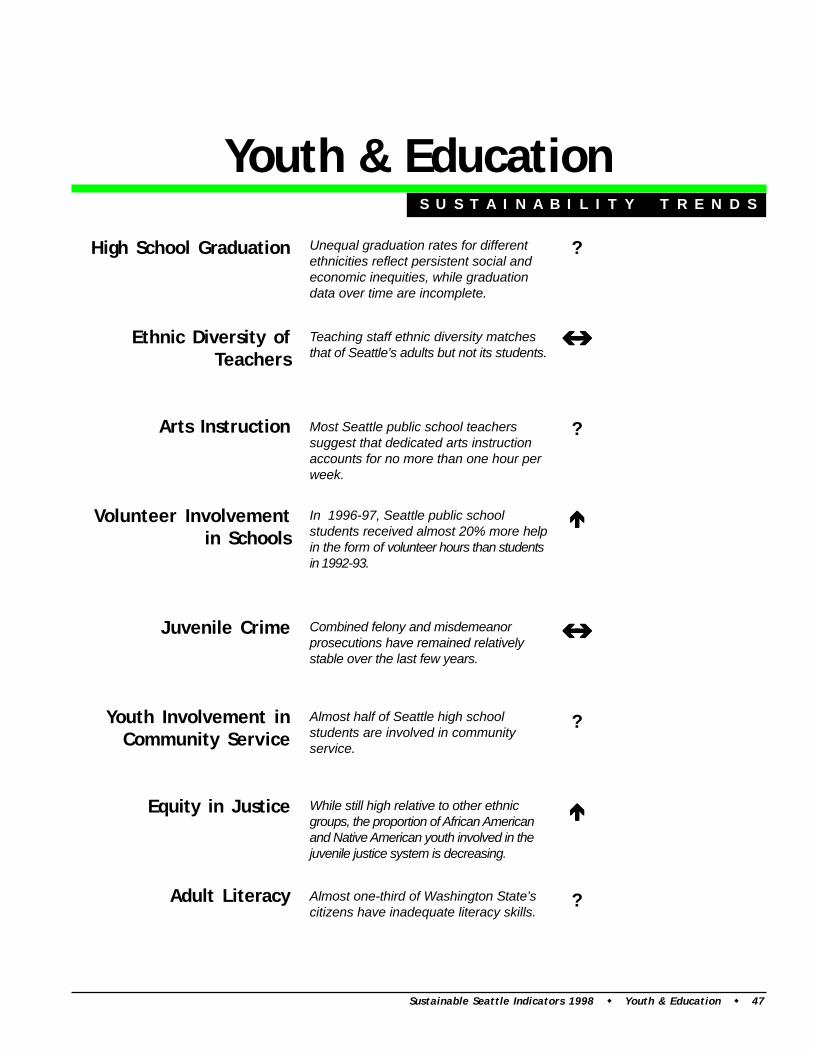
High School Graduation
Ethnic Diversity ofTeachers
Arts Instruction
Volunteer Involvementin Schools
Juvenile Crime
Youth Involvement inCommunity Service
Equity in Justice
Adult Literacy
?
?
?
?
S U S T A I N A B I L I T Y T R E N D
Youth & EducationS U S T A I N A B I L I T Y T R E N D S
Almost one-third of Washington State’scitizens have inadequate literacy skills.
Teaching staff ethnic diversity matchesthat of Seattle’s adults but not its students.
Most Seattle public school teacherssuggest that dedicated arts instructionaccounts for no more than one hour perweek.
In 1996-97, Seattle public schoolstudents received almost 20% more helpin the form of volunteer hours than studentsin 1992-93.
Combined felony and misdemeanorprosecutions have remained relativelystable over the last few years.
Almost half of Seattle high schoolstudents are involved in communityservice.
Unequal graduation rates for differentethnicities reflect persistent social andeconomic inequities, while graduationdata over time are incomplete.
While still high relative to other ethnicgroups, the proportion of African Americanand Native American youth involved in thejuvenile justice system is decreasing.
Sustainable Seattle Indicators 1998 Youth & Education 47
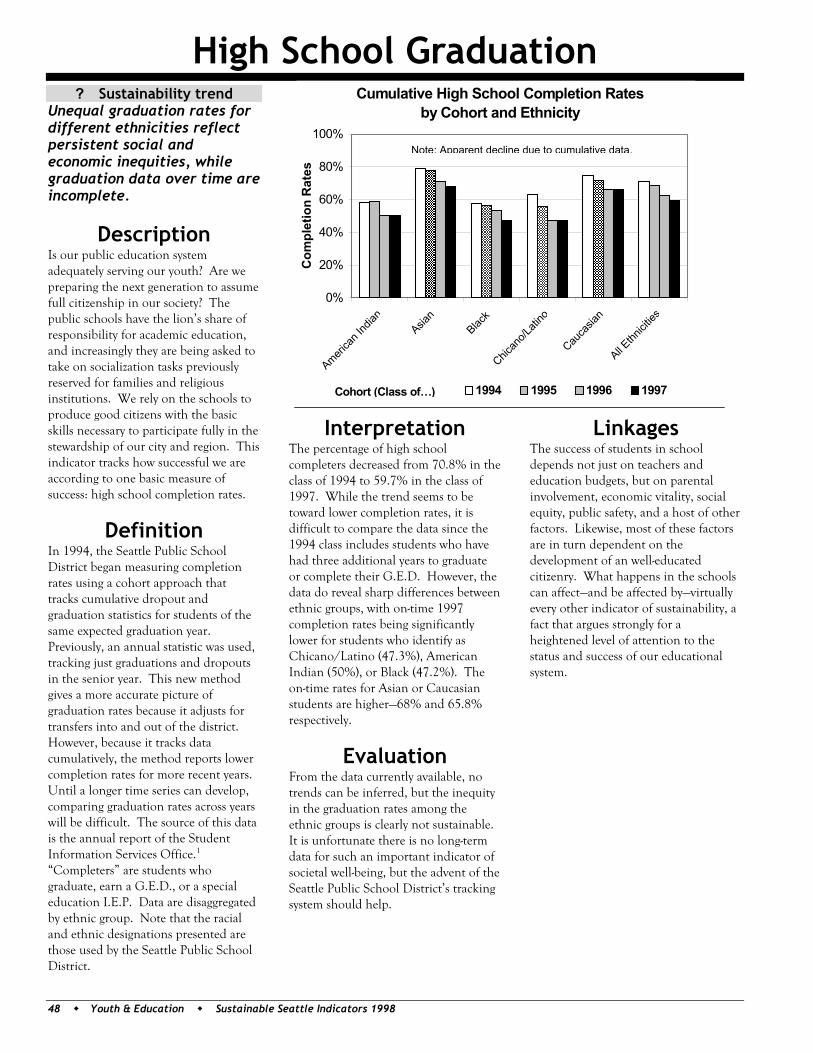
High School Graduation
48 Youth & Education Sustainable Seattle Indicators 1998
? Sustainability trend Unequal graduation rates for different ethnicities reflect persistent social and economic inequities, while graduation data over time are incomplete.
Description Is our public education system adequately serving our youth? Are we preparing the next generation to assume full citizenship in our society? The public schools have the lion’s share of responsibility for academic education, and increasingly they are being asked to take on socialization tasks previously reserved for families and religious institutions. We rely on the schools to produce good citizens with the basic skills necessary to participate fully in the stewardship of our city and region. This indicator tracks how successful we are according to one basic measure of success: high school completion rates.
Definition In 1994, the Seattle Public School District began measuring completion rates using a cohort approach that tracks cumulative dropout and graduation statistics for students of the same expected graduation year. Previously, an annual statistic was used, tracking just graduations and dropouts in the senior year. This new method gives a more accurate picture of graduation rates because it adjusts for transfers into and out of the district. However, because it tracks data cumulatively, the method reports lower completion rates for more recent years. Until a longer time series can develop, comparing graduation rates across years will be difficult. The source of this data is the annual report of the Student Information Services Office.1 “Completers” are students who graduate, earn a G.E.D., or a special education I.E.P. Data are disaggregated by ethnic group. Note that the racial and ethnic designations presented are those used by the Seattle Public School District.
Interpretation The percentage of high school completers decreased from 70.8% in the class of 1994 to 59.7% in the class of 1997. While the trend seems to be toward lower completion rates, it is difficult to compare the data since the 1994 class includes students who have had three additional years to graduate or complete their G.E.D. However, the data do reveal sharp differences between ethnic groups, with on-time 1997 completion rates being significantly lower for students who identify as Chicano/Latino (47.3%), American Indian (50%), or Black (47.2%). The on-time rates for Asian or Caucasian students are higher—68% and 65.8% respectively.
Evaluation From the data currently available, no trends can be inferred, but the inequity in the graduation rates among the ethnic groups is clearly not sustainable. It is unfortunate there is no long-term data for such an important indicator of societal well-being, but the advent of the Seattle Public School District’s tracking system should help.
Linkages The success of students in school depends not just on teachers and education budgets, but on parental involvement, economic vitality, social equity, public safety, and a host of other factors. Likewise, most of these factors are in turn dependent on the development of an well-educated citizenry. What happens in the schools can affect—and be affected by—virtually every other indicator of sustainability, a fact that argues strongly for a heightened level of attention to the status and success of our educational system.
Cumulative High School Completion Ratesby Cohort and Ethnicity
0%
20%
40%
60%
80%
100%
America
n Ind
ianAsia
nBlac
k
Chican
o/Lati
no
Cauca
sian
All Ethn
icitie
sC
ompl
etio
n R
ates
1994 1995 1996 1997Cohort (Class of…)
Note: Apparent decline due to cumulative data.
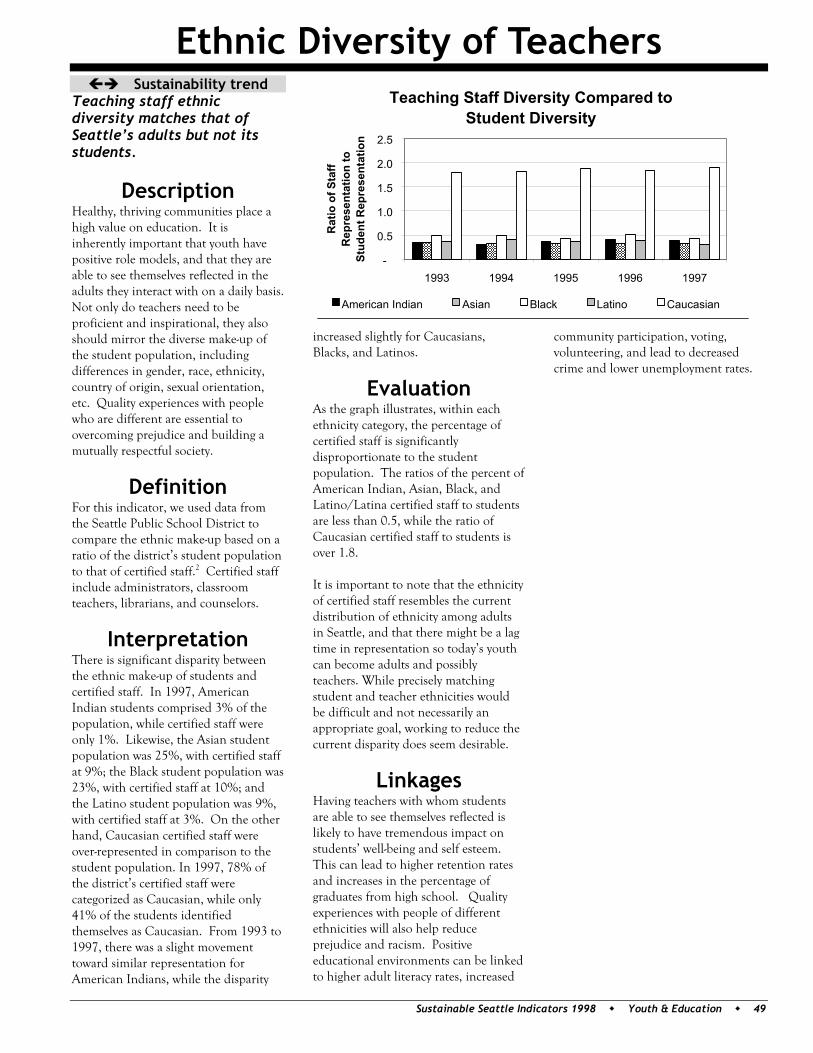
Ethnic Diversity of Teachers
Sustainable Seattle Indicators 1998 Youth & Education 49
Sustainability trend Teaching staff ethnic diversity matches that of Seattle’s adults but not its students.
Description Healthy, thriving communities place a high value on education. It is inherently important that youth have positive role models, and that they are able to see themselves reflected in the adults they interact with on a daily basis. Not only do teachers need to be proficient and inspirational, they also should mirror the diverse make-up of the student population, including differences in gender, race, ethnicity, country of origin, sexual orientation, etc. Quality experiences with people who are different are essential to overcoming prejudice and building a mutually respectful society.
Definition For this indicator, we used data from the Seattle Public School District to compare the ethnic make-up based on a ratio of the district’s student population to that of certified staff.2 Certified staff include administrators, classroom teachers, librarians, and counselors.
Interpretation There is significant disparity between the ethnic make-up of students and certified staff. In 1997, American Indian students comprised 3% of the population, while certified staff were only 1%. Likewise, the Asian student population was 25%, with certified staff at 9%; the Black student population was 23%, with certified staff at 10%; and the Latino student population was 9%, with certified staff at 3%. On the other hand, Caucasian certified staff were over-represented in comparison to the student population. In 1997, 78% of the district’s certified staff were categorized as Caucasian, while only 41% of the students identified themselves as Caucasian. From 1993 to 1997, there was a slight movement toward similar representation for American Indians, while the disparity
increased slightly for Caucasians, Blacks, and Latinos.
Evaluation As the graph illustrates, within each ethnicity category, the percentage of certified staff is significantly disproportionate to the student population. The ratios of the percent of American Indian, Asian, Black, and Latino/Latina certified staff to students are less than 0.5, while the ratio of Caucasian certified staff to students is over 1.8. It is important to note that the ethnicity of certified staff resembles the current distribution of ethnicity among adults in Seattle, and that there might be a lag time in representation so today’s youth can become adults and possibly teachers. While precisely matching student and teacher ethnicities would be difficult and not necessarily an appropriate goal, working to reduce the current disparity does seem desirable.
Linkages Having teachers with whom students are able to see themselves reflected is likely to have tremendous impact on students’ well-being and self esteem. This can lead to higher retention rates and increases in the percentage of graduates from high school. Quality experiences with people of different ethnicities will also help reduce prejudice and racism. Positive educational environments can be linked to higher adult literacy rates, increased
community participation, voting, volunteering, and lead to decreased crime and lower unemployment rates.
Teaching Staff Diversity Compared to Student Diversity
-
0.5
1.0
1.5
2.0
2.5
1993 1994 1995 1996 1997
Rat
io o
f Sta
ff R
epre
sent
atio
n to
St
uden
t Rep
rese
ntat
ion
American Indian Asian Black Latino Caucasian
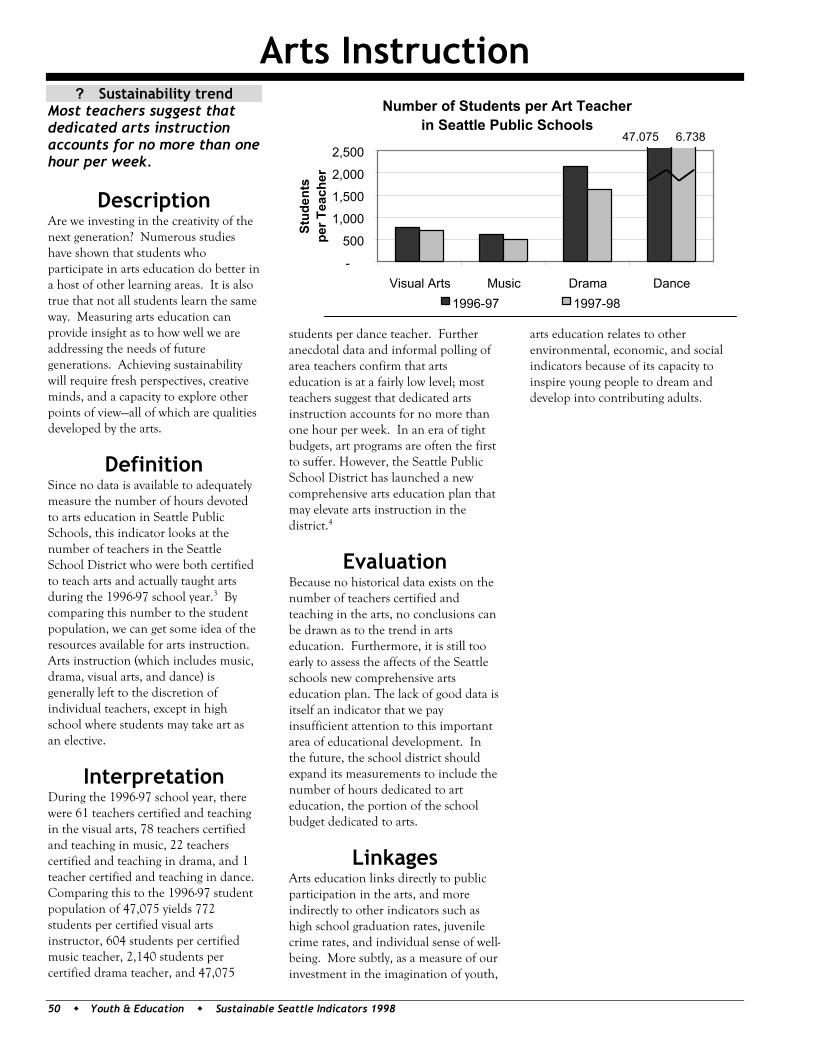
Arts Instruction
50 Youth & Education Sustainable Seattle Indicators 1998
? Sustainability trend Most teachers suggest that dedicated arts instruction accounts for no more than one hour per week.
Description Are we investing in the creativity of the next generation? Numerous studies have shown that students who participate in arts education do better in a host of other learning areas. It is also true that not all students learn the same way. Measuring arts education can provide insight as to how well we are addressing the needs of future generations. Achieving sustainability will require fresh perspectives, creative minds, and a capacity to explore other points of view—all of which are qualities developed by the arts.
Definition Since no data is available to adequately measure the number of hours devoted to arts education in Seattle Public Schools, this indicator looks at the number of teachers in the Seattle School District who were both certified to teach arts and actually taught arts during the 1996-97 school year.3 By comparing this number to the student population, we can get some idea of the resources available for arts instruction. Arts instruction (which includes music, drama, visual arts, and dance) is generally left to the discretion of individual teachers, except in high school where students may take art as an elective.
Interpretation During the 1996-97 school year, there were 61 teachers certified and teaching in the visual arts, 78 teachers certified and teaching in music, 22 teachers certified and teaching in drama, and 1 teacher certified and teaching in dance. Comparing this to the 1996-97 student population of 47,075 yields 772 students per certified visual arts instructor, 604 students per certified music teacher, 2,140 students per certified drama teacher, and 47,075
students per dance teacher. Further anecdotal data and informal polling of area teachers confirm that arts education is at a fairly low level; most teachers suggest that dedicated arts instruction accounts for no more than one hour per week. In an era of tight budgets, art programs are often the first to suffer. However, the Seattle Public School District has launched a new comprehensive arts education plan that may elevate arts instruction in the district.4
Evaluation Because no historical data exists on the number of teachers certified and teaching in the arts, no conclusions can be drawn as to the trend in arts education. Furthermore, it is still too early to assess the affects of the Seattle schools new comprehensive arts education plan. The lack of good data is itself an indicator that we pay insufficient attention to this important area of educational development. In the future, the school district should expand its measurements to include the number of hours dedicated to art education, the portion of the school budget dedicated to arts.
Linkages Arts education links directly to public participation in the arts, and more indirectly to other indicators such as high school graduation rates, juvenile crime rates, and individual sense of well-being. More subtly, as a measure of our investment in the imagination of youth,
arts education relates to other environmental, economic, and social indicators because of its capacity to inspire young people to dream and develop into contributing adults.
Number of Students per Art Teacher in Seattle Public Schools
-
500
1,000
1,500
2,000
2,500
Visual Arts Music Drama DanceSt
uden
ts
per T
each
er1996-97 1997-98
6,73847,075
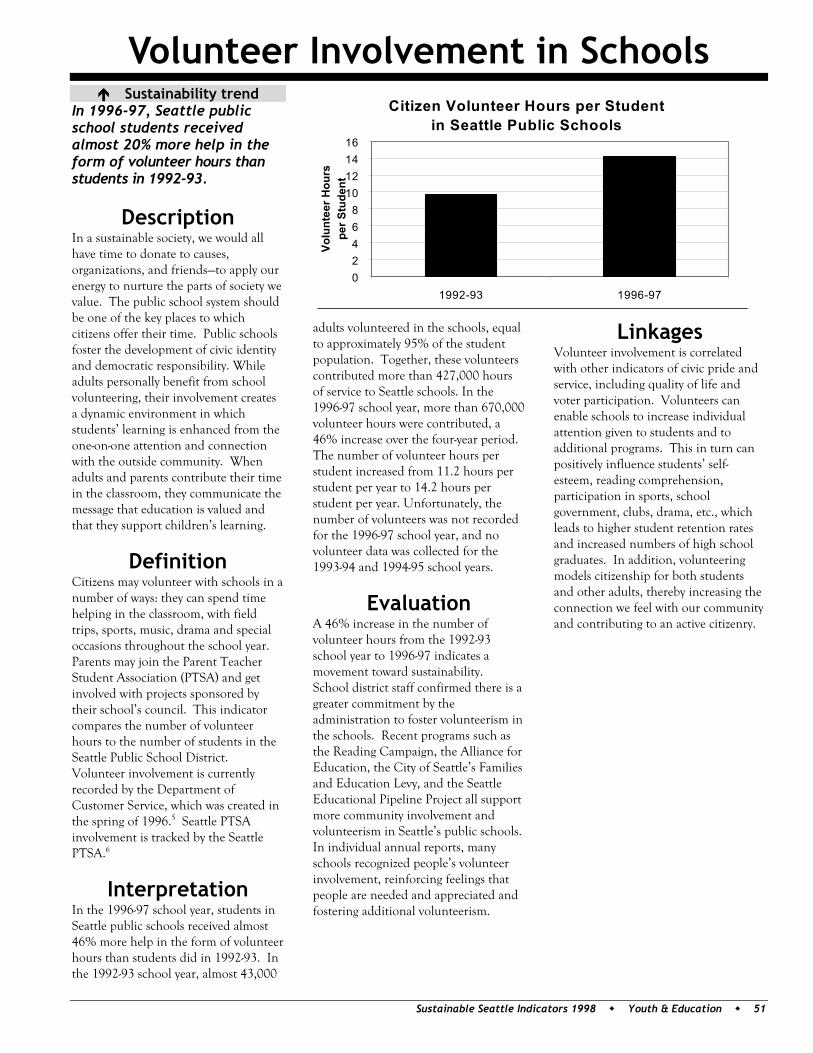
Volunteer Involvement in Schools
Sustainable Seattle Indicators 1998 Youth & Education 51
Sustainability trend In 1996-97, Seattle public school students received almost 20% more help in the form of volunteer hours than students in 1992-93.
Description In a sustainable society, we would all have time to donate to causes, organizations, and friends—to apply our energy to nurture the parts of society we value. The public school system should be one of the key places to which citizens offer their time. Public schools foster the development of civic identity and democratic responsibility. While adults personally benefit from school volunteering, their involvement creates a dynamic environment in which students’ learning is enhanced from the one-on-one attention and connection with the outside community. When adults and parents contribute their time in the classroom, they communicate the message that education is valued and that they support children’s learning.
Definition Citizens may volunteer with schools in a number of ways: they can spend time helping in the classroom, with field trips, sports, music, drama and special occasions throughout the school year. Parents may join the Parent Teacher Student Association (PTSA) and get involved with projects sponsored by their school’s council. This indicator compares the number of volunteer hours to the number of students in the Seattle Public School District. Volunteer involvement is currently recorded by the Department of Customer Service, which was created in the spring of 1996.5 Seattle PTSA involvement is tracked by the Seattle PTSA.6
Interpretation In the 1996-97 school year, students in Seattle public schools received almost 46% more help in the form of volunteer hours than students did in 1992-93. In the 1992-93 school year, almost 43,000
adults volunteered in the schools, equal to approximately 95% of the student population. Together, these volunteers contributed more than 427,000 hours of service to Seattle schools. In the 1996-97 school year, more than 670,000 volunteer hours were contributed, a 46% increase over the four-year period. The number of volunteer hours per student increased from 11.2 hours per student per year to 14.2 hours per student per year. Unfortunately, the number of volunteers was not recorded for the 1996-97 school year, and no volunteer data was collected for the 1993-94 and 1994-95 school years.
Evaluation A 46% increase in the number of volunteer hours from the 1992-93 school year to 1996-97 indicates a movement toward sustainability. School district staff confirmed there is a greater commitment by the administration to foster volunteerism in the schools. Recent programs such as the Reading Campaign, the Alliance for Education, the City of Seattle’s Families and Education Levy, and the Seattle Educational Pipeline Project all support more community involvement and volunteerism in Seattle’s public schools. In individual annual reports, many schools recognized people’s volunteer involvement, reinforcing feelings that people are needed and appreciated and fostering additional volunteerism.
Linkages Volunteer involvement is correlated with other indicators of civic pride and service, including quality of life and voter participation. Volunteers can enable schools to increase individual attention given to students and to additional programs. This in turn can positively influence students’ self-esteem, reading comprehension, participation in sports, school government, clubs, drama, etc., which leads to higher student retention rates and increased numbers of high school graduates. In addition, volunteering models citizenship for both students and other adults, thereby increasing the connection we feel with our community and contributing to an active citizenry.
Citizen Volunteer Hours per Studentin Seattle Public Schools
02468
10121416
1992-93 1996-97
Volu
ntee
r Hou
rs
per S
tude
nt
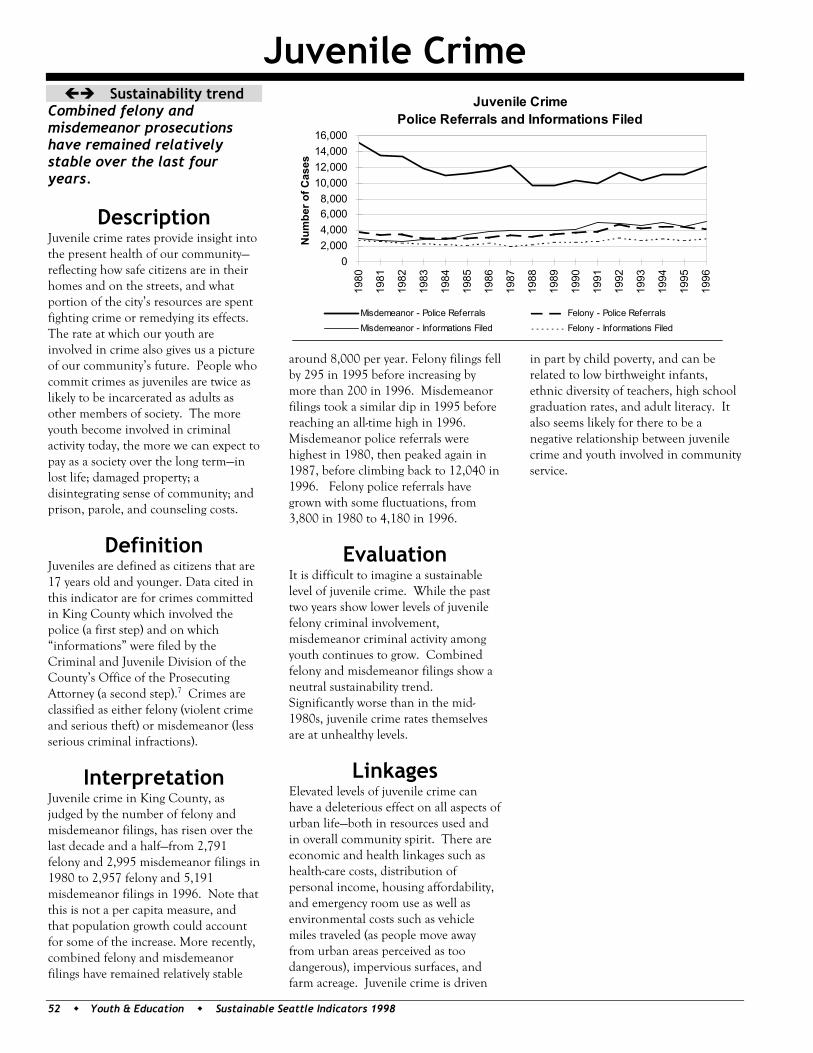
Juvenile Crime
52 Youth & Education Sustainable Seattle Indicators 1998
Sustainability trend Combined felony and misdemeanor prosecutions have remained relatively stable over the last four years.
Description Juvenile crime rates provide insight into the present health of our community—reflecting how safe citizens are in their homes and on the streets, and what portion of the city’s resources are spent fighting crime or remedying its effects. The rate at which our youth are involved in crime also gives us a picture of our community’s future. People who commit crimes as juveniles are twice as likely to be incarcerated as adults as other members of society. The more youth become involved in criminal activity today, the more we can expect to pay as a society over the long term—in lost life; damaged property; a disintegrating sense of community; and prison, parole, and counseling costs.
Definition Juveniles are defined as citizens that are 17 years old and younger. Data cited in this indicator are for crimes committed in King County which involved the police (a first step) and on which “informations” were filed by the Criminal and Juvenile Division of the County’s Office of the Prosecuting Attorney (a second step).7 Crimes are classified as either felony (violent crime and serious theft) or misdemeanor (less serious criminal infractions).
Interpretation Juvenile crime in King County, as judged by the number of felony and misdemeanor filings, has risen over the last decade and a half—from 2,791 felony and 2,995 misdemeanor filings in 1980 to 2,957 felony and 5,191 misdemeanor filings in 1996. Note that this is not a per capita measure, and that population growth could account for some of the increase. More recently, combined felony and misdemeanor filings have remained relatively stable
around 8,000 per year. Felony filings fell by 295 in 1995 before increasing by more than 200 in 1996. Misdemeanor filings took a similar dip in 1995 before reaching an all-time high in 1996. Misdemeanor police referrals were highest in 1980, then peaked again in 1987, before climbing back to 12,040 in 1996. Felony police referrals have grown with some fluctuations, from 3,800 in 1980 to 4,180 in 1996.
Evaluation It is difficult to imagine a sustainable level of juvenile crime. While the past two years show lower levels of juvenile felony criminal involvement, misdemeanor criminal activity among youth continues to grow. Combined felony and misdemeanor filings show a neutral sustainability trend. Significantly worse than in the mid-1980s, juvenile crime rates themselves are at unhealthy levels.
Linkages Elevated levels of juvenile crime can have a deleterious effect on all aspects of urban life—both in resources used and in overall community spirit. There are economic and health linkages such as health-care costs, distribution of personal income, housing affordability, and emergency room use as well as environmental costs such as vehicle miles traveled (as people move away from urban areas perceived as too dangerous), impervious surfaces, and farm acreage. Juvenile crime is driven
in part by child poverty, and can be related to low birthweight infants, ethnic diversity of teachers, high school graduation rates, and adult literacy. It also seems likely for there to be a negative relationship between juvenile crime and youth involved in community service.
Juvenile Crime Police Referrals and Informations Filed
02,0004,0006,0008,000
10,00012,00014,00016,000
1980
1981
1982
1983
1984
1985
1986
1987
1988
1989
1990
1991
1992
1993
1994
1995
1996
Num
ber o
f Cas
esMisdemeanor - Police Referrals Felony - Police ReferralsMisdemeanor - Informations Filed Felony - Informations Filed
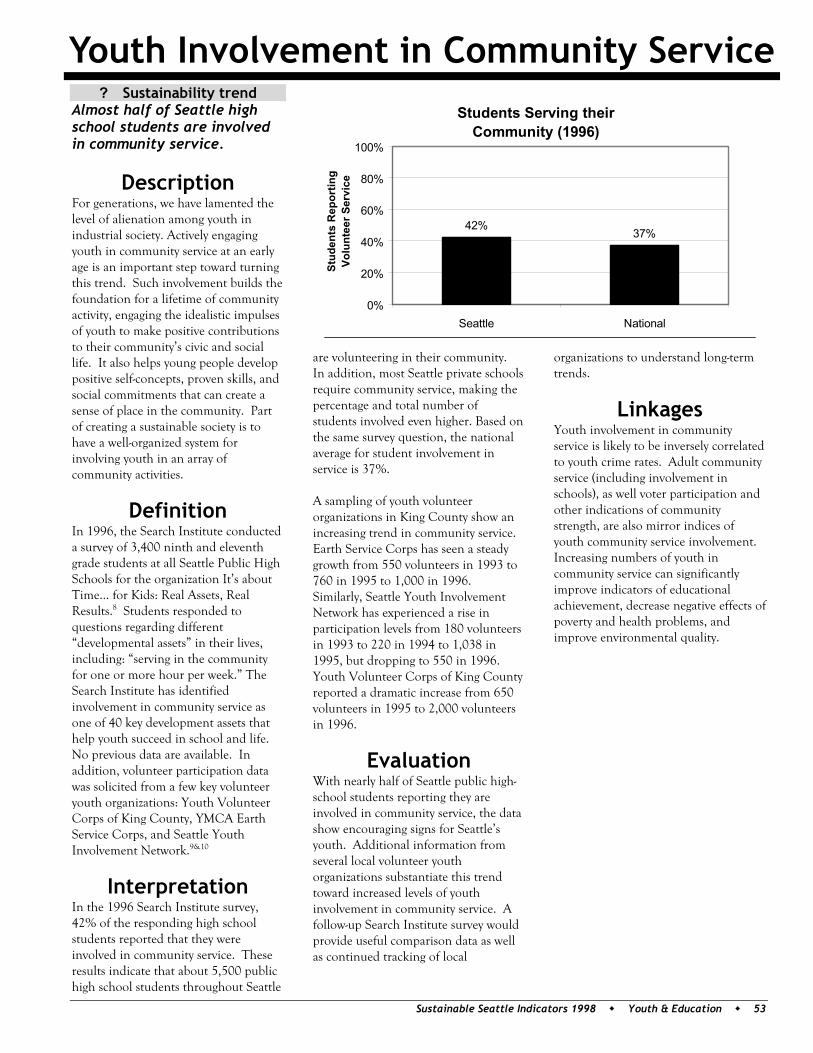
Youth Involvement in Community Service
Sustainable Seattle Indicators 1998 Youth & Education 53
? Sustainability trend Almost half of Seattle high school students are involved in community service.
Description For generations, we have lamented the level of alienation among youth in industrial society. Actively engaging youth in community service at an early age is an important step toward turning this trend. Such involvement builds the foundation for a lifetime of community activity, engaging the idealistic impulses of youth to make positive contributions to their community’s civic and social life. It also helps young people develop positive self-concepts, proven skills, and social commitments that can create a sense of place in the community. Part of creating a sustainable society is to have a well-organized system for involving youth in an array of community activities.
Definition In 1996, the Search Institute conducted a survey of 3,400 ninth and eleventh grade students at all Seattle Public High Schools for the organization It’s about Time... for Kids: Real Assets, Real Results.8 Students responded to questions regarding different “developmental assets” in their lives, including: “serving in the community for one or more hour per week.” The Search Institute has identified involvement in community service as one of 40 key development assets that help youth succeed in school and life. No previous data are available. In addition, volunteer participation data was solicited from a few key volunteer youth organizations: Youth Volunteer Corps of King County, YMCA Earth Service Corps, and Seattle Youth Involvement Network.9&10
Interpretation In the 1996 Search Institute survey, 42% of the responding high school students reported that they were involved in community service. These results indicate that about 5,500 public high school students throughout Seattle
are volunteering in their community. In addition, most Seattle private schools require community service, making the percentage and total number of students involved even higher. Based on the same survey question, the national average for student involvement in service is 37%. A sampling of youth volunteer organizations in King County show an increasing trend in community service. Earth Service Corps has seen a steady growth from 550 volunteers in 1993 to 760 in 1995 to 1,000 in 1996. Similarly, Seattle Youth Involvement Network has experienced a rise in participation levels from 180 volunteers in 1993 to 220 in 1994 to 1,038 in 1995, but dropping to 550 in 1996. Youth Volunteer Corps of King County reported a dramatic increase from 650 volunteers in 1995 to 2,000 volunteers in 1996.
Evaluation With nearly half of Seattle public high-school students reporting they are involved in community service, the data show encouraging signs for Seattle’s youth. Additional information from several local volunteer youth organizations substantiate this trend toward increased levels of youth involvement in community service. A follow-up Search Institute survey would provide useful comparison data as well as continued tracking of local
organizations to understand long-term trends.
Linkages Youth involvement in community service is likely to be inversely correlated to youth crime rates. Adult community service (including involvement in schools), as well voter participation and other indications of community strength, are also mirror indices of youth community service involvement. Increasing numbers of youth in community service can significantly improve indicators of educational achievement, decrease negative effects of poverty and health problems, and improve environmental quality.
Students Serving their Community (1996)
42%37%
0%
20%
40%
60%
80%
100%
Seattle NationalSt
uden
ts R
epor
ting
Volu
ntee
r Ser
vice
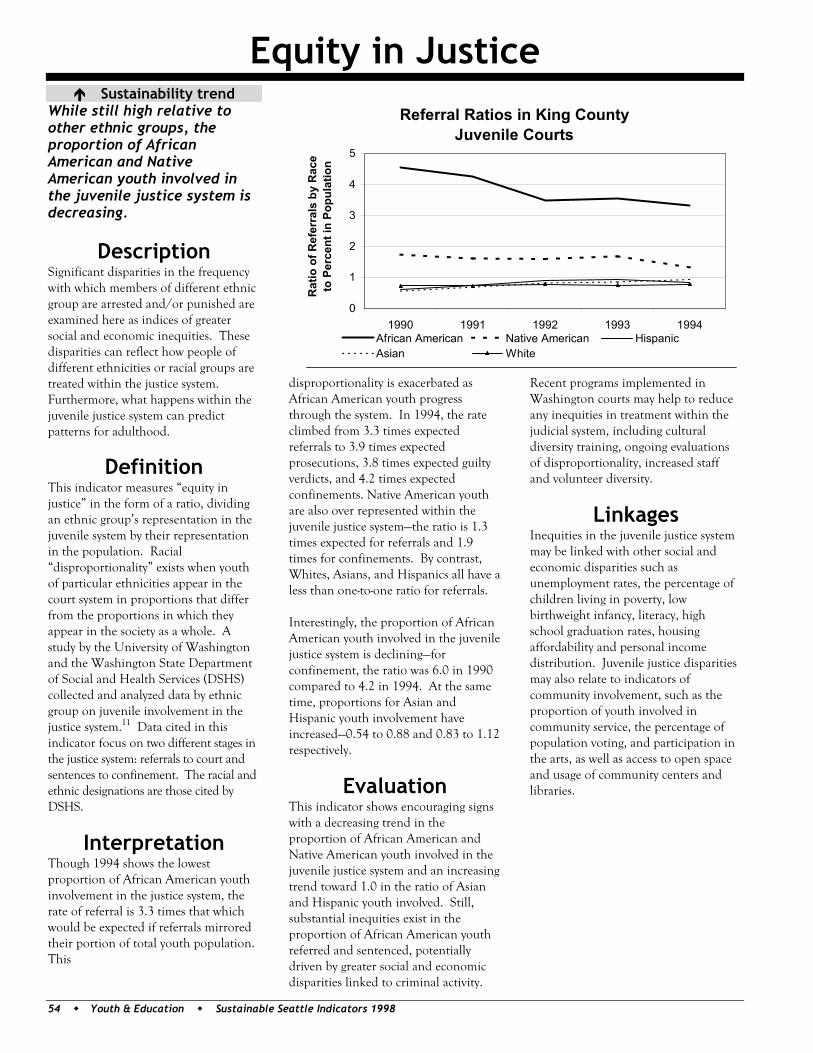
Equity in Justice
54 Youth & Education Sustainable Seattle Indicators 1998
Sustainability trend While still high relative to other ethnic groups, the proportion of African American and Native American youth involved in the juvenile justice system is decreasing.
Description Significant disparities in the frequency with which members of different ethnic group are arrested and/or punished are examined here as indices of greater social and economic inequities. These disparities can reflect how people of different ethnicities or racial groups are treated within the justice system. Furthermore, what happens within the juvenile justice system can predict patterns for adulthood.
Definition This indicator measures “equity in justice” in the form of a ratio, dividing an ethnic group’s representation in the juvenile system by their representation in the population. Racial “disproportionality” exists when youth of particular ethnicities appear in the court system in proportions that differ from the proportions in which they appear in the society as a whole. A study by the University of Washington and the Washington State Department of Social and Health Services (DSHS) collected and analyzed data by ethnic group on juvenile involvement in the justice system.11 Data cited in this indicator focus on two different stages in the justice system: referrals to court and sentences to confinement. The racial and ethnic designations are those cited by DSHS.
Interpretation Though 1994 shows the lowest proportion of African American youth involvement in the justice system, the rate of referral is 3.3 times that which would be expected if referrals mirrored their portion of total youth population. This
disproportionality is exacerbated as African American youth progress through the system. In 1994, the rate climbed from 3.3 times expected referrals to 3.9 times expected prosecutions, 3.8 times expected guilty verdicts, and 4.2 times expected confinements. Native American youth are also over represented within the juvenile justice system—the ratio is 1.3 times expected for referrals and 1.9 times for confinements. By contrast, Whites, Asians, and Hispanics all have a less than one-to-one ratio for referrals. Interestingly, the proportion of African American youth involved in the juvenile justice system is declining—for confinement, the ratio was 6.0 in 1990 compared to 4.2 in 1994. At the same time, proportions for Asian and Hispanic youth involvement have increased—0.54 to 0.88 and 0.83 to 1.12 respectively.
Evaluation This indicator shows encouraging signs with a decreasing trend in the proportion of African American and Native American youth involved in the juvenile justice system and an increasing trend toward 1.0 in the ratio of Asian and Hispanic youth involved. Still, substantial inequities exist in the proportion of African American youth referred and sentenced, potentially driven by greater social and economic disparities linked to criminal activity.
Recent programs implemented in Washington courts may help to reduce any inequities in treatment within the judicial system, including cultural diversity training, ongoing evaluations of disproportionality, increased staff and volunteer diversity.
Linkages Inequities in the juvenile justice system may be linked with other social and economic disparities such as unemployment rates, the percentage of children living in poverty, low birthweight infancy, literacy, high school graduation rates, housing affordability and personal income distribution. Juvenile justice disparities may also relate to indicators of community involvement, such as the proportion of youth involved in community service, the percentage of population voting, and participation in the arts, as well as access to open space and usage of community centers and libraries.
Referral Ratios in King County Juvenile Courts
0
1
2
3
4
5
1990 1991 1992 1993 1994R
atio
of R
efer
rals
by
Rac
e to
Per
cent
in P
opul
atio
nAfrican American Native American HispanicAsian White
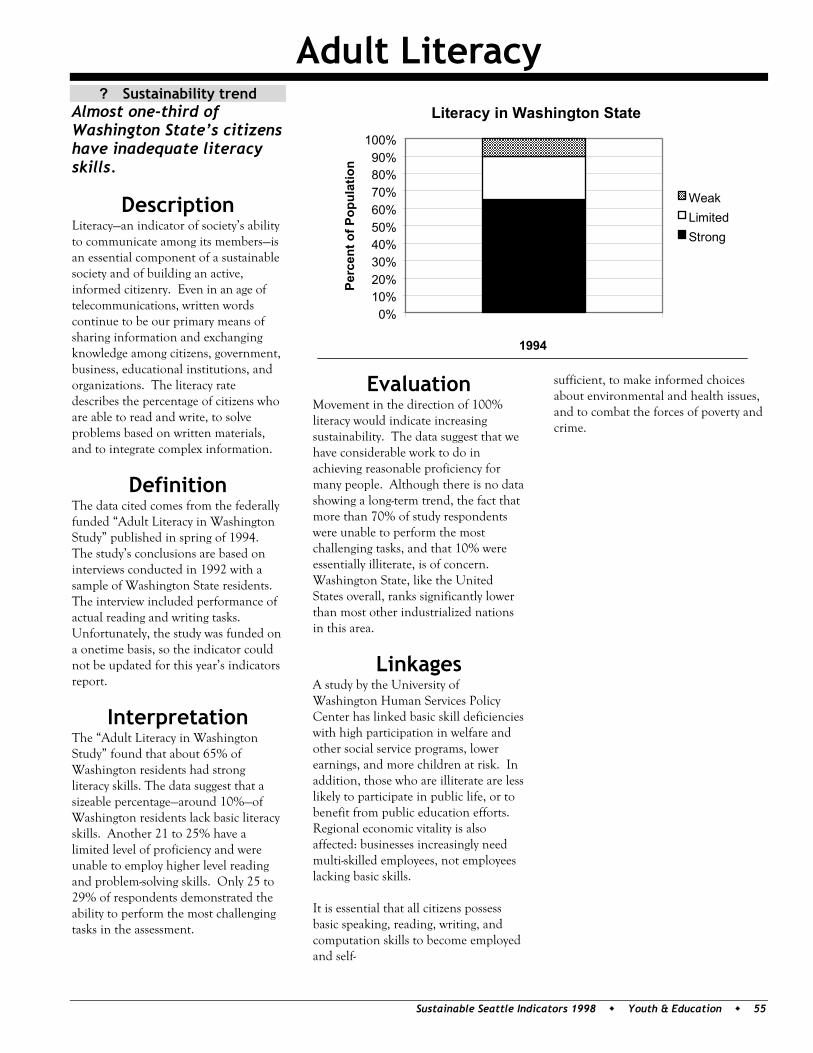
Adult Literacy
Sustainable Seattle Indicators 1998 Youth & Education 55
? Sustainability trend Almost one-third of Washington State’s citizens have inadequate literacy skills.
Description Literacy—an indicator of society’s ability to communicate among its members—is an essential component of a sustainable society and of building an active, informed citizenry. Even in an age of telecommunications, written words continue to be our primary means of sharing information and exchanging knowledge among citizens, government, business, educational institutions, and organizations. The literacy rate describes the percentage of citizens who are able to read and write, to solve problems based on written materials, and to integrate complex information.
Definition The data cited comes from the federally funded “Adult Literacy in Washington Study” published in spring of 1994. The study’s conclusions are based on interviews conducted in 1992 with a sample of Washington State residents. The interview included performance of actual reading and writing tasks. Unfortunately, the study was funded on a onetime basis, so the indicator could not be updated for this year’s indicators report.
Interpretation The “Adult Literacy in Washington Study” found that about 65% of Washington residents had strong literacy skills. The data suggest that a sizeable percentage—around 10%—of Washington residents lack basic literacy skills. Another 21 to 25% have a limited level of proficiency and were unable to employ higher level reading and problem-solving skills. Only 25 to 29% of respondents demonstrated the ability to perform the most challenging tasks in the assessment.
Evaluation Movement in the direction of 100% literacy would indicate increasing sustainability. The data suggest that we have considerable work to do in achieving reasonable proficiency for many people. Although there is no data showing a long-term trend, the fact that more than 70% of study respondents were unable to perform the most challenging tasks, and that 10% were essentially illiterate, is of concern. Washington State, like the United States overall, ranks significantly lower than most other industrialized nations in this area.
Linkages A study by the University of Washington Human Services Policy Center has linked basic skill deficiencies with high participation in welfare and other social service programs, lower earnings, and more children at risk. In addition, those who are illiterate are less likely to participate in public life, or to benefit from public education efforts. Regional economic vitality is also affected: businesses increasingly need multi-skilled employees, not employees lacking basic skills. It is essential that all citizens possess basic speaking, reading, writing, and computation skills to become employed and self-
sufficient, to make informed choices about environmental and health issues, and to combat the forces of poverty and crime.
Literacy in Washington State
0%10%20%30%40%50%60%70%80%90%
100%
11994Pe
rcen
t of P
opul
atio
n
WeakLimitedStrong

56 Youth & Education Sustainable Seattle Indicators 1998
Youth and Education Notes 1 Student Information Services Office, Seattle Public School District. Data Profile: District Summary—November 1996. (Seattle, WA: 1996) p. 129. 2 Ethnic breakdown of students and staff in 1996-97 school year from Seattle Public School District, The Seattle Public Schools At-a-Glance, 1997 Facts and Figures. (Seattle, WA: 1997). Ethnic breakdown of staff in 1995-96 school year from Seattle Public School District, Sealth Annual Report. (Seattle, WA: 1997) p.2. Ethnic breakdown of students from 1992-93 to 1994-95 from Seattle Public School District, District Summary Report, 1995. (Seattle, WA: 1995) p. 7. Ethnic breakdown of teachers, 1992-93 to 1994-95 from Susan Fong of Personal Data Services, private communication, January 5, 1998. 3 List of certified arts staff in 1996-97 school year. Special tabulation provided by Lael Williams, Visual and Performing Arts Manager, Seattle Public School District, July 15, 1997. 4 Lael Williams, Visual and Performing Arts Manager, Seattle Public School District, private communication, May 27, 1997. 5Number of district volunteers and volunteer hours provided by Sue Beyers, Customer Service Department, Seattle Public Schools, private communication, July 31, 1997. 6 Becky Lilley, Seattle Council of PTSA, private communication, November 19, 1997. 7 Nancy Wilson, King County Office of the Prosecuting Attorney, private communication, August 1997. 8 Peter Benson, Dale Blyth, Craig Deville, and Jean Wachs, Developmental Assets Among Seattle Youth (Minneapolis, MN: Search Institute, April 1997). 9 Jamie Flaxman, Seattle Youth Involvement Network, private communication, April 1997. 10 David Kelly-Hedrick, King County Youth Volunteer Corps, private communication, April 1997. 11 Bridges, George S. Racial Disprportionality in County Juvenile Facilities. Conducted for the Department of Social and Health Services (Olympia, WA: July 1995).
C o m m u n i t y
H e a l t h &

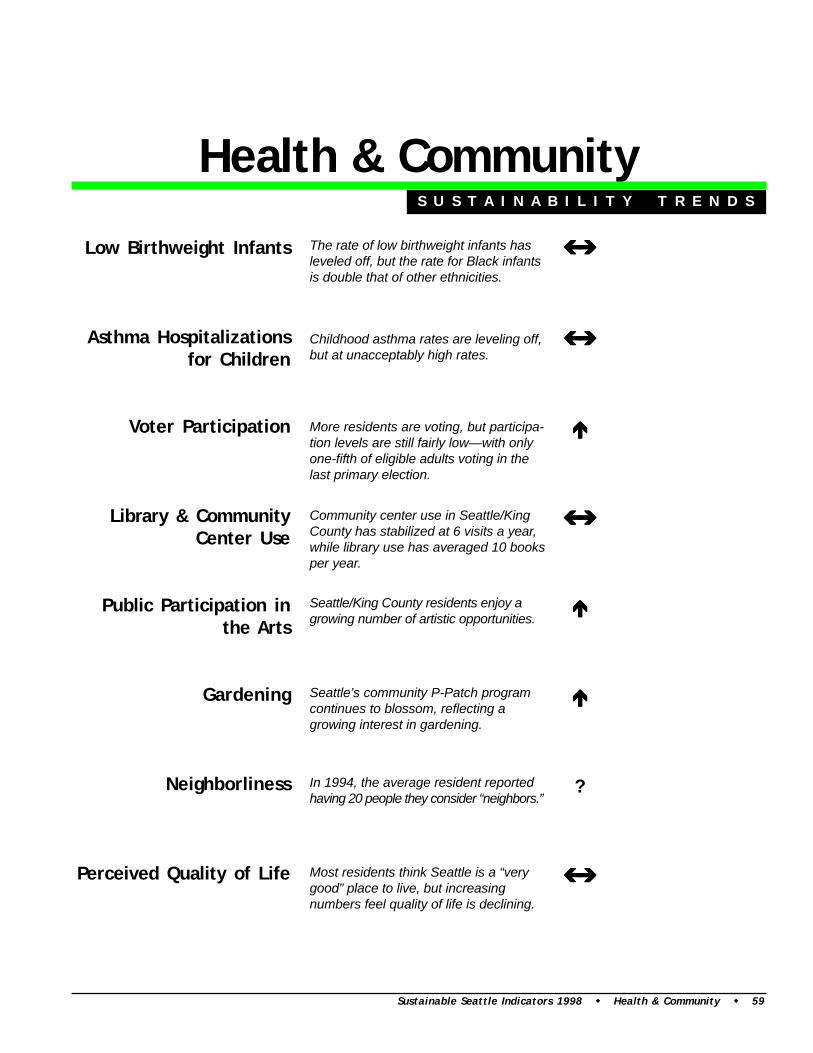
Health & Community
Low Birthweight Infants
Asthma Hospitalizationsfor Children
Voter Participation
Library & CommunityCenter Use
Public Participation inthe Arts
Gardening
Neighborliness
Perceived Quality of Life
?
S U S T A I N A B I L I T Y T R E N D S
The rate of low birthweight infants hasleveled off, but the rate for Black infantsis double that of other ethnicities.
Childhood asthma rates are leveling off,but at unacceptably high rates.
More residents are voting, but participa-tion levels are still fairly low—with onlyone-fifth of eligible adults voting in thelast primary election.
Most residents think Seattle is a “verygood” place to live, but increasingnumbers feel quality of life is declining.
In 1994, the average resident reportedhaving 20 people they consider “neighbors.”
Seattle’s community P-Patch programcontinues to blossom, reflecting agrowing interest in gardening.
Seattle/King County residents enjoy agrowing number of artistic opportunities.
Community center use in Seattle/KingCounty has stabilized at 6 visits a year,while library use has averaged 10 booksper year.
Sustainable Seattle Indicators 1998 Health & Community 59
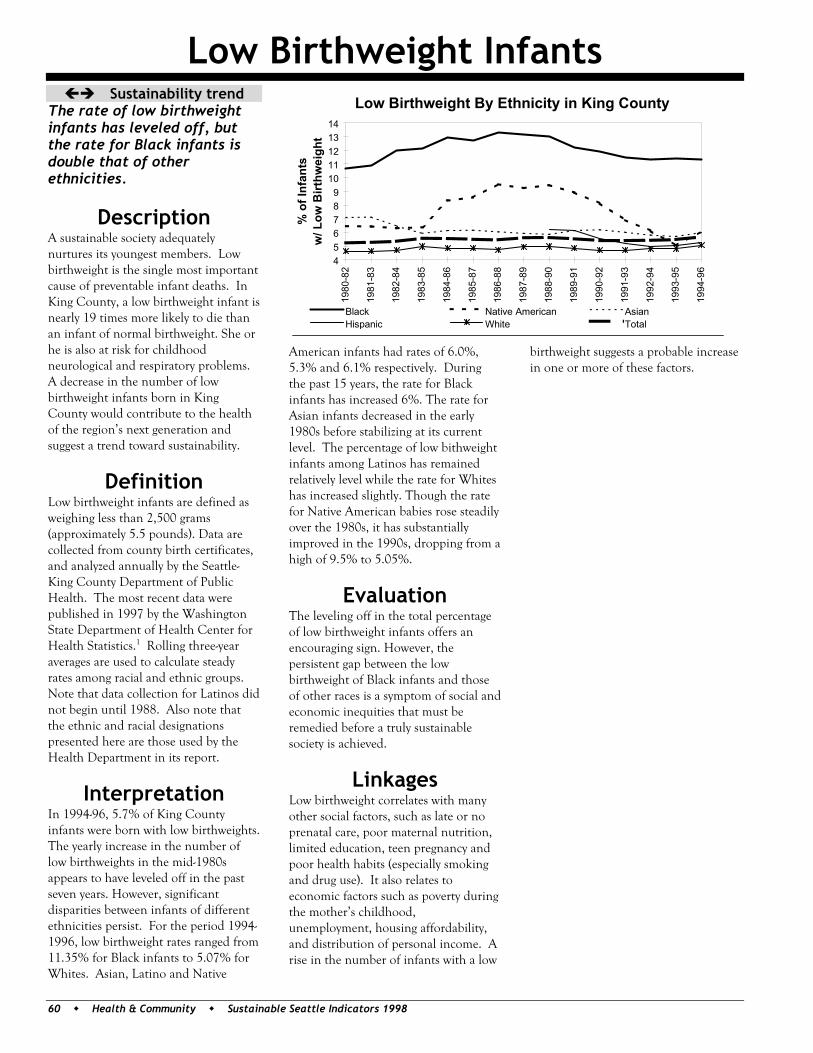
Low Birthweight Infants
60 Health & Community Sustainable Seattle Indicators 1998
Sustainability trend The rate of low birthweight infants has leveled off, but the rate for Black infants is double that of other ethnicities.
Description A sustainable society adequately nurtures its youngest members. Low birthweight is the single most important cause of preventable infant deaths. In King County, a low birthweight infant is nearly 19 times more likely to die than an infant of normal birthweight. She or he is also at risk for childhood neurological and respiratory problems. A decrease in the number of low birthweight infants born in King County would contribute to the health of the region’s next generation and suggest a trend toward sustainability.
Definition Low birthweight infants are defined as weighing less than 2,500 grams (approximately 5.5 pounds). Data are collected from county birth certificates, and analyzed annually by the Seattle-King County Department of Public Health. The most recent data were published in 1997 by the Washington State Department of Health Center for Health Statistics.1 Rolling three-year averages are used to calculate steady rates among racial and ethnic groups. Note that data collection for Latinos did not begin until 1988. Also note that the ethnic and racial designations presented here are those used by the Health Department in its report.
Interpretation In 1994-96, 5.7% of King County infants were born with low birthweights. The yearly increase in the number of low birthweights in the mid-1980s appears to have leveled off in the past seven years. However, significant disparities between infants of different ethnicities persist. For the period 1994-1996, low birthweight rates ranged from 11.35% for Black infants to 5.07% for Whites. Asian, Latino and Native
American infants had rates of 6.0%, 5.3% and 6.1% respectively. During the past 15 years, the rate for Black infants has increased 6%. The rate for Asian infants decreased in the early 1980s before stabilizing at its current level. The percentage of low bithweight infants among Latinos has remained relatively level while the rate for Whites has increased slightly. Though the rate for Native American babies rose steadily over the 1980s, it has substantially improved in the 1990s, dropping from a high of 9.5% to 5.05%.
Evaluation The leveling off in the total percentage of low birthweight infants offers an encouraging sign. However, the persistent gap between the low birthweight of Black infants and those of other races is a symptom of social and economic inequities that must be remedied before a truly sustainable society is achieved.
Linkages Low birthweight correlates with many other social factors, such as late or no prenatal care, poor maternal nutrition, limited education, teen pregnancy and poor health habits (especially smoking and drug use). It also relates to economic factors such as poverty during the mother’s childhood, unemployment, housing affordability, and distribution of personal income. A rise in the number of infants with a low
birthweight suggests a probable increase in one or more of these factors.
Low Birthweight By Ethnicity in King County
456789
1011121314
1980
-82
1981
-83
1982
-84
1983
-85
1984
-86
1985
-87
1986
-88
1987
-89
1988
-90
1989
-91
1990
-92
1991
-93
1992
-94
1993
-95
1994
-96
% o
f Inf
ants
w/ L
ow B
irthw
eigh
tBlack Native American AsianHispanic White Total
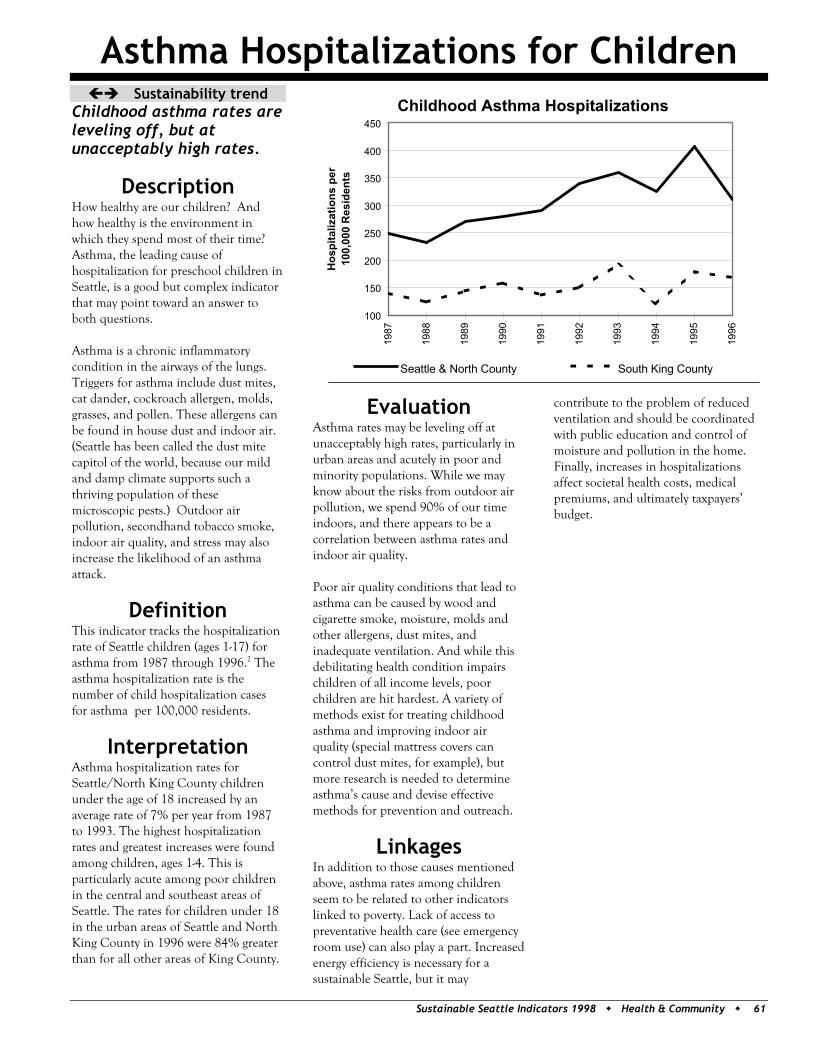
Asthma Hospitalizations for Children
Sustainable Seattle Indicators 1998 Health & Community 61
Sustainability trend Childhood asthma rates are leveling off, but at unacceptably high rates.
Description How healthy are our children? And how healthy is the environment in which they spend most of their time? Asthma, the leading cause of hospitalization for preschool children in Seattle, is a good but complex indicator that may point toward an answer to both questions. Asthma is a chronic inflammatory condition in the airways of the lungs. Triggers for asthma include dust mites, cat dander, cockroach allergen, molds, grasses, and pollen. These allergens can be found in house dust and indoor air. (Seattle has been called the dust mite capitol of the world, because our mild and damp climate supports such a thriving population of these microscopic pests.) Outdoor air pollution, secondhand tobacco smoke, indoor air quality, and stress may also increase the likelihood of an asthma attack.
Definition This indicator tracks the hospitalization rate of Seattle children (ages 1-17) for asthma from 1987 through 1996.2 The asthma hospitalization rate is the number of child hospitalization cases for asthma per 100,000 residents.
Interpretation Asthma hospitalization rates for Seattle/North King County children under the age of 18 increased by an average rate of 7% per year from 1987 to 1993. The highest hospitalization rates and greatest increases were found among children, ages 1-4. This is particularly acute among poor children in the central and southeast areas of Seattle. The rates for children under 18 in the urban areas of Seattle and North King County in 1996 were 84% greater than for all other areas of King County.
Evaluation Asthma rates may be leveling off at unacceptably high rates, particularly in urban areas and acutely in poor and minority populations. While we may know about the risks from outdoor air pollution, we spend 90% of our time indoors, and there appears to be a correlation between asthma rates and indoor air quality. Poor air quality conditions that lead to asthma can be caused by wood and cigarette smoke, moisture, molds and other allergens, dust mites, and inadequate ventilation. And while this debilitating health condition impairs children of all income levels, poor children are hit hardest. A variety of methods exist for treating childhood asthma and improving indoor air quality (special mattress covers can control dust mites, for example), but more research is needed to determine asthma’s cause and devise effective methods for prevention and outreach.
Linkages In addition to those causes mentioned above, asthma rates among children seem to be related to other indicators linked to poverty. Lack of access to preventative health care (see emergency room use) can also play a part. Increased energy efficiency is necessary for a sustainable Seattle, but it may
contribute to the problem of reduced ventilation and should be coordinated with public education and control of moisture and pollution in the home. Finally, increases in hospitalizations affect societal health costs, medical premiums, and ultimately taxpayers’ budget.
Childhood Asthma Hospitalizations
100
150
200
250
300
350
400
450
1987
1988
1989
1990
1991
1992
1993
1994
1995
1996
Hos
pita
lizat
ions
per
10
0,00
0 R
esid
ents
Seattle & North County South King County
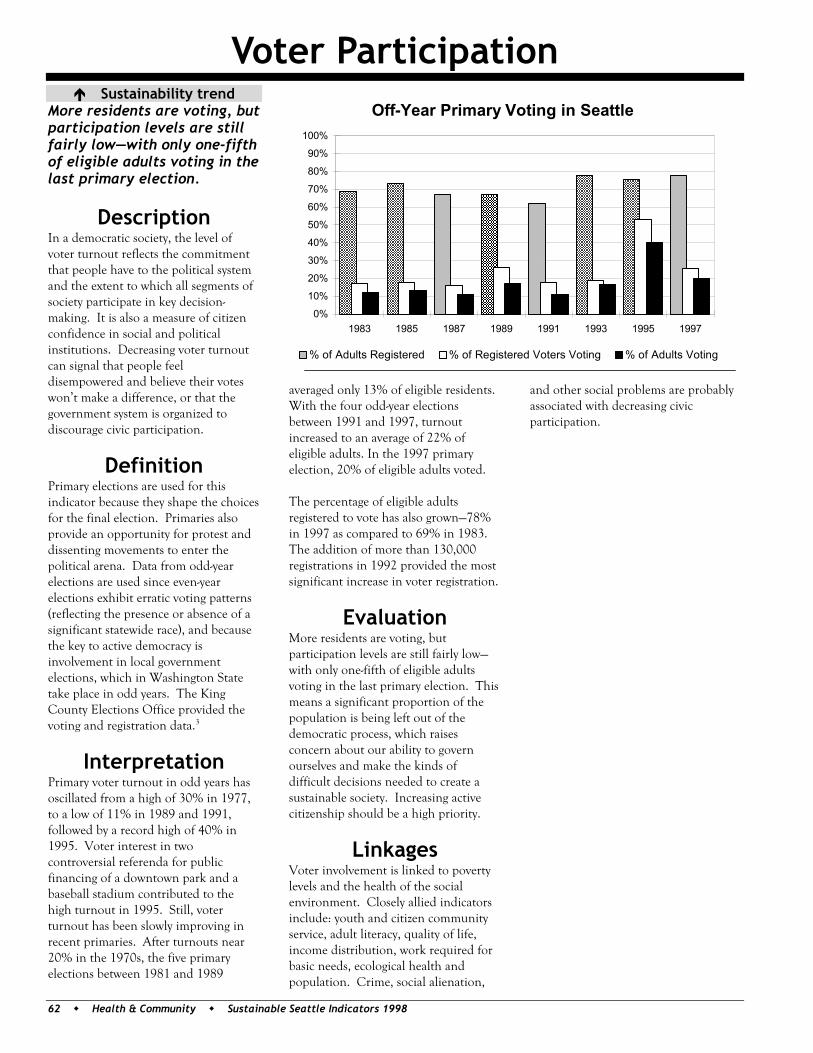
Voter Participation
62 Health & Community Sustainable Seattle Indicators 1998
Sustainability trend More residents are voting, but participation levels are still fairly low—with only one-fifth of eligible adults voting in the last primary election.
Description In a democratic society, the level of voter turnout reflects the commitment that people have to the political system and the extent to which all segments of society participate in key decision-making. It is also a measure of citizen confidence in social and political institutions. Decreasing voter turnout can signal that people feel disempowered and believe their votes won’t make a difference, or that the government system is organized to discourage civic participation.
Definition Primary elections are used for this indicator because they shape the choices for the final election. Primaries also provide an opportunity for protest and dissenting movements to enter the political arena. Data from odd-year elections are used since even-year elections exhibit erratic voting patterns (reflecting the presence or absence of a significant statewide race), and because the key to active democracy is involvement in local government elections, which in Washington State take place in odd years. The King County Elections Office provided the voting and registration data.3
Interpretation Primary voter turnout in odd years has oscillated from a high of 30% in 1977, to a low of 11% in 1989 and 1991, followed by a record high of 40% in 1995. Voter interest in two controversial referenda for public financing of a downtown park and a baseball stadium contributed to the high turnout in 1995. Still, voter turnout has been slowly improving in recent primaries. After turnouts near 20% in the 1970s, the five primary elections between 1981 and 1989
averaged only 13% of eligible residents. With the four odd-year elections between 1991 and 1997, turnout increased to an average of 22% of eligible adults. In the 1997 primary election, 20% of eligible adults voted. The percentage of eligible adults registered to vote has also grown—78% in 1997 as compared to 69% in 1983. The addition of more than 130,000 registrations in 1992 provided the most significant increase in voter registration.
Evaluation More residents are voting, but participation levels are still fairly low—with only one-fifth of eligible adults voting in the last primary election. This means a significant proportion of the population is being left out of the democratic process, which raises concern about our ability to govern ourselves and make the kinds of difficult decisions needed to create a sustainable society. Increasing active citizenship should be a high priority.
Linkages Voter involvement is linked to poverty levels and the health of the social environment. Closely allied indicators include: youth and citizen community service, adult literacy, quality of life, income distribution, work required for basic needs, ecological health and population. Crime, social alienation,
and other social problems are probably associated with decreasing civic participation.
Off-Year Primary Voting in Seattle
0%
10%
20%
30%
40%
50%
60%
70%
80%
90%
100%
1983 1985 1987 1989 1991 1993 1995 1997
% of Adults Registered % of Registered Voters Voting % of Adults Voting
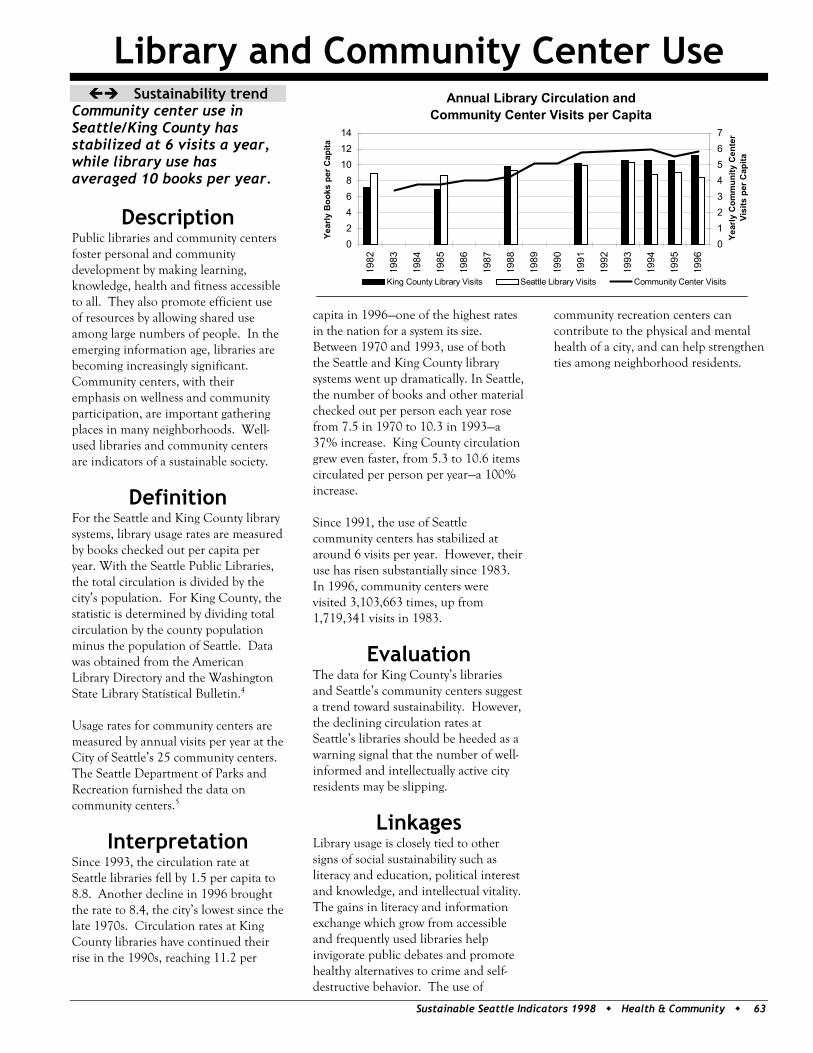
Library and Community Center Use
Sustainable Seattle Indicators 1998 Health & Community 63
Sustainability trend Community center use in Seattle/King County has stabilized at 6 visits a year, while library use has averaged 10 books per year.
Description Public libraries and community centers foster personal and community development by making learning, knowledge, health and fitness accessible to all. They also promote efficient use of resources by allowing shared use among large numbers of people. In the emerging information age, libraries are becoming increasingly significant. Community centers, with their emphasis on wellness and community participation, are important gathering places in many neighborhoods. Well-used libraries and community centers are indicators of a sustainable society.
Definition For the Seattle and King County library systems, library usage rates are measured by books checked out per capita per year. With the Seattle Public Libraries, the total circulation is divided by the city’s population. For King County, the statistic is determined by dividing total circulation by the county population minus the population of Seattle. Data was obtained from the American Library Directory and the Washington State Library Statistical Bulletin.4 Usage rates for community centers are measured by annual visits per year at the City of Seattle’s 25 community centers. The Seattle Department of Parks and Recreation furnished the data on community centers.5
Interpretation Since 1993, the circulation rate at Seattle libraries fell by 1.5 per capita to 8.8. Another decline in 1996 brought the rate to 8.4, the city’s lowest since the late 1970s. Circulation rates at King County libraries have continued their rise in the 1990s, reaching 11.2 per
capita in 1996—one of the highest rates in the nation for a system its size. Between 1970 and 1993, use of both the Seattle and King County library systems went up dramatically. In Seattle, the number of books and other material checked out per person each year rose from 7.5 in 1970 to 10.3 in 1993—a 37% increase. King County circulation grew even faster, from 5.3 to 10.6 items circulated per person per year—a 100% increase. Since 1991, the use of Seattle community centers has stabilized at around 6 visits per year. However, their use has risen substantially since 1983. In 1996, community centers were visited 3,103,663 times, up from 1,719,341 visits in 1983.
Evaluation The data for King County’s libraries and Seattle’s community centers suggest a trend toward sustainability. However, the declining circulation rates at Seattle’s libraries should be heeded as a warning signal that the number of well-informed and intellectually active city residents may be slipping.
Linkages Library usage is closely tied to other signs of social sustainability such as literacy and education, political interest and knowledge, and intellectual vitality. The gains in literacy and information exchange which grow from accessible and frequently used libraries help invigorate public debates and promote healthy alternatives to crime and self-destructive behavior. The use of
community recreation centers can contribute to the physical and mental health of a city, and can help strengthen ties among neighborhood residents.
Annual Library Circulation and Community Center Visits per Capita
02468
101214
1982
1983
1984
1985
1986
1987
1988
1989
1990
1991
1992
1993
1994
1995
1996
Year
ly B
ooks
per
Cap
ita
01234567
Year
ly C
omm
unity
Cen
ter
Visi
ts p
er C
apita
King County Library Visits Seattle Library Visits Community Center Visits
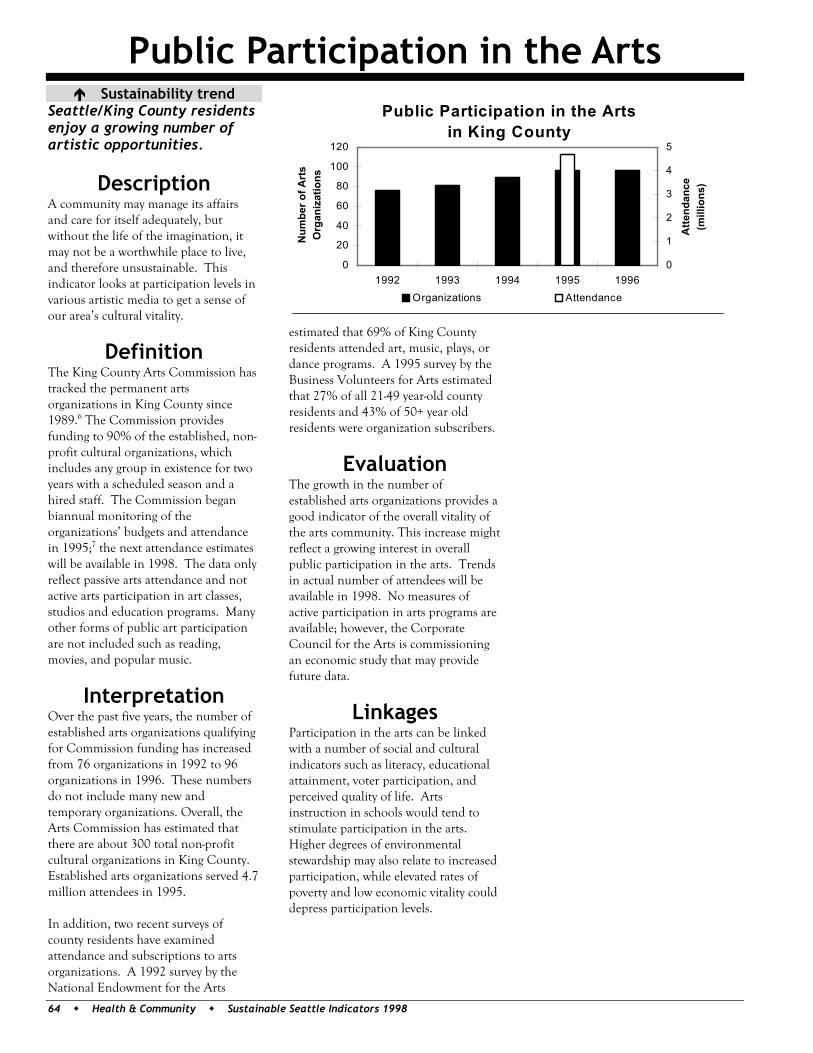
Public Participation in the Arts
64 Health & Community Sustainable Seattle Indicators 1998
Sustainability trend Seattle/King County residents enjoy a growing number of artistic opportunities.
Description A community may manage its affairs and care for itself adequately, but without the life of the imagination, it may not be a worthwhile place to live, and therefore unsustainable. This indicator looks at participation levels in various artistic media to get a sense of our area’s cultural vitality.
Definition The King County Arts Commission has tracked the permanent arts organizations in King County since 1989.6 The Commission provides funding to 90% of the established, non-profit cultural organizations, which includes any group in existence for two years with a scheduled season and a hired staff. The Commission began biannual monitoring of the organizations’ budgets and attendance in 1995;7 the next attendance estimates will be available in 1998. The data only reflect passive arts attendance and not active arts participation in art classes, studios and education programs. Many other forms of public art participation are not included such as reading, movies, and popular music.
Interpretation Over the past five years, the number of established arts organizations qualifying for Commission funding has increased from 76 organizations in 1992 to 96 organizations in 1996. These numbers do not include many new and temporary organizations. Overall, the Arts Commission has estimated that there are about 300 total non-profit cultural organizations in King County. Established arts organizations served 4.7 million attendees in 1995. In addition, two recent surveys of county residents have examined attendance and subscriptions to arts organizations. A 1992 survey by the National Endowment for the Arts
estimated that 69% of King County residents attended art, music, plays, or dance programs. A 1995 survey by the Business Volunteers for Arts estimated that 27% of all 21-49 year-old county residents and 43% of 50+ year old residents were organization subscribers.
Evaluation The growth in the number of established arts organizations provides a good indicator of the overall vitality of the arts community. This increase might reflect a growing interest in overall public participation in the arts. Trends in actual number of attendees will be available in 1998. No measures of active participation in arts programs are available; however, the Corporate Council for the Arts is commissioning an economic study that may provide future data.
Linkages Participation in the arts can be linked with a number of social and cultural indicators such as literacy, educational attainment, voter participation, and perceived quality of life. Arts instruction in schools would tend to stimulate participation in the arts. Higher degrees of environmental stewardship may also relate to increased participation, while elevated rates of poverty and low economic vitality could depress participation levels.
Public Participation in the Artsin King County
0
20
40
60
80
100
120
1992 1993 1994 1995 1996
Num
ber o
f Art
s O
rgan
izat
ions
0
1
2
3
4
5
Atte
ndan
ce
(mill
ions
)
Organizations Attendance
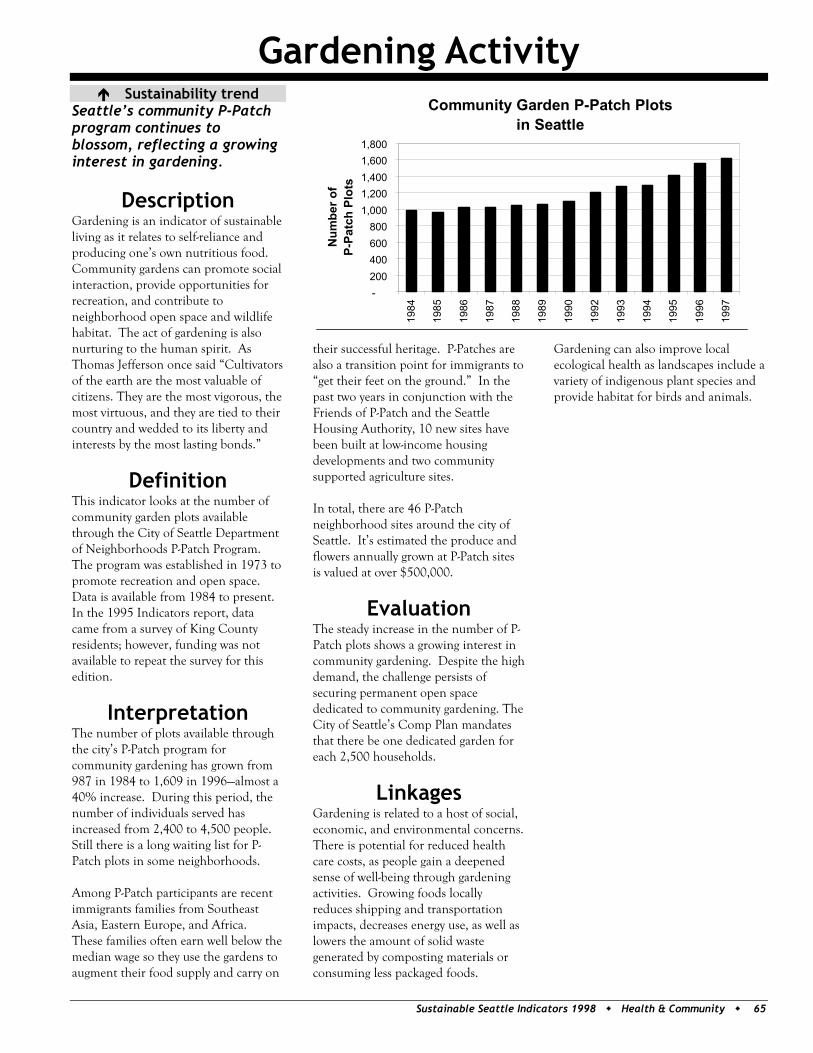
Gardening Activity
Sustainable Seattle Indicators 1998 Health & Community 65
Sustainability trend Seattle’s community P-Patch program continues to blossom, reflecting a growing interest in gardening.
Description Gardening is an indicator of sustainable living as it relates to self-reliance and producing one’s own nutritious food. Community gardens can promote social interaction, provide opportunities for recreation, and contribute to neighborhood open space and wildlife habitat. The act of gardening is also nurturing to the human spirit. As Thomas Jefferson once said “Cultivators of the earth are the most valuable of citizens. They are the most vigorous, the most virtuous, and they are tied to their country and wedded to its liberty and interests by the most lasting bonds.”
Definition This indicator looks at the number of community garden plots available through the City of Seattle Department of Neighborhoods P-Patch Program. The program was established in 1973 to promote recreation and open space. Data is available from 1984 to present. In the 1995 Indicators report, data came from a survey of King County residents; however, funding was not available to repeat the survey for this edition.
Interpretation The number of plots available through the city’s P-Patch program for community gardening has grown from 987 in 1984 to 1,609 in 1996—almost a 40% increase. During this period, the number of individuals served has increased from 2,400 to 4,500 people. Still there is a long waiting list for P-Patch plots in some neighborhoods. Among P-Patch participants are recent immigrants families from Southeast Asia, Eastern Europe, and Africa. These families often earn well below the median wage so they use the gardens to augment their food supply and carry on
their successful heritage. P-Patches are also a transition point for immigrants to “get their feet on the ground.” In the past two years in conjunction with the Friends of P-Patch and the Seattle Housing Authority, 10 new sites have been built at low-income housing developments and two community supported agriculture sites. In total, there are 46 P-Patch neighborhood sites around the city of Seattle. It’s estimated the produce and flowers annually grown at P-Patch sites is valued at over $500,000.
Evaluation The steady increase in the number of P-Patch plots shows a growing interest in community gardening. Despite the high demand, the challenge persists of securing permanent open space dedicated to community gardening. The City of Seattle’s Comp Plan mandates that there be one dedicated garden for each 2,500 households.
Linkages Gardening is related to a host of social, economic, and environmental concerns. There is potential for reduced health care costs, as people gain a deepened sense of well-being through gardening activities. Growing foods locally reduces shipping and transportation impacts, decreases energy use, as well as lowers the amount of solid waste generated by composting materials or consuming less packaged foods.
Gardening can also improve local ecological health as landscapes include a variety of indigenous plant species and provide habitat for birds and animals.
Community Garden P-Patch Plots in Seattle
-200400600800
1,0001,2001,4001,6001,800
1984
1985
1986
1987
1988
1989
1990
1992
1993
1994
1995
1996
1997
Num
ber o
f P-
Patc
h Pl
ots
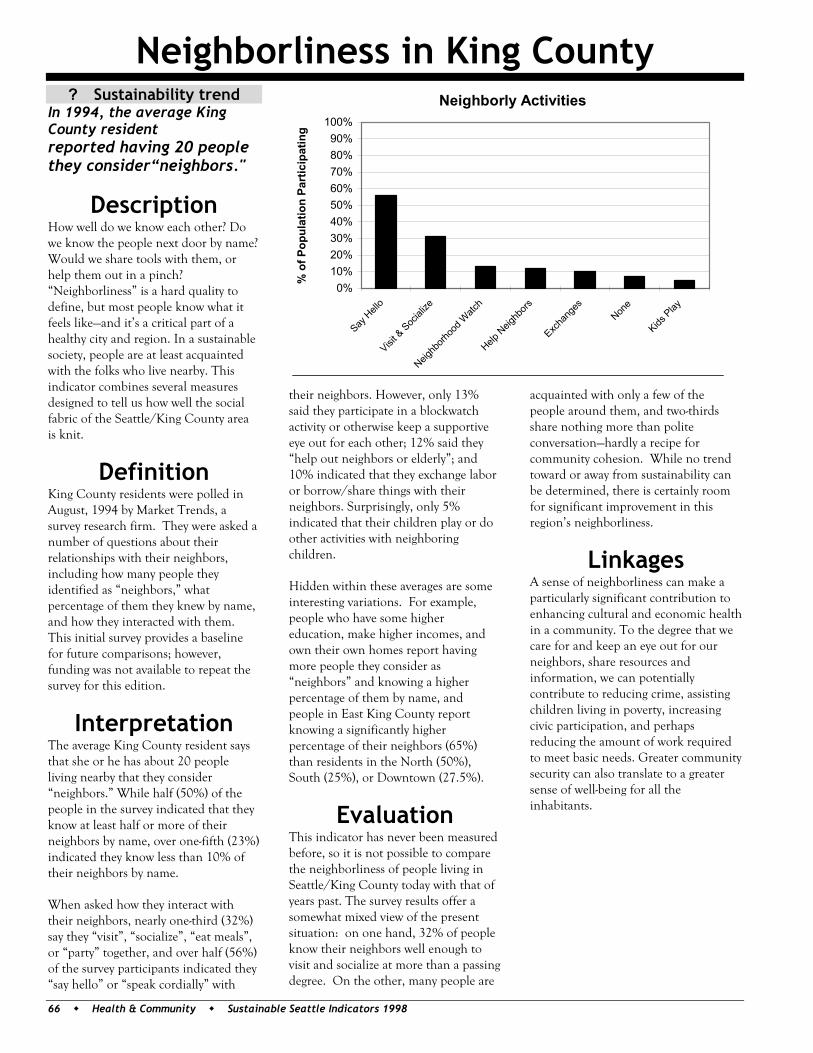
Neighborliness in King County
66 Health & Community Sustainable Seattle Indicators 1998
? Sustainability trend In 1994, the average King County resident reported having 20 people they consider“neighbors."
Description How well do we know each other? Do we know the people next door by name? Would we share tools with them, or help them out in a pinch? “Neighborliness” is a hard quality to define, but most people know what it feels like—and it’s a critical part of a healthy city and region. In a sustainable society, people are at least acquainted with the folks who live nearby. This indicator combines several measures designed to tell us how well the social fabric of the Seattle/King County area is knit.
Definition King County residents were polled in August, 1994 by Market Trends, a survey research firm. They were asked a number of questions about their relationships with their neighbors, including how many people they identified as “neighbors,” what percentage of them they knew by name, and how they interacted with them. This initial survey provides a baseline for future comparisons; however, funding was not available to repeat the survey for this edition.
Interpretation The average King County resident says that she or he has about 20 people living nearby that they consider “neighbors.” While half (50%) of the people in the survey indicated that they know at least half or more of their neighbors by name, over one-fifth (23%) indicated they know less than 10% of their neighbors by name. When asked how they interact with their neighbors, nearly one-third (32%) say they “visit”, “socialize”, “eat meals”, or “party” together, and over half (56%) of the survey participants indicated they “say hello” or “speak cordially” with
their neighbors. However, only 13% said they participate in a blockwatch activity or otherwise keep a supportive eye out for each other; 12% said they “help out neighbors or elderly”; and 10% indicated that they exchange labor or borrow/share things with their neighbors. Surprisingly, only 5% indicated that their children play or do other activities with neighboring children. Hidden within these averages are some interesting variations. For example, people who have some higher education, make higher incomes, and own their own homes report having more people they consider as “neighbors” and knowing a higher percentage of them by name, and people in East King County report knowing a significantly higher percentage of their neighbors (65%) than residents in the North (50%), South (25%), or Downtown (27.5%).
Evaluation This indicator has never been measured before, so it is not possible to compare the neighborliness of people living in Seattle/King County today with that of years past. The survey results offer a somewhat mixed view of the present situation: on one hand, 32% of people know their neighbors well enough to visit and socialize at more than a passing degree. On the other, many people are
acquainted with only a few of the people around them, and two-thirds share nothing more than polite conversation—hardly a recipe for community cohesion. While no trend toward or away from sustainability can be determined, there is certainly room for significant improvement in this region’s neighborliness.
Linkages A sense of neighborliness can make a particularly significant contribution to enhancing cultural and economic health in a community. To the degree that we care for and keep an eye out for our neighbors, share resources and information, we can potentially contribute to reducing crime, assisting children living in poverty, increasing civic participation, and perhaps reducing the amount of work required to meet basic needs. Greater community security can also translate to a greater sense of well-being for all the inhabitants.
Neighborly Activities
0%10%20%30%40%50%60%70%80%90%
100%
Say H
ello
Visit &
Soc
ialize
Neighb
orhoo
d Watc
h
Help N
eighb
ors
Excha
nges
None
Kids P
lay%
of P
opul
atio
n Pa
rtic
ipat
ing
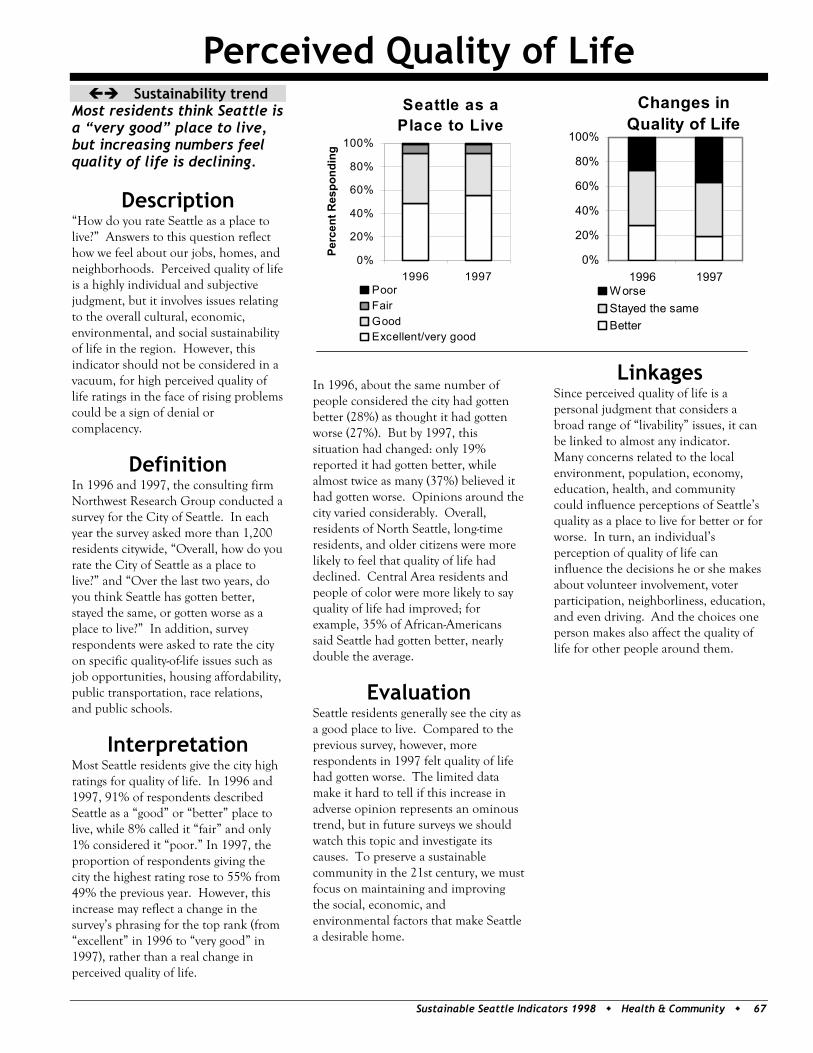
Perceived Quality of Life
Sustainable Seattle Indicators 1998 Health & Community 67
Sustainability trend Most residents think Seattle is a “very good” place to live, but increasing numbers feel quality of life is declining.
Description “How do you rate Seattle as a place to live?” Answers to this question reflect how we feel about our jobs, homes, and neighborhoods. Perceived quality of life is a highly individual and subjective judgment, but it involves issues relating to the overall cultural, economic, environmental, and social sustainability of life in the region. However, this indicator should not be considered in a vacuum, for high perceived quality of life ratings in the face of rising problems could be a sign of denial or complacency.
Definition In 1996 and 1997, the consulting firm Northwest Research Group conducted a survey for the City of Seattle. In each year the survey asked more than 1,200 residents citywide, “Overall, how do you rate the City of Seattle as a place to live?” and “Over the last two years, do you think Seattle has gotten better, stayed the same, or gotten worse as a place to live?” In addition, survey respondents were asked to rate the city on specific quality-of-life issues such as job opportunities, housing affordability, public transportation, race relations, and public schools.
Interpretation Most Seattle residents give the city high ratings for quality of life. In 1996 and 1997, 91% of respondents described Seattle as a “good” or “better” place to live, while 8% called it “fair” and only 1% considered it “poor.” In 1997, the proportion of respondents giving the city the highest rating rose to 55% from 49% the previous year. However, this increase may reflect a change in the survey’s phrasing for the top rank (from “excellent” in 1996 to “very good” in 1997), rather than a real change in perceived quality of life.
In 1996, about the same number of people considered the city had gotten better (28%) as thought it had gotten worse (27%). But by 1997, this situation had changed: only 19% reported it had gotten better, while almost twice as many (37%) believed it had gotten worse. Opinions around the city varied considerably. Overall, residents of North Seattle, long-time residents, and older citizens were more likely to feel that quality of life had declined. Central Area residents and people of color were more likely to say quality of life had improved; for example, 35% of African-Americans said Seattle had gotten better, nearly double the average.
Evaluation Seattle residents generally see the city as a good place to live. Compared to the previous survey, however, more respondents in 1997 felt quality of life had gotten worse. The limited data make it hard to tell if this increase in adverse opinion represents an ominous trend, but in future surveys we should watch this topic and investigate its causes. To preserve a sustainable community in the 21st century, we must focus on maintaining and improving the social, economic, and environmental factors that make Seattle a desirable home.
Linkages Since perceived quality of life is a personal judgment that considers a broad range of “livability” issues, it can be linked to almost any indicator. Many concerns related to the local environment, population, economy, education, health, and community could influence perceptions of Seattle’s quality as a place to live for better or for worse. In turn, an individual’s perception of quality of life can influence the decisions he or she makes about volunteer involvement, voter participation, neighborliness, education, and even driving. And the choices one person makes also affect the quality of life for other people around them.
Seattle as a Place to Live
0%
20%
40%
60%
80%
100%
1996 1997
Perc
ent R
espo
ndin
g
PoorFairGoodExcellent/very good
Changes in Quality of Life
0%
20%
40%
60%
80%
100%
1996 1997WorseStayed the sameBetter

68 Health & Community Sustainable Seattle Indicators 1998
Health & Community Notes
1 All information on low birthweight infants in King County (by race) is from Washington State Department of Health, Center for Health Statistics. Data were obtained from Marianne Sullivan, Epidemiology and Planning Division, Seattle-King County Department of Public Health, private communication, July 1, 1997. 2 Dr. David Solet and Marianne Sullivan, Seattle/King County Department of Public Health, private communication, February 1998. 3 Bob Bruce, King County Office of Elections, private communication, November 1997. 4 Washington State Library, Washington State Library, Washington State Library Statistical Bulletin (Olympia WA: 1997). 5 Jennifer Cargal, Seattle Parks and Recreation Department, private communication, August 1997. 6 Leonard Garfield, King County Office of Cultural Resources, private communication, April 1997. 7 King County Office of Cultural Resources, Sustaining King County Arts Organizations (Seattle, WA: 1997).
How the IndicatorsProcess Began
The “Indicators Project” grew out of aone-day conference in November 1990sponsored by the Washington D.C.-based Global Tomorrow Coalition inwhich community leaders from all facetsof Seattle city life came together aroundthe idea of citizens choosing their ownways of measuring long-term communitywell-being. In February 1991, theSustainable Seattle Network coalescedwith 30 volunteers meeting to furtherthe concept of creating Indicators tomeasure the health of Seattle.
For the next six months, an IndicatorsTask Team made up of people withdiverse backgrounds—an economist,energy specialist, engineer, social worker,city planner, etc.—met regularly tobrainstorm and research possibleindicators. After creating a draft list of29 potential key indicators, and anumber of secondary and “provocative”indicators, the team recognized a need toinvolve more people who could provide abroader perspective on indices of ahealthy community across an economic,environmental, and social spectrum.Business leaders, environmental groups,city and county government representa-tives, labor, the religious community,special interest groups, educators,students, and social activists were askedto participate in a Civic Panel andcollectively imagine what aspects of thecommunity were important to measure.
During this same time, another group ofvolunteers (some from the Indicatorsteam as well as others) met as theSustainable Seattle Board of Trustees.Also known as the “stewards of theprocess,” this group worked together todefine the network’s identity and createan organizational structure that encour-aged consensual decision-making, sharedleadership, and diverse participation.Sustainable Seattle’s values were testedearly on, as the Trustees struggled sixmonths to come up with a consensusdefinition of sustainability: “long-term
health and vitality—cultural, economic,environmental, and social.”
Recruiting Civic PanelParticipants
The Civic Panel process was invaluable inproviding depth and a range of knowledgeabout community life; giving seriousthought to all the dimensions ofsustainability; providing critical thinkingabout the best indicators of sustainability—economic, environmental and social; andbuilding support, enthusiasm and beliefthat a community can find new andbetter ways to measure its own progress.
The design of the Civic Panel was tobring together some of the most activecitizens in Seattle and engage them in adynamic workshop process that wouldlead to specific and credible results—butthat was “sustainable” in terms of thecommitment it required from alreadybusy people.
First, we drew upon our own resourcesand compiled a list of 300 citizensleaders and grassroot activists through-out the city. We made an effort toequally involve men and women, and toinclude active citizens of different ages,cultures, and lifestyles. Using a list often topic areas, we sought people whohad knowledge in:• Resource Consumption• Education• Economy• Transportation• Natural Environment• Health• Social Environment• Culture & Recreation• Population• Community Participation
An invitation, including a description ofthe purpose and six-month schedule forthe Civic Panel, was mailed to eachpotential participant followed by apersonal phone call. Over 150 immedi-ately agreed to participate. The panelwas also open to anyone who wanted toparticipate, and an additional 20 or so
people volunteered.
Support & FacilitationTo use time efficiently, we trained 20Sustainable Seattle volunteers (two foreach topic group) to serve as facilitator/recorder teams. Prior to each workshop,we prepared a packet of backgroundmaterials that was sent to each partici-pant, planned an agenda with specificgoals, and briefed coordinators to leadeach workshop. We used techniques offacilitated whole group dialogue andsmall group working sessions to accom-plish our goals each meeting, alwaysallowing time for socializing andenjoyment. People were drawn to theeffort because we seemed to be having somuch fun!
Steps in the ProcessOur plan included four participatoryworkshops held over the span of sixmonths, with the goal of developingconsensus recommendations for keysustainability indicators.
Workshop #1: Civic Panel Orientation. Awarm evening workshop in June kickedoff the Civic Panel process. Kay Bullitt,a local environmental visionary andleader, and a representative of theMayor’s office, welcomed all the partici-pants. Next, Sustainable Seattle leadersoffered an inspiring presentation on thevision and task of sustainability—theglobal concern and challenge for ourlocal response.
After spending a number of months byourselves working towards a draft list ofindicators, the Task Team was eager tointroduce the “Indicators of SustainableCommunity” project to a broad audienceand invite their participation andcreativity into the process. Eachparticipant received “Draft IndicatorsVersion 1,” the potential list of 29 keyindicators and many secondary andprovocative ones, along with a six-pagefeedback survey for individuals to fill outon their own time. For the remaining
The Sustainable Seattle Indicators Story
Sustainable Seattle Indicators 1998 The Sustainable Seattle Indicators Story 69
perceptions and visions of a sustain-able culture. We asked participantsto envision one generation from now,in 2022, what evidence they mightfind that indicates we have become asustainable society. We also askedwhat hopes or interests people hadfor the Civic Panel process. Theevening concluded with a buzz ofenthusiasm and the pervasive feelingwe were beginning somethinguniquely important to thecommunity’s future well-being.
First Review & Feedback By Mail.Over the summer, Civic Panelistsspent time reviewing the first draftlist of indicators and recording theircomments via the written feedbacksurvey. The process was designed sothat panelists could individuallyreview the draft list in an enjoyableway that was paced according to theirown schedules and could be com-pleted without additional meetings.Some people went to the addedtrouble of attaching extra sheets oftypewritten comments to explaintheir ideas in depth.
From the forms received, theIndicators Task Team studied andsynthesized the written feedback. Inpreparation for the next meeting, wedivided the Panel into topic areas(according to their interest andknowledge), and distributed a set ofrevised key indicators—in addition toframing comments and discussionquestions.
Workshop #2: Topic Groups Develop KeyIndicators. In late September, theSustainable Seattle Civic Panel metfor the second time to begin work onthe nitty-gritty details of designingkey indicators of sustainability. Webegan the workshop with a briefupdate on the progress since the lastworkshop, then Civic Panel membersdivided into the ten topic groups.Using the synthesized feedback onDraft Version 1, each group workedto develop and refine a list of tenpotential indicators for their topicarea, first agreeing among themselvesabout criteria for including certain
indicators and excluding others relatedto their topic. Many groups felt theyneeded more time for discussion andmade plans to meet outside of thescheduled Panel workshops. To wrap upthe second workshop, each topic groupreported on its progress and planned nextsteps to the larger group. All the resultswere compiled into Draft Version 2.
Workshop #3: Towards Consensus on KeyIndicators. The goal for this Octobermeeting was that each topic group movetowards agreement on the three to fivebest key indicators for their area. Torefresh people’s energy, we began theworkshop with some reflection timeabout our visions and hopes for theproject. Then topic groups got to taskon winnowing their indicators list downusing criteria for good indicators thatwere developed from the SustainableSeattle goals. By the end of the evening,each group reported their results to thewhole Civic Panel and shared ideas onhow to publish and use these indicatorsin the community. Some groups felt theneed to meet independently one lasttime after this workshop, while otherscompleted their work by telephone.Many groups only achieved consensus byexpanding the number of indicators theyincluded. The results—99 total indica-tors—became Draft Version 3.
Workshop #4: 99 Indicators, Priorities, &Celebration. On a Saturday in December,the Civic Panel held its final meeting toreview the newly proposed “Indicators ofSustainable Community.” All 99indicators were displayed in large printon a wall. The meeting began with a“dramatic reading” of the 99 indicatorsinterspersed with poetry, quotations, andstories that illustrated the values andprinciples of the project. As a finalpriority-setting exercise, Civic Panelistsparticipated in a “green dot game” inwhich they each selected 15 indicatorsfrom the menu of 99 that seemed mostuseful in providing a snapshot ofcommunity sustainability. “Wild Salmon”received the most green dots, by far.
Next, Panelists considered how theIndicators were linked to one another.They worked in pairs and small groups to
develop “chains of causation” betweenkey indicators. After a lunchtimedemonstration of an electrical scooterand a musical interlude, Panelists set towork on brainstorming strategies forputting the indicators to work inbusiness, education, the media, commu-nities, and policy-making. The meetingconcluded with a joyful celebration overthe successful completion of our work.
Use of Civic PanelResults
Next came the hard task of paring downthe Indicators list, giving seriousconsideration to issues of measurability,data availability, and professionalcredibility. Civic Panelists were invitedto join the on-going Sustainable SeattleIndicators Task Team for next steps, andsome of them did. For the next threemonths, the Indicators Task Teamworked with the prioritized list of 99indicators to winnow it down to a finalselection of 40 indicators that wouldgive a “whole system” or “whole city”snapshot of movement towards or awayfrom sustainability. In all, the indicatorslist went through seven draft iterations.We mailed the final draft list to all CivicPanel members for one last review andcomment. Then we began the finalphase of the project—data collection andanalysis, the results of which you see inthis report.
Many Panel members helped find andcollect data through existing sources andserved as peer evaluators and reviewersto assure that all information wasreliable, defensible and meaningful.People from local government, schoolsand universities, businesses and researchgroups contributed their time andessential resources. All in all, hundredsof volunteers came together to createthis community report-card. And manyhave continued to spark indicator orbenchmark projects in the Puget Soundregion and elsewhere around the UnitedStates and the world.
70 The Sustainable Seattle Indicators Story Sustainable Seattle Indicators 1998
Culture: An integrated pattern ofhuman beliefs, values, behaviors andinstitutions shared by a distinct group, theinhabitants of a region, or the citizens of anation. Used in some contexts as asynonym for the arts and other forms ofsocial expression.
Definition: The technical specificationsof an Indicator, including data sources.
Description: An explanation of therationale for the choice of a particularIndicator.
Development: “To evolve the possibili-ties of” (Webster’s New CollegiateDictionary). A process of growth orchange. Often used in the phrases“economic development,” connoting anexpansion of economic opportunities andjobs, and “sustainable development,”referring to economic and social changesthat promote human prosperity andquality of life without causing ecologicalor social damage. Sometimes confusedwith Growth.
Diversity: Difference and variety.Diversity is an essential component ofsustainable cultural, ecological, andeconomic systems because it makes themmore resilient and adaptable to change.
Earth Summit: See UNCED.
Economic Development: See Develop-ment.
Economy: Originally, the “managementof a household.” More commonly today,the system of production, distribution,and consumption of goods and servicesin the larger scale. Also a synonym forFrugality.
Ecosystem: An integrated system ofliving species, their habitat, and theprocesses that affect them.
Ecological Health: A measure of theability of an Ecosystem to maintainessential natural functions, such asprimary production, nutrient cycling, and
evolution of native species.
Endangered Species: Species whosepopulations and habitat have declined tothe point where extinction is imminent,requiring significant human interven-tions and protection of habitat topreserve them (as defined by theEndangered Species Act). (See alsoSpecies, Threatened Species.)
Environment: “The circumstances,objects, or conditions by which one issurrounded” (Webster’s). Often used torefer only to natural Ecosystems apartfrom human settlement, Environment ismore accurately understood to includeboth natural and human-made physicalconditions.
Equity: Fairness; freedom from bias orfavoritism.
Evaluation: A determination of thepositive or negative connotations in thedata for an Indicator, including a judg-ment about its movement toward oraway from Sustainability.
Extrapolate: A method for estimatingnew data points based on existingmeasurements, and thereby predictingtrends. For example, if the data for 1994and 1995 are 8 and 9 respectively, onecould extrapolate from that data toestimate that in 1996 the figure might be10.
Frugality: In Latin origin, to “enjoy thefruits”; also a synonym for “virtuous.” Incontemporary usage, to use resources(including money) wisely, without waste.
Global Forum: The 1992 meeting ofnon-governmental organizations (NGOs)in Rio de Janeiro, which ran parallel tothe meeting of governments at UNCED.NGO participants signed a set of“Citizen Treaties” that went far beyond theagreements made by governments inAgenda 21.
Glossary
Sustainable Seattle Indicators 1998 Glossary 71
Agenda 21: The non-binding agreementsigned by world nations at the 1992United Nations Conference on Environ-ment and Development (see UNCED).Agenda 21 sets out conditions andrecommendations for achieving globalSustainability.
Benchmark: A point of reference or astandard against which measurementscan be compared; sometimes a goal or atarget. Examples: Record highs in thestock market, optimal water levels inwetlands, so-called “full-employment”levels of acceptable unemployment.Often confused with Indicator.
Biodiversity: The variety of livingorganisms in an Ecosystem. (See alsoDiversity.)
Bioregion: A geographic area defined byclose similarity in Ecosystems, Biodiversity,and climate patterns, as distinct from anarea defined by political boundaries.Many have defined the maritime PacificNorthwest, from British Columbia downto Oregon, as a single Bioregion with thename “Cascadia.”
Brundtland Commission: Officially,the World Commission on Environmentand Development, charted by the UnitedNations and chaired by NorwegianPrime Minister Grö Harlem Brundtland.From 1984 to1987 it studied globalenvironmental, economic, and socialtrends, and published recommendationsin the 1987 report, Our Common Future,which set a global agenda forSustainability.
Btu: “British Thermal Unit,” a unit ofmeasure for energy. Specifically, one Btuis the amount of energy required to raisethe temperature of one pound of waterone degree Farenheit, starting from 39.2degrees.
Civic Panel: A group of approximately150 citizens and civic leaders convened bySustainable Seattle in 1992 to selectIndicators of Sustainability for theSeattle area.
Growth: Increase or expansion. Used inthe phrase “economic growth” to mean anexpansion in production, jobs, andrevenue. Often confused with Develop-ment, which does not necessarily includethe idea of physical increase.
Indicator: A measurement that reflectsthe status of a system. Examples: theDow Jones Industrial Average, thenumber of spotted owls in a forestecosystem, an oil pressure gauge on anengine.
Interpolate: A method for estimatingdata points that fall between points ofactual measurement. For example, if themeasurement for 1992 was “5 units,”and for 1994 “10 units,” one couldinterpolate that the measurement for1993 would be the midpoint betweenthem, or approximately 7.5 units.
Interpretation: The analysis of thedata for an Indicator, including trendanalysis.
Linkage: A direct or indirect causalrelationship between two or moreSystems, where changes in one affect thestatus of the other. Linkages amongSystems are often reflected in theIndicators that measure the health ofthose Systems.
Mean: The statistical average, determinedby adding up all the data and dividing bythe number of data points. For example,in the series 1, 2, 6, the mean is 3.
Median: The figure in an array of datapoints that falls midway in the seriesbetween the highest and the lowestvalues. For example, in the series 1, 2, 6,the median is 2. (Note the distinctionbetween Median and Mean.)
Nonrenewable: Finite in quantity.Fossil fuels (like gasoline) are considered“nonrenewable resources,” because theyexist only in limited amounts, and theirdisappearance is essentially permanent.(See also Resources and Renewable.)
Our Common Future: The Report ofthe Brundtland Commission, whichlinked economic development to alleviatepoverty with environmental protection toprevent ecological catastrophe.
Per Capita: Latin for “by heads.” Ameasurement that is presented in termsof units per person, as opposed to a totalor aggregate figure.
Renewable: Able to be continuallyreplenished. Rainwater, solar and hydro-electricity, and human creativity are allconsidered to be Renewable Resources.(See also Resources and Nonrenewable.)
Resources: “A source of supply orsupport; available means” (Webster’s).The energy and materials used to supportan Economy and fulfill human needs anddesires. (See also Renewable and Nonre-newable.)
Riparian: Refers to land adjacent to ariver, watercourse or body of water.
Rolling Average: A statistical techniquefor smoothing out data trends that aresubject to aberrant fluctuations in theshort term. For example, a three-yearRolling average takes the current year’sdata and averages it with the twopreceding years to minimize sudden dipsor spikes that may not be typical of thetrend.
Society: From a Latin root meaning“companion.” Society in the broadestsense refers to the entirety of a commu-nity, the whole web of living relation-ships among people, their Culture, andtheir Environment.
Species: A biological classificationreferring to a group of organisms whoshare similar traits and genetic codes andwho are capable of interbreeding.
Sustainability: “Long-term health andvitality—cultural , economic, environmen-tal and social” (Sustainable Seattle’sdefinition).
Sustainable: Able to endure over time.A sustainable Society is one that is healthy,vital, resilient, and able to creatively adaptto changing conditions over the long term.(See also Development, and Our Com-mon Future.)
Sustainable Development: The OurCommon Future report defined Sustain-able Development as that which “meetsthe needs of the present without compro-mising the ability of future generations tomeet their own needs.”
System: A set of actors or entitiesbound together by a set of rules andrelationships into a unified whole. Asystem’s health is dependent on the healthof the whole pattern, which can sometimesbe reflected (and thus measured) in thestatus of a key part of the system (seeIndicator).
Threatened Species: Species whosepopulations are in decline and trendingtoward becoming Endangered (as definedby the Endangered Species Act). (See alsoSpecies and Endangered Species.)
UNCED: The United Nations Confer-ence on Environment and Development(the “Earth Summit”), held in Rio deJaneiro, Brazil in 1992. UNCED was thelargest gathering of heads of state in worldhistory.
Watershed: A geographical area whoseboundaries are determined by the flowsof water following gravity to a principaltributary, river, or body of water.Watersheds may be of many differentscales, from relatively small (RavennaCreek or Piper’s Creek in Seattle) to thevery large (the Columbia River basin).
72 Glossary Sustainable Seattle Indicators 1998
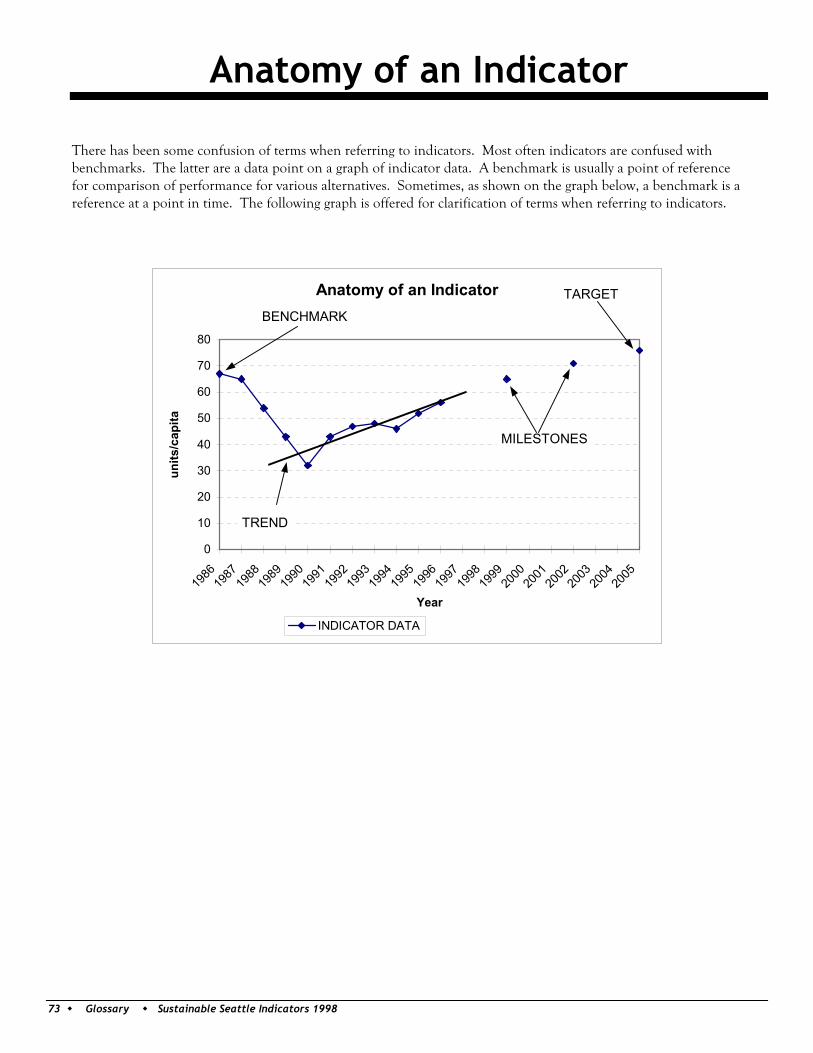
Anatomy of an Indicator
73 Glossary Sustainable Seattle Indicators 1998
There has been some confusion of terms when referring to indicators. Most often indicators are confused with benchmarks. The latter are a data point on a graph of indicator data. A benchmark is usually a point of reference for comparison of performance for various alternatives. Sometimes, as shown on the graph below, a benchmark is a reference at a point in time. The following graph is offered for clarification of terms when referring to indicators.
Anatomy of an Indicator
0
10
20
30
40
50
60
70
80
1986
1987
1988
1989
1990
1991
1992
1993
1994
1995
1996
1997
1998
1999
2000
2001
2002
2003
2004
2005
Year
units
/cap
ita
INDICATOR DATA
MILESTONES
TARGET
BENCHMARK
TREND

1992 Civic PanelMark AalfsCynthia AdcockKimberly AllenSusan AlotricoCecile AndrewsArnie AnfinsonTony AngellAlan AtKissonRuth BachmanTom BaileyMona BaileyEd BelcherPhillip BereanoBelinda BergBonnie BerkCarla BerkedalJulie BlacklowKeith BlumeJuan BocanegraSandy BradleyCatherine BradshawDavid BricklinKay BullittEmory BundyDoug BurcoNoreen CalaghanNea CarrollDoreen CatoVivian CaverBill ChapmanChris CharbonneauStuart ClarkeRon ClinkDavid ColeBrian CollinsTim ColmanRichard ConlinNicholas CorffPeter CostantiniDon CoveyDana CoxDorothy CraigSheila CrofutCarolee DanzDee DickensonJim DiersMartha DiltsCarol D. DiMarcelloSusan DoederleinAnn DoldJoe DominguezAlan DornseifKikora DorseyAmy DugganClaire DyckmanPolly DyerBob EaglestaffDave EllgenLinda EllisJim EvansMickey FearnMike Fitzgerald
Nate FordAngela FordStephen FormanJoanne FraneyBart FreedmanBarbara FreemanTom FribergRichard FrithPat FullmerDiana GaleDave GalvinBob CaryPat GibbonLibia GilRobert GilmanLonnie GoodteacherLarry GossettKathy GrahamMichelle GransgaardTom GriesPatty GrossmanMarcia GuthrieFern HalgrenSusan HallNancy HansenSuzanne HartmanLee HatcherJody HaugJoan HaynesDenis HayesJo HendersonBruce T. HerbertCarlos HerreraShari HirstDiane HornHeather HoustonFritz HullRick JacksonPhil JacksonKirk JohnsonBruce JonesKent KammererDavidya KasperzykRon KasprisinLaurie KeithSheila KellyKathryn KellyBruce KendallDoug KilgoreCharles KleebergRich KovarPenelope KovenArthur KruckenbergVic KuceraAki KuroseMichael LaFondPat LamphereDeEn LangGary LawrenceRon LewisNick LicataJohn LittleNancy Long
Jim LuddenDavid LurieMichael Mac SemsKate MandellMilenko MatanovichNaydene MaykutDavid McCloskeyMary McCumberMark McDermottEvy McDonaldNancy McKayPatricia McLean-VirigiEd MedeirosPhil MillamLynn MirandaSharon Tomiko MiyakeJohn MorefieldBill MoritzSharon MorrisScott MorrowMark MurphyMike NelsonPeter NelsonDick NelsonSteven NicholasFolke NybergMaura O’BrienGary O’NealDavid OrtmanDick PageMargaret PagelerJoan PelleyKit PerkinsMelissa PetersenHanna PetrosGary PivoNancy PlaceRichard PleusDerek PoonLorraine PozziRobert ReedRoss ReiderVicki RobinMary RobinsonZarod RominskiTerryl RossJim RulfsDennis RyanChase RyndLois SheltonBob SickoBuster SimpsonLeon SmithLiz SmithDavid SmukowskiRon SnyderChris StaffordBill StaffordLucy SteersJim StreetDon StrombergPat StrosahlDiane Summerhays
Jean SunborgOlof SundinTom TierneyPaul ToliverWally TonerAlison TuckerJanine Van SandenMenno van WykJim WaldoEugene WassermanMike WeaverEdward Wenk, Jr.Carolyn WhitneyWoody WilkensonDon WillisCarl WoestwinHazel WolfRobert WoodFabiola WoodsVim G. WrightEly Zimmerman


Sustainable Seattle1109 First Avenue, Suite 400ASeattle, Washington USA 98101
Tel: (206) 622-3522Fax: (206) 343-9819
www