Embed Size (px)
Citation preview
( ~ ~ ~ ~ I L~~~~~Ii~~~~ E,XCLUSIVEPLE;ASE; RE;TUu> - Jlz[ F THE
|n(IMENTS rIZ0BUTIO& I R__t__ ___ _, _. m.. -,ns
ROO r "111 tpU PYDOCUMENT OF INTERNATIONAL BANK FOR RECONSTRUCTION AND DEVELOPMENT
INTERNATIONAL DEVELOPMENT ASSOCIATION
Not For Public Use
j 10 i !, -t>i u W | Report No. 25-IND
DEVELT.PMEvNT TRITTIF.- FOR TNDONESIA
Vo..me IV
AMATIVV C. 'FUL TT CLf"rAD
NNEX 5: T OL --I
ANNEX 6: EXFORT TPxENDS, 1971-197
I Z W x m
0
a 2>>December 1, 7 .- C > =
:Om
Asia Program Department I
This report was prepared for official use only by the Bank Group. It may not be p|or cited without Bank Group authorization. The Bank Group does not accept respaccuracy or completeness of the report.
Pub
lic D
iscl
osur
e A
utho
rized
Pub
lic D
iscl
osur
e A
utho
rized
Pub
lic D
iscl
osur
e A
utho
rized
Pub
lic D
iscl
osur
e A
utho
rized
Pub
lic D
iscl
osur
e A
utho
rized
Pub
lic D
iscl
osur
e A
utho
rized
Pub
lic D
iscl
osur
e A
utho
rized
Pub
lic D
iscl
osur
e A
utho
rized

This report was prepared in cooperation with the IBRT ResidentStaff, Jakarta, by an economic mission which visited Indonesia in May-Juineand October-nFovember 1972. The participants were:
Graeme Thompson Mission ChiefBahman K. Abadian Chief -bonomistMark W. Leiserson Employment Specialist (ILO)Helen Hughes Industrial AdvisorNimrod Raphaeli Planning AdvisorJohn Foster Petroleum EconomistBnmerich M. Schebeck Financial EconomistTownsend S. Swayze Fiscal Economist,Vinod Prakash Industrial EconomistRogelio G. David EconomistKevin Young Economist
Miss Julia Nasaire and F{rs. Placida 3spina were mission secretaries.
Annex 3 of the report, on agriculture, is based on The findings of anagriculture sector mission led by 14r. S. Takahashi which was in Indonesia inFebruary-March, 1972.

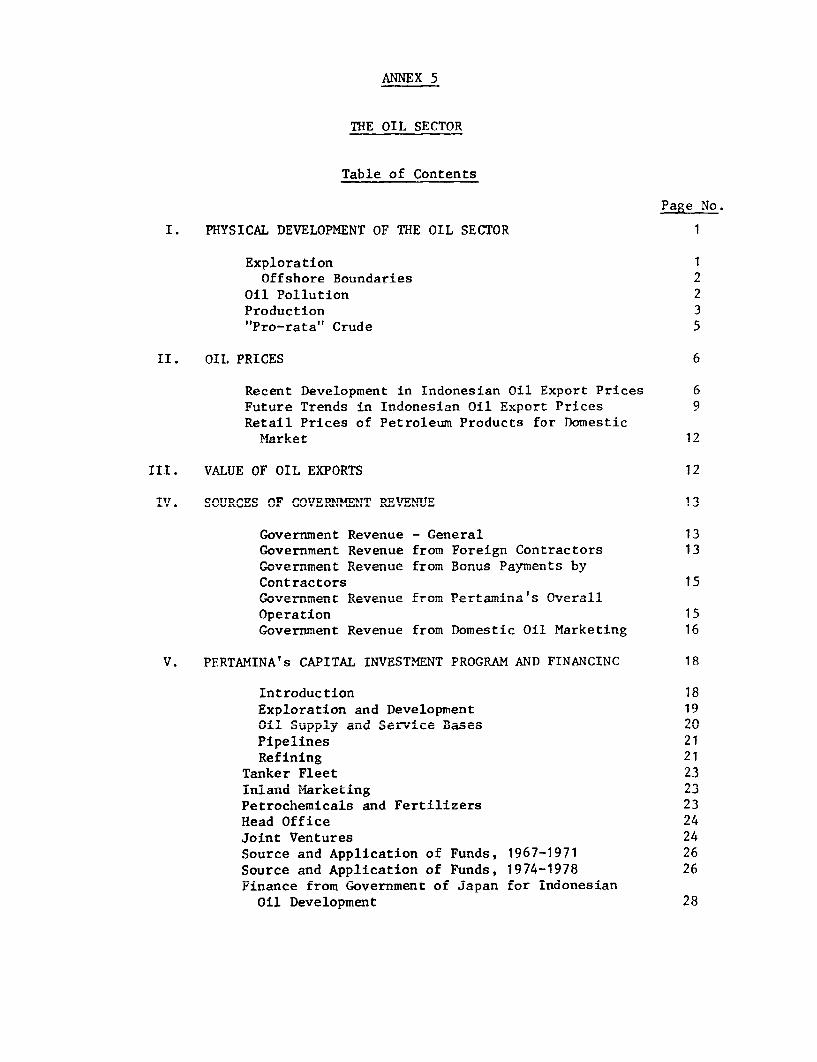
ANNEX 5
Table of Contents
Page No.
I. PHYSICAL DEVELOPMENT OF THE OIL SECTOR 1
Exploration 1Offshore Boundaries 2
Oil Pollution 2Produrtion 3"Pro-rata" Crude
II. OIL PRICES 6
Recent Development in Indonesian Oil Export Prices 6FuI:ture Trend sn Tinni sndonsan Oil Exonnrt Pri-rQ 9Retail Prices of Petroleum Products for Domestic
Market 12
III. VALUE OF OIL EXPORTS 12
IV. SOURCES OF G-3VEDIVMT PTM,1r JYTP 1T3
Government Revenue from Foreign Contractors 13r.fverr.,Lent ReveneC fo. o or A. by
Contractors 15GOvernm.ent Re-ven-LLue f-ol Pet) -- 4 n Overall~~J V CLIIUICLL L VCLIUC £~~~L L SJU L. L L- U.~.LLIQ CL C. ..~Operation 15tGovernm.ment Revenue from. Dom,estic 0i Mretn 16
I3UV~IIUuIL i x L V LU LL L.JUI ~1JLI L. A. UJL£ 1<401 -Lr I u
t~ fl.fltnfltT t A I- flA O,. A I XT~,,'l IPfftT flfflfflAll A7Mfl VT?M AMnlfTM 10
V. PERTMINA'sUU. CAPITL INVSsN RG' DFNCN 18
ILntrodluction 1Exploration and Development 19Oil Supply and Service Bases 20Pipelines 21Refining 2-
Tanker Fleet 23Inland Marketing 23Petrochemicals and Fertilizers 23Head Office 24Joint Ventures 24Source and Application of Funds, 1967-1971 26Source and Application of Funds, 1974-1978 26Finance from Government of Japan for Indonesian
Oil Development 28

I. PHYSICAL DEVELOPMENT OF THE OIL SECTOR
Exploration
1. Pertamina is actively exploring for oil in almost all promisingareas throughout Indonesia either in its own right or through contractsof work or production-sharing contracts. The last economic report discussedexploration prospects and listed production-sharing contracts up toOctober 31, 1971. 1/ Since then, Pertamina has signed two production-sharing contracts. The first was on March 3, 1972, with IndonesianOffshort Operators, Inc. and covers an area offshore southern West Irian.The second was in August 1972 with CFP-Total and covers an onshore areain the Mantalik and Pamai districts of Central Sumatra. Provisions of bothcontracts are similar to those in other recent production-sharing contracts. 2/
2. Drilling activity in 1971 reached a record level of more than 425wells and about 1.9 million feet drilled, which is roughly twice the levelin 1970. Development and extension drilling accounted for about 68 per centof wells completed that year. Wildcat drilling accounted for about 32per cent of wells completed and was about equally divided between on andoffshore activity. 138 wildcat wells were completed in 1971, about doublethe number in 1970; and oil was found in 21 of the wells. Exploration in 1972is expected to be as active as in 1971.
3. Some important oil discoveries have been made in 1971 and early1972; they will require additional work to evaluate their coumercialsignificance. Successful wildcat wells in 1971 led to the discovery of newoil structures onshore Sumatra under contracts of work to PT StanvacIndonesia (PTSI - a joint venture of Jersey Standard and Mobil) and CaltexPacific Indonesia (CPI - a loint venture of California Standard and Texaco)and under production-sharing contracts to Calasiatic - Topco (owned separatelyby California Standard and Texaco respectively). A new field has beenconfirmed at Alor Djimon in north Sumatra (Asamera), and others offshoreN. W. Java both in the "L" structure iust to the west of the Ardiuna field(ARCO) and at Kitty, Gita and Zelda (IIAPCO). Promising oil strikes havebeen made offshore E. Kalimantan at Bekapai (CFP/Japex) and Kerindingan andMelahin (Union Oil). An oil and gas field has been found onshore in S. E.Kalimantan at Badak (Huffington-Virginia International group), and itsdevelopment is being accelerated.
4. Gas has been found onshore at Arun in N. Sumatra (Mobil); twosuccessful wells were tested in 1972 at 14 million cfd and 50 million cfdplus condensate. The results are now being evaluated and seem to indicatethe Dresence of a larae gasfield there. Gas has also been found nearby inthe Lhu Sukon structure (Mobil) and offshore in Block A of the South China Sea
1/ PnrAgrApha 11-17 nnd Tahle 2 rpncpt-v.elyv nf Annow A "The PptrnlimSector in Indonesia" to "The Indonesian Economy: Recent Developmentsand Prospects for 1972!73" (EAP-27a) dated Novemher 30, 1971.
/ See paragraph 5 and Table 2 of Annex A to the last economic report.
ANN4EX 5age
(AGIP/Phillips/Tenneco) and offshore E. Kalimantan at Panjilatan (JasperTotal) adjacent to thle Badak field. Additionua± work is being done toevaluate these and other structures.
5. Exploration and development expenditures by foreign oil contractorshave accordingly grown rapidly:
(US$ Million)
1968 45.51969 90.51970 113.01971 207.01972 estimated 237.0
6. Though one or two contractors have recently relinquished part oftheir offshore areas ahead of the date stipulated in their production-sharingcontracts, the conclusion still holds good that optimism remains high aboutcontinued exploration offshore Indonesia. There has been no discovery yetof a Middle Eastern size since the Minas field. On the other hand, it couldstill happen as in the case of Libya, Alaska and the North Sea. Meanwhilethe new fields thus far developed at Ardjuna, Cinta and imminently atAttaka are still economically attractive to contractors in view of theprofit-sharing arrangements in their contracts, the high price commanded bylow sulphur oil and the relative nearness of the Japanese market.
Offshore Boundaries
7. With a view to rapid development of offshore oil resources, theGovernment has made effort to reach agreement with neighboring countrieson offslhore boundaries. In December 1971 it signed a tripartite agreementwitlh Malaysia and Thailand on offshore boundaries and signed a furtheragreement with Malaysia defining the continental shelf boundary in thenorthern part of the Malacca Straits and the Andaman Sea. Some ten otherboundaries need definition, particularly those with S. Vietnam andAustralia where there are prospective areas for exploration. Indonesiaand Australia have demarcated their offshore boundaries between West Irianand Papua/New Guinea, between West Irian and Australia between Timor andnorthwest Australia.
Oil Pollution
8. While oil pollution in Indoniesia has still not become theserious problem which it is in most industrial advanced countries, stepsneed to be taken as soon as possible to avoid contamination of air andwater in view of the recent rapid growth of the Indonesian manufacturingindustries. In view of the ever-growing risk of oil nollution from tankertraffic and offshore oil exploration and production, the Government MineralOil and f.as Tnstitute (LEIMTCAS) took the initiative in 1970 in Petting up
ANNEX 5Page 3
an informal study group with representatives from Lemigas, Pertamina, BandungInstitute of Technology, Bogor Agricultural Institute, Gadjah Mada University,the Navy Hydrographic Office, and the Directorate of Fisheries. In March 1972the Minister of Mines established a permanent committee staffed from hisMlinistry, Pertamina and LEMIGAS to advise on policy and regulations tocontrol oil pollution. Its functions are to draw up a joint policy andregulations on preventing and combating oil pollution of sea, air andshore; to coordinate with the other relevant ministries in applying theinternational convention regarding oil pollution at sea, to direct researchand investigation of the effects of pollution on sea, air and shore; and toparticipate in international and national bodies concerned with pollution.The permanent team is now preparing regulations, and the Ministry hasalready adopted certain measures to control oil pollution.
Production
9. Though commercial production of oil in Indonesia first startedin 1893, crude output twenty-one years ago (1951) was still only 152,000 b/d.Production rose to 467,000 b/d in 1966 and then at a compound annual growthof 16.3% to 854,000 b/d in 1970. It averaged 892,000 b/d (325.6 millionbarrels) in 1971, an increase of only 4.5% over 1970. 1/ In 1972 total produc-tion is expected to increase by 24 per cent over 1971 to reach 1,101,000 b/d(403.1 million barrels). A strike of Japanese seamen working in Japanese-flag ships, which took place from mid-April to mid-July, caused a cutbackof oil imports into Japan during those months from the Middle East and Indon-esia. Indonesian crude production was consequently cut back from levelspreviously planned for those months. Since then, Japanese buyers havebeen hard seeking crude imports to replenish critically depleted stocks.Indonesian crude production in 1972 hence is likely to be only slightlylower than that expected had there been no Japanese strike.
10. The sharp growth of output in 1972 compared with 1971 results frommajor increases in output onshore under contracts of work, essentially Caltexand offshore under production-sharing contracts. Caltex brought productionin its contract area up from 720,000 b/d average in 1971 to an average 781.000b/d in January-March 1972 and to a record 875,000 b/d in April. It plannedto bring it to 900,000 b/d in April-June and to a level of 940,000 b/d inJuly-December. Its production during May-July was cut back by some 60,000-100,000 b/d from that planned as a result of the Japanese strike, and is nowestimated at 870,000 b/d in July-December. Its expansion was achieved bybringing four new central Sumatran fields into production at Bangko; SouthBalam, iIenggala and Kotabatak. It has now installed (i) a new gatheringsystem and pipeline to bring crude from the first three fields to the mainSumatran oil loading port of Dumai, and (ii) a new pipeline from Kotabatak
1/ Further details of output are given in Table 1 and discussed inparagraph 9 of Annex A to the last economic report (EAP-27a) datedNovember 30, 1971.
ANNEX 5Page 4
field into the existing line connecting the Minas field to Dumni- T t haszalso built additional storage tanks and loading facilities and a thirdpier capable of handling 150,000 d.w.t. tankers at Dumai. CGltex's outputin 1972 is expected now to average 840,000 b/d. Under production-sharingcontracts output is expected to grow during 1972 from the Ardiuna and Cintafields but not to start until early 1973 from the Attaka field offshoreN. E. Kalimantan operated by Union Oil/Janex or from the rorridno blockin Central Sumatra, assigned by Redco to Stanvac in February 1971. Pertamina'sfield under development at Diatibarang, W. Java is alsn not expected to startoutput until early 1973.
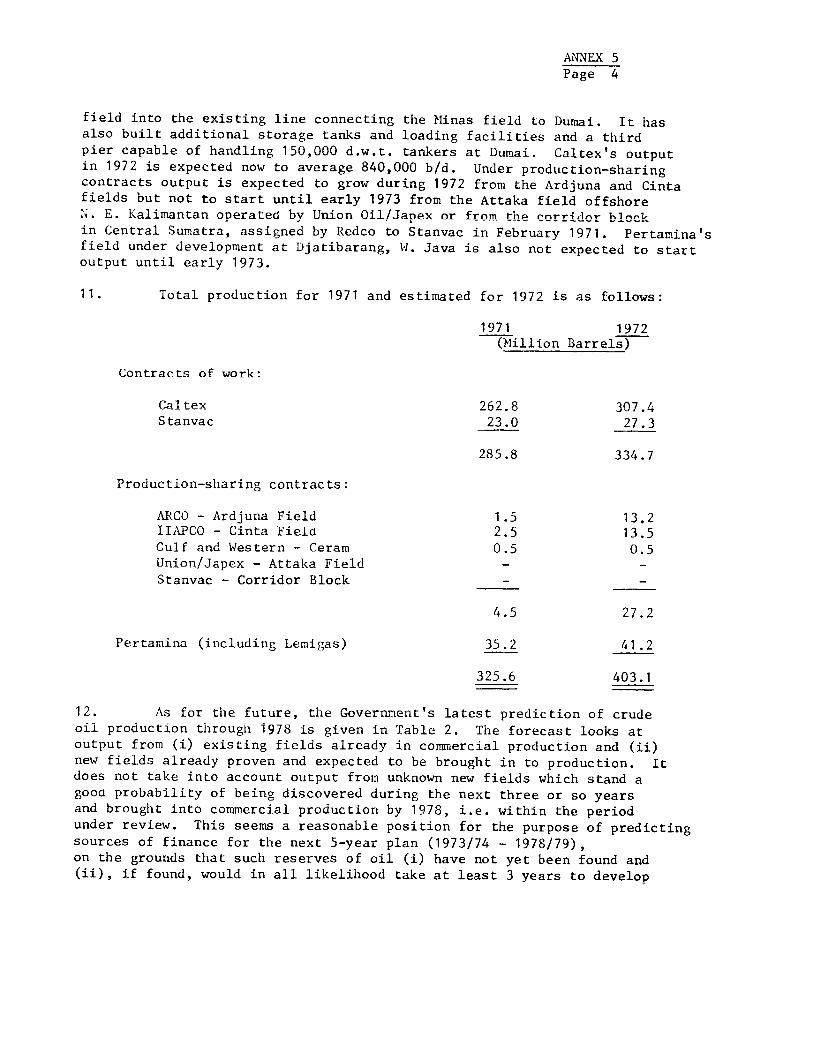
11. Total production for 1971 and estimated for 1972 is as follows:
1971 1972
Contracts of work:
Caltex 262.8 307.4Stanvac 23.0 27.3
285.8 334.7
Production-sharing contracts:
ARCO - Ardjuna Field 1.5 13.2IIAPCO - Cinta Fie-l 2;5 13.5Gulf and Western - Ceram 0.5 0.5Union/.janPx - Atta-;ka Fieldl -
Stanvac - Corridor Block -
4.5 27.2
Pertamina (including Lemigas) 35.2 41.2
325.6 403.1
12. As for the future, the Government's latest prediction of crudeoil production through 1978 is given in Table 2. The forecast looks atoutput from (i) existing fields already in commercial production and (ii)new fields already proven and expected to be brought in to production. Itdoes not take into account output from unknown new fields which stand agooa probability of being discovered during the next three or so yearsand brought into commercial production by 1978, i.e. within the periodunder review. This seems a reasonable position for the purpose of predictingsources of finance for the next 5-year plan (1973/74 - 1978/79),on the grounds that such reserves of oil (i) have not yet been found and(ii), if found, would in all likelihood take at least 3 years to develop
A^NNEbX 5Page 5
fnr inittial production and annther 1-2 years for full production. However,the forecast made for the first two sources above indicates the continuedneed for an active exploration nrnogrm tn find and hring new fields intoproduction by 1977, if total Indonesian production is not to risktdecl i ning from its predicted plateau in 1976. The official forecast
predicts annual increments in the combined output from the first twos-ources above from t,1391 n -,/,I`A 4114-19721,00 (.1* .li bres i 19 o ab'out
1.8 million (669.0 million barrels) in 1976, a compound growth of 13.5percent yearly. HoWeve e it- j4nAIc--scCMbie.4 decline to about 1.7
million b/d (617.1 million barrels) by 1978.
13. Production from existing fields under contract of work is seento peakl at about 970,000 Ib/d rIn 19173 wlhen Caltex's felds in cer,traLL S-u1atra
are fully developed, and thereafter to decline at an average rate of 21 percent yearLy to Just undler 400,000 b/U d In 1970. The_ above L. L re
derived from the contractors ' own estimates and appear to be on the conserva-tive side*. If true, however, it indicates the need for lmproved recoveryof reserves from existing fields, for example by drilling extension wellsaLd 'Lncreasing the use OL secondary recovery techniques. A decline rateof 10 per cent yearly, for example, would result in an additional 200,000b/d of output from such fields in 1978. The additional outpuit would resultin a combined output of 1.9 million b/d (688.1 million barrels) in 1978from the above two sources, thereby avoiding the predicted decline in totaloutput. Production from existing fields under production-sharing contracts- Ardjuna, Cinta, Ceram, Attaka, and corridor block - is foreseen to reachits plateau of just under 300,000 b/d in 1975 to 1976 and thereafter todecline by about 16 per cent yearly. Production from existing tields,operated solely by Pertamina and including the Djatibarang field, is fore-seen to reach a level of just under 150,000 b/d during 1973-1976 and there-after to decline by about 10 per cent yearly. Combined production fromall existing fields is therefore seen to decline from a peak of 1.3 millionb/d in 1973 to about 700,000 b/d by 1978.
14. Production from new fields - already proven and expected to bebrought into production - is foreseen to emerge from such promising areasunder contract of work as the Petapahan, Suram and Sintong fields (Caltex)in central Java, and under production-sharing contracts as those discussedin paragraph 3. Such production is assumed to start in 1973 and toincrease through the period reaching 1.0 million b/d by 1978.
"Pro-rata"l Crude
15. A feature of the Indonesian arrangements is that with the exceptionof the four earliest production-sharing contracts, each crude oil produceris required to supply to the Government at cost plus 20 cents per barrel a"pro-rata" share of its output. In the case of Pertamina itself and theproducers operating under contracts-of-work, the pro-rata share which theyare obliged so to deliver to the Government, is a percentage of theiroutput equal to the percentage of total national output represented bydomestic market requirements. In 1971 the sales volume of refined products
ANNEX 5Page 6
in the domestic market was about 44.0 million barrels. For the purpose ofcalculating nro-rata rrude obliaations. this is taken to equal 49.1 million
barrels of crude oil input to domestic refineries, assuming the Indonesiaconvention of 10 ner cent for fuel use and losses in refining. In 1972
the domestic market requirement is officially estimated at 46.9 millionbarrels cim.ilrlv indirnting 92=4 million harrels of crude oil innut. The
pro-rata percentage was therefore 15.1 per cent for 1971 and is currentlyaestimtted :at 13. n npr cent for 1q72.
16. In the case of production-sharing contrarts (other than the four
earliest), this percentage is applied not to their total output but only tot';e contractor'- sha-e of tha-f output (after deductAing i-sts ann t-ha
Government share of output). The remaining contribution due from theseoperati-ons to the national pro-rata supply m.ust be provided f the
Government-Pertamina share in output under these contracts. The principle.for calc.u"ating prourata crudde is showr. ir. T*able 55 for 10971* ar.d 1972.
17 . IL,or the 'uture, pro=rata deliveries to th e do,estic. ma.rket are
foreseen to increase at about 8 per cent yearly from 1971 to 1978 (Table 2).ThILs is basedu on thLie dorestic .arket proJections .mde in Table 7 and dis-
cussed in paragraph 55. On these assumptions the pro-rata percentagewouldU reL..ain at a tolerable leve.l fro... +th..e vi; bpoint of export availab4lity,
not exceeding 13.5 per cent by 1978. Thereafter it will rise steadilyunless neUw reserves are fLoundU anA brought L - Ai-nto prdt . TheC __._
striking aspect of the forecast is the change in sources of pro-rate crude.
The remaining contrlbut'on due from the Go-ve..umCt-Pertamina share ofoutput under production-sharing contracts could rise from about 0.6 millionbarrels in 1971 to about 39 million barrels by 1978 an.d becomle the largest singlesource (46 per cent) of pro-rata crude. (See Table 2.) The implicationsfor the basic cost of domestic marketing are discusseud in paragraph JO.
II. OIL PRICES
Recent Development in indonesian Uil Export Prices
18. The export price of Indonesian crude oil rose dramaticaily in 1971and 1972. Pertamina raised its price for export sales of 35.0 API Minascrude oil to its 50 per cent affiliate in Japan, Far East Oil TradingCompany, from $1.64 per barrel f.o.b. Dumai in early 1971 to $2.21effective April 1, 1971, $2.60 October 1, 1971 and $2.96 April 1, 1972. It
raised prices to other customers from $1.67/$1.70 per barrel in early1971 to the above prices on those dates. All these prices are inclusiveof 90 days' credit, worth about 3 to 4 cents.
ANNEX 5Page 7
19. Minas crude accounts for two-thirds of Pertamina's crude exports.Perta,i-Lna receivqes 4t as crude-4n-kind f1ro", Cal+--- ',/ A-othe quarter of
Pertamina's crude exports are from its oxmn Rantau field in North Sumatra.: _j___O ADT _ ... T 4 A . 4 AA e A T_+. s o I
115 s's1b VeL y ligh1t * abou tJ X-i .L .. L acnu 'Lse xp oHr .t Sd *. .v .
export price for this crude prior to April 1, 1971 ranged between $1.93and'u $2.13 anu was iLncreased l iLn stages to 4U 9.5C on Apr LJ I 1 1'72.rThe
other crudes which Pertamina produces and exports are from the Bunju fieldin Kalimantan (33° AIrI), anu tLIe K±dILamono LfLe'LUd i1n WeCst Iran 2a2 A . Th/ e
f.o.b. export price for Bunju crude was raised from $1.63 to $2.60 on October1, 1971 and to $2.89 on April 1, 1972. That for Klarono crude, which has goodcharacteristics in making lubricating oils, was correspondingly increasedfrom $2.00 to $2.50 and $2.85.
20. The private contractors followed suit and made corresponuding increases
in their own f.o.b. export prices. Caltex's f.o.b. price for export salesof Minas crude had been $1.67 from July 1970 to March 31, 1971. This wasraised to $2.21 on April 1, 1971, $2.60 on October 1, 1971 and $2.96 onApril 1, 1972. 2/
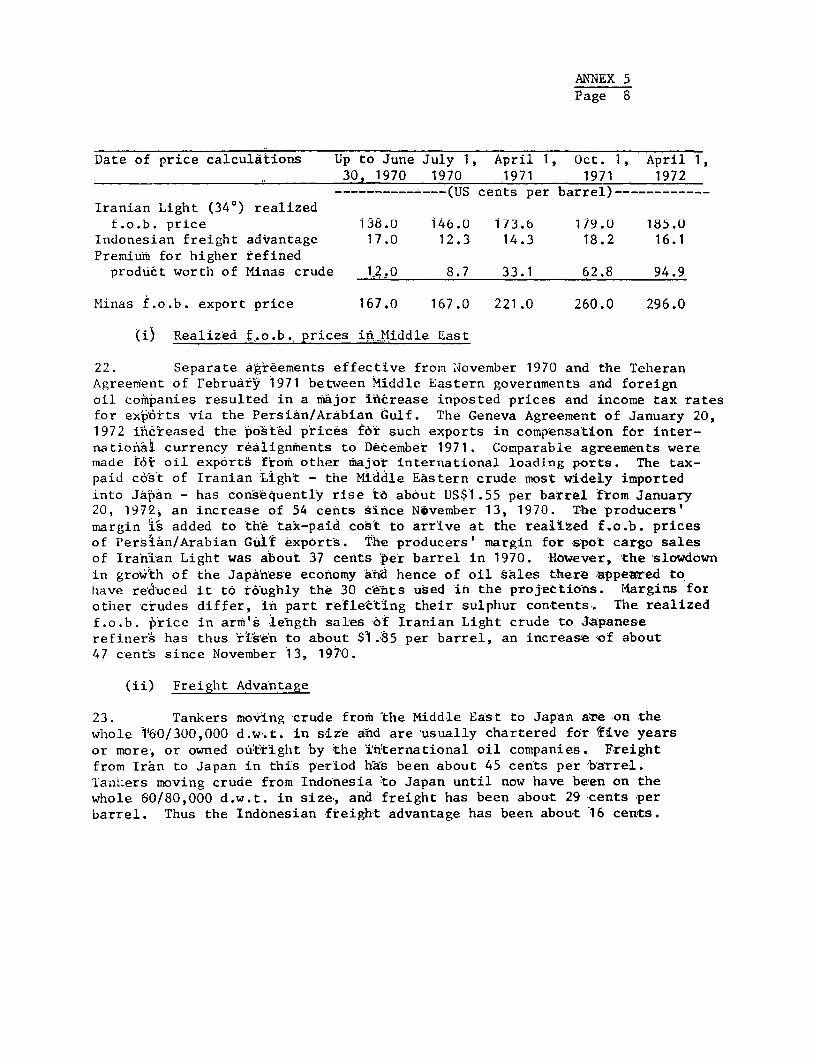
21. The f.o.b. export price of Indonesian crude oil is basicallyderived from three elements: (i) the realized f.o.b. price of an equivalentMiddle Eastern crude; (ii) the freight advantage of Indonesia over theMiddle East into the Japanese market, and (iii) a premium for the higherrefined product worth of Indonesian crude, particularly for its very lowsulphur content. This is analyzed below and in Table 3.
1/ Crude-in-kind is defined in Daragraph 19 of Annex A to the last economiereport (EAP-27a).
2/ These prices are gross of 120 days' credit - worth about 3 to 4 cents -which is Rranted in sales to third parties and to affiliates in whichit has a 50% interest or less. This applies to virtually all itsEastern Hemisphere sales but not to its sales to the U. S. West Coastwhich are to affiliates. Caltex raised its f.o.b. price on June 1,1971for US West Coast Sales to S2.35 ner barrel but brought the nric-e forsales there into line with that for sales elsewhere as from the priceincrease of October 1. Stanvac also increased its exnort nrices forMinas crude from $1.68 to $2.18 per barrel on April 1, 1971,$2.60 on October 1. 1971 and S2.93 on April 1- 1972 with nn extendpdcredit terms. Finally, when crude production started in September 1971from the Arditma and rint- nffrlhnier f4alrti Pirt-Tna and rcont-ractor-priced their exports at $2.60 per barrel inclusive of credit terms, withan increase to $2.96 effert1Ye APril 1, 1972 and higher ian a spotsales. The crudes are again of very low sulphur content and of lightnuality (37 -LO° APT)-
ANNEX 5Page 8
Date of price calculAtions Up to June July 1, April 1, Oct. 1, April 1,30, 1970 1970 1971 1971 1972
-------------- (US cents per barrel)------------Iranian Light (340) realized
f.o.b. price 138.0 146.0 173.6 179.0 185.0Indonesian freight advantage 17.0 12.3 14.3 18.2 16.1Premium for higher refined
produAct worth of Minas crude 1_2,o 8.7 33.1 62.8 94.9
Minas f.o.b. export price 167.0 167.0 221.0 260.0 296.0
(i) Realized f.o.b. prices in .Middle East
22. Separate agreements effective from November 1970 and the TeheranAgreemnent of rebrurfy 1971 between Middle Eastern governments and foreignoil comfnpanies resulted in a major i'ncrease inposted prices and income tax ratesfor exports via the Persian/Arabian Gulf. The Geneva Agreement of January 20,1972 i'creased the posot'ed prices for such exports in compensation for inter-national currency realignments to December 1971. Comparable agreements weremade f6o oil exports from other major international loadi-ng ports. The tax-paid c-691t of Iranian Light - the Middle Eastern crude most widely importedinto Japan - has consiequently rise to about US$1.55 per barrel from January20, 1972, an increase of 54 cents since November 13, 1970. The producers'margin i's added to 'the 'tax-paid cost to arrive at the realized f.o.b. pricesof Persian/Arabian Gulf exports. The producers' margin for spo't cargo salesof Iranian Light was about 37 cents per barrel in 1970. However, the slowdownin growth of the Japanese economy atnd hence of oil sales there appeured tohave redcuced it to t6ughly the 30 ct-nts used in the projections. Margins forother crudes differ, in part refletcting their sulphur contents. The realizedf.o.b. p'rice in arm'` 'length sales of Iranian Light crude 'to Japaneserefiner' has thus '*dsen to about $1 .2'85 per barrel, an increase <of about47 cent's since November 13, 1970.
(ii) Freight Advantage
23. Tankers moving crude from the Middle East to Japan are on thewhole 1V60/300,000 d.w'.t. in size and are usually chartered for -five yearsor more', or owned ouitr'ight -by the itilternational oil companies. Freightfrom Iran to Japan in this period h-Vs been about 45 cen'ts per barrel.Tan!ners moving crude from Indonesia to Japan until now have been on thewhole 60180,000 d.w.t. in size, and freight has been about 29 cents perbarrel. Thus the Indbnesian freight advantage has been about 16 cents.
ANNEX 5Page 9
(iii) Low Sulphur Premium
24. During the mid-1960's Indonesian crude had sold for a discount inexport sales to reflect the adverse value of its wax content for overseasrefiners. However, electric utilities using crude oil directly for steamgeneration and modern refineries with heated storage tanks and vacuumdistillation units are understood to find the wax no disadvantage and tothe contrary to benefit from wax sales at good price, and the high waxcontent no longer penalizes the price of Indonesian crude.
25. In 1968, before the present concern about pollution, the averagesulphur content in Japanese fuel oil was 2.32 per cent by weight. In early1969 the Japanese government introduced environmental health standards neededto combat air pollution due to sulphurous oxides, and in December 1969 itsOverall Energy Council recommended future maximum sulphur contents for fueloils to meet these standards. Sulphur restrictions for fuel oil wereannounced for the fiscal year beginning April 1973, and in late 1971 proposalswere made to stiffen these requirements by 1973 and 1975 for four types ofarea - "over-density, already polluted, precautionary, and non-polluted".
26. Of the main Middle Eastern crude oils only Hlurban crude from AbuDliabi could meet even the specification in 1973 for non-Dolluted areas (1.37per cent) and its total output in 1973 would be scarcely enough to supplya1 fuel oil (including crude oil directly burnt by power utilities) forsuch areas. Iranian crude has a relatively low sulphur content (1.35ner rent we_iht) hbt c2nnnt meet the Jananese suInphur limitations for 1973.
iio knovTn Middle East crude can meet the Japanese limitations proposed for1975. Tapanese fuel oil de>nd in 1973 i-s forecrat at ahout 9-7 milllnn b/dand in 1975 at about 3.2 million b/d. In mid-1972 Japan had capacity todesppinhiri7e anhbiut 5nn 0nn b/d of fuel nil to mPt .TqnnnPvn cphur regullationsand is expected to have about 800,000 b/d of capacity by end-1973. Hencethere isza dearth of low sulnhiur fuel oil available for the Tapanese market,and the price of Indonesian oil is benefitting. In late 1970, the premiumfor the higher refined product worth of Mlnas crude - essentially for itslow sulplhur content - was still only about ten cents per barrel overTrnninn Liaht (Tahle 1 143. joweer the nrire inrrpqo::- for Mfinas_ rrudclp
in April and October 1971 increased the premium to roughly 33 and 66 centsrespectively, and the nrie increase in April 1972 brought the premiulm upto about 95 cents per barrel.
Future Trends in Indonesian Oil Export Prices
27. As for the future, the f.o.b. export price of Indonesian crudeoil is assumed to continue to be based upon the realized f.o.b price ofPersian/Arabian crude, plus the freight advantage of Indonesian over
ANNEX 5
Page 10
Middle East crude to Japan, plus the low sulphur premium. Future trendsin these elements, particularly the low sulphur premium, are noteeasyto predict. In summary, they together indicate that the f.o.b. exportprice-could remain at about $3.00 per barr.el from 1973 to 1976 and risethereafter by a few cents each year. The caiculation is given in Table 3.The projections of Government revenue and of oil exports are very sensitiveto this price forecast,.
(i)) Realized f.o.b. _prices in.Middle East
28. Based upon the leheran and iGeneva Agreements, the f.o.tb. tax-paidcost of ILranian Light crude will rise by about 7 cents per barrel on eachJanuary I of 1973, 1974 and 1975. These agreements expire on December 31,1975. The mission's sprzojections assume that the same provisions wouldcontinue ithrough 1980.. This seems the minimum likely increase., given theevident s.trength of producing versus consuming countries in theZdeterminationof prices.
29. The ongoing negotiations by Middle East members of OP.EC, exceptfor Iran,, for participation of 25 per cent rising ultimately 'to 51 per centin the ;companies producing oil in their countries could increase the tax-paid cost of such crude, to the extent that the producing companies buyback the government's share of oil production at a price higher tthan thearm 's length price for such oil. For example, if a producing company.hasto buy back 20 per cent of total prodkuction from a government.at the quarter-way price (between posted price and tax-paid cost), its tax-paid cost ontotal production would typically be increased by about 7 cents per barrel.The producer can be expected to attempt to pass this increase on to itscustomers.. The Drincinle clearly does not apply to joint-venture agreementsor service contracts nor to Iran which nationalized its industry in 1951with comnensation. On June 24 the Shah of Iran announced that Iran hadreached agreement with *the consortium of oil companies operating thereregarding thie 1nng-term development of the nil industry: Tran is not
directly involved in the participation issue now under discussion at OPEC;the Consortium Agreement will he extended beyond its init-i.l expiry date of
1979; the consortium will actively explore for and develop reserves toennhl ot taitniif tt hell,i tn R Tillie-(n hpe1 -qn(l-hvnd H- norioA of th-e.
Teheran Agreement, future prices will be in line with prices of a "basket"of coAMhTod-itiesan The -pr-drucr margin ia not easy to
ore.izi but is here assumed to continue at about 25-30 cents through 1980 forIrar.ia~n Lg.
ANNEX 5Page 11
(ii) Freiglit Advantage
31. Freight from the Persian Gulf to Japan is projected to remain atabout present levels (Worldscale 55) 1/ through 1975 but thereafter toincrease gradually to about W65 by 1980. These rates take into account(i) recent and future expected increases in ship building costs, (ii)the consequent increase in freight rates in new charters compared withtheir preceding low rates, (iii) to a lesser extent higher bunker charges,and (iv) recent increases and expected future stability in insurancecosts.
32. As for the voyage Indonesia-Japan, Caltex has iust completed theexpansion of the terminal faciliaties at Dumai, Sumatra to ihandle 150,000dwt shins. New offshore storage and loading facilities for the Ardiunaand Cinta fields are being installed this summer and fall respectively andare designed to enable the loading of up to 140;000 dwt shinp. So is theloading jetty for Pertamina's Djatibarang field, expected to startproduction in early 1973. The introduction of tankers of 100!15,s000 dwtis likely to reduce the average freight from Indonesia to Japan to perhapsW 63 i.e. 26 cents ner barrel during the vears 1973-1975. This wonild he
a saving of about 3-4 cents per barrel compared with the voyage by medium-si7zd tankers in use .ntil now. From 1Q76 nnwardsc frpight is predicted torise gradually to about W 75 by 1980 for similar reasons as for the voyagePersi2n Gu1f-JapnAn. Indonesia's freihit advantage over the 7!iddle Eastfor oil supplies to Japan is therefore predicted to be about 18-21 centsner hbrrel during the next few yars.-
(iii) LTo. 5iilnhitur Pvamr rnii
33. Perta-ina hasf s:hor.m bold commeorcial ac,Wmen if. 1obtinn e4e a ;
of about 95 cents per barrel this April in its export sales of Minascrude to Japan. Its demons t,-ar4o I, has 4nduced the e contractors to
follow suit in pricing of their own exports, and the price has thus far held
34. The p 4, a n 14- f A-ve 1-f-te -A1 one Ao1 1 t_ ;_, @ =,,s, ML uz_,,, z * __ A. flU v A.L Z a -Ww i *LwO& s A.0 **UUV|wo s
just over a year. It has raised the export price by half from its levelprior t April 1071 zr.d accounts for one=third of the exotpie ThkI-. *. . J F &jA.LA .i . -Oft t...tlU LUA *JLa -LLL U WJ LAIC I. U L6 '. L± .
premium's future level is fundamental in forecasting the oil sector'scontribut ion to fut.ure economic prospects . Le-L i.ts Leve l 'Ls the ri-,ostvariable and unpredictable component of the export price. The premium
L/ worlU'scale Ls a reference tarliff, in terms or which current rreigntrates are expressed as a percentage. It was introduced on October1, 1969, replacing the preceding reference tariff. It is publishedjointly by the International Tanker Nominal Scale Association, London,and the Association of Ship Brokers and Agents, New York. It isrevised annually.
ANNEX 5Page 12
is clearly above its long-term ceiling which is equivalent to the cost ofdesulphurizing crude oil to meet Japanese specifications. This cost ishard to measure preci§ely, as little reliable information is publishedon such costs, desulphurization technology is advancing rapidly, and thecost per barrel is sensitive (i) to the sulphur content inherent in theraw material and specified in the finished product; and (ii) to the rateof depreciation charged on the plant. However, it is believed by themission to be in the range of 20-40 cents per barrel of Iranian Lightcrude oil desulphurized in refineries to future standards thus far announcedby the Japanese government. There is a good possibility that it may decideto make these standards stricter than those now announced. Such restrictionwould intcrease the above cost.
35. The current premium commanded by Indonesian oil therefore reflectsinsufficient capacity to desulphurize Middle Eastern oil for the Japanesemarket. The leadtime needed to bring in new facilities is roughly threeyears. However, the considerable size of funds needed to install sufficientcapacity makes it unlikely that the bottleneck will be broken three yearsfrom now. As additional capacity become introduced, the premium willdecline but at a rate difficult to predict. It is here assumed to declinegradually from 1973 to 1977 to a level of about 65 cents and to be supportedat that level by a possible further stiffening of Japanese sulphur regulationsover those already announced and over that foreseen above.
Retail Prices of Petroleum Products for Domestic M4arket
36. Retail prices of petroleum products sold in the Government'sdomestic marketing operation had remained unchanged since January 6, 1970until the Government on April 1, 1972 raised the prices of both Rrades ofmotor gasoline by Rp. 5, gas oil by Rp. 1.50, and diesel oil and heavyfuel oil by Rp. 0.50 per litre. It did not change prices of the otherproducts distributed on its behalf by Pertamina, i.e., aviation gasoline,aviation turbine fuel or kerosine.
III. VALUE OF OIL EXPORTS
37. The gross value of oil exports during 1971/72 was aboutt US$596.8million, an increase of 34 per cent over 1970/71 when it was $444 million.The gross value of oil exnorts duiring 1972173 is nnw estimated at- ahoutUS$993 million, an increase of '66 per cent over 1971/72. This es'timateis hnbprd tinnn etjimatpd total nO,tnimt nf 403.1 millinn hnrrelcs i.n 1Q79from which 1.4 million barrels of contractors' losses, own use Wnd changein stocks and 52.L million barrels of pro-ratta deliveries for the domestic
mrprKet are deducted, leaving the equivalent of some 351 million barrels oferude oil for nxport.
ANNEX 5Page 13
38. For the future, gross oil exports are projected to rise in valueto about US$1,770 million by 1976/77 but they decline thereafter to aboutUS$1,650 million by 1978/79. (See Table 5.) Since f.o.b. export pricesare assumed to remain steady through 1976/77 and to increase slightlythereafter, the reason for the forecast decline in the value of gross oilexports lies in the decline in crude oil production which could ensueif new discoveries are not made and brought into production by then. Thephysical decline in future output and exports is illustrated in Table 2.
39. Net oil exports are calculated in Table 4. 1/ They are estimated at$204 million in 1971/72, compared with $126 million in 1970/71, and areestimated to rise to $349.5 million in 1972/73. They are foreseen to riseto about $580 million by 1976/77. Thereafter they could decline, reflectinga drop of about $50 million in tax liability of foreign contractors, unlessnew reserves are discovered and brought into production by then or thedecline rate in output from existing fields under contract of work is sloweddown.
IV. SOURCES OF GOVERNMENT REVENUE
Government Revenue - General
40. Government revenues from petroleum are of three sorts: (a) theGovernment share of the profits from the crude petroleum production andmarketinQ operations of the foreign oil comnanies under contracts-of-workand production-sharing contracts; (b) the Government tax on Pertamina'snrofits from its nroduction. refining and domestis and foreion mnrketingoperations; and (c) the Government "tax" on sales of petroleum products inthe domestic market- which is the rpRidiiul ciiffprpncr hbtfweer total salesreceipts and Pertamina's cost plus fee in acting as agent for the Governmentin the domestir snpply and distrihiitinn operation.
Government Revpniip from noreicn Contractors
41. Government revenue for 1971172 from foreian oil companies onperatingunder contracts of work and production-sharing contracts anounted toRn 112-7 hillion (US$284.3 million) 2/, a third of all Governm ent rThis is an increase of 65% over the Rp 68.5 billion received in 1970/71 androcsults mninlu frnm tho increas in exn,rt price in 1971. Since output
from areas under production-sharing contracts only began in 1971, therevenues in 1971/72 from such output amounted to only about Rp 1.7 billion.Table 5 shows the calculations for 1971/72 and 1972/73.
1/ The method of calculation is discussed in paragraph 38 of Annex Ato the last economic report (EAP-27a) dated November 30, 1972.
9/ The basis for computij.fng Governm,.ent revenue LromLA contracts olf worlkand production-sharing contracts is explained in paragraphs 41-42an' If,5C respecti-vely of tAii-nex AL to the 'Last economiLc report.
ANNEX 5Page 14
42. Government revenue for 1972/73 from foreign contractors is esti-mated at Rp 201.4 billion (US$485.4 million), an increase of 79% over 1971/72mainly because of an estimated 32% increase in average estinated exportprices for 1972 and an estimated 24%` increase in volume output. Thegrowth of output from fields under production-sharing contracts wouldincrease Government revenue by about Rp 13.0 billion, but most of therevenue growth (Rp 81.8 billion) would be brought in under contracts of work.
43. For the future, Government revenue from foreign contractors isforecast to jump again in 1973/74 to about Rp 249 billion. This increase of24% over 1972/73 reflects essentially the growth of output expected fromthe fields in Sumatra operated under contracts of work and from theArdjuna, Cinta and Attaka offshore fields and the corridor block in SouthSumatra operated under production-sharing contracts. The average f.o.b.export price for crude oil and products is assumed at $2.93 per barrel netof credit.
44. Calculations of the forecast for 1973/74 - 1978/79 are given in'table 6. Government revenue from foreign contractors is forecast to increaseby an average 9% yearly to about Rp 320 billion in 1976/77. This lowergrowth rate results particularly from the assumptions that the export pricewill remain by and large unchanged and that output from new fields - nowunder development but not producing - will amount to about 300 million barrelsbut will be partly offset by a decline of about 21% yearly in existing fieldsunder contracts of work (Table 2). In 1977/78 and 1978/79 such revenue isforecast to level out at about Rp 300 billion, assuming that the export priceedges upward but thiat output from existing fields declines by a greater amountthan that from new fields grows. This emphasizes the need for Indonesia toencourage (a) recovery of additional reserves from known fields, forexample, by drilling extension wells and increasing the use of secondaryrecovery techniques, and (b) exploration.
45. Some of the assumptions made in forecasting Government revenuefrom forei,n contractors are particularly sensitive. A variation of tencents per barrel in the export price would cause a correspondinp, yearlyvariation in such revenue of about Rp 10 billion during the period 1973/74 -
1978/79.
46. An increase of ten million barrels' output (27,400 b/d) will cor-respondingly raise Government yearly revenue by about Rp 7 billion undercontracts of work and by about Rp 4.5 billion under production-sharingcontracts. If output from existing fields under contracts of work were todecline at 10% instead of the current forecast of 21% per annum from a peakin 1973, Government annual revenue in 1978 would be higher by Rp 47 billion.Tf sales vol ume in the domestic market and the correponnding nrn-rata- rrt-tdpobligation were to increase one percent faster after 1971 than estimated in
'abl 7 the GovernmPnt 's net- nrofi-t fror. dionueticr m- -i- cnqrt4 no 1i,, 1 Q7./7Q
might be higher by Rp 10 billion, but its revenue from foreign contractorswould be low.rer by Rp 1.4 billion than forecast here. Other assumnptionsincluding those on production costs for contracts of work are less sensitive.
ANNEX 5Page 15
Government Revenue from Bonus Payments by Contractors
47. To the above amounts of Government revenue from foreign contractors,bonus production payments from production-sharing contracts need to beadded. The new Pertamina Law of 1971 requires Pertamina to transfer to theGovernment 60% of bonus revenues. Sucih revenues have now been defined toinclude only bonuses payable when production reached specified levels, notsignature bonuses or payments for geological data which become part ofPertamina's general taxable income. The first revenues from this sourceare expected to accrue in 1973 (Rp 0.5 billion) and 1974 (Rp 1 billion)from the Attaka and Cinta fields respectively; no suclh contractual obligationapplies to the Ardluna field (Table 6).
Government Revenue from Pertamina's Overall Operation
48. Pertamina's income is derived partly from fees earned as agentfor the Government in the domestic distribution of oil; the fees are forrefining and marketing (10 cents each per barrel) and for the Dro-rata crudeit delivers to the Government (20 cents per barrel). It distributes solventsand other special products, bitumen, wax, lubricants and Preases for itsown account in the domestic market; exports on its own account (a) part ofthe crude oil produced from its own fields. (b) nart of the crude nilobtained under crude-in-kind arrangements, and (c) products surplus todompstir market requirements refined from its own cruide and crriie-in-kind;
and receives income from chartering freight to third parties. Operatingrevenue from the nbvre sniirres and nonoperating revenue from signaturebonuses and geological data payments constitute Pertamina's gross revenueQiih4etr to tax. Other Qoiirres of revenue include (a) the five percent of
allocable income from production-sharing contracts which it retains, (b)the .0 An r -efnt of prodiut40n hnu,saec wLhiclh jt- T4 11 r-f-4- t - f-lw-he theyb
payable, and (c) dividends from Far East Oil Trading and other foreignandl do..estic -affilli-ate-s. Pertami4na is understood not to) be liable t1o 'taxon the first item, though operating expenses financed from this source are
not deductible ln computlng tax. Pertami.nla is not liable ta o tax on thLe
second item and is believed not to be liable on the third, assuming thattax has already been naid hy Quirh affiliates.
49. Pertaminnc antc 4sit i n .cred on is own -account are thosc for
exploration, production, refining, freight and head office, to the extentthat these costs a,e not v -oae to 'Cl .het Ve rInIeCtIL do mUIIsr LiLL uL OLL LVI n
operation and reimbursed by the Government.
50. Its net revenue before depreciation was officially forecast for1971 at US$46.0 'illion. However, depreciation of US$26.5 millio .- wasestimated to reduce the net profit before tax to US$9.5 million and to resultin a tax lbilULiLy of about US$. r .±±iion (Rp 2.4 buillion) at the 60 percent rate applicable as from 1971/72. Presumably because of rising operatingcosts and'U depreciation, PLertamina i.4n Lfact paid Ap 1.5 billion. Its netrevenue before depreciation was officially estimated in mid-1972 at US$68.2million. This reflects a sharp rise in Pertamina's exports from its own
ANNEX 5Page 16
production and in f.o.b. export prices, offset only in part by higher operat-ing costs. Reflecting the growth in its capital expenditure programs, Per-tamina's depreciation was officially estimated at US$43.2 million. Thiswou'ldI reduce LILhe net prof4it I-efore- tax to US$2JO rillo ar,41sut n WUUU £~UL I~ L L p. ~ L U~L LVL L-A LU UOY49 g..)U fLI.-L..LIUon andU res~u±L L 11 a
tax liability of US$15.0 million (Rp 6.2 billion). In fact Pertamina paidRp 1.0 billion. It is expected to pay Rp 3.5 billion in 1973/74. / The
mission's projection of Government revenue assumes that Rp 6 billion is theminimLum CUILLLUUL±iLLW'L L -wich Pertamina wouldU rlak LL theeaeL LLr Lhrough I 9 ,7 8/7.
51. Until 1971/72 inclusive, Pertamina's contribution to Governmentrevenue was collected by the Director General of Taxes and shown as partof revenues from domestic corporation tax. As from 1972/73, it is coilectedby the Director General of Finance and included as part of revenues fromforeign oil contractors.
Government Revenue from Domestic Oil Marketing
52. Mlainline oil products are supplied and marketed in Indonesia byPertamina, acting as the Government's agent. It collects the gross proceedsof marketing these products at Government-fixed retail prices and receivesreimbursement of its basic costs plus a fee for conducting the domesticdistribution operation. The Government retains tne net protit from tne
operation 1/. The Government's net profit from the domestic marketingoperation increased trom Rp 17.4 billion in 1969/70 to Rp 28.8 billion in
1970/71, reflecting the sharp increase in the retail prices of gasoline,kerosine and other products put into effect early in 19/0.
53. The Government's net profit trom domestic marketing in 1971/72was only Rp 28.3 billion, slightly less than in 1970/71. On the one hand,it was assisted by (a) a rise of some 12% in sales volumes, (b) the shiftof consumption from 79 octane to 87 octane gasoline whose price was Rp 5per liter higher, and (c) the credit to the domestic operation resultingfrom the price increase in refined products exported as surplus to domesticmarket requirements. On the other hand, the operation's basic costs wereincreased by (a) the higher Rupiah cost of the foreign exchange componentof operating costs resulting automatically from the Rupiah devaluation ofAugust 1971, and (b) the higher price of crude-in-kind supplied as fromApril 1971 and October 1971.
54. The Government's net profit from domestic marketing in 1972/73is now officially estimated at Rp 31.6 billion, because of (a) the riseexpected in sales volumes, (b) the increase in April 1972 in the retailprices of motor gasoline, diesel oil and heavy fuel oil, and (c) the credit
I [Lh ULaLLLI Lop r .s dcussed i par-agrap,, I -4t of AnnexA t o th e
last economic report (EAP-27a).
ANNEX 5Page 17
to the domestic operation resulting from the furtlher price increase inApril 1972 in heavy fuel oil. Furthermore, the inland transport costallowed for premium grade gasoline was to be reduced in April 1972 fromRp 3 to Rp 1.20 per liter which was the 1971 cost for the lowest grade-previously used and now withdrawn from the market. On the other hand, theexnected basic costs were increased by (a) the higher price of crude-in-kindsupplied as from April 1972, (b) a threefold increase in sea freight ofcruide sunnlied for domestic refining. (c) the assumotion that nrodticts aredelivered to the domestic market only from the older and presumably highercost refinpri es and not from the new refineries of Siingei Pakning andDumai, though in fact the latter supply at least gasoline and kerosine tothe domestic market, and (d) increased wage a dpnrecintion..
55. Projection-t of future reveue w.Jill have to be based -c ful
forecasts of sales volumes of each of the eight main products. The growthis likely to be different ir each case. For example, now that the conversion.from piston to turbine-engined aircraft is virtually completed, sales ofaviation gasolne w-ill pr-bably remin stagnant but those of aviationturbine fuel will probably continue to grow strongly. Sales of premiumgraduCe gasoliLne can bue expected to rise buoyantly but those of the best gradeto rise more sharply, though from a far smaller base. Sales of gas oilare a'lso lik1ely to1 4_o -- Al bohi uo..tv ehce n i osrcare ~ ~ L- ,LN ± y t o gr w A. A1LLL. SJ1 LiLt A. LLl aU L1.UILIU. L. V ~ V %;L.LL L. Lt.: kCILLU L Li LkUiJii LL U%C-
tion and manufacturing industries. So to a lesser extent are those ofd. esel o`l and luel oil, fPor examiple in maufcurn --- owrgeeato,ui -L L J-L L IIU LU L LJ±L £.L -~1 L LLt=, -JL I Lia LULJd L L;.U L-L Lii L , ILLLpU UW t-L 8CLttrLd L.LVL).
On the other lhand, sales of kerosine - 43% of total sales in 1971 - arelikely to re'lect the slower growth in per capita inUone. A study oflong-term future growth of the domestic market is being prepared byPertamina wiLt the assistaLce ofL coisuLtaits . ILts results are expecteulater this year and need to be taken into account in the forthcoming
o_ _ A_--__ _ _ _ r 1 4n ) R r 4 v Spreparation of tle Goverument s next 5-year plan k197u/7I -
Table 7 illustrates the possible effect on sales volume through 1980 ofdifferent growth rates for individuai products. It comes out with aweiglited average growtlh rate of 8.1% related to actual sales volumes in 1971.This forecast is taken as thie basis of the future pro-rata crude obligation.
56. The aDove forecast results in a compouna annual growtn of 10.1%in gross revenue by 1978/79 from that officially estimated for the Govern-ment's marketing operation in 1972/i3, at Aprii 1972 prices unchanged(Table 8). The basic cost of the operation, inland transport costs, andpump margin are also roreseen to rise at 10.3 per cent p.a. tor reasonsoutlined below. The net profit from domestic marketing is hence tentativelypredicted here as rising to about Rp 62 billion in 1978/79, a compoundyearly growth of 11 per cent over the Rp 31.6 billion now estimated for1972/ 73.
57. A summary forecast of the basic cost, inland transport cost, andpump margin of the Government's domestic oil marketing operation isattempted in Table 9. By far the largest cost is the basic cost to
ANNEX 5P age 1
Pertamina in running the operation, and 70% of the basic cost is that of
the crude oil input to Local refLineries. An attempt ls iidUe lna 1 0
to forecast the crude input needed through 1978 to meet domestic salesrequirements. WLLLI Le CuuUL1LULA_LLr Ln 1971 o LILe IUJ L CLLLU a ULLSr,L
Pakning refineries, and in 1975 of the proposed Tjilatjap refinery,Indonesian refineries appear prima- facie to hlave capaclty to pLULoc5
crude enough to meet all domestic sales of kerosine, except in 1977 and 1978when some kerosine imports seem needed. On this basis the next major
expansion could be required on stream in about 1979, assuming there iseconomic justification in minimizing product imports.
58. The mission's projection assumes that the f.o.b. export pricewould apply to Government crude from production-sharing contracts deliveredto the domestic operation (see paragraphs on pro-rata arrangements). If
this is correct, the cost of transferring such Government crude to thedomestic operation could grow from nothing in 17/z to aDout $120 millionby 1978/79, or one-third of the basic cost. The effect would be toreflect to a larger extent in the cost of the domestic operation theinternational level qf oil prices. Such an effect would be augmented tothe extent that crude is imported and its landed cost invoiced to thedomestic operation. The price at which the Government invoices crude to
the domestic operation in principle does not matter, insofar as it has ai-
ready obtained the crude at production cost plus a 20-cent fee and receives
the net proceeds on the sale of the refined products, whether the proceeds
are attributed all to the domestic marketing operation or in part toGovernment account elsewhere. In practice, however, the Government might be
more likely to retain this profit rather than to pass it on as a subsidy
to consumers if the crude were to be invoiced to the domestic marketingoperation at the full f.o.b. export price instead of cost plus fee.
V. PERTAiINA'S CAPITAL INVESTMENT PROGRAM X.D FINANCING
Introduction
59. Pertamina is well established as an integrated oil company andengages in all phases of the industry including exploration, production,
refining, shipping and distribution. Until this year its capital invest-ment program was under the general purview of the Minister of Mines.However, the new Pertamina Law of September 15, 1971 provides for theestablishment of a Board of Commissioners to guide Pertamina's development 1/.
This Board was appointed by President Suharto on Marclh 1, 1972 and consists
1/ A summary of Pertamina's history and function and the PertaminaLaw is given in paragraphs 1-7 of Annex A to the last economic
report (EAP-27a).
ANNEX 5Page 19
of the Mlinisters of Mining (Chairman), Finance (Deputy Chairman) andDevelopment Planning. They are responsible for directing Pertamina'spolicy, based on its budget, work program and investment proposals asrecommended by Pertamina's five-member Board of Directors.
60. Pertamina's recent and possible future investment activitiesare described below. As already indicated, the magnitude of its invest-ment operations is very large, and Pertamina has been obtaining a majorpart of the financial resources required by borrowing abroad on quitehard terms. Pertamina has established its credit abroad and is clearlyin a position to borrow additional substantial amounts, albeit on hardterms. It is able to generate sufficient funds to meet its debt serviceobligations principally because for tax purposes the Government has acceptedPertamina's practice of depreciating those assets acquired since 1968with foreign financing at rates equal to the debt repayment periodsinvolved. The depreciation periods are, as a result, generally five yearsor less whereas the life of the assets and the normal depreciation periodsapplicable are much longer. The consequence is that Pertamina's corporateprofit tax obligations to the Government are very much reduced. Thistechnique of depreciating assets for tax purposes at the rate of debtpayment in effect preempts Government revenue for Pertamina's investmentprogram in a virtually automatic or hardly noticeable manner.
61. The effect is to reserves to Pertamina itself, rather than tothe Government, decisions with respect to the use of a substantial partof the investment resources available to the economy. This creates therisk that Pertamina may undertake investments which, even if wise fromPertamina's point of view. may command lower priority than other invest-ments which might be undertaken with the same resources. It means thatthe same criteria are not applied in the case of Pertamina's investmentdecisions as are applied elsewhere. It gives rise to the danger thatrelatively high risk and high cost investments may be undertaken whichmight better be undertaken by the foreign investors able and willing to doso or which might better not be undertaken at all. Tt seemis de-irnhlethat Pertaminas's investments should be judged by the same criteria asapply in other sectors of the economy and that, to the maximum extentpossible, they be financed by long-term concessional credits from abroad.It is for this reason that the $200 million credit offered by the (overnment
of Japan for the development of the petroleum sector is to be welcomedprovided that thiq crediit Q,hsti1tu,tes fnr rather tha. adds to hardcommercial credits and provided also, of course, that the investmentsfinanced are annrnnriatelv selected.
Enlnrnatinn andi r)evulonmpn-
62. Pertaminn onr its nw.M ea ad produces in certain areas.- Inother areas it operates through contracts of work and production-sharingcontracts, under w..hichl foreign contractors make all the investment requiredin return for a share of any oil which may eventually be produced. TheGovernment's view has bee that Pertamina should. J-LA ueake explot a nd
ANNEX 5Page 20
development operations at least where the risk might be judged to be notunduly high, altnough higher risk and higher cost exploration would bestbe left to foreign contractors. Pertamina's exploration and developmentprogram is therefore essentially onshore in accessible places: N. Sumatra,the Palembang area of S. Sumatra, Djatibarang in W. Java, and the Tandjungarea of L. IKalimantan.
63. The policy of restricting Pertamina's exploration and developmentprograms to easily accessible and geologically attractive places looksrighit. Considerable funds might otherwise be invested only too easilywithout resulting in commercially worthwhile production.
64. Pertamina plans to develop producing fields further and isconsidering tihe installation of secondary recovery teclhniques such aswater flooding and gas injection. It bought $20 million of drillingequipment in 1971 for use in the N4. Sumatra and E. Kalimantan fields. Thisis being financed from Japanese commercial credits, repayable in crudeover 5 years. Its main effort now is to develop the Djatibarang field.The present investment there is expected to result in production startingin early 1973 and building up initially to 60/70,000 b/d. It is beingfinanced from three Japanese commercial credits, amounting to $139 million,repayable in Djatibarang crude over 5 years. This is a substantialaddition to the volume of Indonesia's external public debt and, prima facie,a rather costly investment. It raises the question whether further suchdevelopments should be undertaken by Pertamina itself or through foreigncontractors.
65. Pertamina is now looking for gas reserves near Djakarta for usein power generation or town gas distribution, and in East Java for use inthe Petrokimia fertilizer plant in substitution for heavy fuel oil. It alsoplans to supply natural gas to the proposed new fertilizer plant from itsfield under development at Tjirebon, W. Java. The incentive for findinggas has grown greatly this last year, insofar as its economic worth indomestic sales is that of low-sulphur fuel oil released thereby for export.There have been recent reports that consideration is being given in Indon-esia to possible schemes to export liquified natural gas (LNG). Pertaminais understood to have signed a letter of intent with the Californian gasdistribution utility Pacific Lighting to supply LNG over 25 years, start-ing in 1976, for use in southern California. It is also understood to bezot,nidering an LNG scheme with Japanese participation (Bridgestone andFEOT) for supplies of LNG to Japanese steel companies. Mobil is apparentlysounding out Japanese interests with a view to a joint venture for theexport of gas from the Arun reservoir in N. Sumatra.
Oil SuDDlV and Service Bases
66 Offsqhnrp ci1 exnloration and nroduction activities have* led to
the establishment of four oil service and supply bases which are increasinglyable to offer services hitherto provided from Singapore.
ANNqEX 5Page 21
67. In May 1971, President Suharto inaugurated one of these baseson Batam Island, which is one of the Riau islands within Indonesia justsouthi of Singapore. In November 1971 he also established by decree aGovernment Board, chaired by the President-Director of Pertaniina, GeneralIbnu Sutowo, to plan the island's further development. In May 1972,Pertamina agreed with the U.S. firm Bechtel and the Japanese trading firmNissho-Iwai to make a joint feasibility study of the possible establishmentof an industrial estate on the island, including a free port. The develop-ment would include oil and general cargo marine terminals, airport, roads,utilities, recreation facilities and housing. The study contemplates thatwith this infrastructure private enterprise would undertake a variety ofinvestments including processing industries and a refinery for externalmarketing of products (paragraph 74).
60. The three other service bases for offshore operations are atBalikpapan in E. Kalimantan operated by Pertamina, a second on lIasalemboIsland, Java Sea, operated by a U.S. oil contractor (Ashland Oil) and athird at Xlerak on the N.W. coast of Java, operated for Pertamina by aU.S. contractor (Santa Fe-Pomeroy). The Merak base is operatedas a duty-free port and is designed to provide storage of oil well suppliesand a convenient site for construction for offshore construction and mechanicalrepair facilities. Facilities under construction include a helicopter padand an international and shore-to-ship telecommunication center. Subsequentexpansion plans there include an airport for direct service by charterairlines and a dock for ocean vessels drawing up to 45 feet.
Pipelines
69. Pertamina completed a pipeline last year to take petroleum productsfrom Tiilatiap to Maos in central Java and is arranging for its extensionto Jogjakarta. It completed a submarine pipeline to enable the loadingof large-sized crude oil tankers at Pangkalan Susu in l. Sumatra and isconstructing otlhers at Belawan in N. Sumatra and Djatibarang in W. Java.
Re f ining
70. Pertamina has owned and operated all refineries in Indonesiasince January 1970 when it bought the Suneei Gerong refinerv from Stqnvac.It had bought Shell's three refineries - Pladju, Balikpapan and Wonokromo -in January 1966 and it already owned a small refinery at Pangkalan inN. Sumatra. Most of those refineries are old. Pertamina has thereforeengaged in a major expansion nf rofining capacity, recently bringing onstream the Dumai and Sungei Pakning refineries in central Sumatra.
ANNEX 5Page 22
71. In late 1971, Pertamina commissioned an asphalt plant of about60,000 tons per annum capacity at Pladju, South Sumatra and a grease plantat Tandjung Priok, Djakarta. It plans to build a small blending plant forlubricating oils at Tandjung Perak in East Java, importing base stocksuntil they become available from the proposed Tjilatjap refinery in CentralJava.
72. This new 100,000 b/d refinery is expected to come on stream in1975. Under heads of agreement in 1971, Shell undertook to provide financeup to $100 million 1/. However, there now appears to be uncertainty whetherthis arrangement will be pursued. Pertamina is now understood to be nego-tiating with the Japanese firms tlitsui, C. Itoh and Tomen with finance tobe provided from the $200 million, long-term loan offered by Japan toIndonesia (paragraph 92).
73. The next major expansion of refining capacity could be requiredon stream in about 1979, assuming there is economic justification inminimizing product imports (paragraph 57). There could conceivably bejustification for refining for export, but it is not clear in Indonesian'scircumstances that this would produce positive economic returns.
74. For its part, Pertamina held discussions with Japanese refiningcompanies this year on the possibility of creating a Japanese consortiumto finance, construct and operate an export refinery on Batam Islandprimarily to supply Japan. Advantages to Japan could include the avoidanceof air pollution from refining in Japan, value added to the Indonesiandomestic product, and the ability to export products surplus to Japaneserequirements to neighboring countries in South East Asia. The advantagesto Indonesia would be a modest amount of labor and service earnings togetherwith tax revenues accruing to the government. The economic justification,timing and finance of the infrastructure and refinery project for BatamIsland would, of course, be put to Pertamina's new Board of Commissionersfor consideration.
1/ The deal is described in paragraphs 20-23 of Annex A to the lasteconomic report.
ANNEX 5Page 23
LankLer r"Leet
75Pertamina has been u'luding up 'ts Inter L'slI- and ocean-goingfleet. At end-1971 its fleet is believed to consist of 90 vesselsamounting to 900,000 dwt (excluding 140 small vessels). They are eitherowned, operated under hire-purchase arrangements or chartered by Pertamina.By end-1971 it had received 18 out of 25 tankers, mostly about 5,000 dwteach, ordered from Norwegian yards under hire-purchase arrangements. Inexpansion of its fleet of ocean-going tankers - currently of the 30,000to 43,000 dwt range - Pertamina ordered five 115,000 dwt tankers in 1971from Norwegian yards.. it is also understood to be arranging tor the deliveryof three tankers each of 130,000 dwt for hire-purchase over 10 years fromSwedish yards. The first and second ships would be delivered in 1975 andthe third somewhat later. The price is believed to be upward of $20 millionper ship.
76. One aspect for careful consideration is the extent to whichthe acquisition of large tankers under hire-purchase arrangements mayprove more costly forms of freight than the regular long-term charterof such sized vessels. For example, freight for the voyage Dumai-Yokohamawould be 27-31 cents per barrel at the five-year charter rate of Worldscale65-75 which can be envisaged for 100/150,000 dwt ships during 1976-1980.But the freight under the hire-purchase arrangements for these ships isreported to be W 100 or more, which would be 42 cents per barrel or more forthe above voyage. Thus the cost to Indonesia for preferring to acquiresuch ships under hire-purchase terms could be equivalent to an increaseof 11-15 cents per barrel in freight. This would correspondingly reducethe f.o.b. price, as there is no reason to suppose that the cost increasecould be passed on in the c.i.f. price to Japanese buyers. The Board ofCommissioners should review Pertamina's ocean-going and inter-islandfreight operations particularly in relation to outright and hire purchasearrangements, time and spot charters and the appropriate balance betweenthem.
Inland Marketing
77. Pertamina has been actively expanding and modernizing itsinland transport facilities as well as its inter-island tanker fleetto serve the domestic market. The rate of such investment in futurewould presumably depend primarily on the growth foreseen for domesticsales, currently under study (paragraph 55).
Petrochemicals and Fertilizers
78. Pertamina expects to bring the polypropylene plant at Pladjuon stream in early 1973. Plans are under consideration to modifythe older Pladju and S. Gerong refineries - both at Palembang - tomake petrochemical feedstocks as well as some of their present outputof mainline products.
ANNEX 5Page 24
79. Urea fertilizer is now produced at Palembang from natural gasfeedstock by the state fertilizer corporation PUSRI; its plant is beingexpanded for completion by 1974, and Pertamina is constructing and willoperate the required gas facilities. Construction of a second main fertilizerplant is under active consideration. It is likely to be owned and operatedby Pertamina and be sited at Tjirebon, West Java, near the gas field which itis developing there. Financing is being requested from IDA and the Governmentof Japan.
80. Further investments in petrochemicals should be carefullyassessed. Elsewhere in the world, such investments have recentlyshown, on the whole, poor economic returns on capital. The resourcesproduced by oil need to be allocated in the best interests of the wholeeconomy, and the rates of return on investments in as well as outsidethe sector should take the scarcity value of caDital into account. Inrelation to oil-based petrochemical enterprise, also, Indonesia'scircumstances differ from those of most nroducine countries, where sunnlvgreatly exceeds demand and the cost of feedstock is thus around bareproduction cost. Indonesia can exnort at nremium nrices everv barrel Of oilit can produce, so that the real cost of using oil as feedstock is and willcontinue to be about $3.00 a barrel.
Head Office
81. UJntil recentlvy the services needed to qsinonrt a large explorationand production program by foreign contractors have not been available inIndonesia. These servirces have therefore heen nrovided abroad- narticularlyin Singapore and Australia. Pertamina has understandingly made greateffnrts tn mnke sucrh services availahle in Tnrlneoia. In 1971 it nnonet4the Oil Centre Building in Djakarta to provide office accommodation forforeign oil companies, and it has started construction of a 23-storyPertamina Tower in Djakarta to provide office accommodation for itself andforeig. oll companies. I.n January 192 it opened the Pertamina CerntralHospital in Djakarta to give medical care to its staff and family, foreignoil contractors and diplomats, close relations, and the general publicincluding the poor, in that order. It provided substantial assistance foran inte.,.atl-onal 4oint- embassy sch-ool which s-ince cepteumber '91prov4destuition for grades 1-12. For its part the Minister of Mines issued fourdecrees in MrchU 1972) whichU give th-e Govel.nment. some contrVol o-ver-- OperatiOnlso- foreign oil companies not hitherto registered in Indonesia, streamlineproceuures fLor erploying fLoreiLgners, cLar'ily existing rules orL tiie use oUflocally made goods, and encourage companies thus far operating from Singa-pore aC dU ULler cUUonLLtr Le U Uto l Upe 1of cs11 X lUlULLO±d.
Jo.Lit Ventures
02. Pertamina sells its crude oil exports to Japan through FarEast Oil Trading Company, which it holds 50:50 with Japanese refiningand public utility interests. For oil exports covered by tne agreementthis summer between the Governments of Indonesia and Japan, Pertamina will
ANNEX 5Page 25
s uppl A y crd e t.h,o,r Ja u ghTvApan Indonesia Petroleum Company, a new inrit- venture
(paragraph 95).
83. The above ventures presumably require little investment fromPVertmi.inact.AIP~ Howve,i it ha sJ reer.l bee irvet4. nevl t e ethejoint ventures which provide services for its oil activities. It operatesits O-WI LLeet of aircraft andU L'ieLLcoptLers hILLroughI . TL. LeL.L ta A.L SerLvice,
formed in January 1970; the company possessed 25 aircraft and 22 helicoptersin February 197I2 and 's corsiLuerLing extendir.g -t VLt tU foreigr.
contractors and to Pertamina staff for tourism. It has an interest inthe Hongkong firm Tugu Insurance. Since early 1971, it has form1ted t,hefollowing joint ventures:
(a) P. T. Nusantara Star Exploration, (a 50:50 venture withthe U. S. firm Teledyene) to perform seismic explorationand data processing;
(b) P. T. Pertamina Gulf, (with Gulf Oil) to handle storageand packaging of urea fertilizer imports in buik at TandjungPriok harbour, Djakarta;
(c) P. T. Dumai Dockyard Indonesia, (a 60:40 venture with theHongkong based Dumai Dockyard Limited), formed to take overa 20,000 ton floating dock from the Surabaya dock authorityin East Java and to operate it at Dumai, Central Sumatra forthe repair of Pertamina tankers;
(d) a joint venture with the Australian firm Vicker Ruwolt PtyLtd., for the supply of installation and machine tools,
factory buildings, generating plants and manufacturing equip-ment; and
(e) a joint venture with the Hongkong firm of Inter AgenciesLimited to supply ships' stores and to provide warehousingand forwarding services for oil contractors.
84. Pertamina has also moved into the steel industry. In August1970, it joined with the Government in setting up P. T. Krakatau Steel.The Government turned over the assets of the retarded steel project at Tjilegon,West Java and Pertamina was to provide any additional funds. The new enter-prise is pursuing active plants for its completion and expansion. P. T.Krakatau Steel has completed the cold-wire drawing plant and hopes to erectthe rolling mill as soon as funds become available. It has entered into ajoint venture Krakatau Hoogovens International Pipe Industries Pty with theDutch firm of Hoogovens and the Philippine firm of International Pipe In-dustries of Manila. This joint venture will manufacture spiral weldedsteel pipes at Tjilegon and planned to start production in the second halfof 1972. Krakatau Steel has also placed a contract for a four high fivestand cold rolling mill with Nippon Steel. The mill will convert importedcontrolled coil into GI and other sheet for tinning.
ANNEX 5rage 2o
85. The above joint ventures raise the question how far Pertaminashould be putting funds into services which could alternatively be providedby private service companies under contract to Pertamina and its oilexploration/production contractors. A joint venture does not necessarilyhave the same incentive to provide a competitive, low-cost service as aservice company keen to please lest its contract not be renewed. Thequestion also arises how far Pertamina should be investing outside theoil sector. In some instances the answers to the above questions couldbe positive but this is by no means necessarily so, and future proposalsfor joint ventures need careful review.
Source and Application of Funds, 1967-1971
86. All in all Pertamina's capital investment program - includingworking capital - has amounted to lust under US$500 million equivalentduring the period 1967-1971. About two-thirds of this amount has beenon exploration and production and one-fifth on refining. The program hasaccelerated year by year, so that investment in 1970 and 1971 account for70 per cent of the total 5-year period. Pertamina has also paid about$160 million of debt service, including interest payments, during thesefive years. Details of Pertamina's application of funds during 1967-1971are shown in Table 11.
87. Pertamina has therefore had to raise about $650 million to financeits capital investment program and debt service. It appears to haveinternally generated very roughly $180 million, of which some $10 millionas net profit after tax on its own operations and $170 million as depreciationof its assets.
88. During 1967-1971 Pertamina also drew down about $220 million fromrommerrin1l rrpditq whirh it had nhtained rpnayable over 2-12 vyars. Tt
thus used about $400 million from this source and internal cash generation.It is assumed here thast t-hp bnlnnce nf 925O millionn nppdpd tn mnppt
capital expenditure and debt service, must have been financed from shortterm commercial bank borrowing.
Source and ^pplication of Fu.ds, 1974-1978
89] *4 P lna's capIta4-1 expendIture 14Ikely 4n 1972 and 107" ould
be in the order of $280 million combined. It has plans on the drawing-ILoard3 for cap-ita" investment, thereafter capable of using all the fundsUJL U _ . .a .La . . %LV.hL* . L*LO . .AJf.
5C.. .k.*1A
which it may be allowed by its Board of Commissioners. What this mightlook. 1like -c- th-e context of the next 55-year plan is harA to predict. However,A. m . ±LNC LLU -LI L .JL L.Jt A. L_*I IZ~ COt JJ I IO ILa'. - .t I J --'.t I *t.JW
it could be in the order of $750 million, if it were assumed that: (i)expLoratiLon andU developmer.t were restricte t aLL Uout $40 r,ilior. yearly, (ii)
two new refineries were built, one at Tjilatjap and one elsewhere, (iii)future tarikler requiLrerients were ri.et ri-Lainly buy charter arrang.em,ients, (iv)there were no major petrochemical investment other than fertilizers, and(v) tnere were no significant additional in-vestmlent in KraNkatau Steel, anU(vi) no new large joint ventures after Krakatau Steel.
ANNEX 5Page 27
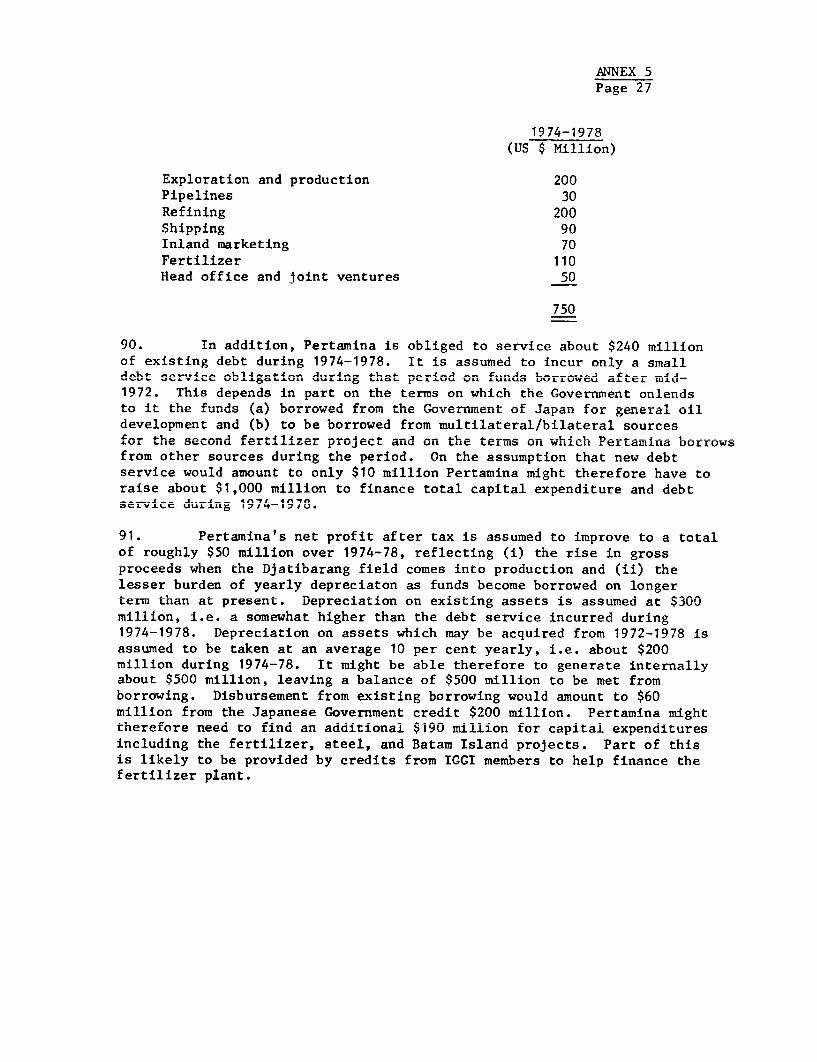
19 74-19 78(US $ Million)
Exploration and production 200Pipelines 30Refining 200Shipping 90Inland marketing 70Fertilizer 110Head office and joint ventures 50
750
90. In aAAditlon, Pertwitina is obli4gedu to serviLce abuout$20nilo.... ~ A uL J..LJ.~ MUf~ JL U)L -VA U I.L±.L.LUII
of existing debt during 1974-1978. It is assumed to incur only a smalldebt service oub-ligat-ion during thtpridorun's buorrowedu afLter ruid'a~J ~ L *C tIJLU
6L~Lt AtL-LflS L-UlO 19CL * U tiLt L ALU JLLU t l C LJU-
1972. This depends in part on the terms on which the Government onlendstio 4i the funds (%a)l borrowed from -. TL theU LI -VV.LL L1L=1 Uk. OdPaLl oUL geIiLeradL o.L
development and (b) to be borrowed from multilateral/bilateral sourcesfor the secondU fLertlizer proJect andU on thle termIs on -Whlich rertamina borrowsfrom other sources during the period. On the assumption that new debtserviLce wouldU amounLt 'Lo onULy $U10 illion r PertauirLa might therefore have toraise about $1,000 million to finance total capital expenditure and debt
~~ J~J- 4f7LY 4fnl'70serviLce UuriLg 1974-1710.
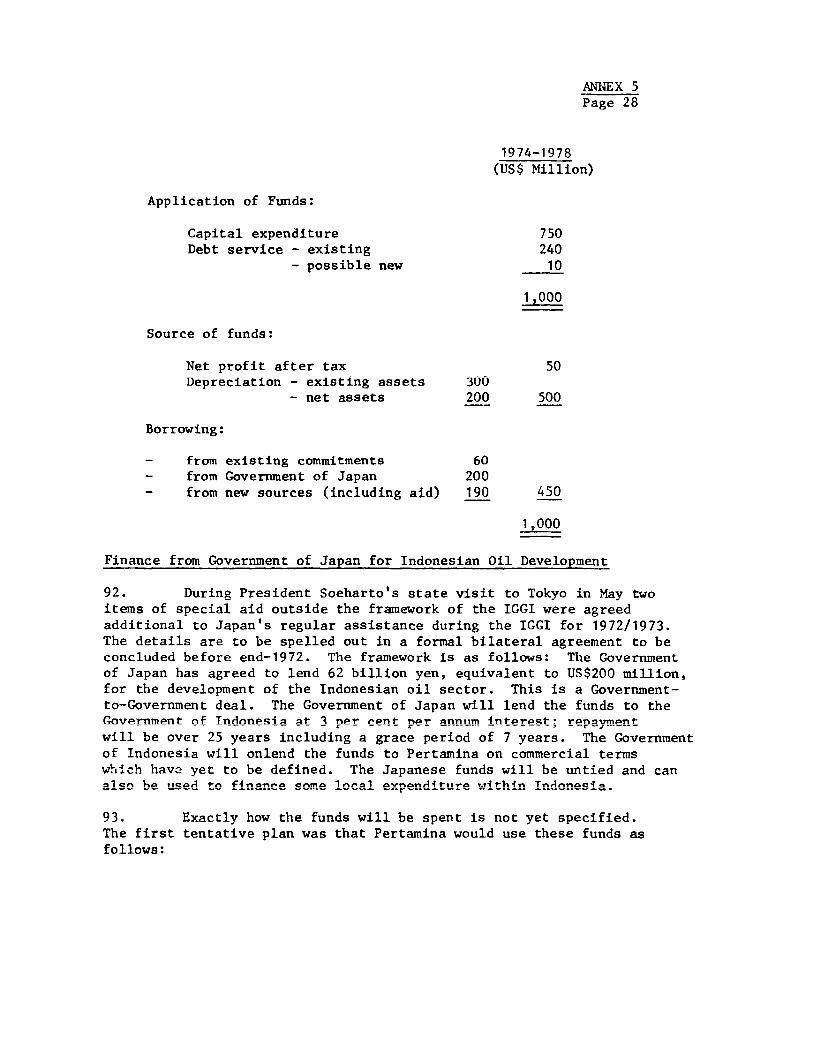
91. Pertaminas n etL profit after tax is assumeu Lo improve to a totaiof roughly $50 million over 1974-78, reflecting (i) the rise in grossproceeds when the Djatibarang field comes into production and (ii) thelesser burden of yearly depreciaton as funds become borrowed on longerterm than at present. Depreciation on existing assets is assumed at $300million, i.e. a somewhat higher than the debt service incurred during1974-1978. Depreciation on assets which may be acquired from 1972-1978 isassumed to be taken at an average 10 per cent yearly, i.e. about $200million during 1974-78. It might be able theretore to generate internallyabout $500 million, leaving a balance of $500 million to be met fromborrowing. Disbursement from existing borrowing would amount to $60million from the Japanese Government credit $200 million. Pertamina mighttherefore need to find an additional $190 million for capital expendituresincluding the fertilizer, steel, and Batam Island projects. Part of thisis likely to be provided by credits from IGGI members to help finance thefertilizer plant.
AN1NEX 5Page 28
1974-1 97?
(US$ Million)
Application of Funds:
Capital expenditure 750Debt service - existing 240
- possible new 10
1 ,000
Source of funds:
Net profit after tax 50Depreciation - existing assets 300
- net assets 200 500
Borrowing:
- from existing commitments 60- from Government of Japan 200- from new sources (including aid) 190 450
1 ,000
Finance from Government of Japan for Indonesian Oil Development
92. DurinR President Soeharto's state visit to Tokyo in May twoitems of special aid outside the framework of the IGGI were agreedadditional to Japan's regular assistance durine the IGGI for 1972/1973.The details are to be spelled out in a formal bilateral agreement to beconcluded before end-1972. The framework is as follows: The Governmentof Japan has agreed to lend 62 billion yen, equivalent to US$200 million,for the develonment of the Indonesian oil sector. This Is a GonvernmPnt-to-Government deal. The Government of Japan will lend the funds to theGovernment of Tndnnesia at nper rent per annuim 1nterest; repavmentwill be over 25 years including a grace period of 7 years. The Governmentof Tndonensi will nnlent the fuindis tn Pertamina non cnmmercial t-er-nms
which have yet to be defined. The Japanese funds will be untied and canalsn be uiieA t-ro finon.e r ome cnal1 expena4rtiture wthin ITrndoiesia
93. Exactly how the funds will be spent is not yet specified.The first tentative plan was that Pertamina would use these funds asfollows:
ANNEX S
Pag 29
r 1~~~ 2 .. .a ~~~~~~ ¶ ... r . --.. 7 -?
$ ruill ion
rExploration and Uevelo-pment of production,excluding the Djatibarang field 150
Domestic distribution facilities 35 - 40Office buildings and other facilities for
foreign oil contractors 10
94. Pertamina in turn will supply to japan a total of 58million kilolitres (50 million metric tons) of crude oil over a 10-yearperiod starting in 1973 additional to the supply through existingcommercial channels. Japan is thus assured of low-sulphur crude oilsupplies by applying a part of its large foreign exchange reserves forthe long-term development of Indonesian oil supplies. This averages 5.8million kilolitres or 5 million tons yearly (100,000 b/d) and is plannedat 3.5 million kilolitres or 3 million tons (60,000 b/d) in the JapaneseFY 1973/1974. Deliveries are expected to rise to 150,000 b/d in 1976and taper off thereafter. The price will be determined quarterly or halfyearly before delivery and Japan will correspondingly prepay beforedelivery. Japan will advance a ceiling of $100 million equivalent aspre-payment for oil delivered in the succeeding six-month period. Theamount will be advanced at the beginning of the six-month period, repayablein crude during that period; it is expected never to be fully run downduring the period.
95. Pertamina will supply the crude oil for the above deal notthrough Far East Oil Trading but through the Japan-Indonesia PetroleumCompany, a new venture established for the purpose by Toyota MotorSales Company and the Industrial Bank of Japan. It is capitalized at500 million yen and the equity will be held 50 per cent by Pertamina, 26per cent by Japanese oil refiners. Financing will be raised mainly bybanks but also probably by public issues.

STATISTICAL APPENDIX
LIST OF TABLES
Table Number
1. Actual and Estimated Crude Oil Production, 1966-1972
2. Forecast of Crude Production, Pro-rata Deliveries andExports, 1972-1980
3. Actual and Forecast Realized f.o.b. Prices of Iranian Lightand Minas Crude Oils, 1970-1980
4. Forecast of Gross and Net Oil Exports, 1971/72 - 1980/81
5. Government Revenues from Foreign Oil Contractors, 1971/72 and1972/73
6. Forecast of Government Oil Revenue, 1971/72 - 1980/81
7. Domestic Sales of Petroleum Products
8. Sumary Forecast of Net Profit from Government's DomesticOil Marketing Operation, 1972 - 1980
9. Forecast of Costs of Government's Domestic Oil MarketingOperation, 1971-1980
10. Forecast of Availability and Disposal of Crude and Droductsfor Domestic Market, 1971-1980
11. Pertamina: Source and Application of Funds, 1961-1971

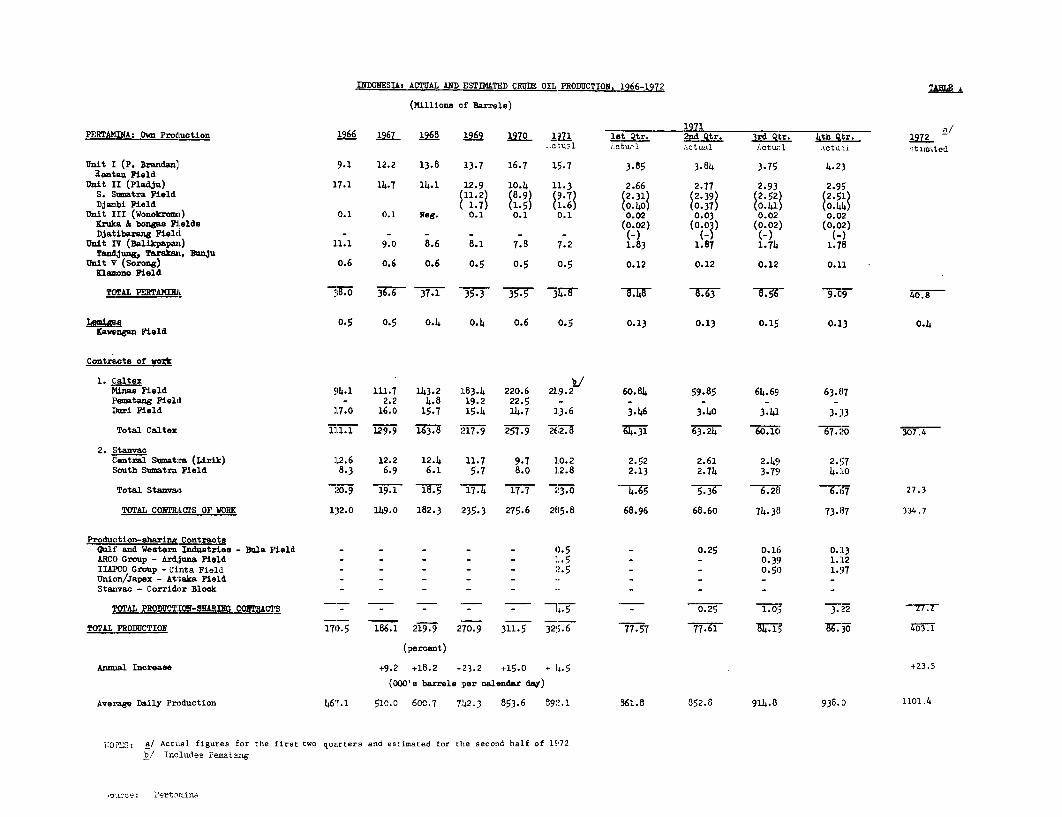
INDONESIA: ACTUAL AND ESTI?WTRD CRUDE OIL PRODUCTION, 1966-1C72 V
(Mil:Lions of Barrsls)
PERITA1INA: Omwn ProdLuction 1966 1967 19IS8 1969 192CL 11 lst Qtr. 2nd Qtr. lrd SLr. 4th Qtr. 1972 act%-l twtul :ctual letu:l 'Lot-a i itimavted
Unit I (P. Brandan) 9.1 12.2 13.8 13.7 16.7 15.7 3.85 3-84 3.75 4.23aantau Field
Unit II (PlaAJu) 17.1 14.7 14.1 12.9 10.4 11.3 2.66 2.77 2.93 2.95S. Sumatra Field (11.2) (8.'l) (.7) (2.31 (2.39) (2.52) (2.5Djambi Field ( 1.7) 1 . 1.6 (O40 0 37 o.415 44
zllit III (Wonkolmo) 0.1 0.1 ffslg. 0.1 0.1 0.1 0.02 0.03 0.02 0.02Kruka & bonage Fields (0.02) (0.03) (0.02) (0.02)Djatibrazsg Field (- ) () -)
Unit IV (Balikpapan) 11.1 9.0 8.6 8.1 7. E 7.2 1.83 1.87 1.74 1.78Tsndjung, 'PI!aka n, Bmju
Unit V (Sorarng) 0.6 0.6 o.6 0.5 0.5 0.5 0.12 0.12 0.12 0.11Laamno Field
TCTAL PERTAKSL 36.67 37d- 3T-3 35' 3Vr -a O; 8.63 8 40.8
LemiRsg 0.5 0.5 0.4 0.4 0. 6 0.5 0.13 0.13 0.15 0.13 0.4Kawengan Field
Contracts of c
1. Caltex bJMlinae Field 94.1 111.7 1143.2 ]L83.4 220.6 249.2 60.84 59.85 64.69 63.87'ematang Field - 2.2 4.8 19.2 22.5 - - - -
IDri Field 17.0 16.0 15.7 15.4 14. 7 13.6 3.46 3.4Cl 3.41 3.13
Total Caltex 111.1 129.9 3 217.9 257.9 1 631 63.24 601C 67:C 107 4
2. StanvacCentrl Sumatra (Lick) 12.6 12.2 12.4 11.7 9.7 10.2 2.52 2.61 2.49 2. 57South Suatra Pield 8.3 6.9 6.1 5.7 8.0 12.8 2.13 2.74 3.79 4.10
Total Stanvao 20.5i 19.1 .5 17.4 1 T7-7 *3 -Ci4.5 -5 3' 6.2ci 27.3
TOUAL CCITRACTS OF WORK 132.0 149.0 182.3 235-3 275.6 285.8 68.96 68.6o 74.38 73.87 334.7
Production-shrng ContractstlLf and Western Industries - Bula Field - - - - - 0.5 - 0.25; O.16 0.L3ARCO Group - Ardjuna Field - - - - - L.5 _ - 0.39 1.12IIAPCO Group -Cinta Field - - - - 2-5 0 - 0-50 1.97Ulnion/Japex - At teka Field - - - - - --Stax,vac - Corridor Block - - - - - --
TCTAL PRODUCTEO-HARMING COYMRAM'FS - - - - - Th.s - 0.2, 1.01 3.22
TOTLL PRODUCTIOR 170.5 186.1 219.9 270.9 311.5 32Wj.6 77.57 776 30 403 .1
(percent)
AnnLal Increase +9.2 +18.2 +23.2 +15.0 + 14.5 +23.5
(000's barrels per calendar day)
Average Daily Production 467.1 510.0 600.7 7242.3 853.6 S9:'.1 861.8 852.8 914.8 938.0 1101.4
IlO[NS: j/ ActuLal figures for the first two quaLrters and estimated for the seccnd half of 19I72ib Includes Pemataxng
o.jurce: Pertimaina

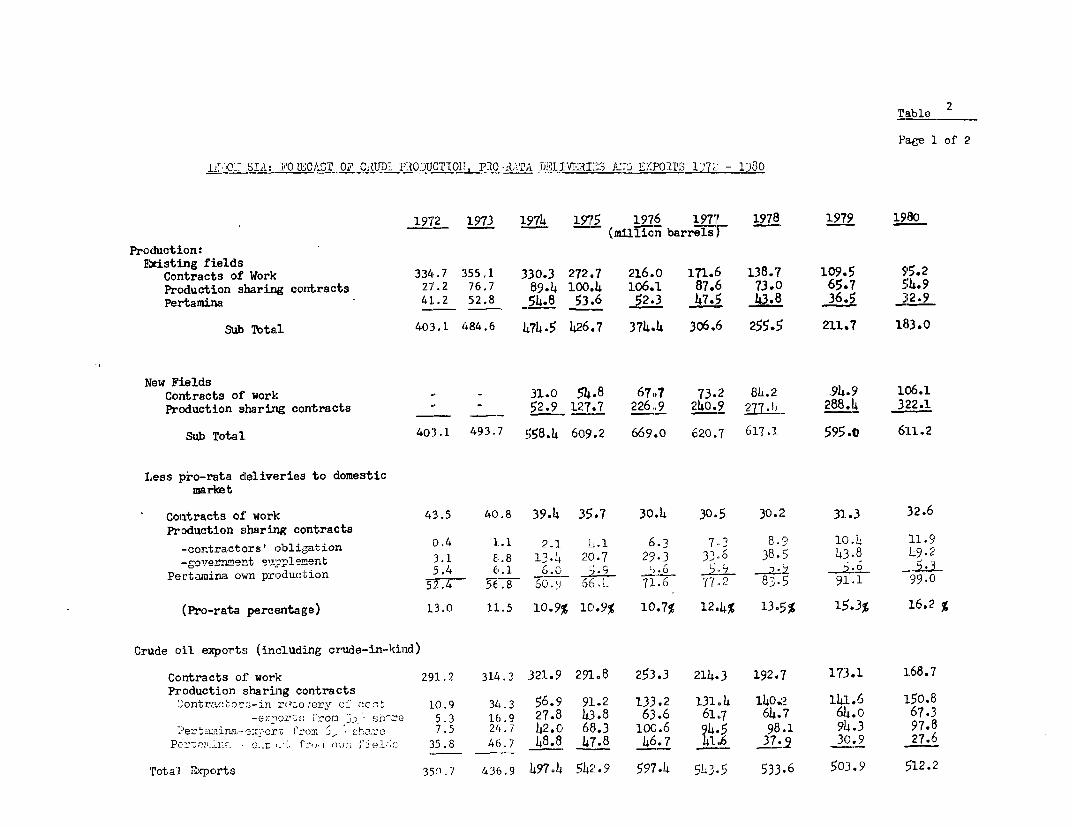
Table 2
Page 1 of 2
]i,T0 SIA: P'0 EYCAJST OF C,UDFlDP10DUCTI0T P20 -V.ATA bELIER A:TD Z_POTTS 1''72: - 1)380
1972 1973 1974 197r5 1976 1977 1978 1979 1980(million barreieF-_
Production:Existing fields
Contracts of Work 334.7 355,1 330.3 272.7 216.0 171.6 138.7' 109.5 55.2Production sharing conitracts 27. 2 76.7 89.4 100,.4 lo6.1 87.6 73.0 65.7 514.9Pertamina 41.2 52.8 54.8 53.6 52.3 47.5 43.El 36.5 312.9
Sub Thtail 401.1 484.6 474.5 426.7 374.4 306.16 255.5 211.7 1E83.0
New FLeldsContracts of' work - - 31.0 54.8 67,7 73.2 84.2 .94.9 106.1Production sharirg contracts - 52.9 127.7 226..9 240.9 ayj, 288.4 322.1
Sub Total 403.1 493 7 558.4 609.2 669.0o 620.7 617.1 595.0 6L1.2
Less pro-rata deliveries to domesticmarket
Contracts of work 43.5 40.8 39.4 35.7 30.4 30-5 30.-2 31.3 32.6Production sharilig contracts
-contractors' obligatiorL o.4 1.l 2.1 4.1 6.3 7-3 8.9 lO., 11.9-govery=ent -u-plement 3.1 8. 8 13.L 1 20.7 29.3 33,,6 38.5 43.8 49.2
Pertamina owm production 5.4 El.1 6.0 -. u _ 9 ._ ___'2.352.4 5-6TW 60.,) 06) L 71.6 77.2 83.5 91. 1 99.0
(Pro-rata percentage) 13.0 11.5 10.9% 10.9% 10.7% 12.4% 13.5% 15.3% 16.2 %
Crude oil exports (including crude-in-kind)
Contracts ol' work 291.2 314.3 321.9 291.8 253.3 214.3 192.7 17:3.1 168.7Production sharinig contracts
Contracor.-in rcl.o,'ery cc c 10.9 34.1 56.9 91.2 133.2 131,4 1402 ll~1.6 150.8-eropsrts lroa 35 sn2rc 5.3 16.9 27.8 43.8 63.6 61,7 64.7 64.0 67.3
P>ertaaina-e.-cr~ i'rCc o c5. a-. c 7.5 24.7 42.0 68.3 10C.6 94.5 98.1 94.3 97.8Pc>-w?ll.l-n -.i. fi n fJ;i, el-.½ 35.8 46.7 48.8 47.8 46.7 116 37-.9 30.9 27.6
Trotal zxpcirts 35n.7 436.9 4974h 542'.9 597.4 5L3.5 533.6 503.9 ';12.2
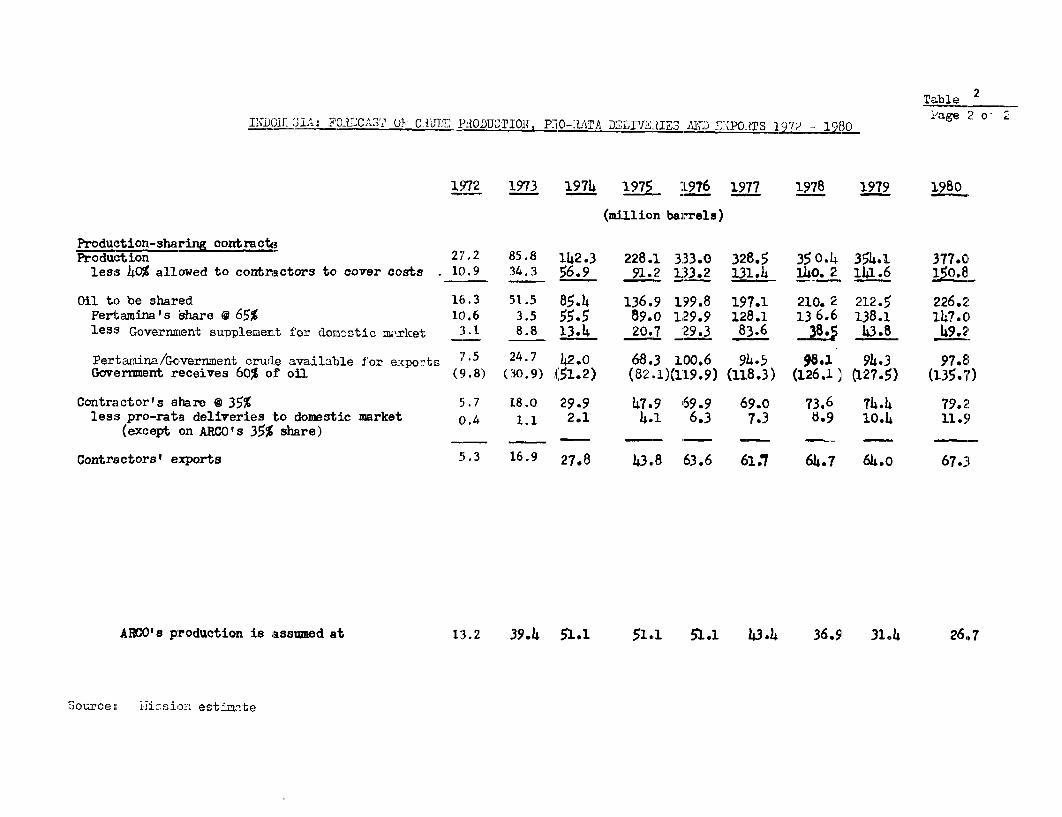
Table 2- - _ _ _ _ _ _ _ _ _ __ i'~~~~~~~~~~~~~~~~~~Tage 2 o 2;
IKDONI 3:IA: FO2C,A"S'2 0u C- IT K PHODUCTIONI, P-10--ITA DELIAIUIE. AKI,) I,{POITS 1097- 0
1972 1973 19574 1975 976 1977 1978 15979 1.980
(million barrels)
Production-sharing cont ra cteProduction 27.2 85.,8 142.3 228.1 333.v7 328.5 35 0.4 354.1 377.01
less 40,' allowed to contriactors to covier costs . 10.9 34.3 56.9 91.2 1:33.2 131.14 311o. 2 141.6 150.8
OilL to be shared 16. 3 51.5 85.4 136.9 199.8 197.1 210. 2 212.5 226.2Perl'amira 's Mare @ 65% 10.6 3.5 55.5 89.0 1,29.9 128.1 131 6.6 138.1 ;147.C)less Government su-Dplement for dora-stic mrket 31.1 8.8 13.4 20.7 29.3 83.6 4318 49.2
Pertamina/Governmnent crude available for expo-tis ;.5 24.7 42.0 68.3 100.6 9,4.5 96.1 914.3 97.8GoerrnmEnt receilres 60% of oil (9.8) (30.9) 1(51.2) (82.1)(119.9) (118.3) (12!6.)L cl27.5) (L35.7)
Contractor's share 0 35% 5. 7 18.0 29.9 47.9 69.9 69.0 73.6 714.4 79.2!less pro-rata deLiveries to domestic market; 0).4 1.1 2.1 14.1 6.3 7.3 t.9 10.4 11.5
(except on ARCO ' s, 35% share)
Contractors' exporlts 5.3 16.9 27.8 43.8 63.6 61.7 64.7 614.0 67.31
ARCO0's production is asswied at 13.2 39.4 51.i 51.1 51.1 143.4 36.9' 31.4 26,7
SoLZLOe:: 1i?iision esti±mte
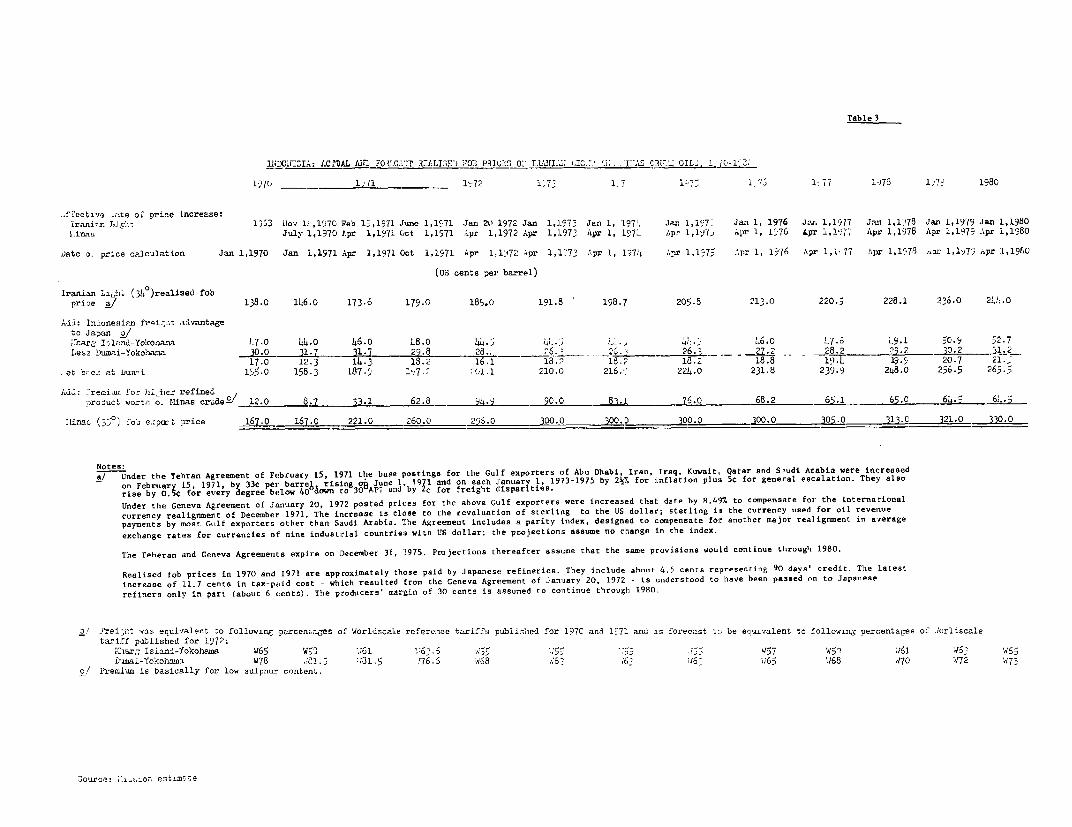
Table 3
11lDOiESIA: LGflAL AlL, FO U.C,5T .R7JLTIS0J IOS PRIC;S 0:' iLlI.: 'JG.7 'i . -I'A'i C83T' OIL;, L jC0-
17'7C 1 L'72 ;73 1.'7 :7- 1 1:77 1j -78 1,'T 1980
..fec tiva .ate of price increase:Irani-x. 7,Jg; 13,3 1iov 1,1'370 Feb 1_,1971 June 1,1'71 Jan 20 1972 Jan 1,197, Jan 1, L971, J?n 1,1971 Jan 1, 1976 Jail 1,1977 Jv.M 1,1178 Jazn 1,1979 Jan 1,1980ILina.s July 1,1970 A.pr 1,1971 Oct 1,1971 '-pr 1,1972 Apr 1,197' Aipr 1, 1974 Apr 1,IY? AXpr 1, 1976 Lpr 1,1977 I Apr 1,1975 Apr 1,1979 APr 1,1580
,)ate D. price calculation Jan 1,1970 Jan 1,1971 Apr 1,1971 Oct 1,1971 kpr 1,1'072 Apr 1,1737 Apr 1, l7194 Anr 1,17,5 '.pr 1, 1,976 Apr 1,1. 77 hpr 1,1578 -pr 1,1J7` 'pr 1,19&0
(US ceats per! barrel)
Iranian Lilah' (3j10)realised fobprize a/ 138.0 146.0 173.6 179.0 185.0 191.8 ' 158.7 205.8 213.0 220.5 228.1 206.0 299.0
Aid: Infonesipn frei-;st a:dvantageto Jas a/;aaro I,land-Yokoaar 1,7.0 144.0 46.0 48.0 44. 41., ; *.6.0 7.-6 .9.1 50.9 52.7Lau~s Dum-ai-Yokohanna 30.0 3h1.7 31 29.8 28:. L . U~26j. 27L2 28.2 29J 22i.. .&L217.0 12.3 14.- 18.2 16 .1 18.? 18.? 18.2 18.5 1' _ ._ 19. 20.7 21.
et brcs at luni 155.0 158.3 187-'. 1o,77 .1 210.0 216. 224.0 231.8 239.9 248.o 256.5 265.5
Aud: ,remius for hi her refineioroJuct wort.l o. Minas crudea/J 12.0 8.7 j3. 62.8 94H 90.0 81.1 76.0 68.2 65.1 _ 65.0 64.5 6iS ..
LiLna, U0) fob o.:-al t price 1 167.0 221.0 260.0 2_. 3 00.0 300.0 321.0 2 21 3 09.O
Notes;:a/ Under the Tehran Agreement of February 15, 1971 the base postings for the Gulf exporters Of Abu Dhabi, Iran, Iraq, Kuwait,, Qatar and Saudi Arabia were increased
on February 15, 1971, by 33c per barre, rising o1 June 1. 1911 and on each lanuary 1, 19'73-1975 by 2½7, for inflation plus3 S¢ fr general escalation. They alsorise by 0. S for every degree below 40 down ra 30 A?1 and by LC for freight disparities.Under the Genieva Agreement of January 20, 1972 posted prices for the a'bove Gtilf exporters were increased that date by 8.497. to compensate for the internationalcurrency realignment of Decembet 1971, The inicrease is close to the revaluation of sterling to the US dollar; sterling is the currency used for oil revetuepayments by roost Gulf exporters other than Saudi Arabia. lThe Agreement includes a parity index, designed to compensate for another major realignment in averageexchange rates for currencies of' nine industirial countries with US dollar; the projections assumie no change iLn the index.
The Teheran aind Gereva Agreements expire on December 31, 1975. Frojections thereafter assiume that the same provisions would continue through 1980.
Realised fob prices in 1970 and 1971 are approximately those paid by Japanese refineries. They include about 4,5 cents representing 90 days' credit. The latestincrease of 11.7 cents in tax-paid cost - which resulted from the Geneva Agreement of January 2CI, 1972 - is understood to have been passed on to Japaneserefiners only in part (about 6 cents). The producers' margin of 30 cents is tissumed to conitinue through 1980.
o / ?rmi,rt vwas equivalent to followine porcenzages of 'dorldscale reference tariffs published for 1970 and 1971 and is forecast to, be equivalent to followins; percentages of lorliscaletariff palblished for 19'7Z:
M2arg Islalnd-'okohamsa W65 W;3 -'61 "6- 5 :459 5' :95 314 457 '5, W61 Ws3- w165u,amai-YokohaonaŽ W78 181.5 :81.5 76S 428 KG' ;6' -6, i6 468 W70 E7t2 47z
c/ Prem.ium is basically for low sulpnur content.
journlee: ;-,I orl est'imte
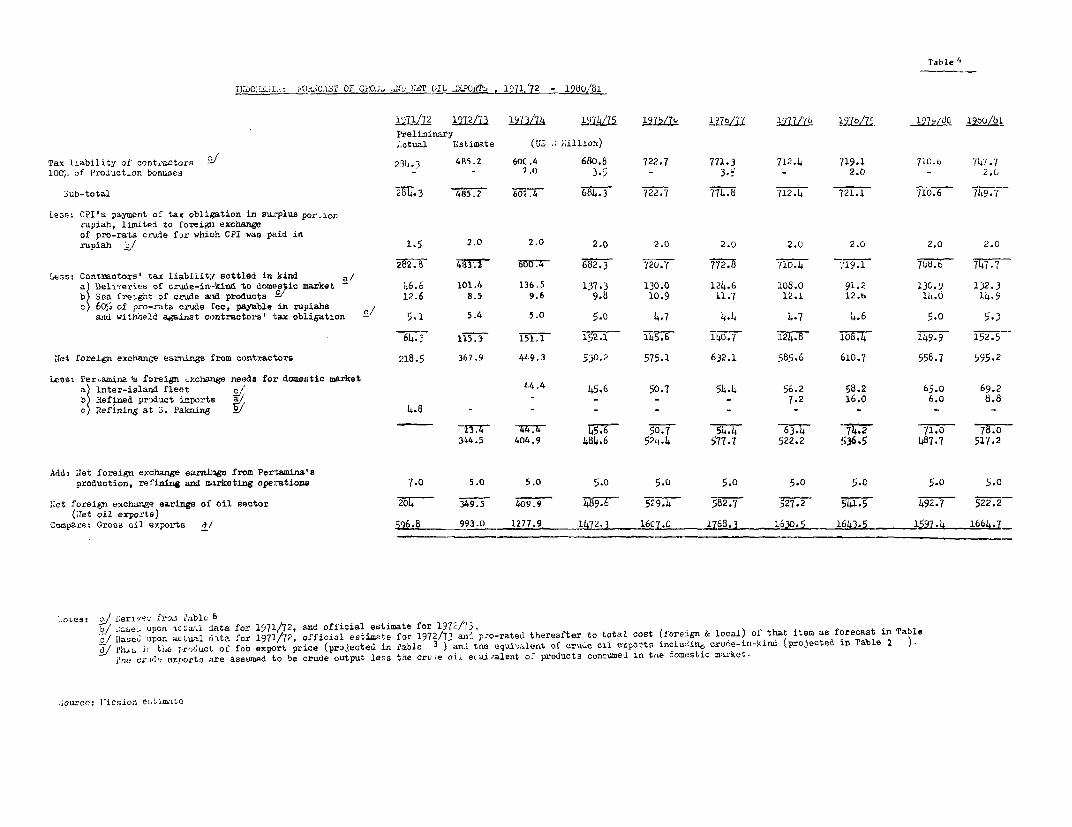
Taible 4
I1;xC:w:J:.~: J(odC.'A-i' OF G?:OL .i-W N2T OIL zX?OM, 1971 '72-- 19,jOZ/ 1
1971/72 A2ltK.U 49'L j j"fl475 }75L U47b/j'1 :1977/7b i97617Z 1979/6C 19oO/blfreliaic.ary,.ctual Ostimate (US S IKillion)
Tax liability of' contLactors 231,.3 4835.2 600.4 680.8 722.7 771.3 712.4 719.1 710.6 74-7.7100%, of Production bonuse:S - 2.0 3.5 - 3.; - 2.0 - 2.0
Sub-total 2 3 485 2 24 3 722.7 7. 712.4 21.1 710.6 749.7
Lese: CPI's payment of tax obligation in surplus por,aonrupiah, limited to foreigi exchuLngeof pro-rata crude for whi,ch CPI was paid inrupiah 1.5 2.0 2.0 2.o 2.0 2.0 2.0 2.0 2.0 2.0
282.8- ;!i;l 7z&rrc- :E:'- 720T7 772.8 710.4 719.1 701.6 747.Less: Contractors' tax liability settled in kind a/
a) Deliveriee of crude-in-kind 'Lo domestic miarket - 96.6 101.4 1:l6 5 137.3 130.0 124.6 106.0 91.2 130.9 132.3b) Sea freight of crude and products i 12.6 8.5 9.6 9.8 10.9 11.7 12.1 12.6 14.0 14.9c 60', of pro-rata crude fee, pa.yable in rupiahs
and withheld against contractors' tax obligation 5.1 5.4 5,0 5.o 4,7 4.4 4.7 4.6 S.o 5.3
64.; 115.3 151. 1 140.7 124.8 1o&.4 Y4152.5'let foreign exchange earninge from contractors 218.5 367.9 449.3 530.2 575.1 632.1 585.6 610.7 558.7 595.2
less: Perkamina 'a foreign Yxchange needs for domzestic marketa) Inter-island fleet c 4,4A 45.6 50.7 54.4 56.2 58.2 65.0 69.2b) Refined product imports - - - 7.2 16.0 6.0 8.8c Refining at S. Piakaing ./ 4.8 - - - -
-, f7lTC- 1j45.6 50.7 54-4 63.4 - 74.2 71.0 75.0344.5 404.9 464.6 524.4 577.7 522.2 536.5 487.7 517.2
Add: Niet foreign exchange earnaings from Pertanina's
production, refining and marketing operationsl 7.0 5.0 5.0 5.0 5.0 5.0 5.0 5.0 5.o 5.0
Set foreign exchange earings of oil sector 349.5 409. 9 529. 582.7 527.2 541.5 492.7 522.2(;Tet oil exports)
Compare: Gross oil exports a 016.8 3.0 1277.t 14r2.3 16 7.0 1768.3 1630.5 1 543.5 1664.7
oL,esa SJ i jriV9Z fer?n blo 6b/ caoe. utpon actwl data for 1971/72, and official estimate for 1972/73.c/ fBasee upon ac:tuLl d ta for 1971/7?, official estimate for 1972/73 an'd: p:o-rated thereafter to total cost (foreign & local) of thaLt item as forecast in Table
I/ I'h., ir t1.c iproduct of fob export price (projected in iable 3 ) a.d trae equivilunt of crude oil exports includin6 crude-in-kind (projected in Table 2 )e'ne c5
0eonrtg are assumed to be crude output less tne Cru ae oil e4uilnaent c,f products concuumed in tloe iomestic market.
..ourcO: ]'icsiofl eCim.'stc:
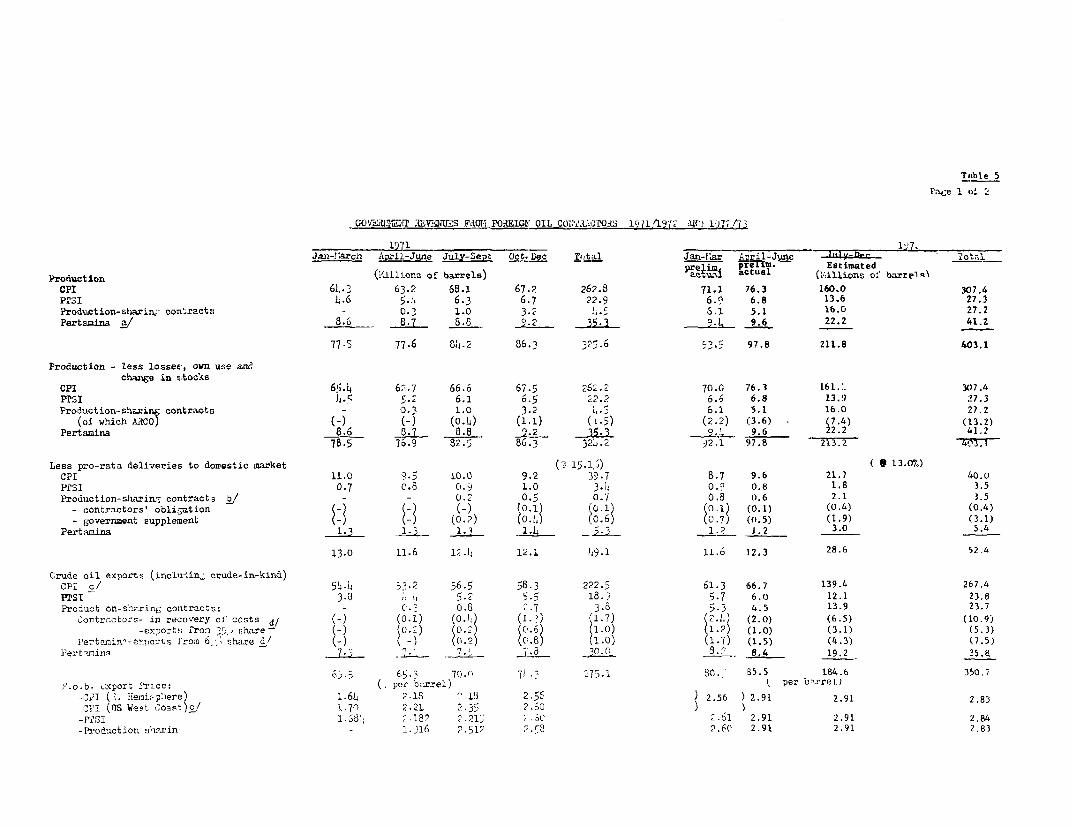
TaLble 5
Pa6e 1 o' 2
GOvt'Aujs1r 32LV?2ThS FdJOi FORIEIGY OIL COAZLO3TO3S l.7LflLlAC)
Jan-' Arclh April-Jwe r Ar-Set Oct,Dec T.tal -rar A Estimate Total
Product ion ~~~~~~~~~~~~~~~~~~~~~~(M'illiona of barrels) pem prflm siaeProdaptiLon 6 .'111t.3.: of barrels) PagWi actual (V.il:ions o.' barrel0
CPI 6l,.'1 6:3.2 65.1 67.2 262.8 71.1 76.3 160.0 3C7,4
PMSI 4.6 5.t 6.3 6.7 22.9 6.: 6.8 13.6 27.3
Production--sharing- contracts _ 0. 1.0 3.2 .f..c 6.1 5.1 16.0 27.2
Pertua-n _a/ _2538.6 8a 8.8 ° W a. 9.6 22.2 411.2
77-5 77.6 04.2 86.3 325.6 '3.5 97.8 211.8 403.1
Production - less losses, own use maechaxmge in sltockls
CPI 6!5.4 62-7 66.6 67.5 262.2 70.0 76.3 161.]L 317.4
PT'SI )5JJ 5.2 6.1 6.5 22.2 6.6 6.8 13.9 27.3
Production-sharirn6 contracts - 1D. 1.0 3.2 ,,., 6.1 5.1 16.0 27.2
(of which AiCO) (*-) (-) (0.4) (1.1) ( L-5) (2.2) (3.6) (7.4) (L3.2)
Pertamina 8.6 _5j.7 8.8 9-2 3$5-3 9-' 9.6 22. 2 41.2
713.5 76.9 82.5 86.3 3X .2 92.1 37.8 23. 2F
I,ess pro-rata deliveries to domestic market (O 15-],-) ( e 13.0%)
cPr 1:.0 9-5 100 9.2 3'9.7 8.7 9.6 21.7 40.0
P21I 0.7 o.8 0.,9 1.0 3.-4 0. 0.8 1.8 3.5
Production-slhrin3 conitracts / - - 0. 0.5 0. o.8 0.6 2.1 3.5
- contractors' obliQation -) (_ (-3 (O-l) (o.i) (o.i) (0.1) (0.4) (0.4)
government supplenment ) (- (o.<) (0.24) (0.6) (0.7) 10.2) (1.9) (3.1)
Pertasilna . .4 1.2 1.2 _ 3.0 5.4
13.0 11.6 12.4 12.1 249.1 11.6 12.3 28.6 52.4
Crude oil exports (inclu'in, crude-in-kind)OPl c/ 54,4 53.2 56.5 58.3 222.5 61.3 66.7 139.4 267.4
PTST - 3.3 2 4 5.2 5';5 185., 5.7 6.0 12.1 23.8
Producit on-sha?ring contracts: - C'. 0.6 .7 3.- 5.3 4.5 13.9 23.7
Contrc.ctors- in recovery oi' costs d/ (-) (0.1) (0./() (1 (1.7) 2. (20) (6.5) (10.9)
-expo-ts _ronl y sare- (-) (O.,-) ID;.6 (1.0) 1.23 (1.0) (3.1) (5.3)
Pe:tanin<-erports f rom 6, share c/ (-) ( -) ( (o.sS (1.O) (1-7) (1.5) (4-3) (7.5)
Pert -rrin, 7.3 ,, ,,8 0 S.?. 8.4 _ 19.2 35.8
63.) 65. 3 7(-0. 71 *s 27 5 .l 80. 55.5 184.6 350.765S 70.0 7 .3 275.1 SC.-'~~~~~~ ~~ per b?arrel)
p.o.b. Oxport <7xce: ( per bar:rel) 2 per 2.83
-021 (i. Ieoii.:-ph1ere) 1.614 2.18 ^.16 258 ) 2.56 ) 2.91 2.91 2.83
-rI (ns West, Goast)s/ 1.7n 2.21 2-35 2.5C
-025i 1.82 7.182 2.21;: 2.30 2.51 2.91 2.91 2.84
-Production s'r'Xin' _ 1.216 2.5l1 2<8 2.60 2.91 2.91 2.83
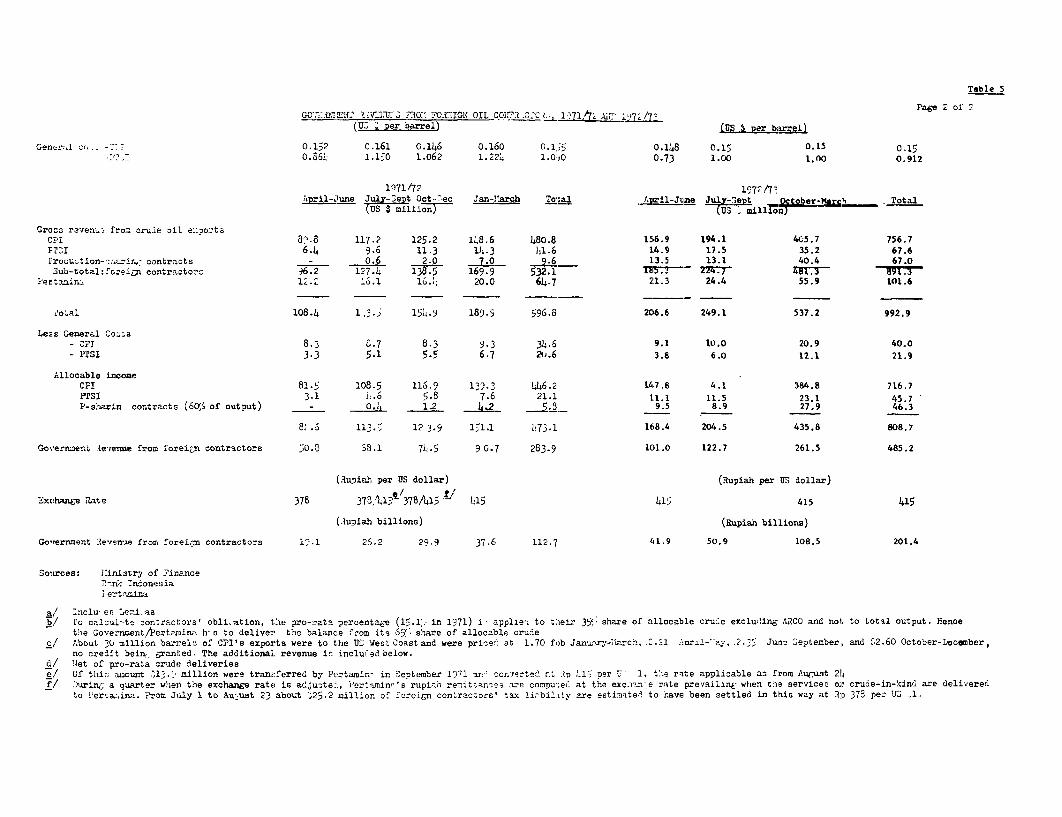
Table 5
Page, 2 of 2c~o,:0r2u2 lV211J?2 ?lEOT F`0TIG1 OIL C01.72 4Ct 171. 72
(U 2 Per barre4) -ITS per bel)
Gencfal ce,.. -; (.152 C.161 0.146 0.16C 0.1,5 0.148 0.15 0.15 0.150.86,; 1.150 1.062 1.224 1.0,O 0.73 1.00 1.00 0.912
1',) 7'1/7 2 '7April-June July-3Et Oot-7ec Jan-l1larch Toltal *jri-Jwine JutUX-3em Oc j . Total
(us m ollli n}-10__ _ _ __ _
Grocs ravenL-. fro= cr-Lale oil e::7o::tscPI 8.8 117.2 125.2 148.6 480.8 156.9 194.1 405.7 756.7P22i 6.4 9.6 11.3 14.3 41.6 14.9 17.5 3S.2 67.6Frodu,_tion--7..7-irk . contracts o- .6 2.0 7.0- 9 6 1_3.5 13.1 40.4 67.0Sub-total:Th:eip:n contractorc 96.2 1,.4 13.5 169.9 532.1 TEI J 27r#2-r 7M T9
'ertamina 1., 61 1.4; 20.0 64.7 21.3 24.4 55.9 101.6
2'o tl 1013.4 1i.j 154.9 189.5 596.8 2Cl6.6 249.1 537.2 992.9
Leas General Coz;a- 2J 13. 6 .7 8.3 9.3 34 6 9.1 10.0 20.9 40.0- ITSI 3.3 5.1 5.5 6.7 2t.6 3.8 6.0 12.1 21.9
Allocable incomeCFI 8l.: 108.5 116.9 13'.3 446.2 147.8 4.1 384.8 716.7FTSI 3.1 it.o 5. 8 7.6 21.1 11.1 11.5 23.1 45.72-sharin contracts (60'A of output) _ __ 4 1.2 14a ;5.3 9.5 8.9 27.9 46.3
8 .i 113.5 12 3.9 151.1 t'73.l 168.4 204.5 435.8 808.7
Government tevrerme from forei n contracto-s iD.3 'il.1 74U.5 90.7 283.9 101.0 122.7 261.5 485.2
(iAupia]h per 13S dollar) (Rupiah per US dollar)
Exchange flate 378 3718 '41- 378/4:L5 i 415 415 415 415
(IupiaŽh billions) (Rupiah billions)
Govrernment ee-r.e frorm _orei.,rn contractors 15.1 25 .2 29,9 37.ci 112.7 41.9 50.9 108.5 201.4
Sources: n:irdatry of Financein< Zndonesia
ertPzina.
a/ Inclu, er L'.i<.aP/ Lo calcl-lte contractors' obli.ation, the pro-rata percernta4e (lz.1_ in 1571) i applie. to their 3'! share of allocable cru_e excluding ARCO and not; to total ouLtput. Hencethe Governijent,/Pert?Dnina rl- B to clelivez the balance from its 65' share of allocable criude
c/ About 3O million barreli of CPI'a exports were to the US West Coast and were price: at 1.70 fob Janixry-71arch, 2.21 .oral- y, .2.' Junr 2epptember, and '2.60 October-Decamber,no credit bein, 6ranted. The additional revenue in incluCed below.
d/ 'let of pro-rata crude delireriese/ Of thi.; =mount .213.' million were tranrferred by Pertamin- in September 1571 an' co-rerte' rt ip 41' per U 1, t::e rate applizable as from AunLst 24f/ urinj a quarter when the exchax4;e rate is adcuoted, Fetrtnin^'s rupiah remittan^es aze comvoiteC at the excx?n-.e rate prevaillne when tha services or crude-in-kind are- delivered
to !ercoa:.ina. Prom July 1 to Au--ust 23 abort '25.2 million off io=eign contrac;orsl tax lirbi2lty are esti.-ateS to have been settled in this way at -lp 378 per UM A.
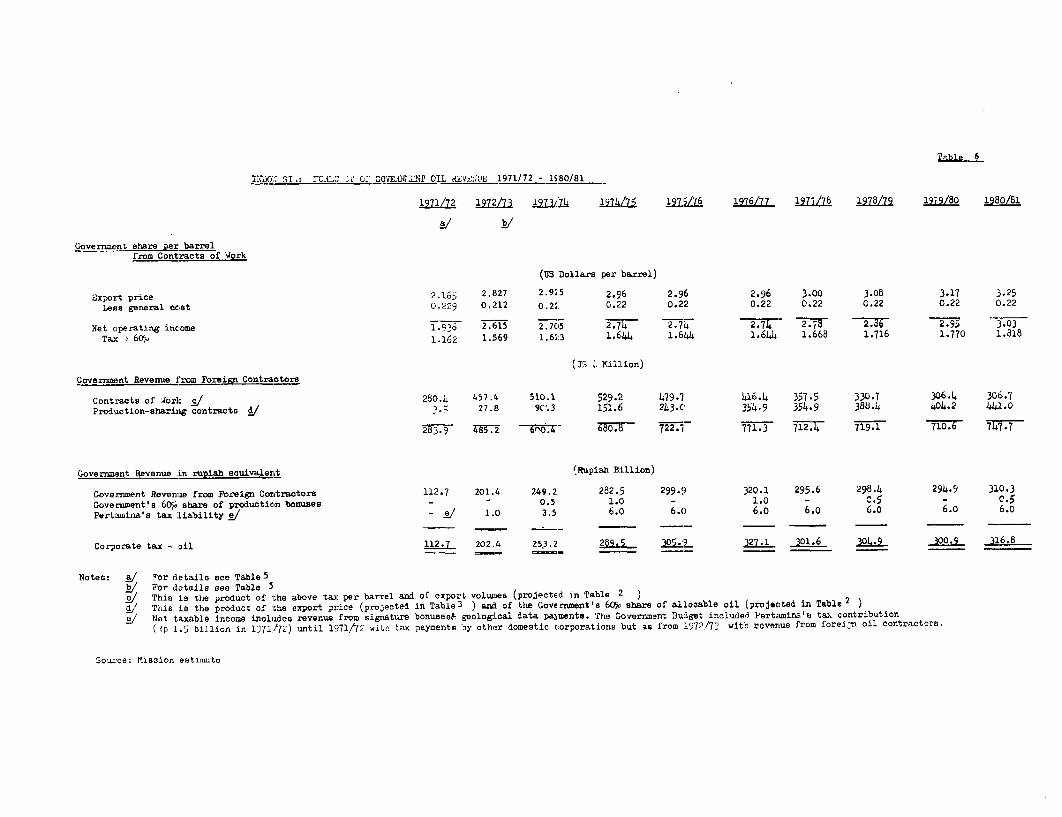
Ii;G;-.. r 0:- GOO ClBAlNT _OIL dEVzcrE 1971/72 - 1980/81
1a7/72 nla ' 132mI4 1974 ia 12LLQ6 125Ž6/77 3211h 19/U 12j9/80 19c0/81
2/ 2!/Government share Per barrel
from Contracts of Work
(US Dollars per barrel)
Nxport price 2.165 2.827 2.925 2.96 2.96 2.96 3°00 3.08 3.17 3.25
Leeis generral ccst 0.229 0.212 0.22 0.22 0.22 0.22 0.22 0.22 0.22 0.22
Net operating income 1.936 2.615 2.705 2.747 2.74 2.74- 2. 2. 2 2.55 3.-03
Tax 4 6Ctp 1.162 1.569 1.623 1.644 1.644 1.644 1.668 1.716 1.770 J.818
(IS , Vdllion)
Government Reivenue from Fcreign Contractors
Contracts of Jorl / 280.4 457.4 510.1 529. 2 479-7 416.4 357.5 330.7 306.4 306.7
Production--sharing contracts / '. 27.8 9C.3 151.6 243.0 354.9 354-9 388.4 404.2 441.0
2h.9 485.2 - 600.4 68T- 722.7 77-3 12W7 719.1 710.6 w7.
Government Revenue :in ruLah eqi4yvaLej t (Rupiah Billion)
Covernsent Revenue from ForeiLgn Contractors 112.7 201.4 249.2 262.!5 299.5) 320.1 295.6 298.4 294.9 310.3
Government's 60% share of production bonuses - 0.5 1.0 - 1.0 - c.5 - 0.5Pertamina'ls tax liability / -- e/ 1.0 3.5 6.0 6.0 6.0 6.0 6.0 6.o 6.o
Corporate tax - oil L12.7 202.4 253.2 255.j .QZL 327.1 J91L. 304.4 _pO.9 8
Rotes: a/ For details see Table5
F Por details see Table 5/ This is the product of the above taxi per barrel and of export volum3es (projected in Table 2
4.1 This is the produot of the export price (projected in Table3 ) andl of the Government's 60Cu share of allocable oil (projected in Table 2
/ Net taxable income includes revenue from signature bonusese geological daLta payments. The Government Budget included Pertamina'lk tax contribution
(tp 1.5 billion in 1971/72) ultil 1971/72 witr. tax payments by other domestic corporations but as from 1972/7f with revenue from forein oil contractors.
Sour-ce: Mission estitLmto

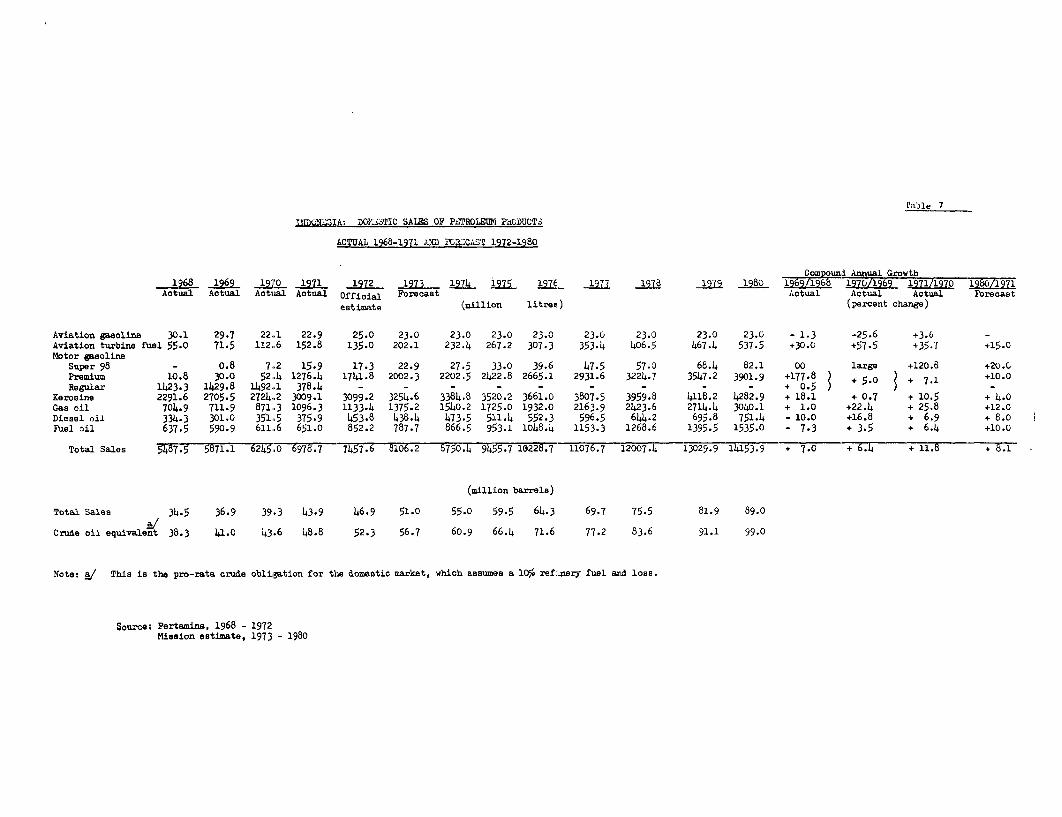
PajJje 7
upoSIA DOKFTIC SALES OF P&2ROLSUM PRODUCTS
ACTUAL 1968-L971 A; itDZCAZST 372i1SBo
Compounl Annual Growth1968 , 1969 1970 1971 1972 1973 19 977 94 2 ! 1980 l969/i 1970/al 197l 16
Actual Actual Actual Actual OfficLal Forecast Actual Actual Actual Forecast
estimate Imillion litres) (percent change)
Aviation gasoline 30.1 29.7 22.1 22.9 25.0 23.0 23.0 23.0 23.0 23.0 23.0 23.0 23.0 - 1.3 -25.6 +3.6 -
Aviation turbine fu.el 55.0 71-5 112.6 1,52.8 135.0 202.1 232,.4 267.2 307.3 353.4 406.5 467-4 5.37.5 +30-0 +57-5 +35.7 +15t.0Motor gasoline
Super 98 - 0.8 7,2 15.9 17.3 22.9 27.5 33.0 39.6 47-5 57-0 68.4, 82.1 00 large +120.8 +20.0Premium 10.8 30.0 52,,4 1276.4 1741.8 2002.3 2202.5 2422.8 2665.1 2931.6 3224.7 3547.2 3901.9 +177.8 ) + 5.0 + 7.L +10.0Regular 1423.3 1429.8 1492,1 378.4 - - - - - - - - - + 0-5
Kerosine 2291.6 2705.5 2724.2 3OC09.1 3099.2 3254.6 3384.8 3520.2 3661.0 3807.5 3959.8 418.2 4282.9 + 18.1 + 0.7 + 10.; + 4.0Gas oil 704.9 711.9 871. 3 109,6.3 1133.4 1375.2 1540.2 1725.0 1932.0 2163.9 2423.6 2714.4 304O0.1 + 1.0 +22.4 + 25.83 +1.0Diesel oil 334.3 301.0 351,.5 375-9 453.8 438.4 473.5 511.4 552.3 596.5 644.2 695.8 751.4 - 10.0 +16.8 + 6.9 + 8.0FPel oil 637.5 590.9 611,6 651.0 852.2 787.7 866.5 953.1 1048.4 1153.3 1268.6 1395.5 1535.0 - 7.3 + 3.5 + 6.14 +10.0
Total Sales 5875 871T.1 6245.o 9 46 1028.7 6107. 12007o.4 13029. 914L;3.9 + 7.0 T6.4 + 11.87 - + -
(million barrels)
Total Sales 34.5 36.9 39.3 143.9 46.9 51.0 55-0 59.5 64.3 69.7 75.5 81.9 139.0
Crude oil equivalent 38.3 41.0 43.6 148.8 52.3 56.7 60.9 66.4 71.6 77.2 83.6 91.1 99.0
Note: a/ This is the pro-rata crude oblilgation for the dometstic market, which assumEs a 103 refILnery fuel aend loss.
Sourcet Pertamina, 1968 - 1972Mission estimate, 1973 - 198(
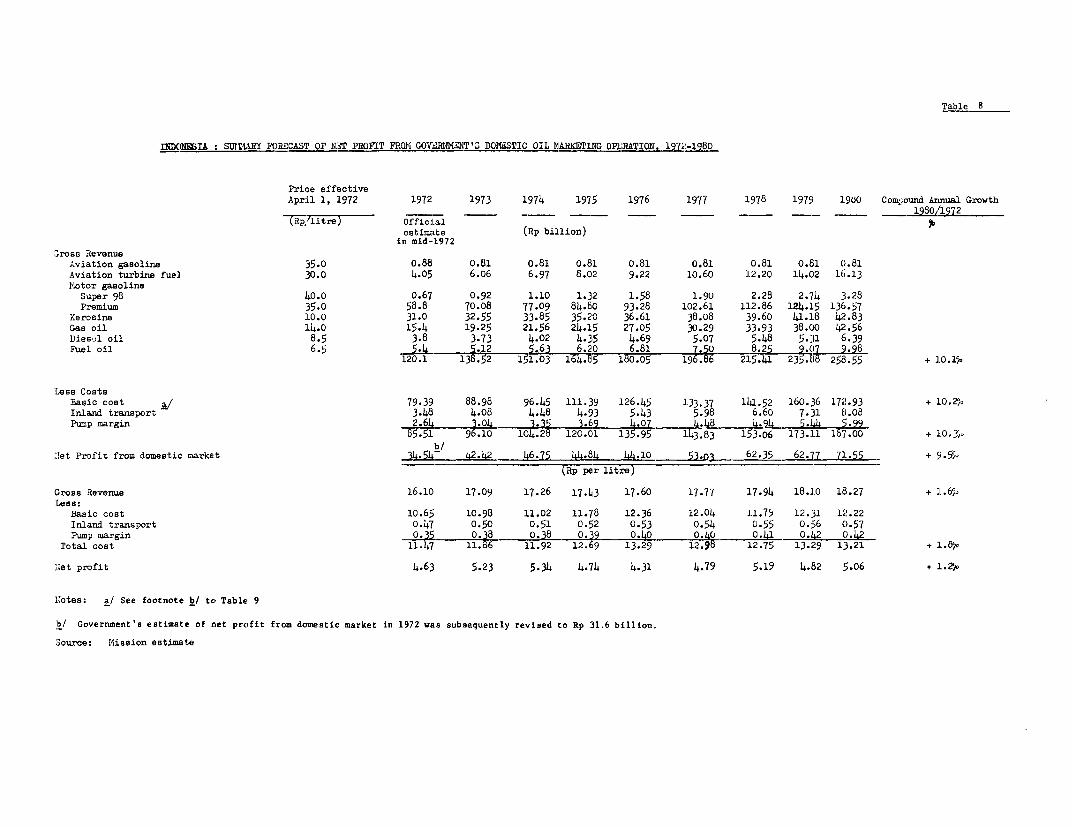
Table 8
INCDOESIA SUII2ARY FP(ECAST OF MWT PR03IT FROMi GOVE M3VT S DCISSTIC OIL 1ARKETlTG OPlRATIOI f 1972-1980
Price effectiveApril 1, L972 1972 1973 1974 1975 1976 1977 1 978 1979 1900 Com ,ound Anmual Growth
1980,_1972tLitre) ~OffiLcial 9
estiMnLte (Rp billion)i n mid-1972
,ross RevenueAviation gasoline :35.0 0.88 0.81 o.81 0.81 0.81 0.81 0.81 0.81 0.81Aviation turbine fuel 30.0 4.05 6.o6 6.97 8.02 9.22 10.60 12.20 14.02 16.13I;otor gasoline
Super 98 140.0 0.67 0.92 1.10 1. 32 1.58 1.90 2.28 2. 74 3.28Premium 35.0 58.8 70.08 77-09 84.8o 93.28 102.61 112.86 124.15 136.57Kerosine .LO.0 31.0 32.55 33.85 35.20 36.61 38.08 39.60 4.18 42.83Gas oil 14.0 15.4 19.25 21.56 24.15 27.05 30.29 33-93 38.00 4-.56Diesol oil 8.5 3-8 3.73 4.02 4-35 4.69 5.07 5.48 5.31 6.39Fuel oil 6.5 5.4 5j.12 6.20 6.81 _7 _ 8.2.98
120.1 138.52 151.03 ;T180.05 196.86 25.41 235.c8 258.55 + 10.1%
Less CostsBasic cost a/ 79.39 88.98 96.45 111.319 126.45 133 37 141.52 160.136 172.93 + 10.2pInland transport 3.48 4.08 4.48 4. 93 5.43 5.98 6.60 7.31 8.08Pump margin 2.64 3.04 1.BS 4.07 48 4. c 4- . .99
85.51 96.10 104.28 120.C1 135.95 143.83 153.06 173.11 187.00 + 10.53P
:'et P?rDfit from domestic market 30 45 42.42 66.75 44.84 4410 2.35 62.- 15 + 9. 559r litre)- -
Gross Revenue 16.10 17.09 17.26 17.43 17.60 17.77 17.94 18.10 18.27 + l .6;Less:Basic cost 10.65 10.98 11.02 11.78 12.36 12.04 li.75 12.31 12.22Inland transport 0.47 0.50 0.51 0.52 0.53 0.54 0.55 0.56 ().57Pump margin 0.35 0.38 -0.38 O. 9 o.4o o40 _ 0.4L _.42 0.42Total cost 11.47 11.86 11.92 12.69 13.29 12.9D 2.75 13. 9 13.21 + 1.8%c
Tiet profit 4.63 5.23 5.34 4.74 4.31 4.79 5.19 4.82 i;.06 + 1.2p
1;otes: a/ See footnote b/ tco Table 9
b/ Government's estimate of net profit from domestic market in 1972 was subsequently revised to Rp 31.6 billion.
.ource: MIission estimate
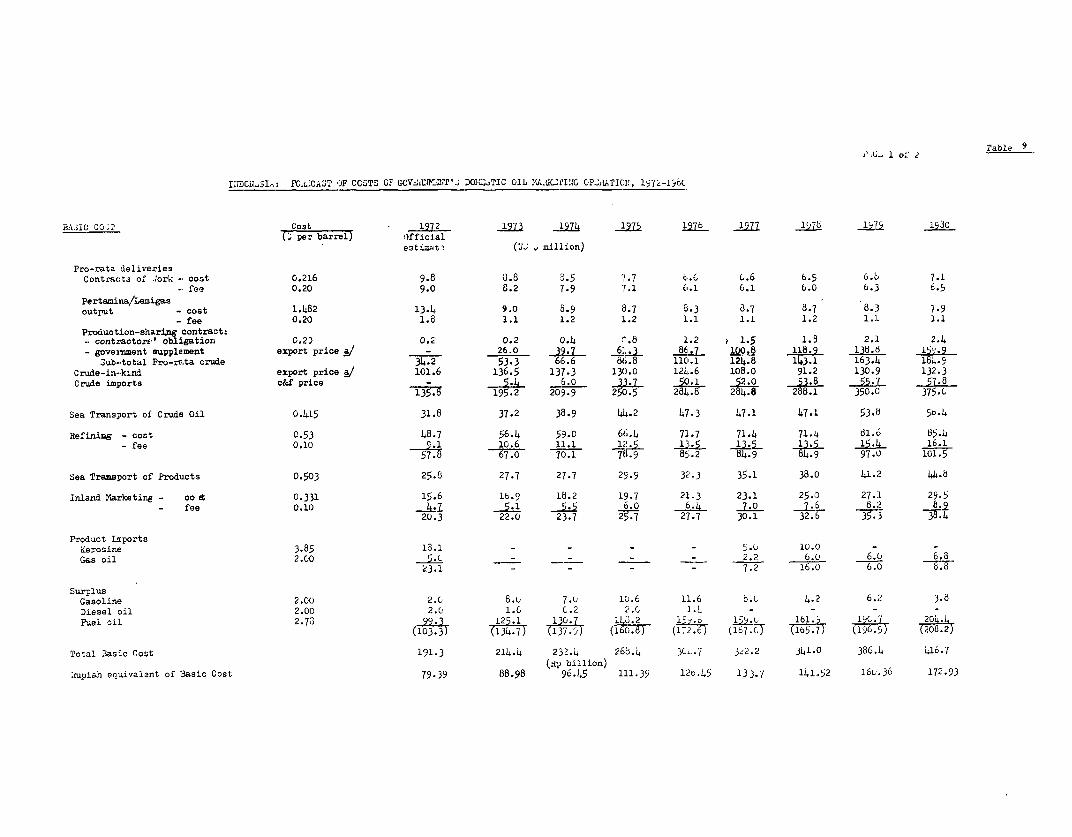
~ C. 1 of 2Table 9
IIVDCiLSI<: It.2CAST OF COSTS OF GOV tXF.2;V'- DOI;TIC OIL ?U'LLTC1I':G O1aiA4TI01T, 1572-19GC
BAjICt 0;2 Cost 17- 2 1973 7 ]76 1911 l4,7 1Z;L 15r30-barrX li~~~;ffieialestimatr (US million)
Pro-rata deliveriesContracts of Jork - cost 0.216 9.cl 8.8 3.5 7.7 6-6 t.6 6.5 6.8 7.1fee 0.20 9.C; 8.2 7.9 7'.1 6.1 6.1 6.0 6.3 6.5Pertamina/Lemigasoutput - cost 1.4B2 13.4 9.0 5.9 8.7 c;.3 5.7 8 '7 8.3 7-9- fee 0.20 1.8 1.1 1.2 1.2 1.1 1.1 1.2 1.L 1.1Production-shariAg contract:-- contzactors' obligation 0. 20 0.2' 0.2 0.4 r.8 1.2 ? 1.5 1., 2.1 2.4- goveanment supplement export price a/ 9 26.0 j9.7 61Lj. 1 .7lDO.8 138.2 ____
Jub-total Pro-rata crude 34.2 53.3 66.6 86.8 110.1 124.8 143.1 163.14 184.9CruLde-in-kind export price a/ 101.6 136.5 137.3 130.O 124.6 108.0 91.2 130.9 132.3CraLde imports c&f price -5'.4 6.o 1;L -. '1 S52.0 $33 S5.L 57.8135-1 195.2 20'9.9 250.5 2847 284.8- 288.1 350.0 375.0
Sea Transport of' Crude Oil 0.415 31.8 37.2 33.9 44.2 47.3 47.1 47.1 53.8 5t.4
Refining - cost, 0.53 48.7 56.4 59.0 66.4 71-7 71.4 71.4 d1.6 85.4- fee 0.10 9.1 _l.6 11.1 11 jI4. 13.j L 16.4 16.157. 76 9067. 70.1 7-89 8 5.2 84.9 84.9 97.0 101.5
Sea Transport of' Products 0.503 25.8 27.7 27.7 2',.9 32'.3 35.1 38.D 41.;2 44.b
Inland Marketing - coct 0.3'31 15.6 l.9 113.2 19.7 21.3 23.1 25.0 27.L 29.5- fee 0.10( 4.7 S.l L6.0 6 4 7.0 7.6_ 8.;.20.3 22.0 23.7 25 .7 27'.7 30.1 32.6 35.3 4
Product ImportsKerosine 3.8'; 18.1 - - - - 5.0 10.0 -Gas oil 2.00 5.L - 2.2 6.0 D 6.o0 6.8
23.1 - - - - 7.2 16.7 6.0
SurplusGasoline 2.00 2.C 8.o 7.0 10.6 11.6 b.O 4.2 6.2 3.8Diesel oil 2.0(0 2.0 1.G C .2 2.G 1.: -- - -EXuel oil 2.lT93 2. 3. 132 SsG 1 6 11 9 ' 20L.
(103. 534.7)~~~~~~~~~~~~ (S).8 (1M767 (1677 (1G -5.'5(9.g(0
Total 3asic Cost 191.3 214.4 23:2.4 268.4 3C,.'j sJ2.2 341.0 386.4 416.7(i.p billion)
.2upiah equivalent of 3Basic Cost 79.39 88.98 96.L5 111.39 12b.L5 133.7 141.52 1'0U.36 172.93
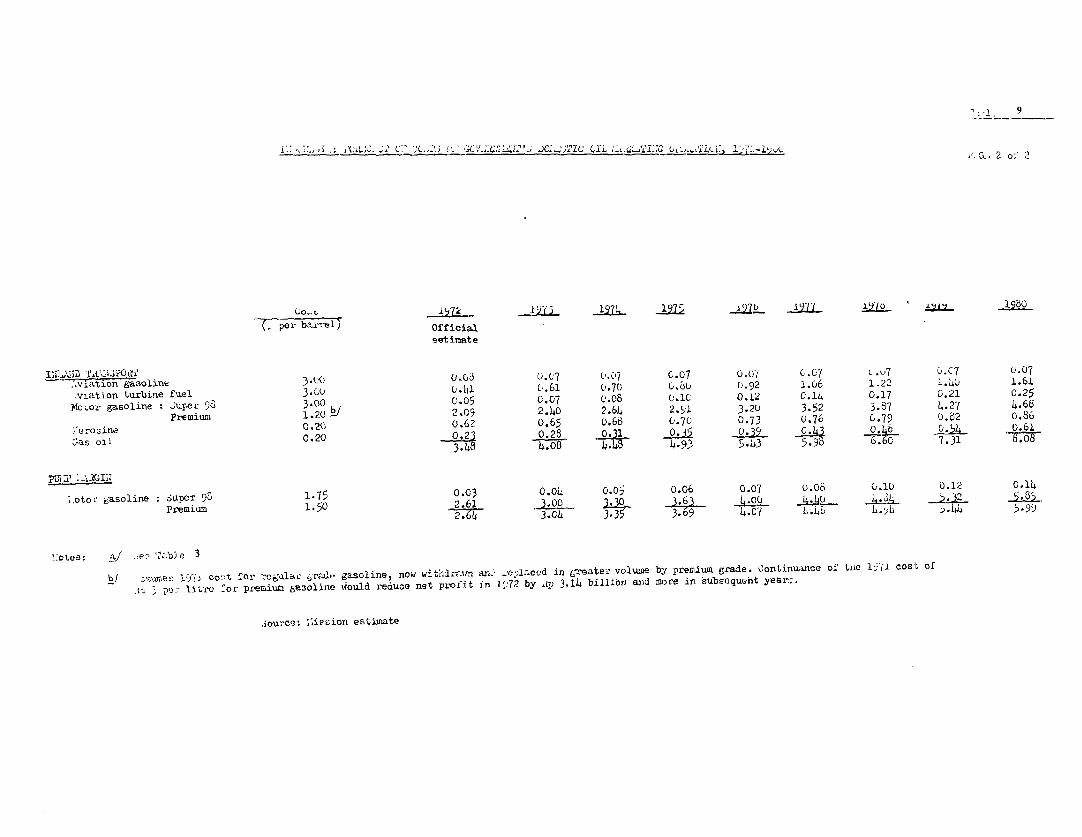
9
___________ > 2 . _i97 c 19W,Lv1°7> i97t2'H1 Jc;.;rlc CIL ;1 ~ c~'i~ QcG2o 2
77per b<.rre1 O£ficialeet ima1 e
i~~~~ti~~~~~~ t0 ~ ~ ~ ~ ~ ~ esirt
.. 'iTTtion gaso:ine 3.0{~ 0.0......... 3,rt3 0.c7 O.Q7 C.07 -. 00 G.G7 0.77 0.07 0.07xiation tuabine £ie1 3.-00 0.43 G,61 o.7c 0. u o.92 1.06 1.22 1 .40 1.61.votor gasoline fu.Ael 98 3.0$0 C.05 0.07 O.08 o.lC 0.12 C.14 0.17 0.21 0.25
Premium 1 .23 0 b/ 2.09 2.40 2.64 2.91 3.20 3.52 3.87 4 .27 4.66; erosine 0.20 0.62 0.65 0.68 0.70 0.73 0.76 C.79 0.62 0.86Oas oil 0.20 0.21 0.28 .1 6.60 7.313.45 ho8 1 4.93: 5.3 67.
poi i D.l;i
;.otor gasoline: sucet' 9r 1.75 0.03 0.04 0.0; 0.06 0.07 0.06 0.10 0.12 0.14Premlium 1.50 2.61 3.00_ 3 3-6',3 44 j9 9 31.50 3.04 3.35 3.69 4.07 4.Lib 4.yl 5.44 .99
* otes: -a -Ie' zb)e 3
b/ .sr,es 7~ oo t. eor e Xe gasoline, now withazemrn ane .e 2 1aced in L-mater volumae by pretium gPame. OontinwA.nce of tilo 13(1 cOSt ofjc, pef litre Zor preuium A0solione %iould reduce net profit in 1`72 by o) 3.14 billibri ayid more in subsequent year:,.
.iource: ';i s£ion estiviate
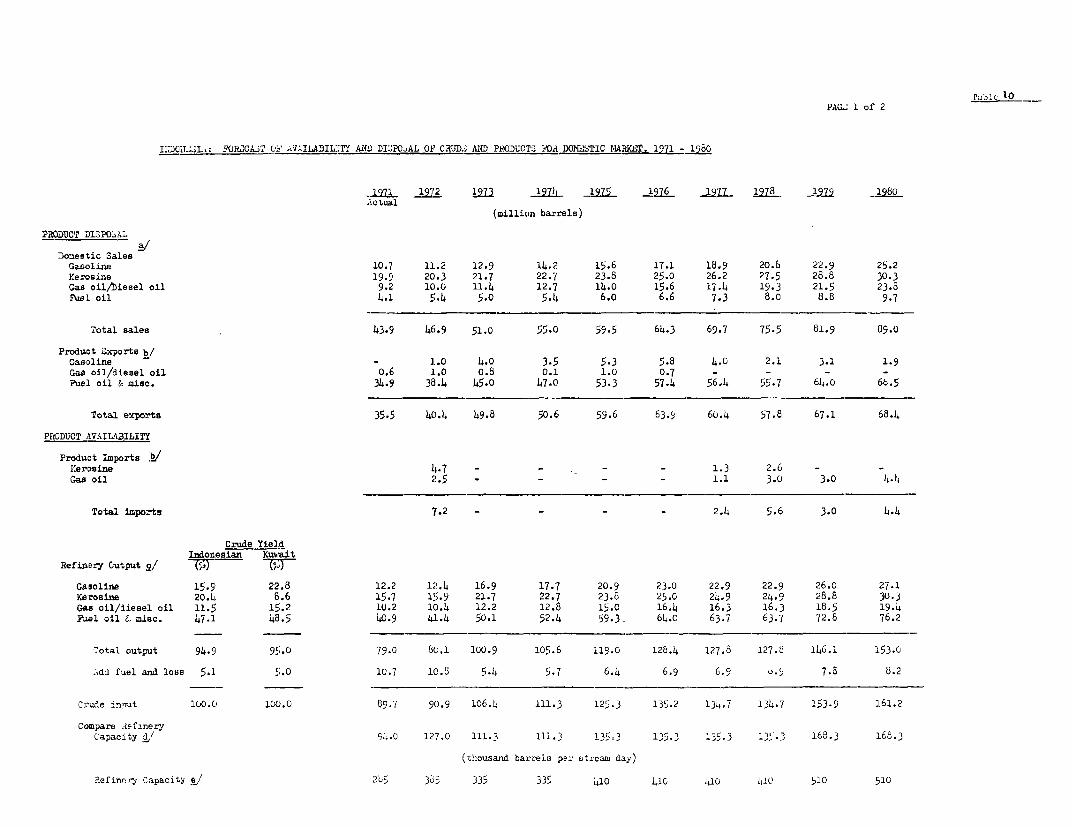
PAG_ 1 of' 2
I;-C:TsI_,: ?0RXCAJL ('P AVAILA,IL17Y AM) DIzPOAL 0OF CRMD' Ai ]PRODUCTOS Y00 DOFE0MIC MALRMT 1971 -198
1971 1974 _L1 1974S 2ZL 1976i _•1L 1978 1979 -1980.ictual(million barrels)
PW0UCT DISPO&AL
Domestic SalesGaoline 10.7 11.2 12.9 14.2 15.6 17.1 18.9 20.8 22.9 25.2Kervsine 19.9 20.3 21.7 22.7 23.8 25.0 26.2 27.5 28.8 30.3Gas oil/ iesel oil 9.2 1O.G) 11.4 12.7 14.0 15.6 17.4 19.3 21.5 23.3Fuel oil 4.1 5.4 5.0 5.4 6.0 6.6 7.3 8.0 8.8 9.7
Total sales 43.9 46.9 51.0 55.0 59.5 64.3 69.7 75.5 81.9 89.0
Product ixpDrts b/Casoline - 1.0 4.0 3.5 5.3 5.8 4.0 2.1 3.1 1.9Gas oil/diesel oil o.6 1.0 0.8 0.1 1.0 0.7 - - - -A el oil k misc. 34.9 3EI.4 45.0 47-0 53.3 57.4 56.4 55-7 64.0 66.5
Total exports 35.5 40-4 49.8 50.6 59.6 63.9 60.4 57.8 67.1 68.4
PIeDDUCT WAVILVBILITY
Product Imports V:esrosine 4.3-1.6 -6
GaU oil 2.5 _ _ _ _ 1.1 3.0 3.0 4.4
Total impo_ts 7.2 - _ _ _ 2.4 5.6 3.0 4.4
Crude YieldIndonesian Kuwait
RefiADry Output S/ (PT) T
Gasoline 15-9 22.8 12.2 12.4 16.9 17.7 20.9 23.0 22.9 22.9 26.0 27.1Kerosine 20.1 L .6 15-7 15.9 21.7 22.7 23.8 25.0 24.9 24.51 28.8 30.3Gas oil/diesel oil 11.5 15;.2 10.2 l0.4 12.2 12.8 15.0 16.4 16.3 16.3 18.5 19.4Fuel oil L misc. 47.1 481.5 40.9 41.4 50.1 52.4 59.3 64.0 63.7 63.7 72.8 76.2
Total output 94.51 9'i.0 79.0 80.1 100.9 105.6 119.0 128.4 127.8 127.8 146.1 153.0
.'ddd fuel and loss 5.1 ';.0 10.7 10.8 5.4 5.7 6.4 6.9 6.9 ,.9 7.8 8.2
Cruee inyut 100.0 10).0 89.7 90.9 106.k 111.3 125.3 135.2 134.7 134.7 153.9 ]61.2
Comnpare AifineryCapacity 9' 9L.0 127.0 111.3 111.3 135.3 135-3 135.3 13.3 1.68.3 ].68.3
(thousand barrels per stream day)
Refinery Capacity / 2/5 33,- 335 33r 4 410 410 i0 410 510 I;C1
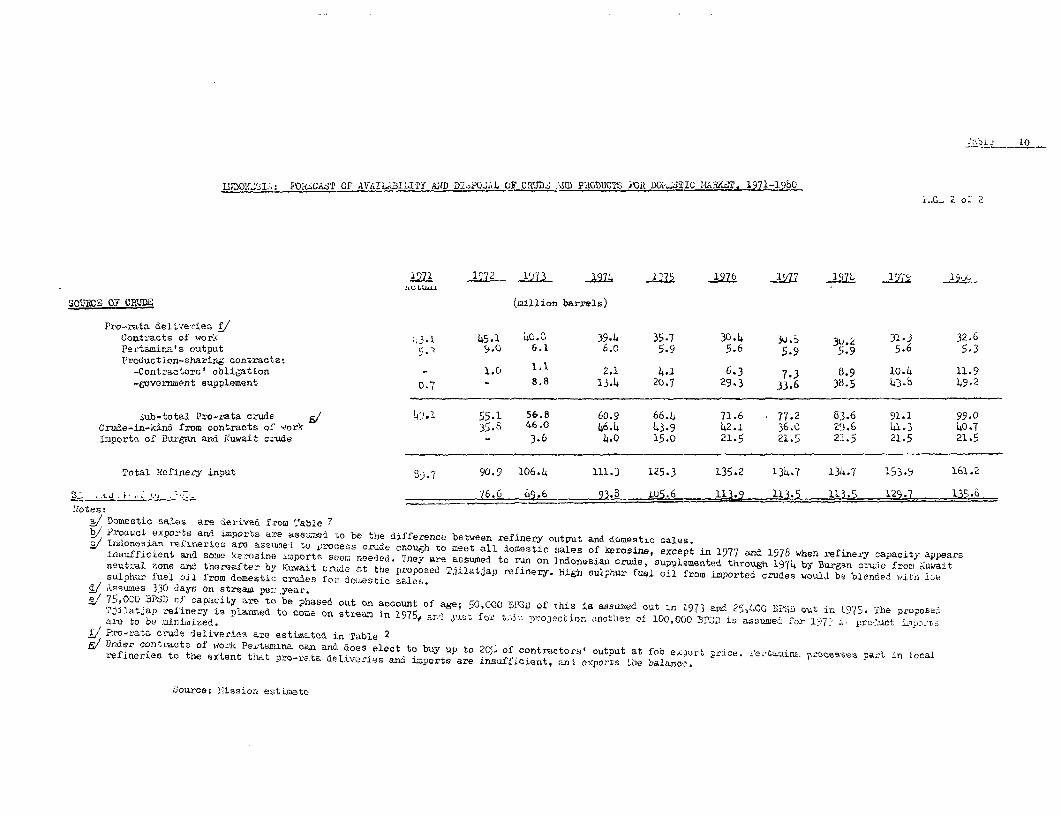
abs 10 _
ThDOi2.^S,IA: PO AST or '.BAVATLUIIITY AND D]IoPOAL OF CRUDTh MdB PRODUCTS )Oi ]DOI-JJTIC 14Aiag 1LIZ980
1971 1 _l'J77 _6 WZl 19 z.NO tU..L
SOVE:X 0: CR]UJ (miillion barrels)
Pro-rata del4veriecf /Contr"acts of wor'k i3.L 45.1 140. 39.4 35.7 30.4 3K.i 3U 31-3 32.6Pel!tamina's output c p.o 6.1 6.o 5.9 516 599 5,9 5-6 5-3Production-sharinig co.ntrac ts: 1-Contractors' oblioation - 1.0 1. 2.1 4.1 6.3 7.3 (9 10.4 11.9-6Y?vernment sttpplement 0.T;- 8,8 13.4 20.7 29.3 33.6 38.5 43.O 49.2
jaub-total Pro-zeta crude! 2 149.1 55-1 56.8 60.9 66.4 71.6 77.2 63.6 91.1 99.0Crude-in--kind from contracts oa' 'rork 35.6 46.0 46.4 43.9 42.1 36.0 29.6 41.3 40-7maporto of Burgan and Kuwait czude - 3-6 4.0 15.0 21.5 21.5 21.5 21.5 21.5
Total Re!finery input 9) 7 90.9 106.4 111.3 125.3 135.z 134.7 1314.7 153.9 161.2
,i .ji,K '.1; Q76.6 j __. _ 23a i5 5.6 11.9 1Ur7 l .W6.9Notes:
a/ Domestic sales are derived from t'able 7,/ Producit exports and imports are assumed 1c0 be the difference between refinery output and domestic -ales.2/ Inidonesian refitneriez are assuried to 1 Jrocess crude enough to meet all domestic sales of kerosine, except in 1977 and 1578 when refinery capacity appearsinsufficient and som7e kerosine imports seem needed. They are assumed to ran on Indonesian crude, Supplemented through 1974 by Burgan crudLe from Uacsitneutral zone and thereafter by Kuwait crude at the proposed Tjilatjau refinery. High sulphur fuel oil from imported crudes would bs blended with lowsulihur fuel oil from domestic crudes for- domsestic sales.2/ Assumes 330 days on stream per year.2/ 75,000 B3PS2 cf capacity are to be phased out on account of age; 50,000 SML of this l.a assused out in 1973 and 25.0,0GG BPSS out in 1975. The p.,o-osedT31ilatjaop refinery is planned to cone on strean in 1975,, an J'at fr tni_ 1rojecbion anothe,r a 100,000 13P.2 is as.uae` for 1')7> i. pproC.Uct .i-:;s'are to be ruinimnzed.
2L/ Pro-rata crude deliveries are estiaz:ted in Table 2S/ Urner contracts of aork Pestasnna can anda does elect to buy up to 2059 of contractors' output at fob export price. iecta:aitu processes part in localrefineries to the extent that pro-rr-ta deliveries and imports are insufficient, anl c-xports the balance.
Source: ilission estimate
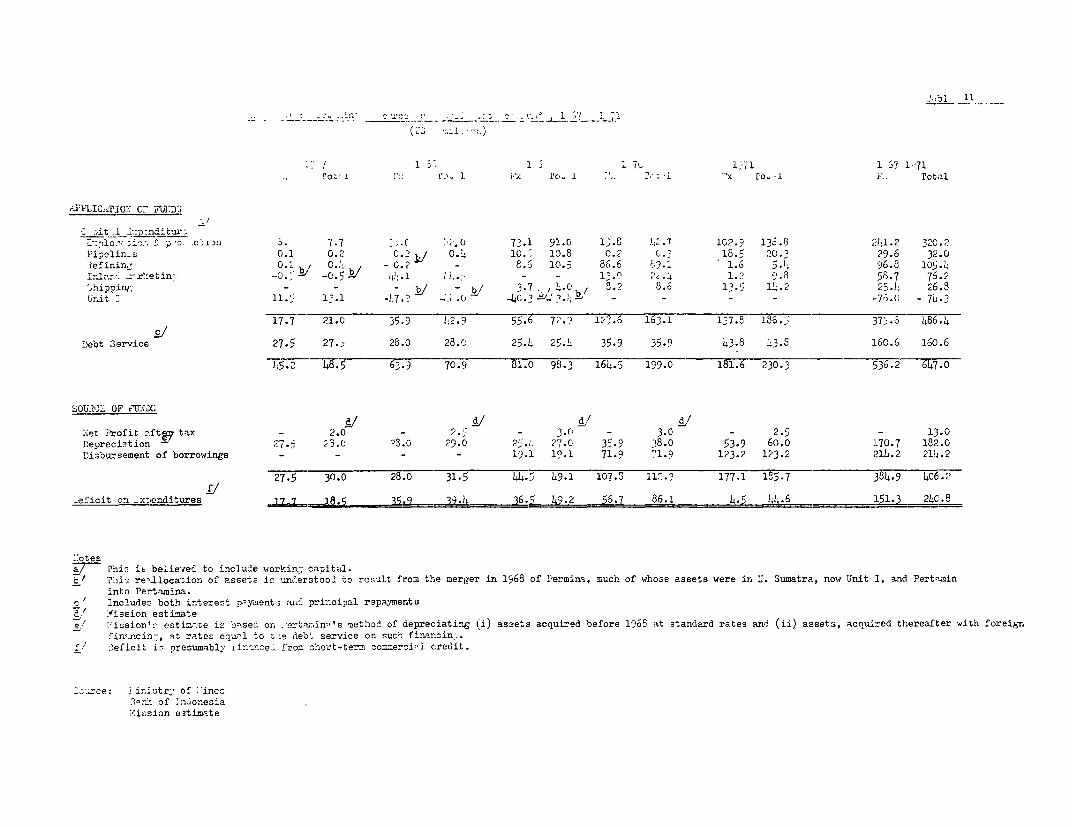
(,., c. 1. j
;: ! 1 3 1 ; 1 tc 1 7u1 1 57 1-71tno-i ro:: 9 1 ;' PC. 1 r'. .9 .'L Do.-L r' Total
aYrLICOI:E2 .' O'.Cr}
' :,it L2 '.Ond± fur::n, o w _ .: . ......... c . n .. 7-.7 .. . . 73 .1 91.0 1l . 42.7 102.? 13 .8 21.2 320 .2
Pipelin s 0.1 0.2 C.2 0.1 lo.,' 1().8 0.2 (.' 18.5 20.3 29.6 32.0-efininC 0.2 0 / - 0.7 - 8.6 10.5 86.6 99.1 1.o 5 96.8 105.4
_0 5 I. ' 5-5 7 76.1n1anrl :-r'.etin' .^t~ -y 4L,.L i_.- . ±'2¢ 2. . , r E- 76.- -. ~ ~ ~~~~~~~~1.1 56.7 26.t.hiDP2U, b - b/ 3.7 !;.o / .2 8.6 - - 11.2 2,.1 26.8
nr.it 71.' 1,.2 -!J7 .7 4 .O 4C. r S - - - - - .-70 .C - 74. 7
17.7 21.0 35.9 42.'i 55.6 72-.9 13.6 163.1 1 7.-8., 37'-.6 486.49/
I)ebt iervice 27.5 27., 28.0 28.t: 25.4 254.4 35.9 35.9 43.8 43-5 160.6 160.6
45.2 ' 48.5 63 70.9 81.0 98.3 164.5 199.0 181.6 230.3 536.2 647.0
_UiS lO'OF &IDS)Z4f/r 94/ 4/ _^
5iet Profit sft: tax -_ 2.0 A- 2. _ 3.0 - 3.0 - 2.5 - 13.0I)epreciation - 27.j 58.0 p3.G 29.t! 25 ,7.C 35.9 38.0 53.9 60.0 170.7 182.0Disbursement of borrowings - - - 19.1 19.1 71.9 71.9 123.2 123.2 214.2 21i;.2
27.5 30.0 28.C 31.5 44. 9 49.1 107.5 1127.? 177.1 17 384.9 406.2
_eficit D_n_X71enditures . 56.7 86.1 4.5 I..6 L51.3 24C.8
''olesa/ Fini, is believed to include wo:rkin., capit,Ll.. / 7.Aii re-llocation of assets ic under3tood to result from the merger in 1568 of Permina, much of whose assets were in U. Sumatra, now Unit I, and Perts.min
into Pertamina.c ' lnclude; both interest p.yyments an' principal repaymentsed' :aission estniatee/ ' ,'ission'- estimasi.e is ba-sed or, oertaz,in-ls method of depreciatingr Ii) assets acquired before 1568 at standard rates and (ii) assets, acquired thereafter with foreign
fin-rcin--, st ratos equr]L to tiLe debo service on such finaincin.-f' :)eficit is presumably iin-mnced from short--ters commercip! credit.
-irce: iinistry of ;'incs"r2'. of In.-onesia
Xission estimFte

EXPORT TRENDS, 1971-1978
Ta-ble of Contents
Page No.
I. INTRODuCTION 1
II. TRKADITIONAL AGRKCUULTURAL EXYUORTS 4
III. TIBER 9
IV. MINERALS (non-oil) 10
V. ALL OTHER GOODS 13

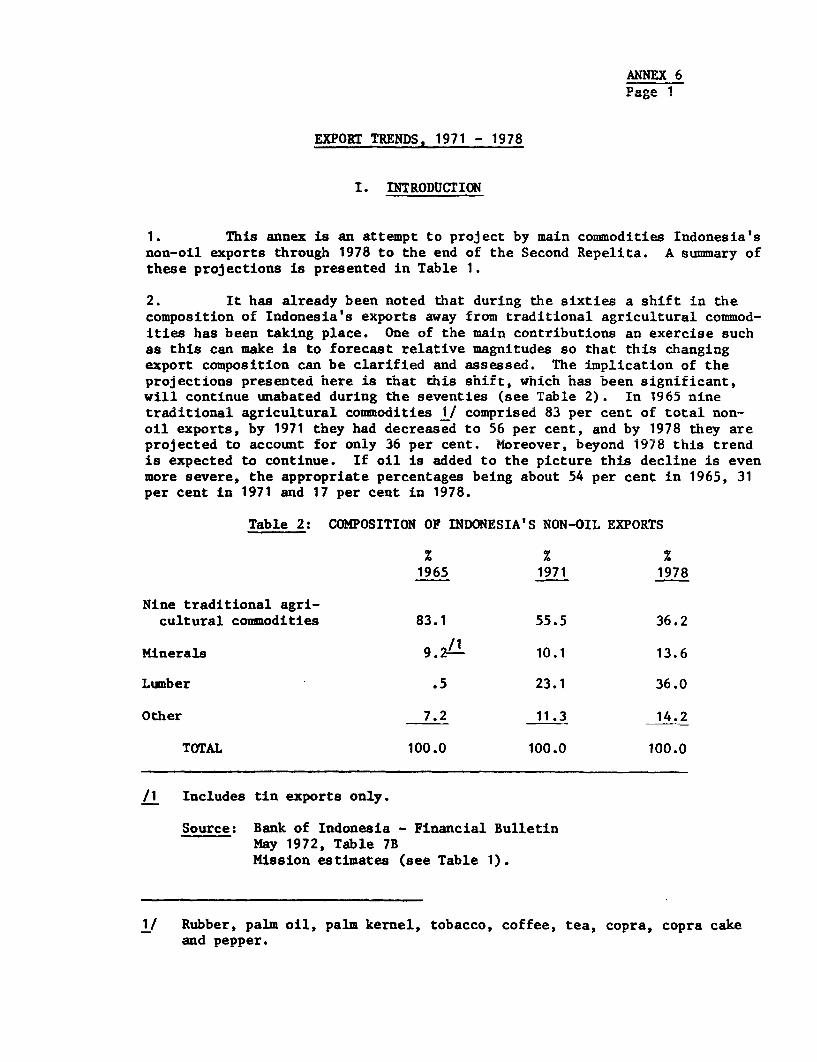
ANNEX 6Page 1
EXPORT TRENDS, 1971 - 1978
A. LLIA L'.IAJU L VA. JL%A
1. This annex is an attempt to project by main commodities Indonesia'snon-oil exports through 1978 to the end of the Secona Repelita. A sfumary ofthese projections is presented in Table 1.
2. It has already been noted that during the sixties a shift in thecomposition of indonesia-s exports away from traditional agricultural commoa-ities has been taking place. One of the main contributions an exercise suchas this can make is to forecast relative magnitudes so that this changingexport composition can be clarified and assessed. The implication of theprojections presented here is tnat this shift, which has been significant,will continue unabated during the seventies (see Table 2). In 1965 ninetraditional agricultural commodities 1/ comprised 83 per cent of total non-oil exports, by 1971 they had decreased to 56 per cent, and by 1978 they areprojected to account for only 36 per cent. Moreover, beyond 1978 this trendis expected to continue. If oil is added to the picture this decline is evenmore severe, the appropriate percentages being about 54 per cent in 1965, 31per cent in 1971 and 17 per cent in 1978.
Table 2: COMPOSITION OF INDONESIA'S NON-OIL EXPORTS
z Z %1965 1971 1978
Nine traditional agri-cultural commodities 83.1 55.5 36.2
Minerals 9.2/ 10.1 13.6
Lumber .5 23.1 36.0
Other 7.2 11.3 14.2
TOTAL 100.0 100.0 100.0
/1 Includes tin exports only.
Source: Bank of Indonesia - Financial BulletinMay 1972, Table 7BMission estimates (see Table 1).
1/ Rubber, palm oil, palm kernel, tobacco, coffee, tea, copra, copra cakeand pepper.
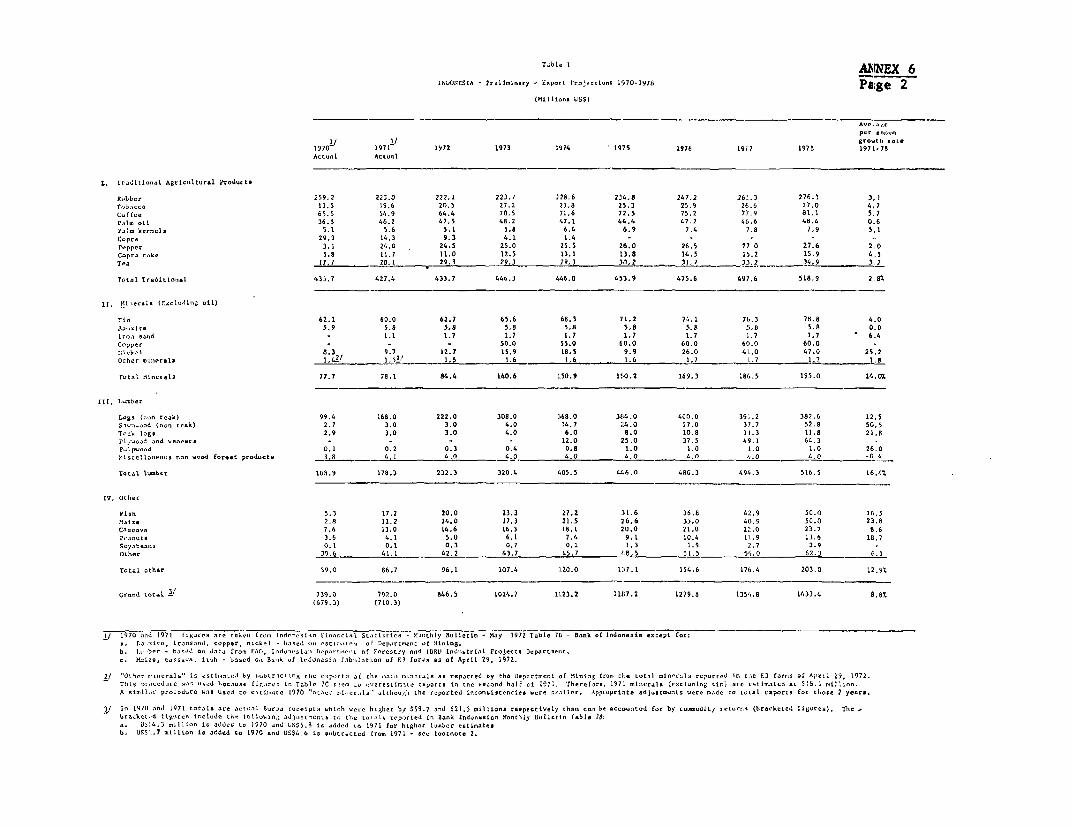
T%bl. I AUINEX 6
INWINESEIA - P-Iilel-arp E.port fr-oi-i... 1970- 1978 PaLge 2
1570 197F1 1972 1931914 1975 1976 191 7 197 8 1971-7
r r.oditlo..l Agrli-Itur,1 Prod.uctS
Robber ~~~~~~ ~~~~~~ ~~~~~~ ~~259.2 223.0 222.1 223.1 ,220.6 234.8 247,2 261.,3 274.1 3,,1Toaooco 11.5 ~~~~ ~~~~ ~ ~~~~ ~ ~~~~ ~ ~~~~ ~ ~~9.6 20.5 27.2 75.8 25.3 25.9 2 6. 27.0 4,7Coffee 65.5 54.~ ~ ~~~~ ~ ~~~~ ~ ~~~~ ~ ~~~~ ~ ~~~~9 64.4 70. 71. 72.5 75.2 7,1.9 01.55
1.,l ol. 36.5 46. 7.4.2 ,:.1 6444 47.2 41.6 48.406pol enl. 5.5 5.6 5.1 5.8 6.4 6.9 7.4 7.979 21ICopro 29,1 14.3 9.5 4.1 1.4 - - -Popper 3.1 24. 0 24.5 25.0 25.5 26.0 26.5 271 0 27,6 2.0Capra _Lok 5.0 11.7 11.0 12.5 13.1 13. 8 14.5 15. 2 15.9 4,5Tea -17.1 70. 29.3 29.3 29.2M 30.r, 21. -34.9 3,12
Total Tradicioonl ~~~~~~ ~~~~~ ~~~433.7 427.4 433.7 446.3 446.8 453.9 475.6 497.6 518.9 2,8%
T LA 62.1 60.0 62.7 65.6 68.3 "1.2 74.1 74. 3 70.6 4,00.soolO 39 3.8 3.8 3.8 5.8 5.8 3.6 5.6b 3.0 0,0Ito,, .uod - 1.1 1.7 1.7 1.7 1.7 1.7 1,2 1.7 6.4Copp-r - - - 50.0 15.0 60.0 60.0 611.0 60.0
::lmhob 8.~~~~~~~~~~~~~~~~~~~~13 9.7 12.7 15.9 18.5 9.9 26.0 41.0 47.0 25.2Other rio/role 1.~~ ~ ~~~~~ ~ ~~~~~~~~4V2 I 1 2/~ 1.5 1.616 1.6 11.7 .7 1.7 1,8
T.too1 Mi-.ncl. 77.7 78.1 84.4 140.6 1150. 9 150 .2 169.3 18645 195.0 14 ,0M
LaOs (cob teak) ~~~~ ~ ~~~~~~ ~~~~~99.4 160.0 222.0 308.0 360. 0 314.0 4C0.0 39..2 382.6 12.5S-.oaod(0 ek) 2.7 3.0 3.0 4.0 14.7 24 .0 27.0 37.7 528a 50,5To-l I11&. 2.9 3.9 3.0 4.0 6.0 8,0 10.0 11.3 11.8 21.8Plywoo d .od ..... er. ---- 12.0 25.0 37.5 49. 1 64.3?alp, -- I 0.1 0.2 0.5 0.4 0.8 1.0 1,0 1.0 1.0 26.0
1locelloneo,o eon nood for*sc pr.d..t. 3.0 4,1 4.0 4.0 4.0 4.0 - 4.0 ".,0 4.0 .0 4
T0401. lonohon 509.9 179.3 232.3 320.4 1,05. 5 444.,0 482.2 494..3 516.5 16.47.
IV, Other
FIsh 5.3 17.2 20.0 23.3 27.2 :11.6 36.6 42.9 55.0 16.5VIatL. 2,8 11.2 14.0 17.3 21.5 24 .6 33.0 401.9 50.0 25.8Ca--Av 7.6 13.0 14.6 16.3 99,1 20 .0 21.2 22. 0 25.3 8.6P.>ooutg- 2.4 4. 5.0 6. 7.4 9.1 10.4 11.9 13.6 18.7loy.shoo.so ~~~~~~~~~~~~~~~~ ~~~0.1 0.1L 0.3 0.1' 0.1 1.3 1.9 :1. 7 2.9Och.r -35.6 41.1 42.2 43.7 45.7 48. 15 56. 0 62.3 6.1
Tota1 othsr 59.0 86.7 96.1 107.4 1120.0 1:17.1 154.6 176.4 203.0 12.9T
Cru~~~~~4 tutol. ~~~~~~~~~.I ~~739.0 292.0 846.5 1014.7 11.23.2 111(7.2 1279.8 1354.8 1/.33,4 8.7.(679.3) (710.3)
T7~ 1970 woo 1921 fog... oetko c, o~Ooa .. ria S.Tio 10.20 hyOllte.M 19-72 Table 711 - Bank of L.doneajia .- pt foro. foxito. IrsnSond, ~~~ coper, nokol lj,I o rtr.o,o Soport-emO 01 lIninAg.
c. MotoC, Oatsaca, Utah buoc.d oa Book of Sedwoslo fobalot~ao aS ES bro s~ o,,,April 2 9, 1977
2/ 'Other conceals Is e-t--to:. ty -to-trst -Og tI, -cp-t, tO0 LIOO -.50 --ntlIa n rep-rted by rho flep.orc-.t of 010104j fro. the total --oo eoted In too 12 fore,. of Ai/ri 29, 1972.This pr,,cd-or 'ao -d fooooip--o Ln Table 7C --or to -crslsotp.rtS LA toe --cod h.ll cIf 1971. Theref-r, 1971 noraoecllrgtin,) arc -ntImaLd at091 mIll-o.A neil, ptood-r Wba ho-d -c etif,,.. z1970 'otho1riaello.ola alth-oo,ll tho r-ported Anocseoesoestl...ppropri,to odju.lt..Lo -et -ode to total -ports for LIo. 2 poor..
3/ S 1970 -1o 1971 tot.Is ar o- oa P.- s ro-ipto which wo-r 6044cr b~, 559.7 -od 121.5 elILO.n reopeCEtoely th.u -o b. *Oco--tod for by -occodlt, ettS(br-ckeind lgoO) hhcoohc~td tI-ate -lectdo the olso; dwoot to l . .101 wI ts.po,-td In 3A.k Ind.oela- mo-tloly &tollctl rabl. 78:
a. lb4., -lliun L. .0dod to9(70 -od .205.8 Lc added -o 11,1 for highc9r loonh- entieat..
b6., 51L.7 illios Ic addad to 1970 -nd 044,6 Lo .obt-ut~d li'rot 1971 - nt footosot. 2.
ANNEX 6Page 3
3. The continuing decline in the traditional agricultural commodities'share in exports is caused both by their slow growth and by the very rapidgrowth of lumber, minerals and a few agricultural commodities such as fishand maize. Lumber is projected to grow at an average annual rate of over16 per cent, reaching $516 million by 1978 and accounting for 36 per cent ofnon-oil exports. Large exports are forecast for both copper and nickel;together they should exceed $100 million by 1978 making mining a dynamicexport sector that will grow at an average annual rate of about 14 per centand will represent 14 per cent of exports by 1978. Of the other commoditiestwo in particular should register substantial growth over the period - fishand maize. Their combined export value by 1978 is set at about $100 million,and together with a few other smaller but rapid growth commodities such ascassava, peanuts, and soyabeans, will result in a 12.9 per cent p.a. growthfor the "Other" commodity group.
4. One effect of these various trends is that Indonesia shouldexperience a respectable growth of its non-oil exports. Total non-oilexports are projected to increase from $792.0 million in 1971 to $1433million by 1978 - resulting in an average annuel growth rate slightly under9 per cent.
5. A second and important implication of these forecasts, and onethat is gaininR considerable attention by government officials, is theemployment and income distribution effect. The traditional agriculturalcommodities particularly rubber and copra are an important source of incomeand employment to a large number of rural families. Yet it is these commodi-ties that have the bleakest prospects and as a groun are forecast to growat only 2.8 per cent p.a. - well below the average export and g.d.p. per-formance exnei-ted. On the other hand; lumber, minerals and fisheries;.where significant growth is expected to occur, and which combined willaccount for almonst threa n,,Artprs of the total growth of non-nil pvnnrtq to1978, perform poorly in the employment and income distribution areas. Tosome exten.t, agricultural commodities such asa maize, cas-sava, pear.uts andsoyabeans, from which fairly rapid export growth is expected, will compensaterural inrnme8 fOr the pOOr norfnrmAne-e expeted of thp trnditionnl apnorts.
The commodity exports that had a significant smallholder contribution 1/ in1971 amniinted to about $362 m 4 llion, 47 per r.t of aenxrto; and byi 1978these will amount to about $500 million, 35 percent of exports. They willhave an average annrual growth 4.7 per ce.t - asubstartiall lemam tha for
total exports.
6. Another important implication of this shift in export compositionfthnr th a vAllwv A namnr cQotnfva Invrnloi fn4lv llv:ar Anmiint*a nf fnov4&n
h _ dyai _Z**_ _0_____ -_--
investment and, like oil exports, will result in a substantially lower netexport .value. This is particularly true for exports of merie.nl a 1-le,
and fish.
1/ These include rubber, copra, copra cake, tobacco, pepper, maize, cassava,pean-uts, soyULea-us an,d other.
ANNEX 6rage 4
7. Also noteworthy is the continuing reorientation of Indonesia'sexports to a major buyer: Japan. In 1960 exports to Japan accounted foronly 4 per cent of total exports (including oil); by 1970 this had increasedto 29 per cent. wnen one examines the specific commodities Japan is buyingand will buy from Indonesia, it is evident that this trend will be more pro-nounced in 1970's. japan is the major buyer of oil, eimber and some mineraisas well as fish and maize - the very commodities where substantial growth isexpected to occur. If one includes only these commodities, non-oil exportsto Japan should exceed $600 million 1/ by 1978, over 40 per cent of non-oilexports. Tnis proportion increases to almost 60 per cent 2/, if gross oiiexports are included.
L. TKADILTLONAL AGRLCULrTURAL EXE'ORTS
Rubber
8. Indonesia's largest non-oil export in 1971 continued to be rubber.About 800 thousand tons were exported; smallholders accounted for about two-thirds of total exports, the rest being produced on large estates; earningsamounted to $223 million.
9. During the 1970's Indonesia&s rubber production is estimated toexpand at only about half the rate of world supply. Although most ofIndonesia's recent growth in production has come from the smallholder sector,future growth will be derived mainly from the estates. The smallholdersector is in a state of general neglect; little or no replanting has takenplace; use of improved clones is nonexistent, and low prices received by thefarmer have encouraged him to switch to other activities. The effects of theproposed IDA credit to smallholders will only begin to have an effect on pro-duction by the late 1970's. In these circumstances only marginal increasesin output for the smallholder sector can be forecast. The situation of thegovernment estates, due to rehabilitation efforts made in the last few yearsis more favorable, and including the additional output resulting from threeIDA credits made to rubber estates, government-estate production is expectedto double by 1978. With small increases in the output of private estatesand assuming a 10 per cent increase in the domestic consumption of rubber,total exports of rubber are projected to increase at an average annualrate of 2.75 per cent.
10. As a result of extensive replanting and new planting of rubberareas with the new high yielding clonal material, the world rubber outputhas expanded rapidly in the last few years. This rate of expansion is ex-pected to be further stepped up in the coming years, when, according to the
1/ Assumes that 82% of lumber exports, 50% of copper exports, and 100%of fish, maize, bauxite, nickel and iron sands go to Japan in 1978.
2/ Assumes that 73.5 per cent of oil export go to Japan in 1978.
ANNEX 6Page 5
estimates prepared by the International Rubber Study Group (IRSG), worldoutput. woulAd reach 3.9 0411ion tCon 4r 1075 andA A.Q millior. tonsu y 1!or
an average annual growth of over 5 per cent. Based on expected technicalChanges 'Lri LAIC pLroUUc;'o LLOf VA&y 16L LUbLbrs andU a v±Ltually unCuILCLgu rateof elastomer demand, the IBRD Trade Policies and Export Projections Divisionprojects hne price of RSSI (c.i.f. N.Y.) to be 17 I/lb in mid-seventies,about a cent lower than the 1971 price, and that for the period 1975-80 aprice of abDout 19 j/lb. The rate of price change implicit in these pro-jections has been applied to the unit of value of Indonesia's projectedexports.
11. Tne Indonesian Government has embarked on a program to increaseexports of technically specified rubber (SIR) in conformity with internationalmarket trends. At present technically specified rubber accounts for 15-20per cent of exports and no premium is being paid for Indonesian SIR. However,as its quality becomes established in world markets it may command a modestpremium. To allow for this, from 1975 an additional half of 1 per cent p.a.was added to the unit value of Indonesia's rubber exports. The net effectof these considerations is that rubber exports by 1978 are projected toincrease by 24 per cent to $276 million.
Tobacco
12. Indonesia exported about 19,600 tons of tobacco in 1971 valued atalmost $20 million. Estimates of both production and export volumes varywidely. The estimated export of tobacco in 1978 is 27.1 thousand tons.This assumes that:
- planted area will increase to 182 thousand hectares by1978 as estimated in the National Fertilizer Study;
- the yield rises from 4.1 quintals per hectare to 5.8by 1978 - the low yield assumptions of the IBRD Agri-cultural Sector survey;
- the domestic demand increases to about 79,000 tons by 1978(assumes an income elasticity of demand of 1).
Independent projections by FAO of world production and demandfor 1980 show a close balance. Assuming constant prices and policies theyproject both demand and production to be 6.4 million tons indicating a con-tinuation of the present overall price level. Although the market for tobaccois quite heterogenous and prices of individual tobaccos vary widely, in theabsence of more information, the price of Indonesian tobacco is also assumedto be constant over the period. The value of Indonesian tobacco exportstherefore will follow the same trend as production, and is projected toreach $27 million by 1978 representing an average annual growth of about4.7 per cent.
ANNEX 6Page 6
Coffee
13. Exports of coffee in 1971 were about 73 thousand metric tons;earnings were $54.9 million. Of this almost 90 per cent was Robusta coffeeand the rest mainly Arabica. As with most coffee-producing countries,Indonesia's future supply capacity is suDstantially ilarger tnan expecteddemand. The IBRD Agriculture Sector Survey reports that Indonesia has thecapacity to more than double present exports ot coftee by i9&0. However,world exports are growing at barely 2 per cent per annum with the demand forRobusta rising at a sharper rate for Arabica. The IBRD is currently assum-ing that the demand for Robusta will grow at 2.5 per cent p.a. Therefore,Indonesia's coffee quota (Robusta) which is set at 73,860 mt for 1971/72is likely to increase only to about 87,500 MT by 1978. The two major non-quota coffee markets are Japan and the USSR: Japanese demand has been grow-ing at nearly 10 per cent per annum although a slowdown is forecast for the1970's. With a concerted effort to raise sales in these markets, Indonesiamight increase its exports of Arabica by 5 per cent per annum.
14. Coffee prices are projected on the assumption that the InternationalCoffee Agreement due to expire in 1973 will be renewed. 1/ A recent cropfailure (July 72) in Brazil has improved price expectations considerably.The initial expectations are that the prices would increase by about 15 percent over previous forecasts. As a result, coffee earnings should increaseconsiderably in 1972 and 1973 and thereafter increase gradually, reaching$81 million by 1978.
Tea
15. There are numerous estimates of production and export volume; ahestimate of 1971 export volume of 37,500 MT is selected as the most consistentwith reported price relationships and past production estimates. Exportearnings in 1971 were $27.4 million.
16. An IDA credit to rehabilitate two tea estates and Dutch aid toantother are expected to increase their combined annual production by 9,000tons by 1980. However, because all other production is expected to continueits decline, by 1980 there would be a net increase of only about 4.000 tonsand that would probably go to domestic consumption, so that exports are notlikely to change much from the current level.
17. The main effect on export earnings will caom from the c-hanoe inthe general level of world prices, as well as from changes in Indonesian teaquality. Based on the first four months of 1972. world tea nriresn couldincrease by about 3.5 per cent in 1972. The IBRD Trade Policies and ExportProiections Divlsions nries nrn1ertiAnn indicaI't- thnt un to 1975 prices w4ll
1/ Recent action by some coffee-producing nations has seriously jeopardizedrenewal of the Agreement. Coffee price projections should therefore beaccepted only with caution.
ANNEX 6Page 7
fall slightly from the 1972 estimated level, and that from 1975 to 1980they will rise at about 2.3 per cent p.a. Tnis, together with the assumedquality improvement in the three estates under rehabilitation plus assumedquality deterioration of non-rehabilitation tea, result in negligible in-creases in the value of tea exports to 1975 but thereafter growth at about5 per cent p.a. Estimated toreign exchange earnings of tea in 1978 wouldbe about $35 million.
Coconut Products
18. Production of copra equivalent in 1971 is generally agreed to beabout 1.3 million tons. Most reports are quite pessimistic about futureproduction possibilities. The crop is dominated by smallholders andcharacterized by neglect. What little replanting that has taken place hasbeen with unselected seed. More than a third of the trees are over 50 yearsold. A growth rate of total output in excess of 3 per cent p.a. is generallyconsidered to be optimistic. The National Fertilizer Study projects noincrease in acreage and an expansion of fertilizer area from 1 per cent to5 per cent for the period 1974-1980.
19. Of all Indonesian exports, coconut products have the largestrelative domestic consumption, and future exports of copra will have tocompete with a large and growing domestic demand. At present almost 90 percent of the domestic consumption of vegetable oil consists of coconut oil;the rest is palm oil. The income elasticity of demand for vegetable oil inIndonesia is estimated to be 1.25, and there is a preference for coconut oilover palm oil. The elasticity of demand for fresh coconuts is estimated tobe .56. These elasticities together with an income growth of say 6.5 percent imply a growth in domestic demand of 7.5 per cent for coconut oil and4.5 per cent for fresh coconuts. These high growth rates together with thehigh proportion of domestic consumption of coconut products result in a rapiddecline of copra exports. However, this decline should be forestalled some-what because as the demand for coconut oil outpaces supply appropriate pricesignals should shift some of the domestically consumed fresh coconut supplyinto coconut oil. In addition, a tight market for coconut oil should resultin an increasing domestic consumption of palm oil. Since domestic consumptionof copra cake and other coconut residuals is proiected at only 3 per cent.export availabilities of copra cake should grow substantially (over 51 percent) to 1978.
20. These assumptions imply the followin2 about coconut product exports.First, by 1975 copra should no longer be an export of any significant magni-tude. In addition, copra prices are nroiected to decline by an average 2.25per cent p.a. Second, due to the large domestic demand of coconut oiland the relatively small domestic demand for conra cake and other residuals,the export availabilities of copra cake should increase substantially overthe period. However. it ia questionable whether these increanes can besuccessfully marketed since copra cake is a rather low protein, inferior oilrake. Given a rather poor market it might be diffilrslt tn inrpreae copracake exports by more than 5 per cent p.a. The copra cake price which sinceMny 1972 has been abnormally lo, ahnoilA quickly regain its 1971 le.vel ho"n.dA
which no further increase is forecast. Foreign exchange earnings of copracake could rea- e1lost $q16 mAiA lior bv 1978.
ANNEX 6Page 8
Palm Products
21. Palm oil and palm kernels are produced almost wholly on estates.Four PNP's are being rehabilitated through IDA projects. Tneir combined out-put is forecast to more than double by 1978. Output of the other estates,together with smaimholder production, including the small addition that therecently signed IDA smallholder project will make to output beginning in 1971,is estimated to increase by only 2 per cent p.a.
22. As noted in para. 19 above, the domestic consumption of vegetableoil is expected to increase by 7.5 per cent p.a. At present palm oil ac-counts for only about 10% of vegetable oil consumption, however as the demandfor coconut oil outstrips production, growing amounts of palm oil will be con-sumed domestically. The effect of these production and consumption forecastswould result in exports of about 367 thousand tons of palm oil and 87 thousandtons of palm kernels by 1978.
23. World production of palm oil during the decade is expected to in-crease by 9.3 per cent per annum. For the market to absorb this increasedlevel of world palm oil exports, it is essential that palm oil's share intotal usage of oils and fats increases substantially. This can only beachieved by palm oil being relatively cheaper than other oils and fats andby exporting countries providing a steady supply of quality oil. It hasbeen estimated by the IBRD Trade Policies and Export Projections Divisionthat the palm oil price will experience a much greater than average declinewhen compared with most other vegetable oils, and settle around L68 per longton (c.i.f. Europe) in 1975 through 1980 compared with E110 in 1970. Palmkernel prices are assumed to be in line with other fats and oils over thelong term. A price of E50-55 per long ton (c.i.f. Europe) by 1980 seemslikely for palm kernels. The 1972 January average price was E50 becauseit has dropped sharply from the unprecedented high 1970 average level ofE71 under the pressure of the steep decline in the copra price. AlthoughIndonesia production will grow substantially over the period, as a resultof falling palm oil prices, export earnings from palm products are projectedto increase by less than 1 per cent p.a. to 1978.
Pepper
24. Pepper exports increased substantially in 1971 as production re-covrered frnm the disease which virtually destroyed the 1970 pepper crop.Besides disease, which periodically hits the pepper crop, overall produc-tivity is low because of a general lack of maintenance, fertilizer, andcredit. Demand is income inelastic and therefore is expected to grow onlyat about the rate of population growth. Improvements in fertilizer use, asproiected by the National Fertilizer Study, as well as efforts to improvemarketing via the Indonesian Pepper Marketing Board, should result in pro-duction beina able to match this nroiectsd demand. Assuming a eonntinuationof the 1971 price, production and foreign exchange earnings are projectedto grnw at 2 npr r.ent p.a.
A 1,TkTD'V C^LqvqrE^ 6
Page 9
III. TIMBER
25. In recent years, forest products have emerged as one of Indonesia'smost important commodity groups. According to Government sources timber ex-ports amounted to US$6.2 million in 1967 (less than 1 per cent of total exports)annd subsequently in-creased very rapidly to some USS168 million in 1971. Theyaccounted for 30 per cent of the growth of total exports over the period rep-resenting 13 per cent of exports in 1971 (excluding oil they accounted for 65%of growth over period).
26. Recorded exports from Indonesia are normally valued at "check prices"which are floor -rices determined b' the Department of Trade for the nurposeof assessing the export prices. In the past, check prices were determined atlevels far below estimated act--l fob prices. Since 1969 Indonesia has beenraising check prices very substantially every year and this combined with asharp vol me increse ham cont 4 buted to the dramatic growth in the earni.gsof exports from timber.
27. The world demand for tropical hardwood is projected to grow at 5.1per cen… p.a. f 4or 0e perioA 196275 andA .6 per cen.t 'fo the period 1975-80.
jJL LUL jJ*8* LJL LflC j CU.t * J -fl J. t.c ... &-. I -I - _
The US and Japan, however, as a result of higher than average growth rates inUemanu. bly 1980", are expected .-o account- fLor zabout three=quarters of all con=
sumption outside the tropical region. This implies that demand prospects fortropical hardwood produced iln the tropical Asia-Pacific regior are speciallyfavorable because of the latter's proximity to markets in Japan and the US.Tnere also seem to be good prospects for the developed importing countriesto acquire an increasing proportion of their tropical hardwood imports invarious processed forms.
28. Outlook for Indonesia's export earnings from forecast productionis bright. Annual earnings could increase from US$178 million in 1971 toover $500 million by 1978.
29. Logs will continue to dominate the export value of forecast prod-ucts during the coming few years. This is not only because the volume oflog exports is expected to rise at hign rates, but also because it is assumedcheck prices will be raised; 1971 timber check prices are estimated to aver-age about 72 per cent of actual fob price. Trne projections assume that by1973 check prices will be only slightly below probable fob market prices.Earnings from sawn wood (other than teak) are projected to increase fromthe current level of US$3 million to US$24 million in 1975 and to US$100million in 1980. Earnings from veneer exports are assumed to become sig-nificant in 1974 and earnings from plywood exports from 1975. The veneerand plywood exports are projected to earn some US$100 million a year by 1980.
30. The projected rapid progress in the earnings from exports of proc-essed wood assumes that the Government takes the necessary steps immediatelyto encourage timber companies operating large logging concessions to establishexport-oriented processing facilities. Steps to be taken should include notonly measures to slow down the expansion of log exports but also positivemeasures to encourage the establishment of processing facilities.
ANNEX 6Page 10
31. Export earnings by the teak sector are expected to increase fromthe current level of US$3 million to over $10 million by 1975, assuming thedevelopment program in Central and East Java will be implemented.
32. Earnings from pulpwood are minor and are not expected to build upto a scale greater than US$1 million a year. Besides wood and wood products,Indonesia has been exporting miscellaneous non-wood forestry products. Theseinclude rattan, "tenghawong" (an oil used in lipstick production), resin,gum and a few other minor items. The first two are more important andhave generally good prospects. Earnings from the other items have tendedto decline and are expected to do so in the future.
IV. MINERALS (non-oil)
33. Non-oil mineral exports continue to be dominated by tin, which in1971 accounted for over 75 per cent of the $78 million of exports. By 1978tin's share is proiected to fall to about 40 per cent as a result of largeincreases in the exports of nickel and copper. These latter two commoditieswill account for over $100 million of foreign exchange earnings by 1978 andwill make mining one of Indonesia's more dynamic export sectors during thedecade.
Tin
34. Exnort earnines from tin were $60.0 in 1971 about double thoseof 1967. At present all tin mining is done by the state enterprise, P.N.Timah, and in 1971 it nroduced 19.765 metric tons. This year's output will
easily exceed the First Repelita target of 20,000 MT set for 1974. Threeforeign firms, P.T. Knba Tin, N.V. Billiton and P.T. Broken Hill. havesigned Contracts of Work over the past few years, and are still at the ex-ploratory stages. There are no indications to date as to their possible
sizes or dates of operations. P.N. Timah is conducting substantial off-shore explorations as well as continuing its program to rehabilitate itsdredgers. There are plans, if financing can be found, to buy additionaldredgers as well as to build a new smelting nl ant. Present smelting capac-ity is about 13,000 MT. The proposed new one is designed to bring totalc- -ci- t- aOut 25,000 MT.
35.* P .N. Tim&h has a longer term ol of 4ni.nrang produotion by 10
per cent p.a. While this is in the realm of possibility on the supply side,ac.,ievir.g such an output would be com-picated- by t-he 1l froath forecast for
world tin demand. Indonesia as a member of the International Tin Council issubiect to export quotas, and given the demand forecasts, ilt seems likelythat quotas would grow at 10 per cent. A target more in line with antic-ipated restrictions on the demand side ,s one mentioned by Bappenas of 25=30,000 MT mined and smelted in Indonesia by 1980. An estimated output of25,000 tons together with the rather low increase 'orecast for the priceof tin, result in projected export earnings from tin reaching $79 millionby 1978; an average growth of about 4 per cent p.a.
ANNEX 6Page 1 1
Bauxite
36. As a result of recently improved harbor facilities and better ef-ficiency in ore handling ! annual exports of bauxite rose from about 80Qthousand tons in 1969 to 1.2 million in 1970 and 1971. The bulk of theexports go to Japan under a 10 year (1968-78) sales contract averaging ahnut1 million tons per year. While high grade ore reserves have been decreasingrapidly, a recent survey indicated the existence of abundant (78.5 milliontons) low grade deposits.
37. The future of bauxite exports depends on how much Japanese smelterscan continue to absorb in light of the comnptition they enrounter with otheraluminum suppliers. The Indonesians are seriously considering the construc-tion of an alumina plant. No plans have been finalized yet but the Japaneseare interested in participation since it would reduce their transport andaluminum smelting costs cons4iderably, and thereby 4-prove their cmpetitiveposition. There are also plans for a large joint power/aluminum-smeltingpro4ect. It is now at the bidding stage and evern if finalized quickly.. -i
unlikely to be operative by 1978. The only other company active in aluminummin.ing is Alcoa, e +.ich hac .d, discoveries i.. West K^aliman.tan, and is con-tinuing work to assess their extent and the most economical way to mine them.To date r.o productior. p1anS bawve bween anr.ounced nor mar'LDe-Ls secured 'Lor a'd-ditional production of bauxite. Exports are projected at the current level0of 1.2 -413ion pour.ds per year.
&J a *A MLLL.L.JL J1A I jF ) L
Co2per
38. Freeport Inudonesia has estimated the "Ertsberg" copper reserve inWest Irian to be about 32.6 million tons averaging 2.5 per cent copper.PrrodUction is scheduleU to begin in early 1913 at a rate of 225,000 tonsannually destined for Japan and Germany. The value of copper concentrateexports could reach uS$60 million annually.
TI.or. 'ads
39. Production of iLror ore containing 55-58 per cent iron and about7-8 per cent titonium started in May 1971. P.N. Aneka Tambang has a con-tract with Japan for 300,000 tOns of1 iron ore a year for a next ten yearsat a price of $5.50 f.o.b. There is an estimated three million tons of ore.A larger deposilt near Jogjakarta is under consideration for development.Preliminary exploration shows a deposit possibly containing more than 140miilion tons of exportable iron sands. Harbor conditions are, however,very poor.
Nickel
40. Indonesia is the main producer of nickel ore in South-east Asiaand sells all of its output to Japan. At present only the state enterprise,P.N. Aneka Tambang, is mining nickel and in 1970 exported 538 thousand tonsof ore worth $8.3 million. The reported earnings for 1971 are $9.7 millionand based on an estimated price of about 304/lb. and a nickel content of
ANNEX 6Page 12
2.4 per cent, export volume would have been about 600 thousand tons. Facedwith the prospects of depleted reserves of exportalie grade nickei ore atthe end of the contract, 'a low-grade-nickel processing plant is scheduledto begin production in 1974. Initial production is set at about 4,000 tonsper annum of nickel in ferronickel for eqxport to Japan as part of a long-term sales contract. Low-grade ore reserves for this plant are estimatedto be capable of supplying the plant for at least thirty years.
41. In addition to P.T. Aneka Tambang's operations, contracts of workhave been signed with three foreign firms, two of which should start substan-tial production by the mid-seventies. P.T. International Nickel Indonesia(I-NCO) announced in June of 1971 that it had located significant lateriticnickel deposits and was making plans to develop them. The first stage ofthe project would involve the construction of facilities to produce about50 million pounds ,of nickel per year in the form of matte with initial pro-duction plans for the mid-seventies. P.T. Pacific Nickel announced in Octo-ber 1971 that it had also located significant lateritic nickel deposits andthat it would proceed to the next stage of development. Provided the feasi-bility study of plant design now underway indicates the deposits are eco-nomically exploitable and marketing and financing can be arranged, initialproduction could begin as early as the mid-seventies. The project wouldinvolve the production of 60-100 million pounds of nickel annually, prim-arily in metallic form. A third firm, Indonesian Nickel Development, isstill at the exploratory stage.
42. The world nickel market went through a severe slump in 1971. How-ever, demand has already picked up, particularly in the US and is likely toimprove further with economic recovery in the industrial countries. Thereare, nevertheless, a number of imponderables in the market situation whichinvite caution in viewing nickel's long term prospects. But even underpessimistic assumptions, world nickel consumption is forecast by the IBRD,to grow at a respectable rate: 4.0 per cent per annum between 1970 and 1975(5.5. per cent annually by 1972-75) and 4.8 per cent between 1975-1980. Onthe other hand, producers' stocks are large as a result of the 1971 slumpand might not be liquidated rapidly. Even conservative estimates of prob-able capacity indicate that nickel production potential may exceed require-ments for another two years, and possibly three or four. This short-runoversupply should not cause problems for Indonesia's nickel exports sincethe large production increases forecast for INCO and Pacific nickel willonly begin in the mid-seventies.
43. In the absence of price and ore content information future exportsof nickel ore are proiected at the current Indonesian f.o.b. nickel Driceof about 30 J a pound. Exports of nickel contained in ferronickel aretentativalv Ret at Si a nound. At these prices exnorts of nickel wouldreach $47 million by 1978, almost 500 per cent higher than the 1971 level.Hrw.upr- if trh nro cnntent of TNCO'a and ParifiS's rpesrvpe differs from
the present ore or some partial smelting is undertaken in Indonesia, thevaluei of t-hease pronections would hbe nwihafAntiall rchanged.
ANNEX 6Page 13
VI. ALL OTHER GOODS
44, All other goods (excluding tradit'onal agricultural exports des-cribed above, and timber and minerals) taken together have made significant
gains over tne last few years. Iu 1970 exports of these goods were equal
to $59.9 million, in 1971 they had increased by 47 per cent to $87.1 million.
Over 90 per cent of this increase was due to 'ncreases inL exports of fish,
maize and cassava. Exports of these three products were $16 million in
1970 and $41 million by 1971; they should contirnue to be substantial growth
exports.
Fish and Fish Products
45. The spectacular increase in fish exports (based on E3 1/ forms,
edible fish increased from $5 million in 1970 to $17 million in 1971) isalmost wholly attributable to increased shrimp exports to Japan. The pros-
pects for a continuing strong demand from Japan are excellent. Shrimp re-
source surveys conducted by the Directorate of Fisheries indicate that sub-
stantial stocks of shrimp and fish exist off the east coast of Sumatra as
well as in the areas of known high potential that are presently being ex-
ploited.
46. Another fish that is expected to be exported in the near future
in substantial quantities is the skipjack tuna. Exports will go to Japan
where the market is good and prices have been rising. IDA in 1970 signed
a development credit to develop the export of skipjack. Although this proj-
ect is behind schedule, skipjack exports should reach about 1,000 tons by
1973 and increase to 9,600 tons by 1978. At full development, based on a
Japanese price (c.i.f.) of $500 a ton, this would add about $2.8 million
to export earnings. Nine joint ventures in fisheries are underway, mainly
with the Japanese. Actual investment is estimated at $9.4 million. Another
5 companies are planning to establish joint ventures based on skipjack pole
fishing. The Indonesian Government has recently signed agreements with ADB,
UNDP/FAO and Japan for fisheries projects. These investments, both public
and private, which for the most part are aimed at increasing fish production
for domestic consumption, should result in a significant increase in export
earnings as well. Projects suggested by the IBRD Agricultural Sector Survey
would add $20 million in shrimp exports and about $15 million in skipjack.
Given the large potential for production, the large and growing demand, and
the substantial interest and investment in this sector, Indonesia should
have no difficulty in exporting about $50 million worth of fish by 1978,
three times present earnings.
1/ E3 forms are authorizations given by foreign exchange banks to exporters
of co dodities other than oil and tin to receive payment in foreign
currencies.
ANNEX 6Dn.>,. 11A
Cassava
47. About 400 thousand tons of cassava ($13 million) were exportedto Eurone In 1Q71 AA fPPel grAin. The huilk of q-rnntrr tn tiara hnR haon In
the form of cassava chips but to meet market demand for a more uniformfeed, efforts are being mAde to switch ovner nt4rely ton cncAa,e pellets.Eight pelletizing factories are now in operation, four are under construc-tion and six mnre have been -ranted opernating licensesa. TArn .na arie grar.te
only if arrangements are made to guarantee an adequate supply of cassava tokeep the factory in operation. Total pelletizing capacity when all thesefactories are in operation is about 540,000 tons. The growth in demand forfeed grains is estimated at 4-6 per cent. Substan.tial am.into nof TAdnon sla'scassava go to the West German pig industry which could grow even faster. In0addition, the Indones4ian Government is att tin" to r.egotiate a reductior.
of the EEC import tariff on cassava. Since production for the pelletizing.a. WSo C hs been a:rnged~Y and zi.nc t factories should be in operat.o
by 1975; exports are estimated to reach about 500,000 tons by 1975, increas-4 1__C -- -- - - A 1,_ 9lets
ing uy 5J peL I.;LL p.a. L-Ierea_Lter. *I; current prices of CSSav pellet,
this could mean cassava exports of about US$23 million in 1978.
Maize
48. Maize exports in 1971 are reported at 225 thousand tons ($11.2J. 1 1 J.8 on . s ~ ~ ~ ~ --U.L.L 4L.A C %Lorn .'L -.he secondu 'Largest -user of. 'Landu 'in Lnd'onesia Out its
value in total production ranks below rubber and cassava. Corn area andprouuction nave uecinedu in the Lace of intensive programs for rice. Cornis concentrated in East Java and Lampung and experiences in North Sumatrahave demonstrated that withn better seeds, fertilizer and improved creditand marketing opportunities farmers can raise production substantially.
49. Japan and smaller markets in Asia have shown an interest in im-porting corn from Indonesia, but internal market costs and port and oceanfreight charges make Indonesia's corn more expensive than that of othersuppliers. For instance, the cost of shipping a ton of corn from Indonesiato Japan is $10-11 which is almost double the cost from Thailand to Japan.Tne opportunities for corn as an export crop are considered good if yieldscan be raised and marketing costs reduced. There is some indication thatthe Government is making a serious effort through its Bimas Pulses programto raise output. The Agriculture Sector Survey estimates that 500,000 tonscould be exported by 1975 and 1 to 2 million tons are possible by 1980 withan intensive corn program. This latter figure is rather high if competi-tion with Thailand for the Japanese market is considered. Exports are pro-jected to reach 1.0 million tons by 1978 equivalent to US$50 million.
Other Agricultural Products
50. Export prospects for peanuts and soya beans, both of which areincluded under the Bimas Pulses Program, are good. A sizeable yield in-crease in both crops is possible and Indonesia could expand its exportssignificantly to take advantage of the large world demand. Exports ofpeanuts could reach 65 thousand tons by 1978 - a tripling of present exports.
ANNEX 6Page 15
Soya bean exports could increase dramatically to about 150,000 tons by 1978from their nresent low level of 3-000 tons:. SuhRtantial nlanting nf rsAhws:has taken place recently under new official programs - exports could beginIn a few years.
MAnn,fAg-t-ireA r-dnAm
51. .Mnii,af*p,rnA exports, e diA4ng processedA raw m-ter--al suc-h asplywood and technically specified rubber, are at present negligible. Basedn. E3 Ifnrmi- 1971 ivYn,ts nf mnAuIfActttnrgA a eA Av* at4mfAm,A at aOU" -1 .4million and consist mainly of textiles, clothing, anJ matting. A reportedlyex-ortable grade of sil has hban Adaev1peA 4l. South Sulesi as a resultof a Ministry of Trade project assisted by ILO. Future m^n"lf-ctured exportscould be iUtVJCA.B ba =free t-ade port system (see Industry annexE *hat w^ulA provide incentives to
mafl1 .nA -- A4..- -o 4egir. -x--ng-4.4 4in addition to pu.g .
for the local market. To account for this Dossibl- development manufacturedeprts _r -uh pro-lec-edI to grow b-y 30 per cent per annum- to 197 andU
subsequently by 50 per cent ner an-um; reaching $12 million by 1978. Thepotent.ial for icreasing manu.factured exports '8 mu^h larger ana woulddepend on the success of Government efforts to stimulate m-nufact,ving basedon Irndonesian raw materials nd to promoute the development or export indus-tries using effectively the low-cost labor available.