Embed Size (px)
Citation preview

Use of surveys as a way to measuring the outcomes of public programs
I. INTRODUCTION: MEASURES OF PERFORMANCE Most performance measurement systems incorporate four types of measures--inputs; process; outputs; and outcomes. Traditional, budget-based performance measurement systems focus primarily on inputs: What are the resources available to address the priority problems faced by the organization? Input measures are relatively easy to identify and collect. And, to an extent, they do illustrate the commitment of the organization to address the issue or issues at hand. Commonly used input measures include dollars appropriated, person hours committed, equipment purchased, space provided and/or length of time committed to the problem/project. Less common but other very relevant input indicators are: other funds/other organizations involved or leveraged as a result of the initial organization's action decision; capital funds directly or indirectly committed as a bi-product of the operating budget commitment; and, staff and consultant time dedicated to the preparation, operation, monitoring and evaluation of the program being launched. Input measures are frequently criticized because they tell you only how hard you are trying to do something about a problem or the extent of your commitment to reach a particular goal (e.g., How much are we willing to spend to find a cure for AIDS?) Input measures tell you very little about how well you are doing in reaching the objective--they measure effort much better than they assess results. But input measures should not be ignored. They provide an important barometer of the scope of activity, the present and future demand on overall resources, serve as surrogates of the organization's priorities, and often reflect the organization's customer priorities as well. Analysis of input measures can help an organization decide whether the critical mass of effort necessary to impact the problem at hand is being met. Also, the individual performance of a variety of organizations in a given service area may be profoundly affected by the overall funding for their issue area generally. Size of contracts and issue area budgets should also influence the size, complexity and cost of the performance measurement system chosen. The process of producing work is an increasing focus of performance management systems and indicators. Total Quality Management's lasting contribution to management practice may be its attention to the work steps involved in producing goods and services. Measurement of those activities facilitates organizational learning and improvement. Process measures include the delineation and definition of specific work steps, measures of the amount of time it takes to perform specific tasks, error rates, and similar indicators. Requiring organizational units to report process measures can signal government's concern for the quality and efficiency of an organization's internal operations and can compel attention to these fundamental management issues. Output measures are the third type of performance measurement indicators. Output measures seek to quantify the amount of work accomplished with the input/resources provided. Output measures can seek to measure quantity, quality or both aspects of the work performed. Typical output measures include:
file:///C|/Users/admin/Documents/websites/cohen/notused/aspa98-3-598.html (1 of 26) [11/4/2008 6:54:01 PM]
Use of surveys as a way to measuring the outcomes of public programs
customers/clients served; facility condition and cleanliness; miles of road paved; numbers of applicants trained; tons of garbage collected; wages earned; course work completed; certificates or licenses acquired; or numbers of products sold. In simple terms, output measures gauge the volume of activity generated by inputs. As with input measures, some outputs are more important than others. A good rule for performance measures for both inputs and outputs is that the more measures you collect data, the more you will spend on the measurement system itself, the less accurate and useful the information you receive will be, and the less impact on service to customers you will achieve. Utilizing a select number of really important indicators is the key to a successful performance measurement system. Since the Second World War, most successful performance measurement systems have been output-based. However, in the 1990's, many experts have written about the weaknesses inherent in output-based systems. Output systems tend to measure and reward work accomplished on a milestone basis-- for example, interim payments are doled out as a contractor achieves pre-established targets along the way toward a completed assignment or full service to a customer. On the surface, output measures seem to provide exactly what senior management should want--simple categories designed to encourage staff to accomplish the work desired by paying for milestones actually achieved. The key weaknesses of an output based system is that it often "pays" more for the process toward the desired outcome than the outcome itself. The ultimate outcome may be underemphasized and key goals may not be reached. For example, in our welfare reform work we have found that by the time employment and training programs finish being rewarded for outputs, training, certification, resume preparation and job interviews, only a small percentage of the contract amount remains to reward the contractor for actually placing the client in a job, keeping them employed or assisting them to move up the employment ladder. This leads us to outcome or impact measures. In the 1990's performance measurement experts have worked to tie input and output measures to more meaningful program impacts and goal achievement. That is, the performance of a police department is not best measured by the number of officers on the beat (input), how many people are arrested (output), or even the reduction in the overall crime rate (output/outcome), but rather how safe people feel/how safe they actually are (outcome).
An initial review might lead to the conclusion that properly designed outcome indicators are all a good performance management system requires. In practice, however, outcome measures have significant weaknesses. First, outcome data is usually the most difficult to identify and expensive to collect. Second outcomes are on-going and the long term impacts, both positive and negative, often do not evolve quickly. Finally, it is often difficult, if not impossible to determine the independent effect of a program or government activity on a particular outcome. This paper explores the use of two types of performance measures in the New York City Department of Parks and Recreation: output measures--the condition and cleanliness of the parks; and outcome measures--the public's satisfaction with the city's parks as measured in a random sample survey of park users.
file:///C|/Users/admin/Documents/websites/cohen/notused/aspa98-3-598.html (2 of 26) [11/4/2008 6:54:01 PM]
Use of surveys as a way to measuring the outcomes of public programs
II. MEASURING PARK OUTPUTS A key strategy utilized by Parks under Commissioner Henry Stern was the use of parks inspections to increase the day-to-day accountability of on-site parks managers. Just as the Police Department consulted geographic crime data to focus management attention on crime reduction strategies, so too would Commissioner Stern consult parks inspection data to target problems and to direct the activities of his staff. So, in 1995, he ordered a increase in the number and frequency of parks inspections. The expansion of the park inspection program became feasible through the use of hand-held computers to record inspection data. These hand-held computers, which inspectors utilize during the on-site inspections, facilitate the swift compilation of inspection results. In 1992, 1993 and 1994 combined, 1,400 parks inspections were conducted. In 1995 that three-year total was exceeded by 600 inspections, as parks staff logged 2,000 inspections that year alone. The increased use of performance data remains an operational strategy at DPR. The system used by Department managers to evaluate the quality and upkeep of parks and park facilities is called the Parks Inspection Program (PIP). DPR's office of Operations and Management Planning uses PIP to rate the cleanliness and condition of every park site of 6 or fewer acres. They also inspect all playgrounds, sitting areas, and public triangles and squares. Inspections are conducted on a bi-weekly basis.
The Parks Inspection Program rates parks as acceptable or unacceptable in two categories: cleanliness and overall condition. The cleanliness rating consists of the following features:
Graffiti
Glass
Lawns
Litter
Weeds The overall condition rating consists of the five cleanliness features plus seven structural features:
Sidewalks
Safety Surfaces
Paved Surfaces
file:///C|/Users/admin/Documents/websites/cohen/notused/aspa98-3-598.html (3 of 26) [11/4/2008 6:54:01 PM]
Use of surveys as a way to measuring the outcomes of public programs
Play Equipment
Trees
Benches
Fences
Cleanliness is deemed acceptable if all of the following conditions are met:
1. Three of the five features are rated as acceptable.
2. The park does not have excessive glass in play areas.
3. No unsanitary conditions exist.
4. Overgrown weeds or grass do not prevent use of the site. The overall condition of the park is deemed acceptable if:
1. Ten of the twelve cleanliness and structural features are acceptable.
2. No deficiency exists which requires immediate attention, such as a safety hazard. The standard for a park's overall condition is stricter than that for cleanliness, and if the cleanliness of the park is unacceptable, the overall condition of the park is unacceptable. Inspectors target sites at random, and park managers do not receive advance warning about inspections. Managers at the Office of Operations and Management Planning present the results of the inspections to the Borough Commissioners, as well as to the Parks Commissioner, at regular senior staff meetings. The results are also posted on a bulletin board located outside of the Parks Commissioner's office. Site managers of inspected parks also receive inspection data on a regular basis. In addition to the general inspection rating, park managers get detailed lists of deficiencies and Polaroid photographs of their site taken at the time of the inspection. The inspection report also breaks down the seriousness of each deficiency and advises what corrective action is required. In addition, the PIP has a built-in method for correcting maintenance and cleanliness problems. Any unacceptable measures from the original inspection are reinspected after eight weeks. The results of these second inspections are presented to the First Deputy Commissioner and Commissioner Stern. The First Deputy Commissioner's staff independently tracks deficiencies involving potential safety hazards.
file:///C|/Users/admin/Documents/websites/cohen/notused/aspa98-3-598.html (4 of 26) [11/4/2008 6:54:01 PM]

Use of surveys as a way to measuring the outcomes of public programs
Impact of the Parks Inspection Program The Parks Inspection Program has evolved into a highly effective performance management tool for DPR. The inspections inform park managers about what operational areas require improvement and establish their maintenance priorities. The program also provides site managers with performance incentives. Ultimately, inspection results help assess the effectiveness of park managers and borough offices. Park Managers compete with one another for ratings and ratings improvements, and the five boroughs compete to have the best maintained parks. Perhaps most importantly, the inspection program communicates the park's quality standards to park personnel and evaluates how well the personnel uphold those quality standards. Improvement in cleanliness and overall conditions ratings from 1994 to 1997 demonstrate the success of the Parks Inspection Program, despite budget and personnel reductions. Citywide, overall condition ratings increased from 39% acceptable in the Spring of 1994, to 43% acceptable in the Spring of 1995, and increased again to 69% acceptable in the Spring of 1997 (See Exhibit 1). Citywide cleanliness ratings also increased dramatically. While additional labor from welfare workers in the Work Experience Program and civic participation have had a role in these improvements, the Parks Inspection Program is a systematic method for improving park cleanliness and maintenance over the long-term, and can be credited for much of the progress made in these areas over the last four years.
Exhibit 1
PARKS INSPECTION PROGRAM RATINGS BY BOROUGH
Percent Acceptable
Overall Condition Rating
Borough
Spring
1994
Spring
1995
Spring
1996
Spring
1997Bronx 27% 43% 53% 66%Brooklyn 35% 38% 57% 67%Manhattan 41% 41% 67% 69%Queens 46% 45% 61% 69%Staten Island 50% 58% 91% 82%
file:///C|/Users/admin/Documents/websites/cohen/notused/aspa98-3-598.html (5 of 26) [11/4/2008 6:54:01 PM]

Use of surveys as a way to measuring the outcomes of public programs
Citywide 39% 43% 62% 69%
Source: Department of Parks and Recreation
Exhibit 1 (Continued)
Cleanliness Rating
Borough Spring 1994 Spring 1995
Spring 1996
Spring 1997
Bronx 63% 77% 91% 94%
Brooklyn 78% 93% 91% 94%
Manhattan 81% 89% 94% 91%
Queens 74% 81% 94% 93%
Staten Island 85% 100% 100% 100%
Citywide 75% 86% 93% 93%
III. OUTCOME MEASURES: CUSTOMER PERCEPTIONS OF NEW YORK CITY PARKS The views of park users are a critical measure of departmental performance. While customer surveys are not a regular element of the department's performance measurement system, the department is interested in information on customer satisfaction. So, during summers of 1996 and 1997, the Department cooperated with an experiment proposed by Cohen and Eimicke to pilot-test and fully implement surveys of park users as a means of enhancing the performance measurement system.
A team from Columbia University and a parks advocacy group known as the Parks Council conducted random surveys of 374 park users in ten New York City parks in the summer of 1996. In the summer of 1997 a full scale random sample survey of 1,086 park users in 19 parks was completed This effort to obtain information on customer views received strong support from Commissioner Henry Stern. They agreed to cooperate in data collection efforts, and planned to utilize the information in operations planning.
file:///C|/Users/admin/Documents/websites/cohen/notused/aspa98-3-598.html (6 of 26) [11/4/2008 6:54:01 PM]

Use of surveys as a way to measuring the outcomes of public programs
Survey Objectives and Methodology The 1997 survey was a stratified random sample of 1,086 people recreating in 19 parks in all five boroughs of New York City from July 21 to August 5, 1997.
The initial stage of the sampling process was stratified sampling. A stratified sample dissects the population into distinct categories, or strata, and then selects a minimum number of representatives from each strata. We wanted an accurate cross-section of parks to be represented. At the same time there were several possible factors upon which we could make our cross-section. For example, would the cross-section be based on income, on geography, or on racial composition?
To adequately represent New York City, our sample of parks was constructed to be representative on all three of these cross-sections. In our sample design, each of New York City's five boroughs was considered a stratum. We then selected parks from each borough, ensuring that they were not concentrated in just one section of the borough. Another element which factored into the geographic selection of parks was the size of the parks themselves. We sought to select a variety of parks, with small, medium, and large parks all represented in our sample. We also selected the parks in our sample to come from neighborhoods with a range of income levels. Interviews were conducted in the parks by 60 enrollees in the Parks Council's High School Summer Youth Program. Interviewers were trained by a team of Columbia University faculty and graduate students in three sessions held at the School of International and Public Affairs. Interviewer staff in the field were supervised by Americorps Interns employed by the Parks Council. Parks Overview The New York City Parks system consists of more than 27,000 acres of park
land and other properties. Parks account for almost 20,000 acres, while nonpark properties make up the remainder. Nonpark properties include playgrounds; expressway and parkway land; malls, strips, and plots; circles, squares, and triangles; and miscellaneous other properties. New York runs 479 parks, but its five best known parks (Central Park in Manhattan, Flushing Meadows-Corona in Queens, Prospect Park in Brooklyn, Van Cortlandt-Pelham Bay in the Bronx, and the Greenbelt in Staten Island) make up more than 40% of all the acreage. In addition to these parks, there are 34 parks above 100 acres each. These parks account for 8,385 acres (approximately 43% of all park land). Thus, thirty-nine large parks account for approximately 84% of park land. The 41 medium-sized parks (20-100 acres) and 399 small parks (under 20 acres) account for the remaining 16% (3,072 acres). Park facilities include 623 ball fields, 541 tennis courts, 33 outdoor swimming pools, 10 indoor swimming pools, 31 recreation and senior centers, 14 miles of beaches, 13
file:///C|/Users/admin/Documents/websites/cohen/notused/aspa98-3-598.html (7 of 26) [11/4/2008 6:54:01 PM]

Use of surveys as a way to measuring the outcomes of public programs
golf courses, 6 ice rinks, 4 major stadiums, and 5 zoos.(1) Compared to other major U.S. cities, New York maintains an expansive park system. A 1991 study by the Citizens Budget Commission included a survey of 14 major U.S. cities. Among these cities, only Phoenix possessed more park land acreage, and New York devoted the highest share of its total land (13.5%) to parks. However, New York is more densely populated than other cities. So, New Yorkers must share comparatively less park land than residents of most other cities. Among the cities included in the survey, only Chicago lagged behind New York in park acreage per 10,000 citizens. New Yorkers have 36 park acres per 10,000 residents, while the average among the 14 cities surveyed was 96.7 acres per 10,000. The median was 65.5 acres per 10,000. Public Satisfaction With Parks While parks operating expenditures are comparatively lower than other major cities and have decreased in real terms since 1965, the public is generally satisfied with the quality of New York City parks. In the survey we conducted in 1997, nearly 76% of park users rated the quality of the park that they were visiting as either good or excellent. (See the Appendix for the English version of the survey instrument used in this report.) Similarly, a 1994 Commonwealth Fund survey of a random sample of New York City residents found that 52% of New Yorkers give a positive rating to park maintenance. Another 44% in 1994 believed that parks and playgrounds had improved over the previous five years.(2) In general, all of the surveys of parks users that we reviewed for this project produced results similar to our study: A high level of
satisfaction with parks, concerns about cleanliness and security, and a high value placed on parks as a source of relaxation from the city's frenetic pace.
As Exhibit 2 indicates, most park users were reasonably satisfied with the parks, the most common
file:///C|/Users/admin/Documents/websites/cohen/notused/aspa98-3-598.html (8 of 26) [11/4/2008 6:54:01 PM]

Use of surveys as a way to measuring the outcomes of public programs
response to our question asking respondents to rate the park they were visiting was good (50%). However, the park-specific breakdown on this question in Exhibit 3 indicates significant variation in
response. Central Park, received the highest rating of any park. No one rated it poor, and half of those interviewed in the park gave it a rating of excellent. Only one other park (Clove Lake) was rated excellent by a majority of its visitors. If we combine ratings and use good and excellent as
positive ratings and fair and poor as negative ratings, we see that eighteen of the nineteen parks we conducted interviews in were perceived positively by users (See Exhibit 4). This included 14 parks viewed positively by 70 percent or more of those interviewed. Alley Pond, Central, Clove Lakes,
Prospect and Marine Parks were
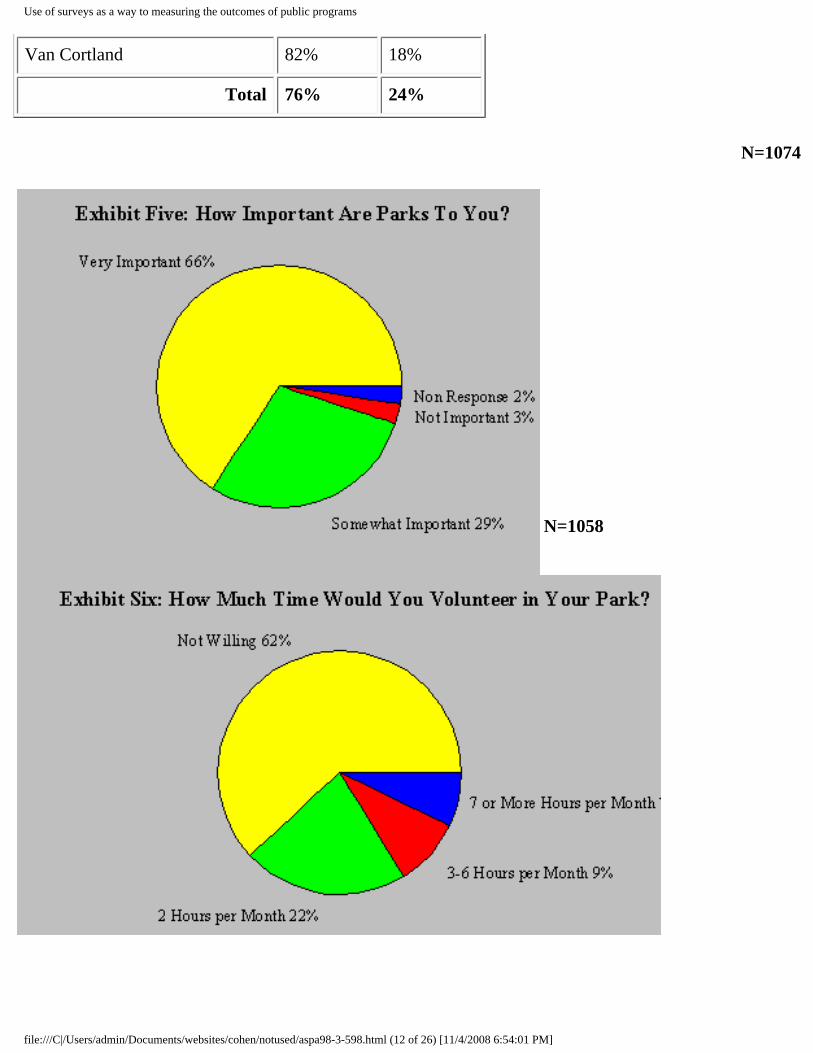
judged excellent or good by over 85% of the customers we surveyed. Only Jackie Robinson Park was perceived negatively by a majority of the respondents interviewed. Customer are satisfied with their parks in both high and low income neighborhoods. In parks abutting lower income census tracks, 71% rated their parks good or excellent. While this is slightly lower than the 79% positive rating given in higher income parks, we are stuck by the degree to which this positive rating of parks is universal throughout the city. We also sought to measure the importance of parks to users and the intensity of citizen interest. Exhibit 5 reports responses to the question: How important are parks to you? Approximately 66% termed parks very important, only 3.2% stated that parks were not important. The importance of parks cuts across income lines. About 2/3 of our respondents in parks surrounded by low income census tracks considered parks very important. A nearly identical percentage of people said the same thing in parks in areas of the city that are not poor. The meaning of "very important" may be unclear. A more meaningful question may be the one we asked about how much time a park user might be willing to volunteer to help improve the park. This requires a respondent to think of their own schedule and envision a commitment of time and work. Exhibit 6 reports the data drawn from this question. While 62% of those questioned were unwilling to contribute time to improve the park, over a third were willing to volunteer 2 hours per month. Approximately 6.6% of those interviewed said they were willing to contribute 7 or more hours to the park. These data are evidence of an extraordinary level of support for parks. Of those respondents who perceived the parks to be very important, 47% were willing (and 49% were unwilling) to contribute time to their park. This result is confirmed by the 1994 Commonwealth Fund random sample survey of New York City where 43% of those surveyed were or would consider joining a park support organization. Dimensions of Quality To better understand the factors that contribute to perceptions of park quality our interviewers asked park users to rate the importance of six factors related to parks quality and were encouraged to mention other factors as well. Exhibit 7 provides the data drawn from that set of questions. Cleanliness and safety were the most important factors, rated essential by approximately 90% of all those interviewed. The repair of facilities, bathrooms and drinking water were also considered very important by three quarters of those interviewed. Very few additional factors were mentioned, and
file:///C|/Users/admin/Documents/websites/cohen/notused/aspa98-3-598.html (9 of 26) [11/4/2008 6:54:01 PM]

Use of surveys as a way to measuring the outcomes of public programs
those that were tended to be closely related to the factors cited previously.
Exhibit Three: Park Ratings by Individual Park
Quality of This Park's Facilities
Excellent Good Fair Poor
Alley Pond 33% 54% 13% 0%
Central 50% 46% 2% 0%
Clove Lakes 51% 38% 9% 2%
Crotona 18% 56% 18% 7%
East River 37% 38% 13% 12%
Flushing Meadows Corona 5% 56% 19% 15%
Fort Tryon 30% 52% 15% 3%
Greenbelt 35% 39% 15% 10%
Jackie Robinson 6% 38% 42% 15%
Marine 39% 52% 6% 0%
Morningside 17% 42% 32% 8%
Owls Head/Shore Road 14% 60% 22% 3%
Pelham Bay 25% 51% 19% 6%
Prospect 29% 58% 14% 0%
Riverside 28% 37% 25% 5%
Springfield 7% 56% 34% 4%
St. Mary's 28% 55% 10% 7%
Sunset 18% 59% 20% 2%
Van Cortland 26% 56% 12% 6%
file:///C|/Users/admin/Documents/websites/cohen/notused/aspa98-3-598.html (10 of 26) [11/4/2008 6:54:01 PM]

Use of surveys as a way to measuring the outcomes of public programs
Total 26% 50% 18% 5%
N= 1074
Exhibit Four: Quality of This Park's Facilities
Quality of This Park's Facilities
Positive Negative
Alley Pond 87% 13%
Central 98% 2%
Clove Lakes 89% 11%
Crotona 75% 25%
East River 75% 25%
Flushing Meadows Corona 64% 36%
Fort Tryon 82% 18%
Greenbelt 75% 25%
Jackie Robinson 44% 56%
Marine 94% 6%
Morningside 59% 41%
Owls Head/Shore Road 74% 26%
Pelham Bay 76% 24%
Prospect 86% 24%
Riverside 68% 32%
Springfield 63% 37%
St. Mary's 83% 17%
Sunset 79% 21%
file:///C|/Users/admin/Documents/websites/cohen/notused/aspa98-3-598.html (11 of 26) [11/4/2008 6:54:01 PM]
Use of surveys as a way to measuring the outcomes of public programs
Van Cortland 82% 18%
Total 76% 24%
N=1074
N=1058
file:///C|/Users/admin/Documents/websites/cohen/notused/aspa98-3-598.html (12 of 26) [11/4/2008 6:54:01 PM]

Use of surveys as a way to measuring the outcomes of public programs
. N=1086
Another way of identifying perceptions of quality is to ask park users what they think should be done to improve the park. We asked an open-ended question on this issue and recorded the data reported in Exhibit 9. The data provide confirmation on the overriding importance of cleanliness and security as the key concerns of park users. Of those responding to this open-ended question, 31.9% sought enhanced park cleanliness. Perhaps in response to the city's declining crime rate, only 15.3% sought improved security. Other key areas cited for improvement include: play equipment, facilities (11.3%), restrooms, water fountains (6.2%), landscaping (5.7%), general maintenance (5.2%) and recreation programming (4%). As Exhibit 10 indicates, these concerns varied by park. Parks such as Central Park and Clove Lake elicited only minor expressions of concern from park users. Visitors to Staten Island's Greenbelt took the very un-New York perspective that there was little to dislike about the park and nothing really needed improvement. In contrast significant number of customers in East River, Ft. Tryon and Morningside parks cited the presence of drug users and dealers as the aspect of the park they most disliked. While each park is a unique public space, parks in all neighborhoods are valued by their users for similar things. At all 19 parks surveyed, significant numbers (more than 10%) of respondents noted that open space was what they most liked about their park. Sports facilities were highly valued at 15 parks. Park users also shared dislikes: in 17 parks, trash was mentioned by significant numbers of people as the park feature they most disliked.
Exhibit Seven: How Important Are The Following Factors to Park Quality?
% who answered "very important"
N=1,086
file:///C|/Users/admin/Documents/websites/cohen/notused/aspa98-3-598.html (13 of 26) [11/4/2008 6:54:01 PM]

Use of surveys as a way to measuring the outcomes of public programs
Exhibit Eight: Parks Quality Factors Considered Most Important
N=1,086
QUALITY DIMENSION
VERY IMPORTANT
SOMEWHAT IMPORTANT
NOT IMPORTANT
DON'T KNOW/
NO RESPONSE
CLEANLINESS 91.5% 6.4% 0.9% 1.2%
SAFETY 90.0 8.2 0.8 1.0
CLEAN/OPEN BATHROOMS
78.3 16.7 3.9 1.2
WORKING DRINKING FOUNTAINS
75.1 17.3 5.4 2.1
FACILITIES IN GOOD CONDITION
74.1 20.6 3.2 2.0
YOUTH PROGRAMS
68.0 23.9 6.4 1.7
file:///C|/Users/admin/Documents/websites/cohen/notused/aspa98-3-598.html (14 of 26) [11/4/2008 6:54:01 PM]

Use of surveys as a way to measuring the outcomes of public programs
Exhibit Nine: What Improvements Would You Like To See In Your Park?
N=822
EXHIBIT 10: A SUMMARY OF WHAT RESPONDENTS LIKED, DIDN'T LIKE & WOULD LIKE TO SEE IMPROVED IN 19 NYC PARKS
PARK LIKE DISLIKE IMPROVE
1.ALLEY POND
OPEN SPACE
CLEANLINESS
LANDSCAPING
SPORTS FACILITIES
TRASH
RESTROOMS/WATER FOUNTAINS
PLAY EQUIPMENT
SECURITY
CLEANLINESS
TELEPHONES.
file:///C|/Users/admin/Documents/websites/cohen/notused/aspa98-3-598.html (15 of 26) [11/4/2008 6:54:01 PM]

Use of surveys as a way to measuring the outcomes of public programs
2. CENTRAL OPEN SPACES
EVENTS
PEOPLE
SPORTS FACILITIES
PEOPLE
RESTROOMS/WATER FOUNTAINS
TRASH
TRAFFIC
RESTROOMS
SECURITY
3. CLOVE LAKES
OPEN SPACES
LANDSCAPING
TRASH
DIRTY LAKE
CLEANLINESS
CLEAN LAKE
4.CROTONA SPORTS FACILITIES
OPEN SPACES
TRASH
DIRTY LAKE
SECURITY
CLEANLINESS
SECURITY
CLEAN THE LAKE
5. EAST RIVER OPEN SPACES
SPORTS FACILITIES
PEOPLE
LANDSCAPING
PEOPLE
DRUG USERS
RESTROOM/WATER FOUNTAINS
HOMELESS PEOPLE
SECURITY
CLEANLINESS
LANDSCAPING
RESTROOMS/WATER FOUNTAINS
6. FLUSHING
MEADOW
OPEN SPACES
SPORTS FACILITIES
LANDSCAPING
TRASH CLEANLINESS
file:///C|/Users/admin/Documents/websites/cohen/notused/aspa98-3-598.html (16 of 26) [11/4/2008 6:54:01 PM]

Use of surveys as a way to measuring the outcomes of public programs
7. FT. TRYON OPEN SPACE
SPORTS FACILITIES
LANDSCAPING
PEOPLE
DRUG USERS
TRASH
SECURITY
CLEANLINESS
PROGRAMMING
8. GREENBELT
OPEN SPACE
LAKE
NOTHING MENTIONED BY MORE THAN 10%
9. JACKIE ROBINSON
SPORTS FACILITIES
OPEN SPACE
PEOPLE
TRASH
INSECTS/RODENTS
CLEANLINESS
SECURITY
PARK LIKE DISLIKE IMPROVE
10. MARINE PEOPLE
OPEN SPACE
SPORTS FACILITIES
RESTROOMS/WATER FOUNTAINS
TRASH
DOG CONTROL
BROKEN FACILITIES
PLAY EQUIPMENT CLEANLINESS
RESTROOMS/WATER FOUNTAINS
DOG CONTROL
SECURITY
11. MORNING- SIDE
OPEN SPACE
SPORTS FACILITIES
LANDSCAPING
TRASH
DRUG USERS
SECURITY
SECURITY
CLEANLINESS
MAINTENANCE
file:///C|/Users/admin/Documents/websites/cohen/notused/aspa98-3-598.html (17 of 26) [11/4/2008 6:54:01 PM]

Use of surveys as a way to measuring the outcomes of public programs
12. OWLS HEAD
SPORTS FACILITIES
OPEN SPACE
CLEANLINESS
TRASH CLEANLINESS
PLAY EQUIPMENT
SECURITY
13. PELHAM BAY
OPEN SPACES
SPORTS FACILITIES
TRASH
BROKEN FACILITIES
CLEANLINESS
PLAY EQUIPMENT
RESTROOMS/WATER FOUNTAINS
14. PROSPECT OPEN SPACE
LANDSCAPING
TRASH
SECURITY
CLEANLINESS
SECURITY
15. RIVERSIDE
SPORTS FACILITIES
OPEN SPACE
LANDSCAPING
PEOPLE
TRASH
PEOPLE
CLEANLINESS
SECURITY
PLAY EQUIPMENT
16. SPRINGFIELD
OPEN SPACES
LANDSCAPING
TRASH
LANDSCAPING
DIRTY LAKE
RESTROOMS/WATER FOUNTAINS
CLEANLINESS
PLAY EQUIPMENT
LANDSCAPING
file:///C|/Users/admin/Documents/websites/cohen/notused/aspa98-3-598.html (18 of 26) [11/4/2008 6:54:01 PM]

Use of surveys as a way to measuring the outcomes of public programs
17. ST. MARY'S OPEN SPACES
SPORTS FACILITIES
LANDSCAPING
TRASH
BROKEN FACILITIES
SECURITY
CLEANLINESS
SECURITY
PLAY EQUIPMENT
18. SUNSET SPORTS FACILITIES
OPEN SPACE
POOL/SPRINKLERS
LANDSCAPING
TRASH CLEANLINESS
SECURITY
PLAY EQUIPMENT
19. VAN CORTLANDT
OPEN SPACES
SPORTS FACILITIES
LANDSCAPING
TRASH
LANDSCAPING
BROKEN FACILITIES
CLEANLINESS
PLAY EQUIPMENT
MAINTENANCE LANDSCAPING
Park Utilization There is no regular study of park utilization in New York City, although a number of studies have attempted estimates. A 1991 study by the Citizens Budget Commission reported a number of utilization estimates based on a variety of previous studies.(3) In addition, a study of Riverside Park by Ukeles and Associates estimated the use of that park. Exhibit 11 reports these utilization estimates. Another way to look at park utilization is to see how often park goers use the parks. Exhibit 12 presents data on the frequency of park visits. Nearly 1/3 (30.9%) of our respondents visited the park every day. Since we conducted our survey on week days during the summer, we will make the assumption that people are referring to warmer weather months in this response. Nearly 60% (58.9%) visited the park more than once a week. New Yorkers are both turf-oriented and cosmopolitan. One third of those we surveyed (33.9%) visited other parks at least once a week. On the other
file:///C|/Users/admin/Documents/websites/cohen/notused/aspa98-3-598.html (19 of 26) [11/4/2008 6:54:01 PM]

Use of surveys as a way to measuring the outcomes of public programs
Exhibit 11
Park Utilization Estimates
Park Name Use Estimate Source YearCENTRAL PARK 14,200,000
(by 3,000,000 users)
WILLIAM KORNBLUM AND TERRY WILLIAMS
1982
VAN CORTLANDT PARK
763,000 ROLF MEYERSOHN 1986
PELHAM BAY 1,000,000 ROLF MEYERSOHN 1987PROSPECT PARK 4,370,000 ROLF MEYERSOHN 1987RIVERSIDE PARK 2,865,000 UKELES AND ASSOCIATES 1991 hand, about a quarter (23.2%) never went to any park other than the one they were in at the time of the interview. This utilization pattern is startling. One way to think about this data is the following: a person visiting a park in New York City during a weekday looks around and realizes that one out of every three people he/she sees will be back tomorrow, and nearly 60% will be back at least one more time during the week. No other data points out the central role that parks play in the daily lives of many New Yorkers.
EXHIBIT 12: FREQUENCY OF PARKS USE
FREQUENCY OF USE THIS PARK OTHER PARKS
EVERY DAY 30.9% 6.7%
SEVERAL TIMES A WEEK 28.0 14.3
ONCE A WEEK 18.1 14.3
OCCASIONALLY 21.9 41.1
NEVER NA 23.2
file:///C|/Users/admin/Documents/websites/cohen/notused/aspa98-3-598.html (20 of 26) [11/4/2008 6:54:01 PM]

Use of surveys as a way to measuring the outcomes of public programs
NO RESPONSE 1.1 1.8
N=1,086
Many of the studies of parks use asked questions about the type of activities that people pursue in parks. Our results are consistent with earlier studies by Ukeles and Associates and Meyersohn et. al. Exhibit 13 presents the responses to our survey question: What did you come to the park to do today? While, of course, many people came to do more than one thing, the pattern of response is clear: Most people come to the park to relax. The activities cited most frequently included:
Sit/read/sun/watch (22%);
Walking and observing (22%);and;
Getting together with friends and family (17%). While most people come to relax, a significant number are involved in active play. This included the following activities:
● Using a playground (13%)● Playing ball (12%)● Jogging (11%)● Riding a bike (7%)
Exhibit Thirteen: What Did You Come To The Park To Do Today?
N=1,085
file:///C|/Users/admin/Documents/websites/cohen/notused/aspa98-3-598.html (21 of 26) [11/4/2008 6:54:01 PM]

Use of surveys as a way to measuring the outcomes of public programs
IV CONCLUSIONS The output measures of park condition and cleanliness are indicators of a public service that is improving in quality. The outcome measures presented here provide a similar positive picture. One limit of this analysis is that we did not survey people who do not use the parks. It is possible that there is widespread avoidance and dissatisfaction with the parks, and if that were so the outcome measures provided in this study would not report that behavior. To learn about the views of people who do not use the parks we would need random sample of the population of the entire city, and its visitors. We opted for focusing our outcome analysis on those who use the parks, because we believed that they would have more fully formed views of the parks and more information about park quality. The definition of success for any public service is subjective. It is defined by policy and by management. Properly conceived outcome measures should also serve as measures of success. There are many aspects of success and definitions of success possible for any particular service. There are many ways to measure outcomes, and many types of outcomes worth measuring. If the definition of success for the parks in New York was to draw in non-users, then surveys of nonusers and first-time park users would be critical to measuring success. We would want to learn why people stay away from the parks and what attractes people to a park for the first time. If we chose to define success as the satisfaction or enjoyment of those in the park, then the outcome measures used in this study would suffice. While it is always possible to measure success utilizing multiple indicators and multiple units of analysis, each additional measure costs resources that might better be used improving the service in question. The data presented here provides a clear picture of a public satisfied with the quality of their parks, but desiring improvements as well. There is room for improvement and there are differences in
file:///C|/Users/admin/Documents/websites/cohen/notused/aspa98-3-598.html (22 of 26) [11/4/2008 6:54:01 PM]

Use of surveys as a way to measuring the outcomes of public programs
perceived quality across the city. Given the size, complexity and expense of New York's park system, we are impressed with the generally positive assessments of the system. The most striking outcome indicator was the degree to which the parks are utilized by those who frequent them. The fact that over 30% of the people we interviewed are in the city's parks every day, and nearly 60% visit the park at least twice a week, is evidence of the importance of parks to a significant segment of our population. Finally, how do agencies like New York's Parks Department utilize this data? In the case of this study, the Department learned several important lessons. First, public satisfaction was high throughout the city. Nevertheless, issues of cleanliness and security remain important in several parks in the city's poorer neighborhoods. As the Parks Department seeks to improve its level of quality, it is allocating additional resources for trash pick up, staff, and security patrols in these parks. The success of these efforts can only be determined by future application of the outcome measures used here.
APPENDIX: PARKS INTERVIEW QUESTIONNAIRE
1. NAME OF INTERVIEWER:_____________________2. NAME OF PARK: ____________________ 3. SECTION OF PARK: PLAYGROUND ____ MEADOW___ BALLFIELD___ OTHER __________ 4. DATE OF INTERVIEW__________________ 5. TIME _____________ 6. CHARACTERISTICS OF THE PERSON YOU ARE INTERVIEWING:
A. GENDER: MALE _____ FEMALE ______
B. AGE: 16-21___ 22-30_____ 31-40_____ 41-60_____ OVER 60____
C. WHERE DO YOU LIVE: NEW YORK CITY?
YES____ IF YES: WHAT BOROUGH
BRKLYN ___ BRONX___ MAN___ QUEENS___ SI____
NO ____ IF NO: WHERE?
NYC SUBURBS___ OTHER USA ____ OUTSIDE USA_____ 7. HOW OFTEN DO YOU GO TO THIS PARK?
file:///C|/Users/admin/Documents/websites/cohen/notused/aspa98-3-598.html (23 of 26) [11/4/2008 6:54:01 PM]

Use of surveys as a way to measuring the outcomes of public programs
EVERY DAY____ SEVERAL TIMES A WEEK ____
ABOUT ONCE A WEEK ____ OCCASIONALLY____ 8. HOW OFTEN DO YOU GO TO OTHER PARKS?
EVERY DAY____ SEVERAL TIMES A WEEK____
ABOUT ONCE A WEEK____ OCCASIONALLY____ NEVER____ 9. WHAT DID YOU COME TO THIS PARK TO DO TODAY?
USE PLAYGROUND ____ PLAY TENNIS ___
PLAY BALL ___ BIKE ___
JOG ___ ROLLERBLADE___
BE WITH FRIENDS/FAMILY___ WALK___
PICNIC___ SIT/READ/SUN/WATCH___
OTHER_______________________ 10. HOW DO YOU RATE THE QUALITY OF THIS PARK'S FACILITIES FOR WHAT YOU ARE DOING HERE TODAY? EXCELLENT___ GOOD___ FAIR___ POOR___ 11. THINKING ABOUT THIS PARK, WHAT DO YOU LIKE THE MOST ABOUT IT?
12. WHAT DO YOU LIKE THE LEAST ABOUT IT?
file:///C|/Users/admin/Documents/websites/cohen/notused/aspa98-3-598.html (24 of 26) [11/4/2008 6:54:01 PM]

Use of surveys as a way to measuring the outcomes of public programs
13. WHAT SHOULD BE DONE TO IMPROVE THIS PARK?
14. WOULD YOU BE WILLING TO CONTRIBUTE YOUR TIME TO HELPING TO IMPROVE THIS PARK?
YES ____ NO____
(IF YES, ASK THE QUESTION BELOW)
HOW MUCH TIME WOULD YOU BE WILLING TO CONTRIBUTE?
2 HRS PER MONTH____ 3-6 HRS PER MONTH____ 7 OR MORE____ 15. I AM GOING TO SHOW YOU SEVERAL FACTORS RELATING TO PARKS QUALITY. PLEASE TELL ME HOW IMPORTANT THESE ARE TO YOU. FACTOR VERY SOMEWHAT NOT IMPORTANT IMPORTANT IMPORTANT
A. CLEANLINESS
B. SAFETY
C. PLAYGROUND AND SPORTS FACILITIES IN GOOD CONDITION
file:///C|/Users/admin/Documents/websites/cohen/notused/aspa98-3-598.html (25 of 26) [11/4/2008 6:54:01 PM]

Use of surveys as a way to measuring the outcomes of public programs
D. BATHROOMS OPEN AND CLEAN
E. WORKING DRINKING FOUNTAIN
F. PROGRAMS FOR YOUNG PEOPLE
G. OTHER FACTOR:
H.
I.
16. HOW IMPORTANT ARE PARKS TO YOU?
VERY IMPORTANT____ SOMEWHAT IMPORTANT____ NOT IMPORTANT___ 17. ARE THERE ANY OTHER COMMENTS YOU WOULD LIKE TO MAKE?
1. 0 Ibid.
2. 0New Yorkers Say that Upgrading Parks is Essential to the Quality of Life." The Commonwealth Fund, January, 1994.
3. 0 Charles Brecher and Dean Michael Mead, Managing the Department of Parks and Recreation in a Period of Fiscal Stress, Citizens Budget Commission, New York. 1991.
Back to Personal Homepage
SIPA Directory
Columbia University Home Page SIPA Web Manager
file:///C|/Users/admin/Documents/websites/cohen/notused/aspa98-3-598.html (26 of 26) [11/4/2008 6:54:01 PM]