Embed Size (px)
Citation preview
BEHAVIORAL HAZARD IN HEALTH INSURANCE*
Katherine BaickerSendhil MullainathanJoshua Schwartzstein
A fundamental implication of standard moral hazard models is overuse oflow-value medical care because copays are lower than costs. In these models,the demand curve alone can be used to make welfare statements, a fact reliedon by much empirical work. There is ample evidence, though, that peoplemisuse care for a different reason: mistakes, or ‘‘behavioral hazard.’’ Muchhigh-value care is underused even when patient costs are low, and some uselesscare is bought even when patients face the full cost. In the presence of behav-ioral hazard, welfare calculations using only the demand curve can be off byorders of magnitude or even be the wrong sign. We derive optimal copay for-mulas that incorporate both moral and behavioral hazard, providing a theoret-ical foundation for value-based insurance design and a way to interpretbehavioral ‘‘nudges.’’ Once behavioral hazard is taken into account, health in-surance can do more than just provide financial protection—it can also improvehealth care efficiency. JEL Codes: D03, I12, I13, I30, I38.
I. Introduction
Moral hazard is central to how we understand health insur-ance. Because the insured pay less for health care than it costs,they may overuse it (Arrow 1963; Pauly 1968; Zeckhauser 1970;Cutler and Zeckhauser 2000). In the standard moral hazardmodel, the demand curve alone is enough to quantify the ineffi-ciency generated by insurance. We can draw welfare conclusionsabout changes in copays without measuring changes in health: ifpeople optimize, health benefits equal copays at the margin. Alarge body of empirical work relies on this ‘‘sufficient statistic’’property to make welfare calculations and policy recommenda-tions, equating evidence of moral hazard with evidence of theprice sensitivity of demand for medical care (Feldstein 1973;
*We thank Dan Benjamin, David Cutler, John Friedman, Drew Fudenberg,Ben Handel, Ted O’Donoghue, Matthew Rabin, Jesse Shapiro, Andrei Shleifer,Jonathan Skinner, Chris Snyder, Douglas Staiger, Neil Thakral Glen Weyl, HeidiWilliams, Danny Yagan, and the anonymous referees for helpful comments.Baicker thanks National Institute on Aging (NIA), Grant Number P30-AG012810 and Schwartzstein thanks NIA, Grant Number T32-AG000186 forfinancial support. This work was largely completed while Schwartzstein was afaculty member in the Economics Department at Dartmouth, and he is gratefulfor the years of support.
! The Author(s) 2015. Published by Oxford University Press, on behalf of Presidentand Fellows of Harvard College. All rights reserved. For Permissions, please email:[email protected] Quarterly Journal of Economics (2015), 1623–1667. doi:10.1093/qje/qjv029.Advance Access publication on July 15, 2015.
1623
Manning et al. 1987; Newhouse 1993; see Finkelstein 2014 for areview). Yet when it comes to health care choices, people may failto optimize so perfectly. This article develops a richer model ofhealth insurance that allows people to make mistakes andimplies that relying on demand data alone can lead to highlymisleading welfare calculations.
Many patterns of health care use are hard to reconcile with aworld in which moral hazard alone drives misutilization. Manypatients underuse care with health benefits that substantiallyexceed costs (even accounting for possible side effects or othernonmonetary costs).1 Diabetes medications, for example, increaselife span, reduce the risk of limb loss or blindness, and improvequality of life, but estimates of adherence are usually under 70percent (DiMatteo 2004). There is similarly low adherence formedications that help manage other chronic conditions and fortreatments such as prenatal and post-transplant care (Osterbergand Blaschke 2005; van Dulmen et al. 2007). Nor does moralhazard explain all overutilization: patients sometimes demandcare that does not benefit them—or may even be harmful(Schwartz et al. 2014). For example, patients seek antibioticswith clear risks and unclear benefits for ear infections (Spiroet al. 2006). It is hard to explain this kind of overuse solely byprivate benefits exceeding private costs.
This evidence is consistent with a simple narrative. Peoplemisuse care not just because the price is below the social marginalcost, but also because they make mistakes. We call this kind ofmisutilization behavioral hazard. Many psychologies can contrib-ute to behavioral hazard. People may overweight salient symp-toms (Bordalo, Gennaioli, and Shleifer 2012, 2013) such as backpain or underweight nonsalient ones such as high blood pressureor high blood sugar (Osterberg and Blaschke 2005). They may be
1. In principle, it is possible to argue that unobserved costs of care, such as sideeffects, drive what seems to be underuse. However, in practice, this argument isdifficult to make for many of the examples we review. The underuse we focus on isvery different from the underuse that can arise in dynamic moral hazard models. Insuch models, patients may underuse preventive care that generates monetary sav-ings for the insurer (Goldman and Philipson 2007; Ellis and Manning 2007). Here,we focus on the underuse of care whose benefits outweigh costs to the consumer. Forexample, though the underuse of diabetes medications does generate future healthcare costs, the uninsurable private costs to the patient alone (e.g., higher mortalityand blindness) make nonadherence likely to be a bad choice even if she is fullyinsured against future health care costs. We also abstract from underuse due tohealth externalities (e.g., the effect of vaccination on the spread of disease).
QUARTERLY JOURNAL OF ECONOMICS1624
present-biased (Laibson 1997; O’Donoghue and Rabin 1999) andoverweight the immediate costs of care, such as copays and hasslecosts of setting up appointments or filling prescriptions(Newhouse 2006). They may simply forget to take their medica-tions or refill their prescriptions. Or they may have false beliefsabout the efficacy of care (Pauly and Blavin 2008). Section IIbuilds on Mullainathan, Schwartzstein, and Congdon (2012) byintroducing a model of behavioral hazard that nests such biases,as well as others within a broad class.
Behavioral hazard means that welfare calculations can nolonger be made from demand data alone. Consider the ‘‘marginal’’insurees—those who respond to a copay change. In the standardmodel, these consumers are trading off health benefits against thecopay. Because they are optimizing, their indifference means thesebenefits equal the copay.2 But Section III shows that with behav-ioral hazard, this inference fails when insurees misvalue care. Forexample, we would not want to conclude falsely that diabetes med-ications are ineffective because a modest copay reduces adherence(e.g., based on Goldman et al.’s 2004 estimates), or that breastcancer patients place little value on conserving breast tissue be-cause a modest copay induces them to switch from equally effectivebreast-conserving lumpectomy to breast-removing mastectomy(e.g., based on Einav, Finkelstein, and Williams’s 2015 estimates).3
Behavioral hazard means that agents can be marginal in theirchoices even when health benefits far exceed the copay.
This is more than an abstract concern. First, we show thatlow-value and high-value care have surprisingly similar priceelasticities. Second, we reexamine the results of a large-scalefield experiment that eliminated some drug copays for recentheart attack victims and found large increases in drug use(Choudhry et al. 2011). Looking only at this demand responsewould suggest significant moral hazard and overuse of low-value
2. Technically, we can only equate the marginal private utility benefit with thecopay, but presumably much of this benefit derives from the health effects.
3. The standard revealed preference assumption used by Einav, Finkelstein,and Williams (2015) effectively assumes that the demand curve reveals the distri-bution of patients’ relative valuation for having a lumpectomy over a mastectomy.There is some suggestive evidence that challenges this assumption, for examplethat providing decision aids to inform breast cancer patients about the relevanttrade-offs increases demand for the less invasive option (Waljee, Rogers, andAlderman 2007). One possibility is that patients may start from a false belief thatthe more invasive procedure is more effective at preventing cancer relapses.
BEHAVIORAL HAZARD IN HEALTH INSURANCE 1625
drugs. But there were also substantial reductions in mortalityand improvements in health. While traditional analysis wouldimply that eliminating drug copays led to a welfare cost, takingbehavioral hazard into account implies a much larger welfaregain.
The fact that the demand curve is not a sufficient statistic alsohas implications for the optimal design of insurance. We show inSection IV that the optimal copay formula now depends on bothdemand and health responses.4 This provides a formal foundationfor ‘‘value-based insurance design’’ with lower cost-sharing forhigher value care (Chernew, Rosen, and Fendrick 2007; Liebmanand Zeckhauser 2008; Chandra, Gruber, and McKnight 2010). Ourmodel nests a more specific result of Pauly and Blavin (2008) thatapplies to the case of uninformed consumers. Perhaps surpris-ingly, we show that the health value of treatment should betaken into account even when behavioral hazard is unsystematicand averages to zero across the population, so long as it is variable.Once behavioral hazard is taken into account, health insurancedoes not just provide financial protection: it can also create incen-tives for more efficient treatment decisions.
Factoring in behavioral hazard can have a large effect. InSection V we compare the optimal copay when behavioralhazard is incorporated to that produced by the neoclassicalmodel when it is not. The neoclassical model underestimatesthe optimal copay whenever behavioral hazard systematicallydrives people to overuse, and overestimates the optimal copaywhenever behavioral hazard systematically drives people tounderuse.5 In fact, we show that when behavioral hazard is ex-treme, the situations in which a neoclassical model generatesparticularly low copays are precisely those in which copaysshould be particularly high, and vice versa.
4. Spinnewijn (2014) analyzes the optimal design of unemployment insurancewhen job-seekers have biased beliefs and similarly predicts that policies imple-menting standard sufficient statistics formulas become suboptimal when agentsmake errors.
5. The idea that the optimal copay is below the neoclassical optimal copaywhen behavioral hazard drives systematic underuse parallels findings on self-commitment devices for present-biased agents. For example, DellaVigna andMalmendier (2004) show that sophisticated present-biased agents value gym mem-berships that reduce the price of going to the gym below the social marginal cost,since this reduction counteracts internalities that result from the overweighting ofimmediate costs relative to long-term benefits.
QUARTERLY JOURNAL OF ECONOMICS1626
In addition to changing the calculus around optimal copays,our framework also has implications for the optimal use of nudges(such as defaults and reminders; Thaler and Sunstein 2009) tomitigate misuse or to calibrate the degree of behavioral hazard.Section VI discusses this as well as other extensions of the basicanalysis, including how we might estimate the degree of behav-ioral hazard when health responses are difficult to measure andwhat we might expect the market to deliver in equilibrium.Although we focus on the patient side, clearly physicians alsoplay an important role in determining the care that is ultimatelyreceived. We briefly discuss areas where combining patient andphysician behavior into one framework could be fruitful (see alsoFrank 2004). Section VII concludes with a discussion of directionsfor future work.
II. A Model of Behavioral and Moral Hazard
II.A. Moral Hazard
We begin with a stylized model of health insurance. Consideran individual with wealth y. Insurance has price, or premium, P.When healthy, she has utility Uðy" PÞ if she buys insurance.With probability q 2 ð0; 1Þ, she can fall sick with a specific condi-tion with a varying degree of severity s that is her private infor-mation. For example, individuals may be afflicted with diabetesthat varies in how much it debilitates. Assume s $ FðsÞwhen sick,where F has support on S ¼ ½s; s' ( Rþ and s < s. Assume furtherthat F(s) has strictly positive density f(s) on S. Severity is mea-sured in monetary terms so that the sick agent receives utility Uðy" P" sÞ absent treatment.
Treatment can lessen the impact of the disease. Treatmentcosts society c, and its benefit bðs; !Þ depends on severity, where! 2 R is a parameter that allows for heterogeneity across peoplein treatment benefits conditional on disease severity, and is alsoprivate information.6 The more severe the disease, the greaterthe benefits: bs > 0: We assume bð0; !Þ ¼ 0 for all ! (the
6. As is standard in the literature, we implicitly assume that consumers wouldface the social marginal cost of treatment without insurance, which abstracts fromanother rationale for why insurance coverage can be welfare-improving even forrisk-neutral consumers: when treatment suppliers have market power, subsidizingtreatment can bring copays closer to the social marginal cost of care (Lakdawallaand Sood 2009).
BEHAVIORAL HAZARD IN HEALTH INSURANCE 1627
unaffected get no benefit) and bs * 1 (the treatment cannot makepeople better off than not having the disease). The benefits areput in monetary terms. It is efficient for some but not all of thesick to get treated: bðs; !Þ < c < bðs; !Þ for all !. We assume thatthe insured individual pays price or copay p for treatment.Although the copay implicitly depends on the disease and treat-ment, it is independent of s and !; we assume that both diseaseseverity and treatment benefits cannot be contracted over be-cause the insurer cannot perfectly measure them. The interpre-tation is that the copay is conditional on all information known tothe insurer, but the individual may have some residual privateinformation.7 In this way, we nest the traditional moral hazardmodel. An insured individual who receives treatment for his dis-ease gets utility Uðy" P" sþ bðs; !Þ " pÞ.
We evaluate insurance contracts from the perspective of abenevolent social planner ranking contracts based on social wel-fare.8 Welfare as a function of the copay and the premium equalsexpected utility:
Wðp;PÞ ¼ ð1" qÞUðy" PÞ þ qE½Uðy" P" sþmðpÞðb" pÞÞjsick';ð1Þ
where mðpÞ 2 0; 1f g represents an individual’s demand for careat a given price and equals 1 if and only if the person demandstreatment. The first term is the utility if individuals do not getsick with a specific condition: they simply pay the premium.The second term is the utility if they do get sick: the expectedutility (depending on disease severity and other stochastic pa-rameters, described in more detail below) that includes the lossdue to being sick (–s) as well as the benefits of care net of coststo individuals ðb" pÞ for the times they choose to use care(m(p) = 1). We assume that insurance must be self-funding:P ¼ PðpÞ ¼MðpÞðc" pÞ, where MðpÞ ¼ E½mðpÞ' equals the percapita aggregate demand at a given copay. As a result, we
7. We focus on a single specific condition for presentational simplicity, but theanalysis is qualitatively similar if the person can fall sick with different conditionsand the specific condition she falls sick with is observable and verifiable to theinsurer, so the insurer can set different copays across conditions.
8. See, for example, Bernheim and Rangel (2009) for a discussion of a choice-based approach to recovering consistent welfare functions from inconsistent choicebehavior.
QUARTERLY JOURNAL OF ECONOMICS1628

can rewrite welfare solely as a function of the copay: with someabuse of notation, WðpÞ + Wðp;PðpÞÞ.
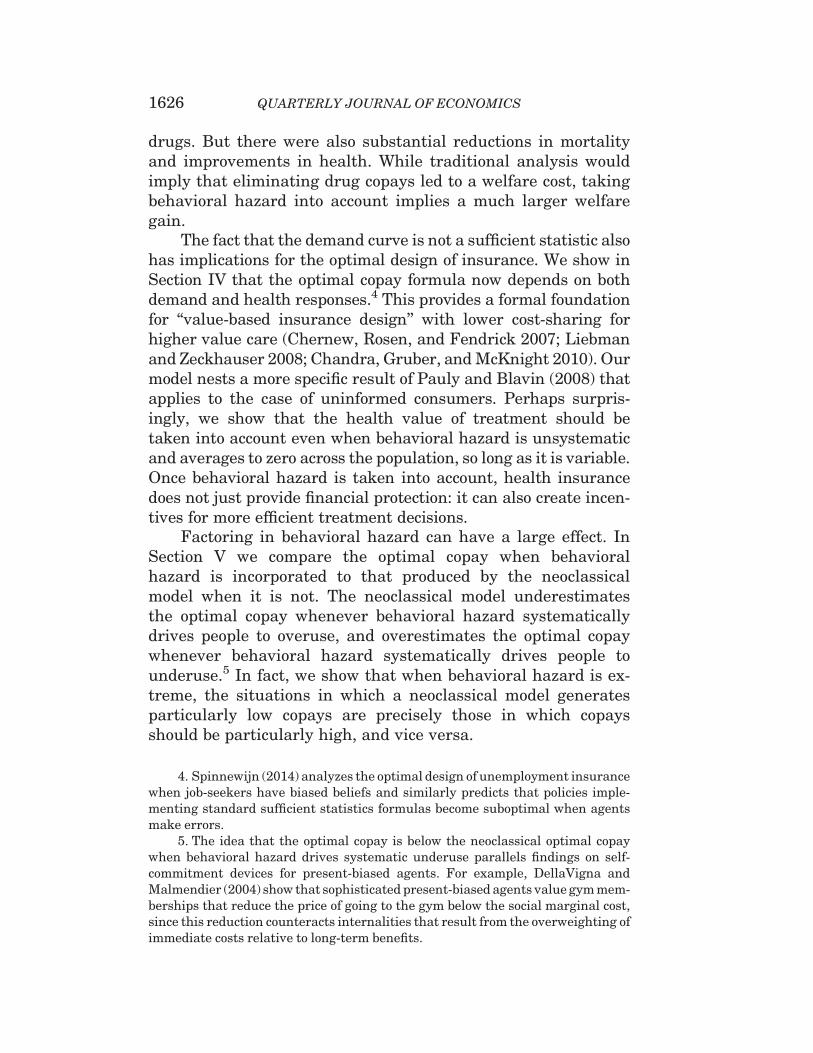
In this simple setup, the choice to receive treatment wheninsured is easy: the rational person gets treated whenever bene-fits exceed price, or b>p. This decision is the source of moralhazard. While the insurance value in insurance comes from set-ting price below true cost, or p< c, this subsidized price meansthat although individuals should efficiently get treated wheneverb> c (benefits exceed social costs), they get treated wheneverb>p (benefits exceed private costs), generating inefficient utili-zation when c> b>p. Figure I provides an illustration, whereindividuals are arrayed on the line according to treatment bene-fits. Those to the right of the cost c should receive treatment anddo so. Those to the left of the price p should not receive treatmentand do not. The middle region represents the problem: those in-dividuals should not receive treatment but they do. The pricesubsidy inherent to insurance is the source of misutilization:Raising the price individuals face would diminish overutilization,but come at the cost of diminished insurance value.9
II.B. Behavioral Hazard
There is, however, ample evidence of misutilization that isdifficult to interpret as a rational person’s response to subsidizedprices. We incorporate behavioral hazard through a simple mod-ification of the original model. Instead of deciding by comparingtrue benefits to copays, evaluating whether bðs; !Þ > p, peoplechoose according to whether bðs; !Þ þ "ðs; "Þ > p; where " is posi-tive in the case of positive behavioral hazard (for example, seek-ing an ineffective treatment for back pain) and negative in thecase of negative behavioral hazard (for example, not adhering toeffective diabetes treatment). The parameter " 2 R allows for het-erogeneity across people in the degree of behavioral hazard and isnot observable to the insurer. We assume that bðs; !Þ þ "ðs; "Þ isdifferentiable and strictly increasing in s for all ð!; "Þ. The
9. For simplicity, we are assuming away income effects or issues of affordabil-ity. In a standard framework, insurance could lead to more efficient decisions inso-far as it makes high-value, high-cost procedures affordable to consumers (Nyman1999). However, in this framework, insurance cannot lead consumers to make moreefficient decisions on the margin. Abstracting from income effects serves to high-light this well-known fact (Zeckhauser 1970). Also, many of the examples we focuson involve low-cost treatments, such as prescription drugs, where any income ef-fects are likely to be small.
BEHAVIORAL HAZARD IN HEALTH INSURANCE 1629
parameters ð!; "Þ are distributed independently from s, accordingto joint distribution Gð!; "Þ. We let Qðs; !; "Þ ¼ FðsÞGð!; "Þ denotethe joint distribution of all the possibly stochastic parameters. Allexpectations are taken with respect to this distribution unlessotherwise noted. When U is nonlinear, it will be useful to considera ‘‘normalized’’ version of the behavioral error,
"0ðs; "Þ ¼ Uðy" P" sÞ "Uðy" P" s" "ðs; "ÞÞE½U 0ðCÞ' ;
which essentially puts " in utility units, where C stands forconsumption. (Note that " ¼ "0 for linear U, so we have the ap-proximation "&"0 if we take U to be approximately linear).
This formulation builds on Mullainathan, Schwartzstein,and Congdon (2012) and implicitly captures a divide betweenpreference as revealed by choice and utility as it is experienced,or between ‘‘decision utility’’ and ‘‘experienced utility’’(Kahneman, Wakker, and Sarin 1997). In our framework, b – paffects the experienced utility of taking the action. Individualsinstead choose as if bþ "" p affects this utility.
This framework nests behavioral models where people mis-behave because of mistakes. What it is not designed to captureare models of nonstandard preferences. For example, anticipationand anxiety may alter how individuals experience benefits(Koszegi 2003): benefits will vary depending on whether takingthe action (such as getting an HIV test) leads to anxiety in antic-ipating the outcome. In these kinds of situations, the behavioralfactor may not be a bias affecting " but a force that affects themapping between outcomes (such as getting a diagnostic test) andbenefits b.
FIGURE I
Model with Only Moral Hazard
QUARTERLY JOURNAL OF ECONOMICS1630
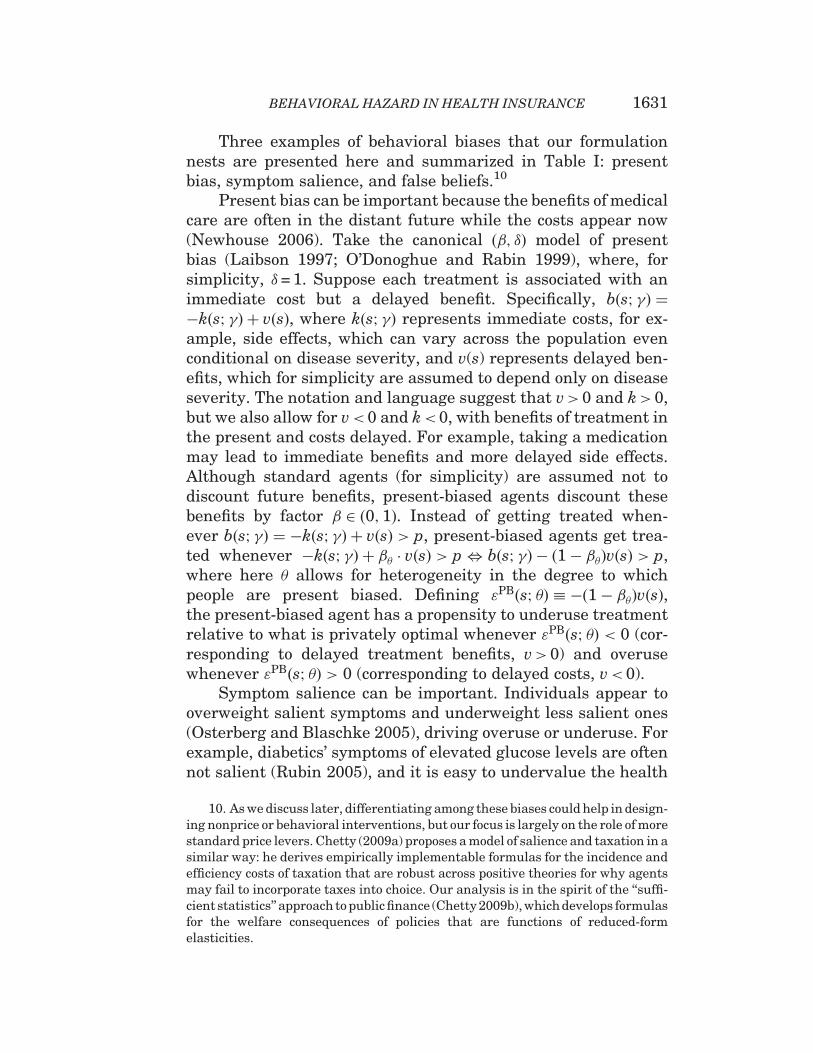
Three examples of behavioral biases that our formulationnests are presented here and summarized in Table I: presentbias, symptom salience, and false beliefs.10
Present bias can be important because the benefits of medicalcare are often in the distant future while the costs appear now(Newhouse 2006). Take the canonical ð#; $Þ model of presentbias (Laibson 1997; O’Donoghue and Rabin 1999), where, forsimplicity, $= 1. Suppose each treatment is associated with animmediate cost but a delayed benefit. Specifically, bðs; !Þ ¼"kðs; !Þ þ vðsÞ, where kðs; !Þ represents immediate costs, for ex-ample, side effects, which can vary across the population evenconditional on disease severity, and v(s) represents delayed ben-efits, which for simplicity are assumed to depend only on diseaseseverity. The notation and language suggest that v> 0 and k> 0,but we also allow for v< 0 and k<0, with benefits of treatment inthe present and costs delayed. For example, taking a medicationmay lead to immediate benefits and more delayed side effects.Although standard agents (for simplicity) are assumed not todiscount future benefits, present-biased agents discount thesebenefits by factor # 2 ð0; 1Þ. Instead of getting treated when-ever bðs; !Þ ¼ "kðs; !Þ þ vðsÞ > p, present-biased agents get trea-ted whenever "kðs; !Þ þ #" , vðsÞ > p, bðs; !Þ " ð1" #"ÞvðsÞ > p,where here " allows for heterogeneity in the degree to whichpeople are present biased. Defining "PBðs; "Þ + "ð1" #"ÞvðsÞ,the present-biased agent has a propensity to underuse treatmentrelative to what is privately optimal whenever "PBðs; "Þ < 0 (cor-responding to delayed treatment benefits, v> 0) and overusewhenever "PBðs; "Þ > 0 (corresponding to delayed costs, v< 0).
Symptom salience can be important. Individuals appear tooverweight salient symptoms and underweight less salient ones(Osterberg and Blaschke 2005), driving overuse or underuse. Forexample, diabetics’ symptoms of elevated glucose levels are oftennot salient (Rubin 2005), and it is easy to undervalue the health
10. As we discuss later, differentiating among these biases could help in design-ing nonprice or behavioral interventions, but our focus is largely on the role of morestandard price levers. Chetty (2009a) proposes a model of salience and taxation in asimilar way: he derives empirically implementable formulas for the incidence andefficiency costs of taxation that are robust across positive theories for why agentsmay fail to incorporate taxes into choice. Our analysis is in the spirit of the ‘‘suffi-cient statistics’’ approach to public finance (Chetty 2009b), which develops formulasfor the welfare consequences of policies that are functions of reduced-formelasticities.
BEHAVIORAL HAZARD IN HEALTH INSURANCE 1631
benefits of taking a pill whose effects cumulate slowly over time.Patients at the symptomatic stages of HIV/AIDS are more likelyto be adherent to their treatment regimens than are patients atthe asymptomatic stage (Gao et al. 2000). Most tuberculosis treat-ment regimens are at least six months long, but effective therapyleads to improved symptoms after the first four weeks and thereis a concurrent drop-off in adherence. Pain, on the other hand, isclearly highly salient, and patients may overweight the currentpain and seek expensive treatments with potential adverse ef-fects in the future. Stories in the popular press highlight therole of symptom salience: a recent report noted the death of anuninsured patient with a tooth infection who was prescribed anantibiotic and a painkiller and who spent his limited resources tofill the painkiller prescription rather than the potentially life-saving antibiotic (Gann 2011).
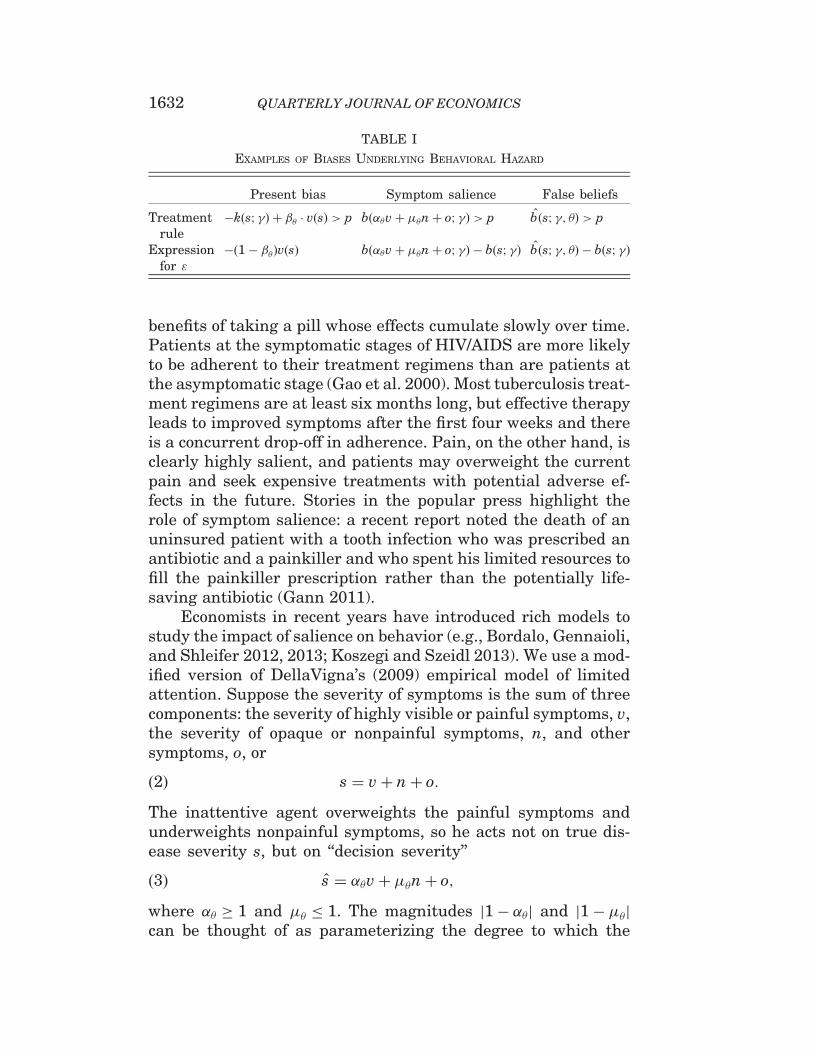
Economists in recent years have introduced rich models tostudy the impact of salience on behavior (e.g., Bordalo, Gennaioli,and Shleifer 2012, 2013; Koszegi and Szeidl 2013). We use a mod-ified version of DellaVigna’s (2009) empirical model of limitedattention. Suppose the severity of symptoms is the sum of threecomponents: the severity of highly visible or painful symptoms, v,the severity of opaque or nonpainful symptoms, n, and othersymptoms, o, or
s ¼ vþ nþ o:ð2Þ
The inattentive agent overweights the painful symptoms andunderweights nonpainful symptoms, so he acts not on true dis-ease severity s, but on ‘‘decision severity’’
s ¼ %"vþ &"nþ o;ð3Þ
where %" - 1 and &" * 1. The magnitudes j1" %"j and j1" &"jcan be thought of as parameterizing the degree to which the
TABLE I
EXAMPLES OF BIASES UNDERLYING BEHAVIORAL HAZARD
Present bias Symptom salience False beliefs
Treatmentrule
"kðs; !Þ þ #" , vðsÞ > p bð%"vþ &"nþ o; !Þ > p bðs; !; "Þ > p
Expressionfor "
"ð1" #"ÞvðsÞ bð%"vþ &"nþ o; !Þ " bðs; !Þ bðs; !; "Þ " bðs; !Þ
QUARTERLY JOURNAL OF ECONOMICS1632
agent misbehaves due to symptom salience, where he acts ac-cording to the standard model when %" ¼ &" ¼ 1. The persongets treated if
bð%"vþ&"nþo;!Þ>p, bðs;!Þþ ½bð%"vþ&"nþo;!Þ"bðvþnþo;!Þ'>p:
ð4Þ
Defining "SSðs;"Þ¼ bð%"vþ&"nþo;!Þ"bðvþnþo;!Þ, where weassume the right-hand side is constant in !, the person has apropensity to underuse treatment relative to what is privatelyoptimal whenever "SSðs;"Þ< 0, where nonpainful symptoms
are sufficiently prominent (i.e., n> vð%""1Þ1"&"
for &" 6¼1), and has a
propensity to overuse treatment relative to what is privatelyoptimal whenever "SSðs;"Þ> 0, where painful symptoms are suf-
ficiently prominent (i.e., v> nð1"&"Þ%""1 for %" 6¼1).
False beliefs can also play a role (e.g., Pauly and Blavin2008).11 Tuberculosis patients may stop taking their antibioticshalfway through their drug regimen not just because salientsymptoms have abated but also because they believe the diseasehas disappeared. People may falsely attribute treatment benefitsas well, such as when they buy an herbal medicine with no knownefficacy.12 Instead of getting treated when bðs; !Þ > p, agentswith false beliefs get treated when bðs; !; "Þ > p, bðs; !Þþ½bðs; !; "Þ " bðs; !Þ' > p, where b is the decision benefit to gettingtreated. Defining "FBðs; "Þ ¼ bðs; !; "Þ " bðs; !Þ, which for simplic-ity we assume is constant in !, the person with false beliefs has apropensity to underuse treatment whenever "FBðs; "Þ < 0, wherethey undervalue treatment (bðs; !; "Þ < bðs; !Þ), and has a propen-sity to overuse treatment whenever "FBðs; "Þ > 0, where theyovervalue treatment (bðs; !; "Þ > bðs; !Þ).
11. False beliefs may result from a variety of factors. Patients may have incom-plete information; they may have faulty mental models; they may not interpretevidence as Bayesians; they may be inattentive to available evidence. SectionVI.A highlights ways that distinguishing between such factors can be helpful,though we suspect that often a combination of factors are at play.
12. Estimates suggest that the majority of antibiotics prescribed for adult re-spiratory infections were for conditions where an antibiotic would not be helpful,such as for a viral infection (Gonzales et al. 2001)—although, as discussed later, thismay be attributable to a combination of patient and physician psychology.
BEHAVIORAL HAZARD IN HEALTH INSURANCE 1633
II.C. Misutilization with Behavioral Hazard
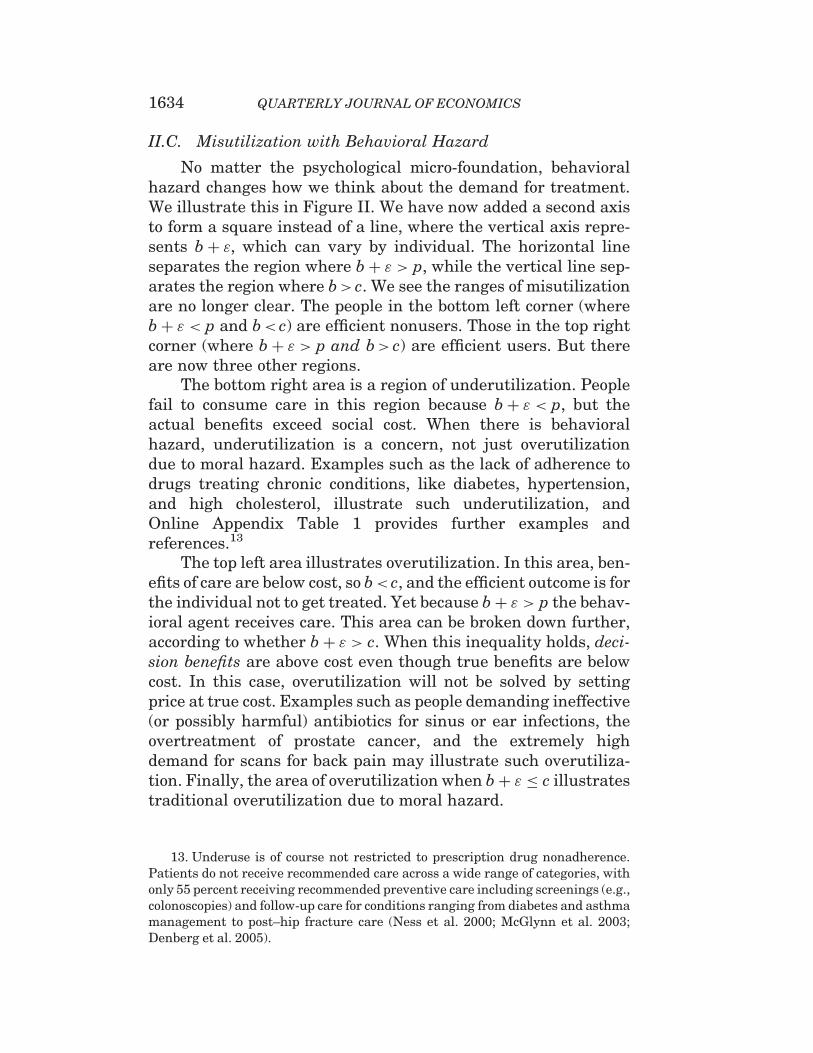
No matter the psychological micro-foundation, behavioralhazard changes how we think about the demand for treatment.We illustrate this in Figure II. We have now added a second axisto form a square instead of a line, where the vertical axis repre-sents bþ ", which can vary by individual. The horizontal lineseparates the region where bþ " > p, while the vertical line sep-arates the region where b> c. We see the ranges of misutilizationare no longer clear. The people in the bottom left corner (wherebþ " < p and b< c) are efficient nonusers. Those in the top rightcorner (where bþ " > p and b> c) are efficient users. But thereare now three other regions.
The bottom right area is a region of underutilization. Peoplefail to consume care in this region because bþ " < p, but theactual benefits exceed social cost. When there is behavioralhazard, underutilization is a concern, not just overutilizationdue to moral hazard. Examples such as the lack of adherence todrugs treating chronic conditions, like diabetes, hypertension,and high cholesterol, illustrate such underutilization, andOnline Appendix Table 1 provides further examples andreferences.13
The top left area illustrates overutilization. In this area, ben-efits of care are below cost, so b< c, and the efficient outcome is forthe individual not to get treated. Yet because bþ " > p the behav-ioral agent receives care. This area can be broken down further,according to whether bþ " > c. When this inequality holds, deci-sion benefits are above cost even though true benefits are belowcost. In this case, overutilization will not be solved by settingprice at true cost. Examples such as people demanding ineffective(or possibly harmful) antibiotics for sinus or ear infections, theovertreatment of prostate cancer, and the extremely highdemand for scans for back pain may illustrate such overutiliza-tion. Finally, the area of overutilization when bþ " * c illustratestraditional overutilization due to moral hazard.
13. Underuse is of course not restricted to prescription drug nonadherence.Patients do not receive recommended care across a wide range of categories, withonly 55 percent receiving recommended preventive care including screenings (e.g.,colonoscopies) and follow-up care for conditions ranging from diabetes and asthmamanagement to post–hip fracture care (Ness et al. 2000; McGlynn et al. 2003;Denberg et al. 2005).
QUARTERLY JOURNAL OF ECONOMICS1634
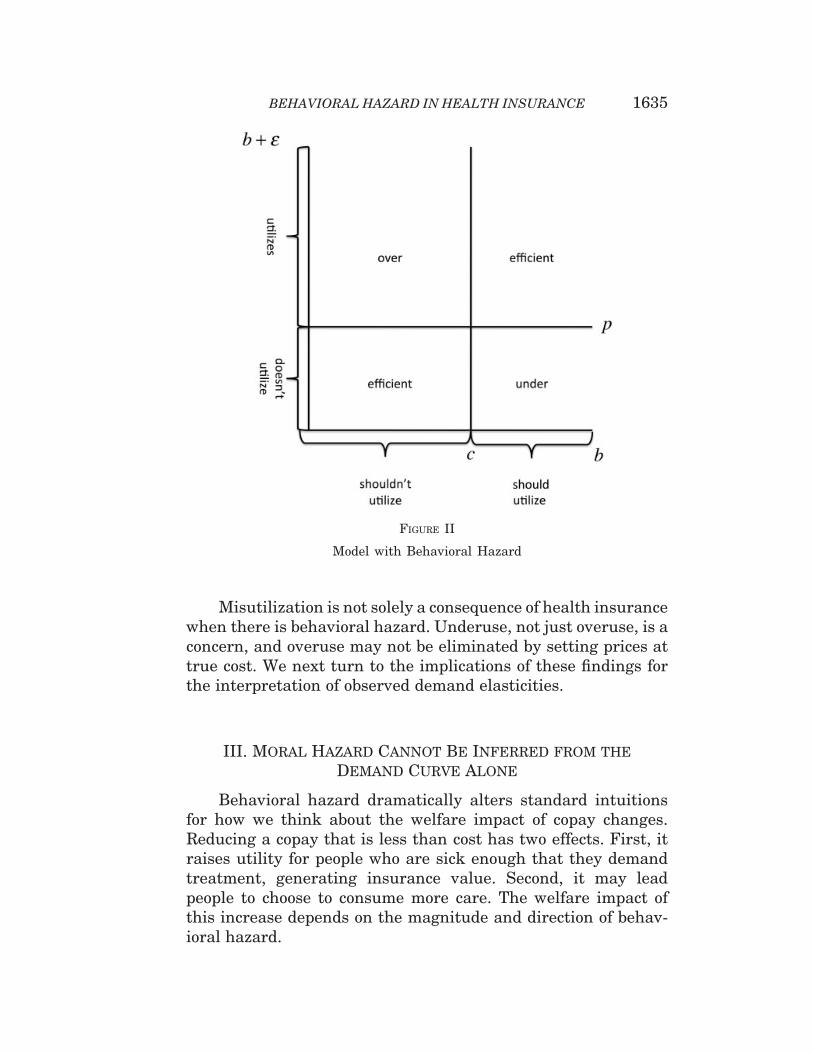
Misutilization is not solely a consequence of health insurancewhen there is behavioral hazard. Underuse, not just overuse, is aconcern, and overuse may not be eliminated by setting prices attrue cost. We next turn to the implications of these findings forthe interpretation of observed demand elasticities.
III. Moral Hazard Cannot Be Inferred from theDemand Curve Alone
Behavioral hazard dramatically alters standard intuitionsfor how we think about the welfare impact of copay changes.Reducing a copay that is less than cost has two effects. First, itraises utility for people who are sick enough that they demandtreatment, generating insurance value. Second, it may leadpeople to choose to consume more care. The welfare impact ofthis increase depends on the magnitude and direction of behav-ioral hazard.
FIGURE II
Model with Behavioral Hazard
BEHAVIORAL HAZARD IN HEALTH INSURANCE 1635
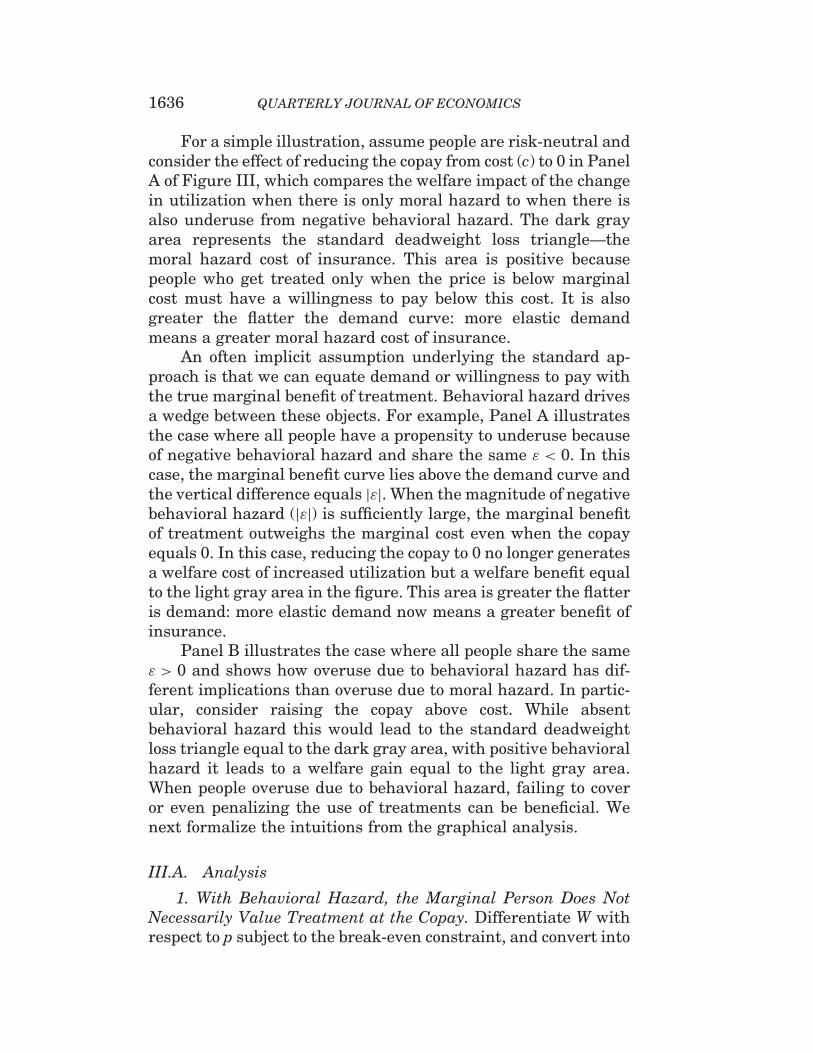
For a simple illustration, assume people are risk-neutral andconsider the effect of reducing the copay from cost (c) to 0 in PanelA of Figure III, which compares the welfare impact of the changein utilization when there is only moral hazard to when there isalso underuse from negative behavioral hazard. The dark grayarea represents the standard deadweight loss triangle—themoral hazard cost of insurance. This area is positive becausepeople who get treated only when the price is below marginalcost must have a willingness to pay below this cost. It is alsogreater the flatter the demand curve: more elastic demandmeans a greater moral hazard cost of insurance.
An often implicit assumption underlying the standard ap-proach is that we can equate demand or willingness to pay withthe true marginal benefit of treatment. Behavioral hazard drivesa wedge between these objects. For example, Panel A illustratesthe case where all people have a propensity to underuse becauseof negative behavioral hazard and share the same " < 0. In thiscase, the marginal benefit curve lies above the demand curve andthe vertical difference equals j"j. When the magnitude of negativebehavioral hazard (j"j) is sufficiently large, the marginal benefitof treatment outweighs the marginal cost even when the copayequals 0. In this case, reducing the copay to 0 no longer generatesa welfare cost of increased utilization but a welfare benefit equalto the light gray area in the figure. This area is greater the flatteris demand: more elastic demand now means a greater benefit ofinsurance.
Panel B illustrates the case where all people share the same" > 0 and shows how overuse due to behavioral hazard has dif-ferent implications than overuse due to moral hazard. In partic-ular, consider raising the copay above cost. While absentbehavioral hazard this would lead to the standard deadweightloss triangle equal to the dark gray area, with positive behavioralhazard it leads to a welfare gain equal to the light gray area.When people overuse due to behavioral hazard, failing to coveror even penalizing the use of treatments can be beneficial. Wenext formalize the intuitions from the graphical analysis.
III.A. Analysis
1. With Behavioral Hazard, the Marginal Person Does NotNecessarily Value Treatment at the Copay. Differentiate W withrespect to p subject to the break-even constraint, and convert into
QUARTERLY JOURNAL OF ECONOMICS1636
FIGURE III
Welfare Impact of a Copay Change: Behavioral Hazard versus Moral HazardAlone
Panel A considers the welfare impact of reducing the copay to zero whenthere is only moral hazard to when there is also negative behavioral hazard.Panel B considers the welfare impact of increasing the copay above cost whenthere is only moral hazard to when there is also positive behavioral hazard.
BEHAVIORAL HAZARD IN HEALTH INSURANCE 1637
a money metric by normalizing the increase in welfare by thewelfare gain from increasing income by 1. The following proposi-tion details the resulting formula:
PROPOSITION 1. The welfare impact of a marginal copay change isgiven by
~W 0ðpÞ+ @W@p=@W@y|fflfflfflfflfflfflfflfflfflfflfflfflffl{zfflfflfflfflfflfflfflfflfflfflfflfflffl}
Total Welfare Impact
¼"M0ðpÞ , ðc"pþ"avgðpÞÞ|fflfflfflfflfflfflfflfflfflfflfflfflfflfflfflfflfflfflfflfflffl{zfflfflfflfflfflfflfflfflfflfflfflfflfflfflfflfflfflfflfflfflffl}Impact from Change in Behavior
" IðpÞ ,MðpÞ|fflfflfflfflfflfflffl{zfflfflfflfflfflfflffl}Impact from Change in Insurance Value
;
ð5Þ
where
IðpÞ ¼ E½U0ðCÞjm ¼ 1' " E½U 0ðCÞ'
E½U 0ðCÞ'
equals the insurance value to consumers (C ¼ y"P" sþm , ðb" pÞ), defined to equal 0 when M(p) = 0, and
"avgðpÞ ¼ E½"0jbþ " ¼ p'
equals the average size of marginal behavioral hazard atcopay p.
Proof. All proofs are in Online Appendix B. !
To interpret Proposition 1, first consider the standard modelwith just moral hazard, where "avgðpÞ ¼ 0 for all p. In this case, thefirst term of equation (5),"M0ðpÞðc" pÞ, represents the welfare gainfrom reducing moral hazard: it can be thought of as the number ofpeople who are at the margin multiplied by the difference betweenthe social cost and social value of their treatment—the marginalinefficiency—ðc" pÞ > 0. Note that the sensitivity of demand,M0ðpÞ, is a sufficient statistic for measuring this gain, since the mar-ginal social value is a known function of the copay when people arerational. The second term represents the reduction in insurancevalue for all treated individuals, where our assumptions guaranteethat I(p)>0 for all p> 0 when individuals are rational.
Behavioral hazard alters the first term because it changeswho is at the margin: with behavioral hazard, the welfare impactof lower utilization equals "M0ðpÞðc" pþ "avgðpÞÞ, which can bethought of as the number of people who are at the margin multi-plied by the difference between the social cost and social value oftheir treatment, ðc" ðp" "avgðpÞÞÞ. As we saw in the graphical
QUARTERLY JOURNAL OF ECONOMICS1638
example, the sign of this term becomes ambiguous. When behav-ioral hazard is on average positive at the margin, "avgðpÞ - 0, thisterm is greater than with moral hazard alone: increasing thecopay from an amount less than cost has an even greater benefitof decreasing overutilization. On the other hand, when behav-ioral hazard is on average negative at the margin, "avgðpÞ < 0,this term may be negative: increasing the copay can have thecost of increasing underutilization.14,15
2. With Behavioral Hazard, Demand Responses Do NotMeasure the Extent of Moral Hazard. Proposition 1 also formal-izes the standard intuition that when there is merely moralhazard, the overall demand response is a powerful tool for mea-suring the welfare impact of the changes in utilization driven bycopay changes. Indeed, "M0ðpÞ , ðc" pÞ is necessarily increasingin jM0ðpÞj when p< c. But it shows that with behavioral hazard,this composite response is harder to interpret: looking at demandresponses alone may provide a misleading impression, since"M0ðpÞ , ðc" pþ "avgðpÞÞ is not necessarily increasing in jM0ðpÞj.A high response might indicate a great deal of moral hazard(and hence a cost of providing insurance), or could indicate agreat deal of negative behavioral hazard or price-responsive un-derutilization (and hence an additional benefit to insurance).
In practice, researchers effectively ignore behavioral hazardby focusing on aggregate demand responses in calculating the
14. Although not the focus of our analysis, with behavioral hazard the sign onthe insurance value term is also ambiguous. In the standard model, the sick whodemand treatment are worse off than the sick who do not, even post treatment, aslong as p> 0. Since this may not hold with behavioral hazard, stronger conditions(for example, that q is sufficiently small) are necessary to guarantee that the peoplewho demand treatment on average have higher marginal utility than those who donot and consequently that I(p)> 0 for p> 0.
15. Note that what matters for calculating the welfare impact of a marginalcopay change is the average marginal size of behavioral hazard at copay p,"avgðpÞ ¼ E½"0jbþ " ¼ p', rather than the average unconditional size, E½"0'. To seewhy, consider a situation where some people simply forget to get treated (e.g., forgeta prescription refill) with some probability ', but otherwise make an accurate cost-benefit calculation. In our framework, this can be captured by assuming that "ðs; "Þis very negative with probability ' and otherwise equals 0. Although the averagedegree of behavioral hazard in this example can be quite negative, behavioralhazard does not influence who is at the margin, since anyone who responds to acopay change is someone who makes an accurate cost-benefit calculation. Indeed, inthis case the marginal degree of behavioral hazard is 0.
BEHAVIORAL HAZARD IN HEALTH INSURANCE 1639
welfare impact of copay changes. For example, researchers calcu-lated a welfare loss of $291 per person from moral hazard in 1984dollars based on evidence from the RAND Health InsuranceExperiment suggesting a demand elasticity of roughly ".2(Manning et al. 1987; Feldman and Dowd 1991). While recent eco-nomic research has questioned whether such a single elasticity canaccurately summarize how people respond to changes in nonlinearhealth insurance contracts (Aron-Dine, Einav, and Finkelstein2013), there has been less emphasis on reexamining the basic as-sumption that the price sensitivity of demand meaningfully cap-tures the degree of moral hazard. In a recent review article ofdevelopments in the study of moral hazard in health insurancesince Arrow’s (1963) original article, Finkelstein (2014) equatesevidence of moral hazard with evidence of the price sensitivity ofdemand for medical care. Our analysis suggests this can be mis-leading, as does a closer look at available evidence.
Table II summarizes evidence indicating that demand for ‘‘ef-fective care’’ is often as elastic as demand for ‘‘ineffective care.’’Analysis of the RAND Health Insurance Experiment found thatcost-sharing induced the same 40 percent reduction in demand forbeta-blockers as it did for cold remedies—with reductions for drugsdeemed ‘‘essential’’ on average quite similar to those for drugsdeemed ‘‘less essential’’ (Lohr et al. 1986).16 Goldman et al. (2006)estimate that a $10 increase in copayments drives similar reduc-tions in use of cholesterol-lowering medications among those withhigh risk (and thus presumably those with high health benefits) asthose with much lower risk. A quasi-experimental study of the ef-fects of small increases in copayments (rising from around $1 toaround $8) among retirees in California by Chandra, Gruber, andMcKnight (2010) suggests that HMO enrollees’ elasticity for ‘‘life-style drugs’’ such as cold remedies and acne medication is virtually
16. Although we have framed the analysis in terms of the insurer setting acopayment for a specific disease and treatment, we could reinterpret the model asbeing about an insurer who sets the same copayment across a set of treatments withcommon cost c. For example, we could think of the insurer as setting the copay fordrugs within some formulary tier. Under this interpretation, ! indexes observableconditions that the insurer does not distinguish between in setting copays. Theanalysis would proceed in a similar fashion, but under this interpretation an ana-lyst can disaggregate the demand response into the response for each condition !,which can provide information on the degree to which the total response reflectssome combination of behavioral hazard and moral hazard when there is a priorsense of the marginal value of different treatments.
QUARTERLY JOURNAL OF ECONOMICS1640
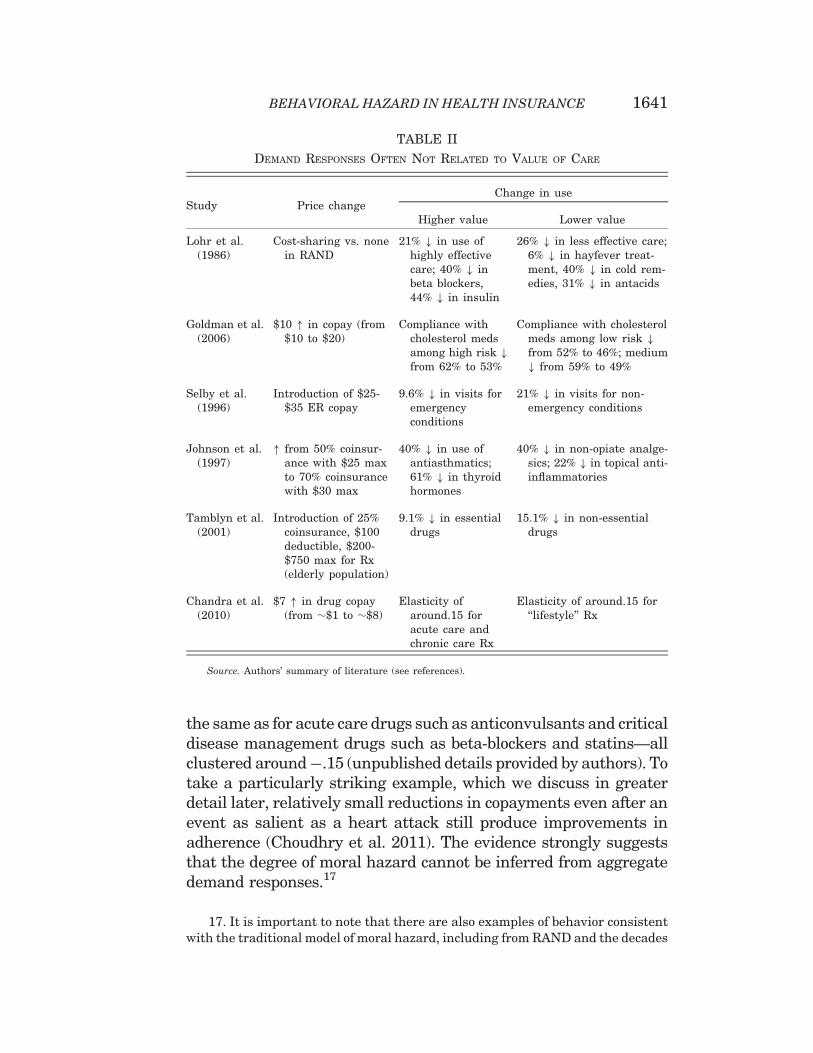
the same as for acute care drugs such as anticonvulsants and criticaldisease management drugs such as beta-blockers and statins—allclustered around".15 (unpublished details provided by authors). Totake a particularly striking example, which we discuss in greaterdetail later, relatively small reductions in copayments even after anevent as salient as a heart attack still produce improvements inadherence (Choudhry et al. 2011). The evidence strongly suggeststhat the degree of moral hazard cannot be inferred from aggregatedemand responses.17
TABLE II
DEMAND RESPONSES OFTEN NOT RELATED TO VALUE OF CARE
Study Price changeChange in use
Higher value Lower value
Lohr et al.(1986)
Cost-sharing vs. nonein RAND
21% # in use ofhighly effectivecare; 40% # inbeta blockers,44% # in insulin
26% # in less effective care;6% # in hayfever treat-ment, 40% # in cold rem-edies, 31% # in antacids
Goldman et al.(2006)
$10 " in copay (from$10 to $20)
Compliance withcholesterol medsamong high risk #from 62% to 53%
Compliance with cholesterolmeds among low risk #from 52% to 46%; medium# from 59% to 49%
Selby et al.(1996)
Introduction of $25-$35 ER copay
9.6% # in visits foremergencyconditions
21% # in visits for non-emergency conditions
Johnson et al.(1997)
" from 50% coinsur-ance with $25 maxto 70% coinsurancewith $30 max
40% # in use ofantiasthmatics;61% # in thyroidhormones
40% # in non-opiate analge-sics; 22% # in topical anti-inflammatories
Tamblyn et al.(2001)
Introduction of 25%coinsurance, $100deductible, $200-$750 max for Rx(elderly population)
9.1% # in essentialdrugs
15.1% # in non-essentialdrugs
Chandra et al.(2010)
$7 " in drug copay(from $$1 to $$8)
Elasticity ofaround.15 foracute care andchronic care Rx
Elasticity of around.15 for‘‘lifestyle’’ Rx
Source. Authors’ summary of literature (see references).
17. It is important to note that there are also examples of behavior consistentwith the traditional model of moral hazard, including from RAND and the decades
BEHAVIORAL HAZARD IN HEALTH INSURANCE 1641
So how can we systematically distinguish between behav-ioral hazard and moral hazard? One method is to measurehealth responses.
3. With Behavioral Hazard, Measuring Health ResponsesHelps Characterize Who Is at the Margin. Let HðpÞ ¼ E½mðpÞ,b" s' equal the aggregate level of health given copay p, whichrepresents the expected value of disease severity post treatmentdecisions at copay level p in income-equivalent units. We have thefollowing result:
PROPOSITION 2. Consider a copay p at which demand is price-sensitive, so M0ðpÞ < 0, and let U be linear. The welfareimpact of a marginal copay change is
~W 0ðpÞ ¼ "M0ðpÞ , c" H0ðpÞM0ðpÞ
" #:
Further, H0ðpÞM0ðpÞ ¼ p if and only if "avgðpÞ ¼ 0 and, more gener-
ally, "avgðpÞ ¼ p" H0ðpÞM0ðpÞ.
The first part of this proposition indicates that all else equal,the welfare impact of a copay increase inversely depends on themarginal health value of care.18 This is true not only when thereis behavioral hazard but also in the rational model. Intuitively, acopay increase is less desirable when it discourages high-valuecare rather than low-value care. The second part clarifies whystandard formulas for the welfare impact of copay changes arenot expressed in terms of health responses: absent behavioralhazard, we can equate the health response with the copay sincebeing marginal reveals indifference. But it goes on to show thatwe cannot do this when there is the possibility of marginal be-havioral hazard. Rather, we can infer the degree of marginal be-havioral hazard from the deviation between the copay and themarginal health value of treatment.
since. Taubman et al. (2014), for example, show that gaining insurance coverage(and the associated drop in prices) increased emergency department visits particu-larly for less urgent or more discretionary conditions.
18. The assumption of linear utility simplifies the presentation by allowing us toabstract from the insurance value term. It also simplifies the relationship between"avgðpÞ and H0ðpÞ
M0ðpÞ. Otherwise, "avgðpÞ&p" H0ðpÞM0ðpÞ when U is approximately linear.
QUARTERLY JOURNAL OF ECONOMICS1642
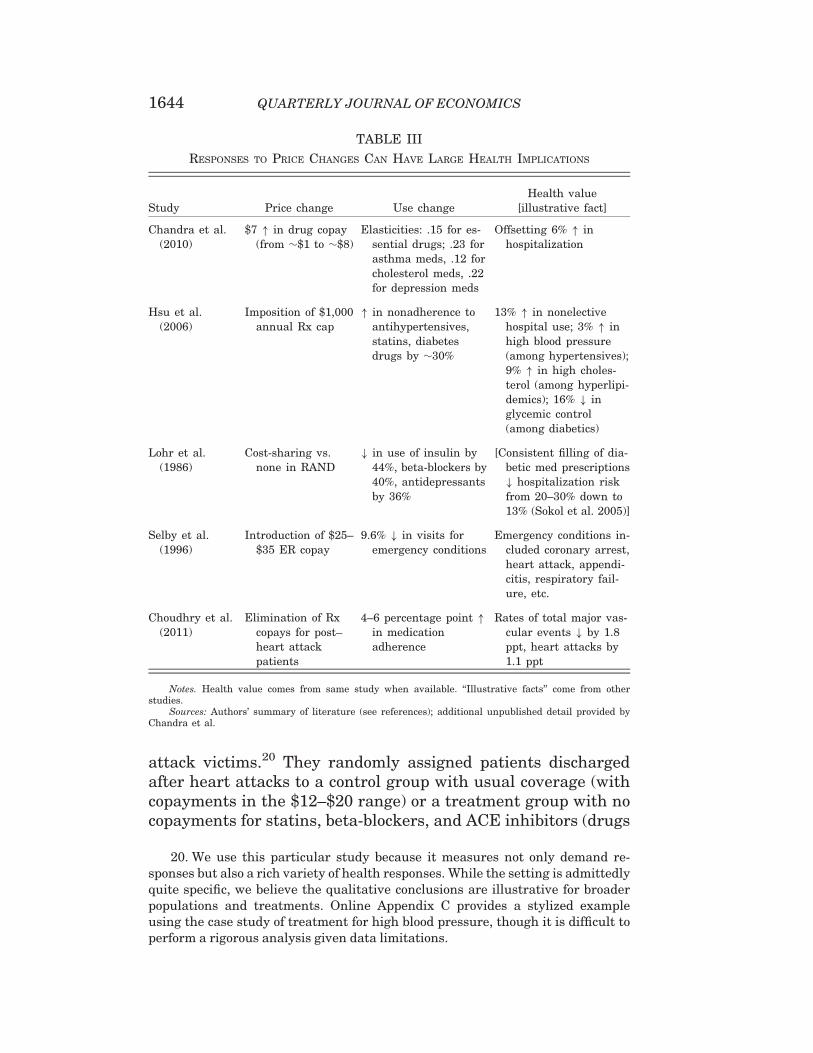
In some of the cases described here, there are indications thatthe copay changes are associated with large health implications,providing further suggestive evidence for behavioral hazard insuch cases. As summarized in Table III, the copay increase stud-ied by Chandra, Gruber, and McKnight (2010) was associatedwith an increase in subsequent hospitalizations, and Hsu et al.(2006) similarly find that the imposition of a cap on Medicaredrug benefits leads to a greater nonelective hospital use.Choudhry et al. (2011) find that providing post–heart attack med-ications for free is associated with a reduced rate of subsequentmajor vascular events to an extent that is inconsistent with plau-sible parameters under the standard model (as we discuss later).
A challenge to using data on health responses to calibrate thedegree of behavioral hazard is that the health response may bedifficult to observe or to map to hedonic benefits. It may be pos-sible to estimate how much a pill reduces mortality risk andtranslate this into (money-metric) utility; it may be more difficultto estimate the unpleasantness of side effects or the inconve-nience of treatment. In some instances, however, we may haveenough information to confidently bound the unobservable com-ponent, in which case we can still say something about the signand possibly the magnitude of behavioral hazard.19 This is morelikely in the case of highly effective treatments with few side ef-fects than in treatments with nonpecuniary costs that may beexperienced quite differently across people (e.g., colonoscopies).Section VI shows that good prior knowledge of the psychologyunderlying behavioral hazard can help estimate the marginaldegree of behavioral hazard in the latter situations.
III.B. An Illustration
We illustrate the potential importance of taking behavioralhazard into account by further drawing on Choudhry et al.’s(2011) work on the effects of eliminating copays for recent heart
19. To illustrate, decompose the change in health per marginal change indemand into observable and unobservable components: H0ðpÞ
M0ðpÞ ¼ hOðpÞ þ hU ðpÞ;where hOðpÞ represents the observable component, and hU ðpÞ the unobservablecomponent. For example, the observable component could include a proxy for qual-ity-adjusted life years gained per marginal filled prescription and the unobservablecomponent could include nonpecuniary costs (e.g., side effects) associated with fill-ing the prescription (all in dollars). If we can bound the unobservable componentas belonging to ½hU ðpÞ; hU ðpÞ'; then we can also bound the extent of behavioralhazard: "avgðpÞ 2 ½p" ðhOðpÞ þ hU ðpÞÞ;p" ðhOðpÞ þ hU ðpÞÞ':
BEHAVIORAL HAZARD IN HEALTH INSURANCE 1643
attack victims.20 They randomly assigned patients dischargedafter heart attacks to a control group with usual coverage (withcopayments in the $12–$20 range) or a treatment group with nocopayments for statins, beta-blockers, and ACE inhibitors (drugs
TABLE III
RESPONSES TO PRICE CHANGES CAN HAVE LARGE HEALTH IMPLICATIONS
Study Price change Use changeHealth value
[illustrative fact]
Chandra et al.(2010)
$7 " in drug copay(from $$1 to $$8)
Elasticities: .15 for es-sential drugs; .23 forasthma meds, .12 forcholesterol meds, .22for depression meds
Offsetting 6% " inhospitalization
Hsu et al.(2006)
Imposition of $1,000annual Rx cap
" in nonadherence toantihypertensives,statins, diabetesdrugs by $30%
13% " in nonelectivehospital use; 3% " inhigh blood pressure(among hypertensives);9% " in high choles-terol (among hyperlipi-demics); 16% # inglycemic control(among diabetics)
Lohr et al.(1986)
Cost-sharing vs.none in RAND
# in use of insulin by44%, beta-blockers by40%, antidepressantsby 36%
[Consistent filling of dia-betic med prescriptions# hospitalization riskfrom 20–30% down to13% (Sokol et al. 2005)]
Selby et al.(1996)
Introduction of $25–$35 ER copay
9.6% # in visits foremergency conditions
Emergency conditions in-cluded coronary arrest,heart attack, appendi-citis, respiratory fail-ure, etc.
Choudhry et al.(2011)
Elimination of Rxcopays for post–heart attackpatients
4–6 percentage point "in medicationadherence
Rates of total major vas-cular events # by 1.8ppt, heart attacks by1.1 ppt
Notes. Health value comes from same study when available. ‘‘Illustrative facts’’ come from otherstudies.
Sources: Authors’ summary of literature (see references); additional unpublished detail provided byChandra et al.
20. We use this particular study because it measures not only demand re-sponses but also a rich variety of health responses. While the setting is admittedlyquite specific, we believe the qualitative conclusions are illustrative for broaderpopulations and treatments. Online Appendix C provides a stylized exampleusing the case study of treatment for high blood pressure, though it is difficult toperform a rigorous analysis given data limitations.
QUARTERLY JOURNAL OF ECONOMICS1644
of known efficacy), and tracked adherence rates and clinical out-comes over the next year. Faced with lower prices, consumersused more drugs: the full coverage group was significantly moreadherent to their medications, using on average $106 more worthof cardiovascular-specific prescription drugs.
Under the moral hazard model, this fact alone tells us thehealth consequences of eliminating copays. Rational patientsforgo only care with marginal value less than their out-of-pocket price. The average patient share under usual coveragein the Choudry data is about 25 percent, implying that theextra care consumed when copays are eliminated has a monetizedhealth value of at most $0.25 on the dollar. Given the $106 in-crease in spending, the moral hazard model then predicts ahealth impact of at most $108,.25 = $26.50 per patient. This inturn implies a moral hazard welfare loss from eliminating copay-ments of at least $106(1 – .25) = $79.50 per person. In other words,the $106 increase in spending is comprised of $26.50 of healthvalue plus $79.50 of excess utilization. This is the kind of exerciseroutinely performed with demand data.21
But Choudhry et al. (2011) collected data on health impacts,which we can use to gauge the performance of the moral hazardmodel by comparing the implied health benefits with the observedones. The increase in prescription drug use was associated withsignificantly improved clinical outcomes: patients in the full cover-age group had lower rates of vascular events (1.8 percentage points),myocardial infarction (1.1 percentage points), and death from car-diovascular causes (0.3 percentage point). We apply the commonlyused estimate of a $1 million value of a statistical life to the reduc-tion in the mortality to get a measure of the dollar value of healthimprovements.22 This implies that the elimination of copays leading
21. Given the assumption that people have linear demand curves, we can derivea tighter lower bound on the welfare loss under the standard model. In this case, themoral hazard model implies a welfare loss of at least $106ð1" :25
2 Þ ¼ $92:75 (see,e.g., Feldman and Dowd 1991).
22. This calculation is admittedly crude but provides an illustrative example.Estimates of the value of a statistical life clearly vary based on the age at whichdeath is averted and the life expectancy gained—averting the death of a young,healthy worker might be valued at $5 million—and mortality is only one aspect ofthe potential changes in health. Though the estimated reduction in mortality is notstatistically significant at conventional levels, the other health impacts are. Wefocus on the mortality reduction because it is easiest to monetize in this illustration.
BEHAVIORAL HAZARD IN HEALTH INSURANCE 1645
to a 0.3 percentage point reduction in mortality generates a value of$3,000. This $3,000 improvement substantially exceeds the stan-dard model’s prediction of $26.50, suggesting large negative behav-ioral hazard. Applying the traditional moral hazard calculus in thissituation would imply that people place an unrealistically low val-uation on their life and health.23
For welfare calculations, the theoretical analysis highlightsthe need to use an estimate of the marginal private health benefitin the presence of behavioral hazard. As a rough back-of-the-envelope calculation, the $3,000 improvement in mortalityminus the $106 increase in spending generates a surplus of$2,894 per person (a gross return of $28 per dollar spent). Thepresence of behavioral hazard thus reverses how we interpret thedemand response to eliminating copayments: moral hazardimplies a welfare loss, while behavioral hazard implies a gainthat is over 30 times larger.24
IV. Implications for Optimal Copays
We have seen that behavioral hazard can influence whetherchanging copays from existing levels is good policy. This sectiondescribes some features of the optimal insurance plan when be-havioral hazard is taken into account.
Consider again equation (5), which gives us the welfareimpact of a marginal copay increase. Setting this equal to 0
23. It seems unlikely that the cost of unobserved side effects of statins, beta-blockers, and ACE inhibitors is anywhere near $2,894 for a given patient in a year,so taking these effects into account should not reverse the conclusion that elimi-nating copayments leads to a welfare gain.
24. As in basic moral hazard calculations, this analysis ignores substitutionbetween treatments. In this example, total spending (prescription drug plus non-drug spending) went down by a small, non–statistically significant amount whencopayments were eliminated on preventive medications after heart attack, as didinsurer costs. Taking these nonsignificant offset effects at face value would implythat welfare goes up even before taking behavioral hazard into account (Glazer andMcGuire 2012), though it raises a puzzle as to why private insurers did not reducecopays on their own. Even in this case, however, incorporating behavioral hazardsubstantially changes the analysis by providing a much stronger rationale for re-ducing the copay. More generally, evidence suggests that reducing copays on high-value care does not generate cost savings over short horizons (one to three years)(Lee et al. 2013).
QUARTERLY JOURNAL OF ECONOMICS1646
yields a candidate for the optimal copay. To limit the number ofcases, we focus attention on the standard situation where somebut not all sick people are treated at the optimum: an optimalcopay pB satisfies M0ðpBÞ < 0 and MðpBÞ > 0. This is true underour assumptions, for example, when people are not too riskaverse, that is, when "U 00
U 0 is sufficiently small over the relevantrange of C. For presentational simplicity, we also focus onthe situation where the optimal copay is unique. Defining pmin ¼inf p : MðpÞ < q
$ %to equal the lowest copay where not every sick
person demands treatment and pmax ¼ sup p : MðpÞ > 0$ %
to equalthe highest copay where some sick person demands treatment,we assume the following.
ASSUMPTION 1. The optimal copay is unique and satisfiespB 2 ðpmin; pmaxÞ.
PROPOSITION 3. Assuming pB 6¼ 0, the optimal copay satisfies
c" pB
pB¼ I(" "
avg
pB;ð6Þ
where ( ¼ "M0ðpÞpMðpÞ equals the elasticity of demand for treat-
ment, I the insurance value, and "avg the average size ofmarginal behavioral hazard, all evaluated at pB.
Proposition 3 expresses the optimal copay in terms ofreduced-form elasticities as well as the degree of behavioralhazard and the curvature of the utility function. It says thatfixing insurance value and the cost of treatment, the optimalcopay is increasing in the demand elasticity and the degree towhich behavioral hazard is positive. This simple formula illus-trates a number of ways behavioral hazard fundamentallychanges how we think about optimal copays.
1. Optimal Copays Can Substantially Deviate from Cost EvenWhen Coverage Generates Little or No Insurance Value. A simpleimplication of equation (6) is that health ‘‘insurance’’ can providemore than financial protection: it can also improve health careefficiency. Even when individuals are risk-neutral and there is novalue to financial insurance (I = 0), equation (6) indicates that theoptimal copay can differ from cost to provide insurees withincentives for more efficient utilization decisions. In fact, whenconsumers are risk-neutral, the extent of behavioral hazard
BEHAVIORAL HAZARD IN HEALTH INSURANCE 1647
(at the margin) fully determines the optimal copay. In this case,the optimal copay formula reduces to pB ¼ cþ "avgðpBÞ: the opti-mal copay acts like a Pigouvian tax to induce marginal insurees tofully internalize their ‘‘internality.’’ Unlike in the standardmodel, there is no clear incentive-insurance trade-off.
2. Optimal Copays Can Be Extreme. It can be optimal to fullycover treatments that are ineffective for some insurees or not tocover treatments that benefit insurees. A related implication isthat optimal copays can be more extreme than in a model withonly moral hazard. Absent behavioral hazard, the optimal copaylies strictly between the value that provides full insurance (i.e.,the value that makes I(p) = 0) and cost when insurees are riskaverse and demand is elastic. Intuitively, without behavioralhazard, slightly raising the copay from the amount that providesfull insurance has only a second-order cost through reducinginsurance value but a first-order benefit through controllingmoral hazard; slightly reducing the copay from cost has asecond-order cost through inducing moral hazard but a firstorder benefit through increasing insurance value. In the standardmodel, it cannot be optimal to deny coverage of treatments thatbenefit some risk averse individuals and it cannot be optimalto fully cover or subsidize treatments when people are price-sensitive at the full coverage copay.
Behavioral hazard alters these prescriptions. When beha-vioral hazard is sufficiently positive, the optimal copay can beabove cost even when the individual is risk-averse: it can begood to let insurers discriminate against certain treatments,as suggested by Panel B of Figure III. When behavioralhazard is sufficiently negative, the optimal copay can bebelow the level that provides full financial protection, even ifdemand is price-sensitive at this copay: paying people to get trea-ted can be optimal, as illustrated in Panel A of Figure III. In thisspirit, some insurers have begun to experiment with payingpatients to take their medications (Belluck 2010; Volpp et al.2009).
3. Optimal Copays Depend on Health Value, Not JustDemand Elasticities. Optimal copays likely vary more acrosstreatments than in a model with only moral hazard. The standardmodel says that fixing insurance value, copays should be higher
QUARTERLY JOURNAL OF ECONOMICS1648
the larger the cost and elasticity of demand (Zeckhauser 1970), ascan be seen from plugging "avg ¼ 0 into equation (6). That modelsuggests, for example, that copays should be lower for emergencycare (where demand is less elastic) than for regular doctor’s officevisits (where it is presumably more price sensitive). However, italso leads to some counterintuitive prescriptions: it suggests thatcopays should be similar across broad categories of drugs withsimilar price elasticities, even if they have very differentefficacies.
Behavioral hazard alters these prescriptions as well. To seethis, make the approximation "ðs; "Þ&"0ðs; "Þ8ðs; "Þ and plug
"avgðpÞ&p" H0ðpÞM0ðpÞ (Proposition 2 establishes that the second
approximation follows from the first) into equation (6), yielding
c" pB
pB&
I(þ H0ðpBÞ
pBM0ðpBÞ " 1
" #:ð7Þ
From equation (7), all else equal, copays should be decreasingin the net return to the last private dollar spent on treatment,jH0ðpÞj
pjM0ðpÞj" 1, so the value of treatment now enters into the deter-
mination of the optimal copay insofar as it influences H0ðpÞ. Fora given demand response to copays, copays should be lowerwhen this demand response has greater adverse effects onhealth.
This connects to value-based insurance design proposals(Chernew, Rosen, and Fendrick 2007) where, all else equal, costsharing should be lower for higher value care. While the marginalrather than the average value of care appears in equation (7),knowledge of the average health value of care can provide auseful signal about the marginal health value. Consider a casewhere the demand curve slopes down only because of behavioralhazard: Varð"Þ > 0, but Var(b) = 0. Then the marginal individualat any copay where demand is price-sensitive must have a mar-ginal health value equal to the average value b, which also can be
expressed as Hðpmin Þ"Hðpmax ÞMðpmin Þ"Mðpmax Þ. (Recall that pmin equals the lowest
copay where some of the sick do not demand treatment and pmax
equals the largest copay where some people still demand treat-ment.) Generalizing this example to allow for heterogeneity inprivate benefits in addition to heterogeneity in behavioralhazard yields the following result.
BEHAVIORAL HAZARD IN HEALTH INSURANCE 1649
PROPOSITION 4. Assume U is linear, M0ðcÞ 6¼ 0, and the distributionQðs; "; !Þ is such that bðs; !Þ and "ðs; "Þ are independently dis-tributed according to symmetric and quasi-concave densitieswith Varð"Þ > 0.
(i) pB > c if Hðpmin Þ"Hðpmax ÞMðpmin Þ"Mðpmax Þ < c and E½"' - 0.
(ii) pB ¼ c if Hðpmin Þ"Hðpmax ÞMðpmin Þ"Mðpmax Þ ¼ c and E½"' ¼ 0.
(iii) pB < c if Hðpmin Þ"Hðpmax ÞMðpmin Þ"Mðpmax Þ > c and E½"' * 0.
This shows that with behavioral hazard, the average value ofcare provides a useful signal for the optimal copay. So long asthere is some variability in behavioral hazard across people andbehavioral hazard does not systematically push people to pri-vately overuse high-value treatments or privately underuselow-value treatments, then the optimal copay is above cost when-ever the treatment is not socially beneficial on average and isbelow cost whenever the treatment is socially beneficial on aver-age. Take the case where E½"' ¼ 0. The average value of caresignals the expected direction of behavioral hazard at themargin, since—as is familiar from standard signal-extractionarguments—the marginal patient’s expected valuation liesbetween the copay (his ‘‘revealed’’ valuation if there is no beha-vioral hazard) and the unconditional average valuation (hisvaluation if being marginal was independent of true valuation).25
The marginal degree of behavioral hazard is then negative atcopays below the expected value of treatment and positive atcopays above the expected value of treatment. Returning to theexample where Var(b) = 0, the marginal degree of behavioralhazard satisfies bþ " ¼ p) " ¼ p" b, which clearly isnegative if and only if the copay is below the expected value oftreatment.
25. The assumptions that b and " are independently distributed according tosymmetric and nondegenerate quasi-concave distributions guarantee that E½bjbþ" ¼ p' lies in between p andE½b' (see, e.g., Chambers and Healy 2012). In a differentcontext, Spinnewijn (2014) similarly shows that even when people make mean-zeroerrors in deciding whether to purchase insurance (which are independent of trueinsurance value), a selection argument implies that the demand curve systemati-cally overestimates the insurance value for the insured and systematically under-estimates the insurance value for the uninsured.
QUARTERLY JOURNAL OF ECONOMICS1650
These results suggest that optimal copays should depend onthe value of treatment in addition to the demand response. Forexample, we might expect that we should have high copays forprocedures that are not recommended but sought by the patientnonetheless and low copays in situations where people haveasymptomatic chronic diseases for which there are effectivedrug regimens. While advocated by some health researchers—for example, Chernew, Rosen, and Fendrick (2007)—such differ-ential cost sharing is uncommon in practice; we return to somepossible reasons in Section VI.26
V. The Pitfalls of Ignoring Behavioral Hazard
Behavioral hazard modifies the central insights of the stan-dard model. The goal of this section is to give a sense of howimportant it is to take behavioral hazard into account—howwrong would the analyst be if he ignored behavioral hazard?
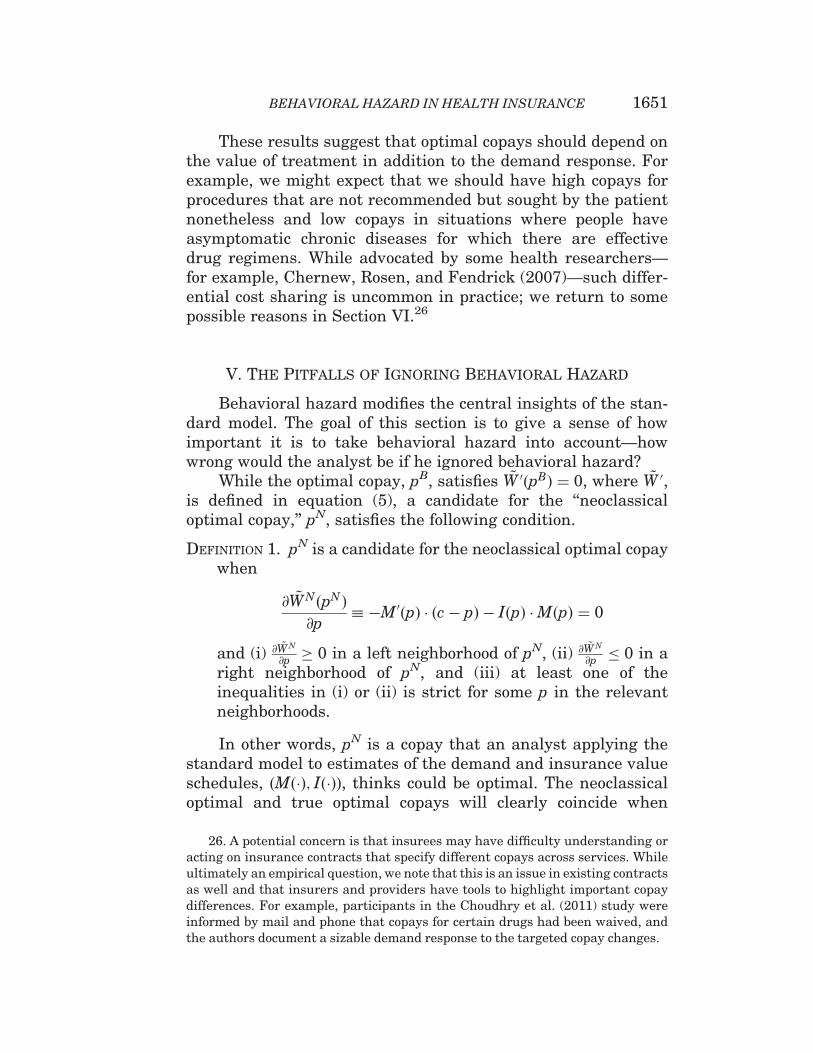
While the optimal copay, pB, satisfies ~W 0ðpBÞ ¼ 0, where ~W 0,is defined in equation (5), a candidate for the ‘‘neoclassicaloptimal copay,’’ pN, satisfies the following condition.
DEFINITION 1. pN is a candidate for the neoclassical optimal copaywhen
@ ~WNðpNÞ@p
+ "M0ðpÞ , ðc" pÞ " IðpÞ ,MðpÞ ¼ 0
and (i) @~W N
@p - 0 in a left neighborhood of pN, (ii) @~W N
@p * 0 in aright neighborhood of pN, and (iii) at least one of theinequalities in (i) or (ii) is strict for some p in the relevantneighborhoods.
In other words, pN is a copay that an analyst applying thestandard model to estimates of the demand and insurance valueschedules, ðMð,Þ; Ið,ÞÞ, thinks could be optimal. The neoclassicaloptimal and true optimal copays will clearly coincide when
26. A potential concern is that insurees may have difficulty understanding oracting on insurance contracts that specify different copays across services. Whileultimately an empirical question, we note that this is an issue in existing contractsas well and that insurers and providers have tools to highlight important copaydifferences. For example, participants in the Choudhry et al. (2011) study wereinformed by mail and phone that copays for certain drugs had been waived, andthe authors document a sizable demand response to the targeted copay changes.
BEHAVIORAL HAZARD IN HEALTH INSURANCE 1651
"ðs; "Þ ¼ 08s; ". The direction of the deviation between thesecopays is also intuitive. As established in Online Appendix A,there is a welfare benefit to raising the copay from the neoclassi-cal optimum whenever behavioral hazard is on average positivefor people at the margin, and there is a welfare benefit to reducingthe copay from the neoclassical optimum whenever behavioralhazard is on average negative for people at the margin.27 Lessobvious, the deviation between the neoclassical optimal and trueoptimal copays can be huge:
PROPOSITION 5. Suppose U is strictly concave, "ðs; "Þ ¼ ~" 2 R, andbðs; !Þ ¼ s8ðs; !; "Þ.
(i) If ~" is sufficiently large, then the neoclassical analystbelieves pN ¼ 0 is a candidate for the optimal copay, butthe optimal copay in fact satisfies pB - c.
(ii) If ~" is sufficiently low, then the neoclassical analystbelieves pN ¼ c is a candidate for the optimal copay,but the optimal copay in fact satisfies pB * 0.
When behavioral hazard is extreme, the neoclassical optimalcopay is exactly wrong: the situations in which the neoclassicalanalyst believes that copays should be really low are preciselythose situations where copays should be really high and
27. A somewhat more subtle point can be seen by focusing on the case wherebehavioral hazard is either systematically positive or negative, meaning that "ðs; "Þ(weakly) shares the same sign across ðs; "Þ. In this context, Proposition A.1 in OnlineAppendix A implies that optimal copays exceed the neoclassical optimal copay solong as some marginal individuals exhibit positive behavioral hazard, as in thiscase "avgðpÞ > 0, and is below the neoclassical optimal copay so long as some mar-ginal individuals exhibit negative behavioral hazard. Consider the case of positivebehavioral hazard. Increasing the copay by a small amount from p ¼ pN has thewelfare benefit of counteracting the behavioral hazard of some individuals, and thewelfare cost of raising the copay above the optimum for people who behave accord-ing to the standard model. This result says that the welfare benefit of counteractingbehavioral hazard wins out. The intuition, similar to that in O’Donoghue andRabin’s (2006) analysis of optimal sin taxes, is that since pN is the optimal copayfor standard agents, any small change from p ¼ pN only has a second-order cost ontheir welfare. On the other hand, since people with positive behavioral hazard areinefficiently using too much care at p ¼ pN , a small reduction in the amount of carethey receive has a first-order welfare benefit. Although the presence of people whobehave according to the standard model can affect the magnitude of the deviationbetween the optimal copay and the neoclassical optimum, it does not influence thedirection of this deviation.
QUARTERLY JOURNAL OF ECONOMICS1652
vice versa.28 In the case of very positive behavioral hazard,almost everybody gets treated at p & c, so the neoclassical ana-lyst thinks there is no benefit to controlling moral hazard butthere is an insurance value to reducing copays, suggesting tohim an optimal copay of at most 0. In reality, however, manypeople who demand treatment at p = c are inefficiently doing so,yielding a large benefit to controlling behavioral hazard by rais-ing the copay above cost. As long as people are not extremely riskaverse, a copay above cost is better than any copay below cost. Inthe case of very negative behavioral hazard, almost nobody getstreated at p & c, so the neoclassical analyst sees a huge benefit tocontrolling moral hazard since nobody appears to value the treat-ment as much as it costs. So long as people are not extremely riskaverse, the neoclassical analyst believes the copay should roughlyequal cost. In reality, however, even at a copay of 0, people at themargin of getting treated have a benefit above cost. There is nobenefit to controlling behavior by raising the copay above zero,but there is an insurance value cost, making the optimal copay atmost 0.
An immediate corollary of Proposition 5 is the following:
COROLLARY 1. Suppose U is strictly concave, bðs; !Þ ¼ s; "ðs; "Þ ¼~" 2 R8ðs; !; "Þ, and
~" ¼e with ex ante probability ) 2 ð0; 1Þ
"e with ex ante probability 1" ):
(
For sufficiently large e: pB - c or pB * 0, where (i) pB - c ifpN ¼ 0 (but not pN ¼ c) is a candidate for the neoclassicaloptimal copay and (ii) pB * 0 if pN ¼ c (but not pN ¼ 0) is acandidate for the neoclassical optimal copay.
This corollary essentially restates Proposition 5 to say thatwhen behavioral hazard is extreme, knowing that the neoclassi-cal analyst believes that the copay should be very low signals thatit should be very high and knowing that he believes the copay
28. Strict concavity matters for this result. With linear utility the neoclassicalanalyst believes pN ¼ c is a candidate for the optimal copay, independent of ~". Theassumption that bðs; !Þ ¼ s simplifies matters by guaranteeing that there is alwaysa nonnegative candidate for the neoclassical optimal copay because it implies that azero copay (rather than a negative one) maximizes insurance value when all thesick are treated.
BEHAVIORAL HAZARD IN HEALTH INSURANCE 1653
should be very high signals that it should be very low. For exam-ple, when the neoclassical optimal copay is 0, that is, full insur-ance, the optimal copay is above c, that is, no insurance.29
For a numerical illustration, take the case where utility isquadratic, s is uniformly distributed, getting treated returns aperson to full health, and the degree of behavioral hazard is con-stant across the population. Table 4 details a resulting calcula-tion for parameter values described in the notes. This examplehighlights several points. First, pB > pN whenever behavioralhazard is positive, and pB < pN whenever behavioral hazard isnegative. Second, the optimal copay pB is increasing in ~". Third,the neo-classical optimal copay pN is instead decreasing in ~".Fourth, and as a result of the fact that pB and pN move in oppositedirections as ~" moves away from 0, the deviation between pB andpN can be huge.30
These results illustrate that setting copays under theassumption that the demand response signals the degree ofmoral hazard leads to very wrong policy conclusions when beha-vioral hazard is extreme. The example of Choudhry et al. (2011)on eliminating copays for recent heart attack victims
29. We can also see that when behavioral hazard is extreme, there is always acandidate for the neoclassical optimal copay satisfying jpB " pN j - c: the degree towhich the optimal copay can vary in response to behavioral hazard is larger thanthe degree to which the neoclassical optimal copay can vary in response to morestandard considerations, like the elasticity of demand or the degree of risk aversion.Indeed, without behavioral hazard, the optimal copay always lies in ½0; c' under theassumption that bðs; !Þ ¼ s.
30. The case where ~" ¼ 99 provides an illustrative example of the last point.This is a situation where there is a lot of overuse due to behavioral hazard, andpatients are reasonably risk averse. The analyst who looks for behavioral hazardwill understand that copays should be really high to counteract overuse due tobehavioral hazard: pB ¼ 197:92, which is well above the cost of treatment,c = 100. The neoclassical analyst who believes that everybody accurately tradesoff costs and benefits in making treatment decisions will observe that everybodygets treated when the price is less than or equal to 99 and half the population getstreated when the price is 299
2 . Since the cost of treatment is c = 100, it looks to theanalyst like there is very little benefit to controlling moral hazard: almost every-body seems to value the treatment at more than its cost, and the extremely smallfraction who do not still seem to value the treatment at 99 percent of its cost. On theother hand, since people are risk averse, there is a benefit to reducing copays. Infact, the marginal insurance benefit appears to exceed the marginal moral hazardcost at a copay of 99. Furthermore, since the marginal moral hazard cost is zero atall lower copays (everybody is already getting treated), the neoclassical analystbelieves the copay should go all the way down to zero when in fact optimally itshould be almost double the cost!
QUARTERLY JOURNAL OF ECONOMICS1654
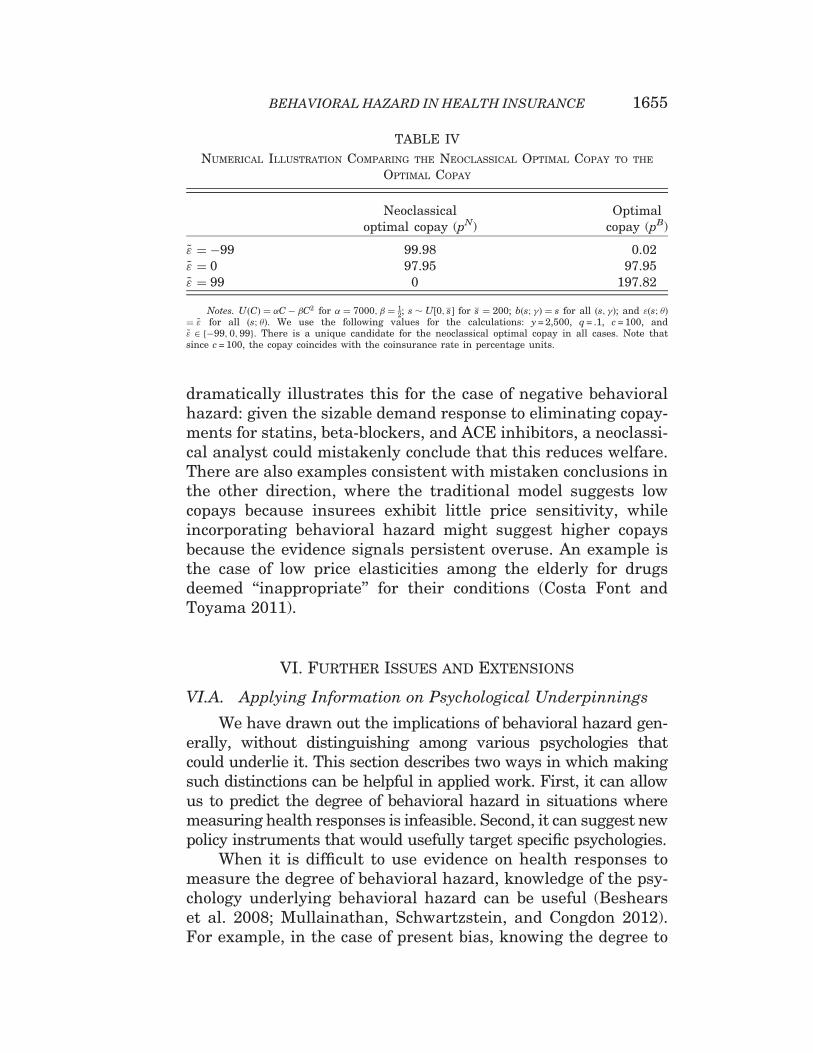
dramatically illustrates this for the case of negative behavioralhazard: given the sizable demand response to eliminating copay-ments for statins, beta-blockers, and ACE inhibitors, a neoclassi-cal analyst could mistakenly conclude that this reduces welfare.There are also examples consistent with mistaken conclusions inthe other direction, where the traditional model suggests lowcopays because insurees exhibit little price sensitivity, whileincorporating behavioral hazard might suggest higher copaysbecause the evidence signals persistent overuse. An example isthe case of low price elasticities among the elderly for drugsdeemed ‘‘inappropriate’’ for their conditions (Costa Font andToyama 2011).
VI. Further Issues and Extensions
VI.A. Applying Information on Psychological Underpinnings
We have drawn out the implications of behavioral hazard gen-erally, without distinguishing among various psychologies thatcould underlie it. This section describes two ways in which makingsuch distinctions can be helpful in applied work. First, it can allowus to predict the degree of behavioral hazard in situations wheremeasuring health responses is infeasible. Second, it can suggest newpolicy instruments that would usefully target specific psychologies.
When it is difficult to use evidence on health responses tomeasure the degree of behavioral hazard, knowledge of the psy-chology underlying behavioral hazard can be useful (Beshearset al. 2008; Mullainathan, Schwartzstein, and Congdon 2012).For example, in the case of present bias, knowing the degree to
TABLE IV
NUMERICAL ILLUSTRATION COMPARING THE NEOCLASSICAL OPTIMAL COPAY TO THE
OPTIMAL COPAY
Neoclassicaloptimal copay (pN)
Optimalcopay (pB)
~" ¼ "99 99.98 0.02~" ¼ 0 97.95 97.95~" ¼ 99 0 197.82
Notes. UðCÞ ¼ %C" #C2 for % ¼ 7000; # ¼ 12; s $ U½0; s ' for s ¼ 200; bðs; !Þ ¼ s for all ðs; !Þ; and "ðs; "Þ
¼ ~" for all ðs; "Þ. We use the following values for the calculations: y = 2,500, q = .1, c = 100, and~" 2 "99; 0;99f g. There is a unique candidate for the neoclassical optimal copay in all cases. Note thatsince c = 100, the copay coincides with the coinsurance rate in percentage units.
BEHAVIORAL HAZARD IN HEALTH INSURANCE 1655
which treatment benefits or costs are delayed can predict beha-vioral hazard and thereby suggest which treatments should havehigher or lower copays. Gruber and Koszegi (2001) follow this sortof approach in estimating the marginal internality for the case ofcigarette purchase decisions.
Identifying the specific psychologies can also motivate theuse of nonfinancial instruments or nudges to change behavior(Thaler and Sunstein 2008). There is substantial evidence, forexample, that reminders or framing can affect utilization(Schroeder, Fahey, and Ebrahim 2004; Schedlbauer, Davies,and Fahey 2010; Strandbygaard, Thomsen, and Backer 2010;Long et al. 2012).31 To incorporate such instruments into theframework, suppose there is a set N of nudges available to theinsurer, where a nudge is modeled as affecting demand throughinfluencing the behavioral error ", so for n 2 N , we have" ¼ "nðs; "Þ. The direct cost to the insurer of nudge n is ðnÞ - 0,where we suppose there is a ‘‘default nudge’’ n ¼ 0 2 N with ð0Þ ¼ 0. So far we have implicitly assumed that the insurersets the default nudge and have notationally suppressed the rela-tionship between the nudge and the behavioral error.
We can sometimes use responses to nudges to measure themagnitude of behavioral hazard, though we have to be careful inour interpretation. It is tempting to say that responses to remin-ders, for example, reveal the extent of inattention. But asBordalo, Gennaioli, and Shleifer (2015) point out, this inferencemay not be valid because people may overreact to such nudges.Nudges can be a useful tool for calibrating the degree of beha-vioral hazard when we have a precise sense for how nudges affectthe error—that is, how "n varies in n. Proposition A.2 in OnlineAppendix A describes conditions under which the degree of mar-ginal behavioral hazard can be calibrated by comparing thedemand response to nudges to the demand response to prices.32
31. To illustrate, Schedlbauer, Davies, and Fahey (2010) find that nudges focus-ing on reminders and reinforcements were particularly promising ways to improvestatin adherence, with four out of six trials reviewed producing significantincreases in adherence ranging from 6 to 24 percentage points. Similarly, simplify-ing the dosing schedules for blood pressure medication can lead to a 10-20 percentincrease in adherence (Schroeder et al. 2004).
32. Chetty, Looney, and Kroft (2009) similarly describe conditions under whichthe marginal internality resulting from inattention to nonsalient taxes can berecovered by comparing the demand response to taxes to the demand response toprices.
QUARTERLY JOURNAL OF ECONOMICS1656

Heuristically, if we find that a nudge believed to lead to betterdecisions increases demand for treatment more than a $ddecrease in the copay, that suggests that agents are undervaluingtreatment by at least $d at the margin.33 Relatedly, if we haveinformation that some people are likely more biased than others,we could in principle bound the degree of behavioral hazard bycomparing the demand curves of the more and less biasedgroups.34
It is difficult to perform this exercise rigorously with existingdata because few studies estimate the impact of nudges andcopays simultaneously. However, the limited evidence on theeffects of nudges on adherence suggests that behavioral hazardcan be significant. For example, Long et al. (2012) compare peermentoring and financial incentives to improve glucose controlamong African American veterans. While they did not measureimpacts on drug adherence, they find that a peer mentoring pro-gram improved blood sugar control more than a $100–$200 incen-tive did, which is suggestive of negative behavioral hazard. (Alsosee Online Appendix C for evidence on the impact of nudges onhypertension.)
Nudges are also potentially useful policy tools for counter-acting behavioral hazard when we know that they are reducingerrors overall, since they can target behavioral hazard betterthan copays can. For example, if some fraction of the populationexhibits negative behavioral hazard under the default nudge,"0ðs; "Þ < 08s, while some fraction acts unbiased, then theredoes not exist a copay that leads to first-best utilization: whilep = c leads to first-best utilization for the unbiased, it leads to
33. It is not only important that the analyst have prior knowledge that thenudge leads to better decisions, but also that the nudge influences demand byimpacting ". To illustrate, suppose people forget to demand treatment with someprobability ' that may be dependent on nudges (e.g., reminders) but is independentof prices. If there are no other biases, then the marginal degree of behavioral hazardwith respect to the price lever is zero, since anybody who is marginal with respect toprice is remembering and making an accurate cost-benefit calculation. However,we may still see a sizable demand response to reminders. So in this case, we cannotinfer the marginal degree of behavioral hazard by comparing nudge and demandresponses. Allcott and Taubinsky (2014) make a related point that analyzing thedemand response to nudges can give a misleading impression of the average mar-ginal bias under certain forms of heterogeneity in the bias across the population.
34. This is reminiscent of the empirical strategies of Bronnenberg et al. (2015)and Handel and Kolstad (2015) who compare the demand curves (e.g., for brandeddrugs) of ‘‘experts’’ (e.g., pharmacists) to ‘‘nonexperts’’ (e.g., average consumers).
BEHAVIORAL HAZARD IN HEALTH INSURANCE 1657
underuse among those with negative behavioral hazard.Similarly, although some p< c may lead to efficient utilizationin the population with negative behavioral hazard, it leads tooveruse among the unbiased. On the other hand, if there is a‘‘perfectly de-biasing nudge’’ n. that eliminates behavioralhazard, "n. ðs; "Þ ¼ 08ðs; "Þ, then using that nudge leads to first-best utilization when p = c.35 Of course, it is implausible that aperfectly debiasing nudge exists, and it is unclear how effectivemany nudges are at reducing behavioral hazard. Studying theoptimal mix of nudges and copays in the design of health insur-ance, taking such uncertainty into account, is an interesting topicfor future research.
VI.B. Incorporating Testing Decisions
The existence of behavioral hazard can have system-levelripple effects, particularly if early utilization, such as diagnostictesting, has cascade effects for downstream care. In the tradi-tional model, the additional information yielded by low-costtests should only improve patient welfare, but with behavioralhazard, subsequent misbehavior can add large costs. Webriefly extend the model to allow for a testing stage that revealss, and suppose the person gets treated only if he is tested.To illustrate through a specific example, further suppose thatU 00 ¼ 0; s $ U½0; 1', c = 3
4, and " ¼ 34 for everybody. Without test-
ing, nobody gets treated and welfare is E½"s' ¼ " 12 q. With test-
ing, everybody gets treated if p* c, and welfare equals" 3
4 q < " 12 q. So tests have a substantially negative return if
behavioral hazard is uncontrolled (p ¼ pN ¼ c) and it is betternot to test: the return on testing equals ð" 3
4 " ð"12 ÞÞq ¼ ð"
14Þ , q.
But if behavioral hazard is perfectly counteracted (say, in thisexample, with copay pB ¼ cþ "), then tests would have a positivereturn: the return on testing is then ð" 15
32 " ð"12 ÞÞ , q ¼ ð
132Þ , q. So
taking health responses into account in setting copays for treat-ment decisions can be doubly beneficial: not only does it lead to
35. It is temptingtosupposethatnudging inawaythateliminateserrorsisalwaysoptimal when such nudging is possible and does not have direct costs. However, whenpeople are risk averse, then such debiasing can undermine broader social welfare incases when it increases demand and, with it, the moral hazard cost of insurance(Mullainathan, Schwartzstein, and Congdon 2012; Pauly and Blavin 2008).
QUARTERLY JOURNAL OF ECONOMICS1658
better decisions at the treatment stage, it can feed back to betterpolicy at the testing stage.
The medical community has designed testing guidelinesthat implicitly acknowledge the imperfections in the downstreamdecision making of patients and physicians alike. The ‘‘ChoosingWisely’’ initiative launched by internal medicine physiciansmakes blanket recommendations against some commonscreenings and tests, not because the tests themselves are cost-ineffective conditional on optimal downstream care, but explicitlybecause of the probability of downstream care that is likely toharm patient health but is delivered nonetheless (Morden et al.2014). These tests yield useful information that should be actedon for a subset of identifiable patients, but many other patientsend up receiving care (whether because of the disutility of ‘‘doingnothing’’ or mistaken beliefs about efficacy) that is at best uselessand at worst harmful, making the expected value of performingthe test negative.36 This downstream suboptimal care is of coursethe product of both patient and physician decision making, andthere may be ample parallel opportunity to redesign physicianincentives to take into account the psychology of their decisionmaking (as well as train them to help take into account the beha-vioral decision making of their patients).37
VI.C. Analyzing What the Market Will Provide
Given the welfare benefits of counteracting behavioralhazard, one question is why existing plans do not seem to do so.As shown in Online Appendix Table 2, typical health insuranceplans have a copay structure that varies little within broad cate-gories of treatments (e.g., physician office visits, inpatient ser-vices, branded drugs, generic drugs), while counteractingbehavioral hazard requires a more nuanced structure wherecopayments are a function of the health benefit associatedwith the care for a particular patient. In an earlier version ofthis article (Baicker, Mullainathan, and Schwartzstein 2013)we extend the model to consider what a competitive market will
36. Ding, Eisenberg, and Pandharipande (2011) and others have also calculatedthe economic costs associated with ‘‘incidental’’ findings —abnormalities detectedin asymptomatic patients in the course of a separate evaluation.
37. One study found, for example, that physicians’ propensity to prescribe con-traindicated antibiotics for their patients rose over the duration of their shift—apattern attributed to physicians’ diminishing capacity to resist patient requests forprescriptions (Linder et al. 2014).
BEHAVIORAL HAZARD IN HEALTH INSURANCE 1659
provide in equilibrium under the simplifying assumption of arepresentative insuree, which requires additional assumptionson the degree to which insurees are sophisticated about beha-vioral hazard. We show how even though optimal insurancecould reduce behavioral hazard, market-provided insurancemay not. If enrollees were sophisticated, perfectly predictingtheir behavioral hazard and insuring accordingly, then market-provided insurance would be optimally designed to counteractbehavioral hazard. But with naive enrollees, insurers have lessincentive to mitigate underuse since naive consumers will notfully value copays designed to counteract their biases.38 Theseproblems are especially severe when insurers have nudges aswell as copays available and when enrollees may be insuredwith them for limited time horizons (and thus insurers do notbear the full cost of current enrollees’ future health care use).In particular, if insurees do not appreciate the impact ofnudges, then we would expect the insurer to supply nudgesthat minimize costs rather than maximize surplus.
Thus, with naive insurees, insurers only have an incentive tocounteract biases when it saves them money. The gains fromreducing copays for diabetic medications, beta-blockers, andother care prone to negative behavioral hazard may not accrueto insurers, limiting their incentive to incorporate behavioralhazard into their copayment structures.39 For example,Beaulieu et al. (2006) estimate that investment in diabetes dis-ease management produces very small monetary gains for
38. Insurers will face some incentive to counteract negative behavioral hazardsince naive consumers overestimate their demand in this case, which creates somebenefit to reducing copays. But in general, negative behavioral hazard will not beefficiently managed in equilibrium. The discussion of market-provided insuranceconnects with the literature on behavioral contract theory and industrial organiza-tion. Ellison (2006) and Spiegler (2011) provide nice reviews of this literature.
39. Nevertheless, insurers could increase profits by promoting adherence tomedications and treatments that save money over a reasonably short horizon (rela-tive to the typical tenure of their enrollees), and the model suggests that insurerswill invest in encouraging care in such instances. For example, flu shots are oftengiven for free and at enrollees’ convenience. Perhaps for a similar reason, insurersare also funding research into promoting adherence to certain treatments (Belluck2010) and in-house programs aimed at improving adherence, such as Humana’sRxMentor or United’s Refill and Save programs. Aetna’s tracking suggests that itsprogram targeting chronic disease patients has improved adherence (Sipkoff 2009).FICO, known for its widely purchased credit score, is now even selling medicationadherence scores to insurers, intended to predict how likely patients are to adhere(Parker-Pope 2011).
QUARTERLY JOURNAL OF ECONOMICS1660
insurers over a 10-year horizon, but would produce $30,000 perpatient in improved quality of life and longevity.40 The potentialfor market failure suggests that government interventions maybe welfare-improving over market outcomes even in the absenceof selection or externalities.41 An important direction for futurework is to develop a better understanding of how sophisticatedconsumers are about their own behavioral hazard, and howthe government could intervene to help counteract behavioralhazard.
VII. Discussion
There is ample evidence that moral hazard alone cannotexplain the patterns of misutilization observed throughout thehealth care system. We build a framework for analyzing the rela-tionship between insurance coverage and health care consump-tion that includes behavioral hazard. With only moral hazard,lowering copays increases the insurance value of a plan butreduces its efficiency by generating overuse. With the additionof behavioral hazard, lowering copays may potentially bothincrease insurance value and increase efficiency by reducingunderuse. Having an estimate of the demand response is nolonger enough to set optimal copays; the health response needsto be considered as well. This provides a theoretical foundationfor value-based insurance design, where copays should be lowerboth when price changes have small effects on demand and whenthey have large effects on health. Ignoring behavioral hazard can
40. Additionally, although it could be efficient to provide negative prices (sub-sidies) to use high-value care (Volpp et al. 2009), practical considerations may makethis infeasible. Current regulatory restrictions may also limit the ability of insurersto counteract behavioral hazard. For example, there are limits to the ability ofinsurers to offer plans with different copayments for the same drug to differentpatients, or for plans operating within Medicare to offer negative prices (cashincentives) to enrollees. As noted already, such plans might also be more complex.
41. We abstract from ex ante heterogeneity among consumers and issues ofselection. Of course, adverse selection provides a rationale for government inter-vention even in the standard model. Sandroni and Squintani (2007, 2013), Jelevaand Villeneuve (2004), and Spinnewijn (2013, 2014) explore how ex ante hetero-geneity in risk perceptions or overconfidence alter equilibrium insurance contracts,the relationship between risk and insurance coverage, and the welfare impact ofvarious government policies, for example, insurance mandates.
BEHAVIORAL HAZARD IN HEALTH INSURANCE 1661
lead to welfare estimates that are both wrong in sign and off by anorder of magnitude.
The finding that optimal insurance features depend cruciallyon how prices affect both demand and health highlights the valueof having empirical estimates of both responses (see also Lee et al.2013). There are limited data linking insurance to clinicaloutcomes—and performing an exhaustive list of experimentsand calculations would certainly be daunting—but a smallnumber of conditions account for a large share of health spending.Patients with circulatory system conditions like high blood pres-sure and high cholesterol are responsible for 17 percent of totalhealth care spending; mental health conditions like depressionfor another 9 percent; respiratory conditions like asthma another6 percent; and endocrine conditions like diabetes another 4 per-cent (Roehrig et al. 2009). Studies that link changes in price,demand, and health would thus be particularly valuable—and alimited number could go a long way.42
This framework is amenable to a number of extensions.While our model is static, it could be extended to consider howbehavioral hazard affects optimal copays for preventive care,where initial underuse could generate expensive future overuse.Further exploration of consumer sophistication and intertem-poral incentives for insurers may help explain insurance offeringsand the potential role of public policy. Work could also draw
42. Even absent such multistep evidence, however, we can make some back-of-the-envelope estimates of the potential benefits of optimal copayment design in amodel with both moral hazard and behavioral hazard from the literature that looksat particular steps in this chain. This requires applying results from one particularstep (e.g., the effect of a copay change on one measure of adherence, such as refillingprescriptions) generated from a particular marginal population to the next step(e.g., the effect of a different measure of adherence, such as missed pills, on heartattacks) generated in a different setting with a different population, over a differenttime frame, and so on. Online Appendix C provides a very stylized example usingthe case study of treatment for high blood pressure. High blood pressure afflicts 68million adults in the United States (CDC 2011) and is an important driver of overallhealth care costs. Using existing estimates, we show that small reductions in copaysincrease compliance with antihypertensive therapy and that better compliancegenerates substantial health gains. This implies a large net return on the marginalsocial dollar spent on improving blood-pressure medication adherence andsuggeststhat the failure of existing plans to address behavioral hazard could be generatinglarge welfare costs. Rosen et al. (2005) perform a similar exercise to predict the cost-effectiveness of first-dollar coverage of ACE inhibitors for Medicare beneficiarieswith diabetes.
QUARTERLY JOURNAL OF ECONOMICS1662
out more nuanced implications for the use of nudges versuscopayments. Although we highlight that the main results donot depend on the underlying psychological forces generatingbehavioral hazard, greater understanding of those forces couldhelp in estimating the degree of behavioral hazard in differentsettings and inform the optimal design of nudges. Finally, physi-cians are important drivers of the health care that is ultimatelydelivered, and, like patients, their choices are driven by bothfinancial incentives and behavioral biases; future work could ana-lyze the interplay of these channels.
Failing to incorporate behavioral hazard into models ofhealth insurance not only generates very wrong answers butvery wrong answers with substantial import for millions ofpeople. Much of our health spending is on care that is sensitiveto copay changes, and much of that care seems to have an impacton health that differs from that implied by moral hazard alone.Simply assuming that the demand curve reveals the health valueof care can generate misleading policy prescriptions; incorporat-ing both moral hazard and behavioral hazard can inform insur-ance designs that better balance insurance protection withefficient resource use.
Harvard UniversityHarvard UniversityHarvard Business School
Supplementary Material
An Online Appendix for this article can be found at QJEonline (qje.oxfordjournal.org).
References
Allcott, Hunt, and Dmitry Taubinsky, ‘‘The Lightbulb Paradox: Evidence fromTwo Randomized Experiments,’’ Working Paper, NYU, 2014.
Aron-Dine, Aviva, Liran Einav, and Amy Finkelstein, ‘‘The RAND HealthInsurance Experiment, Three Decades Later,’’ Journal of EconomicPerspectives, 27 (2013), 197–222.
Arrow, Kenneth J., ‘‘Uncertainty and the Welfare Economics of Medical Care,’’American Economic Review, 53 (1963), 941–973.
Baicker, Katherine, Sendhil Mullainathan, and Joshua Schwartzstein, ‘‘BehavioralHazard in Health Insurance,’’ NBER Working Paper w18468, 2013.
Bailey, C. J., and Michael Kodack, ‘‘Patient Adherence to MedicationRequirements for Therapy of Type 2 Diabetes,’’ International Journal ofClinical Practice, 65 (2011), 314–322.
Beaulieu, Nancy, David M. Cutler, Katherine Ho, George Isham,Tammie Lindquist, Andrew Nelson, and Patrick O’Connor, ‘‘The BusinessCase for Diabetes Disease Management for Managed Care Organizations,’’
BEHAVIORAL HAZARD IN HEALTH INSURANCE 1663

in Frontiers in Health Policy Research, vol. 9, David M. Cutler andAlan Garber, eds. (Cambridge, MA: NBER Books, 2006).
Belluck, Pam, ‘‘For Forgetful, Cash Helps the Medicine Go Down,’’ New YorkTimes, June 13, 2010.
Bernheim, B. Douglas, and Antonio Rangel, ‘‘Beyond Revealed Preference:Choice-Theoretic Foundations for Behavioral Welfare Economics,’’Quarterly Journal of Economics, 124 (2009), 51–104.
Beshears, John, James J. Choi, David Laibson, and Brigitte C. Madrian, ‘‘How ArePreferences Revealed?,’’ Journal of Public Economics, 92 (2008), 1787–1794.
Bordalo, Pedro, Nicola Gennaioli, and Andrei Shleifer, ‘‘Salience Theory of Choiceunder Risk,’’ Quarterly Journal of Economics, 127 (2012), 1243–1285.
———, ‘‘Salience and Consumer Choice,’’ Journal of Political Economy, 121(2013), 803–843.
———, ‘‘Memory, Attention, and Choice,’’ Mimeo, Harvard University, 2015.Bronnenberg, Bart J., Jean-Pierre Dube, Matthew Genzkow, and Jesse
M. Shapiro, ‘‘Do Pharmacists Buy Bayer? Informed Shoppers and theBrand Premium,’’ Quarterly Journal of Economics, 130 (2015) (this issue).
CDC, ‘‘High Blood Pressure and Cholesterol,’’ National Center for ChronicDisease Prevention and Health Promotion, 2011.
Chambers, Christopher P., and Paul J. Healy, ‘‘Updating toward the Signal,’’Economic Theory, 50 (2012), 765–786.
Chandra, Amitabh, Jonathan Gruber, and Robin McKnight, ‘‘Patient Cost-Sharing and Hospitalization Offsets in the Elderly,’’ American EconomicReview, 100 (2010), 193–213.
Chernew, Michael E., Allison B. Rosen, and A. Mark Fendrick, ‘‘Value-BasedInsurance Design,’’ Health Affairs, 26 (2007), w195–w203.
Chetty, Raj, ‘‘The Simple Economics of Salience and Taxation,’’ Mimeo, HarvardUniversity, 2009a.
———, ‘‘Sufficient Statistics for Welfare Analysis: A Bridge between Structuraland Reduced-Form Methods,’’ Annual Review of Economics, 1 (2009b), 451–488.
Chetty, Raj, Adam Looney, and Kory Kroft, ‘‘Salience and Taxation: Theory andEvidence,’’ American Economic Review, 99 (2009), 1145–1177.
Choudhry, Niteesh K., Jerry Avorn, Robert J. Glynn, Elliott M. Antman,Sebastian Schneeweiss, Michele Toscano, Lonny Reisman,Joaquim Fernandes, Claire Spettell, Joy L. Lee, Raisa Levin,Troyen Brennan, and William H. Shrank, ‘‘Full Coverage for PreventiveMedications after Myocardial Infarction,’’ New England Journal ofMedicine, 365 (2011), 2088–2097.
Costa Font, Joan, and Marin Gemmill Toyama, ‘‘Does Cost Sharing Really ReduceInappropriate Prescriptions among the Elderly?’’ Health Policy, 101 (2011),195–208.
Cutler, David M., and Richard J. Zeckhauser, ‘‘The Anatomy of HealthInsurance,’’ Handbook of Health Economics, 1 (2000), 563–643.
DellaVigna, Stefano, ‘‘Psychology and Economics: Evidence from the Field,’’Journal of Economic Literature, 47 (2009), 315–372.
DellaVigna, Stefano, and Ulrike Malmendier, ‘‘Contract Design and Self-Control: Theory and Evidence,’’ Quarterly Journal of Economics, 119(2004), 353–402.
Denberg, Thomas D., Trisha V. Melhado, John M. Coombes, Brenda L. Beaty,Kenneth Berman, Tim E. Byers, Alfred C. Marcus, John F. Steiner, andDennis J. Ahnen, ‘‘Predictors of Nonadherence to Screening Colonoscopy,’’Journal of General Internal Medicine, 20 (2005), 989–995.
DiMatteo, M. Robin, ‘‘Variations in Patients’ Adherence to MedicalRecommendations: A Quantitative Review of 50 Years of Research,’’Medical Care, 42 (2004), 200–209.
Ding, Alexander, Jonathan D. Eisenberg, and Pari V. Pandharipande, ‘‘TheEconomic Burden of Incidentally Detected Findings,’’ Radiologic Clinics ofNorth America, 49 (2011), 257–265.
Einav, Liran, Amy Finkelstein, and Heidi Williams, ‘‘Paying on the Margin forMedical Care: Evidence from Breast Cancer Treatments,’’ Mimeo, MIT, 2015.
QUARTERLY JOURNAL OF ECONOMICS1664

Ellis, Randall P., and Willard G. Manning, ‘‘Optimal Health Insurance forPrevention and Treatment,’’ Journal of Health Economics, 26 (2007), 1128–1150.
Ellison, Glenn, ‘‘Bounded Rationality in Industrial Organization,’’ Advances inEconomic and Econometrics: Theory and Applications, WhitneyNewey, Richard Blundell, and Tortsen Persson, eds. (Cambridge:Cambridge University Press, 2006).
Feldman, Roger, and Bryan Dowd, ‘‘A New Estimate of the Welfare Loss of ExcessHealth Insurance,’’ American Economic Review, 81 (1991), 297–301.
Feldstein, Martin S., ‘‘The Welfare Loss of Excess Health Insurance,’’ Journal ofPolitical Economy, 81 (1973), 251–280.
Finkelstein, Amy, Moral Hazard in Health Insurance (New York: ColumbiaUniversity Press, 2014).
Frank, Richard G., ‘‘Behavioral Economics and Health Economics,’’ NBERWorking Paper, 2004.
Gann, Carrie, ‘‘Man Dies from Toothache, Couldn’t Afford Meds,’’ ABC News,September 2, 2011.
Gao, Xin, D. P. Nau, S. A. Rosenbluth, V. Scott, and C. Woodward, ‘‘TheRelationship of Disease Severity, Health Beliefs and Medication Adherenceamong HIV Patients,’’ AIDS Care, 12 (2000), 387–398.
Glazer, Jacob, and Thomas G. McGuire, ‘‘A Welfare Measure of ‘Offset Effects’ inHealth Insurance,’’ Journal of Public Economics, 96 (2012), 520–523.
Goldman, Dana P., Geoffrey F. Joyce, Jose J. Escarce, Jennifer E. Pace, MatthewD. Solomon, Marianne Laouri, Pamela B. Landsman, and Steven M. Teutsch,‘‘Pharmacy Benefits and the Use of Drugs by the Chronically Ill,’’ Journal ofthe American Medical Association, 291 (2004), 2344–2350.
Goldman, Dana P., Geoffrey F. Joyce, and Pinar Karaca-Mandic, ‘‘VaryingPharmacy Benefits with Clinical Status: The Case of Cholesterol-LoweringTherapy,’’ American Journal of Managed Care, 12 (2006), 21–28.
Goldman, Dana P., and Tomas J. Philipson, ‘‘Integrated Insurance Design in thePresence of Multiple Medical Technologies,’’ American Economic Review, 97(2007), 427–432.
Gonzales, Ralph, Daniel C. Malone, Judith H. Maselli, and Merle A. Sande,‘‘Excessive Antibiotic Use for Acute Respiratory Infections in the UnitedStates,’’ Clinical Infectious Diseases, 33 (2001), 757–762.
Gruber, Jonathan, and Botond Koszegi, ‘‘Is Addiction ‘Rational’? Theory andEvidence,’’ Quarterly Journal of Economics, 116 (2001), 1261–1303.
Handel, Benjamin R., and Jonathan T. Kolstad, ‘‘Health Insurance for ‘Humans’:Information Frictions, Plan Choice, and Consumer Welfare,’’ AmericanEconomic Review, 105 (2015), 2449–2500.
Hsu, John, Mary Price, Jie Huang, Richard Brand, Vicki Fung, Rita Hui,Bruce Fireman, Joseph P. Newhouse, and Joseph V. Selby, ‘‘UnintendedConsequences of Caps on Medicare Drug Benefits,’’ New England Journalof Medicine, 354 (2006), 2349–2359.
Jeleva, Meglena, and Bertrand Villeneuve, ‘‘Insurance Contracts with ImpreciseProbabilities and Adverse Selection,’’ Economic Theory, 23 (2004), 777–794.
Johnson, Richard E., Michael J. Goodman, Mark C. Hornbrook, and MichaelB. Eldredge, ‘‘The Impact of Increasing Patient Prescription Drug CostSharing on Therapeutic Classes of Drugs Received and on the HealthStatus of Elderly HMO Members,’’ Health Services Research, 32 (1997),103–122.
Kahneman, Daniel, Peter P. Wakker, and Rakesh Sarin, ‘‘Back to Bentham?Explorations of Experienced Utility,’’ Quarterly Journal of Economics, 112(1997), 375–405.
Koszegi, Botond, ‘‘Health Anxiety and Patient Behavior,’’ Journal of HealthEconomics, 22 (2003), 1073–1084.
Koszegi, Botond, and Adam Szeidl, ‘‘A Model of Focusing in Economic Choice,’’Quarterly Journal of Economics, 128 (2012), 53–104.
Laibson, David, ‘‘Golden Eggs and Hyperbolic Discounting,’’ Quarterly Journal ofEconomics, 112 (1997), 443–477.
Lakdawalla, Darius, and Neeraj Sood, ‘‘Innovation and the Welfare Effects ofPublic Drug Insurance,’’ Journal of Public Economics, 93 (2009), 541–548.
BEHAVIORAL HAZARD IN HEALTH INSURANCE 1665

Lee, Joy L., Matthew L. Maciejewski, Shveta S. Raju, William H. Shrank, andNiteesh K. Choudhry, ‘‘Value-Based Insurance Design: Quality Improvementbut No Cost Savings,’’ Health Affairs, 32 (2013), 1251–1257.
Liebman, Jeffrey, and Richard Zeckhauser, ‘‘Simple Humans, ComplexInsurance, Subtle Subsidies,’’ Mimeo, Harvard University, 2008.
Linder, Jeffrey A., Jason N. Doctor, Mark W. Friedberg, Harry Reyes Nieva,Caroline Birks, Daniella Meeker, and Craig R. Fox, ‘‘Time of Day and theDecision to Prescribe Antibiotics,’’ JAMA Internal Medicine, 174 (2014),2029–2031.
Lohr, Kathleen N., Robert H. Brook, Caren J. Kamberg, George A. Goldberg,Arleen Leibowitz, Joan Keesey, David Reboussin, and Joseph P. Newhouse,‘‘Use of Medical Care in the RAND Health Insurance Experiment: Diagnosis-and Service-Specific Analyses in a Randomized Controlled Trial,’’ MedicalCare, 24 (1986), S1–S87.
Long, Judith A., Erica C. Jahnle, Diane M. Richardson, George Loewenstein, andKevin G. Volpp, ‘‘Peer Mentoring and Financial Incentives to ImproveGlucose Control in African American Veterans: A Randomized Trial,’’Annals of Internal Medicine, 156 (2012), 416–424.
Manning, Willard G., Joseph P. Newhouse, Naihua Duan, Emmett B. Keeler, andArleen Leibowitz, ‘‘Health Insurance and the Demand for Medical Care:Evidence from a Randomized Experiment,’’ American Economic Review, 77(1987), 251–277.
McGlynn, Elizabeth A., Steven M. Asch, John Adams, Joan Keesey,Jennifer Hicks, Alison DeCristofaro, and Eve A. Kerr, ‘‘The Quality ofHealth Care Delivered to Adults in the United States,’’ New EnglandJournal of Medicine, 348 (2003), 2635–2645.
Morden, Nancy E., Carrie H. Colla, Thomas D. Sequist, and MeredithB. Rosenthal, ‘‘Choosing Wisely—The Politics and Economics of LabelingLow-Value Services,’’ New England Journal of Medicine, 370 (2014), 589–592.
Mullainathan, Sendhil, Joshua Schwartzstein, and William J. Congdon, ‘‘AReduced-Form Approach to Behavioral Public Finance,’’ Annual Review ofEconomics, 4 (2012), 511–540.
Ness, Reid M., Ann M. Holmes, Robert Klein, and Robert Dittus, ‘‘Cost-Utility ofOne-Time Colonoscopic Screening for Colorectal Cancer at Various Ages,’’American Journal of Gastroenterology, 95 (2000), 1800–1811.
Newhouse, Joseph P., Free for All? Lessons from the RAND Health InsuranceExperiment (Cambridge, MA: Harvard University Press, 1993).
———, ‘‘Reconsidering the Moral Hazard-Risk Avoidance Tradeoff,’’ Journal ofHealth Economics, 25 (2006), 1005–1014.
Nyman, John A. ‘‘The Value of Health Insurance: The Access Motive,’’ Journal ofHealth Economics, 18 (1999), 141–152.
O’Donoghue, Ted, and Matthew Rabin, ‘‘Doing It Now or Later,’’ AmericanEconomic Review, 89 (1999), 103–124.
———, ‘‘Optimal Sin Taxes,’’ Journal of Public Economics, 90 (2006), 1825–1849.Osterberg, Lars, and Terrence Blaschke, ‘‘Adherence to Medication,’’ New
England Journal of Medicine, 353 (2005), 487–497.Parker-Pope, Tara, ‘‘Keeping Score on How You Take Your Medicine,’’ New York
Times, June 20, 2011.Pauly, Mark V., ‘‘The Economics of Moral Hazard: Comment,’’ American
Economic Review, 58 (1968), 531–537.Pauly, Mark V., and Fredric E. Blavin, ‘‘Moral Hazard in Insurance, Value-Based
Cost Sharing, and the Benefits of Blissful Ignorance,’’ Journal of HealthEconomics, 27 (2008), 1407–1417.
Roehrig, Charles, George Miller, Craig Lake, and Jenny Bryant, ‘‘National HealthSpending by Medical Condition, 1996–2005,’’ Health Affairs, 28 (2009),w358–w367.
Rosen, Allison B., Mary Beth Hamel, Milton C. Weinstein, David M. Cutler, A.Mark Fendrick, and Sandeep Vijan, ‘‘Cost-Effectiveness of Full MedicareCoverage of Angiotensin-Converting Enzyme Inhibitors for Beneficiarieswith Diabetes,’’ Annals of Internal Medicine, 143 (2005), 89–99.
QUARTERLY JOURNAL OF ECONOMICS1666

Rubin, Richard R., ‘‘Adherence to Pharmacologic Therapy in Patients with Type 2Diabetes Mellitus,’’ American Journal of Medicine, 118 (2005), 27–34.
Sandroni, Alvaro, and Francesco Squintani, ‘‘Overconfidence, Insurance, andPaternalism,’’ American Economic Review, 97 (2007), 1994–2004.
———, ‘‘Overconfidence and Asymmetric Information: The Case of Insurance,’’Journal of Economic Behavior & Organization, 93 (2013), 149–165.
Schedlbauer, Angela, Philippa Davies, and Tom Fahey, ‘‘Interventions to ImproveAdherence to Lipid Lowering Medication,’’ Cochrane Heart Group, 2010.
Schroeder, Knut, Tom Fahey, and Shah Ebrahim, ‘‘How Can We ImproveAdherence to Blood Pressure-Lowering Medication in Ambulatory Care?Systematic Review of Randomized Controlled Trials,’’ Archives of InternalMedicine, 164 (2004), 722–732.
Schwartz, Aaron L., Bruce E. Landon, Adam G. Elshaug, Michael E. Chernew,and J. Michael McWilliams, ‘‘Measuring Low-Value Care in Medicare,’’JAMA Internal Medicine, 174 (2014), 1067–1076.
Selby, Joe V., Bruce H. Fireman, and Bix E. Swain, ‘‘Effect of a Copayment on Useof the Emergency Department in a Health Maintenance Organization,’’ NewEngland Journal of Medicine, 334 (1996), 635–642.
Sipkoff, Martin, ‘‘Improved Adherence Highlights Specialty Pharmacy’sPotential,’’ Managed Care, 18 (2009), 17–18.
Sokol, Michael C., Kimberly A. McGuigan, Robert R. Verbrugge, and RobertS. Epstein, ‘‘Impact of medication adherence on hospitalization risk andhealthcare cost,’’ Medical care, 43,6 (2005): 521–530.
Spiegler, Ran, Bounded Rationality and Industrial Organization (Oxford: OxfordUniversity Press, 2011).
Spinnewijn, Johannes, ‘‘Insurance and Perceptions: How to Screen Optimists andPessimists,’’ Economic Journal, 123 (2013), 606–633.
———, ‘‘Heterogeneity, Demand for Insurance and Adverse Selection,’’ Mimeo,LSE, 2014.
Spiro, David M., Khoon-Yen Tay, Donald H. Arnold, James D. Dziura, MarkD. Baker, and Eugene D. Shapiro, ‘‘Wait-and-See Prescription for theTreatment of Acute Otitis Media: A Randomized Controlled Trial,’’ Journalof the American Medical Association, 296 (2006), 1235–1241.
Strandbygaard, Ulla, Simon Francis Thomsen, and Vibeke Backer, ‘‘A Daily SMSReminder Increases Adherence to Asthma Treatment: A Three-MonthFollow-up Study,’’ Respiratory Medicine, 104 (2010), 166–171.
Tamblyn, Robyn, Rejean Laprise, James A. Hanley, Michael Abrahamowicz,Susan Scott, Nancy Mayo, Jerry Hurley, Roland Grad, Eric Latimer,Robert Perreault, Peter McLeod, Allen Huang, Pierre Larochelle, andLouise Mallet, ‘‘Adverse Events Associated with Prescription Drug Cost-Sharing Among Poor and Elderly Persons,’’ Journal of the AmericanMedical Association, 285 (2001), 421–429.
Taubman, Sarah L., Heidi L. Allen, Bill J. Wright, Katherine Baicker, and AmyN. Finkelstein, ‘‘Medicaid Increases Emergency-Department Use: Evidencefrom Oregon’s Health Insurance Experiment,’’ Science, 343 (2014), 263–268.
Thaler, Richard H., and Cass R. Sunstein, Nudge: Improving Decisions AboutHealth, Wealth, and Happiness (New York: Penguin, 2008).
van Dulmen, Sandra, Emmy Sluijs, Liset van Dijk, Denise de Ridder, Rob Heerdink,and Jozien Bensing, ‘‘Patient Adherence to Medical Treatment: A Review ofReviews,’’ BMC Health Services Research, 7 (2007), 55.
Volpp, Kevin G., Mark V. Pauly, George Loewenstein, and David Bangsberg,‘‘P4P4P: An Agenda for Research on Pay-for-Performance for Patients,’’Health Affairs, 28 (2009), 206–214.
Waljee, Jennifer F., Mary A. M. Rogers, and Amy K. Alderman, ‘‘Decision Aidsand Breast Cancer: Do They Influence Choice for Surgery and Knowledge ofTreatment Options?’’ Journal of Clinical Oncology, 25 (2007), 1067–1073.
Zeckhauser, Richard, ‘‘Medical Insurance: A Case Study of the Tradeoff BetweenRisk Spreading and Appropriate Incentives,’’ Journal of Economic Theory, 2(1970), 10–26.
BEHAVIORAL HAZARD IN HEALTH INSURANCE 1667

This page intentionally left blank