Embed Size (px)
Citation preview
THE GLOBAL DECLINE OF THE LABOR SHARE*
Loukas Karabarbounis and Brent Neiman
The stability of the labor share of income is a key foundation in macroeco-nomic models. We document, however, that the global labor share has signifi-cantly declined since the early 1980s, with the decline occurring within thelarge majority of countries and industries. We show that the decrease in therelative price of investment goods, often attributed to advances in informationtechnology and the computer age, induced firms to shift away from labor andtoward capital. The lower price of investment goods explains roughly half of theobserved decline in the labor share, even when we allow for other mechanismsinfluencing factor shares, such as increasing profits, capital-augmenting tech-nology growth, and the changing skill composition of the labor force. We high-light the implications of this explanation for welfare and macroeconomicdynamics. JEL Codes: E21, E22, E25.
I. Introduction
At least since the work of Kaldor (1957), the stability of thelabor share of income has been a fundamental feature of macro-economic models, with broad implications for the shape of theproduction function, inequality, and macroeconomic dynamics.We document that the global labor share has declined signifi-cantly since the early 1980s, with the decline occurring withinthe large majority of countries and industries. We demonstratehow the decline of the labor share can be explained by the declinein the relative price of investment goods. Efficiency gains incapital-producing sectors, often attributed to advances in infor-mation technology and the computer age, induced firms to shiftaway from labor and toward capital to such a large extent that thelabor share of income declined.
We start by documenting a 5 percentage point decline in theshare of global corporate gross value added paid to labor over thepast 35 years. We measure the labor share using a novel data setwe compile by combining country-specific data posted on the
*We thank the editors, Robert Barro and Elhanan Helpman, and seven an-onymous referees for valuable comments and suggestions. We additionally thankMartin Berka, Bob Hall, Chang-Tai Hsieh, John Huizinga, Chad Jones, and PeteKlenow. Gabriela Antonie, Sophie Wang, Bowen Yang, Anny Zhong, MichaelMarvin, and Victor Lin provided excellent research assistance. This researchwas funded in part by the Initiative on Global Markets and the NeubauerFamily Foundation at the University of Chicago Booth School of Business. Thedata set that accompanies the article is available on the authors’ web pages.
! The Author(s) 2013. Published by Oxford University Press, on behalf of President andFellows of Harvard College. All rights reserved. For Permissions, please email: [email protected] Quarterly Journal of Economics (2014), 61–103. doi:10.1093/qje/qjt032.Advance Access publication on October 24, 2013.
61
at University of C
alifornia, Berkeley on January 24, 2016
http://qje.oxfordjournals.org/D
ownloaded from

Internet with sector-level national income accounting data frommultilateral organizations obtained digitally and collected fromphysical books. Our baseline analyses focus on the labor sharewithin the corporate sector because this allows us to circumventimportant measurement difficulties confronted by most of thelabor share literature. As emphasized by Gollin (2002), aggregatelabor share measures are influenced by the methods used to sep-arate the labor and capital income earned by entrepreneurs, soleproprietors, and unincorporated businesses. The corporate laborshare is not subject to such imputations. Although previous ana-lyses of U.S. data have sometimes focused on the corporate laborshare, we are unaware of other research focusing on corporatelabor shares in such a large sample of countries.
Of the 59 countries with at least 15 years of data between1975 and 2012, 42 exhibited downward trends in their laborshares. Of the trend estimates that are statistically significant,37 are negative and only 9 are positive. We complement our ana-lysis with industry-level data and show that 6 of the 10 majorindustries experienced significant labor share declines and only2 experienced the opposite. Most of the global decline in the laborshare is attributable to within-industry changes rather than tochanges in industrial composition.1 The pervasiveness of thedecline in the labor share is even present in regional data forthe United States, where two-thirds of the states experienceddeclines over this period.
The decline in the price of investment relative to consump-tion goods accelerated starting in the early 1980s. We develop amodel that relates the decline in the labor share to this coincidentdecline in the relative price of investment goods. The economyproduces two final goods (consumption and investment) using acontinuum of intermediate inputs. Technology differences in theproduction of final goods cause shifts in the price of investmentrelative to the price of consumption goods and affect the rate atwhich households rent capital to the firms. Monopolistically com-petitive firms produce intermediate inputs with capital and laborusing a constant elasticity of substitution (CES) technology and
1. This decomposition, together with the fact that labor-abundant countriessuch as China, India, and Mexico also experienced significant declines in their laborshares, argues against a simple role for international trade or outsourcing in ex-plaining labor share declines in capital-abundant countries such as the UnitedStates.
QUARTERLY JOURNAL OF ECONOMICS62
at University of C
alifornia, Berkeley on January 24, 2016
http://qje.oxfordjournals.org/D
ownloaded from

sell their output each period at a constant markup over marginalcost. Changes in the rental rate of capital induce producers tochange their capital-labor ratios and, for nonunitary elasticitiesof substitution, the shares of each factor in production costs.Changes in price markups additionally change the shares ofeach factor in income.
In our model the labor share will only change in response toshocks that influence the rental rate of capital, markups, or cap-ital-augmenting technology, with the magnitude of any responsebeing a function of the elasticity of substitution between capitaland labor and the levels of the labor share and markups. Givenour focus on long-term trends, we treat the data as being gener-ated from the model’s transition from one steady state to another.Assuming a constant household discount factor and depreciationrate of capital, changes across steady states in the rental rate onlyreflect changes in the relative price of investment. Heterogeneityacross countries in the level or growth of any variable other thanthe relative price of investment, markups, or capital-augmentingtechnology will therefore not matter for long-term trends in thelabor share. This logic argues against the possibility that shocksto other macroeconomic objects such as labor income taxes orhousehold labor supply are important for explaining the laborshare decline.
To determine the implications of the declining relative priceof investment for the labor share, we use our model to estimatethe elasticity of substitution between capital and labor. Mostprior estimates use time series variation within a country infactor shares and factor prices to identify the elasticity. By con-trast, our estimates are identified from cross-country variation intrends in rental rates and labor shares. Therefore, our estimatesare not influenced by the global component of the labor sharedecline, the object that we intend to explain. Put differently,even if each individual country experienced a decline in both itsrelative price of investment and its labor share, there is nothingin our methodology that prevents us from associating a globaldecline in the price of investment with a global increase in thelabor share.
The rental rate of capital can be influenced at high frequencyby various factors such as short-run changes in interest rates,adjustment costs, or financial frictions. These factors, however,are unlikely to have a significant influence on long-run trends inthe rental rate, particularly compared to the relative price of
GLOBAL DECLINE OF THE LABOR SHARE 63
at University of C
alifornia, Berkeley on January 24, 2016
http://qje.oxfordjournals.org/D
ownloaded from

investment goods, which moves proportionately with the rentalrate across steady states of our model. Therefore, our estimatesfocus on low-frequency variation and only include countries withat least 15, and as many as 37, years of data. Rather than havingto use more volatile proxies of the rental rate, this allows us toexploit high-quality and widely available data on the relativeprice of investment.
We start by assuming that capital-augmenting technologygrowth is orthogonal to the price of investment shock and thatthe economy has zero profits. In the data, countries and indus-tries experiencing larger declines in the relative price of invest-ment also experienced larger labor share declines. This leads toour preferred estimate of the elasticity of substitution betweencapital and labor of about 1.25. When confronted with the 25%decline in the global relative price of investment that occurredsince 1975, our model delivers roughly half of the 5 percentagepoint decline in the global labor share.
Next, we allow for the possibility that markups affect ourestimated elasticity. Imagine that markups increased more incountries with larger declines in the relative price of investment.Even in the Cobb-Douglas case, which features a constant laborshare of costs, this would produce a spurious association betweendeclining labor shares of income and declining prices of invest-ment. Our baseline procedure would incorrectly estimate an elas-ticity greater than 1. To address this concern, we use long-termtrends in nominal investment rates to approximate changes inthe capital-output ratio and follow Rotemberg and Woodford(1995) in using this ratio to calculate capital shares and markups.We find that markups generally increased and therefore did playa role in the labor share decline. However, when we modify ourempirical framework to take markups into account, the estimatedelasticity, and thus the implied contribution of the price of invest-ment to the labor share decline, is essentially unchanged relativeto our benchmark results.
Similarly, our elasticity estimate might be biased upward ifcapital-augmenting technology growth is greater in countrieswith larger declines in the relative price of investment.2 The
2. In our model, the decline in the relative price of investment causes an in-crease in the capital-labor ratio. Acemoglu (2002) develops a model in which firmschoose to direct technological change toward the relatively abundant factor whenthe elasticity of substitution between capital and labor exceeds 1.
QUARTERLY JOURNAL OF ECONOMICS64
at University of C
alifornia, Berkeley on January 24, 2016
http://qje.oxfordjournals.org/D
ownloaded from
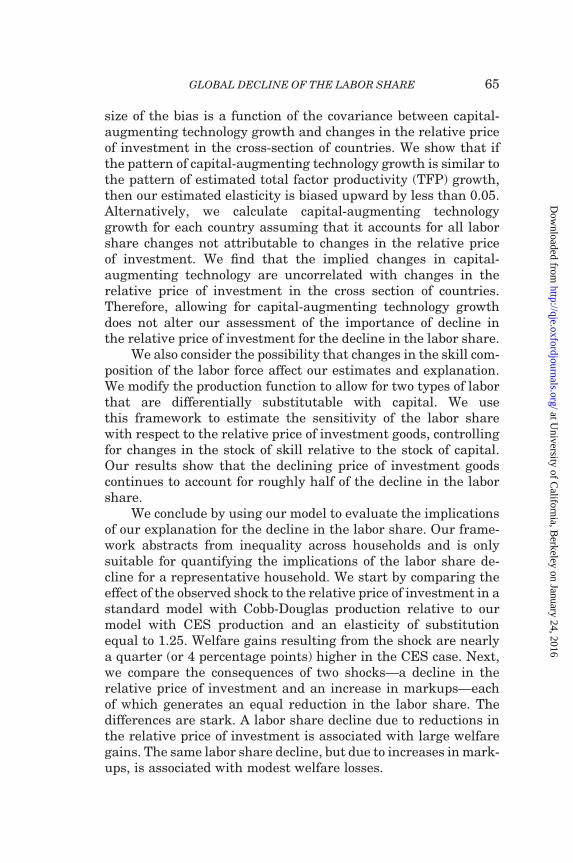
size of the bias is a function of the covariance between capital-augmenting technology growth and changes in the relative priceof investment in the cross-section of countries. We show that ifthe pattern of capital-augmenting technology growth is similar tothe pattern of estimated total factor productivity (TFP) growth,then our estimated elasticity is biased upward by less than 0.05.Alternatively, we calculate capital-augmenting technologygrowth for each country assuming that it accounts for all laborshare changes not attributable to changes in the relative priceof investment. We find that the implied changes in capital-augmenting technology are uncorrelated with changes in therelative price of investment in the cross section of countries.Therefore, allowing for capital-augmenting technology growthdoes not alter our assessment of the importance of decline inthe relative price of investment for the decline in the labor share.
We also consider the possibility that changes in the skill com-position of the labor force affect our estimates and explanation.We modify the production function to allow for two types of laborthat are differentially substitutable with capital. We usethis framework to estimate the sensitivity of the labor sharewith respect to the relative price of investment goods, controllingfor changes in the stock of skill relative to the stock of capital.Our results show that the declining price of investment goodscontinues to account for roughly half of the decline in the laborshare.
We conclude by using our model to evaluate the implicationsof our explanation for the decline in the labor share. Our frame-work abstracts from inequality across households and is onlysuitable for quantifying the implications of the labor share de-cline for a representative household. We start by comparing theeffect of the observed shock to the relative price of investment in astandard model with Cobb-Douglas production relative to ourmodel with CES production and an elasticity of substitutionequal to 1.25. Welfare gains resulting from the shock are nearlya quarter (or 4 percentage points) higher in the CES case. Next,we compare the consequences of two shocks—a decline in therelative price of investment and an increase in markups—eachof which generates an equal reduction in the labor share. Thedifferences are stark. A labor share decline due to reductions inthe relative price of investment is associated with large welfaregains. The same labor share decline, but due to increases in mark-ups, is associated with modest welfare losses.
GLOBAL DECLINE OF THE LABOR SHARE 65
at University of C
alifornia, Berkeley on January 24, 2016
http://qje.oxfordjournals.org/D
ownloaded from

Our work relates to several strands of literature. First, ourfindings are consistent with earlier work by Blanchard (1997),Blanchard and Giavazzi (2003), Jones (2003), and Bentolila andSaint-Paul (2003) that focuses on the variability of labor sharesover the medium run, including the large declines seen duringthe 1980s in Western Europe.3 Harrison (2002) and Rodriguezand Jayadev (2010) use UN data and are the broadest studiesof trends in labor shares. Harrison (2002) finds a decreasingtrend in the labor share of poor countries but an increasingtrend in rich countries for 1960–1997. Rodriguez and Jayadev(2010) estimate a declining average trend in labor shares usingan equally weighted set of 129 countries.
Our results improve and expand on this related literature.We capture significant movements in the labor share subsequentto 2000, include important non–Organisation for Economic Co-operation and Development (OECD) countries such as China, anduse exchange rates to aggregate across countries and examine theglobal labor share. By focusing on the labor share in the corporatesector, rather than the overall labor share, our results are lesssubject to measurement problems caused by the imputation oflabor earnings in unincorporated enterprises and by shifts in eco-nomic activity across sectors. Importantly, we offer novel evi-dence tying the decline in the labor share to the decline in therelative price of investment goods and compare our mechanism toother potential explanations.
Our work relates the decline in the labor share to the declinein the relative price of investment by estimating an elasticity ofsubstitution between capital and labor that exceeds unity.4 Asreviewed in Antras (2004) and Chirinko (2008), among others,there is a large literature estimating this elasticity. Though the
3. Blanchard and Giavazzi (2003) argue that deregulation in product and labormarkets decreased labor shares and increased unemployment in Europe in the1980s. Azmat, Manning, and Van Reenen (2012) explore deregulations in the net-work industry to further advance this argument.
4. As discussed in Barro and Sala-i-Martin (1995) and Jones (2003), a balancedgrowth path with nonzero factor shares will only emerge if technology growth islabor-augmenting, regardless of the production function, or if the production func-tion is Cobb-Douglas, even if technology growth is capital-augmenting. Acemoglu(2003) and Jones (2005) develop models in which firms choose technical progress tobe labor-augmenting along the balanced growth path. If real wage growth or in-creases in the capital-labor ratio are caused by labor-augmenting technologygrowth, there need not be movement in the labor share.
QUARTERLY JOURNAL OF ECONOMICS66
at University of C
alifornia, Berkeley on January 24, 2016
http://qje.oxfordjournals.org/D
ownloaded from

range of estimates is very wide, most estimates are below 1.5 Asalready discussed, an important difference between our approachand that taken by most papers in the literature is that we esti-mate the elasticity from cross-sectional variation using manycountries and industries and by focusing only on long-runtrends, we take advantage of cross-sectional variation in the rela-tive price of investment.
Finally, our article also relates to the literature on invest-ment-specific technical change. Following Greenwood, Herco-witz, and Huffman (1988), and consistent with Hsieh andKlenow (2007), we interpret innovations in the relative price ofinvestment as reflecting investment-specific technology shocks.Greenwood, Hercowitz, and Krusell (1997) study the relevanceof this type of shock for growth in the United States. Fisher(2006) documents an acceleration in the decline in the relativeprice of investment since 1982 and evaluates the importance ofinvestment shocks for business cycles. Perhaps closest in spirit toour narrative, Krusell et al. (2000) study the evolution of the U.S.skill premium in a model with price of investment shocks andCES production between skilled labor and capital equipment.
II. Trends in Labor Shares and Investment Prices
We start by documenting the pervasive decline in laborshares around the world at the country, U.S. state, and industrylevels. Next we document a decline in the relative price of invest-ment goods, which we later show to be the key factor explainingthe global trend in the labor share. Each subsection first describesthe data sources used and then summarizes the relevant trends.
II.A. Declining Labor Shares
Our baseline results come from analysis of a new data set weconstruct using country-level statistics on labor share in the cor-porate sector. We generate these data by combining five broad
5. A notable exception is Duffy and Papageorgiou (2000). Leon-Ledesma,McAdam, and Willman (2010) attribute some of the large variation in the estimatesof the elasticity to the use of a single equation first-order condition rather than ajoint estimation with the production function. Data limitations prevent us fromemploying their methodology. We note that they find a large downward bias inestimated elasticities from simulated time series when the true underlying elasti-city is greater than 1.
GLOBAL DECLINE OF THE LABOR SHARE 67
at University of C
alifornia, Berkeley on January 24, 2016
http://qje.oxfordjournals.org/D
ownloaded from

sources: (i) country-specific web pages (such as that managedby the Bureau of Economic Analysis [BEA] for the UnitedStates); (ii) digital files obtained from the United Nations (UN);(iii) digital files obtained from the OECD; (iv) physical books pub-lished by the UN; and (v) physical books published by the OECD.Over time and across countries there are some differences inmethodologies, but our data generally conform to System ofNational Accounts (SNA) standards.6
Economic activity is divided in the SNA into the corporate(C), household (H), and government (G) sectors. The householdsector includes unincorporated businesses, sole proprietors, non-profits serving households, and the actual and imputed rentalincome accruing to noncorporate owners of housing. The corpor-ate sector includes financial and nonfinancial corporations.Nominal gross domestic product (GDP) Y equals the sum ofsectoral gross value added Q (final output less intermediateconsumption) and taxes net of subsidies on products:7
Y ¼ QC þQH þQG þ Taxproducts:ð1Þ
The aggregate labor share equals total compensation of laboracross all three sectors divided by GDP, or WN
Y , where W equalsthe average wage and N equals hours worked. Corporate grossvalue added QC equals the sum of compensation paid to laborWCNC, taxes net of subsidies on production (including items
6. Theresulting data set with corporate and overall labor shares isavailable onthe authors’ web pages. To merge the data, we begin by using any values we are ableto obtain from the Internet. This is our preferred source because it is the most likelyto include data revisions. We then rank the digital files by the number of availableyears of data for each country and use these sources (in order) when the preferredsources lack data. Last, we similarly rank and use the printed sources. We onlyconnect series together from multiple sources if they satisfy a ‘‘smooth pasting’’condition whereby measures for any given variable from overlapping years forboth sources are sufficiently close to each other. Though there are some exceptions,this procedure typically implies that one or two sources contribute the bulk of thedata for any given country. These key sources do, however, differ across countries.We refer the reader to the SNA Section of the United Nations Statistics Division andto Lequiller and Blades (2006) for the most detailed descriptions of how nationalaccounts are constructed and harmonized to meet SNA standards.
7. This is true for a large majority of countries but there are several exceptions.For example, BEA accounts for the United States include net taxes on products inthe gross value added of each of the three sectors and also include unincorporatedenterprises in what they call the business sector (rather than in the householdsector). National accounts for Germany and China also include net taxes in sectoralgross value added.
QUARTERLY JOURNAL OF ECONOMICS68
at University of C
alifornia, Berkeley on January 24, 2016
http://qje.oxfordjournals.org/D
ownloaded from
such as corporate income and property taxes), and gross operat-ing surplus (including items such as interests on loans, retainedearnings, and dividend payments).
For most of our analyses, we focus on the labor share in thecorporate sector, WCNC
QC.8 The labor share measured within the cor-
porate sector is not affected by the statistical imputation of wagesfrom the combined capital and labor income earned by sole pro-prietors and unincorporated enterprises, highlighted by Gollin(2002) as problematic for the consistent measurement of thelabor share. Additionally, we find the focus on the corporatelabor share theoretically appealing given difficulties in specifyinga production function and optimization problem for the govern-ment. We note that the corporate sector accounts for roughly 60%of the economy’s total gross value added both in the U.S. andglobally. Furthermore, we find that this share has been relativelystable throughout our sample period.
For all our analyses, we start in 1975 and only include coun-tries that have at least 15 years of data. The resulting data setcontains corporate sector-level information on the income struc-ture of 59 countries for various years between 1975 and 2012.This is a significant increase in coverage relative to what is read-ily downloadable from the UN and OECD, but we also reportsimilar results when only using those standard data sources.
The solid line in Figure I shows the evolution of the globalcorporate labor share in our data by plotting the year fixed effectsfrom a least-squares regression of the corporate labor share oncountry and year fixed effects. The regression includes countryfixed effects to eliminate the influence of countries entering andexiting the data set. We weight observations by corporate grossvalue added measured in U.S. dollars at market exchange rates.We normalize the fixed effects such that they equal the level ofthe corporate labor share in our data set in 1975. From a level ofroughly 64%, the global corporate labor share has exhibited arelatively steady downward trend, reaching about 59% at theend of the sample. The dashed line plots the fixed effects from
8. According to the SNA, compensation of employees includes wages and sal-aries in cash, wages and salaries in kind, and employers’ social contributions forsickness, accidents, and retirement (to social security funds and insurance enter-prises). Though the treatment of gains associated with the exercise of stock optionsis subject to data availability and is not uniform across countries, most developedcountries try to account for the value of stock options granted to employees as part oflabor compensation (Lequiller 2002).
GLOBAL DECLINE OF THE LABOR SHARE 69
at University of C
alifornia, Berkeley on January 24, 2016
http://qje.oxfordjournals.org/D
ownloaded from

an equivalent regression and shows that labor’s share of the over-all economy also declined globally.9 Unless otherwise noted, werefer to measures taken from the corporate sector when referringto the labor share.
Figure II shows that the decline in the labor share occurredin each of the four largest economies in the world. The dashed
.5.5
5.6
.65
.7G
loba
l Lab
or S
hare
1975 1980 1985 1990 1995 2000 2005 2010 2015
Corporate Sector Overall
FIGURE I
Declining Global Labor Share
The figure shows year fixed effects from a regression of corporate and over-all labor shares that also include country fixed effects to account for entry andexit during the sample. The regressions are weighted by corporate gross valueadded and GDP measured in U.S. dollars at market exchange rates. We nor-malize the fixed effects to equal the level of the global labor share in ourdataset in 1975.
9. For transparency and cross-country consistency, we define the overall laborshare here as compensation of employees divided by GDP and therefore exclude anylabor income of unincorporated business and sole proprietors. The level of overalllabor share is about 10 percentage points lower than the corporate labor share inpart due to this exclusion as well as the inclusion of taxes in the denominator. Thereare a number of countries that lack the data required to calculate the corporatelabor share but have data on the overall labor share. In such cases, we use theaggregate figures but scale them up by the average global ratio of corporate tooverall labor share found in the data set and include these scaled values as partof our primary corporate-sector data set.
QUARTERLY JOURNAL OF ECONOMICS70
at University of C
alifornia, Berkeley on January 24, 2016
http://qje.oxfordjournals.org/D
ownloaded from

.55.6.65.7
Labor Share
1975
1985
1995
2005
2015
Uni
ted
Sta
tes
.55.6.65.7
Labor Share
1975
1985
1995
2005
2015
Japa
n
.35.4.45.5
Labor Share
1975
1985
1995
2005
2015
Chi
na
.55.6.65.7
Labor Share19
7519
8519
9520
0520
15
Ger
man
y
FIG
UR
EII
Dec
lin
ing
Labor
Sh
are
for
the
Larg
est
Cou
ntr
ies
Th
efi
gu
resh
ows
the
labor
share
an
dit
sli
nea
rtr
end
for
the
fou
rla
rges
tec
onom
ies
inth
ew
orld
from
1975.
GLOBAL DECLINE OF THE LABOR SHARE 71
at University of C
alifornia, Berkeley on January 24, 2016
http://qje.oxfordjournals.org/D
ownloaded from

lines plot linear trends estimated using all available data since1975. All four trends are downward sloping and statistically sig-nificant at the 1% level. In fact, most countries in the worldexperienced this decline. Figure III shows linear trends for all59 countries with data available for at least 15 years. The coeffi-cients are scaled such that the units represent the percentagepoint change in the labor share every 10 years. Forty-two coun-tries experienced labor share declines, compared to 17 thatexperienced increases. Of those 46 countries where the trendswere statistically significant at the 5% level, the labor sharedeclined in 37 of them. The largest eight economies are shaded,and with the United Kingdom as the only exception, they allexperienced statistically significant declines.
The decline in the global labor share reflects declines in thelarge majority of countries around the world and is not simply areflection of trends in a few big countries. In fact, even looking atregional data within the United States, we find that the decline issimilarly broad-based. We calculate the labor share for all U.S.states plus the District of Columbia by dividing total compensa-tion by value added in the BEA’s state-level GDP data (these datado not isolate the corporate sector).10 In parallel to the countrytrends plotted in Figure III, Figure IV shows labor share declinesin the majority of U.S. states with 34 states experiencing laborshare declines compared to 17 that experienced increases. Ofthose 38 states where the trends were statistically significant atthe 5% level, the labor share declined in 27 of them.
Returning to the global analysis, we now ask how much of theglobal labor share decline reflects declines within industries andhow much reflects changes in industrial composition. For ex-ample, the labor share in manufacturing is typically higherthan in finance and business services. Does the decline in thelabor share simply reflect the fact that manufacturing’s share ofeconomic activity has fallen while the share of economic activityin services has risen?
To answer this question, we use the EU KLEMS data set. It isavailable for far fewer countries and does not allow for a focus on
10. The data are available prior to and including 1997 using the SIC classifica-tion system and from 1997 onward using the NAICS classification system. Wematch the 1997 values at the most disaggregated level and scale the SIC valuesby the discrepancy. This effectively shifts the earlier values of overall U.S. laborshare up by about 1 percentage point and results in a continuous series which wethen use.
QUARTERLY JOURNAL OF ECONOMICS72
at University of C
alifornia, Berkeley on January 24, 2016
http://qje.oxfordjournals.org/D
ownloaded from

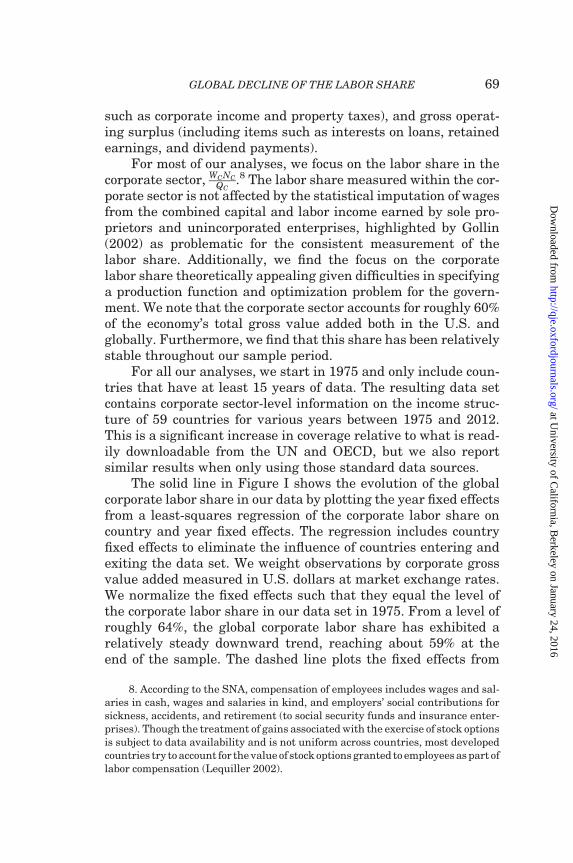
the corporate sector, but it allows us to construct labor shares foreach country in commonly defined industries of varying granu-larity.11 Figure V plots labor share trends, scaled to equal thepercentage point change per decade, for 10 nonoverlapping indus-tries that aggregate to the overall economy. For each industry weestimate a linear trend from a regression of the labor share thatincludes country fixed effects and weights countries by theirvalue added in that industry. The labor share significantly de-clines in six of the eight industries with statistically significanttrends. The remaining two exhibit statistically insignificant de-clines in their labor shares.
CH
N
GE
R ITA
FR
A
CA
NJP
N
US
A
GB
R
−15
−10
−5
05
10La
bor
Sha
re T
rend
s, P
erce
ntag
e P
oint
s pe
r 10
Yea
rs
FIGURE III
Estimated Trends in Country Labor Shares
The figure shows estimated trends in the labor share for all countries in ourdata set with at least 15 years of data starting in 1975. Trend coefficients arereported in units per 10 years (i.e., a value of �5 means a 5 percentage pointdecline every 10 years). The largest eight economies are shaded.
11. These data end in 2007, several years earlier than our baseline data set.When we overlap the KLEMS data with our data set, we find that the country laborshare trends are quite similar for the years in which both sources exist. The correl-ation of country trends is over 90% if one excludes the two large outliers ofLuxembourg and Ireland.
GLOBAL DECLINE OF THE LABOR SHARE 73
at University of C
alifornia, Berkeley on January 24, 2016
http://qje.oxfordjournals.org/D
ownloaded from

Finally, we more formally address the question of how muchof the change in the labor share is due to changing sizes of indus-tries with different levels of labor shares and how much is due tochanges in labor shares within those industries. We write thestandard within-between accounting decomposition for eachcountry i across 10 industries k:
�sLi ¼X
k
!i, k�sLi, k|fflfflfflfflfflfflfflfflfflffl{zfflfflfflfflfflfflfflfflfflffl}Within-Industry
þX
k
sLi, k�!i, k|fflfflfflfflfflfflfflfflfflffl{zfflfflfflfflfflfflfflfflfflffl}Between-Industry
,ð2Þ
where !i, k denotes industry k’s share in country i’s value added, xdenotes the arithmetic mean of the variable x, and �x denotes theestimated linear trend in x.
Figure VI plots labor share trends, the left-hand side of equa-tion (2), on the horizontal axis against the within-industry com-ponent, the first term on the right-hand side of equation (2), onthe vertical axis. With a few exceptions, countries in Figure VI
−6
−4
−2
02
46
Labo
r S
hare
Tre
nds,
Per
cent
age
Poi
nts
per
10 Y
ears
WA
DE
VT HI
RH
NV
KS
CT
SC
ME
PA
CA IN VA
DC
TN
NH
OR
OH
WY
NC AZ
WV NJ
LA FL
GA ID MI
AL
OK TX
MO IL
MD
MA
NM NY
MS
AR
CO
MN WI
UT
NE IA SD
KY
MT
ND
FIGURE IV
Estimated Trends in U.S. State Labor Shares
The figure shows estimated trends in the labor share for 51 U.S. states plusthe District of Columbia in BEA data starting in 1975. Trend coefficients arereported in units per 10 years (i.e., a value of �5 means a 5 percentage pointdecline every 10 years).
QUARTERLY JOURNAL OF ECONOMICS74
at University of C
alifornia, Berkeley on January 24, 2016
http://qje.oxfordjournals.org/D
ownloaded from
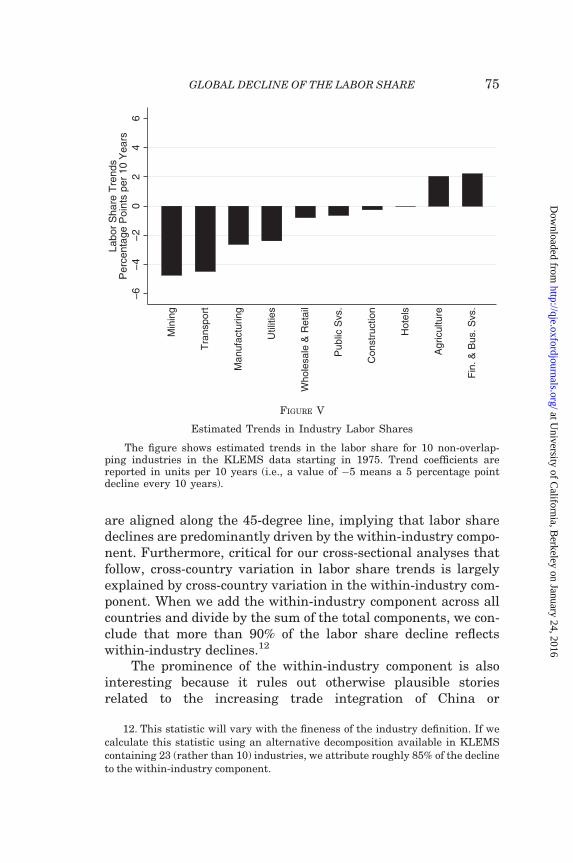
are aligned along the 45-degree line, implying that labor sharedeclines are predominantly driven by the within-industry compo-nent. Furthermore, critical for our cross-sectional analyses thatfollow, cross-country variation in labor share trends is largelyexplained by cross-country variation in the within-industry com-ponent. When we add the within-industry component across allcountries and divide by the sum of the total components, we con-clude that more than 90% of the labor share decline reflectswithin-industry declines.12
The prominence of the within-industry component is alsointeresting because it rules out otherwise plausible storiesrelated to the increasing trade integration of China or
−6
−4
−2
02
46
Labo
r S
hare
Tre
nds
Per
cent
age
Poi
nts
per
10 Y
ears
Min
ing
Tra
nspo
rt
Man
ufac
turin
g
Util
ities
Who
lesa
le &
Ret
ail
Pub
lic S
vs.
Con
stru
ctio
n
Hot
els
Agr
icul
ture
Fin
. & B
us. S
vs.
FIGURE V
Estimated Trends in Industry Labor Shares
The figure shows estimated trends in the labor share for 10 non-overlap-ping industries in the KLEMS data starting in 1975. Trend coefficients arereported in units per 10 years (i.e., a value of �5 means a 5 percentage pointdecline every 10 years).
12. This statistic will vary with the fineness of the industry definition. If wecalculate this statistic using an alternative decomposition available in KLEMScontaining 23 (rather than 10) industries, we attribute roughly 85% of the declineto the within-industry component.
GLOBAL DECLINE OF THE LABOR SHARE 75
at University of C
alifornia, Berkeley on January 24, 2016
http://qje.oxfordjournals.org/D
ownloaded from
globalization more generally. For example, imagine a simple two-country Heckscher-Ohlin model with Cobb-Douglas production intwo sectors with different labor shares. Compared to autarky, therelatively capital-abundant economy will in the free trade equi-librium allocate a larger share of its inputs to the production ofthe lower labor share industry. If we think of China as the rela-tively labor-abundant economy opening up to trade, one mightpredict a decline in the rest of the world’s labor share due tothis mechanism. In addition to the fact that we document alabor share decline in China itself (as well as other labor-abun-dant countries like India and Mexico), this trade-induced compos-itional change is unlikely to explain the labor share decline inother countries because it counterfactually implies an importantrole for the between component in equation (2).13
AUS
AUT
BEL
CYP
CZE
DNK
EST
FIN
FRA
GER
GRC
HUN
IRLITA
JPN
KOR
LVA
LTU
LUX
MLT
NLD
POL
PRT
SVKSVN
ESP
SWE
GBR
USA
−6
−4
−2
02
4W
ithin
−In
dust
ry C
ompo
nent
−6 −4 −2 0 2 4Labor Share Trends, Percentage Points per 10 Years
FIGURE VI
Within Component and Total Trends in Country Labor Shares
The figure plots the trend in the labor share against the within-industrycomponent as defined in equation (2) using the KLEMS data.
13. We calculated each country’s trends in imports, exports, and overall tradeboth bilaterally with China and multilaterally, where the change in flows are ex-pressed relative the country’s GDP. These measures of increasing exposure toChina and to the rest of the world do not generally correlate with declines in thelabor share.
QUARTERLY JOURNAL OF ECONOMICS76
at University of C
alifornia, Berkeley on January 24, 2016
http://qje.oxfordjournals.org/D
ownloaded from

II.B. Declining Prices of Investment Goods
In parallel with these large and broad trends in the laborshare, the price of investment relative to consumption goodshas also experienced a pervasive decline. For our cross-countryanalyses, we measure the relative price of investment goods intwo datasets which offer different costs and benefits. Our firstsource is the Penn World Tables (PWT, Mark 7.1), which offersmeasures at a point in time of the relative price levels of invest-ment and consumption goods for many countries around theworld. The PWT data are translated using investment-specificand consumption-specific purchasing power parity exchangerates, which is undesirable for our exercise because we wish toknow the price of investment relative to consumption that a do-mestic producer faces. We therefore follow Restuccia and Urrutia(2001) and divide the PWT relative price of investment of eachcountry by the PWT relative price of investment in the UnitedStates. We then multiply this ratio by the ratio of the investmentprice deflator to the personal consumption expenditure deflatorfor the United States, obtained from the BEA. This procedureyields for each country the relative price of investment measuredat domestic prices.
The PWT data cover a large set of countries and in some casesextend back to 1950. Furthermore, by combining the PWT’s in-formation on the cross-section of international prices with time-series information on the relative price of investment from theUnited States, the constructed series are insensitive to cross-country differences in methodologies used to construct invest-ment price deflators. If the U.S. BEA employs hedonic adjust-ments to properly capture changes in the quality of computers,for example, then our methodology will imply that this same ad-justment is implicitly captured for all countries in the data.
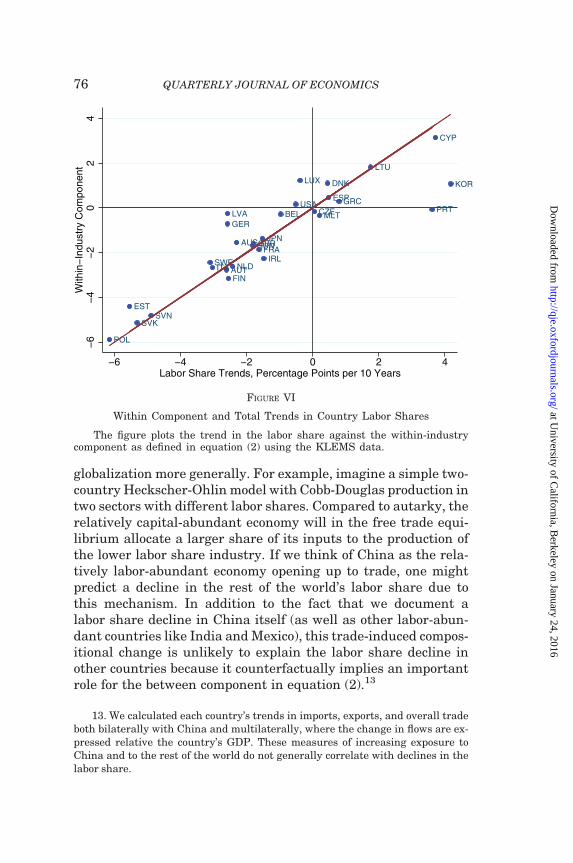
The solid line in Figure VII plots year fixed effects from aregression of the log relative price of investment in the PWTdata set after absorbing country dummies. The regressions areweighted by GDP, and the fixed effects are normalized to equal 0in 1980. The series exhibits a mild decline from 1950 to 1980,trending downward about 0.02 log point per decade. Consistentwith Fisher (2006), however, the series exhibits a clear breakaround 1980 and declines at a rate closer to 0.1 log point perdecade after 1980. This steep downward trend occurred allaround the world. Of the countries with at least 15 years of
GLOBAL DECLINE OF THE LABOR SHARE 77
at University of C
alifornia, Berkeley on January 24, 2016
http://qje.oxfordjournals.org/D
ownloaded from
data on both the PWT relative price of investment and on laborshares, 44 experienced declines in the relative price of investmentsince 1975, compared to only 14 that experienced an increase.
As a second measure of the relative price of investmentgoods, we take the ratio in each country of the fixed investmentdeflator to the consumption price index, obtained by comparingnominal and real measures of gross fixed investment and house-hold consumption from the World Bank’s World DevelopmentIndicators (WDI). These data rely more on the individual statis-tical agencies in each country but offer the benefit of properlycapturing differences in the composition of investment spendingacross countries.14 The short-dashed line in Figure VII plots theequivalent series of year fixed effects as the solid line but esti-mated using the WDI data, which is widely available from 1970.
−.4
−.3
−.2
−.1
0.1
.2Lo
g R
elat
ive
Pric
e of
Inve
stm
ent (
1980
=0)
1950 1960 1970 1980 1990 2000 2010 2020
PWT WDI KLEMS
FIGURE VII
Declining Global Price of Investment Goods
The figure shows year fixed effects from regressions of the log relative priceof investment that absorb country fixed effects to account for entry and exitduring the sample. The regressions are weighted by GDP measured in U.S.dollars at market exchange rates.
14. We enrich the WDI data with equivalent data from the EconomistIntelligence Unit for a small number of countries that are not included in WDI.
QUARTERLY JOURNAL OF ECONOMICS78
at University of C
alifornia, Berkeley on January 24, 2016
http://qje.oxfordjournals.org/D
ownloaded from
The global trends in the PWT and WDI data are highly similar.Very moderate declines in the relative price of investment prior to1980 are followed by steep subsequent declines. The decline in theWDI data is also widespread across countries, with 43 experien-cing declines compared to 11 with increases. There are differ-ences in country and time coverage between the PWT and WDIsources, but when we consider overlapping country-year observa-tions, we measure a cross-country correlation of about .75between the trends found in the two data sets.
Finally, our industry-level analyses use KLEMS data on in-vestment and output prices in each industry. Though the keyvariation we use from this data set will be cross-industry differ-ences in declines in the relative price of investment, we demon-strate comparability with the other sources by plotting time fixedeffects from regressions using the country-level relative price ofinvestment in KLEMS. The long-dashed line in Figure VII showsan increasing trend that sharply reverses in the early 1980s, con-sistent with the timing of the decline captured in the other datasources. All countries in KLEMS with sufficient data for this ana-lysis exhibit a declining relative price of investment. Excludingthe United Kingdom, which is an outlier in KLEMS, the correl-ations of these trends with the trends found in PWT and WDIacross countries are .60 and .75, respectively.
III. A Model of the Labor Share
We now develop a model that relates the labor share to therelative price of investment goods as well as to other macroeco-nomic variables, such as price markups and factor-augmentingtechnology. We consider a two-sector economic environment inwhich final consumption and investment goods are produced bycombining intermediate inputs using a CES technology. Time isdiscrete and the horizon is infinite, t = 0,1,2, . . . There is no uncer-tainty and all economic agents have perfect foresight. All pay-ments in this economy are made in terms of the finalconsumption good, which is the numeraire.
III.A. Final Consumption Good
Competitive producers assemble the final consumption goodCt from a continuum of intermediate inputs z 2 ½0, 1� and sell it to
GLOBAL DECLINE OF THE LABOR SHARE 79
at University of C
alifornia, Berkeley on January 24, 2016
http://qje.oxfordjournals.org/D
ownloaded from
the household at a price Pct . They produce final consumption with
the technology:
Ct ¼
Z 1
0ctðzÞ
�t�1�t dz
� � �t�t�1
,ð3Þ
where ctðzÞ denotes the quantity of input z used in production of thefinal consumption good and �t > 1 denotes the elasticity of substi-tution between input varieties. The consumption good producerspurchase these inputs at prices ptðzÞ from monopolistically competi-tive firms that charge a markup over marginal cost �t that dependson �t. To capture changes in markups over time, we allow the elas-ticity of substitution across varieties to vary over time.
Cost minimization implies that the demand for input variety
z for use in producing the consumption good is ctðzÞ ¼ptðzÞPc
t
� ���tCt.
The final consumption good is the numeraire and has a price of 1.It is competitively produced, so its price equals the marginal costof production:
Pct ¼
Z 1
0ptðzÞ
1��tdz
� � 11��t
¼ 1:ð4Þ
III.B. Final Investment Good
Competitive producers assemble the final investment good Xt
from the same continuum of intermediate inputs z:
Xt ¼1
�t
� � Z 1
0xtðzÞ
�t�1�t dz
� � �t�t�1
:ð5Þ
The exogenous variable �t denotes the technology level in theproduction of the consumption good relative to the investmentgood. A decline of �t implies an improvement in the technology ofproducing the investment good relative to the consumption good.
Since firms in the final investment good sector are competi-tive, the price of the final investment good equals the marginal
cost of production, Pxt ¼ �t
R 10 ptðzÞ
1��tdz� � 1
1��t¼ �t. We refer to
�t ¼Px
t
Pct
as the relative price of investment, which declines when-
ever technology in the investment good sector improves relativeto the consumption good sector. Finally, demand for input varietyz for use in production of the investment good is given byxtðzÞ ¼ �tptðzÞ
��tXt.
QUARTERLY JOURNAL OF ECONOMICS80
at University of C
alifornia, Berkeley on January 24, 2016
http://qje.oxfordjournals.org/D
ownloaded from

III.C. Producers of Intermediate Inputs
The producer of intermediate input variety z operates a con-stant returns to scale technology in capital and labor inputs toproduce output sold to both consumption and investment goodproducers, ytðzÞ ¼ FðktðzÞ, ntðzÞÞ. Capital is rented at rate Rt andlabor is rented at a price Wt from the household. Producers ofintermediate inputs take input prices and aggregate demand,Yt ¼ Ct þ �tXt, as given.
The profit-maximization problem of the producer of inter-mediate input z is:
maxptðzÞ, ytðzÞ, ktðzÞ, ntðzÞ
�tðzÞ ¼ ptðzÞytðzÞ � RtktðzÞ �WtntðzÞ,ð6Þ
subject to
ytðzÞ ¼ ctðzÞ þ xtðzÞ ¼ ptðzÞ��t ðCt þ �tXtÞ ¼ ptðzÞ
��tYt:ð7Þ
The first-order condition with respect to capital is ptðzÞFk, tðzÞ ¼�tRt and with respect to labor is ptðzÞFn, tðzÞ ¼ �tWt. Firms set themarginal revenue product of factors as a markup �t ¼
�t
�t�1 overfactor prices.
III.D. Household
The household derives utility from consumption goods anddisutility from supplying labor. It purchases consumption andinvestment goods from final good producers at prices 1 and �t,respectively. The household uses the investment good to augmentthe physical capital stock and rents capital to producers of inter-mediate goods at a rental rate Rt. The household owns all firms inthe economy and receives their profits as dividends in everyperiod. The household supplies labor to intermediate input pro-ducers at a wage Wt. It can also hold some asset Bt that pays a realinterest rate rt and is in zero net supply. Denoting by �t a house-hold preference shifter and by b the discount factor, the problemof the household in some period t0 is:
maxCt, fntðzÞg, Xt, Ktþ1, Btþ1f g
1
t¼t0
X1t¼t0
�t�t0V Ct, Nt;�tð Þ,ð8Þ
subject to initial capital K0 and assets B0, the capital accumulationequation, Ktþ1¼ð1��ÞKtþXt, and the household budget constraint:
Ctþ �tXtþBtþ1�ð1þ rtÞBt ¼
Z 1
0WtntðzÞþRtktðzÞþ�tðzÞð Þdz:ð9Þ
GLOBAL DECLINE OF THE LABOR SHARE 81
at University of C
alifornia, Berkeley on January 24, 2016
http://qje.oxfordjournals.org/D
ownloaded from
Aggregate labor supplied by the household is Nt ¼R 1
0 ntðzÞdz andthe aggregate capital stock is Kt ¼
R 10 ktðzÞdz.
Household optimization implies a standard Euler equationfor consumption across time and a standard intraperiod conditionfor leisure and consumption. Finally, the first-order conditionwith respect to capital is given by:
Rtþ1 ¼ �t 1þ rtþ1ð Þ � �tþ1 1� �ð Þ,ð10Þ
where 1þ rtþ1 ¼VCðCt, NtÞ
�VCðCtþ1, Ntþ1Þdenotes the gross real interest rate.
This condition says that the household invests in physical capitalup to the point where the marginal benefit of investing in capital(the rental rate) equals the marginal cost of investing in capital.
III.E. Equilibrium
We define an equilibrium for this economy as a sequence ofprices and quantities such that, given a sequence of exogenousvariables: (i) the household maximizes its utility; (ii) final produ-cers of the consumption good minimize their costs; (iii) final pro-ducers of the investment good minimize their costs; (iv) eachproducer of input variety z maximizes profits; and (v) marketsfor labor, capital, assets, consumption, investment, and inter-mediate inputs clear in every date. We define a steady state asan equilibrium in which all variables are constant over time.
The equilibrium of the model is symmetric, with ptðzÞ ¼ Pct ¼
1, ktðzÞ ¼ Kt, ntðzÞ ¼ Nt, ctðzÞ ¼ Ct, xtðzÞ ¼ �tXt, ytðzÞ ¼ Yt ¼ Ctþ
�tXt, and Yt ¼ FðKt, NtÞ, where Nt and Kt are total labor and totalcapital. The share of income paid as wages for labor services,rentals for capital, and profits are given by:
sL, t ¼WtNt
Yt¼
1
�t
� �WtNt
WtNt þRtKt
� �,ð11Þ
sK , t ¼RtKt
Yt¼
1
�t
� �RtKt
WtNt þRtKt
� �,ð12Þ
s�, t ¼�t
Yt¼ 1�
1
�t,ð13Þ
where sL, t þ sK , t þ s�, t ¼ 1:
QUARTERLY JOURNAL OF ECONOMICS82
at University of C
alifornia, Berkeley on January 24, 2016
http://qje.oxfordjournals.org/D
ownloaded from
III.F. The Production Function
We assume intermediate inputs are produced with a CESproduction function:
Yt ¼ FðKt, NtÞ ¼ �k AK , tKt
� ��1 þ 1� �kð Þ AN, tNt
� ��1
� � �1
,ð14Þ
where s denotes the elasticity of substitution between capital andlabor in production and �k is a distribution parameter. We let AK,t
and AN,t denote capital-augmenting and labor-augmenting tech-nology, respectively. The limit of the CES production function ass approaches 1 is the Cobb-Douglas production function,FðKt, NtÞ ¼ AK , tKt
� ��k AN, tNt
� �1��k . With the production function(14), the firm’s first-order conditions with respect to capital andlabor are:
FK , t ¼ �kA�1
K , t
Yt
Kt
� �1
¼ �tRt,ð15Þ
FN, t ¼ 1� �kð ÞA�1
N, t
Yt
Nt
� �1
¼ �tWt:ð16Þ
III.G. The Labor Share
We can now discuss the determinants of the labor share ofincome sL,t. Using the first-order condition for capital in equation(15) and the definitions of the income shares in equations (11)–(13), we derive an expression that relates the labor share to mark-ups, capital-augmenting technology, and the rental rate of capitalfor some value of the elasticity of substitution s and the distribu-tion parameter �k:
1� sL, t�t ¼ �k
AK , t
�tRt
� ��1
:ð17Þ
In the limiting case of a Cobb-Douglas production functionwhere ¼ 1, the labor share of income simply becomes sL, t ¼
1��k
�t.
Therefore, with Cobb-Douglas production the labor share ofincome varies over time only when markups vary over time andthe labor share of cost, sL, t�t ¼
WtNt
WtNtþRtKt, is constant.
As we discuss later, our estimation strategy focuses on laborshare trends because this allows us to control for substantial
GLOBAL DECLINE OF THE LABOR SHARE 83
at University of C
alifornia, Berkeley on January 24, 2016
http://qje.oxfordjournals.org/D
ownloaded from

cross-country heterogeneity in both economic parameters(e.g., initial level of technology) and measurement practices.We write equation (17) in changes between two arbitrary periodst and t0 > t as:
1
1� sL�
� �1� sL 1þ sLð Þ� 1þ �ð Þð Þ ¼
1þ AK
1þ �ð Þ 1þ R� �
0@ 1A�1
,ð18Þ
where Z ¼ Zt0
Zt� 1 denotes the percent change of some variable
Z between periods t and t0 and where for notational conveniencewe drop subscripts from values corresponding to the initialperiod t.
For any value of the elasticity of substitution s, given initialconditions for the labor share sL and markups m, equation (18)implies that information on changes in markups �, in capital-augmenting technology AK , and in the rental rate of capital R issufficient to pin down changes in the labor share sL. Additionalknowledge of wage and labor-augmenting technology is not in-formative for understanding changes in the labor share.
One can estimate the elasticity of substitution s either usingthe first-order condition with respect to capital, equation (15), orusing the first-order condition with respect to labor, equation(16). The former requires data on growth in the rental rate,whereas the latter requires data on growth in wages. Our esti-mate of s uses long-run trends spanning 15 to 37 years of dataand treats these trends as steady-state-to-steady-state transi-tions. As can be seen in equation (10), if we assume constant dis-count factors b and constant depreciation rates d over time (butnot necessarily across countries), we can equate trends in therental rate to trends in the relative price of investment, R ¼ �.We prefer estimating s using equation (18) which comes from thefirst-order condition with respect to capital relative to estimatings using the first-order condition with respect to labor becauseinternationally comparable and high-quality data on growth inx are more readily available than data on wage growth.
To summarize, holding fixed the discount factor and thedepreciation rate of capital, the labor share will only change inthe steady state of our model if AK, m, or x change. This generalresult argues against the relevance for the long-run decline inlabor share of a large set of factors, such as wage markups,labor income taxes and other labor supply shocks, and
QUARTERLY JOURNAL OF ECONOMICS84
at University of C
alifornia, Berkeley on January 24, 2016
http://qje.oxfordjournals.org/D
ownloaded from
government spending shocks that do not directly affect the pro-duction function.15
IV. The Elasticity of Substitution
In this section we confront equation (18) with our data toestimate the elasticity of substitution between capital and labors. We start by focusing only on trends in the relative price ofinvestment and abstract from markups and capital-augmentingtechnological progress because we lack direct measurementson them. Next, we introduce assumptions that allow us toimpute time-varying markups from data on investment spending,and we quantify the sensitivity of our estimates to capital-augmenting technological progress. Finally, we estimate s withproduction functions that allow for differential substitutabilitybetween capital and two types of labor. Equipped with our esti-mates of s, in Section V we quantify the effect of the decline in therelative price of investment goods on the labor share and explorethe broader macroeconomic and welfare implications of ourfindings.
We measure the percent change of all variables (correspond-ing to our ‘‘hat’’ notation) as the linear trend in the log of thevariable using all available data. We replace the variables inlevels with their average values in our sample. As discussed, wefocus on long-run trends and will think of them as capturingmovements from an initial to a final steady state. Assuming aconstant household discount factor b and depreciation rate d,this allows us to substitute the percent change across steadystates in the rental rate of capital with the percent change inthe relative price of investment goods, R ¼ �. However, we alsoshow that our results are robust when we allow for trends indepreciation rates.
15. For this reason ourmodel abstracts from wage markups, labor income taxes,and household shocks to the utility of leisure relative to consumption. All thesefactors are isomorphic to a change in � in household preferences in the sense thatnone can affect the labor share of income, the capital-labor ratio, and the wage in thesteady state of the model. Steady-state wages do not depend on � because withconstant returns to scale the change in capital implies a shift in labor demandthat exactly offsets any shifts in labor supply.
GLOBAL DECLINE OF THE LABOR SHARE 85
at University of C
alifornia, Berkeley on January 24, 2016
http://qje.oxfordjournals.org/D
ownloaded from

IV.A. Relative Price of Investment
We start with equation (18) and set � ¼ 1, � ¼ 0, andAK ¼ 0. We take a linear approximation around � ¼ 0 and add aconstant and an idiosyncratic error term to obtain our estimatingequation:
sL, j
1� sL, jsL, j ¼ þ � 1ð Þ�j þ uj,ð19Þ
where j denotes observations. The intuition behind equation (19)is simple. Absent economic profits and capital-augmenting tech-nology growth, a positive relationship between trends in the rela-tive price of investment �j and trends in the labor share sL, j ispossible only when the elasticity of substitution between capitaland labor s exceeds 1. In that case, a decrease of the cost of capitaldue to decreases in the relative price of investment induces firmsto substitute away from labor and toward capital to such anextent that it drives down the labor share. If trends in the relativeprice of investment were unrelated to trends in the labor share,this would imply a Cobb-Douglas production function with s= 1.A negative relationship between trends in the relative price ofinvestment and trends in the labor share would imply s< 1.
We emphasize that the identification of s in equation (19)comes from the cross-sectional variation of trends in laborshares and trends in the price of investment. Specifically,adding a constant g to the regression allows us to control forglobal factors that affect all countries. For example, imaginethat all countries experienced declining trends in labor sharesand the price of investment goods, but the extent of the laborshare decline across countries was unrelated to the extent ofthe decline in the price of investment across countries. In sucha case, we would estimate s= 1. Put differently, even though boththe labor share and the relative price of investment declined overtime for the typical country in our sample, our estimation usingcross-sectional variation could hypothetically produce an elasti-city estimate less than 1. In this sense, our methodology for esti-mating the elasticity does not incorporate information from theglobal trend that we hope to explain.
Given the small number of observations, estimation of equa-tion (19) is particularly sensitive to outliers. We standardize ourselection and treatment of outliers by generating ‘‘robust regres-sion’’ estimates, which place less weight on extreme values that
QUARTERLY JOURNAL OF ECONOMICS86
at University of C
alifornia, Berkeley on January 24, 2016
http://qje.oxfordjournals.org/D
ownloaded from

are identified endogenously during the estimation.16 In practice,the primary difference compared with ordinary least squares(OLS) estimates for most of our results is that the robust regres-sions endogenously assign very little weight to Kazakhstan,Kyrgyzstan, and Niger.
Table I presents our baseline estimates of s from equation(19). In the first four rows we estimate s using our country dataset, with j indexing the country observations. The first two rowsunder the column labeled ‘‘Labor Share’’ list the source as ‘‘KNMerged’’ to refer to our full data set described above and rows(iii)–(iv) list the source as ‘‘OECD and UN’’ to refer to a similarlyconstructed data set that only uses data easily downloadableonline from the UN and OECD (i.e., it discards the data we col-lected ourselves from country-specific Internet sources and phys-ical books). The column labeled ‘‘Investment Price’’ alternates inthese rows between PWT and WDI to indicate the data sourceused for �. These first four specifications produce highly similarresults, with the estimated s always significantly greater than 1.
To visualize these results, we plot in Figure VIII the cross-country relationship between the left-hand side of equation (19)and the trends in the price of investment goods.17 We use the KNMerged data set for the labor share, the PWT for the priceof investment goods, and drop the three outliers discussedbefore to ensure that the plotted least-squares line closely corres-ponds to the estimate presented in the first row of Table I.Countries with larger relative price of investment declines also
16. This regression is implemented with the command rreg in the statisticalpackage STATA. The idea behind a robust regression is to weight less those obser-vations that lie further from the regression line. The method starts by droppingobservations with Cook’s distance greater than 1. Then an iterative process calcu-lates weights based on absolute residuals. The process stops when the maximumchange between the weights from one iteration to the next is below some tolerancelevel. All regressions reported in this article use this procedure.
17. In our closed economy model, the variation in the relative price of invest-ment across countries is tied to different sectoral productivity shocks in each coun-try. This intuition can be extended to the open economy if one thinks of investmentgoods as freely tradeable across countries and consumption goods as being at leastpartly nontradeable. As in Balassa-Samuelson, prices of investment goods would beequalized across countries but differential technology growth in traded relative tonontraded sectors will shift the price of investment relative to consumption in eachcountry. Aside from productivity shocks, cross-country differences in the relativeprice of investment may also come from differences in the scale and timing of re-ductions in tariffs and other trade frictions.
GLOBAL DECLINE OF THE LABOR SHARE 87
at University of C
alifornia, Berkeley on January 24, 2016
http://qje.oxfordjournals.org/D
ownloaded from

TABLE I
BASELINE ESTIMATES OF ELASTICITY OF SUBSTITUTION
Labor shareInvestment
price Std. err.90% Conf.interval Obs.
(i) KN Merged PWT 1.25 0.08 [1.11,1.38] 58(ii) KN Merged WDI 1.29 0.07 [1.18,1.41] 54(iii) OECD and UN PWT 1.20 0.08 [1.06,1.34] 50(iv) OECD and UN WDI 1.31 0.06 [1.20,1.42] 47(v) KLEMS 1 KLEMS 1.17 0.06 [1.06,1.27] 129(vi) KLEMS 2 KLEMS 1.49 0.13 [1.28,1.70] 129
Average 1.28
ARG
ARM
AUSAUT
AZE
BHR
BLR
BEL
BOL
BRA
CANCHN
COL
CRI
CZEDNK
EST
FINFRAGER
HUN
ISL
ITAJPN
KENKOR
LVALTULUX
MAC
MEX
MDA
NAM
NLD
NZL
NGA
NOR
PER
POL
PRT
ROM
SGP
SVK
SVN
ZAF
ESP
SWECHETWN
THA
TUN
TUR
UKR
GBR
USA
−30
−20
−10
010
20(T
rend
in L
abor
Sha
re)/
(1−
Labo
r S
hare
)
−40 −20 0 20Trend in Log Relative Price of Investment
FIGURE VIII
Labor Share and Relative Price of Investment
The figure plots the left-hand and right-hand sides of equation (19). Allvalues are scaled to denote changes per 10 years. For example, a value of�10 for the trend in the log relative price of investment means a roughly10% decline of the price every 10 years. The figure excludes three countries(Kazakhstan, Kyrgyzstan, and Niger) with extremely low weights in the base-line regression of the first row of Table I. The best-fit line shown in the figurehas a slope of 0.28.
QUARTERLY JOURNAL OF ECONOMICS88
at University of C
alifornia, Berkeley on January 24, 2016
http://qje.oxfordjournals.org/D
ownloaded from

experienced larger labor share declines, which results in a stat-istically significant positive slope of 0.28 and an implied elasticityof 1.28.18
As shown in Figure I, the global labor share decline is simi-lar when measured within the corporate sector or when measuredin the overall economy. At the country level, the correlation be-tween these two trends is roughly 60%. We find, however, thatestimates of s using equation (19) differ when using overallrather than corporate labor shares. In the specification corres-ponding to the first row of Table I, if we restrict the sampleonly to countries that have data on the corporate labor share(dropping the countries where we use a scaled version of the over-all labor share), we obtain the larger elasticity estimate of 1.32,which is statistically greater than 1 at the 1% level. If instead weuse overall rather than corporate labor shares, the relationshipbetween labor share and investment price trends loses its signifi-cance and therefore cannot be used to rule out a unitary elasti-city. In this sense, we argue that the better measured andinternationally comparable corporate labor share data are im-portant if one wishes to use cross-country variation to understandthe behavior of the labor share.
In addition to using cross-country variation within the cor-porate sector, we use the KLEMS data set to similarly analyzecross-country variation within particular industries. Unfortu-nately, we cannot isolate the corporate labor share in theKLEMS data, and therefore these analyses in principle may beaffected by cross-country differences in the scale, measurement,and behavior of unincorporated business and government pro-duction. In practice, however, we worry less about these problemsfor this analysis for three reasons. First, because we use KLEMSto study within-industry variation, our results are not affected bycompositional differences across countries. If an industry withmany sole proprietors is particularly large in one country, forexample, this will not be problematic because our observations
18. We use a linear approximation of equation (18) to derive our estimatingequation (19) because it makes more transparent how changes in the labor shareare related to changes in the relative price of investment and highlights the vari-ation that identifies our elasticity estimate. If instead we directly use the nonlinear
equation (17) and estimate d1� sL, j ¼ þ 1� ð Þ�j þ uj, we obtain highly similarresults for s that differ from those in rows (i) to (iv) of Table I by –0.035 to0.008. We used numerical simulations to confirm that the approximation errorsin Section IV.B are also small.
GLOBAL DECLINE OF THE LABOR SHARE 89
at University of C
alifornia, Berkeley on January 24, 2016
http://qje.oxfordjournals.org/D
ownloaded from
are at the industry level. Second, the KLEMS data we use areonly available for 14 developed economies, where measurementpractices are more similar than in the larger group of countriesalready analyzed. Third, we verify that our results hold for twomeasures of the labor share in KLEMS, one that makes no ad-justment for unincorporated businesses (KLEMS 1) and anotherthat makes an adjustment (KLEMS 2).19
The last two rows of Table I report estimates of s using theKLEMS data set, with j indexing country-industry observationsfor 10 major industries and 14 developed economies. We includeboth country and industry fixed effects in the regression. Asshown in rows (v) and (vi), both elasticity estimates from thesedata are also significantly greater than 1.
Our estimates allow for substantial heterogeneity acrosscountries and industries. Initial differences in technology,wages, relative prices of investment, preferences, and depreci-ation rates are all captured by the initial level of the laborshare sL,j, which is allowed to vary across observations in theleft-hand side of equation (19). If our trends capture a steady-state-to-steady-state transition, and assuming constant discountfactor and depreciation rates over time (but not necessarily acrosscountries), our estimates of s allow for differences in the growthof wages, labor-augmenting technology, and anything other thancapital-augmenting technology and markups, which we addressshortly. The only substantial restriction we are imposing is acommon elasticity of substitution s between capital and laboracross countries or industries.20
19. In KLEMS 1, the labor share at the country-industry level is defined ascompensation of employees divided by gross value added, consistent with our meas-urement of overall labor shares above. In KLEMS 2, the numerator additionallyincludes a fraction of other taxes on production and an imputation for the income ofself-employed workers. The results reported in Section II.A use the KLEMS 1 def-inition of the labor share. They are qualitatively similar if we use KLEMS 2.
20. This restriction is tied to our strategy of using cross-sectional variation toidentifys. We prefer using cross-sectional variation as it eliminates the influence ofglobal trends, but to check the robustness of our results, we have also estimatedcountry or country-industry specific s’s based on long-term time-series variation.We generate an estimate ~j for each observation by dividing the left-hand side ofequation (19)by the right-hand side of equation (19)after dropping the constant and
the error term, ~j ¼ 1þsL, j sL, j
1�sL, jð Þ�j. The median elasticity estimate across countries in
the data set with the KN Merged labor share and the PWT prices equals 1.41.
QUARTERLY JOURNAL OF ECONOMICS90
at University of C
alifornia, Berkeley on January 24, 2016
http://qje.oxfordjournals.org/D
ownloaded from

Up to now our analysis imposes constant depreciation ratesover time. We note that if industries or countries that experiencedlarger declines in their relative price of investment are system-atically shifting the composition of their capital stock towardcapital goods with higher depreciation rates (e.g., computers),then our estimated s is generally biased downward. This isbecause a given labor share decline would be associated withsmaller declines in the rental rate of capital, therefore increasingthe elasticity of substitution between capital and labor necessaryto generate the positive relationship between labor share trendsand trends in the rental rate.21
We empirically assess the extent of this bias in the KLEMSdata set because it includes estimates of depreciation and capitalstocks at the country-industry level. We write the steady-stateexpression for the rental rate and add a subscript to the depreci-ation rate, Rj ¼ �jð
1�� 1þ �jÞ, which means we can no longer
equate growth in the rental rate with growth in the relativeprice of investment. We assume b= 0.91, measure �j and �j inthe KLEMS data, and calculate alternative values for Rj. Ourestimated elasticity does not change meaningfully. The valuesin rows (v) and (vi) of Table I, 1.17 and 1.49, increase to 1.19and 1.51, respectively, when taking into account heterogeneousand time-varying depreciation rates.
To summarize, our six baseline estimates of s in Table Iaverage 1.28, a bit more than our baseline value of 1.25 in row(i), and are all statistically greater than 1 at the 5% significancelevel. Section V analyzes in greater detail the implications of ourestimates. Here we note that using s= 1.25 together with cali-brated global values for sL and � as inputs in equation (19) impliesthat roughly half of the global decline in the labor share isexplained by the decline in the relative price of investment.
IV.B. Markups
We now allow for the possibility that our estimated elasticityis affected by markups mj. As a simple example of how markupscould bias our estimates from Section IV.A, consider the Cobb-Douglas case, which has an elasticity of substitution between
21. This argument assumes that the increase of depreciation does not morethan offset the decline in the price of investment, which is empirically true forthe great majority of observations.
GLOBAL DECLINE OF THE LABOR SHARE 91
at University of C
alifornia, Berkeley on January 24, 2016
http://qje.oxfordjournals.org/D
ownloaded from
capital and labor equal to 1. Though the labor share of costs isconstant, markups generate a wedge between costs and revenuesand can cause movements in the labor share of income. If mark-ups increased more in countries with larger declines in the rela-tive price of investment, then labor shares would decline more inthese countries. Without taking into account markup variation,our baseline procedure would incorrectly estimate an elasticitygreater than 1.
We use estimates of capital share trends in our data to ruleout this possibility. Under the assumption the trends reflectmovements from one steady state to another, the trend in eachcountry’s capital share equals the trend in its nominal invest-
ment rate, sK , j ¼dRjKj
Yj
� �¼
d�jXj
Yj
� �. If the true elasticity is 1 and
markup growth drives all labor share movements, then laborand capital shares of income change by the same percent.Figure IX plots the percent change in labor shares against thepercent change in capital shares. Countries do not lie along the45-degree line. Rather, the best-fit line has essentially zero slope.This finding provides strong evidence against the possibility thatwe estimate a nonunitary elasticity purely due to the bias frommarkups.
To more generally assess the effect of markups on our elas-ticity estimate, we calculate the markup levels mj and trends �j
and derive a modified estimating equation that includes theseterms. Since factor and profit shares sum to 1 and the markupcan be backed out directly from the profit share, the markup is
given by �j ¼1
1�s�, j¼ 1
sL, jþsK , j. Given our data on sL,j, the only add-
itional information we need to calculate markups is the level ofthe capital share, sK,j.
To calculate the capital share, we substitute the steady state
level of the rental rate Rj ¼ �j1�j� 1þ �j
� �and the steady-state
level of the capital Kj ¼Xj
�jinto equation (12) and write it as:
sK , j ¼RjKj
Yj¼
�jXj
Yj
� �1=�j � 1þ �j
�j
� �:ð20Þ
We calculate the first term of the right-hand side of equation (20)for each country as the average nominal investment rate in ourdata from the national income accounts. We assume the secondterm is homogeneous across countries and choose dj = 0.10 and bj
QUARTERLY JOURNAL OF ECONOMICS92
at University of C
alifornia, Berkeley on January 24, 2016
http://qje.oxfordjournals.org/D
ownloaded from
as before. This gives us the level of the markup. We then calculatethe trend in the markup as:22
�j ¼1
�j sL, jsL, j þ sK , jsK , j
� � :ð21Þ
We continue to assume no capital-augmenting technologicalprogress and set AK ¼ 0 in equation (18). Taking a linear approxi-mation around � ¼ 0 and � ¼ 0, adding a constant and an idio-syncratic error term, we obtain our modified estimating equation:
sL, j�j
1� sL, j�j
� �1þ sL, j
� �1þ �j
� �� 1
� �¼ þ �1ð Þ �jþ �j
� �þuj:ð22Þ
Table II reports our estimates of s from equation (22). Asbefore, we report values across multiple data sources on thelabor share and the relative price of investment, but here wealso report whether we use total or corporate nominal investmentdata in constructing markups. We consider these estimates lessreliable than our baseline estimates because they require richerassumptions and make use of imputed values as opposed to directmeasurements. Nonetheless, the results in Table II are highlysimilar to the baseline results in Table I.
The similarity in our estimated s when including or exclud-ing information on markups does not imply that markups playedno role in labor share movements. In fact, since we do not gener-ally find significant increases in capital shares, it must be the casethat some of labor share’s decline is attributable to markupgrowth. Given that our elasticity estimates remain unchanged,however, we maintain our conclusion that the decline in the rela-tive price of investment explains roughly half of the labor sharedecline.
22. Similar methodologies for calculating markups and profits are employed inRotemberg and Woodford (1995), Basu and Fernald (2002), and Fernald andNeiman (2011). The average initial profit share varies across data sources but gen-erally is less than 5%, consistent with most estimates in these papers. For somecountries this methodology implies negative profit shares. We have consideredvarious ad hoc treatments for such observations that bound profit shares above 0and have explored alternative values for b and d. Results vary depending on themethodology, but for small average profit shares, average estimates of s are con-sistently close to our baseline estimates. We only do this analysis at the countrylevel because when applied to the more disaggregated industry data, our procedureoften imputes implausibly large capital shares.
GLOBAL DECLINE OF THE LABOR SHARE 93
at University of C
alifornia, Berkeley on January 24, 2016
http://qje.oxfordjournals.org/D
ownloaded from

IV.C. Capital-Augmenting Technological Progress
Given the difficulty of properly measuring capital-augment-ing technology growth, our baseline analysis assumed that it isorthogonal to changes in the relative price of investment. Thisassumption would be violated, for example, if firms respond to thedecline in the relative price of investment by directing their in-vestments toward capital-augmenting technological improve-ments. If this or other mechanisms produced a negativecorrelation between growth in the relative price of investmentand growth in capital-augmenting technology, our elasticity esti-mates would be biased upward. In this section, we demonstratethat this bias is unlikely to be quantitatively large.
ARG
ARM
AUS
AUT
AZE
BLR
BEL
BOL
BRA
CAN
CHN CRI
CZE
DNK
EST
FIN
FRAGER
HUN
ISLITA
JPN
KEN
KOR
LVA
LTU
LUX
MEX
MDA
NAM
NLD
NZL
NOR
PER
POL
PRT
ROM
SGPSVK
SVN
ZAF ESP
SWE
CHE
TWNTHATUN
TUR
UKR
GBR
USA
−30
−10
1030
Tre
nd in
Log
Cap
ital S
hare
−30 −10 10 30Trend in Log Labor Share
FIGURE IX
Capital Share and Labor Share
The figure plots the trend in the log capital share against the trend in thelog labor share. All values are scaled to denote percent changes per 10 years.For example, a value of �10 for the trend in the log labor share means a 10%decline of the labor share every 10 years. For illustrative reasons, in this figurewe drop three observations (Kazakhstan, Kyrgyzstan, and Macau) with ex-tremely low weights in the regression of the first row of Table II and wewinsorize one observation in each dimension for both variables. The solid linerepresents the fitted relationship between trends in capital share and trends inthe labor share (slope 0.20 with a standard error of 0.23), whereas the dashedline represents the 45-degree line.
QUARTERLY JOURNAL OF ECONOMICS94
at University of C
alifornia, Berkeley on January 24, 2016
http://qje.oxfordjournals.org/D
ownloaded from
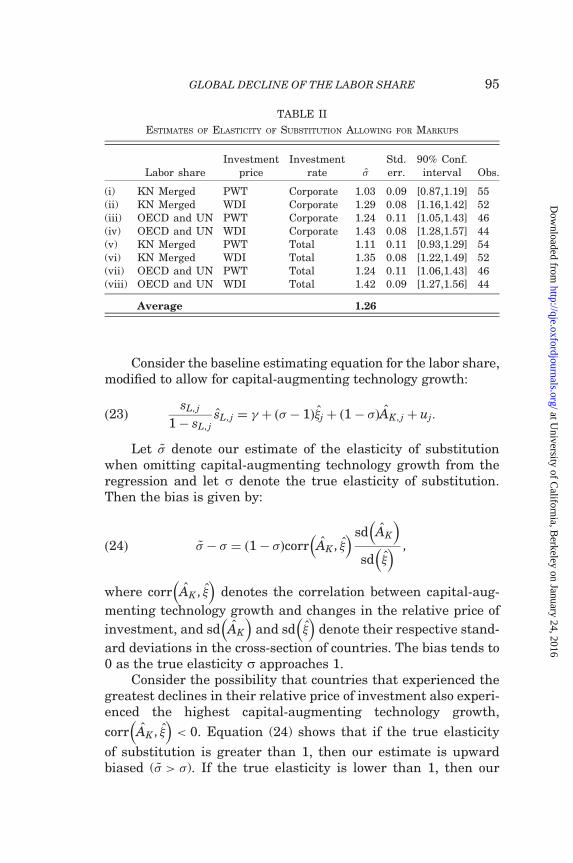
Consider the baseline estimating equation for the labor share,modified to allow for capital-augmenting technology growth:
sL, j
1� sL, jsL, j ¼ þ � 1ð Þ�j þ 1� ð ÞAK , j þ uj:ð23Þ
Let ~ denote our estimate of the elasticity of substitutionwhen omitting capital-augmenting technology growth from theregression and let s denote the true elasticity of substitution.Then the bias is given by:
~ � ¼ ð1� Þcorr AK , �� � sd AK
� �sd �� � ,ð24Þ
where corr AK , �� �
denotes the correlation between capital-aug-
menting technology growth and changes in the relative price of
investment, and sd AK
� �and sd �
� �denote their respective stand-
ard deviations in the cross-section of countries. The bias tends to0 as the true elasticity s approaches 1.
Consider the possibility that countries that experienced thegreatest declines in their relative price of investment also experi-enced the highest capital-augmenting technology growth,
corr AK , �� �
< 0. Equation (24) shows that if the true elasticity
of substitution is greater than 1, then our estimate is upwardbiased ( ~ > ). If the true elasticity is lower than 1, then our
TABLE II
ESTIMATES OF ELASTICITY OF SUBSTITUTION ALLOWING FOR MARKUPS
Labor shareInvestment
priceInvestment
rate
Std.err.
90% Conf.interval Obs.
(i) KN Merged PWT Corporate 1.03 0.09 [0.87,1.19] 55(ii) KN Merged WDI Corporate 1.29 0.08 [1.16,1.42] 52(iii) OECD and UN PWT Corporate 1.24 0.11 [1.05,1.43] 46(iv) OECD and UN WDI Corporate 1.43 0.08 [1.28,1.57] 44(v) KN Merged PWT Total 1.11 0.11 [0.93,1.29] 54(vi) KN Merged WDI Total 1.35 0.08 [1.22,1.49] 52(vii) OECD and UN PWT Total 1.24 0.11 [1.06,1.43] 46(viii) OECD and UN WDI Total 1.42 0.09 [1.27,1.56] 44
Average 1.26
GLOBAL DECLINE OF THE LABOR SHARE 95
at University of C
alifornia, Berkeley on January 24, 2016
http://qje.oxfordjournals.org/D
ownloaded from

estimate is downward biased. This logic implies that as long as
corr AK , �� �
< 0, the bias from capital-augmenting technology
growth would never cause us to mistakenly estimate an elasticityof substitution s that exceeds 1 if the true elasticity was smallerthan 1.
To quantify the size of the bias using equation (24), we needto specify values for the standard deviations of the relative priceof investment and capital-augmenting technology growth and forthe correlation between these two variables. To get a sense forthese moments, we combine our PWT and WDI data on � withcross-country estimates of TFP growth that we use as proxies forcapital-augmenting technology growth AK .23 Although imperfect,this is a reasonable exercise because AK is the product of capital-augmenting and Hicks-neutral technology growth. We estimate
corrðAK , �Þ ¼ �0:28, sdðAK Þ ¼ 0:10, and sdð�Þ ¼ 0:11. Given these
values, and given an estimate ~ ¼ 1:25, equation (24) implies atrue elasticity of s= 1.20.
Alternatively, we use the model to calculate the capital-aug-menting technology growth assuming that it accounts for all laborshare changes not attributable to changes in the relative priceof investment. Using the estimated values of the constant ~and residual terms ~uj in equation (19), the growth in capital-
augmenting technological progress is AK ¼~þ ~uj
1� ~ . We find that
the resulting cross-country pattern of AK is essentially uncorre-lated with �, which implies that the bias is close to 0.24
We conclude that any upward bias from capital-augmentingtechnology growth is small and unlikely to alter our conclusions.With alternative estimates of the covariance between AK and �,one can use equation (24) to obtain different magnitudes of thebias. For the results to differ significantly from ours, however, thecross-country pattern of capital-augmenting technology growthwould need to be significantly different than the patterns in
23. We use TFP estimates from the Conference Board’s Total EconomyDatabase, which are available from 1990 to 2012 for about 50 countries overlappingwith our data set. The estimated moments account for the existence of outliers andrepresent averages between the PWT and the WDI data sets.
24. The implied values for the growth in capital-augmenting technology varysignificantly across countries. The average growth in AK is 0.9% per year. The ma-jority of countries, including six out of the eight largest economies, exhibit positivegrowth.
QUARTERLY JOURNAL OF ECONOMICS96
at University of C
alifornia, Berkeley on January 24, 2016
http://qje.oxfordjournals.org/D
ownloaded from
both the external estimates of TFP growth and our internal esti-mates of capital-augmenting technology growth.
IV.D. Skilled versus Unskilled Labor
Our analyses thus far assume that all labor types are equallysubstitutable with capital. Influential work such as Krusell et al.(2000), however, has suggested the importance of the differentialsubstitutability of capital with different types of skill. Addition-ally, there have been significant trends in recent decades in theskill composition of the labor force related to changing skillpremia, specialization, and international trade. We use KLEMSdata to evaluate whether changes in the skill composition of thelabor force in a production function with differential capital-skillsubstitutability alter our conclusion that the decline in the rela-tive price of investment goods accounts for half of the decline inthe global labor share.
We maintain the assumption of a homogeneous capital stockKt but now distinguish between two types of labor, skilled St andunskilled Ut. Within the CES framework, there are three ways inwhich skilled labor, unskilled labor, and the capital stock can benested. The first way is as in the production function (14), inwhich the aggregate labor input is a function of different skills,Nt = Nt(St,Ut), and Nt and the capital stock Kt combine with aconstant elasticity of substitution s. In this case all our previousresults continue to apply.
The second way to nest the three inputs is through the pro-duction function:
Yt ¼ �1 �2K��1�
t þ ð1� �2ÞS��1�
t
� � ���1
�1
þð1� �1ÞU�1
t
! �1
,ð25Þ
where r is the elasticity of substitution between capital andskilled labor and s is the elasticity of those factors with unskilledlabor. We follow the same steps as in the two-factor case to derivethe corresponding estimating equation:
sL, j
1� sL, jsL, j ¼ þ � 1ð Þ�j þ dSj=Kj
� �þ uj,ð26Þ
where we continue to define the labor share as the sum of all
compensation to all labor types. The termdSj
Kj
� �denotes the
GLOBAL DECLINE OF THE LABOR SHARE 97
at University of C
alifornia, Berkeley on January 24, 2016
http://qje.oxfordjournals.org/D
ownloaded from
change in the ratio of skilled labor to capital. The third way tonest the three inputs is to reverse the structure in (25), withcapital and unskilled labor combining with each other with anelasticity of substitution r and the combined input aggregatingwith skilled labor with an elasticity s. This alternative produc-tion function leads to an identical estimating equation as equa-tion (26), but with Sj replaced by Uj.
We estimate s for both of these nesting structures using theKLEMS industry data, where the change in either skilled or un-skilled labor relative to capital is added as a covariate. We con-sider two definitions of unskilled labor, one that includesKLEMS’s definitions of both ‘‘middle’’ and ‘‘low’’ skill and theother just using ‘‘low.’’ As with the previous industry-level esti-mates, we use both KLEMS definitions of the labor share andinclude industry and country fixed effects. Table III presentsour estimates. Across the six specifications, the estimates for saverage 1.26, very close to the average of our baseline estimatesin Table I. In all cases, the estimated s is significantly differentfrom 1 at the 10% level.
As with the case of markups, the similarity in our estimateds when including or excluding the possibility of capital-skill com-plementarity does not imply that changes in the stock of skillplayed no role in labor share movements.25 Rather, the resultsin Table III simply confirm that even with these alternative pro-duction functions and taking into account the changing skill com-position of labor, the decline in the relative price of investmentcontinues to account on its own for about half of the labor sharedecline.
V. The Decline in the Labor Share
Figure I documented a 5 percentage point global decline inthe labor share. Figure VII documented a global decline in therelative price of investment goods of about 25%. Using cross-coun-try variation, we estimated an elasticity of substitution betweencapital and labor of about 1.25. This estimate proves stable when
25. Depending on the specification, the coefficients on cSK
� �or cUK� � suggest that
skill composition may in fact have played some role in the declining labor share. Thecoefficient on these covariates is a function of the two elasticitiessandr, the level ofSK or U
K, and the distribution parameter �2. So this regression alone cannot be used toidentify the value of r.
QUARTERLY JOURNAL OF ECONOMICS98
at University of C
alifornia, Berkeley on January 24, 2016
http://qje.oxfordjournals.org/D
ownloaded from
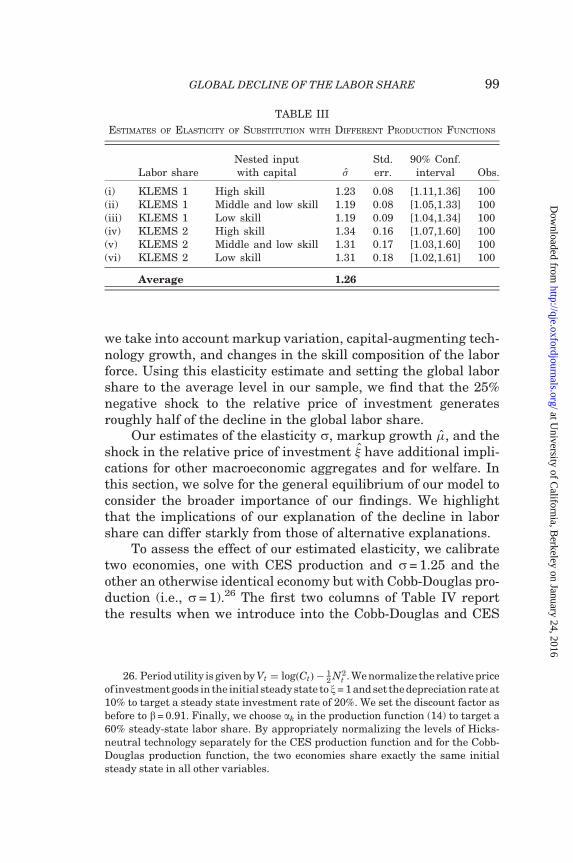
we take into account markup variation, capital-augmenting tech-nology growth, and changes in the skill composition of the laborforce. Using this elasticity estimate and setting the global laborshare to the average level in our sample, we find that the 25%negative shock to the relative price of investment generatesroughly half of the decline in the global labor share.
Our estimates of the elasticity s, markup growth �, and theshock in the relative price of investment � have additional impli-cations for other macroeconomic aggregates and for welfare. Inthis section, we solve for the general equilibrium of our model toconsider the broader importance of our findings. We highlightthat the implications of our explanation of the decline in laborshare can differ starkly from those of alternative explanations.
To assess the effect of our estimated elasticity, we calibratetwo economies, one with CES production and s= 1.25 and theother an otherwise identical economy but with Cobb-Douglas pro-duction (i.e., s= 1).26 The first two columns of Table IV reportthe results when we introduce into the Cobb-Douglas and CES
TABLE III
ESTIMATES OF ELASTICITY OF SUBSTITUTION WITH DIFFERENT PRODUCTION FUNCTIONS
Labor shareNested inputwith capital
Std.err.
90% Conf.interval Obs.
(i) KLEMS 1 High skill 1.23 0.08 [1.11,1.36] 100(ii) KLEMS 1 Middle and low skill 1.19 0.08 [1.05,1.33] 100(iii) KLEMS 1 Low skill 1.19 0.09 [1.04,1.34] 100(iv) KLEMS 2 High skill 1.34 0.16 [1.07,1.60] 100(v) KLEMS 2 Middle and low skill 1.31 0.17 [1.03,1.60] 100(vi) KLEMS 2 Low skill 1.31 0.18 [1.02,1.61] 100
Average 1.26
26. Period utility is given by Vt ¼ logðCtÞ �12 N2
t . We normalize the relative priceof investment goods in the initial steady state tox= 1and set thedepreciation rate at10% to target a steady state investment rate of 20%. We set the discount factor asbefore to b= 0.91. Finally, we choose ak in the production function (14) to target a60% steady-state labor share. By appropriately normalizing the levels of Hicks-neutral technology separately for the CES production function and for the Cobb-Douglas production function, the two economies share exactly the same initialsteady state in all other variables.
GLOBAL DECLINE OF THE LABOR SHARE 99
at University of C
alifornia, Berkeley on January 24, 2016
http://qje.oxfordjournals.org/D
ownloaded from
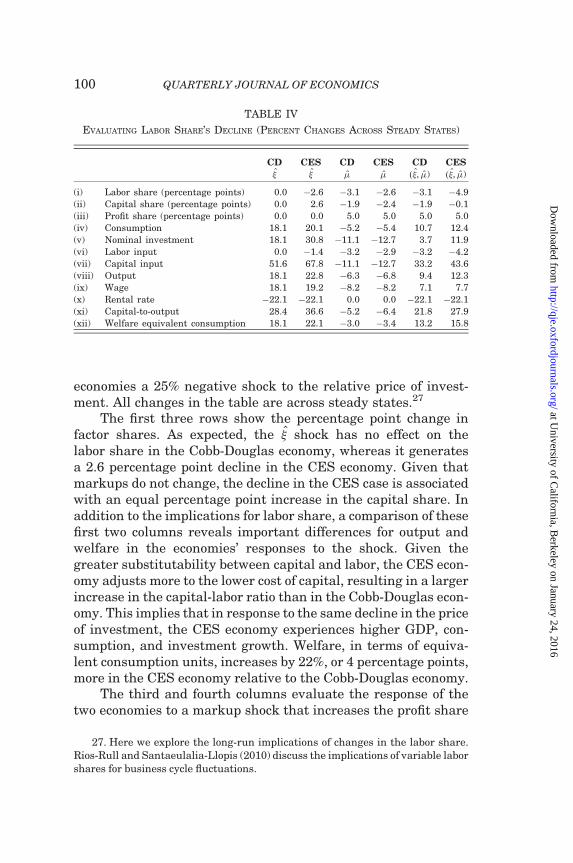
economies a 25% negative shock to the relative price of invest-ment. All changes in the table are across steady states.27
The first three rows show the percentage point change infactor shares. As expected, the � shock has no effect on thelabor share in the Cobb-Douglas economy, whereas it generatesa 2.6 percentage point decline in the CES economy. Given thatmarkups do not change, the decline in the CES case is associatedwith an equal percentage point increase in the capital share. Inaddition to the implications for labor share, a comparison of thesefirst two columns reveals important differences for output andwelfare in the economies’ responses to the shock. Given thegreater substitutability between capital and labor, the CES econ-omy adjusts more to the lower cost of capital, resulting in a largerincrease in the capital-labor ratio than in the Cobb-Douglas econ-omy. This implies that in response to the same decline in the priceof investment, the CES economy experiences higher GDP, con-sumption, and investment growth. Welfare, in terms of equiva-lent consumption units, increases by 22%, or 4 percentage points,more in the CES economy relative to the Cobb-Douglas economy.
The third and fourth columns evaluate the response of thetwo economies to a markup shock that increases the profit share
TABLE IV
EVALUATING LABOR SHARE’S DECLINE (PERCENT CHANGES ACROSS STEADY STATES)
CD CES CD CES CD CES� � � � ð�, �) ð�, �)
(i) Labor share (percentage points) 0.0 �2.6 �3.1 �2.6 �3.1 �4.9(ii) Capital share (percentage points) 0.0 2.6 �1.9 �2.4 �1.9 �0.1(iii) Profit share (percentage points) 0.0 0.0 5.0 5.0 5.0 5.0(iv) Consumption 18.1 20.1 �5.2 �5.4 10.7 12.4(v) Nominal investment 18.1 30.8 �11.1 �12.7 3.7 11.9(vi) Labor input 0.0 �1.4 �3.2 �2.9 �3.2 �4.2(vii) Capital input 51.6 67.8 �11.1 �12.7 33.2 43.6(viii) Output 18.1 22.8 �6.3 �6.8 9.4 12.3(ix) Wage 18.1 19.2 �8.2 �8.2 7.1 7.7(x) Rental rate �22.1 �22.1 0.0 0.0 �22.1 �22.1(xi) Capital-to-output 28.4 36.6 �5.2 �6.4 21.8 27.9(xii) Welfare equivalent consumption 18.1 22.1 �3.0 �3.4 13.2 15.8
27. Here we explore the long-run implications of changes in the labor share.Rios-Rull and Santaeulalia-Llopis (2010) discuss the implications of variable laborshares for business cycle fluctuations.
QUARTERLY JOURNAL OF ECONOMICS100
at University of C
alifornia, Berkeley on January 24, 2016
http://qje.oxfordjournals.org/D
ownloaded from
from an initial level of 3% to a final level of 8% while holding xconstant. Broadly in line with our results from Section IV.B, wechoose the scale of this markup shock to generate an identicaldecline in the labor share as generated by the � shock in theCES case. In the Cobb-Douglas case, consistent with the logicpresented earlier, the labor and capital shares decline by anequal percent (the values in rows (i) and (ii) are not equal asthey are in percentage points). Comparing the second andfourth columns, we conclude that alternative explanations foran equal decline in the labor share entail different macroeco-nomic implications. If labor share declines result from declinesin the relative price of investment with CES production, they areassociated with significant output and welfare gains. In contrast,labor share declines associated with markup increases in factreduce welfare.
The fifth and sixth columns consider the simultaneous intro-duction of a decline in the relative price of investment and anincrease in markups. In the CES case, these shocks togethercan produce the entire 5 percentage point decline in the laborshare. The changes in output and welfare in the case with bothshocks are quantitatively closer to the outcomes with only the �shock than to those with only the � shock. Markups may be ofroughly equal importance as the relative price of investment forexplaining the total global labor share decline, but this evidencesuggests that the component attributable to the markup shockhad far less important macroeconomic implications than the com-ponent attributable to the decline in the relative price ofinvestment.
VI. Conclusion
In this article we do three things. We document a decline inthe global labor share over the past 35 years, offer an explanationfor the decline, and assess the resulting macroeconomic implica-tions. We start by showing that the share of income accruing tolabor has declined in the large majority of countries and indus-tries. Larger labor share declines occurred in countries or indus-tries with larger declines in their relative price of investmentgoods. Next, we use this cross-sectional variation to estimatethe shape of the production function and conclude that the declinein the relative price of investment explains roughly half of the
GLOBAL DECLINE OF THE LABOR SHARE 101
at University of C
alifornia, Berkeley on January 24, 2016
http://qje.oxfordjournals.org/D
ownloaded from
decline in the global labor share. Finally, we explore the macro-economic and welfare implications of our results. We emphasizethat our explanation for the labor share decline carries with it sig-nificantly different implications from alternative explanations.
Our conclusions suggest several paths for future research.For example, the secular decline of the labor share suggeststhat nonunitary elasticities of substitution in production maybe an important element to incorporate in business cyclemodels. Our results also imply meaningful changes in the distri-bution of income when households have heterogeneous assets orwhen skills are differentially substitutable with capital and canaccumulate endogenously. Furthermore, as labor shares havedeclined, business earnings and corporate saving have increased.This large change in the flow of funds between households andfirms may have important macroeconomic repercussions.28
Last, our results support the view that changes in technol-ogy, likely associated with the computer and information technol-ogy age, are key factors in understanding long-term changes infactor shares. This raises natural questions. What will be thefuture path of the relative price of investment? Will the elasticityof substitution between capital and labor change over time?Standard macroeconomic models do not allow for long-termtrends in labor shares, a strong prediction that we show to beviolated in the data since the early 1980s. We hope our resultsgenerate new frameworks and analyses useful for thinking aboutthese future trends.
University of Chicago
University of Chicago
References
Acemoglu, D., ‘‘Directed Technical Change,’’ Review of Economic Studies, 69(2002), 781–809.
———, ‘‘Labor- and Capital-Augmenting Technical Change,’’ Journal ofEuropean Economic Association, 1 (2003), 1–37.
Antras, P., ‘‘Is the U.S. Aggregate Production Function Cobb-Douglas? NewEstimates of the Elasticity of Substitution,’’ B.E. Journal of Macroeconomics,4 (2004).
Azmat, G., A. Manning, and J. Van Reenen, ‘‘Privatization and the Decline of theLabour’s Share: International Evidence from Network Industries,’’Economica, 79 (2012), 470–492.
28. See Karabarbounis and Neiman (2012) for documentation of this globalincrease in saving by the corporate sector and for a model in which the sectoraldistribution of saving matters for macroeconomic allocations.
QUARTERLY JOURNAL OF ECONOMICS102
at University of C
alifornia, Berkeley on January 24, 2016
http://qje.oxfordjournals.org/D
ownloaded from

Barro, R., and X. Sala-i-Martin Economic Growth (New York: McGraw-Hill,1995).
Basu, S., and J. Fernald, ‘‘Aggregate Productivity and Aggregate Technology,’’European Economic Review, 46 (2002), 963–991.
Bentolila, S., and G. Saint-Paul, ‘‘Explaining Movements in the Labor Share,’’B.E. Journal of Macroeconomics, 3 (2003).
Blanchard, O., ‘‘The Medium Run,’’ Brookings Papers on Economic Activity, 2(1997), 89–158.
Blanchard, O., and F. Giavazzi, ‘‘Macroeconomic Effects of Regulation AndDeregulation In Goods and Labor Markets,’’ Quarterly Journal ofEconomics, 118 (2003), 879–907.
Chirinko, R., ‘‘s: The Long and Short of It,’’ Journal of Macroeconomics, 30 (2008),671–686.
Duffy, J., and C. Papageorgiou, ‘‘A Cross-Country Empirical Investigation of theAggregate Production Function Specification,’’ Journal of Economic Growth,5 (2000), 87–120.
Fernald, J., and B. Neiman, ‘‘Growth Accounting with Misallocation: Or, DoingLess with More in Singapore,’’ American Economic Journal:Macroeconomics, 3, no. 2 (2011), 29–74.
Fisher, J. D., ‘‘The Dynamic Effects of Neutral and Investment-SpecificTechnology Shocks,’’ Journal of Political Economy, 114 (2006), 413–451.
Gollin, D., ‘‘Getting Income Shares Right,’’ Journal of Political Economy, 110(2002), 458–474.
Greenwood, J., Z. Hercowitz, and G. W. Huffman, ‘‘Investment, CapacityUtilization, and the Real Business Cycle,’’ American Economic Review, 78(1988), 402–417.
Greenwood, J., Z. Hercowitz, and P. Krusell, ‘‘Long-Run Implications ofInvestment-Specific Technological Change,’’ American Economic Review, 87(1997), 342–362.
Harrison, A., ‘‘Has Globalization Eroded Labor’s Share? Some Cross-CountryEvidence,’’ Working Paper, University of California at Berkeley, 2002.
Hsieh, C.-T., and P. Klenow, ‘‘Relative Prices and Relative Prosperity,’’ AmericanEconomic Review, 97 (2007), 562–585.
Jones, C., ‘‘Growth, Capital Shares, and a New Perspective on ProductionFunctions,’’ Working Paper, Stanford University, 2003.
———, ‘‘The Shape of Production Functions and the Direction of TechnicalChange,’’ Quarterly Journal of Economics, 120 (2005), 517–549.
Kaldor, N., ‘‘A Model of Economic Growth,’’ Economic Journal, 67, no. 268 (1957),591–624.
Karabarbounis, L., and B. Neiman, ‘‘Declining Labor Shares and the Global Risein Corporate Saving,’’ NBER Working Paper No. 18154, 2012.
Krusell, P., L. E. Ohanian, J.-V. Rios-Rull, and G. L. Violante, ‘‘Capital-SkillComplementarity and Inequality: A Macroeconomic Analysis,’’Econometrica, 68 (2000), 1029–1053.
Leon-Ledesma, M., P. McAdam, and A. Willman, ‘‘Identifying the Elasticity ofSubstitution with Biased Technical Change,’’ American Economic Review,100 (2010), 1330.
Lequiller, F., ‘‘Treatment of Stock Options in National Accounts of Non-EuropeanOECD Member Countries,’’ Working Paper, OECD, 2002.
Lequiller, F., and D. Blades Understanding National Accounts (Paris: OECD,2006).
Restuccia, D., and C. Urrutia, ‘‘Relative Prices and Investment Rates,’’ Journal ofMonetary Economics, 47 (2001), 93–121.
Rios-Rull, J.-V., and R. Santaeulalia-Llopis, ‘‘Redistributive Shocks andProductivity Shocks,’’ Journal of Monetary Economics, 57 (2010), 931–948.
Rodriguez, F., and A. Jayadev, ‘‘The Declining Labor Share of Income,’’ HumanDevelopment Reports Research Paper 2010/36, 2010.
Rotemberg, J., and M. Woodford, ‘‘Dynamic General Equilibrium Models WithImperfectly Competitive Product Markets,’’ in Frontiers of Business CycleResearch, T. F. Cooley, ed. (Princeton: Princeton University Press, 1995).
GLOBAL DECLINE OF THE LABOR SHARE 103
at University of C
alifornia, Berkeley on January 24, 2016
http://qje.oxfordjournals.org/D
ownloaded from

This page intentionally left blank
at University of C
alifornia, Berkeley on January 24, 2016
http://qje.oxfordjournals.org/D
ownloaded from