Embed Size (px)
Citation preview
i
INTER-RELATIONSHIPS BETWEEN STOCK INDEX WITH RESIDENTIAL
PROPERTIES AND INDIRECT PROPERTY INVESMENT IN MALAYSIA
LEE YOUNG YEE
A project report submitted in partial fulfillment of the requirements
for the award of the degree of Master of Science (Real Estate)
Faculty of Geoinformation and Real Estate
Universiti Teknologi Malaysia
AUGUST 2014

iii
"To my beloved family, thank you for your support, lastly and most importantly for
my supervisor Dr. Janice Lee Yim Mei who never gave up inspiring and motivating
me, through this project. Thank you. "

iv
ACKNOWLEDGEMENT
I am thankful to my supervisor, Dr. Janice Lee Yim Mei, my panel Dr
Rohaya and Dr Najib for their comments, opinions and guidance. Many thanks to all
the lecturers in this Master course who taught me with valuable real estate insight
and knowledge.
Finally, I would like to thank to my course mates in assisting me to complete
this projects with relevant information and exchanged ideas.
v
ABSTRACT
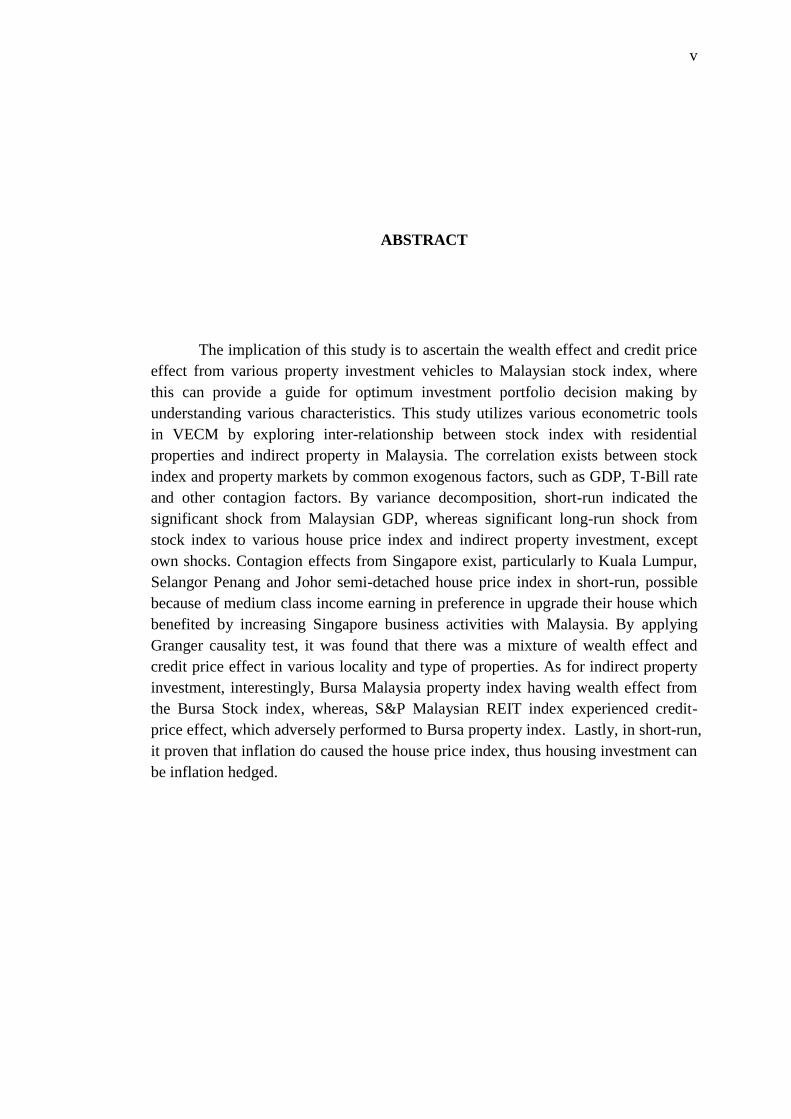
The implication of this study is to ascertain the wealth effect and credit price
effect from various property investment vehicles to Malaysian stock index, where
this can provide a guide for optimum investment portfolio decision making by
understanding various characteristics. This study utilizes various econometric tools
in VECM by exploring inter-relationship between stock index with residential
properties and indirect property in Malaysia. The correlation exists between stock
index and property markets by common exogenous factors, such as GDP, T-Bill rate
and other contagion factors. By variance decomposition, short-run indicated the
significant shock from Malaysian GDP, whereas significant long-run shock from
stock index to various house price index and indirect property investment, except
own shocks. Contagion effects from Singapore exist, particularly to Kuala Lumpur,
Selangor Penang and Johor semi-detached house price index in short-run, possible
because of medium class income earning in preference in upgrade their house which
benefited by increasing Singapore business activities with Malaysia. By applying
Granger causality test, it was found that there was a mixture of wealth effect and
credit price effect in various locality and type of properties. As for indirect property
investment, interestingly, Bursa Malaysia property index having wealth effect from
the Bursa Stock index, whereas, S&P Malaysian REIT index experienced credit-
price effect, which adversely performed to Bursa property index. Lastly, in short-run,
it proven that inflation do caused the house price index, thus housing investment can
be inflation hedged.

vi
ABSTRAK
Implikasi kajian ini adalah untuk menentukan wealth effect dan kesan credit
price effect daripada pelbagai jenis pelaburan hartanah kepada indeks saham
Malaysia, kita akan dapat panduan untuk optimum portfolio pelaburan membuat
keputusan dengan memahami ciri-cirinya. Kajian ini menggunakan pelbagai kaedah
ekonometrik dalam VECM untuk meneroka hubungan antara indeks saham dengan
index kediaman dan hartanah tidak langsung di Malaysia. Korelasi wujud di antara
indeks saham dan pasaran hartanah oleh faktor-faktor luaran yang sama, seperti
kadar KDNK, T-Bill dan faktor penularan lain. Dengan variance decomposition,
jangka pendek yang ditunjukkan shock ketara daripada KDNK Malaysia, manakala
shock jangka panjang dari indeks saham kepada pelbagai indeks harga rumah dan
pelaburan hartanah tidak langsung, kecuali shock sendiri. Kesan penularan dari
Singapura wujud, terutamanya ke Kuala Lumpur, Pulau Pinang dan Selangor Johor
indeks harga rumah berkembar dalam jangka pendek, kerana pendapatan para
pendapatan sederhana akan mengutamaan dalam menaik taraf rumah mereka, dengan
mendapat faedah dengan bertambahan aktiviti perniagaan antara Singapura dengan
Malaysia. Dengan menggunakan Granger causality test, didapati bahawa terdapat
campuran wealth effect dan credit price effect dalam pelbagai tempat dan jenis
hartanah. Bagi pelaburan hartanah tidak langsung, menarik, indeks harta Bursa
Malaysia mempunyai wealth effect daripada indeks Bursa Saham, manakala indeks
REIT Malaysia S & P mengalami credit-price effect. Akhir sekali, dalam jangka
pendek, ia membuktikan bahawa inflasi yang disebabkan indeks harga rumah, dan
pelaburan perumahan boleh dilindung nilai atas keadaan inflasi.
vii
TABLE OF CONTENTS
CHAPTER TITLE PAGE
DECLARATION ii
DEDICATION iii
ACKNOWLEDGEMENT iv
ABSTRACT v
ABSTRAK vi
TABLE OF CONTENTS vii
LIST OF TABLES xiv
LIST OF FIGURES xvii
LIST OF SYMBOLS xxi
LIST OF APPENDICES
xxiv
1 INTRODUCTION 1
1.1 Introduction 1
1.2 Background 2
1.3 Problem Statement 3
1.3.1 Descriptive Statistics and
Correlation Analysis
4
1.3.2 Wealth Effect and Credit Price
Effect
5
1.3.3 Geographical Differences 6
1.3.4 Exogenous Factors 6
1.3.5 Contagion Effects 7
1.3.6 Malaysia Context 8
1.4 Research Questions 10
1.5 Research Objectives 10
1.6 Scope of Study 11
viii
1.7 Significant of Study 11
1.8 Research Methodology 12
1.9 Chapter Organization 14
1.10 Expected Result 16
2 THE FACTORS FOR STOCK INDEX AND
REAL PROPERTIES
17
2.1 Introduction 17
2.2 House Price Index 18
2.3 Stock index, Bursa Property Index and
REIT
20
2.4 T-bill Rate 22
2.5 Exogenous factors 23
2.6 Contagion factors 24
2.7 Variables Study 27
3 RESEARCH METHODOLOGY 30
+ 3.1 Introduction 30
3.2 Descriptive Statistics 30
3.3 Correlation 31
3.4 Ordinary Least Square (OLS) 32
3.5 CUSUM Squared 32
3.6 Unit Root Test (ADF) 33
3.7 Johansen Co-integration Test 34
3.8 Variance Decomposition 36
3.9 Granger Causality Test 38
4 RESULT AND DISCUSSION 39
4.1 Introduction 39
4.2 Descriptive Statistics 43
4.3 Correlation 45
4.4 Ordinary Least Square (OLS) 45
4.5 CUSUM Squared – Structural Breaks 48
4.6 Unit Root Test (ADF) 50
4.7 Lag Selection 51
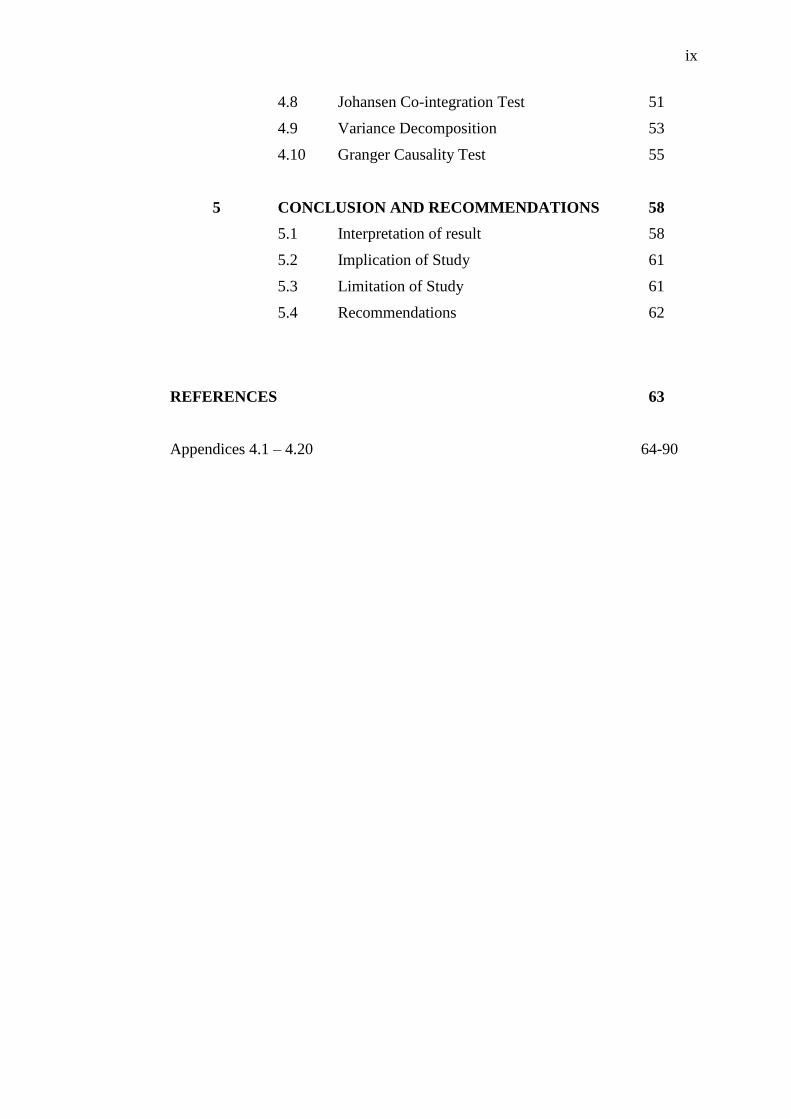
ix
4.8 Johansen Co-integration Test 51
4.9 Variance Decomposition 53
4.10 Granger Causality Test 55
5 CONCLUSION AND RECOMMENDATIONS 58
5.1 Interpretation of result 58
5.2 Implication of Study 61
5.3 Limitation of Study 61
5.4 Recommendations 62
REFERENCES 63
Appendices 4.1 – 4.20 64-90
x
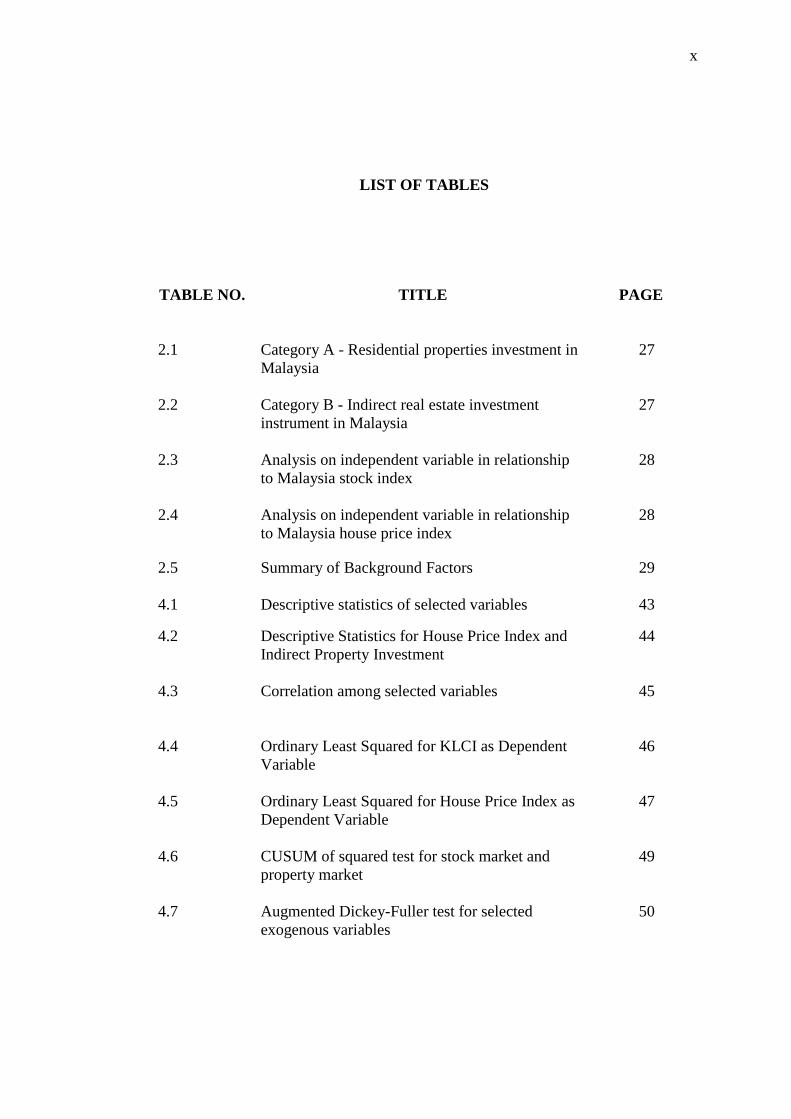
LIST OF TABLES
TABLE NO. TITLE PAGE
2.1 Category A - Residential properties investment in
Malaysia
27
2.2 Category B - Indirect real estate investment
instrument in Malaysia
27
2.3 Analysis on independent variable in relationship
to Malaysia stock index
28
2.4 Analysis on independent variable in relationship
to Malaysia house price index
28
2.5 Summary of Background Factors 29
4.1 Descriptive statistics of selected variables 43
4.2 Descriptive Statistics for House Price Index and
Indirect Property Investment
44
4.3 Correlation among selected variables
45
4.4 Ordinary Least Squared for KLCI as Dependent
Variable
46
4.5 Ordinary Least Squared for House Price Index as
Dependent Variable
47
4.6 CUSUM of squared test for stock market and
property market
49
4.7 Augmented Dickey-Fuller test for selected
exogenous variables
50
xi
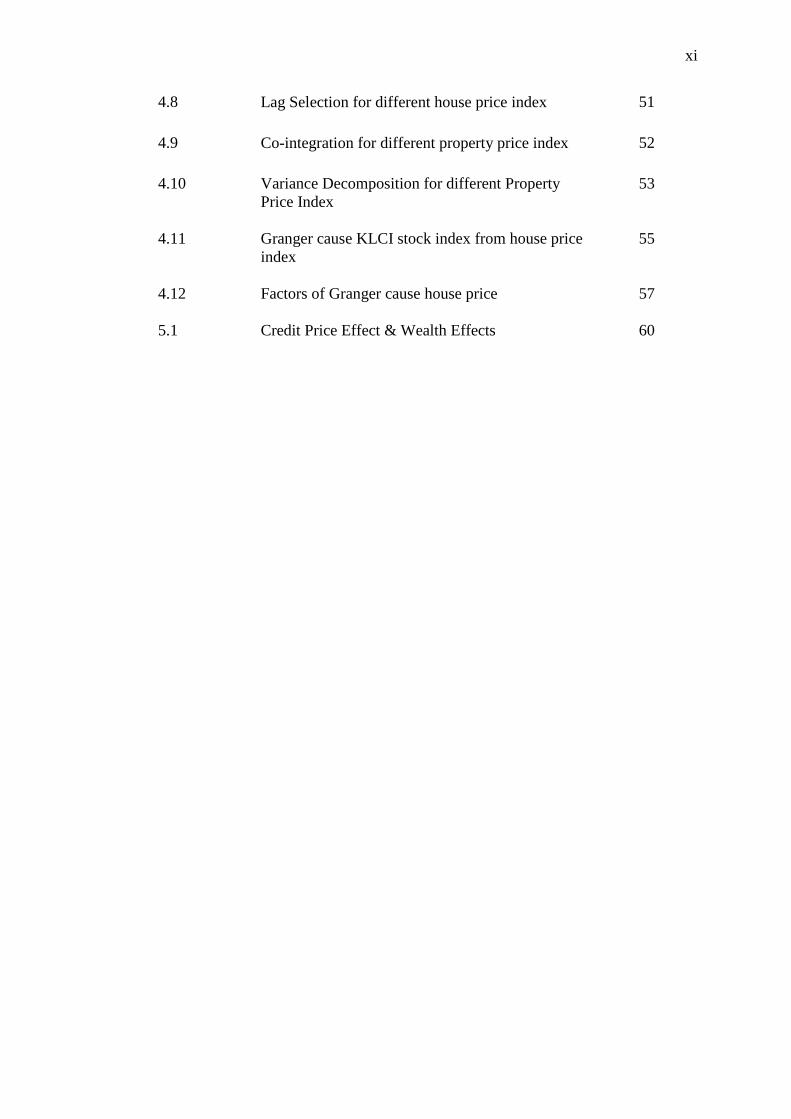
4.8 Lag Selection for different house price index 51
4.9 Co-integration for different property price index 52
4.10 Variance Decomposition for different Property
Price Index
53
4.11 Granger cause KLCI stock index from house price
index
55
4.12 Factors of Granger cause house price
57
5.1 Credit Price Effect & Wealth Effects 60
xii
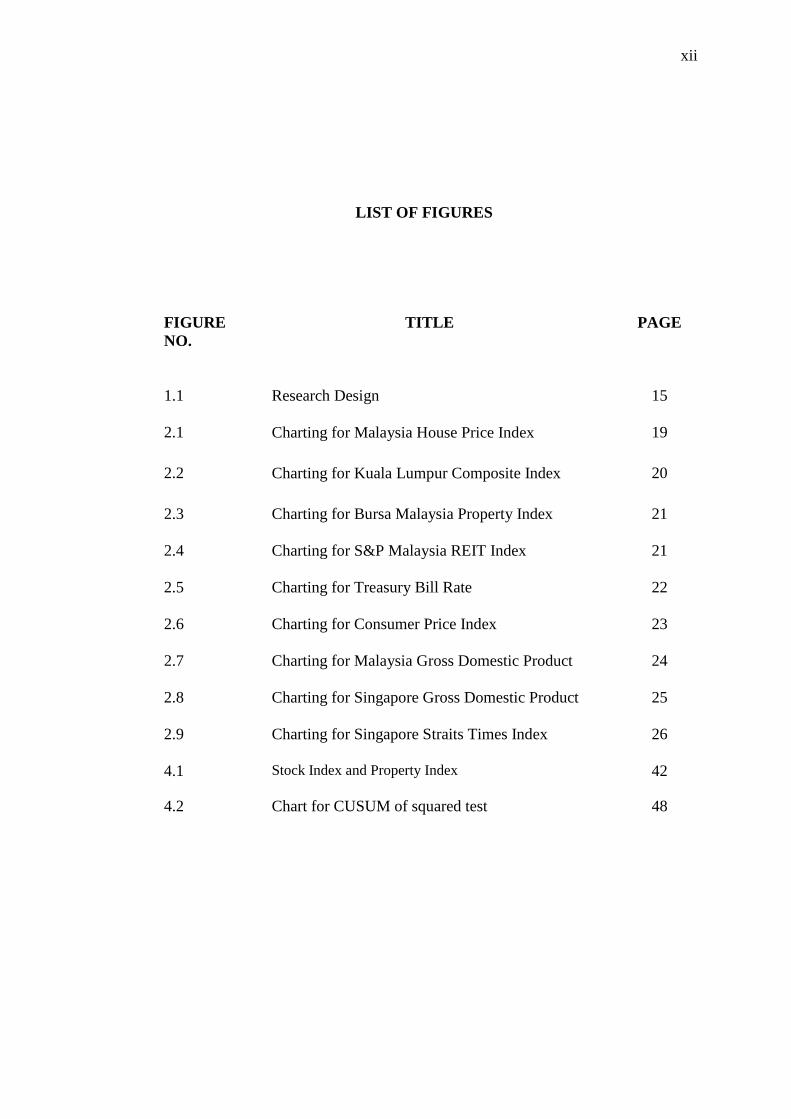
LIST OF FIGURES
FIGURE
NO.
TITLE PAGE
1.1 Research Design
15
2.1 Charting for Malaysia House Price Index 19
2.2 Charting for Kuala Lumpur Composite Index 20
2.3 Charting for Bursa Malaysia Property Index 21
2.4 Charting for S&P Malaysia REIT Index 21
2.5 Charting for Treasury Bill Rate 22
2.6 Charting for Consumer Price Index 23
2.7 Charting for Malaysia Gross Domestic Product 24
2.8 Charting for Singapore Gross Domestic Product 25
2.9 Charting for Singapore Straits Times Index 26
4.1 Stock Index and Property Index
42
4.2 Chart for CUSUM of squared test
48
xiii
LIST OF SYMBOLS
ADF - Augmented Dickey-Fuller Test
CUSUM - Cumulative Sum Control Chart
CPI - Consumer Price Index
GDP - Gross Domestic Products
JHA - Johor Overall House Price Index
JHD - Johor Detached House Price Index
JHH - Johor High-rise House Price Index
JHS - Johor Semi-Detached House Price Index
JHT - Johor Terrace House Price Index
KLA - Kuala Lumpur Overall House Price Index
KLCI - Kuala Lumpur Composite Index
KLD - Kuala Lumpur Detached House Price Index
KLH - Kuala Lumpur High-rise House Price Index
KLS - Kuala Lumpur Semi-Detached House Price Index
KLT - Kuala Lumpur Terrace House Price Index
MYA - Malaysia Overall House Price Index
MYD - Malaysia Detached House Price Index
MYGDP - Malaysia Gross Domestic Product
MYH - Malaysia High-rise House Price Index
MYS - Malaysia Semi-Detached House Price Index
MYT - Malaysia Terrace House Price Index
OLS - Ordinary Least Squared
PI - Bursa Malaysia Property Index
PGA - Penang Overall House Price Index
xiv
PGD - Penang Detached House Price Index
PGH - Penang High-rise House Price Index
PGS - Penang Semi-Detached House Price Index
PGT - Penang Terrace House Price Index
REIT - Real Estate Investment Trust
S&P - Standard & Poor
SGA - Selangor Overall House Price Index
SGD - Selangor Detached House Price Index
SGGDP - Singapore Gross Domestic Product
SGH - Selangor High-rise House Price Index
SGS - Selangor Semi-Detached House Price Index
SGT - Selangor Terrace House Price Index
STI - Singapore Strait Time Index
TBILL - Treasury Bill rate
VECM - Vector Error Correction Modal
xv
LIST OF APPENDICES
APPENDIX. TITLE PAGE
A Augmented Dickey-Fuller test for House Price
Index
65
B Lag selection 66
C Johanson Co-integration Test
72
D Variance Decomposition.
77
1
CHAPTER 1
INTRODUCTION
1.1 Introduction
Both real estate market and stock markets are important investment vehicles
to the general public, who will put substantial amount into their investment portfolio.
Thus, the observations on the fluctuation of the market price are an ideal action in
understanding of the market mechanism avoiding the blind spot and significant
depreciation of capital, and make a prudent investment and portfolio strategy.
Housing considered as a long-term investment which accounts for a large proportion of
household wealth (FTI, 2012). Moreover, residential property is represents a large
portion of household investment portfolio and ex-post efficient portfolio in
increasing with risk aversion of the investor (Ting 2003, Case et al, 2001), which
proved that investment in real property is significantly important role as a vehicle.
There are a great deals of considerations in selecting real estate instruments
or stock market or even a combination of both in investor portfolio in gain short
term or long term profitability in terms of rental, dividend yield and capital
appreciations. However, the business environment is constantly changes in nature,
direction or even the fundamental, this lead to a very uncertain and vague in future
market movements. Moreover, there are different market characteristics for each
2
investment instrument in relation to the market as a whole, some may react
sensitively and some may be lagged behind the market.
There are direct and indirect real estate investments in Malaysia, which in
this study will be include direct investment in residential real properties, whereas
indirect investment will be included with Real Estate Investment trust (REIT) and
property index comprise of listed property company in Malaysia. These are
important investment vehicle available in Malaysia real property market, as most of
the individual investor holding their most and significant asset holding in these
sectors. Thus, a better and in-depth study in understanding the market behavior
characteristics is extremely important for future investment strategy deployment and
portfolio management, in acquisition, disposal or hedging against the market.
Interrelationship and spillover effects from various economic indicators are
also influence the property market and stock market as a whole; it would be
worthwhile in investigating the interrelationship among them as well.
1.2 Background
This study is about interrelationship between various real estate investment
instruments and stock index. House price index is defined as periodic board measure
of movement of house price in the region from serving as an indicator of house price
trends; it provides an analytical tool for estimating the changes in the rates of
housing affordability basically. In Malaysian context, house price index computation
is based on sampling of transactions on house type stratification. As a result, fixed
basket of house characteristics of “average” house is revalued for each period by
Laspyeres index (JPPH, 2013)
3
Whereas, stock index is a measurement for stock market in arriving value
determination, typically by weighted average. It is a tool used by the investors to
describe the market and to make comparison on specific investment. In Malaysia,
we are using FTSE Bursa Malaysia Kuala Lumpur Composite, also known as KLCI
as our stock performance yardstick, which the index computation is based on
weighted capitalization of 30 listed companies (Bursa 2014).
Additionally, we also investigate the interrelationship between the stock
index and REIT, where REIT is an entity that own various type of real properties for
generating income which basically from rental and capital appreciation from the
property acquisition. Returns from REIT and S&P 500 proved that stock market
contains important and timely information on real estate fundamental (Gyourko and
Keim, 1992) Causality relationship between stock market and property market may
given different result by adopting different causality test (Okunev et al. , 2000).
Notwithstanding REIT is an indirect property investment, it would be worthwhile to
investigate in Malaysia context for its market characteristics in relation o stock index
and property markets. In comparison to unit trust, REIT which traded at the stock
exchanges and actively from an avenue for exploring the connection between stock
and real estate investment (Subrahmanyam, 2007).
1.3 Problem statement
There are many investment instruments available in Malaysian market. Apart
from stock market, real estate market is served as an important investment
instrument, especially for the direct real property, where it may involve substantial
of cash flow. Thus, prudently investment deployment is essential. In this study, we
need to ascertain the appropriate real estate instrument, for both direct and indirect,
which is closely related to the stock index in Malaysia. Relatively, we can be sure of
the property price is either overvalue or undervalue and the occurrence which cause
the changes in market condition and its amplitude.
4
In this study, by comparing different direct and indirect real estate
investment instruments, we can easily compare among them closeness for the
relationship to the economic yardstick of stock index. The direct real estate
investment terrace houses, semi-detached houses, bungalow, high-rise houses and
commercial properties in various geographical location in Malaysia. Whereas, the
indirect real estate investment may be including stock price for REIT Company as
well as Malaysian property index, who mainly are the major real estate players.
Thus, the important of this study is to undergo a comprehensive study on
stock index and house price index which taking consideration of exogenous factors
to ascertain not only the relationship, the shocks from variable and lead-lag causality
relationship. This is extremely important for an investor to have better knowledge of
individual economic or related factors that influence the market in order to have
better deployment of the portfolio.
1.3.1 Descriptive statistics and Correlation Analysis
Descriptive statistic is merely explaining the relationship between stock
market and real estate market; however this is not enough in explaining the factors
for the relationship. Thus, providing more empirical studies with manipulating
relevant the facts and data is essential to find out the interrelationship among all the
factors and variables. In this we can ascertain this particular Malaysian market on
the existence of wealth effects or credit effect or both in relationship to the cause and
effect approach, which may give a direction to the investors for both property and
stock markets. Otherwise, the investors may not really understand what their
financial resources investment deployment, which in some extent will turn to
disastrous in just mainly based on surface data.
There are quite a number of research in correlation analysis in ascertain the
relationship between stock and real estate’s market. However, based on different
5
countries and time periods, the result can be negative correlated (Ibbotson & Siegal,
1984, Eichholtz & Hartzell, 1996, Hartzell, 1986) or positive correlated (Worzala &
Vandell, 1993).
Simple correlation is not enough to address the co-movement, or defined as
the tendency of two or more variables to move in parallel. Many studies attempted to
explore the relationship between stock market and real property market. Low
positive correlation exists between stock market and real estate market, especially
for commercial sector (Newell and Chau, 1996). Bivariate analysis is unsatisfactory
because the relationship between variables might be already reflected from common
factor for stock market and property market (Quan & Titman, 1999: Ibrahim, 2010).
Thus, this study will not limited to a simple relationship study, but applying other
econometrics tools for better understanding of the market behavioral characteristics,
timing and the cause and effects relationship, for instance the CUSUM structural
breaks and Granger causality test would be recommended.
1.3.2 Wealth Effect and Credit Price Effect
There are two significant theoretical views in explaining the relationship
between stock and real estate price. Firstly, the well-know wealth effect, where
stresses a transmission channel from stock to real estate (Markowitz, 1952). Most
studies discovered that wealth effect on aggregate consumption and prices is
relatively weak (Fama, 1951: Fischer and Merton, 1984: Poterba and Samwick,
1995). Hence, it indicated the stock market lead the property market. Secondly, it is
the credit-price effects, which caused by the property holding in balance sheet in a
listed company increase its value, which possessed of large unrealized capital gain
that increase the company wealth, and hence the property market will lead the stock
market. Therefore, the interaction between these two assets markets will lead to a
complementation in price influences for each other’s (Chen, 2001). More studied in
6
examining the applied co-integration and Granger causality to time series data
between two assets market to ascertain the existence of wealth effect (Sutton, 2002;
Green, 2002) and credit-price effects (Sim and Chang, 2006: Ansari, 2006). It would
be reasonable that higher stock prices raised the share of household’s portfolios in
stock market and caused a readjusting their portfolio by stock disposal and
acquisition of real estate (Kapopoulos & Siokis, 2005). Therefore, in Malaysian
context, it would be an indication for investment strategy deployment.
1.3.3 Geographical differences
After finding out the relationship between stock market and real estate
market, there would be different relationship between geographical region with
different price level, as Green (2002) noted, a more expensive market could be a
prime candidate for wealth effect, thus with various reasons, which including
quantity supply, changes in demands will constitute different outcome. Thus, it will
worthwhile to investigate different real estate market in the country, because
different geographical location, do have different market characteristics (Panayotis
Kapopoulos & Sioks, 2005). This is important for this study include various market
from different location in Malaysia
1.3.4 Exogenous factors
There are spill-over effects in economic and financial stability in the real
estate investment with a cleared define of fundamental (Hibers et al., 2008). Using
equilibrium price equation which including residential property price index and
exogenous variables, such as GDP, interest rate, inflation, household consumption
and stock index, can be a test for the existence of property bubbles in its correlations
7
in Korea and Japan (Kim and Suh. 1993). Pricing modal with empirical study in its
equation that consists of income and price conducted for Tokyo office market from
1977 to 1999; the variable included net operating income, office occupation rate,
price index and general economic indicator, for instance, GDP, inflation rate and
interest rate (Peng and Hudson-Wilson). Interest rate is the investor ability in
borrowing to finance investment in property and stock market (Chen, 2001). There
is a strong evident of hedging effectiveness in relation to real property and inflation
(C.L. Lee, 2014). Economic growth is a common factor for real estate market,
government intervention in economic means affect the house price (Chen et al,
2014). This concludes that, in this study, those exogenous variable have to be
included in order to ascertain the interrelationship, especially GDP, interest rate,
inflation rate and etc.
As for property stock listed in Malaysia Bursa stock exchange, it also
affected by the economic climate and political condition, it showed year 2004, the
listed Malaysia property stock performance is at its worst level by OLS in studying
various financial ratios (Chan et al., 2012). This is an important real estate
investment instrument in relation to its performance with stock index which backed
by real estate industry spearhead.
1.3.5 Contagion effects
According to World Bank (2011), there are ideas of contagion where it defined
either, the cross country shocks transmission or across the countries spillover effects,
or the shocks transmission to other countries which may beyond any fundamental
link among the countries and beyond the common shock or contagion occurs when
cross-country correlations increase during “crisis” or unexpected incidents relative
to correlations during “tranquil”, where the market or business environment
considered stable in a sense.
8
According to Calvo and Reinhart (1966) there were two types of contagion.
Fundamental-based contagion is the first type, which arisen from connection
involved among the “infected” countries and others by form of trading for goods and
services or finance activities. Secondly, as a “true” contagion, this is a herding
behavior among the investors by following the trend (Calvo and Mendoza, 1988:
Kaminsky and Reinhard, 2000). There are evident that interdependence between
Hong Kong stock market and Mainland economy, which in the same time affect the
Hong Kong real estate market as contagion effect (Hui and Ng, 2011; Ni J.S. & Liu
J.C. , 2011).
Thus, in this study, as Malaysia and Singapore economic is closely connected,
GDP as an economic factors may be included in the study for both Malaysia and
Singapore in studying the relationship between Malaysian stock index and real estate
market and other indirect property investment instruments.
1.3.6 Malaysian Context
In Malaysia context, a wealth effect and credit price effect studied was done
for various markets in the country. Generally, found that there were mixture of credit
price effect and wealth effect throughout the country (Lean, 2012).
However there are few differences between Lean’s study and this study.
Lean’s studied is based on year 2000~2010, however in this study, the examination
from 2000Q1-2013Q4 will be observed for lasted update in arriving variance
decomposition and Granger causality test. Lean’s studied only based on BLR as
exogenous factors, however, in this studies exogenous factor in considering the
influences from the market, GDP, inflation and contagion effect from Singapore will
be taken into consideration. This is to have better finding of the impact of shock to
9
the housing price index as well as stock index. In additionally, the time for the
critical point for the transformation of the market behavior which related to the lead-
lag relationship for the mentioned indexes?
We opted for T bill yield rate instead of BLR taken as exogenous factor,
because of the tendency to intrinsic rate and behavioral movement for market
reaction on fluctuation to the reality. Lean’s study is only covered for whole market,
Selangor, Penang and Kuala Lumpur. However, in this study, we will have
comprehensive study for more geographical region, which including Johor state and
various major city. Econometrics tools is difference in structural break studies as
well as this study will have additional application of variance decomposition for
ascertain the medium-term and short-term shock from various exogenous factors.
This is to further ascertain the extent of impact for various exogenous factors.
Contagion effects is a one of the vital part in this study, which we consider
Singapore economic effect do have some influence to Malaysia property market,
particularly Johor state. A further study in Johor state housing market will be
conducted in relation to Singapore stock index as dependent variable.
Thus, we have to ascertain the relationship between the Malaysian stock
market and property market in different periods. Because there do have different
reasons for different price movement. Thus the structural break does provide us the
direction for the study. Variance decomposition explaining the shocks from
exogenous factors and Granger causality provide the cause and effects. This will be
a comprehensive study for Malaysia property market, which is very important for
any investor in investment decision making for certain geographical area or indirect
investment vehicle.
10
1.4 Research Questions
1. What is the correlation between stock market and real estate market as a
whole or different property types and property markets, as well as
influences from other control variable, such as interest rate, GDP and
contagion effect from Singapore market? What is the relationship among
stock index with REIT and Bursa Malaysian property index?
2. What are the reasons and the time for structural breaks in relationship
between stock index and housing price index?
3. Any wealth effects and credit price effect in Malaysia? What is impact
for that?
1.5 Research Objectives
1. To identify the relationship between stock market and real estate market,
for different property type, property market and property investment
instruments, which includes the impact from exogenous factors.
2. To identify the causes and critical point for the transformation of the
lead-lag relationship between stock index and housing price index.
3. To identify wealth effect and credit price effect in Malaysian stock
market and real estate investment by causality test. To have details on the
action and reaction for residential properties, property index and REIT to
the stock index for ascertain the reason for the relationship.
11
1.6 Scope of Study
The data obtained for the study including the stock market index as well as
residential property index from the year 2000Q1 to 2013Q4. REIT index will be
collected from 2006Q4 to 2013Q4. Besides this, other exogenous factors also
included, for instance Malaysia GDP, T-bill yield from government, Consumer price
index (CPI) and Singapore GDP and Singapore stock index for the same period.
1.7 Significant of study
1 Individual investor
The findings of this study allow the individual investor to make wise
decision making in real estate investment instrument selection with
their limited financial resources.
2 Institutional investor
The findings of this study allow the institutional investor to have
better knowledge of characteristics the mentioned real estate
investment in managing the portfolio, especially in a balanced
investment deployment.
12
1.8 Research Methodology
Broadly, this study undergoes different stages in investigating the
interrelationship among the stock index, property index and exogenous factors.
i. Stage 1 – Preliminary study
Descriptive statistics to identify the central tendency thought-out study
period. Additionally, the correlation to ascertain the causal relationship,
and OLS to identify the significant relationship
ii. Stage 2 – Structural breaks
CUSUM- square applied to identify the period of structural breaks
between stock index and real property investment vehicles.
iii. Stage 3 – Data processing
Natural logs for all data, except CPI and T-bill rate, which is to avoid any
possible any heteroscedasticity. Further on this, unit root test for
identifying the stationary of the data, if needed first differential the data
from non-stationary to stationary data, which is required for Vector error
correction model (VECM). This study will adopt Augmented Dickey-
Fuller (ADF) test.
iv. Stage 4 – Lag selection and co-integration
Before using VECM modal, we have to identify the lag selection and co-
integration. As for lag selection, we can adopt from sequential modified
LR test (LR), Final prediction error (FPF), Akaike information criterion
(AIC), Schwarz information criterion (SC) and Hannan-Quinn
information criterion (HQ) at 5% level. Using the selected lag, we
perform the Johansen co-integration test to identify number of co-
integration variables. It because only variables with at least one co-
integrated can be use in VECM.
13
v. Stage 5 – Identify the shock
Variance decomposition is to identify the own shock or variables shock
for short term and medium term which obverse from the past historical
data.
vi. Stage 6 – causality test
Granger causality test is to identify the lead-led relationship, which in
hence to conclude the wealth effect or credit price effect and other
independent granger causes impacts,
14
1.9 Chapter Organization
Chapter 1
It is about introduction of the real estate investment market in Malaysia and outline
of the structure of this study, which including the problem statement, objective of
the study, scope of study, significant of study, research methodology and data
collection and organization of study.
Chapter 2
There are definition of the direct property investment for related property type and
market, which also including the indirect investment instrument like REIT and
Bursa Malaysia property index. Moreover, the further definition and explanation on
Malaysian stock index and other exogenous economics control exogenous variables
which might affect the real estate market.
Chapter 3
This chapter is focuses in implementation of research methodology and data analysis
from data collected from 1988 to 2013.
Chapter 4
This chapter is regarding the data analysis with different econometrics tools such as
descriptive statistics, correlation, OLS, CUSUM, differentials for stationary data,
ADF test, Johnson co-integration test, variance decomposition and Granger causality
test.
Chapter 5
This chapter comprises of conclusion of the study, as well as implication and
limitation of the study. Furthermore, there are some recommendations for further
investigation beyond this study.
15
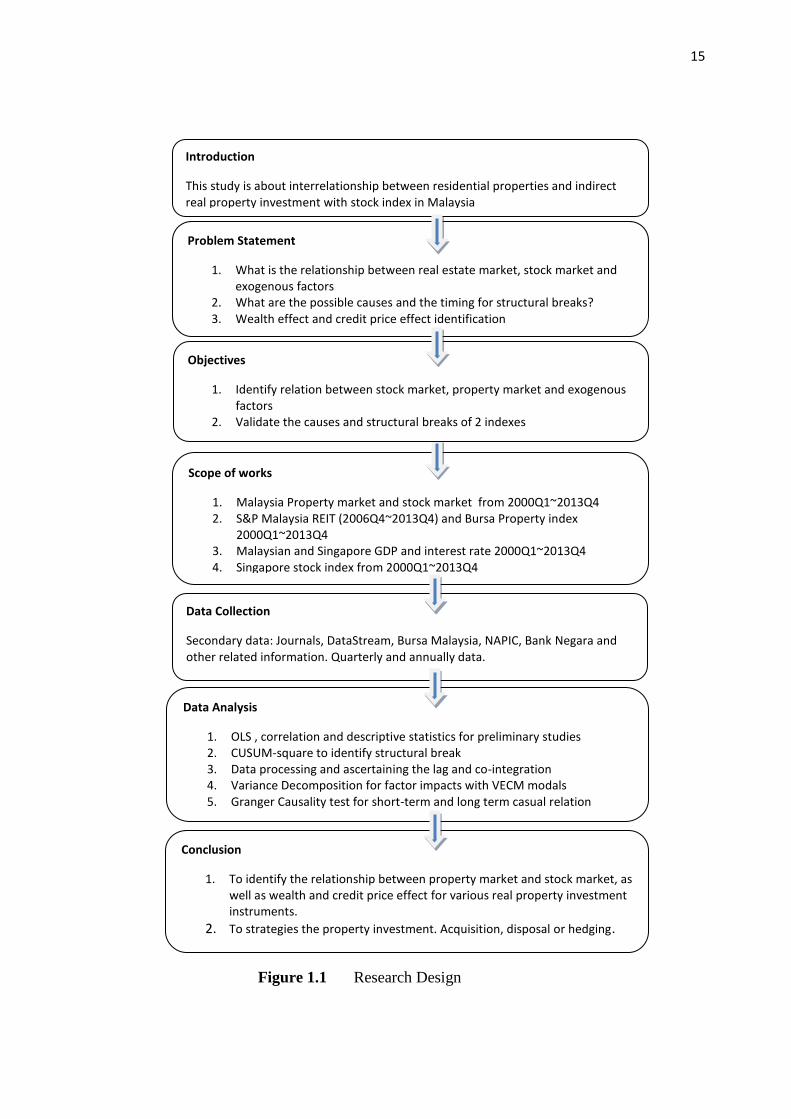
Figure 1.1 Research Design
Scope of works
1. Malaysia Property market and stock market from 2000Q1~2013Q4 2. S&P Malaysia REIT (2006Q4~2013Q4) and Bursa Property index
2000Q1~2013Q4 3. Malaysian and Singapore GDP and interest rate 2000Q1~2013Q4 4. Singapore stock index from 2000Q1~2013Q4
Data Collection
Secondary data: Journals, DataStream, Bursa Malaysia, NAPIC, Bank Negara and other related information. Quarterly and annually data.
Data Analysis
1. OLS , correlation and descriptive statistics for preliminary studies 2. CUSUM-square to identify structural break 3. Data processing and ascertaining the lag and co-integration 4. Variance Decomposition for factor impacts with VECM modals 5. Granger Causality test for short-term and long term casual relation
Conclusion
1. To identify the relationship between property market and stock market, as well as wealth and credit price effect for various real property investment instruments.
2. To strategies the property investment. Acquisition, disposal or hedging.
Objectives
1. Identify relation between stock market, property market and exogenous factors
2. Validate the causes and structural breaks of 2 indexes 3. Identify wealth effect and credit price effect
Problem Statement
1. What is the relationship between real estate market, stock market and exogenous factors
2. What are the possible causes and the timing for structural breaks? 3. Wealth effect and credit price effect identification
Introduction
This study is about interrelationship between residential properties and indirect real property investment with stock index in Malaysia
16
1.10 Expected outcome
There should be one of the real estate investment type or market that appear
with high correlated to the stock market index as well as identify the time for
structural breaks. Whenever it can be ascertain, we can conclude the determinants of
real estate market to the stock index by variance decomposition analysis. It may also
prove that, if wealth effect is exaggerated, the real estate may lead to the hinge of
property bubbles. As a metaphor, when we conclude the relationship between stock
index and real estate vehicle, we can make slightly adjustment for hedging
effectiveness by using stock futures index. Hedging purpose is an important issue in
investment to avoidance from the risks with minimum transaction charges to protect
the investor’s capital.
63
REFERENCES
Alessio Ciarlone (2011). Housing wealth effect in emerging economies. Emerging
Market Review. 12, 399-417
Belayet H & Ehsan L. (2009). Determinants of housing price volatility in Canada: a
dynamic analysis. Applied Economics. 41, 3521-3531
Chan K.T, Yap V.C (2010). Stock Performance of the property sector in Malaysia .
Journal of Modern Accounting and Auditing. l8(2), 241-246
Chen M.C , Kawaguchi Y. and Patel K. (2004). An analysis of the trends and
cyclical behaviors of house price in the Asian markets. Journal of Property
Investment & Finance. 22(1), 55-75.-
Lee C.L. (2008). The inflation-hedging characteristics of Malaysian residential
property. Journal of Housing Markets and Analysis.7(1), 61-75
Green, R (2002). Stock prices and house prices in California: New evidence of
wealth effect? Regional Science and Urban Economics. .32, 775-783
Hui C.M. & Ng M.H (2011)., Wealth effect, credit price effect, and inter-
relationships between Hong Kong’s property market and stock market.
Property Management. 30(3), 255-273
Hassan G.T (2014). Dynamic Relationship between House Prices in Malaysia’s
Major Economic Regions and Singapore House Price. Regional Studies 2014
Hi J.S. & Liu J.C. (2011). The study in house market and stock market in China-
Hong Kong-US. International Conference on Business and Economics
Research. 1(2011)
64
Lean H.H., Russell Smyth.(2014) “Dynamic Interaction between House Price and
Stock Prices in Malaysia” International Journal of Strategic Property
Management. 18(2), 163-177
Lean H.H. & Russell Smyth (2012). REITs, Interest Rates and Stock Prices in
Malaysia, International Journal of Business and Society. 13(1), 2012, 49-62
Lean H.H. & Russell Smyth (2014). Dynamic interaction between house prices and
stock prices in Malaysia, International Journal of Strategic Property
Management.18(2), 163-177
Lean H.H. (2012), Wealth Effect or Credit-Price Effect? Evidence from Malaysia.
Procedia Economics and Finance. 1 , 259-268
Liao W.C. , Zhao Daxuan & Sing T.F. (2014) , Risk Attitude and Housing Wealth
Effect, Journal of Real Estate Finance Economic ). 48,467-491
Kapopoulos P. and Siokis F. (2005). Stock and real estate prices in Greece: wealth
versus credit-price effect. Applied Economics Letter. 12, 125-128
Sim S.H. & Chang B.K. (2006), Stock and Real Estate Markets in Korea: Wealth or
Credit-Price Effect, Journal of Economic Research 11, 99-122
Ting Y.K. (2006), The role of residential property in personal investment portfolio:
The case of Malaysia, Pacific Rim Property Research. 10(4) 466-485