Embed Size (px)
Citation preview

u
pni jou C kx 1 *4 **J I H I i -J
i "^! y f
? O l C &.,^ -*. * i *»»*.

Hydrogeology and Results of Injection Tests at Waste-Injection Test Sites in Pinellas County, Florida
By JOHN J. MICKEY
Prepared in cooperation with Pinellas County and the City of St. Petersburg, Florida
U.S. GEOLOGICAL SURVEY WATER-SUPPLY PAPER 2183

UNITED STATES DEPARTMENT OF THE INTERIOR
JAMES G. WATT, Secretary
GEOLOGICAL SURVEY
Dallas L. Peck, Director
UNITED STATES GOVERNMENT PRINTING OFFICE: 1982
For sale by Distribution Branch Text Products Section U.S. Geological Survey 604 South Pickett Street Alexandria, Virginia 22304
Library of Congress Cataloging in Publication Data
Mickey, John J.Hydrogeology and results of injection tests at waste-injection test sites in Pinellas County, Florida.(Geological Survey water-supply paper; 2183)"Prepared in cooperation with Pinellas County and the City of St. Petersburg, Florida."Bibliography: p.1. Waste disposal in the ground Florida Pinellas County. 2. Water, Underground Florida Pinellas
County. I. Title. II. Series. TD761.H52 627'.56 81-607052
AACR2

CONTENTSAbstract 1 Introduction 1
Purpose and scope 3 Acknowledgments 3
Geologic framework 3 Definitions and methods of study 4 Hydrogeology of the test injection sites 7
Surficial aquifer 7 Floridan aquifer 8
Permeable zone A 9 Permeable zone B 11 Permeable zone C (injection zone) 13 Permeable zone D 15 Semiconfining beds 18
Upper confining bed 20 Lower confining bed 20 Ground-water-level fluctuations 23Ground-water flow in permeable zone C (injection zone) 23 Water quality 25
Injection tests 25McKay Creek 28 South Cross Bayou 28
Pressure buildup 29 Southwest St. Petersburg 31
Use of dye tracer 31 Water-quality changes 34 Water-level and pressure buildup 35
Summary 38 References 40 Conversion factors 42
FIGURES
1. Map showing location of Pinellas County and the city of St. Petersburg 12. Map showing location of test injection sites 23. Stratigraphic and hydrogeologic section, South Cross Bayou test injection
site 64. Hydrogeologic section A-A' through injection sites 75. Hydrogeologic section B-B' through injection sites 86. Plan showing location of wells at South Cross Bayou, southwest
St. Petersburg, McKay Creek, and Bear Creek 97. Vertical sections showing altitude of open intervals in wells at South Cross
Bayou and southwest St. Petersburg 108. Vertical sections showing altitude of open intervals in wells at McKay Creek
and Bear Creek 119. Map showing top of Floridan aquifer, Pinellas County 12
10. Graph showing drawdown in southwest St. Petersburg well B5 during pumping of well B8 13
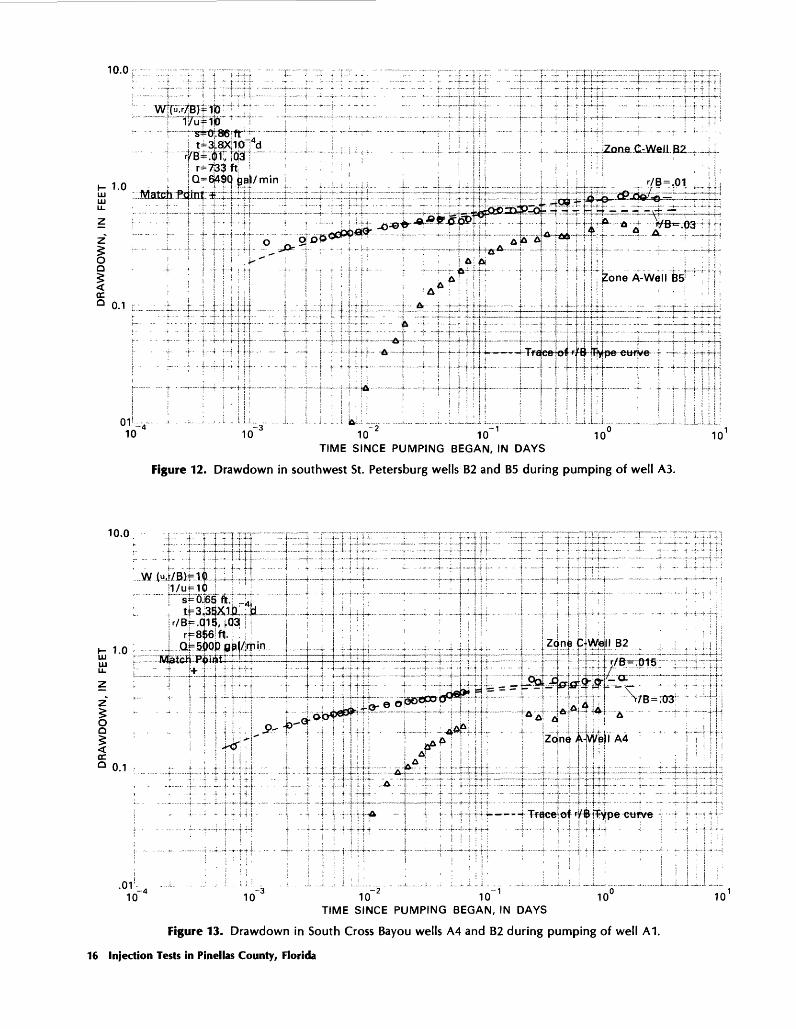
11. Map showing top of permeable zone C (injection zone), Pinellas County 1412. Graph showing drawdown in southwest St. Petersburg wells B2 and B5 during
pumping of well A3 1613. Graph showing drawdown in South Cross Bayou wells A4 and B2 during
pumping of well Al 16
III

CONTENTS Continued
FIGURES Continued
14. Graph showing drawdown in McKay Creek wells Bl and B3 during pumping of well A3 17
15. Graph showing log-normal probability plot of vertical hydraulic conductivity of limestone cores from semiconfining beds overlying zone C (injection zone) 19
16. Map showing thickness of upper confining bed of the Floridan aquifer, Pinellas County 21
17. Map showing configuration of top of lower confining bed of the Floridan aquifer, Pinellas County 22
18. Barogram at southwest St. Petersburg and hydrograph at Mullet Key tide station for March 9-10, 1977 23
19. Hydrographs from permeable zones at southwest St. Petersburg for March 9-10, 1977 23
20. Graph showing comparison of 1977-78 water levels from Mullet Key tide station and Bear Creek, zone D 24
21. Vertical section A -A' showing chloride and dissolved-solids concentration in ground water 29
22. Vertical section B-B' showing chloride and dissolved-solids concentration in ground water 30
23. Map showing chloride concentration in water from selected wells open to permeable zone A, Pinellas County and surrounding area 32
24. Map showing chloride concentration in water from selected wells open to permeable zone C (injection zone), Pinellas County and surrounding area 33
25. Graph showing chloride concentration in water from wells A2 and B2 during injection test, McKay Creek 34
26. Vertical section showing chloride concentration in water from observation wells after injection test, South Cross Bayou 35
27. Vertical section showing calculated pressure changes in observation wells at end of injection test, South Cross Bayou 35
28. Graph showing rhodamine WT concentration in injected water and in water from wells B3 and B6 during injection test, southwest St. Petersburg 36
29. Vertical section showing chloride concentration in water from observation wells at end of injection test, southwest St. Petersburg 37
30. Graph showing chloride concentration in water from wells B3 and B6 during injection test, southwest St. Petersburg 38
31. Graph showing water-level buildup in wells B2 and B5 and changes in density of water from wells B2, B3, and B5 during injection test, southwest St. Petersburg 39
32. Vertical section showing calculated pressure changes in observation wells at end of injection test, southwest St. Petersburg 40
TABLES
1. Time-stratigraphic units and formations underlying Pinellas County and the city of St. Petersburg, Florida 4
2. Depth of exploration holes and oldest time-stratigraphic unit encountered at subsurface injection test sites 5
3. Estimated aquifer coefficients for zone C (injection zone) based on aquifer test analyses 17
IV

CONTENTS Continued
TABLES Continued
4. Chemical composition of water from selected wells open to the surficial aquifer 26
5. Chemical composition of water from selected wells open to permeable zone A 26
6. Chemical composition of water from selected wells open to permeable zone B 27
7. Chemical composition of water from selected wells open to permeable zone C 27
8. Chemical composition of water from selected wells open to permeable zone D 28

Hydrogeology and Results of Injection Tests at Waste-Injection Test Sites in Pinellas County, Florida
By John J. Mickey
Abstract
Potential benefits or hazards to freshwater resources could result from subsurface injection of treated waste- water. Recognizing this, the U.S. Geological Survey, in cooperation with Pinellas County and the city of St. Peters burg, undertook an evaluation of the hydrogeology and injection of wastewater at proposed test sites on the Pinel las peninsula.
The injection sites are underlain by sedimentary rocks ranging in age from Cretaceous to Pleistocene. Lower Eo cene carbonate rocks were penetrated to a maximum depth of 3,504 feet and were found to have relatively low water yields. The most permeable part of the investigated section was in rocks of middle Eocene age within the Flor- idan aquifer.
At the injection sites, the Floridan aquifer was subdi vided into four permeable zones and three semiconfining beds. The test injection zone is within the Avon Park Lime stone, the most productive of the identified permeable zones, with a transmissivity of about 1,000,000 feet squared per day. Two semiconfining beds are above the injection zone in the Suwannee Limestone and Ocala Limestone and have vertical hydraulic conductivities estimated to range from about 0.1 to 1 foot per day where these beds do not contain clay.
Limited fresh ground-water supplies exist in the Flori dan aquifer within the Pinellas peninsula. At all test sites, chloride concentration in the injection zone ranged from 19,000 to 20,000 milligrams per liter.
Injection tests ranging in duration from 3 to 91.1 days were run at three different sites. Pressure buildup oc curred in permeable zones above and below the injection zone during these tests. Calculated pressure buildup in observation wells close to and at some distance from the test wells was typically less than 1 pound per square inch. Injection and formation water will probably move slowly through the semiconfining bed overlying the injection zone, and long-term injection tests will be needed to de termine the effectiveness of these beds to retard flow. The injected water was well mixed with the native formation water, which, in part, is a direct consequence of the frac tures in the injection zone.
INTRODUCTION
Pinellas County, including the city of St. Peters burg, is in west-central Florida (fig. 1) and is experiencing
rapid population growth. Population of the county in 1960 was about 375,000; in 1970 it was about 522,000; and by 2000 it may exceed 1,000,000 (Thompson, 1977). This growing population has caused and will cause great stresses on water supply and waste-treatment plant facili ties. Efforts by regulatory agencies to upgrade the quality of the hydrologic environment have led to regulation of withdrawals from well fields serving the area and to increased regulatory standards for wastewater treat ment plants. These factors have resulted in interest in improving water management and reducing wastewater
UNITED--STATES
co ! HILLSBOROUGH
Tampa
Figure 1. Location of Pinellas County and city of St. Petersburg.
Introduction 1

treatment costs in the county and city through subsurface storage of treatment-plant effluent in saline aquifers for possible future nonpotable reuse.
The anticipated average injection rate for Pinellas County and the city of St. Petersburg, when their injec tion facilities become fully operational, will be about 40 Mgal/d. The county plans to inject all of its waste effluent at the South Cross Bayou and McKay Creek injection sites (fig. 2). At South Cross Bayou, the ex
pected average injection rate will be about 20 Mgal/d; at McKay Creek, the expected average rate is 4 Mgal/d (William E. Dunn, oral commun., 1978). The city of St. Petersburg plans to use the injection facilities as a second ary disposal method, the primary method being spray sites and irrigation of golf courses. The city anticipates using the injection wells only during periods of wet weather when the primary disposal method becomes ineffective. The city plans to have four injection sites: northwest
83W 45'
28°15' -
28°00'
27°45' -
GULFOF
MEXICO
PASCO COUNTY"HILLSBOROUGH COUNTY
Northwest Pinellas
EXPLANATION
Injection Site
Well Field
PINELLAS
COUNTYMcKay Creek
South Cross Bayou
Northeast St. Petersburg
I TAMPA 1 BAYAlbert
Northwest St. PetersburgBear Creek
Southwest St. Petersburg
_fHILLSBO_ROUG H \CQ UNITY MANATEE COUNTY\~
NATIONAL GEODETIC VERTICAL DATUM OF 1929
Base from U.S. Geological Survey State of Florida map 1967
Figure 2. Location of test injection sites. (Sections A-A' and B-B' are shown in figures 4 and 5, respectively.)
2 Injection Tests in Pinellas County, Florida

St. Petersburg, northeast St. Petersburg, southwest St. Petersburg, and Albert Whitted (fig. 2). At each site, the city expects to inject at an average rate of 4 Mgal/d, or a total of 16 Mgal/d for the four sites (William Duns- lager, oral commun., 1978).
During the investigation, Pinellas County reeval- uated its original plan and the northwest Pinellas site (fig. 2) was dropped from consideration as an injection site. The St. Petersburg Bear Creek site (fig. 2) was drilled by the city as an experimental storm-water injection site rather than a wastewater injection site (Black, Crow and Eidsness, 1974).
Purpose and Scope
Potential benefits or potential hazards to freshwater resources could accrue from subsurface injection of treated wastewater. Recognizing this, the U.S. Geolog ical Survey, in cooperation with Pinellas County and the city of St. Petersburg, undertook an evaluation of the hydrogeology and injection tests of wastewater at pro posed injection sites (fig. 2). The investigation would pro vide a basis for developing and managing the injection systems to maximize benefits and minimize hazards to the hydrologic environment.
The objectives of the study were to determine the hydrogeology at the injection sites and to evaluate results of injection tests at the sites. This report presents hydro- geologic analyses for six sites and results of three injection tests. The tests ranged in duration from 3 to 91.1 days.
Acknowledgments
William E. Dunn, Director of Utilities, Pinellas County, and William Dunslager and Vincent D. Patton, former and current Director, respectively, Public Utilities Division, city of St. Petersburg, made available the re sources of the county and city during this investigation. Dean Hughes, Deputy Director, Public Utilities Division, city of St. Petersburg, coordinated water-treatment oper ations with testing at the southwest St. Petersburg test site.
GEOLOGIC FRAMEWORK
Pinellas County and the city of St. Petersburg are underlain by a sequence of sedimentary rocks whose lith- ology, structure, and geologic history control the occur rence and movement of fresh and saline ground water. Principal elements of the geologic framework are de scribed below; a more detailed discussion is contained in the "Hydrogeology" section of this report.
Table 1 shows the time-stratigraphic units and for mations underlying Pinellas County. These units include sedimentary rocks ranging in age from Cretaceous to Pleistocene that probably overlie a pre-Mesozoic base ment complex of igneous and metamorphic rocks (Ap- plin, 1951). Limestone and dolomite are the principal sedimentary rocks in this column; they range in thickness from about 10,000 to 12,000 feet (Applin, 1951).
During this investigation, the rocks underlying Pinellas County were studied in detail to a depth of about 3,500 feet. Oldest rocks encountered were lower Eocene (table 2). Formations in exploratory holes, from youngest to oldest, were surficial deposits (Pleistocene), Hawthorn Formation (middle Miocene), Tampa Limestone (lower Miocene), Suwannee Limestone (Oligocene), Ocala Limestone (upper Eocene), Avon Park Limestone (mid dle Eocene), Lake City Limestone (middle Eocene), and Oldsmar Limestone (lower Eocene). Contacts between these formations are probably unconformable (Puri and Vernon, 1964), which indicates hiatus of deposition and probable erosion.
Pinellas County is on the southwest flank of the Peninsular Arch and is southwest of the Ocala Uplift. The Peninsular Arch is the dominant subsurface structure and forms the axis of the Florida peninsula; the Ocala Uplift is a gentle, anticlinal flexure in north-central Florida (Puri and Vernon, 1964). Axes of the structural features approximately parallel each other and trend northwest to southeast. Puri and Vernon (1964) describe the rocks associated with the Ocala Uplift as being extensively fractured. Fracture patterns mapped by Vernon (1951) show preferred fracture orientation with azimuths from 306° to 325° just north of Pinellas County (James Miller, written commun., 1978). Vernon (1951) shows fracture patterns in the northern part of Pinellas County but no fractures in the southern part. To the east, in southern Hillsborough County, Vernon shows a small number of fractures.
Three principal rock sequences underlie Pinellas County: (1) Unconsolidated sand, clay, and marl; (2) limestone and dolomite; and (3) gypsiferous limestone and dolomite. Sand, clay, and marl are the principal sed iments in the upper part of the section in middle Miocene and younger rocks. Limestone and dolomite dominate the middle part of the section in lower Miocene to upper middle Eocene rocks. Gypsiferous limestone and dolomite are the principal rocks in the lower part of the section in lower middle Eocene to lower Eocene rocks. The test injection zone at all test sites is in a persistent dolomitized section of late middle Eocene age. Figure 3 shows a stra- tigraphic and hydrogeologic section for the South Cross Bayou test injection site.
During this investigation, exploratory holes from 3,000 to 3,504 feet deep were drilled at northwest Pi nellas, South Cross Bayou, and the Bear Creek sites
Introduction 3

Table 1. Time-stratigraphic units and formations underlying Pinellas County and the city of St. Petersburg, Florida[Nomenclature from Applin and Applin (1944), Heath and Smith (1954), and Puri and Vernon (1964)]
ERATHEM
Cenozoic
Mesozoic
Pre-
Mesozoic
SYSTEM
Quaternary
Tertiary
Cretaceous
SERIES
Pleistocene
Miocene
Middle
CD
O _l
Oligocene
Eocene
i_ 0) Q. Q.
=>
Middle
Lower
Paleocene
FORMATION
Surficial sand
Hawthorn Formation
Tampa Limestone
Suwannee Limestone
Ocala Limestone
Avon Park Limestone
Lake City Limestone
Oldsmar Limestone
Cedar Keys Limestone
Undifferentiated for this report
Undifferentiated for this report
(table 2). This was done to test the hypothesis that the "boulder zone" would be encountered within the rocks of the Oldsmar Limestone (lower Eocene). The "boulder zone" is a highly permeable zone known to exist in south Florida (Kohout, 1965). Permeable zones were identified within the Oldsmar Limestone at the Bear Creek site, but they had relatively poor capacity for yielding water and thus for accepting water (Black, Crow and Eidsness, 1974). Results of a pumping test on the Oldsmar Lime stone at South Cross Bayou (Hickey, 1979) yielded an
estimate for transmissivity of about 2,000 to 3,000 ft2/d a relatively low value for carbonate strata in Flor ida. The most productive water-yielding zones were iden tified during exploratory drilling to be within rocks of the Avon Park Limestone (upper middle Eocene).
DEFINITIONS AND METHODS OF STUDY
All clastic and carbonate rocks underlying Pinellas County are permeable in some degree, but their ability to
4 Injection Tests in Pinellas County, Florida

yield water to wells differs considerably. Therefore, they have been categorized hydrogeologically as either aqui fers or confining beds. Lohman and others (1972) define an aquifer to be a formation, group of formations, or part of a formation that contains sufficient permeable material to yield significant quantities of water to wells and springs. They define a confining bed to be a body of "impermeable material" stratigraphically adjacent to one or more aquifers. Confining beds are less permeable than aquifers and restrict the flow of water between aquifers. Their effectiveness to restrict flow varies, depending on confining-bed thickness, vertical hydraulic conductivity, and head differences between aquifers. Under suitable conditions, moderate to large volumes of water can flow through confining beds. The ratio of hydraulic conduc tivities used in this report to distinguish aquifers from confining beds is 100 to 1.
Table 2. Depth of exploration holes and oldest time- stratigraphic unit encountered at subsurface injection test sites
Subsurface injection test site
Northwest PinellasMcKay Creek _ _ _ __ __South Cross BayouBear CreekNortheast St. Petersburg _ Southwest St. Petersburg _
Depth of exploration
hole (feet below land surface)
3,0001,7503,2803,5041,210 1,438
Oldest time-stratigraphic unit penetrated
Lower EoceneMiddle EoceneLower EoceneLower EoceneMiddle Eocene Middle Eocene
In Pinellas County, two aquifers have been iden tified, the surficial aquifer and the Floridan aquifer (Parker and others, 1955). Also, two confining beds have been identified, the upper and lower confining beds of the Floridan aquifer. One of the geologic formations, Lake City Limestone, identified by Parker to be part of the Floridan aquifer, is relatively impermeable in Pinellas County and comprises the lower confining bed.
The Floridan aquifer is subdivided in this report into four permeable zones and three semiconfining beds. The term "permeable zone" is used to describe the most permeable strata of the aquifer. The term "semiconfining bed" is used to describe the least permeable strata of the aquifer and to distinguish these beds from the confining beds overlying and underlying the aquifer.
Typically, measurable volumes of water flow from a number of vertically spaced and discrete borehole inter vals during pumping of the Floridan aquifer. The term "water-producing interval" is used to describe these dis crete intevals of borehole inflow. Water-producing inter vals, which are hydraulically continuous, commonly occur at different depths in adjacent boreholes. In this report, the upper and lower probable extent of hydrau
lically continuous water-producing intervals defines the upper and lower boundaries of a permeable zone.
Criteria used to identify water-producing intervals were short-term pumping tests, flow meter measure ments, and static and pumping temperature logs run as exploratory holes were deepened (Hickey, 1977; Hickey, 1979; Hickey and Barr, 1979; Black, Crow and Eidsness, 1978). Of these, flow meter and temperature logs were the most diagnostic.
Flow data collected in a borehole yield information only on the degree of horizontal hydraulic interconnec tion in the immediate vicinity of the borehole. Semicon fining beds are hypothesized to generally coincide with nonproductive intervals within the boreholes at the test sites. It should therefore be recognized that, for hydrau lically complex carbonate strata, all semiconfining bed identifications are tentative until long-term injection tests have been run to test the hypotheses adequately. Figures 4 and 5 are north-south and east-west hydrogeologic sections showing the aquifers, water-producing intervals, permeable zones, confining beds, and semiconfining beds. The lines of section are shown in figure 2.
Figures 6 through 8 show the configuration of wells at South Cross Bayou, southwest St. Petersburg, McKay Creek, and Bear Creek. All wells injection and observa tion were constructed to be open to only one permeable zone, with the exception of the Bear Creek injection well. At each site, two observation wells were constructed in zone C (injection zone), one in the upper and one in the lower part of the zone.
Aquifer tests were run at four injection test sites: South Cross Bayou, southwest St. Petersburg, McKay Creek, and Bear Creek. All test results are assumed to be applicable only to the permeable zones and semiconfining beds of the Floridan aquifer. The Hantush-Jacob method (Hantush, 1964; Lohman, 1972) was used to analyze the test results to estimate the hydraulic characteristics of the pumped zone and overlying and underlying semiconfining beds. Application of this method was restricted due to pos sible errors caused by: (1) small drawdown in the pumped zone; (2) neglect of storage in the semiconfining beds; and (3) neglect of drawdown in the unpumped permeable zones.
The California Department of Water Resources (1971) discussed errors in estimated hydraulic character istics that could be caused by neglecting storage in a semiconfining bed and by neglecting drawdown in an un pumped zone. After applying the Hantush-Jacob method to the results of a multiple layered analytic solution for a well pumping in only one of the layers, the authors con cluded that under certain conditions substantial error could be introduced into estimated hydraulic character istics. As a practical matter, the amount of error cannot be estimated in hydraulic characteristics derived from a field aquifer test. What can be done is to choose the analytic method which appears most appropriate, and
Definitions and Methods of Study 5

then check the estimated characteristics with indepen dent data to determine if the estimates are physically plausible.
Storage coefficients derived from the application of the Hantush-Jacob method were compared with storage coefficients calculated using laboratory measurements of rock compressibility. In addition, a range of vertical hy draulic conductivity values was estimated in each aquifer test analysis and compared to laboratory core measure
ments of vertical hydraulic conductivity. Comparisons of storage coefficient and hydraulic conductivity discussed in subsequent sections of this report are reasonably satis factory, which suggests that error in estimates derived from the aquifer tests is within the limits of the state of the art to define the hydraulic characteristic of a ground- water flow system.
Rock compressibility was determined on several limestone and dolomite cores from the McKay Creek,
0
250
500
750
h-ffiioooLl_
zof 0 1250 <LI- CCD WQ 1500z <
§1750_iUJmI £2000UJQ
2250
2500
2750
3000
3250
-
-
SERIES
vPleistocenex
Miocene
Oligocene
Eocene
FORMATION
^ Surficial sand x Hawthorn
\ Formation/Tampa
Limestone
Suwanee Limestone
Ocala Limestone
Avon Park Limestone
Lake City Limestone
Oldsmar Limestone
HYDRO- GEOLOGIC
UNIT
^Surficial aquifej>Upper Confining~\ Bed /~
Floridan aquifer
Lower Confining Bed
LITHOLOGY
r i i "
5E^5I I !
ILimestonel' i ' i ' .' iI i i
i i
I Ii i
i ii i) /'/'/ ! / / / /
T-polomiteT-/ / / ' // / / / /' / ' 'A 'A'i I ( -? /l/ / / ';(,. i // «"i - /' " i / '/"/ "/"/
i i i'/"/"/*/".Gypsiferous -J-imestone-l and Dolomite* " / " / ' .,/ / ,' /'
f ' a > >
ii it -i /'
I
I/ /' /. /
".( './ "./"^/ ll /; / II
" / / /,.
r '1 ;
>l
\ , '1 , .1 ..
r>") /..\ ; ., ' .,,. I, ,, ,:
/"/"/'/f
"/ " / " /" /«/',/'</ ',
/ / / /
PERMEABLE ZONE
mm/S/////yCy
y/y/Es///
^6-^J'lnjectiorM^^'\'sty^}fy
^'VDT';.''''-
' / s \ \ v N '
> ' ,\,\.- ,' ,'
»:<-:\\v:
t
25 -52
-450
-19,000
-20,000
-20,000
-21,000
-25,000
-27,000
-31,000
-
'CHLORIDE CONCENTRATION (MILLIGRAM PER LITER)
Figure 3. Stratigraphic and hydrogeologic section, South Cross Bayou test injection site.
6 Injection Tests in Pinellas County, Florida

250^
1500
SOUTHWEST BEARST. PETERSBURG CREEK
A
McKAY CREEK
NORTHWEST PINELLAS
A'
Water pro ducing intervi al
Lower confining bedof the Floridan
aquifer
0 5I I I I I I
10 MILES
(VERTICAL SCALE EXAGGERATED X80)
Figure 4.figure 2.)
Hydrogeologic section A-A' through injection sites. (Location of section A-A' is shown on
South Cross Bayou, and Bear Creek test sites (Hickey, 1977; Hickey, 1979; Hickey and Barr, 1979). Compres sibility of five limestone cores averaged 6.2 X 10~6 in2/lb and ranged from 3.1 X 10~7 to 1.2 X 10~ 5 in2/lb. Com pressibility of six dolomite cores averaged 5.5 X 10~ 7 in2 /lb and ranged from 6.4 X 10~ 8 to 2.2 X 10~ 6 in2/lb. Calculated storage coefficients, discussed above, were based upon the average compressibility of the cores. The storage calculations assumed that dolomitic limestone compressibility was the same as limestone compressibility.
Porosity of the strata comprising the Floridan aqui fer at the northwest Pinellas, northeast St. Petersburg, and southwest St. Petersburg sites was estimated from geophysical logs. The commercial firm that ran the logs also performed the porosity calculations. Average poros ity values for the permeable and semiconfining beds, com puted from the logging firm's analyses, are given in another part of this report. The reliability of these porosity values cannot be ascertained, but a comparison with laboratory core porosity determinations at the logged sites and at other sites suggests that the porosities are physically plau sible with the exception of that for zone A at northeast St. Petersburg (Hickey, 1977; Hickey, 1979; Hickey and Barr, 1979; Black, Crow and Eidsness, 1978; unpublished data, city of St. Petersburg and Pinellas County).
HYDROGEOLOGY OF THE TEST INJECTION SITES
Fresh and saline ground water occur in the rocks underlying Pinellas County and the city of St. Petersburg. Saline ground water predominates; fresh ground water typically occurs as a thin layer in the upper part of the rocks. The source of fresh ground water is rainwater that infiltrates the rocks underlying Pinellas County. Sources of saline ground water are probably the Gulf of Mexico and Tampa Bay and residual seawater from the geologic past. The injection zone at all test sites contains saltwater that is similar to seawater in composition.
Surficial Aquifer
The surficial aquifer at the injection test sites con sists of a sand deposit ranging in thickness from about 20 to 85 feet. Except for minor to abundant shell and minor phosphate, the sand is composed principally of fine- to medium-sized quartz grains. The age of the surficial sand is not definitely known. Cooke (1945) thought the sand in the southern part of the county was deposited during Pliocene time, whereas Vernon (Heath and Smith, 1954)
Hydrogeology of the Test Injection Sites 7

thought that the sand in Pinellas County was deposited during Pleistocene time. Vernon's estimate is used in this report.
The surficial aquifer is used mainly as a source of water for lawn irrigation, but the quantity withdrawn for this purpose is unknown. The water table in the aquifer is generally close to land surface and is easily reached by shallow wells. During dry spring weather, the water table is about 5 to 10 feet below land surface, and, during wet summer weather, the water table is generally at or near land surface.
Some hydraulic properties for the surficial aquifer in Pinellas County and in northwest Hillsborough County were determined during previous studies. Hutchinson and Stewart (1978) and Sinclair (1974) reported that, based on laboratory tests, vertical hydraulic conductivity ranged from 0.36 to 13 ft/d and averaged 2.6 ft/d. Horizontal hydraulic conductivity, derived from pumping test inter pretations, is reported by Cherry and Brown (1974) to be 250 (gal/d)/ft2 (33 ft/d) and by Sinclair (1974) to be 100 (gal/d)/ft2 (13 ft/d). Four specific yield determina tions ranged from 33.7 to 37.6 percent (Sinclair, 1974), and two determinations of effective porosity were 29.2 and 32.2 percent (Hutchinson and Stewart, 1978).
250-1
1500
(VERTICAL SCALE EXAGGERATED X80|
'Surficial aquifer
2 Upper confining bed of the Floridan aquifer 3 Lower confining bed of the Floridan aquifer
Figure 5. Hydrogeologic section B-B' through injection sites. (Location of section B-B' is shown on figure 2.)
8 Injection Tests in Pinellas County, Florida
Floridan Aquifer
The Floridan aquifer underlies the injection sites in Pinellas County and the city of St. Petersburg and, at these sites, contains mostly saltwater. Some freshwater occurs in the upper part of the aquifer and is tapped for irrigation and municipal supplies. The cities of Clear- water, Dunedin, and Belleair in west-central Pinellas County pumped about 10 Mgal/d during 1975 (Geraghty and Miller, 1976). All water distributed by Pinellas County and the city of St. Petersburg comes from well fields as far as 40 miles distant from the county (fig. 2). Total water use in Pinellas County for 1975 was about 119 Mgal/d (Leach, 1978).
Parker in Parker and others (1955) defined the Floridan aquifer to include permeable parts of the Haw thorn Formation that are in hydrologic contact with the rest of the aquifer, and all or parts of the Tampa Lime stone, Suwannee Limestone, Ocala Limestone, Avon Park Limestone, and Lake City Limestone. The Lake City Limestone, underlying Pinellas County, is relatively impermeable and, therefore, is not considered in this re port to be part of the Floridan aquifer.
The top of the Floridan aquifer is considered in this report to be the top of the persistent carbonate sequence below which clay, marl, and sand make up only a very small percentage of the rocks. The upper part of the aquifer probably is the Tampa Limestone. The base of the aquifer is considered to be at the first presence of gypsum in the carbonates occurring below a relatively thick, dark- brown, microcrystalline dolomite. Typically, gypsum oc curs as intergranular fillings of pores with occasional thin beds; when first encountered, the gypsum is in trace amounts. The base of the aquifer in Pinellas County is considered to be the contact between the Avon Park Limestone and the Lake City Limestone, which, in this report, is presumed to be at the first presence of gypsum.
Most water-supply investigations of the Floridan aquifer have treated the aquifer as a single hydrogeologic unit as proposed by Parker and others (1955). This view point has yielded satisfactory analyses of the fresh ground-water flow regime in the aquifer. A few authors have subdivided the Floridan aquifer on the west coast of Florida into "units" (Wilson, 1977) and "zones" (Sut- cliffe, 1975) based upon the ability of different sections to yield water.
In this investigation, the Floridan aquifer is sub divided into four permeable zones separated by three semiconfining beds, based upon detailed studies at the injection test sites (figs. 4 and 5). The permeable zones are labeled alphabetically from A to D. Zone A is the shallowest within the aquifer, and zone D is the deepest; zone C is the test zone at the prospective wastewater injection sites. Most water wells in Pinellas County used for public supply are open only to zone A.

SOUTH CROSS BAYOUA1 (Test injection well)
SOUTHWEST ST. PETERSBURG
99A3 (Test injection well)
-733
A2OB1-B5
Rft B6B7l
125
McKAY CREEK
B1-B4 o
BEAR CREEK
A1 (Test injection well) A2
10"f^ llfA1 / A2,A3 (Test injection well)B1-B5 6
200 400 FEET
Figure 6. Location of wells at South Cross Bayou, southwest St. Petersburg, McKay Creek, and Bear Creek.
Permeable Zone A
Permeable zone A is a limestone probably compris ing the Tampa Limestone and the upper part of the Su- wannee Limestone (fig. 3). The zone was identified at all sites by the presence of water-producing intervals (figs. 4 and 5). For mapping purposes, the top of the zone is defined as the contact between the persistent limestone sequence and the overlying clays and marls. The top of the zone corresponds to the top of the Floridan aquifer. The bottom of zone A was defined as the base of the lowermost producing interval in the upper part of the limestone sequence above the beginning of a relative in crease in gamma-ray activity, as measured with geo physical logs. Correlation between increased gamma-ray activity and the producing intervals was observed at the southwest St. Petersburg, northeast St. Petersburg, and Bear Creek injection sites. The increasing gamma-ray activity was used to identify the base of the zone at the
South Cross Bayou and McKay Creek injection sites (figs. 4 and 5).
A contour map of the top of the Floridan aquifer in Pinellas County is shown in figure 9. This map is an adjusted version of one produced by Buono and Rutledge (1979). The altitude of the top of the aquifer (zone A) ranges from zero NGVD of 1929 (National Geodetic Vertical Datum of 1929) just southwest of Lake Tarpon in north Pinellas County to about 150 feet in southern Pinellas County. Figure 9 shows the top to be somewhat irregular except in the northernmost part of the county where it is nearly flat. Thickness of zone A (figs. 4 and 5) averages about 180 feet and ranges from 115 to 245 feet. Thickness varies from site to site and occurs with no apparent regional pattern. At southwest St. Petersburg, northwest Pinellas, and northeast St. Petersburg, the av erage porosity for zone A, estimated from geophysical logs, was 26 percent, 32 percent, and 41 percent. The last value appears to be too large and may be in error.
Hydrogeology Floridan Aquifer 9

The vertical position of producing intervals within zone A is highly variable (figs. 4 and 5). This variability suggests a network of random anastomosing permeable pathways through which most of the fluid flow occurs. Very little information is available about the nature of the permeable pathways in zone A, except that cavities or large tubular channels probably do not constitute the general nature of the permeability. Only one cavity was identified during drilling at the test sites. This cavity oc curred at the base of zone A at the Bear Creek site. A few known sinkholes in north Pinellas County, notably Blue Sink and Tarpon Sink, probably interconnect all or part of zone A, but sinkholes are very rare occurrences within the county and probably have little effect on the regional transfer of water in zone A.
Aquifer and specific-capacity tests were run on zone A at the test sites. An aquifer test at the southwest St. Petersburg site was run for about 3.5 days, pumping well B8 at a rate of 650 gal/min (Hickey and Spechler, 1979). Measurable drawdown occurred only in permeable zones A and B. Figure 10 shows a time-drawdown graph
for well B5 in zone A, 636 feet distant from the pumped well (figs. 7 and 9). Transmissivity (T\ storage coefficient (S), and leakance coefficient (K'/b f) determined from these test data are as follows: T = 2.9 X 104 ft 2/d, S = 4.0 X 10~4 (calculated from compressibility of cores, S = 7.7 X Kr4),and#'/£' = 2.9 X l(T 3/d.The Hantush-Jacob type curve method was used in the test analysis. Transmissivity calculated from the pumped well drawdown data also was 2.9 X 104 ft2/d- For this esti mate, Jacob's semi-log straight-line method was used with test data from about 6 to 270 min.
Specific-capacity tests were run at Bear Creek, McKay Creek, and South Cross Bayou. These tests were run for 60 to 90 min with discharges ranging from 100 to 260 gal/min. At Bear Creek, two tests were performed, one with only the upper part of zone A open to the well and the other with all of zone A open to the well. Specific capacity calculated when zone A was only partially open was 13 (gal/min)/ft. When zone A was completely open, the specific capacity was 228 (gal/min)/ft. Analysis of test data when the zone at Bear Creek was completely
ALTITUDE, IN FEET, ABOVE AND BELOW
NATIONAL GEODETIC VERTICAL DATUM OF 1929i NJ O 00 O> -Pk NJ N
DOOOOOO C DOOOOOOOc
SOUTH
-
M
CROSS BAYOU
Land Surface
titimmmmmmmmI 192 IA4
242ZONE A
<:^^:'^<^^:-^^^^^^^<^<:
[A3 3 ZONE B B4J
-^ - - - - - -- - - - - - - -- - -
lA7292
ZONE C (Injection zone)
,953
| A1 (Test well) Q2L in-70-.'.'.-.'.'.v.'.-. 1 .-.-.-.- . . . . . . .
.-. . .-. .' M/.4-. .-. . . . . . . . . . . .
.-.-. . .-. . . . . . . . . . . . . . .'" 'ZONE - D - ----------
...I |
raft I y*r-r-r-tOf)-^-^
'86
^512
772
807
1017 -
mm31 1216
|
1 1 1 SOUTHWEST ST. PETERSBURG
Land Surface^
-
-- -
242 ZONE A B8 B5
--<}jj^
IB? ZONE B : -*-6?4 : : : : : : : : : : : : : : : : : : : : :
[ ' '71 a:-:-:-:-:-:-:-:-:-:-:-:-:-:-:-:-:-:-:-:-:-:-:-:
B6 842
_ 921 ZONE C (Injection zone)
A3 (Test well)
B3
B2
ZONE D
1
B1-
250
w**-»%/
1-559
844
,934
kH *>'ri
-
r-920
A2 -
*vm
L'l 279
200
[543
fi?4
400 600 800 1000 0 200 400
RADIAL DISTANCE FROM TEST WELL, IN FEET
600 800 1000
B7| Open hole interval in well; numbers are altitude of 624 top and bottom of interval; alphanumeric is local
well number.
Semiconfining bed
Figure 7. Altitude of open intervals in wells at South Cross Bayou and southwest St. Petersburg.
10 Injection Tests in Pinellas County, Florida

open suggests a transmissivity that could range from 2.5 X I04 to 3.0 X I04 ft 2 /d. At South Cross Bayou and McKay Creek, both pumped wells were open only to the upper part of zone A. Specific capacity at McKay Creek was 15 (gal/min)/ft, and at South Cross Bayou it was 4 (gal/min)/ft.
The variability of specific capacity, and thus, in an approximate manner, of transmissivity, calculated from wells open to different parts of zone A, is a natural con sequence of the irregular distribution of the producing intervals that compose the zone. Although it may be coin cidental, the data also suggest that for tests on wells completely open to the zone, transmissivity estimates show much less variation. For example, the transmissivity values for southwest St. Petersburg and Bear Creek are very similar and compare very well with a transmissivity of 3.3 X 104 ft2 /d reported by Robertson and Mallory (1977) in northern Pinellas County from a well that is probably completely open to zone A. In addition, the transmissivity estimates in northern Pinellas County, which Robertson and Mallory (1977) estimated through a calibration of a digital model, ranged from 2.1 X 10⁴ to
4.32 X 104 ft2 /d. These estimates are also in reasonable agreement with the pumping test results derived from wells completely open to zone A.
Permeable Zone B
Permeable zone B is composed of dolomite, dolo- mitic limestone, and limestone. Some dolomite is present at all sites except southwest St. Petersburg. Zone B probably includes the lower part of the Suwannee Lime stone and the upper part of the Ocala Limestone (fig. 3). The zone was identified at most sites by the presence of water-producing intervals (figs. 4 and 5). The top and bottom of the zone are defined by the presence of dolomite and dolomitic limestone and by relatively high electrical resistivity, with the exception of southwest St. Petersburg where the vertical extent of the water-producing intervals was used. Along sections A-A' (fig. 4) and B-B' (fig. 5), zone B tends to dip from north to south and from east to west. The thickness of the zone averages about 60 feet and ranges from 50 to 75 feet. The thickness is remark ably uniform from site to site. At northwest Pinellas,
200
|£ 200_iLU;> CD^
Q !rf
|Q 400
2<ogm I-
<£ 600
00 O O
O O O
McKAY CREEKLand Surface
cil r"C1 I C2l -198 l
| ZONE A
IIIA1
A2
A3 I-(Test well)|
IU/
197
^ 4:5; 8; i;:i ;:;;;:;: :;:;:;:|;§||||;i;
ZONE B B1
B2 [841
ZONE C 940 (Injection zone)
B3
1028
^^^:-<<<<<^^<^<^^<<<<^y.
I
tmmm
-
4-7'6': : : ::: : : : : : : : : :x :
576.-.-.-...-.-.-...-..
781 831
941
1008
-1087
' ' ' ' ' ' ^^ -^
-^ t ^ ^
A2,
-
I
BEAR CREEK
Land Surface^
ZONE A B5
534 ZONE B B4 "4
B3
ZONE C (Injection zone)
-1000 B2
A? 1 . V I v^Jl. VV.QU I- . .........
ZONE D B1 1254
"173
::^:::::^:^::>:^:-':^S
554
" WV' -*-***- " ' *'* - " -*- -* / J 1
-811 -
r911
-1051
^1 151 ' ' ' ' ' ' ' ' ' ' ' '
-1248
I
ffio"-H -, UJla .oLU LUQ OIf
<Z
N> O O
1400
A2.-534
200 400 600 0 200
RADIAL DISTANCE FROM TEST WELL, IN FEET
Open hole interval in well; numbers are altitude of top and bottom of interval; alphanumeric is local well number.
400 600
Semiconfining bed
Figure 8. Altitude of open intervals in wells at McKay Creek and Bear Creek.
Hydrogeology Floridan Aquifer 11

28° 1583°00' 45' 30' 82°15'
28°00'-
45'-
27°30'
Big Bayou Po
ANCLUTt NATJONAl. J? AncloteW?
WILDUFE Hi F DM V Keys
CS/° Crystal Beac
s
(y. ,V
"*^^iA Clearwa£er v /'' "'N Relleair Bea«.h /),.
Indian Rocks Beach-a.
-91
b-~~ c <.'' x i 3 5 / t- N \, Lorraine %,^4-T*-'- u/O; \o
-^ " '
Redmgton Bea
Madeira Bea
(b»
Treasure Isla
\ v
St Petersburg Beak:
EXPLANATION/
50 Structure contour shows ^_^-§5 altitude of top of FloridaTf ^ aquifer. Contour interval -r_ 50 feet; dashed where -^ fapproximate. National ' Geodetic Vertical Datum of 1929
rO Location of well and
altitude of top of Floridan aquifer.
5 10 MILES
Base from U.S. Geological Survey State of Florida map 1967
Figure 9. Top of Floridan aquifer, Pinellas County.
southwest St. Petersburg, and northeast St. Petersburg, Specific-capacity tests were run during drilling andthe average porosity of zone B, estimated from geo- construction. Duration of these tests ranged from 50 tophysical logs, was 19 percent, 24 percent, and 30 percent. 240 min. At three sites, Bear Creek, South Cross Bayou,
12 Injection Tests in Pinellas County, Florida

and McKay Creek, these tests were suitable for specific-capacity estimates; at the other sites, the data were affected by water-quality changes during pumping. Specific capacity for zone B at Bear Creek was 6 (gal/ min)/ft, at South Cross Bayou, 24 (gal/min)/ft, and at McKay Creek, 9 (gal/min)/ft. These results suggest that the transmissivity of zone B is relatively smaller than that of zone A. At northwest Pinellas (fig. 2), mud circulation was lost in zone B during drilling, which indicates high permeability.
Permeable Zone C (Injection Zone)
Permeable zone C, composed of dolomite, dolomitic limestone, and limestone, probably comprises the upper part of the Avon Park Limestone and, in places, the lower part of the Ocala Limestone (fig. 3). Dolomite (estimated visually) in the zone at the test sites averages about 80 percent and ranges from about 50 to 100 percent. Con versely, the average percentage of dolomitic limestone and limestone is about 20 percent, with a range from 0 to about 50 percent. Typically, in the upper part of the zone, limestone and dolomitic limestone are associated with dark-brown dolomite (figs. 4 and 5), whereas the lower part of the zone is consistently a nonfossiliferous, dark- brown, microcrystalline dolomite. Applin and Applin (1944) described a stratigraphic unit in north Pinellas County called the Tallahassee Limestone and equivalent
10.0
nonfossiliferous limestone of late middle Eocene age. In the immediate vicinity of the northwest Pinellas site, Applin and Applin (1944, fig. 4) identified the top of the nonfossiliferous limestone to be at about the same alti tude as the top of the brown, microcrystalline dolomite in the lower part of zone C.
Zone C was identified at all sites by the presence of water-producing intervals (figs. 4 and 5). For mapping purposes, the top of the zone was defined as the beginning of a persistently dolomitized carbonate section and as the top of a zone of extremely high electrical resistivity, as measured by geophysical logging. Occasionally, the top is also marked by relatively high gamma-ray activity. The bottom of the zone was defined as the contact between the brown, microcrystalline dolomite and an underlying cream to tan, porous dolomite or dolomitic limestone and also as the bottom of the extremely high resistivity zone. Figure 11 shows a contour map of the top of zone C (injection zone) in Pinellas County. The surface, in gen eral, tends to dip to the south, ranging in altitude from about 400 feet in north Pinellas County to almost 900 feet in south Pinellas County. Superimposed on this general pattern is a shallow trough in central Pinellas County trending approximately north 30° east. The thickness of zone C at the -test sites averages about 330 feet and ranges from 300 to 386 feet. Thickness is remarkably uniform from site to site. At northwest Pinellas, southwest St. Petersburg, and northeast St.
i.-i_4-- - --4-- -- «- -4--II ; Q=650 gal/mih !
ir=636ft.
10 ' 10 TIME SINCE PUMPING BEGAN, IN DAYS
10 10
Figure 10. Drawdown in southwest St. Petersburg well B5 during pumping of well B8.
Hydrogeology Floridan Aquifer 13

Petersburg, zone C average porosity, estimated from geo- Zone C contains the most productive water-pro- physical logs, was 15 percent, 14 percent, and 21 percent. ducing intervals within the Floridan aquifer in Pinellas
83°00' 45' 82°15'
1°ndian Rocks BTeach
PETERSBURG
St F>etersburg
EXPLANATION
-500~ Structure contour showsaltitude of top of permeable Zone C. Contour interval 100 feet; dashed where approximate. National Geodetic Vertical \ " Datum of 1929
505 O Location of well and altitude
of top of Zone C. ; i - 878 to
)L orramei, .r-"-
Brade
27°30
Base from U.S. Geological Survey State of Florida map 1967
Figure 11. Top of permeable zone C (injection zone), Pinellas County.
14 Injection Tests in Pinellas County, Florida

County. The vertical distribution of producing intervals varies somewhat from site to site, as shown in figures 4 and 5. There is less variability in the lower part of the zone than in the upper part. A producing interval occurs consistently in the lower part of the zone associated with the dark-brown, microcrystalline dolomite. In the upper part, the producing intervals exhibit much more vertical variation and are absent at the northwest Pinellas site. Rosenshein and Hickey (1977) hypothesized that a confining bed existed between the producing intervals in the upper and lower parts of the zone. Subsequent data, mainly from injection tests that are discussed later in this report, proved that the hypothesis was incorrect. The pro ducing intervals in the upper part of the zone are sig nificantly interconnected with the producing intervals in the lower part of the zone. The exact nature of the vertical interconnection is not known but most likely is related to vertical and oblique fractures that have been enlarged by solution.
The physical nature of the permeability of produc ing intervals (figs. 4 and 5) is not well known. As in zone A, cavities or large tubular solution channels are probably unimportant as conduits for fluid flow. A core taken from zone C at the McKay Creek site was intensely shattered and contained a few solution openings that were less than 1/2 inch in diameter (Hickey, 1977). During drilling, intervals were encountered in the dolomite of zone C, which persistently caved in and had to be continuously redrilled, suggesting that they, too, were intensely shat tered. The drillers referred to these intervals as "dredging zones." When a "dredging zone" was encountered, it typ ically was later identified as a producing interval, al though not all producing intervals were associated with a "dredging zone." It appears that the permeability of pro ducing intervals is probably related to numerous small fractures and some small solution channel openings. Sup porting this point of view is the apparent partial plugging of an injection well during a test at southwest St. Peters burg (Black, Crow and Eidsness, 1978). If large solution channels constituted the permeability, this plugging probably would not have occurred.
To summarize, the producing intervals in the upper and lower parts of zone C are probably highly fractured layers that are interconnected through vertically exten sive fractures. Also, the producing interval in the bottom of the zone appears to be a consistent feature throughout Pinellas County, whereas the producing interval in the top of the zone is much more variable in vertical position and may be absent in local areas.
Aquifer tests were run on zone C at South Cross Bayou, southwest St. Petersburg, and McKay Creek (Hickey, 1977; Hickey, 1979; Hickey and Spechler, 1979). Duration of these tests ranged from about 1.4 to 3.4 days with discharges ranging from 4,180 to 6,490 gal/min. Figures 12 through 14 show drawdown during
the tests. At southwest St. Petersburg (fig. 12) and South Cross Bayou (fig. 13), the uppermost zone showing a change in water level in response to pumping in zone C was zone A; at McKay Creek (fig. 14), the uppermost was zone B. The only significant lithologic difference between these sites is the presence of small quantities of clay in the strata between zones A and B at McKay Creek; the clay is absent in the equivalent strata at southwest St. Peters burg and South Cross Bayou (Hickey, 1977; Hickey, 1979; Black, Crow and Eidsness, 1978). The clays be tween zones A and B at McKay Creek probably cause this site to have vertical hydraulic characteristics significantly different from those of the other two sites.
At the southwest St. Petersburg and South Cross Bayou sites, a comparison of the drawdown responses between zones A and C indicates that these two sites are hydraulically similar in the vertical. The ratio of draw down in zone A to that in zone C near the end of both tests was about 0.5, and the time of first measurable drawdown observed in the well open to zone A was about 0.01 day after pumping started (figs. 12 and 13).
In zone C, similarity of drawdown response during different tests indicates that radial hydraulic character istics of zone C in the vicinity of the three sites are com parable. The ratio of drawdown to discharge near the end of each test ranged from about 1 x 10"4 to 1.2 x 10"4 ft/(gal/min), a difference of about 20 percent.
Transmissivity, storage coefficient, and leakance coefficient were interpreted from the test results (figs. 12-14) using the Hantush-Jacob type curve method. Storage coefficients derived from the test results compare favorably to storage coefficients calculated from the aver age rock compressibility data from cores collected at the test sites (Hickey, 1977; Hickey, 1979; Hickey and Barr, 1979). Two leakance coefficients were interpreted from each test and are minimum and maximum possible values because a representative coefficient could not be deter mined from the data. Transmissivity, storage coefficient, leakance coefficient, and diffusivity estimated from the tests are shown in table 3. In figures 12 through 14, drawdown in the unpumped permeable zones (A and B) became approximately parallel to the drawdown in the pumped permeable zone (C), which indicates that the ratio of drawdown for these zones at each site became approximately constant with time. This condition can occur when aquifers are separated by significantly less permeable beds.
Permeable Zone D
Permeable zone D is composed of dolomite and some limestone and dolomitic limestone in the lower part of the Avon Park Limestone (fig. 3). The zone was identi fied by the presence of producing intervals, except at McKay Creek where the zone is absent. The top of the
Hydrogeology Floridan Aquifer 15
fi
I ^,rj" ~~ "t f
I- 1.0 i uj ~ Malctj^Pc
z [.. 4
2" i
O fQ . 4.
DCQ o.1 4 -
, ., 4 44..
"if"
^ufljO
Stlxiiof&
r-
tad
- .
oV -
=.Oi;TQ3= 7s33 ft = $4$0j g;
. -|...
T
i
f..."- + -
.-4__
-_f.l^i
.j....
..».. 4
.-i....
-i- -
..; .
i
^ 4d
al/min-?-
- - - -J '""
- - ----- -
.......
O& "
_ __..- -
.....
;
O^*1
j
--> '-
...|
... 4 \-
-\
|
***
-
f . . ,. - , f * -
>4a
;±.^
,_-
|A
i . I
!j"__ ....._..< _ ..._^_. _ , _ L_.
: ; : | ,
~k *.... ........j. ..t ._!_. _,__._At__4__t_
i ! i 1i ! j
_.
_.
1 1 *TTT
; | M1 1 r 7
.in: * T ^
r | ^! ! I
i-itH&C2S-^rp.. ..... '~H|"~ - ̂ -
if-|f|-- - - -
-,i-|4-i~"--- - -
H-t-H
j ; i j
__.
M-o...... tt""S
(.. -. H1
-
l_ «---
^_
...._
_
N~~
t*
-
£*A
i
1
... .i j _ t_J_Jb-*H^
"^ M
-fh ^ i: i
| >
j i
I i
^.|..|.
44...- ._-.-.4 .._...{..-.-;....
in.
_4=
r
4H| j J--4-M
-{-fir
i'Ti } *I i ' \ \ '
7 ^ .;
... i-j.j4.! : 1 T ; ; ^ !
' \ ' : I .
;j..-t. ,_....(
Zan&-£.-Wil&tt. 02 . r, i .
.,. r/B=.01 ^{[.,J RP -^Jt- t ; ^ , ( _
_ ^ , _ v-i_ -J. . . ; "*"'
^.... A . t. I^fi^;
Zone A-Well B5
io~4 io~3 io~ 2 io~ 1 10°
- f-^-t- 1
f"-f-M-'
_4_r44_i ,.._j4|j
_.[|.|i i i i
_L Li 1 :
10TIME SINCE PUMPING BEGAN, IN DAYS
Figure 12. Drawdown in southwest St. Petersburg wells B2 and B5 during pumping of well A3.
10.0
10 - 10 TIME SINCE PUMPING BEGAN, IN DAYS
Figure 13. Drawdown in South Cross Bayou wells A4 and B2 during pumping of well A1.
16 Injection Tests in Pinellas County, Florida

10.0
i - t 4.f-.fJ-4.4. .- .... .-J.. _i__U 44-44 - - I
ZoneB-Well B1
10 " 10 " 10 10 TIME SINCE PUMPING BEGAN, IN DAYS
Figure 14. Drawdown in McKay Creek wells B1 and B3 during pumping of well A3.
zone was identified by the presence of the next producing interval below zone C. The bottom of the zone approxi mates the altitude of the first occurrence of intergranular and interbedded gypsum in the carbonates. The top of the zone is somewhat uncertain, as indicated by the dashed lines on the hydrogeologic sections (figs. 4 and 5). This uncertainty was caused by the difficulty in identifying producing intervals below the extremely permeable zone C. Except for the Bear Creek site, static and pump ing temperature logs were the only data that could be used to identify producing intervals, and, in most in stances, only very subtle changes between static and pumping temperature logs were observed. Along sections A-A' and B-B' (figs. 4 and 5), zone D tends to dip from north to south and from east to west. The thickness of the zone, where it is present, averages about 70 feet and
ranges from 22 to 121 feet. Average porosity of zone D, estimated from geophysical logs at northwest Pinellas and northeast St. Petersburg, was 22 and 39 percent.
An aquifer test was run at Bear Creek that initially was thought to be withdrawing water only from zone D. Duration of this test was about 3 days with a discharge of 3,450 gal/min (Hickey and Barr, 1979). Flow-meter logs, run while well Al was being pumped about 2 weeks prior to the test, indicated that most, if not all, water from test well Al (figs. 5 and 6) was coming from zone D (Hickey and Barr, 1979), even though well Al was known to be open to the base of zone C as well as to zone D. Specific capacity of the test well at the time of the flow-meter logging was 200 (gal/min)/ft.
At the beginning of the aquifer test, specific capac ity of the well was 1,100 (gal/min)/ft, an increase of 5.5
Table 3. Estimated aquifer coefficients for zone C (injection zone) based on aquifer test analyses
Test site
Southwest St. PetersburgSouth Cross BayouMcKay Creek
TransmissivityT
(ftVd)
.... 1.2 X 10⁶
.... 1.2 X 10⁶__._ 0.9 X 10⁶
Storage coefficient
S
3.3 X 1(T42.2 X 1(T 40.8 X 10~ 4
Storage coefficient
from laboratory compressibility
testsS
6.0 X 10~41.5 X 10~ 43.1 X 10" 4
Leakance coefficient
K'/b'
(Vd)
2.2 X 10~4 to 1.9 X 10~ 33.7 X 10~4 to 1.5 X 10~ 36.6 X 10~ 3 to 1.5 X 10~ 2
Diffusivity T/S
(ftVd)
3.6 X 1095.5 X 109
11.3 X 10⁹
Hydrogeology Floridan Aquifer 17

times. This indicated that the well had developed since the end of prior pumping and suggested that the base of zone C was now contributing water to well Al. Construc tion history of the well and prior short-term injection tests, which used water from an adjacent creek (Black, Crow and Eidsness, 1974), strongly support the possi bility that zone C was plugged during construction and injection and subsequently developed during pumping. The test data were considered to be unsuitable for analyz ing hydraulic coefficients of zone D because both zones C and D were probably contributing water to the test well.
Semiconfining Beds
Semiconfining beds within the Floridan aquifer the nonproductive beds between permeable zones are composed of limestone, dolomitic limestone, and dolomite and probably comprise parts of the Suwannee Limestone, the Ocala Limestone, and the Avon Park Limestone (fig. 3). Semiconfining beds above zone C (injection zone) are limestone; the Semiconfining bed below zone C is mainly dolomitic limestone and dolomite. Thickness of the two Semiconfining beds above zone C averages about 330 feet and ranges from 254 to 420 feet. Including zone B, the total thickness between zone A and zone C averages about 395 feet and ranges from 329 to 470 feet. Thickness of the Semiconfining bed below zone C aver ages about 135 feet and ranges from 97 to 183 feet. Average porosity of Semiconfining beds above zone C, estimated from geophysical logs at northwest Pinellas, southwest St. Petersburg, and northeast St. Petersburg, is about 30 percent and ranges from 22 to 36 percent. Poros ity of the Semiconfining bed below zone C, derived from geophysical logs at northwest Pinellas and northeast St. Petersburg, is 26 and 33 percent.
The physical nature of the permeability of the Semiconfining beds is not completely known. Cores taken from the limestone Semiconfining beds above zone C indi cate that the beds have closed fractures which generally show no indication of relative movement or solution (Hickey, 1977; Hickey, 1979; Hickey and Barr, 1979). Borehole television surveys suggest few, if any, visible fractures in the limestone. Based mainly on these obser vations, it appears that, at least for the limestone, the primary pores of the rock probably control the perme ability of the Semiconfining beds.
Data supporting the occurrence of Semiconfining beds between zones A and B and between zones B and C were derived mainly from short-term injection tests run at South Cross Bayou, McKay Creek, and southwest St. Petersburg. These tests are discussed in detail later in the report.
During the three injection tests into zone C, injec ted water was not observed in zone A or in zone B with the exception of one instance in zone B (Hickey, 1977;
18 Injection Tests in Pinellas County, Florida
Hickey, 1979; Hickey and Spechler, 1979). Volumes of injected water were sufficient to totally displace all native formation water at the three sites between the top of zone A and the base of zone C in the vicinity of the test wells for radial distances ranging from about 50 to 240 feet. Figures 7 and 8 show observation wells open to zones above the injection zone within these radial distances at the injection sites.
At the southwest St. Petersburg injection test site, some injected water was observed in a well open to zone B, 65 feet from the injection well, 5 to 6 days after the start of the injection test. However, injected water was not observed in the other zone B well, 733 feet from the injection well, during the entire test (91.1 days). For this latter well, injected water was noted in the injection zone below it within 6 to 14 days from the start of the test. Available data (Black, Crow and Eidsness, 1978) suggest that injected water was moving radially into the zone B observation well 65 feet from the injection well. This suggests that the appearance of injected water was proba bly caused by a "short circuit" related either to test well A3 or to well B6 and not to flow through the undisturbed limestone strata separating zones B and C at southwest St. Petersburg. Test well A3 has gravel in its annulus (Black, Crow and Eidsness, 1978) across part of the strata separating zone B from zone C.
In summary, available water-quality data collected during injection tests support the existence of semi- confining beds above zone C, with one exception, which was probably caused by a construction difficulty. Injected water has not been observed in permeable zones A and B at the test sites except as noted. The injection tests, how ever, have been relatively short term, and longer tests are needed to adequately test the effectiveness of the Semicon fining beds.
Vertical hydraulic conductivity for the semi- confining beds within the Floridan aquifer was deter mined from laboratory tests and aquifer tests. Figure 15 shows a log-normal probability plot of vertical hydraulic conductivity measured in the laboratory on cores taken from Semiconfining beds overlying zone C (injection zone) at the test sites (Hickey, 1977; Hickey, 1979; Hickey and Barr, 1979; Black, Crow and Eidsness, 1978; unpublished data, city of St. Petersburg). Included in figure 15 are three hydraulic conductivities from equiv alent strata in Polk County, about 60 miles distant from the test sites (Stewart, 1966). These conductivities agree with data from the test sites. The estimated mean of the vertical hydraulic conductivities is about 0.6 ft/d, with values ranging from 1.3 X 10" 3 to 2.6 ft/d. The lowest conductivity, 1.3 X 10~ 3 ft/d, is from the Semiconfining bed between zones A and B at the northeast St. Peters burg site. This Semiconfining bed contains some clay (Hickey, unpublished data on file in Tampa office of U.S. Geological Survey) and is similar to the equivalent strata

10.0 8.0
6.0
4.0
2.0
1.0 .8
.6
.4
> - 2t- (Jo .1 o - 080 .06
.04
.02-
p 0.01 £.008
> .006
.004
.002
EXPLANATION
O Data from Pinellas County and city of St. Petersburg
nData from Polk County (Stewart, 1966)
Estimated cumulative distribution curve
10 1520 30 40 50 60 70 PERCENTAGE
80 85 90 95 98
Figure 15. Log-normal probability plot of vertical hydraulic conductivity of limestone cores from semiconfining beds overlying zone C (injection zone).
at the McKay Creek site. At the southwest St. Petersburg site, vertical and horizontal hydraulic conductivities were measured (Black, Crow and Eidsness, 1978). These data indicate little or no difference between vertical and hori zontal hydraulic conductivities in the semiconfining beds and agree with Stewart's (1966) data from equivalent strata in Polk County, which also show little or no difference between vertical and horizontal conductivities.
Vertical hydraulic conductivities also were esti mated from the leakance coefficients derived from the aquifer test analyses discussed earlier. Leakance co efficient (K'/b f ) times thickness (b'} of a semiconfining bed gives vertical hydraulic conductivity (Kf). The total thickness between the pumped zone and other zones that had water-level changes was used in the calculations. These calculated vertical hydraulic conductivities have to be considered as equivalent (one value representing a series of strata with different values) when they are as
sumed to apply to strata containing semiconfining beds and permeable zones, as would be the case between zones A and D (figs. 4 and 5). Also, calculated hydraulic con ductivities are areal average values representing the re gion affected by the withdrawal tests. At any particular location, vertical hydraulic conductivity could be smaller or larger anywhere within the semiconfining beds.
The leakance coefficient interpreted from the zone A pumping test at southwest St. Petersburg, 2.9 X 10~ 3/d, can be assumed to be applicable to two stratigraphic intervals below zone A. (The stratigraphic interval overlying zone A was considered a negligible source of leakage because of its lithology and the relatively short duration of the test.) The first possibility is the strata between zones A and B (fig. 4); the second possibility is the strata between zones A and C (fig. 4). The latter possibility is considered reasonable even though draw down was not observed in zone C during the zone A test. This lack of response could have been caused by the ex tremely high transmissivity of zone C. Assuming that the leakance coefficient is applicable to the strata between zones A and B, the leakance coefficient times semi- confining bed thickness gives a calculated vertical hydrau lic conductivity of about 0.4 ft/d. Assuming that the leakance coefficient is applicable between zones A and C, the calculated vertical hydraulic conductivity is about 0.9 ft/d.
The leakance coefficients interpreted from the zone C test at southwest St. Petersburg range from 2.0 X 10~4/d to 1.8 X 10~ 3/d and are assumed to be applicable between zones A and C and zones C and D (fig. 4). With these assumptions, calculated vertical hy draulic conductivity ranges from about 0.1 to 1.0 ft/d.
Leakance coefficients interpreted from the zone C test at South Cross Bayou range from 3.7 X 10~ 4/d to 1.5 X 10~ 3/d and are assumed to be applicable between zones A and C and zones C and D (fig. 4). Calculated vertical hydraulic conductivities range from about 0.2 to 0.8 ft/d.
Leakance coefficients interpreted from the zone C test at McKay Creek range from 6.6 X 10~ 3 to 1.5 X 10~ 2/d and are assumed to be applicable between zones B and C (fig. 4). Calculated vertical hydraulic con ductivities range from about 1.2 to 2.8 ft/d.
From the above, the calculated vertical hydraulic conductivities range from 0. 1 to 2.8 ft/d and, even though not exactly comparable to the core estimates (bulk values versus point values), are within the range of the hydraulic conductivities measured on the cores (fig. 15). Because of the nature of both sets of hydraulic conductivity esti mates, an exact specification of the "true" vertical hy draulic conductivity of the semiconfining beds cannot be made either site by site or areally. Both sets of vertical hydraulic conductivity estimates, however, suggest that a physically plausible range of values applicable to the
Hydrogeology Floridan Aquifer 19

semiconfining beds that do not contain clay, and rounded to the nearest order of magnitude, would be 0.1 to 1.0 ft/d. For the semiconfining beds that contain clay between zones A and B, at and near McKay Creek and northeast St. Petersburg, data are insufficient to estimate a range of vertical hydraulic conductivity. Because of the presence of clay, however, the vertical hydraulic conduc tivity should be less and could possibly be on the order of 10~ 2 to 10- 3 ft/d.
Specific storage (Ss ) of the limestone semiconfining beds, calculated with average rock compressibility and average porosity of these beds, is 3.2 X 10~ 6/ft. There fore, diffusivity (K'/SS ) of the more permeable parts of the limestone semiconfining beds could range from 3.1 X 10⁴ to3.1 X 105 ft2 /d. These diffusivity values are relatively large and are the principal reason water-level changes occur rapidly in zones A and B above pumped zone C.
Upper Confining Bed
The upper confining bed of the Floridan aquifer in Pinellas County is composed of interbedded clay, marl, and limestone with rare occurrences of dolomite (Hickey, 1979). Clay and marl generally predominate and are very sandy in places. At some sites, limestone predominates. The upper confining bed probably comprises the Haw thorn Formation (fig. 3). For mapping purposes, the thickness of the upper confining bed was chosen to be the difference between the depth of the base of the surficial sand and the depth of the top of the persistent occurrence of limestone (Floridan aquifer). At the test sites (figs. 4 and 5), the thickness of the upper confining bed ranges from 0 to 115 feet. Figure 16 is a thickness map of Pinel las County adjusted from Buono and Rutledge (1979). The map shows that the upper confining bed thickens to the southwest but probably does not greatly exceed 150 feet throughout the county.
Previous studies in Pinellas County and in north west Hillsborough County have determined some hydro- logic properties for the upper confining bed of the Floridan aquifer. Cherry and Brown (1974), Sinclair (1974), and Hutchinson and Stewart (1978) reported lab oratory vertical hydraulic conductivities for the confining bed sediments. Twelve conductivities are reported for sandy clay and marl, ranging from 2.1 X 10~ 2 to 1.1 X 10~4 ft/d and averaging 8.3 X 10~ 3 ft/d; ^con ductivities are reported for clay, ranging from 2.8 X 10~ 3 to 6.6 X 10" 5 ft/d and averaging 7.6 X 10~4 ft/d.
During this investigation, one laboratory analysis of the vertical hydraulic conductivity of a core from the confining bed was performed. The core was taken from a marl in the lower part of the confining bed at the south
west St. Petersburg site. Black, Crow and Eidsness (1978) reported the vertical hydraulic conductivity to be 6.9 X 10~ 3 ft/d, which is within the above range for the marls and sandy clays and near the average value.
The vertical hydraulic conductivities discussed above were all determined in the laboratory at atmos pheric conditions. Because of this, they are probably somewhat higher than if they had been determined in place. Sinclair (1974) reported one vertical hydraulic conductivity, determined by a consolidation test, to be 1.3 X 10~4 ft/d. A comparison of this value with the average reported for clay (7.6 X 10~4 ft/d) shows that the consolidation test result is about six times smaller. Therefore, most reported hydraulic conductivity values are probably high.
Lower Confining Bed
The lower confining bed of the Floridan aquifer is composed of limestone and dolomite with intergranular gypsum and anhydrite. It probably comprises the Lake City Limestone (fig. 3). For mapping purposes, the top of the confining bed was chosen to be at the the first presence of intergranular gypsum in the carbonate rocks below the dark-brown, microcrystalline dolomite. Typically, gyp sum is first present in trace amounts but increases in percentage with depth. Percentages seldom exceed 10 percent of a given sample of rock cuttings. Figure 17 shows the altitude of the top of the lower confining bed. The surface, in general, dips to the south and ranges in altitude from about 1,000 feet in north Pinellas County to below 1,400 feet in south Pinellas County. The struc tural attitude of this surface is very similar to the attitude of the zone C surface (fig. 11).
Vertical hydraulic conductivities for the lower con fining bed of the Floridan aquifer were determined by laboratory tests on cores. Three conductivities deter mined on cores are 6.0 X 10" 7 ft/d, 3.3 X 10~ 3 ft/d, and 1.1 ft/d (city of St. Petersburg, unpublished data; Black, Crow and Eidsness, 1978). Stewart (1966) re ported vertical hydraulic conductivities derived from cores from equivalent strata in Polk County as 4.0 X 10~ 5 ft/d, 3.0 X 10~ 3 ft/d, 5.2 X !Q- 2 ft/d, and 2.0 ft/d. The above conductivities show a much larger range (with a weighting toward lower values) than the hydraulic conductivities measured on the cores from the semiconfining beds within the Floridan aquifer (fig. 15).
In addition to laboratory analyses, visual exami nation of the available cores, injection tests at Bear Creek (Black, Crow and Eidsness, 1974), flow-meter and temperature logs at South Cross Bayou (Hickey, 1979), and a borehole television survey at northwest Pinellas suggest that the strata comprising the lower confining bed are significantly less permeable than the shallow
20 Injection Tests in Pinellas County, Florida

semiconfining beds of the Floridan aquifer. These data the clay of the upper confining bed, and that it is certainlystrongly suggest that the lower confining bed could have much less permeable than the semiconfining beds of thea vertical hydraulic conductivity similar to or less than Floridan aquifer.
28°1583°00' 45' 30' 82°15'
28°00
45'
27°30'
Big Bayou Point.
ANCLOTt NATJONAl ^Anclote
WILUI If E ft f UC,S F Keys
Tarpon Sp
A} Crystal Bea
X PdlfTi Har\ ' !'
L. Crfla£lesi v\i O/o^T IsUnd f;
*v >
/, ClearwafcerO ' «.V* Bplleair Bpa< h/v V
^ -«' '
Indian Rocks Beach &
Redington Be
Madeira Beach"
St Petersburg Bear.
Pass-a Grille Beach
EXPLANATION
50 Line of equal thicknesscontour shows thicknessof upper confining bed ofthe Floridan aquifer. Interval50 feet. Dashed where approximate ' Terr
O Location of well with thickness McGilllsland^- in feet
Confining bed probably absent
Holmes Beach
Bradenton Bear
5 10 MILES ton
Base from U.S. Geological Survey State of Florida map 1967
Figure 16. Thickness of upper confining bed of the Floridan aquifer, Pinellas County.
Hydrogeology Lower Confining Bed 21

28°1583°00 82°15'
28°00'
27°30
<r' If. New Poet " pit" ; --p-.^ !g EU*ou Point, $-> f ..^ichey/ ; 4 ' } j ",
£l!£i:
OLD 7y5MP,4 \
1000 Structure contour shows altitude of top of lower confining bed of the Floridan aquifer. Contour interval 200 feet. Dashed where approximate. National Geodetic Vertical Datum of 1929
Location of well with altitude991 of top of confining bed." **/7
i J Ai>SA',t » EY [^_,
Bradenton Beach
10 MILES to
Base from U.S. Geological Survey State of Florida map 1967
Figure 17. Top of lower confining bed of the Floridan aquifer, Pinellas County.
22 Injection Tests in Pinellas County, Florida

Ground-Water-level Fluctuations
Ground-water-level fluctuations at the test sites are caused by tidal variations in the Gulf of Mexico, seasonal variations in water pumped from the Floridan aquifer, precipitation, barometric pressure changes, and earth tides. On a daily basis, tidal variations in the Gulf of Mexico are the most significant factor affecting ground- water-level fluctuations. This effect can be seen by comparing figures 18 and 19. Figure 18 shows a daily barogram at the southwest St. Petersburg site and a daily hydrograph at the Mullet Key tide station located about 7.4 miles from southwest St. Petersburg. Figure 19 shows hydrographs from wells monitoring the permeable zones at southwest St. Petersburg.
On a yearly basis, the volume of freshwater pumped from the Floridan aquifer is the most significant factor affecting ground-water-level fluctuations, including fluc tuations in permeable zones containing saline water. Figure 20 shows a comparison of 1977-78 water levels between the Mullet Key tide station and zone D at the Bear Creek site. The lowest ground-water levels in zone D occurred during late spring, and the highest water levels occurred during late summer. These periods correspond to periods of maximum and minimum withdrawals of fresh ground water from the Floridan aquifer.
During withdrawal and injection tests, the observed water level must be corrected for the background water- level fluctuations. These corrections were estimated using linear regression equations to calculate drawdown or buildup. At the beginning of a test (1 to 2 hours), a linear regression between water levels and time (trend), devel-
yuj£ 5
||S|| 34.00
5'55§ Mm
^-11 II IIi= BAROGRAM
HI II II
1 1 1 1 II 1 1
1 1 1 1 1 1 1 1 1 =
1600 2000 2400 0400 0800
TIME, IN HOURS
1200 1600
Figure 18. Barogram at southwest St. Petersburg and hydrograph at Mullet Key tide station for March 9-10, 1977.
O_l LLUJ o
^5
8.50
8.00
7.50
ZONE A (WELL 85)
Lags Mullet Key Tide Station (Figure 18) by 105 mm..
LLJ O 1.50<y 1.00
ZONE B (WELL B4)_________i Lags Mullet Key Tide Station
(Figure 18) by 135 min.
UJ >
0-3.50 ZP uj_r o -4.oouj o> UJ UJ
< O -7.00
Z-7.50
Lags Mullet Key Tide Station (Figure 18) by 105 min^
ZONE D (WELL BDLags Mullet Key Tide Station
(Figure 18) bv 90 min.
1600 2000 2400 0400 0800 1200 1600 TIME, IN HOURS
Figure 19. Hydrographs from permeable zones at south west St. Petersburg for March 9-10, 1977.
oped with data prior to the start of the test, was used to estimate background water levels. To insure that trend estimates were as accurate as possible, all tests were started on the most consistent linear segment of the back ground water-level hydrographs, the period between high-high and low-low tides (fig. 19). After a test had been running for 1 to 2 hours, background water levels were estimated using linear regression equations devel oped with data from the test site and from one other site. Standard error of estimate for 55 regression equations averaged 0.05 foot with a standard deviation of 0.03 foot.
Before these regression equations could be devel oped, time differences between water-level peaks and troughs at the different sites had to be removed. Cross covariance analysis (Wang Laboratories, Inc., Program 01-2200.01A-OOF1-26-0) was used to determine these time differences. In this method, time differences between the occurrence of peaks and troughs at different sites are related to calculated maximum covariance between hydrographs.
Ground-Water Flow in Permeable Zone C (Injection Zone)
The possibility of ground-water flow in zone C (in jection zone) was investigated using the "three-point problem" method. The "three-point problem" method is commonly used in structural geology (Billings, 1955) to
Hydrogeology Ground-Water-Level Fluctuations 23

determine the magnitude and direction of dip of a plane that represents the top of a bed. The magnitude and direction of dip are physically analogous to magnitude and direction of hydraulic gradient. Direction of hydrau lic gradient is equivalent to direction of ground-water flow when hydraulic conductivity is isotropic. Assuming that the zone C potentiometric surface is approximately planar, the method can be used to determine whether there is ground-water flow and the approximate mag nitude and direction of hydraulic gradient of such flow.
Three-point problems for May and September 1978 were constructed from water levels in zone C at Bear Creek, northeast St. Petersburg, and northwest Pinellas. The May results indicated saltwater flow with a hydraulic
gradient of magnitude 0.2 ft/mi and directed toward an azimuth of 115°. May water-level data from other test sites were also used to construct three-point problems in differ ent combinations; all solutions gave similar results. The September results also indicated saltwater flow with a hy draulic gradient of magnitude 0.2 ft/mi directed toward an azimuth of 110°. Both the May and the September so lutions to the three-point problems indicate the possibility of saltwater flow in zone C with a relatively low magnitude of hydraulic gradient directed east-southeast toward cen tral and south Hillsborough County and north Manatee County. This area has the largest annual water-level fluc tuations and the largest long-term decline in water levels within the Tampa Bay area (Mills and Laughlin, 1976).
6.0
4.0
y 3.0ocUJ
oUJO OUJa
o
o
O 00
2.0
1.0
-1.0
-2.0
-4.0UJ
ocUJ
5 -5.0 £
-6.0
Mullet Key Tide Station
A Zone D at Bear Creek, Well B1 (water levels are plotted for noon of each Wednesday)
1977 1978
May | Jun | Jul | Aug | Sept | Oct | Nov | Dec | Jan | Feb | Mar | Apr | May | Jun
Figure 20. Comparison of 1977-78 water levels from Mullet Key tide station and Bear Creek, zone D.
24 Injection Tests in Pinellas County, Florida

The magnitude and direction of hydraulic gradient in zone C are very similar for both May and September, suggesting an approximately steady flow in 1978. Water levels were higher in September than in May, yet the apparent flow in zone C remained about the same in magnitude and direction for both times. This suggests that saltwater in zone C flows mainly in response to two principal long-term hydrologic causes. The first is the long-term gradual decline in water levels and associated long-term and gradual reduction in the westward flow of fresh ground water to the coastal areas of central and south Hillsborough and north Manatee Counties. The second is the large-scale pumping of saltwater that has occurred for several years (45 Mgal/d in 1975) and con tinuously throughout each year at an industrial site on the coast of central Hillsborough County in the vicinity of Riverview, Florida (Leach, 1978). These industrial wells are open to zone C and yield water with chloride concen trations ranging from about 12,000 to 19,000 mg/L. At present (1979), it is not possible to determine the relative importance of each cause of the east-southeast saltwater flow in zone C.
Water Quality
Chemical composition of water from selected wells in the surficial aquifer and in permeable zones of the Floridan aquifer at the injection test sites is listed in tables 4 through 8. Lowest dissolved-solids concentration occurs in water from the surficial aquifer (table 4); high est concentration occurs in the water from zone D (table 8). Water from zone C, the injection zone (table 7), is approximately comparable to seawater.
Figures 21 and 22 show vertical profiles of chloride and dissolved-solids concentration along lines A-A' and B-B'. Chloride concentration in water from the surficial aquifer ranges from 6 to 1,400 mg/L. Chloride concen tration in water from zone A ranges from 91 to 16,000 mg/L and in water from zones B through D from 13,000 to 21,000 mg/L. Dissolved-solids concentration of less than 10,000 mg/L occurs in water from the surficial aqui fer and zone A (figs. 21 and 22). Water with dissolved- solids concentration equal to or greater than 10,000 mg/L occurs in the lower part of zone A at the northeast St. Petersburg site and in zones B through D (figs. 21 and 22) at all of the sites.
Figures 21 and 22 show that chloride concentration varies vertically within zone A. Potable water with less than 250 mg/L, where it occurs, is typically in a thin stratum at the top of the zone. The vertical variation in chloride indicates that water in zone A is density stratified.
Density stratification helps to explain the vari ability of chloride concentration in water from adjacent wells in Pinellas County sampled by Heath and Smith
(1954) and from adjacent wells sampled for this report and shown in figure 23. The vertical variability of water- producing intervals in zone A and wells open to different depths, when coupled with water-quality stratification, explains the variations in concentration between adjacent wells. Heath and Smith (1954) recognized the impor tance of wells open to different depths, but also considered upconing to be an important process. As indicated by observations at McKay Creek and southwest St. Peters burg (Hickey, 1977; Hickey and Spechler, 1979; Black, Crow and Eidsness, 1978), upconing, while probably oc curring on a limited scale, is not very important because its effect is masked by effects of variable distribution of water-producing intervals within the density-stratified water column.
Figures 21 and 22 also show that within zone A chloride concentration varies laterally. The test sites clos est to the coastal margins of the Pinellas peninsula typi cally have higher concentrations in both the upper and lower parts of zone A, with the exception of the upper part of zone A at McKay Creek.
Figure 23 shows the chloride concentrations in water from selected wells open to permeable zone A with in Pinellas County and the surrounding area. In Pinellas County, water with a chloride concentration equal to or less than 25 mg/L occurs in the vicinity of the major recharge area identified by Heath and Smith (1954). A chloride concentration of 25 mg/L is an approximation of the highest background concentration in fresh ground water from the Floridan aquifer at locations distant from Tampa Bay and the Gulf of Mexico.
Figure 24 shows the chloride concentration in water from selected wells open to permeable zone C within Pinellas County and the surrounding area. Most of zone C underlying the county contains water with chloride concentrations equal to or greater than 19,000 mg/L.
INJECTION TESTS
Injection tests were run at three test sites: McKay Creek, South Cross Bayou, and southwest St. Petersburg. At each site, more than one injection test was performed. In this report only the initial tests are discussed. All sub sequent tests were performed either to confirm results of the initial tests or to gather data to answer specific questions about well construction or injection well performance. The initial tests ranged in duration from 3 days at South Cross Bayou to 91.1 days at southwest St. Petersburg and ranged in injection rate from 650 gal/ min at McKay Creek to 4,350 gal/min at South Cross Bayou.
Hydrogeology Water Quality 25

Table 4. Chemical composition of water from selected wells open to the surficial aquifer
[Chemical analyses expressed in milligrams per liter except as noted]
Parameter
Temperature (°C) __ . ___ _ _ ____ _Specific conductance (micromhos
per centimeter at 25°C) __ ____ __ ____ .Dissolved solids (by evaporation) ___ _Density (grams per milliliter at 20°C) __pH_______________________________________________Calcium (Ca) _______ _ _ ____ ________ _ _Magnesium (Mg) _ _ _ __ _Sodium (Na) . ____________ _ ___ _____ _ _Potassium (K)Silica (SiO2 ) _________ __________________Strontium (Sr) (micrograms per liter) _ _Chloride (Cl)___________________________________Bromide (Br)___________________________________Fluoride (F)__ __ ____ _ _ __ _____ _ _Sulfate (SO4 ) _ . .Boron (B)__.____________________________________Bicarbonate (HCO3 ) _________________________Total nitrogen (N) _____Total phosphorus (P) ______ ._ _ _____
NorthwestPinellas280629
0824542.04
6932
5.15.31.72.9
.52.6
303.3
.318
7.13.02
McKayCreek275237
0325028.01
23.5
435259
.9977.5
391924
1.429
11035
.212
187.68.07
South CrossBayou274918
0824431.01
24.3
660404
.9987.7
1001028
.922
68037
.3
.8
384.54
NortheastSt.
Petersburg274935
0823702.06
25.3
4,9403,040
.9986.8
36040
7009.6
142,3001,400
5.30
5390
2301.6.42
BearCreek274628
0824256.01
24.5
343210
.9974.45.3
1126
6.38.8
16072
.239
01.54.01
SouthwestSt.
Petersburg274311
0824118.01
27.0
244120
.9983.97.65.1
166.58.1
9032 0
3470
01.0.05
Table 5. Chemical composition of water from selected wells open to permeable zone A
[Chemical analyses expressed in milligrams
Parameter
Temperature (°C) _ ___- ______ - __ _Specific conductance (micromhos
per centimeter at 25°C) _ ___ __ _ _Dissolved solids (by evaporation), _ _ _Density (grams per milliliter at 20° C)pHCalcium (Ca) __ ___ _ ______ ___ _ _Magnesium (Mg) _ _ _____Sodium (Na) _ _ _ ___ _________ ___Potassium (K) ______ _ _ _ _ _ _ __ ________Silica (SiO2 ) _ _ __ __________________________Strontium (Sr) (micrograms per liter) _ __Chloride (Cl)______________-___________________Bromide (Br)Fluoride (F)_Sulfate (SO4 ) __________________________________Boron (B)____ ___ __________________________Bicarbonate (HCO3 ) ___ .. __ __Total nitrogen (N) _ _ _ _Total phosphorus (P) _ _ _ _
NorthwestPinellas280631
0824551.01
25.6
9,9306,540
1.0037.5
260180
1,70045
8.82,6003,300
6.2.2
470440140
.46
.11
McKayCreek275241
0825039.01
-
775508
1.0007.4
743228
1.543
640120
.5
.61250
252
per liter except
South CrossBayou
2749290824435.01
25.5
1,800969
1.0007.4
16047
110133.6
5,000450
.36050
159.62.03
as noted]
NortheastSt.
Petersburg274935
0823702.05
26.2
44,80032,900
1.0186.7
1,100980
9,300200
1322,00016,000
840
2,200900160
.61
.26
BearCreek274614
0824252.05
25.5
2,4901,530
.9987.4
23030
2303.6
302,100
6803.0
.22570
248.78.07
SouthwestSt.
Petersburg274259
0824102.05
25.3
7,6005,530
1.0027.9
510110
1,2002717
15,0002,200
14.4
5409089
1.13.10
26 Injection Tests in Pinellas County, Florida

Table 6. Chemical composition of water from selected wells open to permeable zone B
[Chemical analyses expressed in milligrams per liter except as noted]
Parameter
Temperature (°C) _ _ __ _ ______Specific conductance (micromhos
per centimeter at 25°C) _______________ _ _______Dissolved solids (by evaporation). _ _ _ _Density (grams per milliliter at 20°C) __ _ _PH_Calcium (Ca) _____________________________________ __Magnesium (Mg) ______ __ _________________Sodium (Na) ___ __ ____Potassium (K) _____ __ _ _____Silica (SiO2 ) _________________________________________Strontium (Sr) (micrograms per liter) _ _______Chloride (Cl)______________________________________ __Bromide (Br)___________________________ __________ __Fluoride (F) _ ____ ___ ____ _ _ __ ____Sulfate (SO4 ) ________________ _____ _._._.._.. _Boron (B)_____________________________________________Bicarbonate (HCO3 ) ______Total nitrogen (N) _____ ____ _______Total phosphorus (P)_
McKay Creek 275244
0825037.01
26.4
___________ 52,000
___________ 1.025_ ______ 7.7________ _ 970___________ 1,200___________ 12,000___________ 370___________ 8.7___________ 32,000________ 20,000___________ 48___________ 1.0___________ 3,100
6,000___________ 184___________ 1.03___________ .02
South Cross Bayou 274922
0824431.01
27.0
49,90035,500
1.0246.1
1,000920
11,000430
7.523,00019,000
.63,0003,300
119.31.04
Northeast St.
Petersburg 274935
0823702.03
26.7
53,33038,400
1.0247.0
9201,200
12,000500
9.730,00019,000
88.1
3,1003,200
220.69.07
Bear Creek 274614
0824252.04
25.9
43,60030,400
1.0207.5
120730
9,400320
5.437,00016,000
76.5
2,500920100
1.18.03
Southwest St.
Petersburg 274259
0824102.04
27.0
36,50026,700
1.0188.2
1,500550
7,200210
1140,00013,000
70.6
2,700710
911.54.04
Table 7. Chemical composition of water from selected wells open to permeable zone C
[Chemical analyses expressed in milligrams per liter except as noted]
Parameter
Temperature (°C) ___________________________Specific conductance (micromhos
per centimeter at 25° C) __ _ _____Dissolved solids (by evaporation). ___ _ _Density (grams per milliliter at 20°C)pH.___ _ __ _Calcium (Ca) _ __ _______ _ __ _Magnesium (Mg) _ _ _Sodium (Na)_Potassium (K) _ __ __ _ ___ ____ ___Silica (SiO2 ) _______________________________Strontium (Sr) (micrograms per liter)Chloride (Cl)______________________.__________Bromide (Br)___ _ _____Fluoride (F)Sulfate (SO4 ) ________________________________Boron (B)Bicarbonate (HCO3 ) _ _Total nitrogen (N) __ _ _ __ ___ __________Total phosphorus (P) _____ _ __________
Northwest Pinellas 280630
0824550.02
26.2
.__ 51,500
.__ 39,2001.0257.3
860.__ 1,300__ 12,000
410.9
... 11,000
.__ 20,00052
.8._ 2,900__ 2,200
133
.21
McKay Creek 275241
0825039.02
28.6
52,50038,200
1.0256.8
7701,200
12,000410
1225,00020,000
781.2
2,8002,800
195.76.07
South Cross Bayou 274922
0824435.01
27.8
50,60038,100
1.0257.5
9101,100
11,000400
1127,00020,000
1.13,0004,200
186.65.03
Northeast St.
Petersburg 274934
0823707.02
27.3
56,50041,800
1.0257.0
8801,300
12,000460
9.229,00020,000
110.1
3,2003,800
230.89.11
Bear Creek 274614
0824252.02
26.5
53,00037,900
7.2880
1,20011,000
3809.4
33,00021,000
84.9
3,1002,500
186.91.02
Southwest St.
Petersburg 274259
0824054.01
28.7
52,00037,800
1.0266.9
1,0001,270
13,000440
1116,00020,000
90.4
2,8003,900
180.53.10
Injection Tests 27

Table 8. Chemical composition of water from selected wells open to permeable
[Chemical analyses expressed in milligrams per liter except as noted]
zone D
Parameter
Temperature (°C) _ _Specific conductance (micromhos
per centimeter at 25 °C) . .Dissolved solids (by evaporation)Density (grams per milliliter at 20°C)pH . . _________________________ ,________.Calcium (Ca) _____^___________________ _____________________Magnesium (Mg) _____Sodium (Na)Potassium (K) _ _Silica (SiO2 ) _____________- _-_____ _____-- .Strontium (Sr) (micrograms per liter)Chloride (Cl)__________________-_--_____-___..__-_________--_--.Bromide (Br) _ __ __ _ .Fluoride (F) _ _ __________________ ________ __ _ __ _ __Sulfate (SO4 ) -Boron (B)_._ --.-.._ _- __________________Bicarbonate (HCO3 ) ___ ___ _ ______ _Total nitrogen (N) _ _ _Total phosphorus (P)_
South Cross Bayou 274922
0824431.04
.__ . ___..._._.. 26.0
53,700_ ______________ 39,800
______________ 1.026_____________ 6.3
1,300___ _____________ 1,100
1,200
__________________ 1028,00021,000
______ . 1.13,800
________ ________ 4,500_______ . 182_____ _____ 1.31
......_-__._...._.. .13
Northeast St.
Petersburg 274934
0823707.01
27.8
56,68043,500
1.0266.8
9201,3001,300
4908.9
29,00021,000
84.4
3,0003,600
210.76.08
Bear Creek 274614
0824252.01
26.6
52,90038,600
1.0267.0
7401,1001,200
4109.1
29,00020,000
501.3
4,1002,500
179
.03
Southwest St.
Petersburg 274259
0824102.01
28.8
56,00042,500
1.0296.9
8001,2001,200
4009.2
28,00021,000
1101.1
4,4002,800
2031.08.15
McKay Creek
The McKay Creek injection test was run for 57.1 days, starting at 1200 hours on February 19, 1976, and ending at 1346 hours on April 16, 1976. Injection water came from two wells, Cl and C2 (figs. 6 and 8), open to permeable zone A of the Floridan aquifer. Chloride con centration of the injected water ranged from 93 to 110 mg/L. The average injection rate was 650 gal/min. The total volume of water injected was 5.34 X 10⁷ gal. Water- level and water-quality data were collected before, dur ing, and after the test (Hickey, 1977).
During the test, water-level changes caused by in jection were too small to be measured in any observation well except well B2 in zone C (Hickey, 1977). Water- level change in well B2 was probably caused by a small decrease in water density within the well.
Water-quality changes were observed in well B2 located 585 feet (distant) from test well A3 and open to the top of the injection zone. Chloride concentration in water from B2 dropped from 20,000 mg/L before the test to 18,000 mg/L at the end of the test. Figure 25 compares the chloride concentration in water from wells A2 and B2 during the test. Well A2 is immediately above and in the annulus of test well A3 (fig. 8) and is open to the top of the injection zone. Well A2 showed no water-quality
28 Injection Tests in Pinellas County/ Florida
changes during the test, even though it is immediately above the interval into which the water was being injec ted. This suggests inhomogeneity in the vertical hydraulic interconnection of the injection zone, which, as previously mentioned, is probably composed of vertical and oblique fractures that have been enlarged by solution. In the immediate vicinity of well A2, there apparently are no vertical pathways across the injection zone, whereas somewhere between wells A2 and B2 (figs. 6 and 8), there is vertical interconnection.
South Cross Bayou
The South Cross Bayou injection test was run for 3 days, starting at 1545 hours on October 30, 1974, and ending at 1607 hours on November 3, 1974. Injection rate for the test averaged 4,350 gal/min, and the total volume of water injected was about 1.89 X 10⁷ gal. Water for injection came from a tidally influenced creek adjacent to the test well. Chloride concentration of the injected water averaged 710 mg/L and ranged from 92 to 2,400 mg/L. Chloride concentration of the native formation water in the injection zone was 20,000 mg/L. Water-level data were collected before and during the test; water-quality data were collected before and after the test (Hickey, 1979).

Chloride concentration in water from the obser vation wells after the injection test is shown in figure 26. A mixture of injected and native formation water with a chloride concentration of 8,800 mg/L was found in well A2 after the test. The density of this water was 1.011 g/mL at 20° C. Density of the native formation water was 1.025 g/mLat20°C.
Pressure Buildup
Calculated pressure buildups in observation wells at South Cross Bayou at the end of the test are shown in figure 27. These pressure buildups show the effects of the injection test on the natural flow system. The magnitude of pressure buildup in the observation wells is very small, ranging from 0 to 1.2 lb/in2 . This reflects, in part, the high transmissivity of the injection zone.
Assuming that the density of water in the casings did not change during the test, pressure buildup in obser vation wells at the end of the test was calculated from observed changes in water levels using the following relationship:
dp = sp(T)g/\44 where dp = pressure buildup (pounds per
square inch), s = water-level buildup in observation
well at end of test (feet), p(T) = density of water at average tem
perature in casing (slugs per cubic foot),
g = acceleration of gravity at 30° lati tude (feet per square second).
Measured water-level buildup at the end of the test was corrected by the linear regression methods discussed previously. For each well a background water level was estimated for the end of the test and then subtracted from the observed water level to yield buildup. This method for estimating water-level buildup is useful as long as den sity does not change in the casing of an observation well. In well A2, density changes occurred in the open-hole section of the well (fig. 26). However, the specific conduc tance of water pumped from the well after the test sug gested that most of the formation water in the casing had not been displaced by the dispersed injection water. Thus,
250 NORTHWEST PINELLAS
A'
SOUTHWEST BEAR ST. PETERSBURG CREEK
A
McKAYCREEK
.^SECTION 1 B-8'
1 Upper confining bed of 150 the Floridan aquifer
680
ZONE C (Injection zone)
Lower confining bed of the Floridan aquifer
<Q
1500
(VERTICAL SCALE EXAGGERATED X80)
EXPLANATION
20,000 Chloride concentration in milligrams per liter
Dissolved-solids concentration less than 10,000 milligrams per liter
Dissolved-solids concentration equal to or greater than 10,000 milligrams per liter
Figure 21. Vertical section A-A' showing chloride and dissolved-solids concentration in ground water. (Location of section A-A' is shown on figure 2.)
Injection Tests 29

250NORTHEAST
ST. PETERSBURG
Surficial aquifer Upper confining bed of the
Floridan aquifer1500
(VERTICAL SCALE EXAGGERATED X80)
EXPLANATION
20,000 Chloride concentration in milligrams per liter
Dissolved-solids concentration less than 10,000 milligrams per liter
iitlillll Dissolved-solids concentration equal to or &&&SSMa greater than 10,000 milligrams per liter
Figure 22. Vertical section B-B' showing chloride and dissolved-solids concentration in ground water. (Location of section B-B' is shown on figure 2.)
pressure buildup for A2 was calculated in the same man ner as used for the other observation wells at South Cross Bayou.
At the end of the test, the rate and direction of vertical movement across the semiconfining bed overlying the injection zone was the sum of the background and the injection-caused vertical velocity fields. This can be stated in the following manner:
v, = vzb + vzi,where vz = vertical velocity in semiconfining
bed at end of test (feet per day), vzb = vertical velocity in semiconfining
bed caused by background condi tions (feet per day),
vzi == vertical velocity in semiconfining bed caused by injection (feet per day).
The actual rate of vertical movement across the semiconfining bed at the end of the test is unknown. How ever, by assuming steady flow with total displacement and constant density of water in the semiconfining bed before and during the injection test, vertical rates can be esti mated. Constant density of water is a reasonable approxi mation because of the short-term nature of the test.
Hubbert (1969) examined the conditions necessary for a region of ground-water flow to possess a potential field and therefore a derivable gradient and velocity field. One of his conclusions was that the region of interest had to have a constant density. Hubbert's method of analysis considered that when a potential existed it would be a function of the density of water in the region of interest. Thus, as long as water density within the semiconfining bed is essentially constant, even though density changes below the bed, the vertical velocity is derivable from the potential difference across the bed at the end of the test.
The measure of potential used in this report is head, calculated as a function of density of water in the semi- confining bed. This may be stated as
, P
where h(ps ) head as a function of density ofwater in semiconfining bed (feet),
z = altitude of point of head calcu lation measured from National Geodetic Vertical Datum of 1929 (feet),
P pressure at z (pounds per square foot),
ps = density of water in semiconfining bed (slugs per cubic foot),
g acceleration of gravity at 30° lat itude (feet per square second).
The vertical component of head gradient across the semiconfining bed at the end of the test is
dh(Ps ) _ . dP/dz j i -f ,dz psg
where 4^ = vertical component of head gra dient as a function of density of water in the semiconfining bed (foot per foot),
dP/dz = vertical component of pressure gradient across semiconfining bed (pounds per cubic foot),
ps and g are defined as above.Recognizing that a similar expression can be written for the vertical component of head gradient under back ground conditions ([dhb (ps )]/dz) and also that the difference between the gradients at the end of the test and background conditions ([dh(ps )]/dz [dhb (ps )]/dz)is equal to the vertical component of gradient caused by injection ([dhi(ps )]/dz), then the vertical velocity at the end of the test may be stated as either
30 Injection Tests in Pinellas County/ Florida

or
v,
where /sTr = vertical hydraulic conductivity of semiconfining bed (feet per day),
0 porosity of semiconfining bed,dPb/dz vertical pressure gradient
across semiconfining bed under background conditions (pounds per cubic foot),
dPf/dz = dP/dz-dPb/dz = pressure buildup gradient across semi- confining bed caused by injec tion (pounds per cubic foot),
dP/dz, ps , and g are defined as above.The maximum vertical velocity at the end of the
test will occur in the vicinity of the injection well because the vertical component of driving force per unit weight of water is a maximum at that location. Using the hydraulic parameters deduced earlier in this report, a range of ver tical pore velocities can be computed choosing dPb/dz = -63.73 lb/ft3 [calculated from data in Hickey (1979)], dP,/dz = -0.58 lb/ft3 (calculated from data in figure 27), Kz = 0.1 to 1 ft/d, 6 = 0.3, Ps = 1.985 slugs/ft3 at 27°C, and g = 32.129 ft/s2 .
Background vertical velocity ranges from 0.002 to 0.0002 ft/d (negative sign indicates downward direc tion). Injection-caused upward vertical velocity ranges from 0.03 to 0.003 ft/d. Thus, in the vicinity of the injec tion well at the end of the test, the driving forces associ ated with injection are dominant and effectively control the vertical pore velocity in the semiconfining bed.
The reasonableness of the 0.03 to 0.003 ft/d range of vertical velocities was verified by results of a subse quent injection test and drilling at South Cross Bayou. After the test just discussed, an injection test was run for about 1 day using rhodamine WT, a fluorescent dye, as a tracer in the injection water (Pinellas County, written commun., 1977). About a year after the 1-day test, an additional observation well was drilled about 250 feet from test well Al. During the drilling, rhodamine WT was observed between 747 and 761 feet below land sur face (Pinellas County, written commun., 1978) near the top of zone C shown in figure 27. This indicates that the injected water did not move much above the top of the zone during the 1-day test and in the subsequent year, and supports what would be generally deduced from the above calculated velocities for the vicinity of the test well. It should be pointed out that the velocity estimates cal culated above are for conditions at the end of the 3-day
test and cannot be used to estimate the expected vertical rates of flow in the semiconfining bed during long-term injection.
Southwest St. Petersburg
The southwest St. Petersburg injection test was run using well A3 for 91.1 days, starting at 1335 hours on June 21, 1977, and ending at 1500 hours on September 20, 1977. For the first 9.1 days of the test, the injection rate averaged 3,380 gal/min with a standard deviation of 80 gal/min. For the rest of the test, 82 days, the injection rate averaged 2,770 gal/min with a standard deviation of 150 gal/min. Average injection rate for the entire test was 2,830 gal/min. Volume of water injected during the test was 3.7 X 10⁸ gal. Injection water came from the ef fluent of the city's wastewater treatment plant located at the site. During the test, rhodamine WT was placed into the injected water and used as a tracer.
Use of Dye Tracer
Rhodamine WT dye, used as a tracer, provided a basis for judgments about the presence of injected water in observation wells. It was detected in three wells at the site during the test. Rhodamine WT arrived in well B6 between 0.03 and 1.2 days from the start of the test, in well B7 between 5 and 6 days from the start of the test, and in well B3 between 6 and 14 days from the start of the test (Hickey and Spechler, 1979). The dye was not de tected in any other well during the test. As mentioned earlier, the appearance of rhodamine WT in well B7 is considered to be the result of a "short circuit" in the vicinity of injection well A3 and probably does not repre sent flow across the undisturbed strata above the injection zone. Wells B3 and B6 are both open to the top of the injection zone at distances of 733 and 36 feet, respec tively, from the test well. Rhodamine WT was not de tected in well B2 open to the lower part of the injection zone at 733 feet from the test well. This indicates that injected water stratified due to density differences near the top of the injection zone within a relatively short radial distance from the injection well during the test.
Figure 28 shows rhodamine WT concentration ver sus elapsed time for the injected water (test well A3) and for wells B3 and B6. Rhodamine WT concentration in the injected water varied in an approximately cyclic pattern and had an average concentration of 834 mg/L, a stand ard deviation of 234 mg/L, and a range of 525 to 1,400 mg/L.
The cyclic variation of rhodamine WT concen tration in the injection water is partially dampened out in well B6 and completely dampened out in well B3. This
Injection Tests 31

83°00 82°15'
ANCLOTE NATJONAi. rAncJot.e '
WILUMFE fUFUbf > Keys / P %
5f PETERSBURGTreasure Islan
950St Petersburg
EXPLANATION
25 Approximate line of 25 milli gram per liter chloride concentration
o Well with chloride concentra- 270 tion in milligram per liter.
Lowest concentra- Well with tion within zone
4000 Highest concentra tion within zone
Bfadenton Beac
10 MILES ^h,,N,,«E,«
Base from U.S. Geological Survey State of Florida map 1967
Figure 23. Chloride concentration in water from selected wells open to permeable zone A, Pinellas County and surrounding area.
32 Injection Tests in Pinellas County, Florida

83°00' 82°15'
ANCL'lU NAMONAl || Anclote 'f
Wit IH If F
ERSBURG
St Petersburg Beacrt
EXPLANATION
25 Approximate line c milligram per liter chloride concentration.
Well with chloride concen-\ t tration in milligrams per _ gff f liter.
Palrpa-Sotli, ~^Holmes Beach \Vji r27°30'
Base from U.S. Geological Survey State of Florida map 1967
Figure 24. Chloride concentration in water from selected wells open to permeable zone C (injection zone), Pinellas County and surrounding area.
Injection Tests 33

30,000
ZUJ CJz oCJ
UJoQCO_lICJ
,- 25,000
20,000
15,000
A. Well A3 average injection rate for 57.1 days was650 gallons per minute
B. Chloride concentration of injected water averaged100 milligrams per liter and ranged from 93 to120 milligrams per liter
C. Injected water was observed during test in well B2
o-
UJ UJ
Z
UJ 0
1-h-
1400-
RACT
|C2 'C1 '
A1
A2
A3 , Test well (
81
82
83
84
0 600 HAL DISTANCE FROM EST WELL, IN FEET
-o- A2-o-o
B2
10 20 30 40 TIME SINCE INJECTION STARTED, IN DAYS
50 60
Figure 25. Chloride concentration in water from wells A2 and B2 during injection test, McKay Creek.
probably is the result of mixing of injected water with formation water and of sorption of rhodamine WT on the rocks of the injection zone.
Water-Quality Changes
Figure 29 shows the chloride concentration in water from the observation wells at the end of the injection test. The only wells that had chloride changes were wells B3, B6, and B7, the same wells in which rhodamine WT was detected. The change in well B7, as mentioned above, can probably be attributed to a "short circuit" in the immedi ate vicinity of test well A3. An interesting result shown in figure 29 is that well B6 at the end of the test had a chloride concentration (1,800 mg/L) that was one order of magnitude greater than the average of the injected water (180 mg/L).
The chloride concentration in water from wells B3 and B6 versus elapsed time during the southwest St. Petersburg 91.1-day injection test is shown in figure 30. At the start of the test, chloride concentration in both wells was about 15,000 mg/L. Concentrations differed from native conditions (19,000 mg/L) because water was injected into test well A3 just before the test to calibrate instrumentation used for measuring wellhead pressure
34 Injection Tests in Pinellas County, Florida
and injection rates. In the lower part of the zone at the start of the test, chloride concentration was at native conditions (20,000 mg/L), at least in well B2. During the test, chloride concentrations of injected water averaged 180 mg/L and ranged from 35 to 340 mg/L.
Figure 30 shows that the chloride concentration in water from well B6 did not change significantly after 41 days of the test had elapsed. The chloride concentration for this period ranged from 1,600 to 2,000 mg/L. Specific conductance of the samples ranged from 5,670 ^mho/cm (micromhos per centimeter) to 6,450 ^mho/cm; density of the samples was 1.001 g/mL at 20° C (Hickey and Spechler, 1979).
A similar pattern of stabilization of chloride con centration is seen for well B3 in figure 30 but for a differ ent period of time. Chloride concentration in well B3 ranged from 5,800 to 5,400 mg/L after 62 days had elapsed. Specific conductance of these samples ranged from 15,900 to 16,800 ^mho/cm; density of the samples was 1.006 g/mL at 20°C (Hickey and Spechler, 1979).
The very slow rate of change or apparent quasi- stabilization of the chloride concentration in wells B3 and B6 (fig. 30) suggests that dispersion of injected water into formation water was relatively great and that chlorides might be added to the dispersed water plume as it moved

ALTITUDE IN FEET, ABOVE AND BELOW NATIONAL GEODETIC VERTICAL DATUM OF 1929
JlfeMOOOCDfkM N. DgooOOoO C
DO OOOOOOOC
-
1 SOUTH CROSS BAYOU 'CHLORIDE CONCENTRATION (mg/L) IN WATER FROM
8800 WELL AFTER 3 DAY INJECTION TEST19,000 CHLORIDE CONCENTRATION (mg/L) IN FORMATION
WATER FROM WELL Land Surface
Floridan aquifer
Surficial aquifer
! X'XvXvX-of the Floridan aquifer -XvXvX
1 ii0.
"A4 ZONE A
: 1 9,000 X-X-X-XvX-XvXvX-XvX-X-XvX-I- 19,000 -X-X-X-XvX-XvX-X-X-X-XvX-X-X-
|A3 ZONE B B4
^eWllllllllp-Estimated position of B3H 19 000 MSiipSS*'1"' dispersed injection water
ZONE C lip:51** (Injection zone) 8I/ 710 Average of injected
120,000 water
Test well A1 B2
;..... .r.............^'^'.........^
Wft» :crfB5v:
1 9,666 .-.^19,000 : : :
20,00020,000
20,00020,000
20,600' : : 20,000 -X-;
.-. . . . . . . . . . . . . . . . . Lower confining . . . . . . . .-. . . . . . . . . .': : : : : : : : : : : : : : : : : : bed of the -x-XvX-XvX-x-x-Tv
l ! I i i200 400 600 800
RADIAL DISTANCE FROM TEST WELL, IN FEET
1000
Figure 26. Chloride concentration in water from observa tion wells after injection test, South Cross Bayou.
upward and radially outward from well A3. The injected water is probably dispersed in the native formation water through numerous fractures of various widths in the zone. A possible way of adding chlorides to the dispersed water plume is Cooper's hypothesis of dispersion at coastal mar gins, the flow of saltwater into and counter to the flow of freshwater (Cooper and others, 1964). Whether or not Cooper's postulated saltwater flow occurred during the injection test is unknown, but it would be appropriate to tentatively presume that it did.
Water-Level and Pressure Buildup
A comparison of water-level buildup in wells B2 and B5 with changes in density of water from wells B2, B3, and B5 during the southwest St. Petersburg 91.1-day injection test is shown in figure 31. Well B2 is open to the lower part of the injection zone, and during the test den sity changes did not occur in the water from this well. Well B3 is open to the top of the injection zone, and during the test density changes ranged from 1.018 to 1.006 g/mL at 20°C. Well B5 is open to zone A, 325 feet
above the top of the injection zone. Density changes did not occur in this well. Wells B2, B3, and B5 are all 733 feet distant from test well A3.
Water-level buildup in well B5 can be considered to be related to two interacting driving forces that cause flow to occur in and above the injection zone. One driving force is caused by the placement of water through the test well into the injection zone; the other driving force is caused by buoyant lift acting on the dispersed injected water because it displaces and is surrounded by water of a different density. The pressure effects of buoyant lift are illustrated in figure 31, particularly for the period from 28 days to the end of the injection test. Water-level buildup in well B5 is apparently related to density changes in well B3. This suggests that buoyant lift acting on water in the injection zone causes pressure to increase above the dis persed injection water.
At the end of the aquifer test discussed above, the ratio of drawdown to discharge at well B2 was 1.2 X 10~ 4 ft/(gal/min). Near the end of the injection test, the ratio of buildup to injection rate at well B2 was also 1.2 X 10~4 ft/(gal/min), which indicates that build-
ALTITUDE IN FEET, BELOW NATIONAL GEODETIC VERTICAL DATUM OF 1929 o>j>roocoo>Jvro M
OOOOOOOOOc
i ill SOUTH CROSS BAYOU
AVERAGE INJECTION RATE: 4350 GALLONS PER MINUTE DURATION OF TEST: 3 DAYS Land surface
Floridan aquifer
r-i-i-r . i . i . i^ Surf cial aquifer ^,,^4^.1^
. , . . . .-. . '. . the Floridan aquifer .v.-X-g |
io.24lb/in2
' A4 ZONE A
1 0337 Ib/in2 ZONE B 0.24 Ib/in2
l?.l:2.!b/jri.2(est.^||^ o.28 Ib/in2lililii^SS£ii:^stimated Position ^xlllp^**' °' dispersed injection iip?' water $/ ZONE C i|.0 Ib/in2(est.) (injection zone) $TTest well A1 0.22 Ib/iri2
: : : :x: : : : : : : : : : : :: : : : : : : : : : : : : : : : : : : : : : : : : : :X;>X;xaijyb^m2,?®^ 9
i/in* i*B5-.'
B4
B3
B2 ~
' 5S5S5:
X'X'X-X'X'X-X- Lower confining bed ofX-XvX- X-XvXv!
x-x-xox:x-x-x-x:x-x-x-x-x-x-x-x-x-x-Xv-x-x-x-x-:I I
0 200 400 600 800 1000
RADIAL DISTANCE FROM TEST WELL, IN FEET
Figure 27. Calculated pressure changes in observation wells at end of injection test, South Cross Bayou.
Injection Tests 35

1400
Well A3 average injection rate for 91.1 days was 2830 gal lons per minute.
B. 9.1 days from start of test, the injection rate was changed from 3380 to 2770 gallons per minute.
Injected water (A3)
20 30 40 50 60 70 80
TIME SINCE INJECTION STARTED, IN DAYS
90 100
Figure 28. Rhodamine WT concentration in injected water and in water from wells B3 and B6 during injection test, southwest St. Petersburg.
up in B2 during injection was similar to what would have occurred if saltwater had been injected.
Calculated pressure buildups in observation wells at the southwest St. Petersburg site near the end of the 91.1-day injection test are shown in figure 32. The build ups reflect changes from initial conditions caused by the injection test. Water was injected prior to the test, so the site was not in its natural state when the test began. The magnitude of pressure buildup is very small, ranging from
36 Injection Tests in Pinellas County, Florida
0.13 to 2.13 lb/in2 . Of particular interest is that pressure buildup in zone B (wells B7 and B4) is larger than buildup in the injection zone (wells B6 and B3). These larger pressures are probably related to the buoyant lift of the injected water in the "short circuit" near test well A3 and the increased radial flow in zone B caused by more water flowing through the "short circuit" into the zone during injection. However, the volume of water flowing in zone B during the injection test probably was small. Injected

ALTITUDE, IN FEET, ABOVE AND BELOW NATIONAL GEODETIC VERTICAL DATUM OF 1929
J)-^NJOOOO)^N3 is. DO OOOOOO C DO OOOOOO OC
-
SOUTHWEST ST. PETERSBURG CHLORIDE CONCENTRATION (mg/L) IN WATER FROM
180 WELL AT END OF 91 DAY INJECTION TEST20,000 CHLORIDE CONCENTRATION (mg/L) IN FORMATION
WATER FROM WELL
Floridan aquifer
1
^r-;-vSurficial aquifer
Upper confining bed ' ' ;
88 ZONE A 4000 2500 3700 2200
I&B? : : : : : : : : : : : : : : : : : : : : : 13,000^13406""^ ZONE B *-:i6,ooov:-:- 1-:-:-:-:-;-:-;-.-;-:-;-:-;-:-:-:-;-:-;-.-.
\B6 : : : : A^m^M&^mm:'^^
ii 19,000 liliiiiiiili|lilll.i?rpooj|p :̂^^:!Bp'-l£!*:iS~istfrnated position of
IJ dispersed injection water 1 180 Average of injected water -20,000 ZONE C ZOOM Test well A3 (Injection zone) 20 000
81 ZONE D
B5
B4-.'
B3|| S-SiSi
B2 1
-1
Land Surface
-
wiilliSliiS
20,00020,000
122,000 21,000
X'X>v>*'v>°-°'''°"''"vXvXvXvX-XvXvX-f
.-.-. . bed of the .-. . . . . . . . . . . . . . . . . . . .
1 10 200 400 600 800
RADIAL DISTANCE FROM TEST WELL, IN FEET
1000
Figure 29. Chloride concentration in water from ob servation wells at end of injection test, southwest St. Petersburg.
water was not detected in well B4, 733 feet distant from well A3.
Pressure buildup calculations in figure 31 had to account for density changes in water from all wells. At the end of the injection test, density of water in the obser vation wells differed from density at the start of the test. These density differences occurred because of water- temperature changes and compositional changes caused by pumping for water-quality samples. Water from all wells changed temperature. Water from wells B3, B6, and B7 showed changes in chemical composition (Hickey and Spechler, 1979). Pressure buildup, accounting for density changes in each well, was calculated in the following manner:
dp = (l ePe(T)g - l bpb(T)g]/\44
where dp = pressure buildup (pounds persquare inch),
l e = length of fluid column from base of casing to water surface at the end of test (feet),
l b = length of background fluid column from base of casing to esti mated background water sur face (feet),
pe(T) = density of water at temperature ( T) in casing at the end of test (slugs per cubic foot),
pb(T) = density of background water at temperature (T) in casing at start of test (slugs per cubic foot),
g = acceleration of gravity (feet persquare second).
Length of the fluid column at the end of the test was computed using the observed water levels. Length of the background fluid column was computed using the back ground water levels estimated from the above-mentioned linear regression methods. If the density of water in the wells had remained constant during the test, the above equation would simplify to the equation used for the South Cross Bayou test.
At the end of the test, the rate and direction of vertical movement across the semiconfining bed be tween zones A and B was the sum of the background and the injection-caused vertical velocity fields. By assuming steady flow with total displacement and constant density of water in the semiconfining bed, the vertical velocity in the bed can be computed using the pore velocity equation discussed above. In the vicinity of wells B7 and B8, choos ing dPb /dz = -63.33 lb/ft3 [calculated from data in Hickey and Spechler (1979)], dPi/dz = -1.57 lb/ft3 (calculated from data in figure 32), Kz = 0.1 to 1 ft/d, Ps = 1.971 slugs/ft3 at 26°C, 6 = 0.3, and g = 32.129 ft/s2 , the estimated background-caused downward verti cal velocity (vz6 ) ranges from -0.0003 to -0.00003 ft/d, and the injection-caused upward vertical velocity (vz( ) ranges from 0.08 to 0.008 ft/d. Again, as at South Cross Bayou, the driving force caused by injection is much larger than the driving force caused by background condi tions near the injection well.
In the vicinity of wells B4 and B5, choosing dPi/dz = -0.38 lb/ft3 (calculated from data in figure 32) and keeping the other hydraulic parameters the same, injection-caused upward vertical velocity (vz( ) ranges from 0.02 to 0.002 ft/d. Thus, the impact of injection is dominant within a radial distance of 733 feet from the test well. Also, velocity is reduced by a factor of at least four across the semiconfining bed (between zones A and B) over the distance between wells B7 and B4.
Further examination of the calculated pressure buildups in figure 32 indicates that the buildup pressure gradients are directed downward between zones B and C (injection zone). Thus, with the exception of the small quantity of water moving in the "short circuit" near test well A3, the dispersed injected water within the injection
Injection Tests 37

zone at the end of the test was not moving upward across the overlying semiconfining bed.
As mentioned above, pressure buildup in the obser vation wells was relatively small during the test; however, this was not the case for the wellhead pressure buildup in injection well A3. Wellhead pressure buildup in A3 near the end of the test reached a maximum of about 48 lb/in2 (Hickey and Spechler, 1979). Considering only the dis placement of saltwater in the casing by the injected water, casing and exit losses, and formation buildup, wellhead pressure should not have exceeded about 10 lb/in2 . The observed excess pressure of about 38 lb/in2 is attributed to well plugging. A preliminary interpretation would sug gest that suspended solids deposited on the face of the well bore were the principal cause. During the test, clumps of algae were observed in the injected water. The
effluent from the wastewater treatment plant was filtered but was subsequently placed in a pond prior to injection. Most of the algae came from the pond. Another possible cause of plugging, suggested by the city of St. Peters burg's consultants (city of St. Petersburg, oral commun., 1979), is air entrapment in the pores adjacent to the well bore.
SUMMARY
Hydrogeologic and injection-test data were studied to determine conditions prevailing at test injection sites in Pinellas County and the city of St. Petersburg. The injection sites are underlain by sedimentary rocks ranging in age from Pleistocene to Cretaceous. Limestone and
Q. 20,000ait 19,000
ccUl 0-
cc<2 15,000_i _j5 <
z
cczUloz o oUlo cc oI o
10,000
5000
A. Well A3 average injection rate for 91.1 days was 2830 gallons per minute.B. At 9.1 days from start of test the injection rate was changed from 3380 to 2770
gallons per minute.C. Chloride concentration of injected water averaged 180 milligrams per liter and
ranged from 35 to 340 milligrams per liter.D. Injected water was observed during test in wells B3, B6, and B7 (see figure 29).E. Initial chloride concentration in water from wells B3 and B6 shown below, was
affected by water injected prior to test during calibration of instrumentation used for continuous measurement of well head pressure and injection rates.
Chloride concentration of native formation water from wells B3 and B6
I9rB7
J6
A3Test well
85
B4
B3
B2
B11400
0 800 RADIAL DISTANCE FROM
TEST WELL IN FEET
B3
B6
10 20 30 40 50 60 70
TIME SINCE INJECTION STARTED, IN DAYS
80 90 100
Figure 30. Chloride concentration in water from wells B3 and B6 during injection test, southwest St. Petersburg.
38 Injection Tests in Pinellas County, Florida

en
Zo_<UJO
1.03
1.02
1.01
1.00
1.5
1.0
.5
0
1.5
1.0
.5
0 800 RADIAL DISTANCE FROM TEST WELL, IN FEET
O O O -o-e-Injection rate
3380 gal/min
B2
o o
-0- o o
tochanged from
2770 gal/min.
10-3 10-2 10-1 1TIME SINCE INJECTION STARTED, IN DAYS
10 100
Figure 31. Water-level buildup in wells B2 and B5 and changes in density of water from wells B2, B3, and B5 during injection test, southwest St. Petersburg.
dolomite predominate in the section and range in thick ness from about 10,000 to 12,000 feet. Lower Eocene rocks were penetrated to a maximum depth of 3,504 feet and had relatively low water yields. The most productive part of the section was in upper middle Eocene rocks within the Floridan aquifer.
The Floridan aquifer in Pinellas County is com posed of rocks ranging from lower Miocene to middle Eocene and comprises the following formations (from youngest to oldest): Tampa Limestone, Suwannee Lime stone, Ocala Limestone, and Avon Park Limestone. At the injection sites, the Floridan aquifer was subdivided into four permeable zones and three semiconfining beds.
The test injection zone is within the Avon Park Limestone, the most productive of the identified perme able zones with a transmissivity of about 1,000,000 ft2/d. The top of the injection zone ranges from about 400 feet below the National Geodetic Vertical Datum of 1929 in north Pinellas County to about 900 feet below the datum in south Pinellas County. Average thickness of the zone is about 330 feet. Water-producing intervals within the upper and lower parts of this zone are intensely shattered and are interconnected vertically by fractures. Ground- water flow of saltwater toward the east-southeast proba bly occurs within the injection zone under preinjection conditions.
Two semiconfining beds within parts of the Su wannee Limestone and Ocala Limestone are above the
injection zone and have vertical hydraulic conductivities estimated to range from about 0.1 to 1 ft/d where these beds do not contain clay. Closed fractures occur in the semiconfining beds but probably have little influence on the permeability of the beds. Average thickness of these beds above the injection zone is about 330 feet.
Overlying the Floridan aquifer are the clays, marls, and limestone of the Hawthorn Formation that comprise the upper confining bed of the aquifer. Underlying the aquifer are the limestones and dolomites with inter- granular gypsum of the Lake City Limestone that com prise the lower confining bed of the aquifer.
Limited fresh ground-water supplies exist in the Floridan aquifer within the Pinellas peninsula. Fresh ground water, where it is found, typically occurs as a thin layer within the uppermost permeable zone. Most water in the aquifer is saline with chloride concentrations rang ing from 13,000 to 21,000 mg/L. At all test sites, chloride concentration in the injection zone ranged from 19,000 to 20,000 mg/L.
Injection tests ranging in duration from 3 to 91.1 days and ranging in rate from 650 to 4,350 gal/min were run at three different sites: McKay Creek, South Cross Bayou, and southwest St. Petersburg. Pressure buildup occurred in permeable zones above and below the injec tion zone during these tests. Calculated pressure buildup in observation wells close to and at some distance from the test wells was typically less than 1 lb/in2 . The largest
Summary 39

IO O O
I^ O O
D O) O O
IO OO O O
O O O
- 1200
-t^ O O
1600
1 1 1
SOUTHWEST ST. PETERSBURGAVERAGE INJECTION RATE: 2830 GALLONS PER MINUTE
DURATION OF TEST: 91.1 DAYS Land surface
ffi
CJ 1C
1 1 Floridar
-
.. .-.
Surficial aquifer
,-.-. . Upper confining bed of .-. . . . ' ' ' ' the Floridan aquifer -X-.-X- IB9
Sig Ib/in2 ZONE A B5
^ipi|^|b/ i n 1 ZONE B
»:x:
B6 * 0.75
3.9 Ib/ Test w
b/in
d n2(e IIA3
Me
sp st
ated position of r ed injection water
ZONE C njection zone)
B1 ZONE D
0.44
0.84
:0.63
0.1
Ib/in2
Ib/in^i
b/in2
;.;.;.;.;.;. .;.; ;~v
0.13 Ib/in2
X'XvX-XvXLower confining bed of X-X'X-X'X-X-X'X : : : : : : : : : : : : tne Floridan aquifer -x-X'X'X'X-X'X'X
1 1 10 200 400 600 800
RADIAL DISTANCE FROM TEST WELL, IN FEET
1000
Figure 32. Calculated pressure changes in observation wells at end of injection test, southwest St. Petersburg.
observed buildup was 2.1 lb/in2 in an observation well at the southwest St. Petersburg site. Volumes of injected water were sufficient to totally displace all formation water between the top of zone A and the base of zone C in the vicinity of the test wells for radial distances ranging from about 50 to 240 feet. Water-quality sampling during these tests supports the presence of semiconfining beds above the injection zone. However, injection and for mation water probably will slowly move through these beds, and long-term injection tests will be needed to deter mine their effectiveness to retard vertical movement. Water-quality sampling indicated that the injected water was well mixed with formation water, which, in part, is a direct consequence of the fractured nature of the injection zone.
REFERENCES
Applin, P. L., 1951, Preliminary report on buried pre- Mesozoic rocks in Florida and adjacent states: U.S. Geological Survey Circular 91, 28 p.
40 Injection Tests in Pinellas County, Florida
Applin, P. L., and Applin, E. R., 1944, Regional sub surface stratigraphy and structure of Florida and southern Georgia: America Association of Petro leum Geologists Bulletin, v. 28, no. 12, p. 1673- 1753.
Billings, M. P., 1955, Structural geology: New York, Prentice-Hall, p. 428-429.
Black, Crow and Eidsness, Inc., 1974, Results of drilling and testing of the test storm water injection well for the city of St. Petersburg, Florida: Consultants' re port in files of the city of St. Petersburg.
1978, Drilling and testing of the monitoring and injection wells at the Southwest Wastewater Treatment Plant for the city of St. Petersburg, Flor ida: Consultants' report in files of the city of St. Petersburg.
Buono, A., and Rutledge, A. T., 1979, Configuration of the top of the Floridan aquifer, Southwest Florida Water Management District: U.S. Geological Sur vey Water-Resources Investigations 78-34.
California Department of Water Resources, 1971, Sea water intrusion: aquitards in the coastal ground water basin of Oxnard Plain, Ventura County: State of California, Bulletin 63-4, 569 p.
Cherry, R. N., and Brown, D. P., 1974, Hydrogeologic aspects of a proposed sanitary landfill near Old Tam pa Bay, Florida: Florida Bureau of Geology Report of Investigation 68, 25 p.
Cooke, C. W., 1945, Geology of Florida: Florida Geolog ical Survey Bulletin 29, 339 p.
Cooper, H. H. Jr., Kohout, F. A., Henry, H. R., and Glover, R. E., 1964, Sea water in coastal aquifers: U.S. Geological Survey Water Supply Paper 1613-C, 84 p.
Geraghty and Miller, Inc., 1976, Management of the water resources of the Pinellas-Anclote and north west Hillsborough basins, west-central Florida: Report to Southwest Florida Water Management District, v. 1, p. C.23; consultants' report in files of the Southwest Florida Water Management District.
Hantush, M. S., 1964, Hydraulics of wells, in Yen Te Chow, ed., Advances in Hydroscience, v. 1: New York and London, Academic Press, p. 280-432.
Heath, R. C., and Smith, P. C., 1954, Ground-water resources of Pinellas County, Florida: Florida Geo logical Survey Report of Investigation 12, 139 p.
Hickey, J. J., 1977, Hydrogeologic data for the McKay Creek subsurface-injection test site, Pinellas County, Florida: U.S. Geological Survey Open-File Report 77-802, 94 p.
1979, Hydrogeologic data for the South Cross Bayou subsurface-injection test site, Pinellas County, Florida: U.S. Geological Survey Open-File Report 78-575, 87 p.

Hickey, J. J., and Barr, G. L., 1979, Hydrogeologic data for the Bear Creek subsurface-injection test site, St. Petersburg, Florida: U.S. Geological Survey Open- File Report 78-853, 53 p.
Hickey, J. J., and Spechler, R. M., 1979, Hydrologic data for the southwest St. Petersburg subsurface-injection test site, St. Petersburg, Florida: U.S. Geological Survey Open-File Report 78-852, 104 p.
Hubbert, M. K., 1969, The theory of ground-water mo tion and related papers: New York, Hafner Publish ing Co., 310 p.
Hutchinson, C. B., and Stewart, J. W., 1978, Geo- hydrologic evaluation of a landfill in a coastal area, St. Petersburg, Florida: U.S. Geological Survey Water-Resources Investigations 77-78, 40 p.
Kohout, F. A., 1965, A hypothesis concerning cyclic flow of salt water related to geothermal heating in the Floridan aquifer: Transactions of the New York Academy of Science, Ser. II, v. 28, no. 2, p. 249-271.
Leach, S. D., 1978, Source, use, and disposition of water in Florida, 1975: U.S. Geological Survey Water- Resources Investigations 78-17, 90 p.
Lohman, S. W., 1972, Ground-water hydraulics: U.S. Geological Survey Professional Paper 708, 70 p.
Lohman, S. W., and others, 1972, Definitions of selected ground-water terms revisions and conceptual re finements: U.S. Geological Survey Water-Supply Paper 1988, 21 p.
Mills, L. R., and Laughlin, C. P., 1976, Potentiometric surface of Floridan aquifer May 1975, and change of potentiometric surface 1969 to 1975, Southwest Florida Management District and adjacent areas: U.S. Geological Survey Water-Resources Investiga tions Open-File Report 76-80.
Parker, G. G., Ferguson, G. E., Love, S. K., and others, 1955, Water resources of southeastern Florida: U.S. Geological Survey Water-Supply Paper 1255, 965 p.
Puri, H. S., and Vernon, R. O., 1964, Summary of the geology of Florida and a guidebook to the classic exposures: Florida Geological Survey Special Publi cation 5, 312 p.
Robertson, A. F., and Mallory, J. J., 1977, A digital model of the Floridan aquifer, north of Tampa, Flor ida: U.S. Geological Survey Water-Resources Inves tigations 77-64, 29 p.
Rosenshein, J. S., and Hickey, J. J., 1977, Storage of treated sewage effluent and stormwater in a saline aquifer, Pinellas Peninsula, Florida: Ground Water, v. 15, no. 4, p. 289-293.
Sinclair, W. C., 1974, Hydrogeologic characteristics of the surficial aquifer in northwest Hillsborough County, Florida: Florida Bureau of Geology Information Cir cular 86, 98 p.
Stewart, H. G., Jr., 1966, Ground-water resources of Polk County, Florida: Florida Geological Survey Report of Investigation 44, 170 p.
Sutcliffe, Horace, Jr., 1975, Appraisal of the water re sources of Charlotte County, Florida: Florida Bu reau of Geology Report of Investigation 78, 53 p.
Thompson, R. B., ed., 1977, Florida Statistical Abstract 1977: Gainesville,UniversityPressesof Florida,597 p.
Vernon, R. O., 1951, Geology of Citrus and Levy Coun ties, Florida: Florida Geological Survey Bulletin 33, 256 p.
Wilson, W. E., 1977, Ground-water resources of DeSoto and Hardee counties, Florida: Florida Department of Natural Resources Report of Investigation 83, 102 p.
References 41

Conversion Factors
Factors for converting inch-pound units to SI (metric) units are shown below:
Multiply inch-pound
inch (in) foot (ft)
mile (mi)
gallon (gal)
gallon per minute (gal/min)
foot squared per day (ft2/d) gallon per day per foot [(gal/d)/ft]
pound per square inch (lb/in2 )
foot per day (ft/d)
gallon per minute per foot of drawdown
By
Length25.4 0.3048 1.609
Volume3.785 3.785 X 10" 3
Flow0.6309
Transmissivity 0.0929 0.0124
Pressure6.8948 X 103
Hydraulic Conductivity0.3048
Specific Capacity0.207
To obtain SI (metric) unit
millimeter (mm) meter (m) kilometer (km)
liter (L) cubic meter (m 3 )
liter per second (L/s)
meter squared per day (m2/d) meter squared per day (m 2/d)
Newton per square meter (N/m2)
meter per day (m/d)
liter per second per meter [(L/s)/m][(gal/min)/ft]
micromhos (/ttmho)
slug per cubic foot (slug/ft3 )
Specific Conductance 1.000
Density 0.515
microsiemens (/tts )
gram per milliliter (g/mL)
National Geodetic Vertical Datum of 1929 (NGVD of 1929). A geodetic datum derived from a general adjustment of the first-order level nets of both the United States and Canada, formerly called "mean sea level." The datum was derived from the average sea level during a period of many years at 26 tide stations along the Atlantic, Gulf of Mexico, and Pacific coasts.
42 Injection Tests in Pinellas County, Florida £ U.S. GOVERNMENT PRINTING OFFICE: 1982-361-614/7