Embed Size (px)
Citation preview
'UNCLASSIFIEDSAD-A261 592 Fom APProved
S11111AGIIIIMIHI E m NO. 07001"Is. REPORT SECURITY C 1(" IN 1 . RESTRICTIVE MARKINGS
Unclassif ied ......
2a. SECURITY CLASSIFICATIO t U; DISTRIBUTION /AVAILABILITY OF REPORT
20. DECLASSIFICATIONIOOW IN.o"NLE
4. PERFORMING ORGANIZATIa -"ORT NU (S) S. MONITORING ORGANIZATION REPORT NUMBER(S)
92-6IVAs g , - ý 7_1 1
6&, NAME OF PERFORMING ORGANIZATION 6b. OFFICE SYMBOL 7a. NAME OF MONITORING OGANIZATION
New York University (if opplicable) Air Force Office of Scientific Research
6c. ADDRESS (Ci9y; State, and ZIP Code) 7b. ADDRESS (City, Stot, and ZIP Code)Departments of Physics and Psychology4104 Washington Place Boiling AFB, DC 20332-6558New York. NY 10003
Ba. NAME OF FUNDING/SPONSORING Sb. OFFICE SYMBOL 9. PROCUREMENT INSTRUMENT IDENTIFICATION NUMBERORGANIZATION (If applicable)AFOSR NL AFOSR-90-0221
8c. ADDRESS (City, State, and ZIP Code) 10. SOURCE OF FUNDING NUMBERSBuilding 410 - PROGRAM PROJECT TASK IWORK UNITBolling AFB, DC 20332-6558 ELEMENT NO. NO. NO ACCESSION NO.
___ __ __ ___ __ __ _ 0 ~ I i ~ I I11. TITLE (Include Security Cassification)
Duration of Alpha Suppression Increases with Angle in a Mental Rotation Task
12. PERSONAL AUTHOR(S)C.M. Michel, L. aufan, and S.J. Williamson04303
13a. TYPE OF REPORT 113b. TIME COVERED 114. DATE OF REPORT (Yea 93Ma n c4p ,-'e QL' fy I FROM 920201 l To 930214 930201
" o16. SUPPLEMENTARY NOTATION fI
17. COSATI CODES 1B. SUBJECT TERMS (Continue on reverse if necetsary and dentfy by block number)FIELD GROUP I SUB-GROUP | Magnetic source imaging, mental imagery, mental rotation, cognitive
- information processing, magnetoencephalography, electroencephalogra-] phy
19. ABSTRACT (Continue on reverse if necessary and ideify by block number)
Magnetic and electric recordings of average power within the restricted alpha band (10-12 Hz) were made over theparietal and occipital -areas of the human scalp while subjects were engaged in the mental imagery task of comparingan object with one previously seen but rotated and perhaps also mirror reflected. Alpha power was found to besuppressed while the subjects were engaged in the comparison, and the duration of suppression increased with theminimum rotation angle to achieve a match. This is additional evidence that visual cortex is engaged in the process ofmental imagery. Moreover, for large rotation angles, where the task is markedly more difficult, a shift in the spatialpattern of suppression indicates that the left parietal area of the cortex becomes involved.
20. DISTRIBUTION /AVAILABILITY OF ABSTRACT 121. ABSTRACT SECURITY CLASSIFICATIONr UNCLASSIFIEDAJNLIMITED UISAME AS RPT. 0 DTIC USERS I Unclassified
22a. NAME 01 RESPONSIBLE INDIVIDUAL 122b. TELEPHONE (include Area Code) 22c. OFFICE SYMBOLDr. John F. Tanzney I 202/767-5021 I NL
DD Form 1473, JUN 86 Previous edtions are obsolete. SECURITY CLASSIFICATION OF THIS PAGE
93 3 079 r Page 1 UNCLAS S IFI ED
Michel, Kaufinan, Williamsou: Alpha Suppression 11/19/92 page 2 1ABSTRACT
Electric and magnetic recordings of average power within the nigh alpha band (10-12
Hz) were made over the parietal and occipital areas of the scalp while subjects were en-
gaged in the mental imagery task of Cooper and Shepard. The subject had to determine
whether an abstract probe figure was identical to a memory figure presented earlier at a
different orientation, or whether it was the mirror image of the memory figure. Alpha power
was found to be suppressed while the subjects were engaged in the comparison, and the
duration of suppression increased with the minimum rotation angle to achieve a match. This
is additional evidence that visual cortex is engaged in the process of mental imagery. More-
over, for large angles, where the task is markedly more difficult, a shift in the spatial pattern
of suppression indicates that the left parietal area becomes involved.
INTRODUCTION
The question of whether the visual system is involved in mental imagery has long been
debated (Golla et al., 1943; Shepard & Meltzer, 1971; Shepard & Cooper, 1982; Kosslyn,
1983; Farah, 1984; Anderson, 1985; Farah, 1988; Farah et al., 1988). Shepard and his
colleagues (Shepard & Metzler, 1971; Cooper & Shepard, 1973; Finke & Shepard, 1986)
concluded from extensive behavioral experiments based on mental rotation tasks that mental
imagery involves the same neural circuits as those employed in -processing real visual im-
ages. For instance, the interstimulus interval needed to produce optimum stroboscopic rota-
tion of a form increases at the same rate with increasing increment of angle as does the ,i" ,CRAMl
time to mentally rotate the same form to achieve a match. TAB""o ICed
This correspondence suggests that the machinery of the visual system is involved in im- c~d :t
agery tasks. However, alternative theories (e.g., Pylyshyn. 1981) argue that the same in-
crease in time required for mental rotation with greater angles could be accounted for if .butio .I
Avmi rabeltdty Chgdamore time is required to test hypotheses in working memory about abstract features of
S....... ..; I is Special

Mchel, Kaufman, Williamson: Alpha Supprssion 1I119/92 page 3
these same visual objects. One way toward resolving such issues is to establish directly
whether the visual areas of the brain are actually active when subjects mentally rotate
imagined objects. In this paper we test the hypothesis that the electrophysiological activity
of visual areas of the brain is altered during mental rotation, and that behavioral indices of
mental rotation time coincide with these changes in cortical activity.
There is some precedent for this. For example, Farah and her colleagues employed the
event-related potential (ERP) to determine whether visual areas are differentially affected by
the formation of mental images. Farah (1988) and Farah et al. 41988) recorded the ERPs to
visual stimuli that were or were not preceded by an acoustic cue. They demonstrated that
mentally imaging a stimulus before it was presented increased detection accuracy and en-
hanced the amplitude of the first negative ERP component (with 170 ms latency) over tem-
poro-occipital recording sites. This effect on early modality-specific stages of information
processing led Farah et al. (1988) to conclude that mental imagery is accompanied by
changes in the visual system, and these are correlated with the content of the image.
While these results suggest that visual cortex becomes differentially active if a person
forms mental images of objects about to be seen, similar enhancements of the same com-
ponents of the ERP accompany selectively attending to objects in visual space (Mangun &
Hillyard, 1988). Recently, Peronnet and Farah (1989) recorded enhancement in the ampli-
tudes of broad, late components (400-1700 ms) of the ERP during a mental rotation task.
These changes were detected with midline electrodes and were proportional to the angle of
mental rotation needed to achieve a match. However, these results fail to separate more
generalized attentional effects from processes that are specific to mental imagery. The drain
on attentional resources may also affect measures of brain activity. Thus, tasks requiring
more effort may produce greater changes in response amplitude or more enduring changes
in level of brain activity than do easier tasks. In a recently described experiment by Ruchkin
et al. (1991) event related slow wave potentials were studied for visual stimuli with easy
and with difficult rotation angles. They found that slow wave negativity at centro- parietal

Mkhel, Kaufinaa, Willianson: Alpha Suppftsason 11119/92 pape 4
sites increased with increasing rotation difficulty, which might suggest the involvement of
visual cortical areas in mental rotation. However, even here the durations (latencies) of these
slow waves do not correspond to the times required for mental rotation, although enhanced
amplitude with increased rotation difficulty was observed. As in Farah's experiments, these
differences in amplitude of slow waves do not constitute direct evidence that the time
course of dctivity in visual or non-visual areas of cortex is related to mental imagery, as
reflected in the mental rotation task. No hypotheses are presented to link time required to
perform mental rotation to a change in amplitude of an ERP component.
Roland & Friburg (1985) observed an increase in regional cerebral blood flow (rCBF) in
the occipital regions when subjects imagined walking in their own neighborhoods. Different
changes in blood flow were noted when the same subjects performed a mental arithmetic
task. Single photon emission (SPECT) studies of blood flow during other kinds of imagery
tasks revealed changes in blood flow in occipital areas, but also in parietal and frontal areas
(Goldenberg et al., 1989). Analysis of the mean model dipole generator sources of the Delta-
Theta and Alpha EEG frequency bands revealed more posterior locations of the dipoles that
were associated with spontaneous thoughts of "visual imagery* type than those that were
associated with thoughts of "abstract" type (Lehmann et al., 1991). Although these results
indicate spatially selective brain activity associated with mental imagery, they cannot be re-
lated to the actual time required to perform the imagery task. Similarly, in virtually all other
studies demonstrating relations between changes in brain activity and other mental imagery
tasks, none have shown a connection between time to perform the task and the duration of
change in level of brain activity.
There is increasing evidence that the amplitude of spontaneous cortical rhythms are
modulated over specific anatomical areas of the scalp when a subject is engaged in sensory,
motor and cognitive tasks. For instance, activity in the alpha frequency range (8-12 Hz) is
suppressed over posterior areas after visual stimulation (Berger, 1930; Kaufman & Locker,
1970; Pfurtscheller, 1986) and before and after eye movements (Lehmann, 1971). Beta

Michel, Kulfman, Williamson: Alpha Suppres•ion 11/19/92 pugt 5 [rhythm (18-30 Kz) is suppressed in central regions in association with hand movements
(Jasper & Andrews, 1938; Pfurtscheller, 1981), and central mu rhythm (7-13 Hz) is bilateral
symmetrically suppressed during planning and execution of unilateral movements
(Pfurtscheller & Aranibar, 1979). Extensive studies carried out by Pfurtscheter and collabo-
rators revealed reduction in alpha band power ('desynchronization" in their terminology)
whose strength and spatial distribution was related to specific sensory-motor (Pfurtscheller
& Aranibar, 1979) and cognitive tasks tPfurtscheller & K'.mesch, 1991).
Kaufman et al. (1989; 1990) measured me change in level of alpha-band activity in the
magnetoencephalogram (MEG) over different scalp regions during performance of imagery
and of verbal tasks. The durations of these changes over the visual areas were commensu-
rate with behavioral indices of task completion. Similar changes were noted for verbal tasks,
but not over the visual areas.
Besides spatially selective alpha suppression, Kaufman et al. (1989, 1990) demonstrated
with magnetoencephalographic recordings that the duration of alpha suppression increases
in a systematic way that is closely related to some cognitive functions. In a task where
subjects were engaged in comparing the image of an abstract figure with a memory set of
three figures previously seen, the duration of parieto-occipital alpha suppression was comr ,-
rable to the reaction time indicating whether there was'a match or not. Moreover, the sup-
pression of alpha power was.enhanced over areas along the midline of the occipital scalp.
This corresponds to neuronal sources lying within the visual cortex. Suppression was also
observed in the same time window for what may be a particularly strong source of alpha
rhythm - the parieto-occipital sulcus (Williamson & Kaufman, 1989; Williamson et al.,
1989), the posterior bank of which is a visual area. Together with the temporal window
within which suppression is observed, this provides strnng evidence that the visual cortex
participates in the process of mental imagery. However, the case would be more compelling
if the duration of a cognitive task were manipulated by increasing the task difficulty, and as
a result a strong positive covariation were found between reaction time to task completion
Michel, Kaufinan, Williamson: Alpha Suppression 11/19/92 pase 6 1and the alpha suppression duration.
This was the case for scanning short-term memory for a previously heard musical tone
(Kaufman et al., 1992). A Sternberg task was carried out in which subjects determined
whether a tone matched one just heard in a memory set. There was a significant positive
correlation between the duration of alpha suppression measured over the right temporal area
and the number of tones in the memory set. Moreover, the spatial pattern of suppression
over the scalp correlated with the pattern for the magnetic NI 00 response of primary audi-
tory cortex. This indicates that the source of the suppressed rhythm includes the primary
auditory cortex. Direct evidence for spontaneous rhythmic activity at about 10 Hz in audi-
tory cortex was recently reported by Tiihonen et al. (1991) from magnetic source images.
Thus there is converging evidence that spontaneous rhythms are produced by many cortical
areas, and when a particular area becomes involved in a sensory or cognitive process the
corresponding rhythm is suppressed. This provides opportunities for a broad range of stud-
ies of cognitive functions, with the advantage that the signal being monitored is consider-
ably stronger than that of event-related fields or potentials.
Behavioral studies show that the rate of increase in time to complete mental rotation is
clearly and strongly related to the angle through which the form must be rotated to obtain a
match (Cooper & Shepard, 1973). In view of the earlier findings that the duration of alpha
suppression is commensurate with performance of other imagery tasks, and that these ef-
fects are specific to particular cortical regions, motivates this study. The present study was
carried out to test a central issue that was unanswered by previous studies: whether the
temporal duration of alpha suppression over the visual cortex correlates with the behavioral
measure of reaction time as the time required to complete a mental rotation task is made to
vary. To accomplish this, we recorded multichannel magnetic (MEG) and electric (EEG) sig-
nals over the posterior scalp while subjects performed the mental rotation paradigm intro-
duced by Cooper and Shepard (1973). In this task subjects are asked to discriminate normal
from mirror reflected versions of alphanumeric characters when they are tilted at different

Micbl, Kauftnan, Widliamson: Alpha Suppression 11/19/92 pap 7
angles with respect to the upright position. This well controlled and replicated task is known
to produce clear correlations between the angle of tilt and reaction time, suggesting different
durations of the neuronal processing time that presumably corresponds to the time required
to perform the mental rotation task.
RESULTS
Reaction Time and Suppression Duration
The visual inspection of all single traces indicated that alpha rhythm was suppressed
after the memory as well as after the target figure in all 9 EEG channels and all 30 MEG
channels in all subjects. The interval between the memory and target figure was long
enough to reestablish alpha activity before the onset of the target stimulus. The computed
suppression duration had to be corrected on the basis of the inspection of the individual
traces in 19.5% of all cases. In these cases, the automatic duration computation failed
mainly because of low alpha amplitude at the time of stimulus onset and thus there was a
corresponding small decrease of alpha after the stimulus. There was no significant difference
across the different MEG or EEG sensors. Statistical comparison of the suppression duration
of the different sensors by repeated measure ANOVA's failed to show any significant differ-
ences. For further analysis the suppression duration values were averaged over all sensors,
separately for each subject, each angle and each condition.
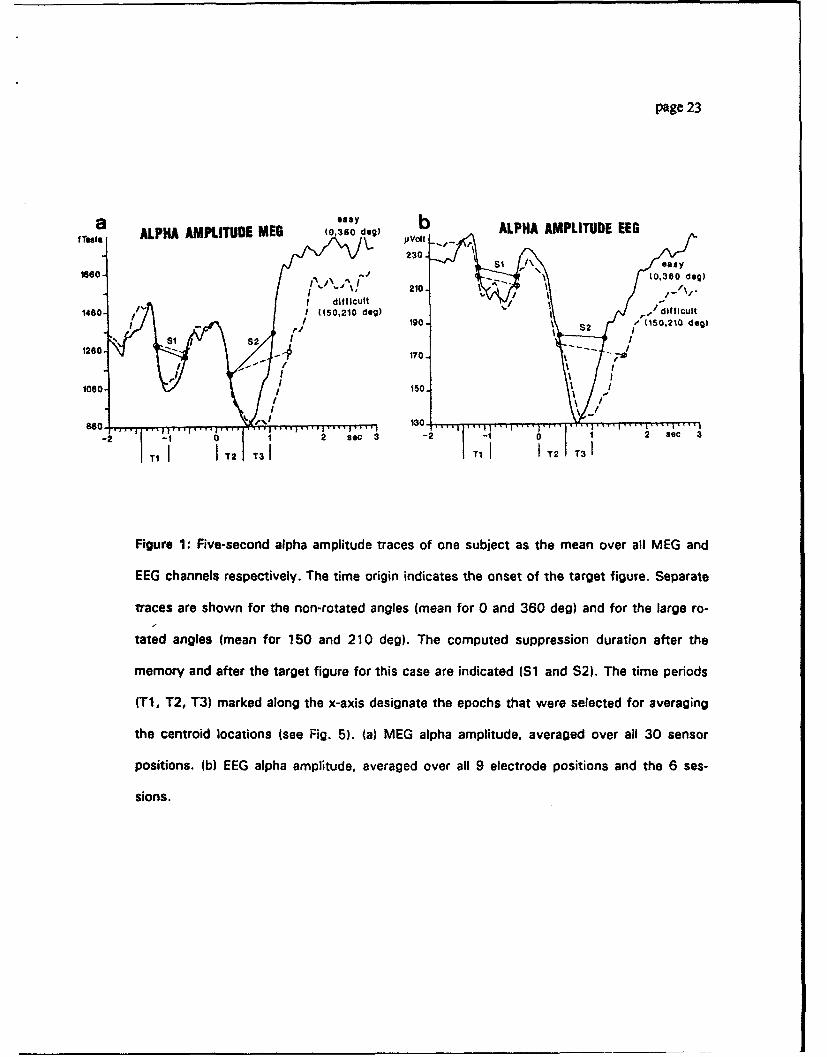
Fig. l a (MEG) and Fig. lb (EEG) show representative alpha amplitude traces of one
subject, separately for non-rotated (mean of 0 and 360 deg) and for markedly rotated angles
(mean of 150 and 210 deg). The traces are means over all 30 MEG and all 9 EEG sensors
respectively. They illustrate that both EEG and MEG show stronger and prolonged suppres-
sion of alpha amplitude during the time a subject was identifying the target figure (S2) as
compared to the time aiter the presentation of the memory figure (Si). Moreover there is
evidence for longer suppression when subjects match markedly rotated forms to non-rotated
Michl, Kaufinmn, Williamson: Alpha Suppresion 11/19192 page 8 [
targets.
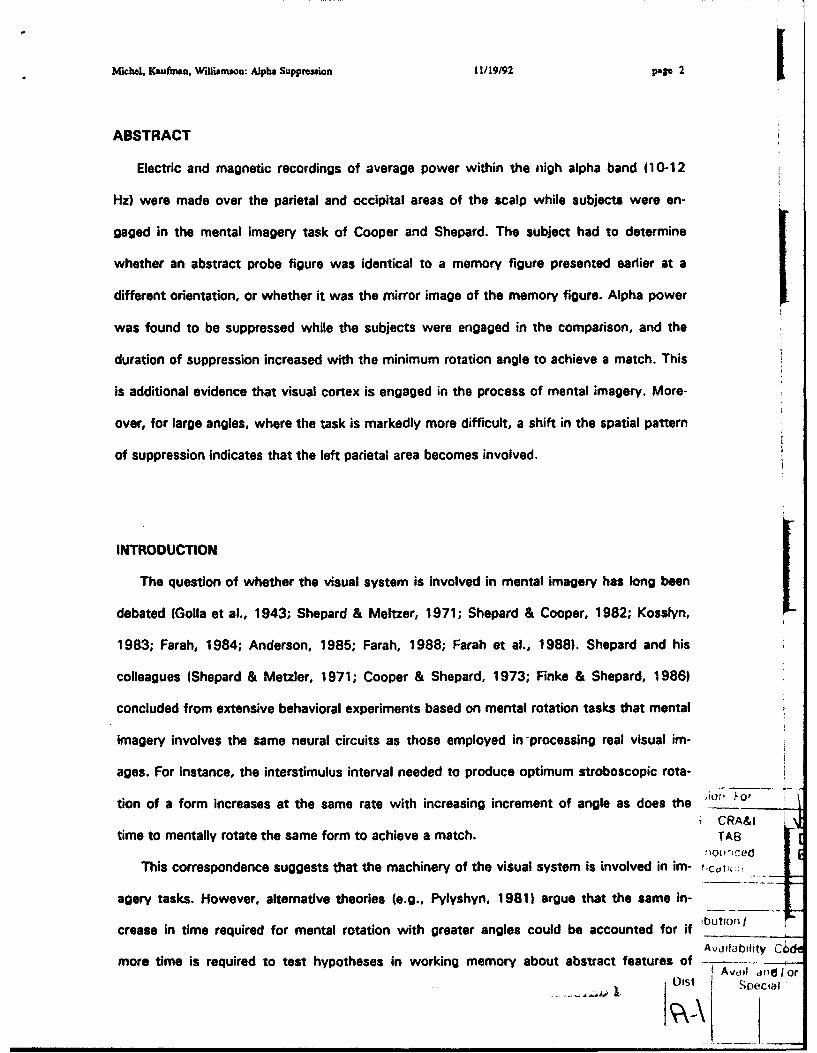
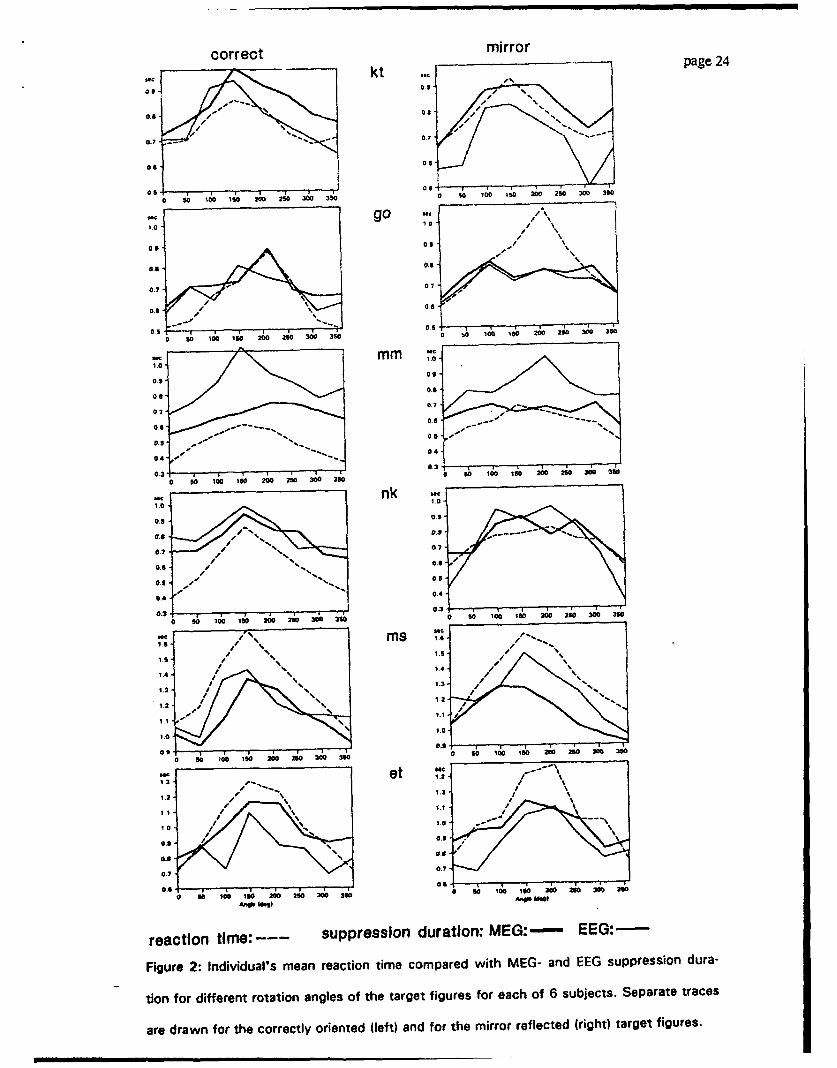
Fig. 2 shows the individual traces of reaction time, EEG-, and MEG-suppression duration
as a function of the angle of the target figure, separately for the correct and for the mirror
reflected targets. Although individual differences were observed, the general trend for in-
verted U-shaped curves was evident, i.e. reaction time as well as suppression duration in-
creased with increasing rotation angle. In all traces, non-rotated target stimuli (0 and 360
deg) produced faster reaction times and shorter suppression durations than markedly rotated
stimuli. There was no consistent difference between reaction time and the duration of EEG-
or MEG alpha suppression. The mean reaction and suppression times were different be-
tween the subjects but it did not affect the differences between the rotation angles.
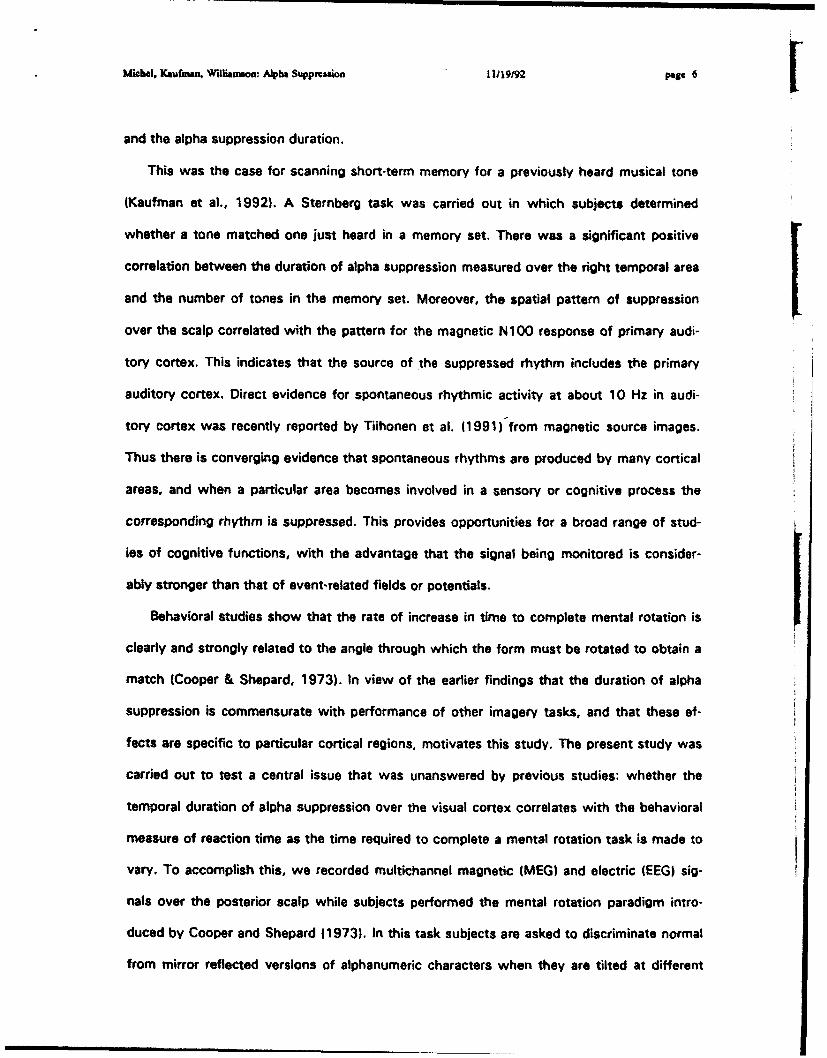
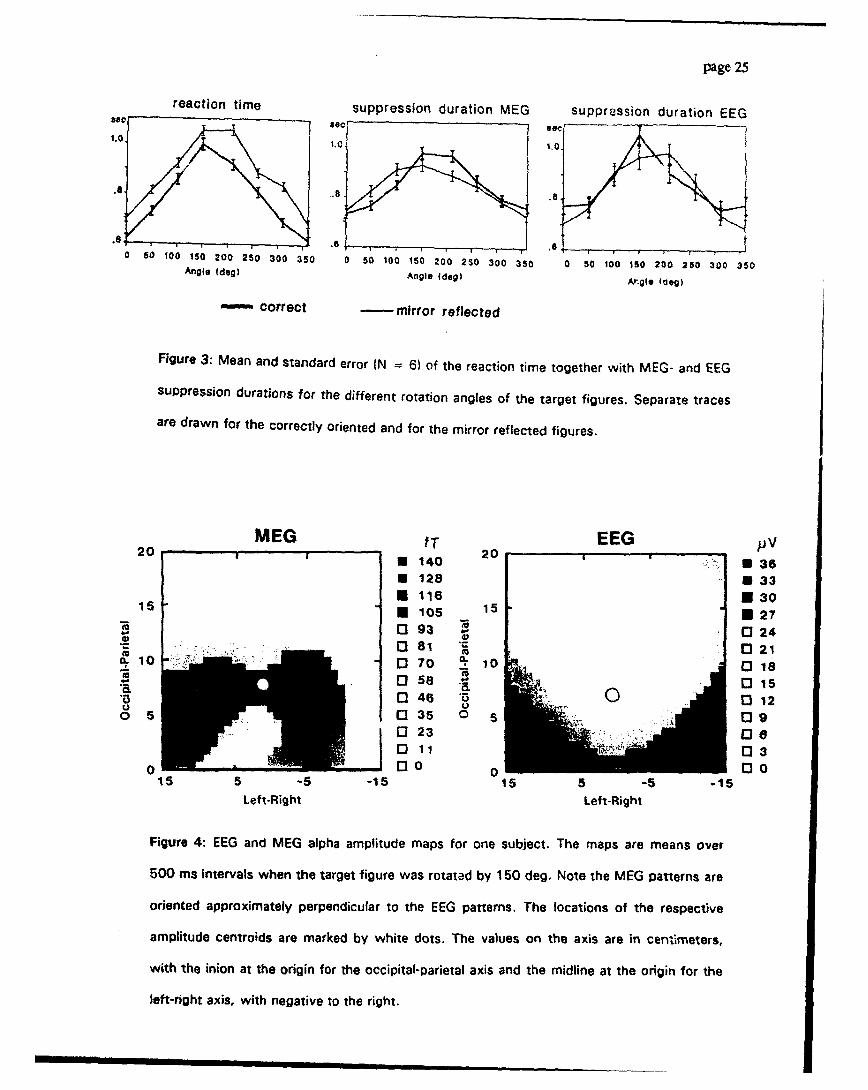
Fig. 3 shows the mean and standard error of the reaction time and the suppression du-
rations over the six subjects as a function of the rotation angle. These data were statistically
tested for consistency over subjects by repeated measure ANOVA's with the factors
"condition" (2 levels: correct and mirror) and "angles" (8 levels). It resulted in highly signifi-
cant main effects of the factor wangle" [reaction time: F47,35) = 22.0, p < .001; MEG sup-
pression duration: F(7,35) = 15.2, p < .001; EEG suppression duration: Ff7,35) = 20.43,
p<.0011. The main effect for the factor *condition" was significant for the reaction time
only [F(1,5) - 11.1, p - .021 while no differences between correct and mirror reflected
targets were found for the EEG and MEG suppression duration [MEG: F(1,5) = 0.9, EEG:
F01,5) = 0.61. Clear statistical proof for the inverted U-shaped profiles were revealed by
polynomial contrast analysis, where the quadratic trend was highly significant for all three
variables [Reaction time: F01,5) = 29.8, p = .003; MEG suppression duration: F(1,5)
51.3, p < .001; EEG suppression duration: F(1,5) = 63.'), p < .0011.
Spatial Features
Fig. 4 illustrates on EEG and MEG maps of one subject how he analyzed field descriptor
(center of gravity or centroid) is related to the field pattern. It also illustrates the main topo-
Michel, KaIufman, Widliamson: Alpha Suppression 11/19/92 pase 9 [
graphical distribution of alpha activity over the parieto-occipital area: Power is maximal over
medial occipital sites for the EEG and over left and right lateral sites for the MEG. Across
subjects, the average locations of the centroids of the EEG and the MEG alpha amplitudes
did not differ significantly between the eight different rotation angles. That is, unlike the re-
action time or suppression duration data, there were no significant ANOVA or polynomial
contrast effects for field amplitudes. However, significant differences were found in the
comparison of the centroid locations between the non-rotated (mean of 0 and 360 deg) and
large rotation angles (mean of 150 and 210 deg). The centroid locations of these two rota-
tion conditions are shown in Fig.5.
The analysis of the early suppression period after the target (T2, between 0 and 500 ms
as defined in Fig. 6) showed a more occipitally located centroid than after the memory fig-
ure. This shift was independent of the rotation angle of the target figure and was evident in
the EEG and in the MEG pattern. The shifts were small but they were in the same direction
in all 6 subjects for the MEG centroid (Wilcoxon test: Z = 2.2, p - .028 for both angles)
and in 5 of the 6 subjects for the EEG centroid (Z = 1.99, p = .046 for both angles).
A significant shift in the centroid in the parietal direction was found for the late target
period T3 (between 500 and 1000 ms) when the target was largely rotated. This shift re-
sulted in significant differences in the comparison between the late and the early period
(period T3 vs period T2) for the EEG (Z = 1.99, p = .046, 5 of 6 subjects) and for the
MEG (Z = 2.2, p = .28, 6 of 6 subjects). Direct differences between non-rotated and
markedly rotated targets within period T3 was significant for the parietal shift of the EEG
centroid (Z = 2.2, p = .028, 6 of 6 subjects). In addition, the centroid of the alpha pattern
during this late suppression period was located more to the right for the large rotation an-
gles as compared with the non-rotated angles. However, this difference was significant for
the MEG measurement only (Z = 1.99, p = .46, 5 of 6 subjects).
Michel, Kaufnman, Williamson: Alpha Suppression 11119/92 page 10
DISCUSSION
The reaction time results in this study clearly replicated the findings described by Cooper
& Shepard (1973). Reaction time increased with increasing rotation of the target figure from
the normal orientation. Therefore the mental rotation task clearly fulfilled our requirements to
produce different response latencies for different levels of task difficulty. As proposed by
Finke & Shepard (1 986) the present reaction time results are consistent with the notion that
subjects mentally carry out a rotation of the figure to the normal position before making an
identification. Our data are consistent with a linear variation, implying that the time to re-ori-
ent the figure is proportional to the rotation angle. Since there was no difference in the re-
action and suppression times between the corresponding angles from 0 to 150 deg and
from 210 to 360 deg, the figures seemed to be re-oriented either in the clockwise or
counter-clockwise direction, depending on the smallest angle of rotation needed to produce
the upright position. The responses to the mirror reflected letters appeared to be about 50
ms longer than those to the letters with correct orientation, indicating that additional pro-
cesses were required when the stimuli were mirror reflected. However, this additional
amount of time was essentially independent of the rotation angle.
Both the MEG and the EEG measures showed suppression of the alpha activity after the
presentation of the stimuli. Suppression was observed after presentation of the memory fig-
ure as well as the target figure. All recorded MEG and EEG channels showed this suppres-
sion of the alpha amplitude. This finding is in agreement with early EEG-reports about pari-
eto-occipital alpha blocking after visual stimulation IMorrell, 1966).
The present study has now established a clear relationship between the increase in du-
ration of suppression of parieto-occipital alpha band neuronal activity and reaction time as
task difficulty is increased in a mental rotation paradigm. Both increased by about 200 ms
for largest angles of rotation in a consistent fashion for each subject. This trend was inde-
pendent of the different individual's reaction times for the non-rotated targets (0 and 360
deg). Interestingly, while the reaction time was generally longer for mirror reflected than cor-
Michel, Kaufman, Williamson: Alpha Suppression 11119/92 page I I
rectly oriented target stimuli, this was not revealed by the duration of the alpha suppression.
The RT data imply that decisions regarding reflected letters are more difficult to make than
those regarding non-reflected letters. Since this does not appear in our parieto-occipital data,
it suggests that the effects are not due to task difficulty alone. However, since the differ-
ence in the reaction time was relatively small, the absence of such an effect could have
been due to the uncertainty in establishing suppression onset and offset times. Alternatively,
the decision as to whether the letter was reflected as well as rotated may have engaged
cortical areas outside the parieto-occipital region.
The accuracy in determining these physiological measures was dependent on the
strength of the alpha rhythm at stimulus onset. Because cortical excitations (alphons) that
produce the parade of spindles comprising the alpha rhythm have many different spectral
and temporal configurations (Williamson et al., 1989), there may be none in the relevant
cortical areas at the moment of interest and therefore suppression may not have been
clearly observed. However, these cases were rare and alpha suppression occurred in the
majority of the cases. The fact that this suppression was stronger and markedly longer
when the subject was engaged in the figure identification task, and its duration was longer
when this task was made more difficult (large rotated targets) indicates that the region of
the brain supporting this rhythm was involved in the mental rotation task. As noted earlier in
a study of mental imagery in a figure matching task, sources in the visual cortex (Kaufman
et al., 1990) and parieto-occipital sulcus (Williamson et al., 1989) contribute to these fields.
Although the number of sensors employed to measure the EEG and MEG activity was rather
small, changes of the spatial pattern during the period of alpha suppression were observed.
The analysis of the locations of the centroids of electric and magnetic field power registered
by the sensors revealed small but statistically significant shifts depending on the task re-
quirements of the stimuli (memory vs. target figure) and depending on level of difficulty for
the rotation task (non-rotated vs. large rotated targets). The spatial patterns of MEG and
EEG alpha signals often consist of only two extremas with opposite polarity (Lehmann et al.,

Mchel, Kaufman, Williamson: Alpha Supprcssion I 123/92 page 12
1987; Williamson & Kaufman, 1987, 1989; Michel et al., 1992).
Neuronal current sources within the parieto-occipital sulcus are oriented perpendicular to
the sulcus, so their magnetic field (and field-power) extrema are over the left and right ends
of the sulcus and their electric field extrema are over occipital and parietal areas. These ex-
treme dominate the spatial pattern of alpha power. They are supplemented by activitv within
the parietal areas as well. Assuming anatomical symmetry, sources in visual cortex within
the longitudinal fissure and calcarine sulcus would produce weaker alpha field power over
occipital and parietal regions. For such dipolar field patterns the center of gravity of the
maps (where the two extremas are squared) approximates the 2-dimensional location on the
scalp of the underlying equivalent generator. A shift of this point within the measured array
indicates changes in the average spatial activity pattern of the different neural populations
exhibiting the spontaneous activity (Lehmann, 1987; Michel et al., 1992).
In the first 500 ms after the memory and target figures, the centroid locations of both
the EEG and the MEG shifted towards more occipital regions after the target figure as com-
pared to the same period after the memory figure, independent of the time needed to iden-
tify the stimulus. This means that early suppression was stronger in the parietal region when
an analysis task was required with the visual stimulus. Alpha pattern differences between
the non-rotated and large rotated targets were found in the later period (500 - 100 ms)
after the target stimuli, where the centroids shifted towards the right (significant for the
MEG) and parieta: areas (significant for the EEG) when processing the targets with the large
rotated angles. This effect suggests additional suppression of neuronal activity in the left
occipital area. Our study was not designed primarily to study hemispheric differences, and in
view of the confusing literature (Erlichman & Barrett, 1983; Kosslyn, 1987; Papanicolaou et
al., 1987; Corballis & Sergent, 1989a, 1989b; Servos & Peters, 1990) further studies that
also include recordings of the brain's electrical activity over the temporal, central and frontal
areas are needed to define a clear left hemispheric involvement in mental imagery. However.
the spatial changes described in this paper give the first evidence for local changes of alpha
Michel, Kauffrmn, Williamson: Alpha Suppmssion 11/19/92 page 13
activity that depend on the task demands. Clearly, it could be of considerable interest to
supplement these result in future experiments by recordings with larger arrays of field sen-
sors. Together with the newly developed Minimum-Norm Least-Squares procedures for ob-
taining inverse solutions (*MNLS inverse") for measurements of the distribution of average
magnetic field power (Wang et al., 1992), it will be possible to map in detail the evolution of
the activity pattern associated with alpha suppression. The high temporal correlation be-
tween behavioral measures and alpha suppression make this physiological measure a clear
candidate for studies of brain processes that serve cognitive functions.
METHODS
Subjects
Six healthy, paid volunteers (2 males and 4 females) participated in this study after giv-
ing their informed consent. Their ages ranged from 19 to 31 years. All of them were right
handed and had normal, uncorrected vision. Before the actual recording sessions each sub-
ject performed at least 2 training runs of the task without recordings being made. Subjects
were informed to respond as quickly as possible while trying to maintain high accuracy.
Visual Presentation
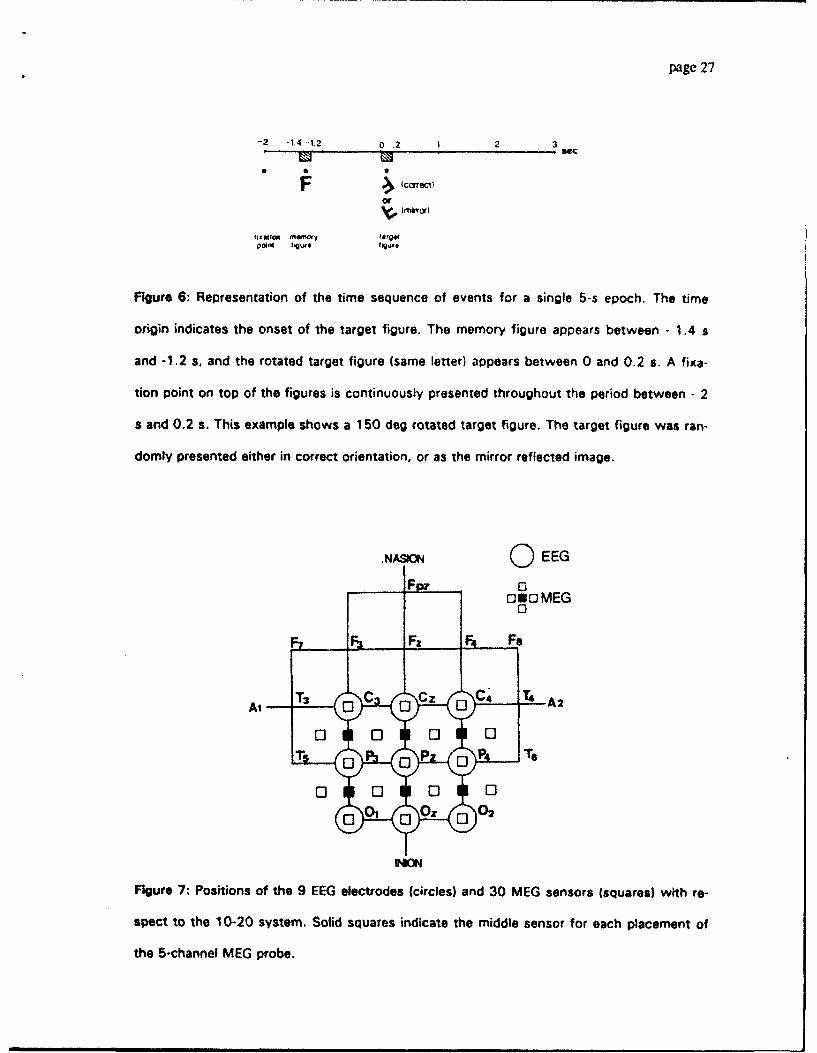
The time sequence of a single epoch is illustrated in Fig. 6. It begins with the presenta-
tion of a fixation point on a viewing screen positioned in front of the subject. This is pro-
duced from outside our magnetically shielded room by an Elektrohome video projector con-
trolled by an Amiga 2000 computer. The memory figure in the upright position was pre-
sented under the fixation point 700 ms later. After 200 ms it was turned off while the fixa-
tion point persisted for 1.2 s on the screen. Then the target figure was presented for 200
ms duration. Subsequently the screen was darkened for 3.2 s until the fixation point for the
next epoch was presented. Eight different figures were generated (letters C, E, F, G, L, P, S)

Michel, Kaufman, Williamson: Alpha Suppression 11/19/92 page 14
with a font that distinguishes between upright and inverted presentation of the letters C, E,
and S. The target figure was always the same as the memory figure but was tilted clock-
wise by a randomly selected angle from the set 0, 50, 100, 150, 210, 260, and 310 deg. In
addition, each target figure was randomly chosen to be presented either normal or mirror re-
flected. The subject's task was to press one of two buttons with the right hand to indicate
whether the target figure was normal or mirror reflected.
Recording Methods
The electric signals (EEG) were recorded from 9 electrodes positioned over the posterior
area of the scalp as shown in Fig. 7 (C3, Cz, C4, P3,Pz. P4, 01, Oz, 02 according to the
10-20 system). The electrode at Cz was used as the recording reference, and the data were
recomputed to express signals relative to the average reference (Lehmann & Skrandies,
1980). EEG data were bandpassed between 0.1-30 Hz.
Magnetic data (MEG) were recorded with a 5-channel neuromagnetometer (Williamson et
al., 1984) located within a magnetically shielded room. The probe, consisting of detectioiI
coils and SQUID sensors to which they were attached, was immersed in liquid helium within
a fiberglas cryogenic vessel. The detection coils were second-order gradiometers with 1.5
cm diameter and 4 cm baseline, arranged with four sensors equally spaced on a 2 cm circle
and the fifth in the center. Bandpass filters for the MEG channels were set for 0.1-50 Hz.
MEG signals were recorded from 6 different probe locations, each obtained in an individual
session. The sequence of positions was varied across subjects. The approximate positions
for magnetic recordings in comparison with the 9 EEG positions are ilhlstrated in Fig. 7.
Procedure
Both EEG and MEG signals were recorded for 5 s of each epoch, starting with the pre-
sentation of the fixation point at the -2 s time point in Fig. 6. A separate trigger channel and
two separate response channels as well as information about the presented stimulus (letter,
Michel, Kaufman, Williamson: Alpha Suppression 11/19/92 page 15
angle, and type) were simultaneously recorded. The data were digitized with a sampling rate
of 128 Hz and stored on computer disk for off-line analysis. Each subject participated in 6
sessions on 3 different days within less than 2 weeks. On each day, 2 experimental ses-
sions were performed with different probe positions, separated by a rest break of 20 min.
Each session consisted of 6 runs of 40 epoches each. One run lasted 3.6 min and was fol-
lowed by a pause of 1 min. Each session began with electrodes being attached to the scalp,
and then the subject was comfortably positioned on a kneeling chair inside the magnetically
shielded room. Torso and head were tilted forward so that they were supported by firm
cushions and vacuum casts. A system of mirrors was adjusted so that the target (3 cm
height) was presented in the lower visual field at a distance of 36 cm from the subject
(viewing size of the figure was 4.8 deg arc).
The recording positions of the neuromagnetometer probe relative to three cardinal land-
marks on the head (left and right periauricular points and nasion) of each subject was de-
termined by standard procedures (Yamamoto et al., 1988) using the Probe Position Indicator
system (Williamson & Kaufman, 1989). Two receivers were stuck to a Velcro headband,
and their positions were recorded relative to the three landmarks on the head to establish
the head-based coordinate system. The location and orientation of the probe relative to this
head-based coordinate system was determined automatically before and after each recording
(PPI system, Biomagnetic Technologies Inc., San Diego, CA).
Data analysis
Pilot studies suggested that the clearest suppression was observed within the higher al-
pha bandwidth of 10-12 Hz. Consequently each 5 s record of EEG and MEG recordings was
bandpassed in the range 10-12 Hz (-3 db points) using a digital FIR filter with a rolloff of 48
db/octave. The filtered signals were squared and then low-pass filtered with a cutoff of 6
Hz, to provide a slowly varying envelope of the alpha rhythm's power. These power traces
were averaged over the 6 runs of each session, separately for the 8 angles and the 2 condi-
Michel, Kaufhmn, Williamson: Alpha Suppression 11/19/92 page 16
tions (correct or mirror reflected target). Only correct responses were included in the aver-
age, which left about 20 epoches to be averaged together for each run, depending on the
random generator and number of correct responses. The square root of averaged power val-
ues were then taken, providing the 'alpha amplitude' for each average.
The durations of alpha suppression after the memory figure, and after the target figure
were computed separately. To determine the onset of suppression the program searched for
the time when the average amplitude fell below 50% of the amplitude span between the
preceding maximum and the following minimum. The offset of suppression was defined
similarly as when the amplitude rose above 50% of the span between the minimum and the
following maximum. These time marks were accepted when the amplitude exceeded the
50% threshold for at least 100 ms. The search was carried out within the time period be-
tween -1.7 s and 0 s for the memory figure and between 0 s and 2.8 s for the target figure.
Traces were then randomly displayed, without identification, on a computer monitor to-
gether with the time marks for onset and offset, and corrections were made where there
were obvious miss-identifications by the computer algorithm.
While the present experiment was not designed to characterize the spatial evolution of
magnetic or electric field power, it was possible to obtain some preliminary information
about changes in the distribution under the sensor arrays. As a practical measure we fo-
cussed on a one-point descriptor for the spatial pattern of the alpha at each moment in time:
the location of the center of gravity or centroid (Lehmann, 1987; Michel et al., 1992). In
contrast to potential maps where two centroids describe the positive and the negative half
of the fields, there is only one controid for power maps. It is assumed that a shift of the
centroid location means a shift of the dominant alpha activity across the scalp. The spatial
extent of the sensor array was sufficiently broad over parietal and occipital regions to indi-
cate if the centroid shifts away from the region where alpha suppression had been domi-
nant. The mean locations of the centroids, described by their anterior-posterior and their left-
right locations were compared between different time periods by averaging the centroids

Michel, Kaufmamn, Wlliamnson: Alpha Suppnrsion 11/19/92 pagS 17
over three different 500 ms time intervals: after the onset of memory figure, after the onset
of the target figure, and between 500-1000 ms after the target figure. The latter two peri-
ods reflecting early and late parts of the target-induced alpha suppression.
Acknowledgments
This work was supported by the Swiss National Science Foundation and conducted at
the Neuromagnetism Laboratory, Department of Physics, New York University, New York. It
was supported in part by Air Force Office of Scientific Research Grant AFOSR-90-0221. We
thank D. Chander for her help in conducting the experiment, Dr. Y.M. Cycowicz and Dr. Z.L.
Lu for their technical advice, Dr. J.-Z. Wang for computer assistance, and Dr. D. Lehmann
for his helpful comments during the analysis of the study.
Reprint requests should be sent to Christoph M. Michel, EEG-EP Mapping Laboratory,
Neurology Department, University Hospital, CH-8091 Zurich, Switzerland.
REFERENCES
Anderson, J.R. (1985). Cognitive psychology and its implications. 2nd edition, New York:
W.H. Freeman & Company.
Berger, H. (1930). Ueber das Elektrenkephalogram des Menschen I1. Journal of Psychology
and Neurology, 40, 160-179.
Cooper, L.A., & Shepard, R.N. (1973). The time required to prepare for a rotated stimulus.
Memory and Cognition, 7, 246-250.
Corballis, M.C., & Sergent, J. (1989a). Hemispheric specialization for mental rotation. Cor-
tex, 25, 15-25.

Michel, tXauftan, Williams:n: A•pha Suppression 1111902 past Is
Corballis, M.C., & Sergent. J. 01989b). Mental rotation in a commissurotomized subject.
Neuropsychologia, 27, 585-597.
Erlichman, H., & Barrett, J. (1983). Right hemisphere specialization for mental imagery: a
review of the evidence. Brain and Cognition, 2, 55-76.
Farah, M.J. (1984). The neurological basis of mental imagery: a componential analysis.
Cognition, 18, 245-272.
Farah, M.J. (1988). Is visual imagery really visual? overlooked evidence from neuropsychol-
ogy. Psychological Review, 95, 307- 317.
Farah, M.J., Peronnet, F., Weisberg, L.L., & Perrin, F. (1988). Electrophysiological evidence
for shared representational medium for visual images and visual percepts. Journal of Ex-
perimental Psychology, 117, 248-257.
Finke, R.A., & Shepard, R.N. (1986). Visual functions of mental imagery. In K.R. Boff, L.
Kaufman, & J.P. Thomas, tEds), Handbook of Perception and Human Performance: Vol.
II, Cognitive Processes and Performance (pp. 1-55). New York: John Wiley and Sons.
Goldenberg, G., Podreka, I., Steiner, M., Willmes, K., Suess E., & Deecke, L. (1989). Re-
gional cerebral blood flow patterns in visual imagery. Neuropsychologia, 27, 641-664.
Golla, F.,Hutton, E.L., & Walter, W.G. (1943). The objective study of mental imagery. I.
Physiological concomitants. Journal of Mental Sciences, 75, 216-223.
Jasper, H.H., & Andrews, H.L. 01938). Electro-encephalography. Ill. Normal differentiations
of occipital and precentral regions in man. Archives of Neurology and Psychiatry, 39,
96- 115.
Kaufman, L., & Locker Y. (1970). Sensory modulation of the EEG. Proceedings of the
Americal Psychological Association, 75th Meeting, 179-180.
Kaufman, L., Glanzer, M., Cycowicz, Y.M., & Williamson, S.J. 11989). Visualizing and
rhyming cause diffarences in alpha suppression. In S.J. Williamson, M. Hoke, G. Stroink,
& M. Kotani (Eds.), Advances in Biomagnetism (pp. 241-244). New York: Plenum Press.

Michel, Kaufnma, Williamaon: Alpha Suppresion 11119/92 peg© 19 [Kaufman, L., Schwartz, B., Salustri, C., & Williamson, S.J. (1990) Modulation of sponta-
neous brain activity during mental imagery. Journal of Cognitive Neuroscience, 2, 124-
132.
Kaufman, L., Curtis, S., Wang, J.-Z., & Williamson, S.J. (1992). Changes in cortical activity
when subjects scan memory for tones. Electroencephalography and Clinical Neurophys-
iology, 82, 266-284.
Kosslyn, S.N. (1983). Ghosts in the Mind's Machine. New York: Norton Press.
Kosslyn, S.N. (1987). Seeing and imagining in the cerebral hemispheres: a computational
approach. Psychological Review, 94, 148-175.
Lehmann, D. (1971). EEG, evoked potentials, and eye movements. In P. Bach-y-Rita & C.C.
Collins (Eds.), The control of eye movements (pp. 141-173). New York, London: Aca-
demic Press Inc.
Lehmann D. (1987). Principles of spatial analysis. In A.S. Gevins & A. Remond, (Eds.),
Handbook of Electroencephalography and Clinical Neurophysiology, Vol. I: Methods of
Analysis of Brain Electrical and Magnetic Signals (pp.309-354). Amsterdam: Elsevier.
Lehmann, D., & Skrandies, W. (1980). Reference-free identification of components of
checkerboard-evoked multichannel potential fields. Electroencephalography and Clinical
Neurophysiology, 48, 609-621.
Lehmann, D., Ozaki, & Pal, I. (1987). EEG alpha map series: brain micro-states by space-ori-
ented adaptive segmentation. Electroencephalography and Clinical Neurophysiology, 67,
271-288.
Lehmann, D., Michel, C.M., Henggeler, B., & Brandeis, D. (1991). Source localisation of
spontaneous EEG using the FFT Dipole Approximation: Different frequency bands, and
differences with classes of thoughts. In I. Dvorak & A.V. Holden (Eds.), Mathematical
approaches to brain functioning diagnostics. (pp. 159-169). Manchester, New York:
Manchester University Press.
Michel. Kagfijaa, Willisawsn: Alpha Suzppression 11/19/9 page 20[
Mangun, G.R., & Hillyard, S.A. (1988). Spatial gradients of visual attention - behavioral and
electrophysiological evidence. Electroencephalography and Clinical Neurophysiology, 70,
417-428.
Michel, C.M., Lehmann, D., Henggeler, B., & Brandeis, D. (1992). Localization of the
sources of EEG delta, theta, alpha and beta bands using the FFT Dipole Approximation.
Electroencephalography and Clinical Neurophysiology, 82, 38-44.I
Morrell, L.K. (1966). Some characteristics of stimulus-provoked alpha-activity. Electroen-
cephalography and Clinical Neurophysiology, 21, 552--561.
Papanicolaou, A., Deutsch, T., Bourbon, G., Will, K., Loring, D., & Eisenberg, H. (1987).
Convergent evoked potential and cerebral blood flow evidence of task-specific hemi-
spheric differences. Electroencephalography end Clinical Neurophysiology, 66, 515-520.
Peronnet, F., & Farah, M.J. (1 989). Mental rotation - an event- related potential study with
a validated mental rotation task. Brain and Cognition, 9: 279-288.
Pfurtscheller, G. (1981). Central beta rhythm during sensory motor activities in man. Elec-
troencephalogra~phy and Clinical Neurophysiology, 51, 253-264.IPfurtscheller, G. (1986). Event-related desynchronization mapping: visualization of cortical
activation patterns. In: F.H. Duffy (Ed.), Topographic Mapping of Broin Electrical Activity
(pp.99-il11). Stoneham: Butterworth.
Pfurtscheller, G., & Aranibar, A.01 979). Evaluation of event- related desynchronization (ERD)
preceding and following voluntary self-paced movement. Electroencephalography and
Clinical Neurophysiology, 46, 138-146.
Pfurtscheller G., & Klimesch W. (1991). Event-related desynchronization during motor be-
havior and visual information processing. In C.I-.M. Brunia, G. Mulder, & M. Verbaten
(Eds.), Event-Related Brain Research, Electroencephalography and Clinical Neurophysiol-
ogy 1pp.58-65). Amsterdam: Elsevier.
Pylyshyn Z.W (1981). The imagery debate: Analogue media versus tacit knowledge. Psy-
chologigical Review, 88, 18-45.

Mkhe1, Kaufmnan, Williamson: Alpha Suppresion 11/9/2 page 21
Roland, P. E. & Friburg, L. 41985). Localization of cortical areas activated by thinking. Jour-
nal of Neurophysiology., 53, 1219-1243.
Ruchkin D.S., Johnson, R., Canoune, H., & Ritter, W. (1991). Event-related potentials dur-
ing arithmetic and mental rotation. Electroencepha/ography and Clinical Neurophysiology,
79, 473-487.
Servos, P., & Peters, M. (1990). A clear left hemisphere advantage for visuo-spatially based
verbal categorization. Neuropsychologia, 28, 1251-1260.
Shepard R.N., & Meltzer J.(1 971). Mental rotation of three-dimensional objects. Science,
171, 632-634.
Shepard R.N., & Cooper, L.A. (1982). Mental Images and their Transformations. Cambridge:
MIT Press.
Tiihonen, J., Hari, R., Kajola, M., Karhu, J., Ahlfors, S., & Tissari S. (1991). Magnetoen-
cephalographic 10-Hz rhythm from the human auditory cortex. Neuroscience Letters,
129, 303- 305.
Wang , J.Z., Williamson, S.J., & Kaufman, L. (1992). Magnetic source images determinedI
by a lead-field analysis: the unique minimumn-norm least-squares estimation. IEEE Trans-
actions on Biomedical Engineering, 39, 665-67 5.
Williamson, S.J., & Kaufman, L. (11987). Analysis of neuromagnetic signals. In A.S. Gevins,
& A. Remond, (Eds.), Handbook of Electroencephalography and Clinical Neurophysiol-
ogy, Vol. 1: Methods of Analysis of Brain Electrical and Magnetic Signals (pp. 405-488).
Amsterdam: Elsevier.
Williamson, S.J. & Kaufman, L. (1989). Advances in neuromagnetic instrumentation and
studies of spontaneous brain activity. Brain Topography, 2, 129-139.
Williamson, S.J., Pelizzone, Y., Okada, D., Kaufman, L., Crum, B., & Marsden, J.R. (1984).
Magnetoencephalography with an array of SQUID sensors. In H. Collan, P. Berglund, &I
M. Krusius, fEds.), ICEC70: Proceedings of the Tenth International Cryogenic Engineer-
ing Conference, Guildford, England (pp. 339-348). Stoneham: Butterworth.

NMichel, Kaufman, Will~ason: Alpha Supprsa•oa 1J119192 page 22 [Williamson, S.J., Wang, J.-Z. & Ilmoniemi, R.J. (1989). Method for locating sources of hu-
man alpha activity. In S.J. Williamson, M. Hoke, G. Stroink, & M. Kotani (Eds.), Ad-
vances in Biomagnetism (pp. 257-260). New York: Plenum Press.
Yamamoto, T, Williamson, S.J., Kaufman, L.; Nicholson, C. & linas, R. 11988). Magnetic
localization of neuronal activity in the human brain, Proceedings of the Nationai
Academy of Sciences USA, 85, 8732-8736.
[
page 23
a b ALPHA AMPLITUDE EEGfTnt . ALPHA AMPLITUDE MEG (0,360 dogl JvO . . AL
1660- -1 easy¶50,�1--d-g)� -•( (0,32o0 dog)
Figur 1:Fv-eodapaapltd rcso n ubeta h enoe al ME yn
14 0
difficult
(asa5hnf t n tan,210 dos) ( f n 3rt .larg•et
taedanle men or15 nd21 dg19hecopue supeso duration afergth
SI -- S F2S120._
170-
1 15 0 .
memory and after the target figure for this case are indicated (S1 and $2). The time periods
(Ti, T2, T3) marked along the x-axis designate the epochs that were selected for averagingthe centroid locations (see Fig. 5). (a) MEG alpha amplitude, averaged over all 30 sensorpositions. (b) EEG alpha amplitude, averaged over all 9 electrode positions and the 6 ses-
sions.
correct mirrorpae2kt pag 2
007
006
0 0 100 15,0 300 350 3W0 350 0 5 0 5 s 5 0 5
gon -'
1,0 10 If
0. 0.3
0-7016
05 5ý ý 20 0 6
so0 100 ISO 200 300 300 350 0 50 100 10 20 30 30 15
1.06
0.7 -
07.-
0. 100 ND20 ý
OA 0.5
0 - - 067
0.6 0.
0.30.3 10 5 100 ISO 200 3110 300 350
0 so 100 150 240 3510 300 3S50 s
0.5S
1.9.
0 .-. 1 1
000.
0 50 100 10 200 n10 300 300
11..
1i.
If 1.6
1.6 3/ 30 1.3, 4 2;0
A1 '" 1.2ftWW
recto 1.1e - / upeso urto:MG - EG
Fi.ur 2:Idvda'-enrato iecmae ihMG n E upeso ua
tin o dferntrtain nge o hetagt iurs o ec o 6sbjcs.Seaat rae
ar1rw.o0h orctyoine lf)adfo h irrrfetd rgt agtfgrs
page 25
reaction time suppression duration MEG suppression duration EEG'sac
1.01
.6 .68 _ _ _ _ _ _ _ _ _ _ _ _ _ _ .68 _ _ _ _ _ _ _ _ _ _ _ _ _ _ _
0 50 100 150 200 250 300 350 0 50 100 150 200 250 300 350 0 50 100 150 200 260 300 350Angle (dWg) Angle (dog) Arg.e (gl)
- correct mirror reflected
Figure 3: Mean and standard error (N = 6) of the reaction time together with MEG- and EEG
suppression durations for the different rotation angles of the target figures. Separate traces
are drawn for the correctly oriented and for the mirror reflected figures.
MEG fT EEG pv20 3140 20 "36
3128 D 33ie 116 30
15 105 15 27( 93 2 024• = . • -. .. . • ,r l 1 "=!"0 2 1_ 0 21810 [3 70 ar 10 E3 IS
023 0e.9 00 46 3[31
o 5 [] 35 o 5 0 1-9=• ,.• r3 23 ie
0 0o 0 0o15 5 -5 -15 I5 5 -5 -15
Left-Right Left-Right
Figure 4: EEG and MEG alpha amplitude maps for one subject. The maps are means over
500 ms intervals when the target figure was rotatad by 150 deg. Note the MEG patterns are
oriented approximately perpendicular to the EEG patterns. The locations of the respective
amplitude centroids are marked by white dots. The values on the axis are in centimeters,
with the inion at the origin for the occipital-parietal axis and the midline at the origin for the
left-right axis, with negative to the right.

page 26
a MEG Centroid Location b MEG Centroid Location
-0.3 0
-0.9-• • 10-
dIffloult CIL
*pC4.00 -9., 4e
- 1.2 • 9.7period TI period T2 peiod T3 peried TI period T2 period T3
c EEG Centroid Location d EEG Centroid Location-0.1,.
-0.12 ,-S,
.• .--N- diffteult 8.* \-.--0•' .
-0.3 3.period TI pi T2 po T3 d TI period TI perd TS
Figure 5: Location of the centroids of the MEG and the EEG field patterns, averaged over 3
different time piriods: TI: 0-500 ms after onset of the memory figure; T2: 0-500 ms after
onset of the target figure; and T3: 500-1000 ms after onset of the target figure. Separate
traces are shown for the non-rotated (0, 360 deg) and large rotated (150, 210 deg) target
figures. All points are the medians over six subjects. Statistically significant differences
(Wilcoxon-tests) are marked by an asterisk and vertical lines. Coordinate axes are as in the
preceding figure. (a) Right-Left location of the cenrtroid of the MEG field (negative is in right
hemisphere). (b) Occipitai-Parietal location of the centroid of the MEG field, (c) Right-Left lo-
cation of the centroid of the EEG field. (d) Occipital-Parietal location of the centroid of the
EEG field.
page 27
-2 -14 -12 0 .2 1 2 3
or
fOMI@Qoifl hgu~e l•,gg'e
Figure 6: Representation of the time sequence of events for a single 5-s epoch. The time
origin indicates the onset of the target figure. The memory figure appears between - 1.4 s
and -1.2 s, and the rotated target figure (same letter) appears between 0 and 0.2 s. A fixa-
tion point on top of the figures is continuously presented throughout the period between - 2
s and 0.2 s. This example shows a 150 deg rotated target figure. The target figure was ran-
domly presented either in correct orientation, or as the mirror reflected image.
* NAW ON 0 EEG
oloMEG0
_ 3 F, F4 Fe
Al
0 0 0 0
0 [] 0 R T
Figure 7: Positions of the 9 EEG electrodes (circles) and 30 MEG sensors (squares) with re-
spect to the 10-20 system. Solid squares indicate the middle sensor for each placement of
the 5-channel MEG probe.
![[P] Oxygen Therapy - Inpatient and STOT Ordering · 2019-05-09 · Clinical Practices A-Z Oxygen Therapy – Inpatient & STOT Ordering Issued by Respiratory CNS Issued Date March](https://img.pdfslide.us/doc/110x75/5ed6b58bcaf45b18673a5a17/p-oxygen-therapy-inpatient-and-stot-ordering-2019-05-09-clinical-practices.jpg)


![Background – Operators (1D) · Background (1D) Operators 4 Young Won Lim 3/28/18 zip function zip :: [a] -> [b] -> [(a,b)] zip (a:as) (b:bs) = (a,b) : zip as bs zip _ _ = [] Prelude>](https://img.pdfslide.us/doc/110x75/5f7d53a36176442cad227c24/background-a-operators-1d-background-1d-operators-4-young-won-lim-32818.jpg)