Embed Size (px)
Citation preview
Aon Retirement and Investment
I Fund Benchmark Study Federal Retirement Thrift Investment Board
Thrift Savings Plan
October 2019
port Document Title Sub-Title of Report Document
Date

(This page left blank intentionally)

Risk. Reinsurance. Human Resources.
Table of Contents Page 1. Executive Summary 1 2. I Fund 7

1
EXECUTIVE SUMMARY
Executive Summary
3
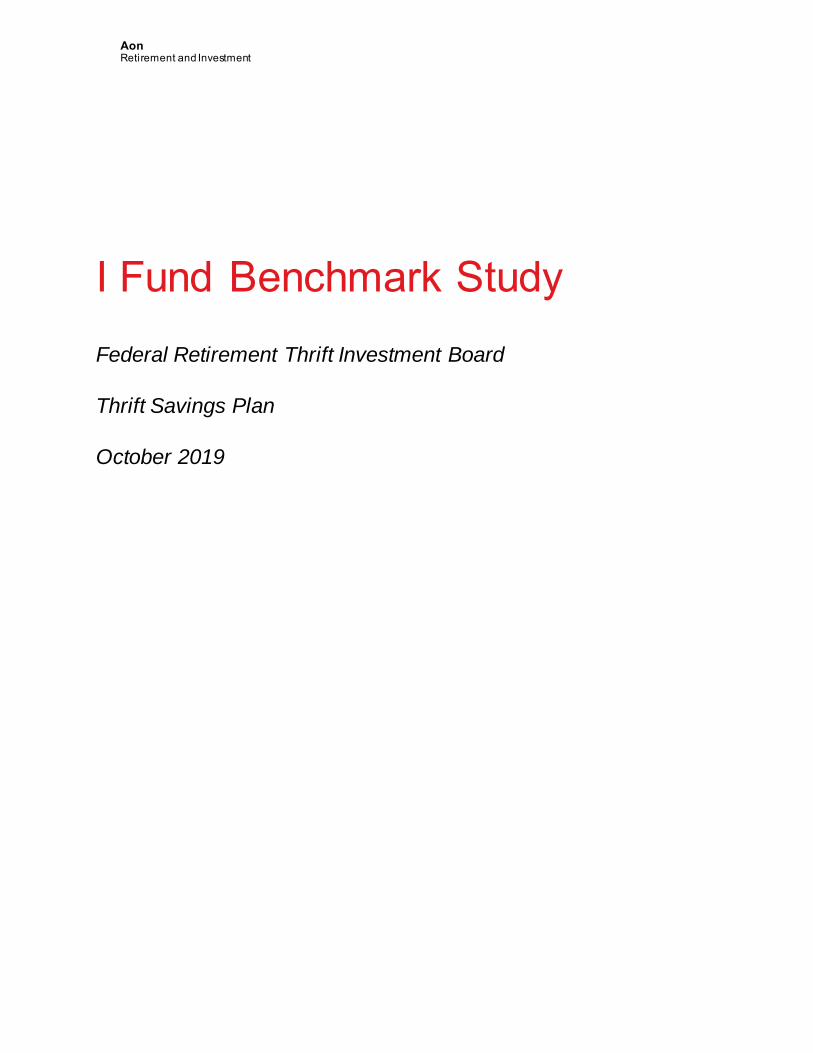
Background
In 2017, The Federal Thrift Savings Plan (“TSP”) requested that Aon Hewitt Investment Consulting, Inc. (“AHIC”) review and evaluate the appropriate index to benchmark the Common Stock Index Investment Fund (“C Fund”), Small Cap Stock Index Investment Fund (“S Fund”), Fixed Income Index Investment Fund (“F Fund”), and International Stock Index Investment Fund (“I Fund”). To do so, AHIC reviewed multiple indexes by evaluating the construction methodology and opportunity set covered by each, the investability and liquidity of the indexes, acceptance of the indexes by the investment community, the appropriateness of the indexes for the TSP, and the estimated costs associated with making a change. These factors are the most relevant to consider when choosing a benchmark. Based on our review, we issued a report and recommendation. Our recommendation at that time was not to change the benchmark for the C Fund, S Fund, and F Fund and was to change the benchmark of the I Fund from the MSCI Europe, Australasia, Far East Index (MSCI EAFE Index) to the MSCI All Country World ex US Investable Market Index (MSCI ACWI ex USA IMI Index).
In September of 2019, the TSP asked AHIC to review and re-evaluate its 2017 I Fund recommendation. We have done so and affirm the following recommendations based on a re-review of the factors mentioned above.
I Fund Aon recommends continuing with the plan to replace the MSCI EAFE Index with the MSCI ACWI ex USA IMI Index
This recommendation is based on the following reasons, among others:
▪ Legislative Requirements on Market Exposure: − The Federal Retirement Thrift Investment Board is an independent federal agency that was
established to administer the TSP under the Federal Employees’ Retirement System Act of 1986 (See 5 U.S.C. §§ 8351; 8401 et seq.).
− The Board’s mission is to act solely in the interests of its participants and beneficiaries. − Section 8438(b)(2) defines the C Fund and Section 8438(b)(3) defines the S Fund, which combined
provide participants with access to the reasonably complete representation [roughly 99%] of the U.S. public equity markets (5 U.S.C. §§ 8438(b)(2)-(b)(3)).
− The I Fund—that is, the international equity complement to the C Fund and S Fund—is defined in Section 8438(b)(4), which states:
o “The Board shall select an index which is a commonly recognized index comprised of stock the aggregate market value of which is a reasonably complete representation of the international equity markets excluding the United States equity markets.” (Id. § 8438(b)(4)).
− Moving from the MSCI EAFE Index, which represents 58% of the international equity market, to the MSCI ACWI ex USA IMI Index, which represents 99% of the international equity market, is a more representative benchmark and better fulfills the intent of Title 5 U.S.C. Section 8438(b)(4)(A). Specifically, it provides participants with greater investable access to the international equity market including:
Executive Summary
4
o Canada—Canada is the fourth-largest developed equity market in the world, representing 6.8% of the developed non-U.S. equity opportunity set.
o Emerging Markets—which represent 25.7% of the international non-U.S. equity investable universe.
▪ Best Practice in U.S. Defined Contribution Plans: - The MSCI indexes remain the most popular indexes for U.S. based institutional investors investing
in overseas equity markets. Including an international equity option with a material allocation to emerging markets equities is considered best practice in the marketplace, exemplified by adoption among public plans, defined contribution plans, target date funds, etc.
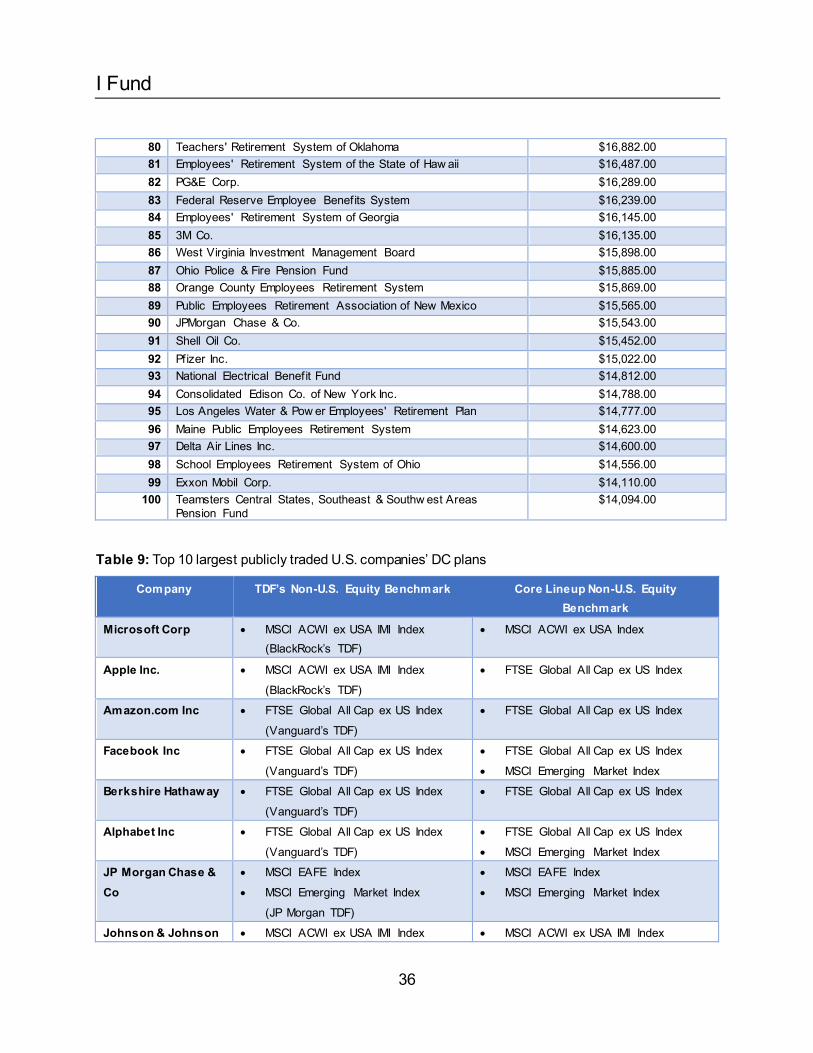
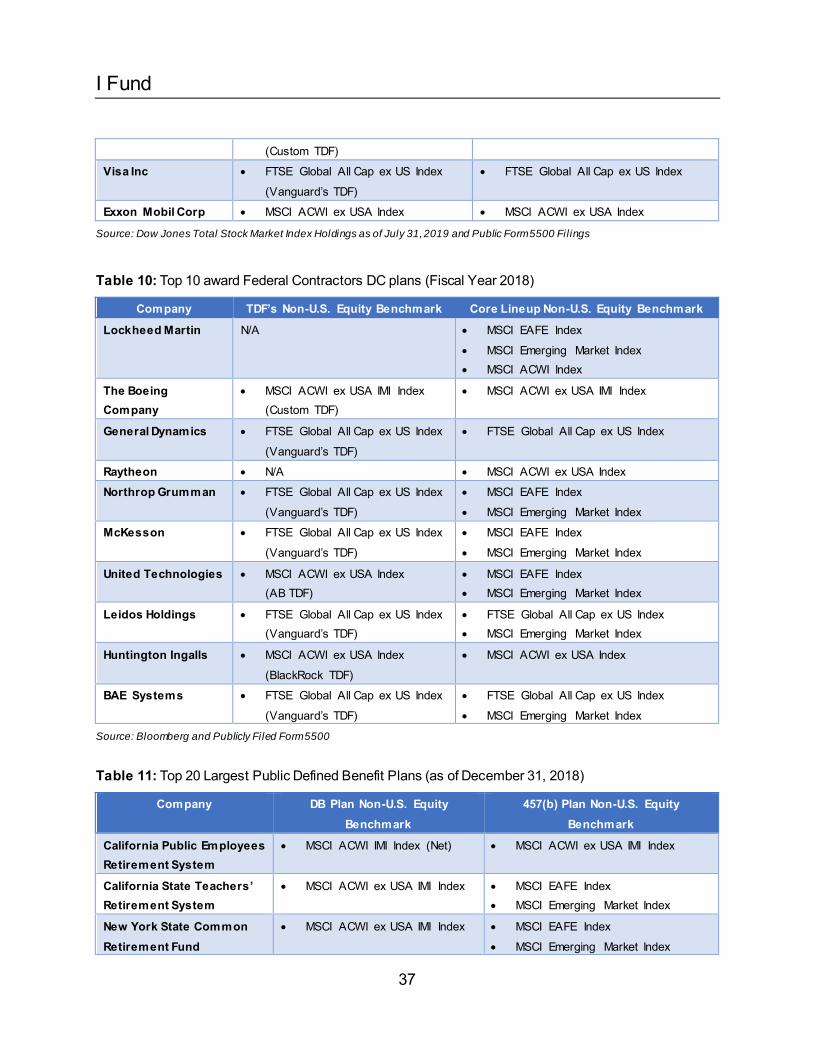
o From the evaluation of public filings, we have observed the Top 10 publicly traded U.S. companies and Federal contractors all offer their participants access to the full non-U.S. equity market including emerging market equity.
o In addition, in the public plan space across the Top 20 largest public plans, we have found a clear majority of them use a full non-U.S. equity benchmark in their defined benefit plan strategic allocation, as well as in their participant-directed 457(b) plans.
− Both the availability and the constitution of standalone options in a DC plan are important, and they become even more meaningful when a plan offers a custom target date fund (“TDF”), because a custom TDF will rely on those asset exposures to build the strategic asset allocation of the custom target date funds’ glide path. Best practices for U.S. target date funds design has relevance as TDFs are increasingly becoming a meaningful part of all Americans’ investment portfolio within defined contribution plans. It is our observation that most TDFs include a dedicated equity allocation to emerging markets. Since President George W. Bush signed the Pension Protection Act of 2006 (which defined a qualified default investment alternative) into law, target date funds have become the most used investment option within defined contribution (“DC”) plans in the United States. (For reference, the TSP’s L Funds are target date funds.)
o At the end of 2018, Fidelity and Vanguard, two of the largest recordkeepers of DC plans, reported that roughly 52% of all participants hold a single target date fund as their sole investment.
o Vanguard also reported at the end of 2018 that 79% of all participants have some exposure to a target date fund, and 57% of all participant-directed contributions were allocated to a target date fund.
o As of June 30, 2019, Vanguard reported that the top six target date fund providers by assets (i.e., Vanguard, Fidelity, T. Rowe Price, BlackRock, JP Morgan, and American Funds) hold 86% of all assets invested in target date funds—that is, more than $1.9 trillion.
o As of June 30, 2019, all six of those listed target date fund providers invest in emerging market equity as part of the international allocation of their respective target date fund products.
▪ Liquidity: - AHIC’s analysis suggests that including emerging markets and international small cap equities in
the I Fund will not hinder the ability of the TSP to meet its daily liquidity needs.
Executive Summary
5
▪ Analysis of International Equity Benchmarks: - Capital Market Assumptions
o AHIC’s Q3 2017 30-year forward-looking capital market assumptions forecasted that the MSCI ACWI ex USA IMI Index’s nominal return and Sharpe Ratio were 7.7% and 0.24, respectively, compared to the MSCI EAFE Index’s nominal return and Sharpe Ratio of 7.3% and 0.23, respectively.
o AHIC’s Q3 2019 30-year forward-looking capital market assumptions have improved expectations for the international equity markets as shown by the MSCI ACWI ex USA IMI Index’s nominal return and Sharpe Ratio of 7.9% and 0.27, as compared to the MSCI EAFE Index’s nominal return and Sharpe Ratio of 7.5% and 0.26.
- Securities Lending o In addition, the MSCI ACWI ex USA IMI Index generated the higher expected yield and
percentage out on loan when compared to the MSCI EAFE Index. o Across each of the last three calendar years, the income to the TSP I Fund is estimated to
have been at least 1.5x as much if the I Fund tracked the MSCI ACWI ex USA IMI Index instead of the MSCI EAFE Index.
▪ Analysis of Model Participant using the L Funds: - Aon was asked to provide a historical analysis of changes in TSP account balances for hypothetical
average participants under two scenarios for both 5- and 10-year time periods. The first scenario analyzes the L Funds’ performance using the MSCI EAFE Index as the benchmark for the I Fund (current benchmark). The second scenario analyzes the Funds’ performance using the MSCI ACWI ex USA IMI Index as the benchmark for the I Fund (approved benchmark).
o The results of the analysis supported the recommendation to replace the current I Fund benchmark (MSCI EAFE Index) with the proposed benchmark (MSCI ACWI ex USA IMI Index). The differences in expected returns and account balances for both time periods were minimal between the two approaches.
- Aon was asked to provide a forward-looking analysis of changes in TSP account balances for hypothetical average participants under two scenarios over a 10-year timespan. The first scenario analyzes the L Funds’ performance using the MSCI EAFE Index as the benchmark for the I Fund (current benchmark). The second scenario analyzes the L Funds’ performance using the MSCI ACWI ex USA IMI Index as the benchmark for the I Fund (approved benchmark).
o The results of the analysis supported the recommendation to replace the current I Fund benchmark (MSCI EAFE Index) with the proposed benchmark (MSCI ACWI ex USA IMI Index). In almost every market environment for each L Fund included in the analysis, the MSCI ACWI ex USA IMI Index produced better expected returns. When incorporating the positive effects of contributions while modeling participant account balances, the L Funds including the MSCI ACWI ex USA IMI Index are expected to produce better results over all market environments.
▪ Macro Analysis of Investment Flows into China Equities: - Investment in China’s equity market is not new for U.S. based institutional investors. Since MSCI
included China in the Emerging Markets Index in 1996, U.S. investors have gained exposure to
Executive Summary
6
China equities. Over the past ten years, U.S. investors have primarily invested in China equities through listings on the Hong Kong Stock Exchange and the NYSE/ Nasdaq.
- U.S. retirement funds’ capital flows into China equities have grown from an estimated $53 billion to $161 billion1 over the past ten years, which reflects the rising weight of overall China in the MSCI Emerging Markets Index, the evolution of share classes for China equities within the Emerging Markets Index, as well as investors’ outlook for Emerging Markets Equity .
- The higher weight of overall China since 1996 reflects the expanding investable market universe due to increasing issuance across different share classes of China equities, improved market access particularly to its onshore markets, as well as the growth of market valuations.
- Starting in 2018, MSCI’s move to include China onshore equities (A-Shares) in the Emerging Markets Index provided investors a new channel to gain exposure to China’s domestically listed equities. Looking further out, MSCI has illustrated the possibility that China (as a country) could comprise more than 40% of the MSCI Emerging Markets Index, rising from the current weight of 32%, when eligible A-Shares are fully included. A-Shares alone could jump from the current 2.5% to 17.4% of the MSCI Emerging Markets Index, while other China share classes are displaced by A-Shares. The expected rising weight of China domestic equity in the MSCI China Index will likely determine the direction and scale of future capital flows to China equities.
- We expect future capital inflows to China equities from passive investors to track the rising weight of overall China in the Emerging Markets Index as well as the expected dominance of A-Shares in the MSCI China Index. In addition to capital inflows of equity passive strategies that follow index moves, we also expect additional inflow to China’s domestic equity markets from active investors.
1 As of 12/31/2018. U.S. retirement funds include total assets of DB, DC Plans and IRAs. Source: Federal Reserve Bank of St. Louis; Allocation to China is estimated based on market survey on DC funds’ allocation to Non -U.S. Equity at 6%-8% and DB funds allocation to EM at 2.6%, then assumed a passive allocation to China based on the index weight.

I Fund
7
I FUND
I Fund
8
I Fund Summary Aon has reviewed the International Stock Index Investment Fund’s (“I Fund”) legislative requirements and compared its current benchmark, the MSCI EAFE Index, to other leading international equity indexes. Legislative Requirements The objective of any investment option or portfolio plays an important role in determining the appropriate benchmark for that investment. The Federal Employees’ Retirement System Act of 1986 (FERSA), as amended, states the following regarding the I Fund, under Title 5 U.S.C. Section 8483 (b)(4): (4)(A) The Board shall select an index which is a commonly recognized index comprised of stock the
aggregate market value of which is a reasonably complete representation of the international equity markets excluding the United States equity markets.
(B) The International Stock Index Investment Fund shall be invested in a portfolio designed to replicate the performance of the index selected under subparagraph (A). The portfolio shall be designed such that, to the extent practicable, the percentage of the International Stock Index Investment Fund that is invested in each stock is the same as the percentage determined by dividing the aggregate market value of all shares of that stock by the aggregate market value of all shares of all stocks included in such index.
Benchmarks Considered We initially short-listed the following benchmarks for the I Fund:
▪ Dow Jones Developed World ex U.S. Index ▪ MSCI Europe, Australasia, Far East (EAFE) Index (Current Benchmark) ▪ MSCI World ex USA Index ▪ MSCI All Country World ex USA (ACW ex USA) Index ▪ MSCI All Country World ex USA Investable Market Index (ACW ex USA IMI) (Approved
Benchmark)
▪ FTSE All World Developed ex North America Index (AWD ex NA) ▪ FTSE All World ex US Index (AW ex US) ▪ S&P/Citigroup Broad Market Index (BMI)
We eliminated the Dow Jones Developed World ex U.S. Index and the S&P/Citigroup index from further consideration based on the lack of significant passive assets managed to them. None of the major index fund managers offer funds indexed to these benchmarks, either in the U.S. or internationally.
As for the FTSE indexes, Vanguard is the only investment management firm out of the five major index fund providers in the U.S. that has assets benchmarked to FTSE indexes. Although assets managed to FTSE indexes through Vanguard index funds are meaningful in size, the benchmark is not common across the rest of the major passive providers. Therefore, we excluded both FTSE indexes in further study.
I Fund
9
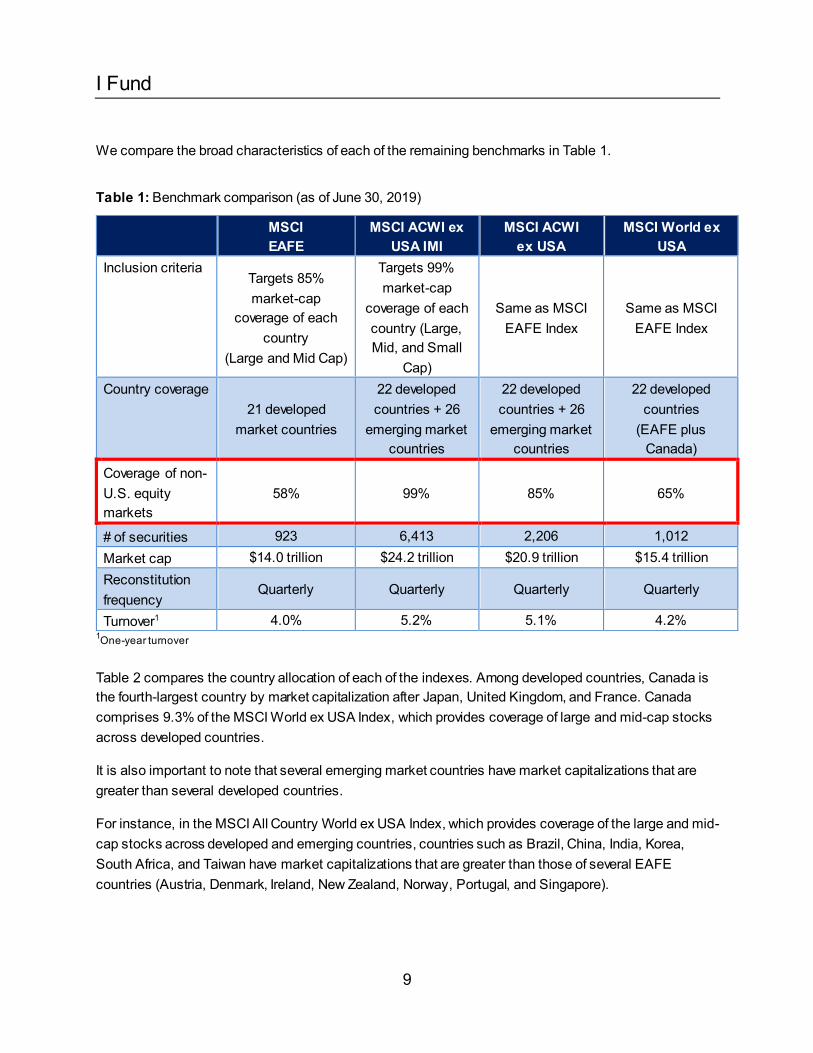
We compare the broad characteristics of each of the remaining benchmarks in Table 1.
Table 1: Benchmark comparison (as of June 30, 2019)
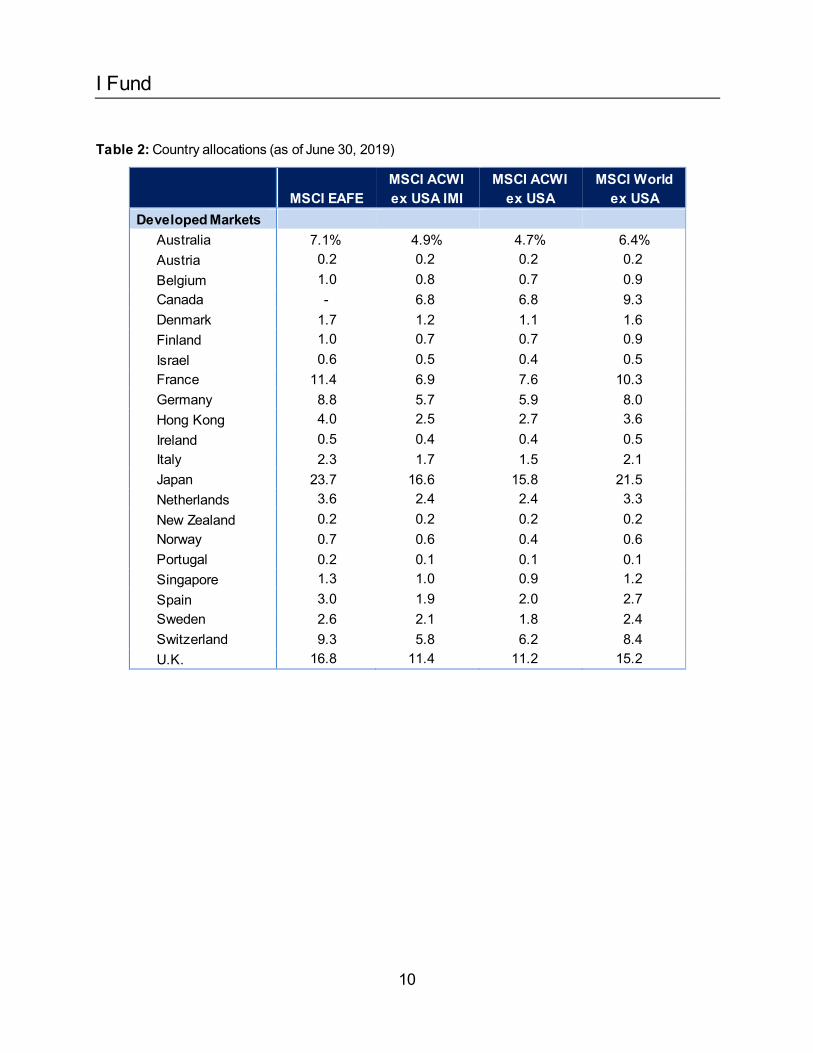
1One-year turnover Table 2 compares the country allocation of each of the indexes. Among developed countries, Canada is the fourth-largest country by market capitalization after Japan, United Kingdom, and France. Canada comprises 9.3% of the MSCI World ex USA Index, which provides coverage of large and mid-cap stocks across developed countries.
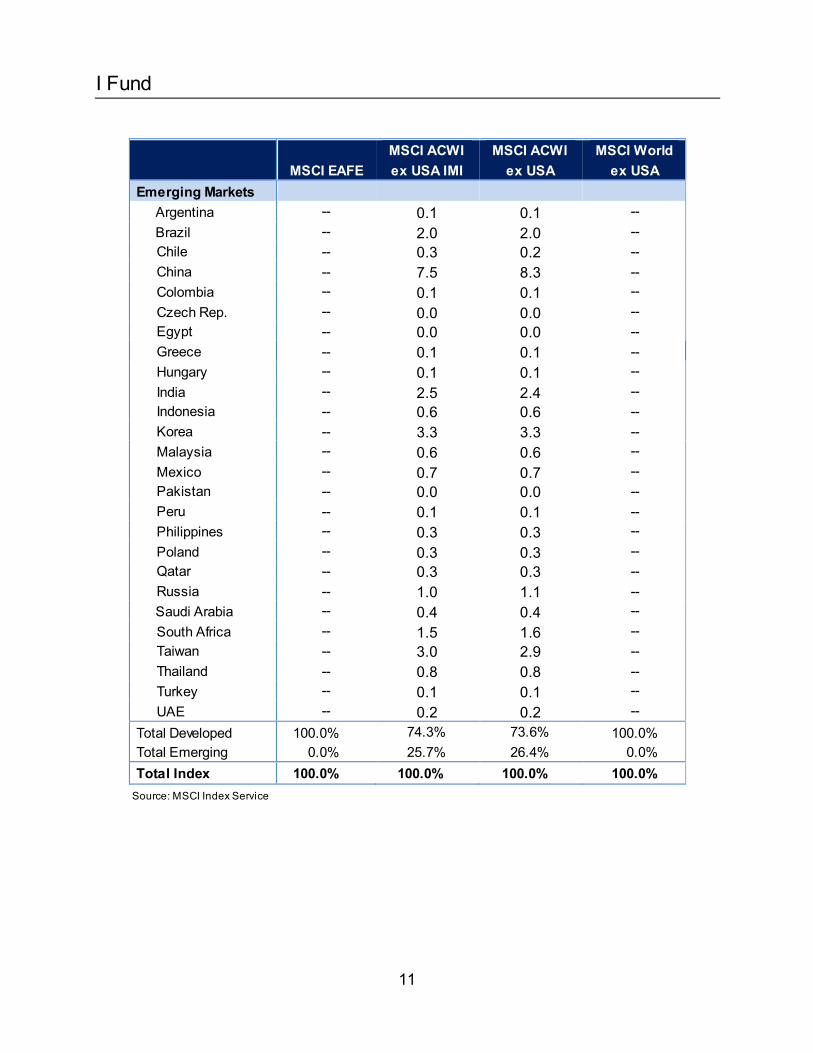
It is also important to note that several emerging market countries have market capitalizations that are greater than several developed countries.
For instance, in the MSCI All Country World ex USA Index, which provides coverage of the large and mid-cap stocks across developed and emerging countries, countries such as Brazil, China, India, Korea, South Africa, and Taiwan have market capitalizations that are greater than those of several EAFE countries (Austria, Denmark, Ireland, New Zealand, Norway, Portugal, and Singapore).
MSCI EAFE
MSCI ACWI ex USA IMI
MSCI ACWI ex USA
MSCI World ex USA
Inclusion criteria Targets 85% market-cap
coverage of each country
(Large and Mid Cap)
Targets 99% market-cap
coverage of each country (Large, Mid, and Small
Cap)
Same as MSCI EAFE Index
Same as MSCI EAFE Index
Country coverage 21 developed
market countries
22 developed countries + 26
emerging market countries
22 developed countries + 26
emerging market countries
22 developed countries
(EAFE plus Canada)
Coverage of non-U.S. equity markets
58% 99% 85% 65%
# of securities 923 6,413 2,206 1,012 Market cap $14.0 trillion $24.2 trillion $20.9 trillion $15.4 trillion Reconstitution frequency
Quarterly Quarterly Quarterly Quarterly
Turnover1 4.0% 5.2% 5.1% 4.2%
I Fund
10
Table 2: Country allocations (as of June 30, 2019)
MSCI EAFE MSCI ACWI ex USA IMI
MSCI ACWI ex USA
MSCI World ex USA
Developed Markets Australia 7.1% 4.9% 4.7% 6.4% Austria 0.2 0.2 0.2 0.2 Belgium 1.0 0.8 0.7 0.9 Canada - 6.8 6.8 9.3 Denmark 1.7 1.2 1.1 1.6 Finland 1.0 0.7 0.7 0.9 Israel 0.6 0.5 0.4 0.5 France 11.4 6.9 7.6 10.3 Germany 8.8 5.7 5.9 8.0 Hong Kong 4.0 2.5 2.7 3.6 Ireland 0.5 0.4 0.4 0.5 Italy 2.3 1.7 1.5 2.1 Japan 23.7 16.6 15.8 21.5 Netherlands 3.6 2.4 2.4 3.3 New Zealand 0.2 0.2 0.2 0.2 Norway 0.7 0.6 0.4 0.6 Portugal 0.2 0.1 0.1 0.1 Singapore 1.3 1.0 0.9 1.2 Spain 3.0 1.9 2.0 2.7 Sweden 2.6 2.1 1.8 2.4 Switzerland 9.3 5.8 6.2 8.4 U.K. 16.8 11.4 11.2 15.2
I Fund
11
MSCI EAFE MSCI ACWI ex USA IMI
MSCI ACWI ex USA
MSCI World ex USA
Emerging Markets Argentina -- 0.1 0.1 -- Brazil -- 2.0 2.0 -- Chile -- 0.3 0.2 -- China -- 7.5 8.3 -- Colombia -- 0.1 0.1 -- Czech Rep. -- 0.0 0.0 -- Egypt -- 0.0 0.0 -- Greece -- 0.1 0.1 -- Hungary -- 0.1 0.1 -- India -- 2.5 2.4 -- Indonesia -- 0.6 0.6 -- Korea -- 3.3 3.3 -- Malaysia -- 0.6 0.6 -- Mexico -- 0.7 0.7 -- Pakistan -- 0.0 0.0 -- Peru -- 0.1 0.1 -- Philippines -- 0.3 0.3 -- Poland -- 0.3 0.3 -- Qatar -- 0.3 0.3 -- Russia -- 1.0 1.1 -- Saudi Arabia -- 0.4 0.4 -- South Africa -- 1.5 1.6 -- Taiwan -- 3.0 2.9 -- Thailand -- 0.8 0.8 -- Turkey -- 0.1 0.1 -- UAE -- 0.2 0.2 --
Total Developed 100.0% 74.3% 73.6% 100.0% Total Emerging 0.0% 25.7% 26.4% 0.0% Total Index 100.0% 100.0% 100.0% 100.0%
Source: MSCI Index Service
I Fund
12
Investability & Liquidity All the benchmarks under consideration take into account the liquidity of stocks for inclusion in the index. Although some stocks in certain smaller countries can be difficult to trade, index fund managers still hold most, if not all stocks, though they may have a higher tolerance for mis-weights, as the benefit from fully replicating the benchmark can be more than offset by transaction costs.
Investors have become increasingly interested in the non-U.S. equity markets over the past decade. Institutional investors have embraced non-U.S. equity as an essential asset class in the asset allocation plan. Liquidity in the non-U.S. equity-related index products has increased substantially as a result.
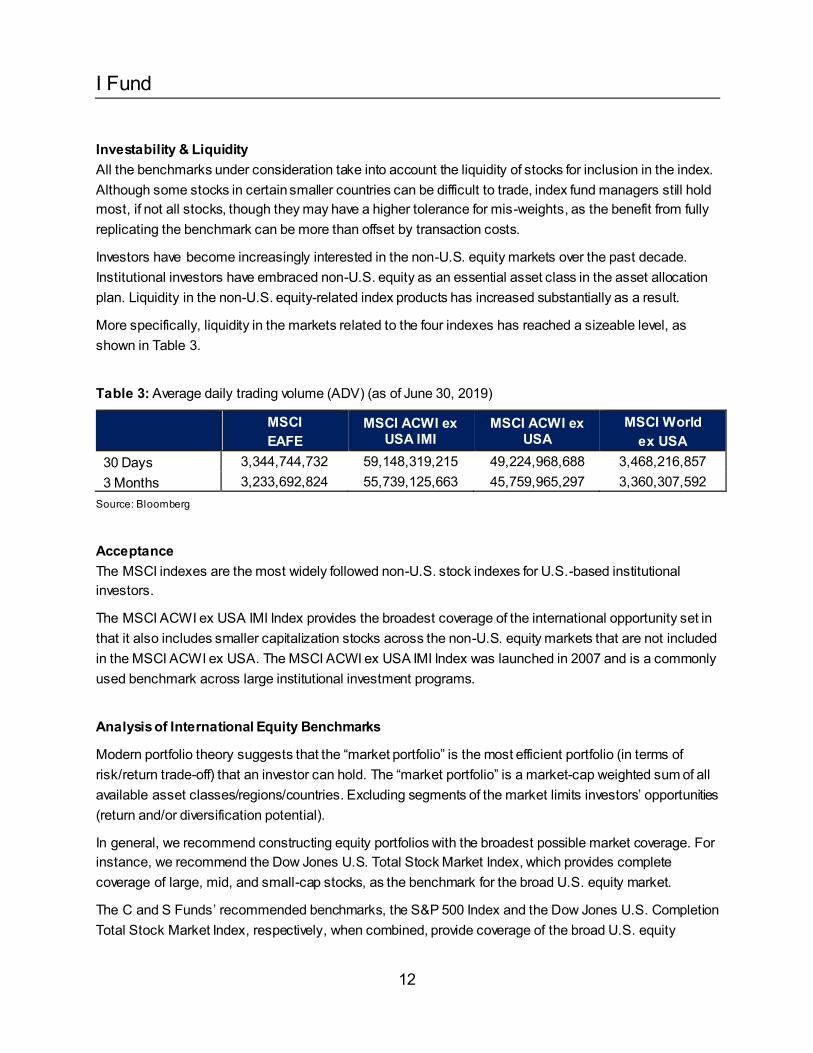
More specifically, liquidity in the markets related to the four indexes has reached a sizeable level, as shown in Table 3.
Table 3: Average daily trading volume (ADV) (as of June 30, 2019)
MSCI EAFE
MSCI ACWI ex USA IMI
MSCI ACWI ex USA
MSCI World ex USA
30 Days 3,344,744,732 59,148,319,215 49,224,968,688 3,468,216,857 3 Months 3,233,692,824 55,739,125,663 45,759,965,297 3,360,307,592
Source: Bloomberg
Acceptance The MSCI indexes are the most widely followed non-U.S. stock indexes for U.S.-based institutional investors.
The MSCI ACWI ex USA IMI Index provides the broadest coverage of the international opportunity set in that it also includes smaller capitalization stocks across the non-U.S. equity markets that are not included in the MSCI ACWI ex USA. The MSCI ACWI ex USA IMI Index was launched in 2007 and is a commonly used benchmark across large institutional investment programs.
Analysis of International Equity Benchmarks
Modern portfolio theory suggests that the “market portfolio” is the most efficient portfolio (in terms of risk/return trade-off) that an investor can hold. The “market portfolio” is a market-cap weighted sum of all available asset classes/regions/countries. Excluding segments of the market limits investors’ opportunities (return and/or diversification potential).
In general, we recommend constructing equity portfolios with the broadest possible market coverage. For instance, we recommend the Dow Jones U.S. Total Stock Market Index, which provides complete coverage of large, mid, and small-cap stocks, as the benchmark for the broad U.S. equity market.
The C and S Funds’ recommended benchmarks, the S&P 500 Index and the Dow Jones U.S. Completion Total Stock Market Index, respectively, when combined, provide coverage of the broad U.S. equity
I Fund
13
opportunity set that is very similar to the coverage provided by the Dow Jones U.S. Total Stock Market Index.
The I Fund’s existing benchmark, the MSCI EAFE Index, excludes Canada and the emerging markets. As noted earlier, the Canadian equity market is the fourth-largest developed equity market outside of the United States, and emerging markets represent nearly a fourth of the non-U.S. equity opportunity set. Moreover, emerging markets represent a significant and growing portion of global growth or GDP and an increasingly larger portion of the world equity market capitalization. Over the past two decades, emerging economies, such as Brazil, China, India, Russia and South Africa, have expanded at a much faster pace than developed countries.
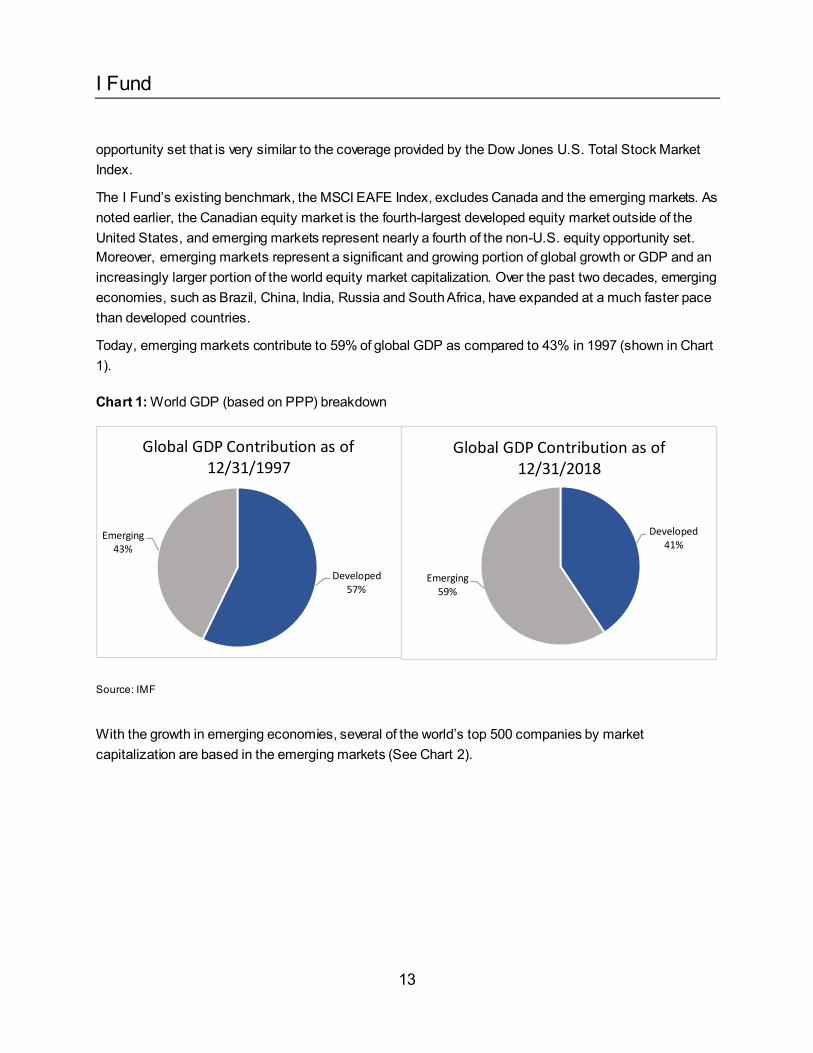
Today, emerging markets contribute to 59% of global GDP as compared to 43% in 1997 (shown in Chart 1).
Chart 1: World GDP (based on PPP) breakdown
Source: IMF
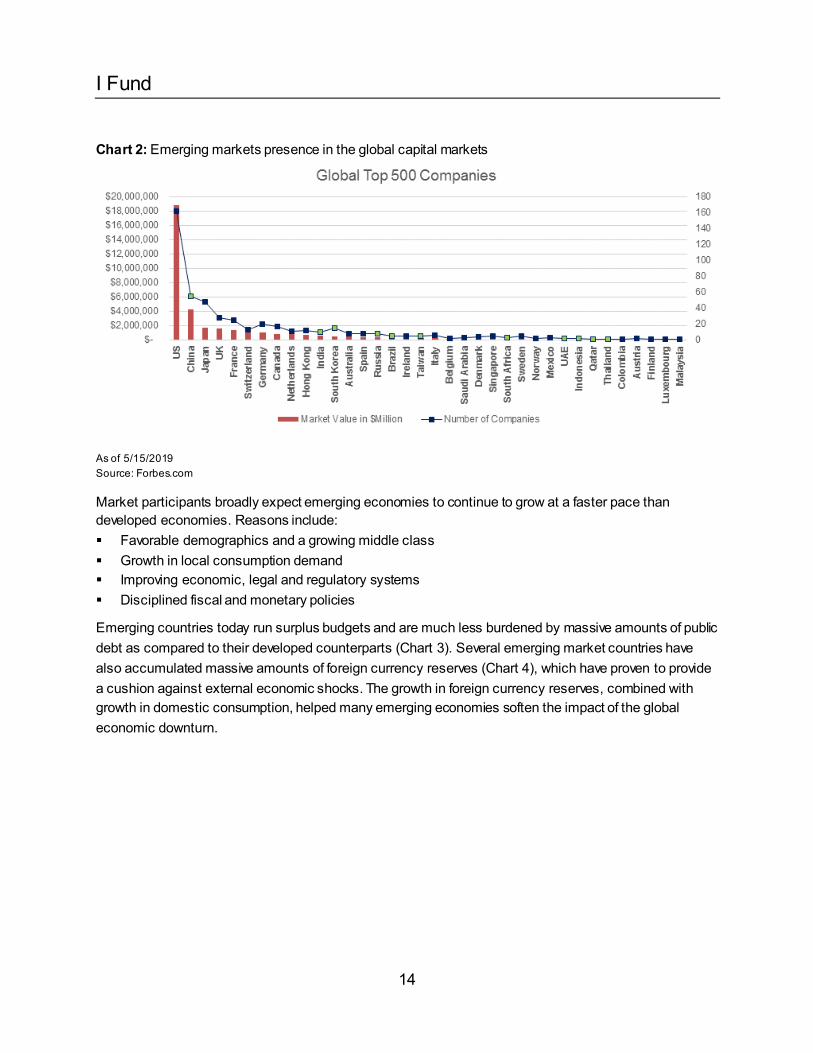
With the growth in emerging economies, several of the world’s top 500 companies by market capitalization are based in the emerging markets (See Chart 2).
Developed 57%
Emerging43%
Global GDP Contribution as of 12/31/1997
Developed 41%
Emerging59%
Global GDP Contribution as of 12/31/2018
I Fund
14
Chart 2: Emerging markets presence in the global capital markets
As of 5/15/2019 Source: Forbes.com
Market participants broadly expect emerging economies to continue to grow at a faster pace than developed economies. Reasons include: ▪ Favorable demographics and a growing middle class ▪ Growth in local consumption demand ▪ Improving economic, legal and regulatory systems ▪ Disciplined fiscal and monetary policies
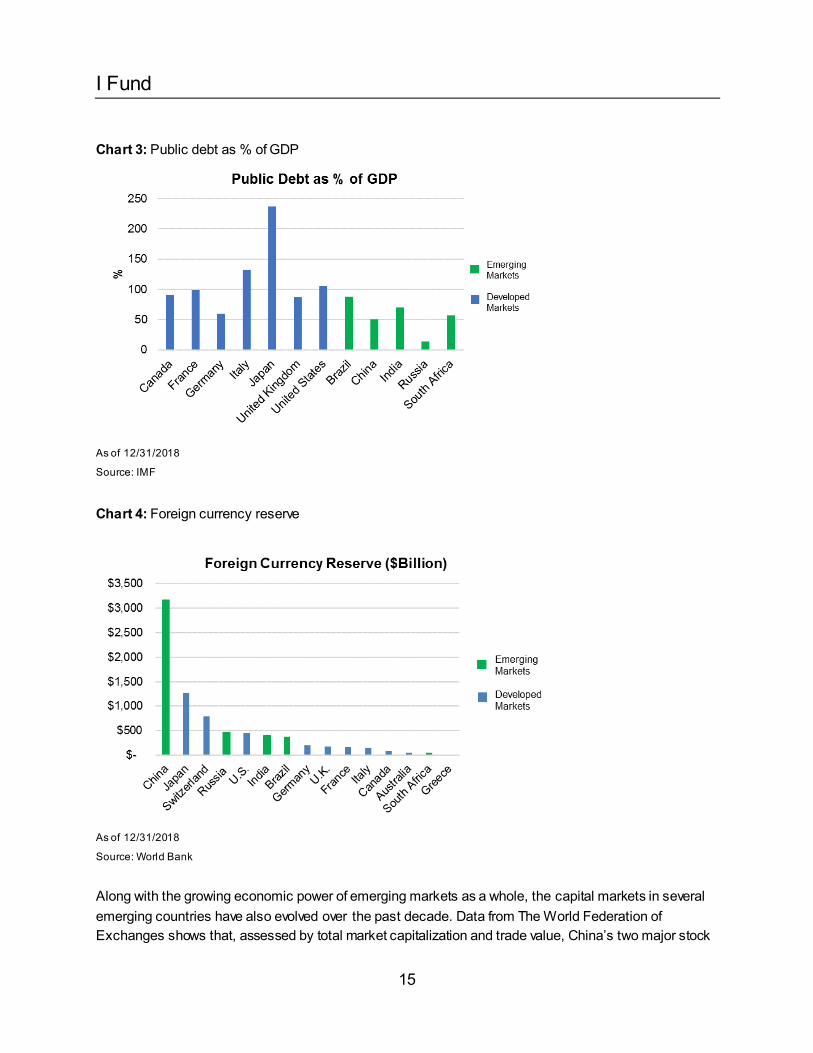
Emerging countries today run surplus budgets and are much less burdened by massive amounts of public debt as compared to their developed counterparts (Chart 3). Several emerging market countries have also accumulated massive amounts of foreign currency reserves (Chart 4), which have proven to provide a cushion against external economic shocks. The growth in foreign currency reserves, combined with growth in domestic consumption, helped many emerging economies soften the impact of the global economic downturn.
I Fund
15
Chart 3: Public debt as % of GDP
As of 12/31/2018
Source: IMF
Chart 4: Foreign currency reserve
As of 12/31/2018
Source: World Bank
Along with the growing economic power of emerging markets as a whole, the capital markets in several emerging countries have also evolved over the past decade. Data from The World Federation of Exchanges shows that, assessed by total market capitalization and trade value, China’s two major stock
I Fund
16
exchanges, if combined, rank third-largest in the world after the New York Stock Exchange and NASDAQ. Other emerging countries such as Brazil, India, Russia, South Africa, and Korea also claimed spots within the top-20 stock exchanges at the end of 2018. With the improved liquidity and transparency, lower transaction costs, and improved property rights and legal protections, institutional investors have become more comfortable investing in emerging markets.
While the case for investing in emerging markets has become more compelling, emerging markets have experienced, and, in our opinion, will continue to experience greater volatility than that of developed markets. Some of the risks in emerging markets include: ▪ Political risk (rogue regimes, expropriation of assets, etc.) ▪ Slowing down or a reversal of favorable economic and monetary policies ▪ A higher willingness based on historical experience to default or devalue their currencies ▪ Growth that is heavily dependent on or tied to growth in developed markets (exports, commodities,
etc.)
While several of these risks are not easily quantified, we do believe investors are compensated for these risks on a risk-adjusted basis. The volatility of emerging markets has been higher than developed markets over the last decade or two, but emerging markets have been able to outperform developed markets on a risk-adjusted basis.
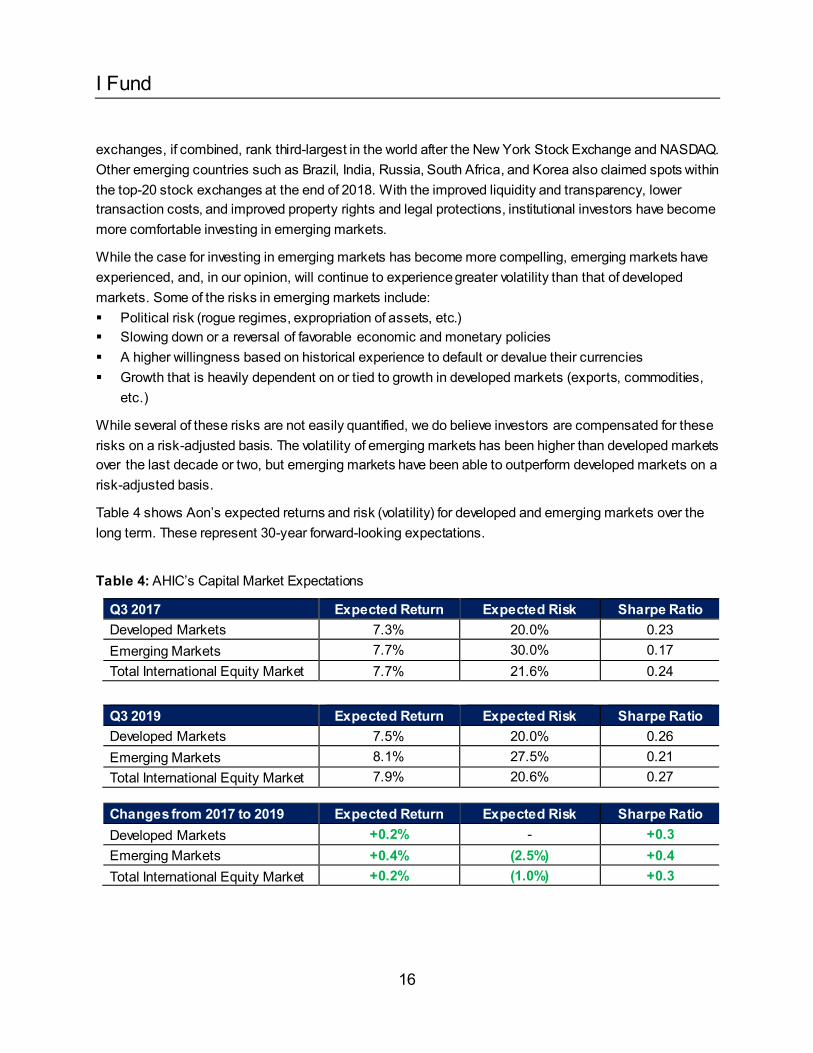
Table 4 shows Aon’s expected returns and risk (volatility) for developed and emerging markets over the long term. These represent 30-year forward-looking expectations.
Table 4: AHIC’s Capital Market Expectations
Q3 2017 Expected Return Expected Risk Sharpe Ratio Developed Markets 7.3% 20.0% 0.23 Emerging Markets 7.7% 30.0% 0.17 Total International Equity Market 7.7% 21.6% 0.24
Q3 2019 Expected Return Expected Risk Sharpe Ratio Developed Markets 7.5% 20.0% 0.26 Emerging Markets 8.1% 27.5% 0.21 Total International Equity Market 7.9% 20.6% 0.27
Changes from 2017 to 2019 Expected Return Expected Risk Sharpe Ratio Developed Markets +0.2% - +0.3 Emerging Markets +0.4% (2.5%) +0.4 Total International Equity Market +0.2% (1.0%) +0.3
I Fund
17
As shown, we expect emerging markets to perform favorably as compared to developed markets, but at a higher level of risk.
As for non-U.S. small cap stocks, because commonly used benchmarks for international equity, MSCI EAFE and MSCI ACWI ex USA indexes, do not contain small cap names, we believe that non-U.S. small cap stocks are under-invested relative to their U.S. small cap peers. Additionally, relative to larger peers, smaller companies in the index are covered by a smaller pool of sell-side analysts. This under-investment and lack of analyst coverage may lead to less market efficiency and a greater return potential.
Non-U.S. small cap stocks are also tied more to their local economies than to the global economy. The lack of connection to the global economy should provide lower correlations to the broader equity market. Consequently, we believe that adding non-U.S. small cap exposure will likely improve the Sharpe Ratio of the overall non-U.S. equity portfolio.
The broad non-U.S. equity market is of significant market size and index assets under management are large. The broad non-U.S. equity market provides diversification across country, sector, and market capitalization. By broadening the exposure of the I Fund, it will increase stock coverage by 1,282 stocks in the case of the MSCI ACWI ex USA Index and 5,473 stocks in the case of the MSCI ACWI ex USA IMI Index as of July 31, 2019.
Overall, we favor a benchmark that includes Canada, emerging markets, and international small cap equities, as it provides broader coverage of the international equity markets, more fully captures global growth, and provides enhanced diversification of the international equity portfol io. From a theoretical standpoint, we recommend that clients utilize the MSCI ACWI ex USA Index or MSCI ACWI ex USA IMI Index as these indexes provide complete coverage of the global equity opportunity set.
However, as we consider an appropriate benchmark for the I Fund, it is important to take into account the Thrift Savings Plan’s unique circumstances. These include: ▪ Need to provide daily liquidity ▪ Transition cost and planning ▪ Securities lending income ▪ Administrative complexities: coordinating custody account openings in emerging markets, which are
generally more complex and time consuming. Considerations in Expanding the I Fund benchmark to Index Emerging Markets As we review the I Fund’s current benchmark, the MSCI EAFE Index, the case to include Canada is very compelling and logical given that it is the fourth-largest developed equity market outside the U.S.
One of the main considerations in expanding the I Fund benchmark to include emerging markets and international small cap equities is the need to provide daily liquidity. A sufficient level of cash must be maintained in the Fund to meet participant withdrawal needs.
I Fund
18
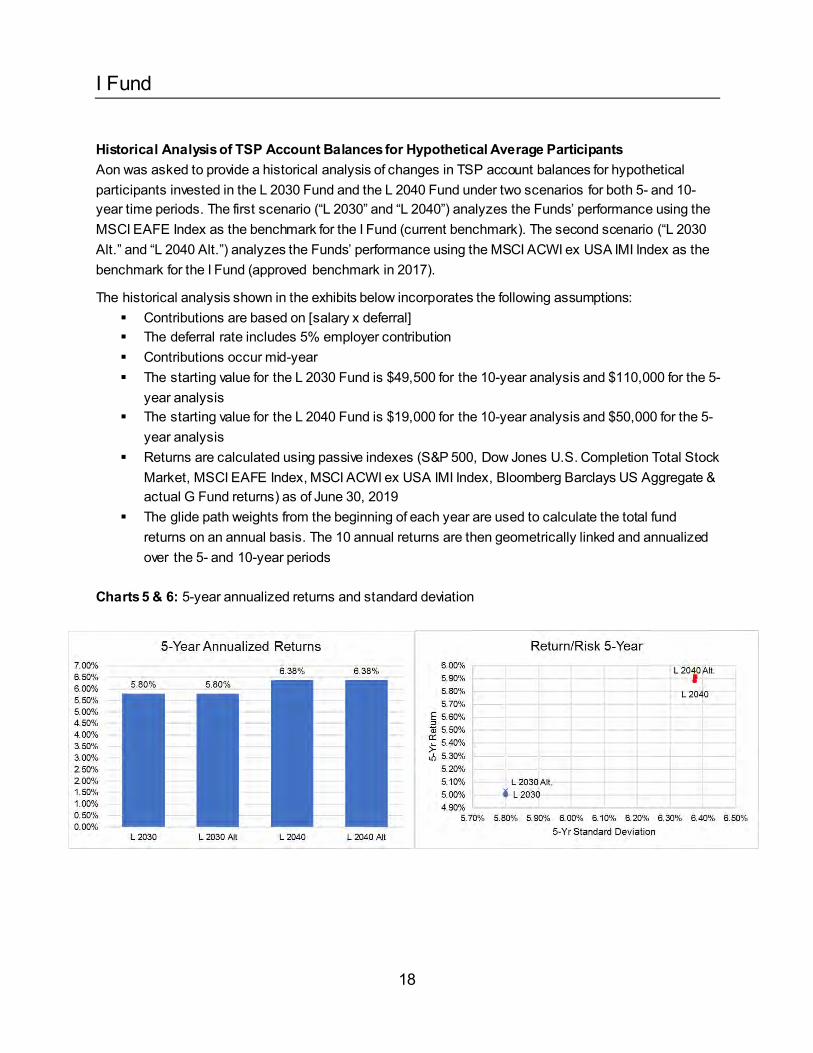
Historical Analysis of TSP Account Balances for Hypothetical Average Participants Aon was asked to provide a historical analysis of changes in TSP account balances for hypothetical participants invested in the L 2030 Fund and the L 2040 Fund under two scenarios for both 5- and 10-year time periods. The first scenario (“L 2030” and “L 2040”) analyzes the Funds’ performance using the MSCI EAFE Index as the benchmark for the I Fund (current benchmark). The second scenario (“L 2030 Alt.” and “L 2040 Alt.”) analyzes the Funds’ performance using the MSCI ACWI ex USA IMI Index as the benchmark for the I Fund (approved benchmark in 2017).
The historical analysis shown in the exhibits below incorporates the following assumptions: ▪ Contributions are based on [salary x deferral] ▪ The deferral rate includes 5% employer contribution ▪ Contributions occur mid-year ▪ The starting value for the L 2030 Fund is $49,500 for the 10-year analysis and $110,000 for the 5-
year analysis ▪ The starting value for the L 2040 Fund is $19,000 for the 10-year analysis and $50,000 for the 5-
year analysis ▪ Returns are calculated using passive indexes (S&P 500, Dow Jones U.S. Completion Total Stock
Market, MSCI EAFE Index, MSCI ACWI ex USA IMI Index, Bloomberg Barclays US Aggregate & actual G Fund returns) as of June 30, 2019
▪ The glide path weights from the beginning of each year are used to calculate the total fund returns on an annual basis. The 10 annual returns are then geometrically linked and annualized over the 5- and 10-year periods
Charts 5 & 6: 5-year annualized returns and standard deviation
I Fund
19
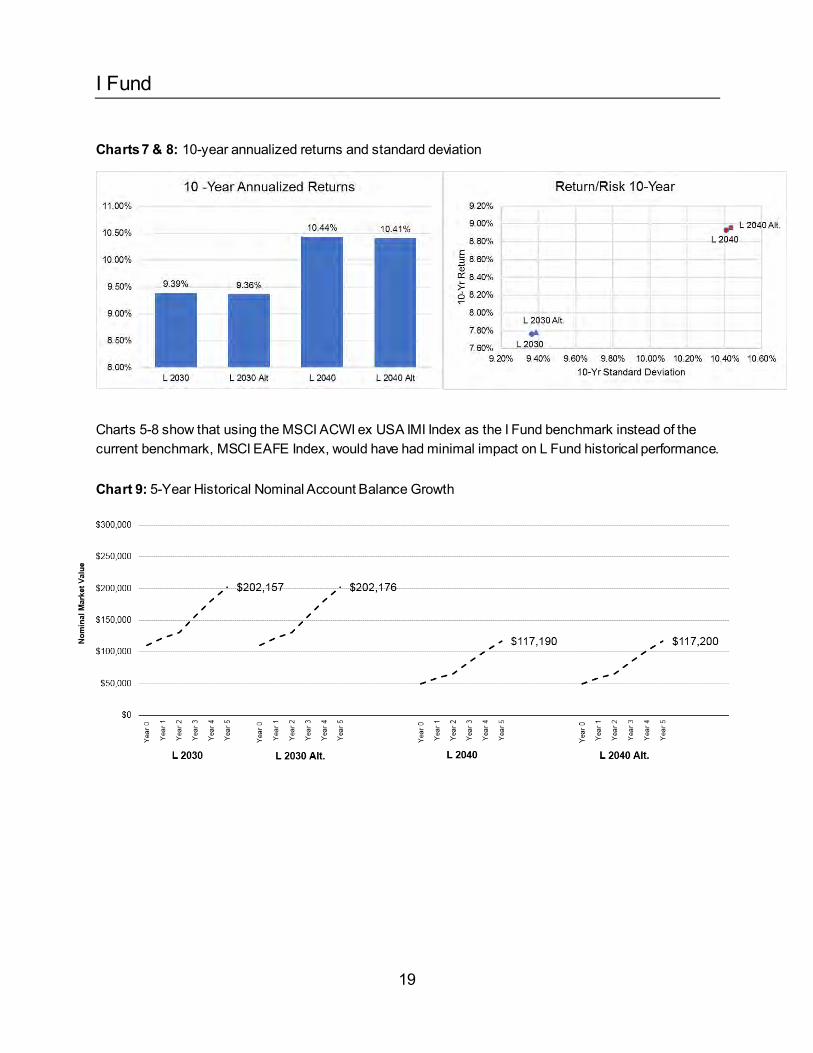
Charts 7 & 8: 10-year annualized returns and standard deviation
Charts 5-8 show that using the MSCI ACWI ex USA IMI Index as the I Fund benchmark instead of the current benchmark, MSCI EAFE Index, would have had minimal impact on L Fund historical performance. Chart 9: 5-Year Historical Nominal Account Balance Growth
I Fund
20
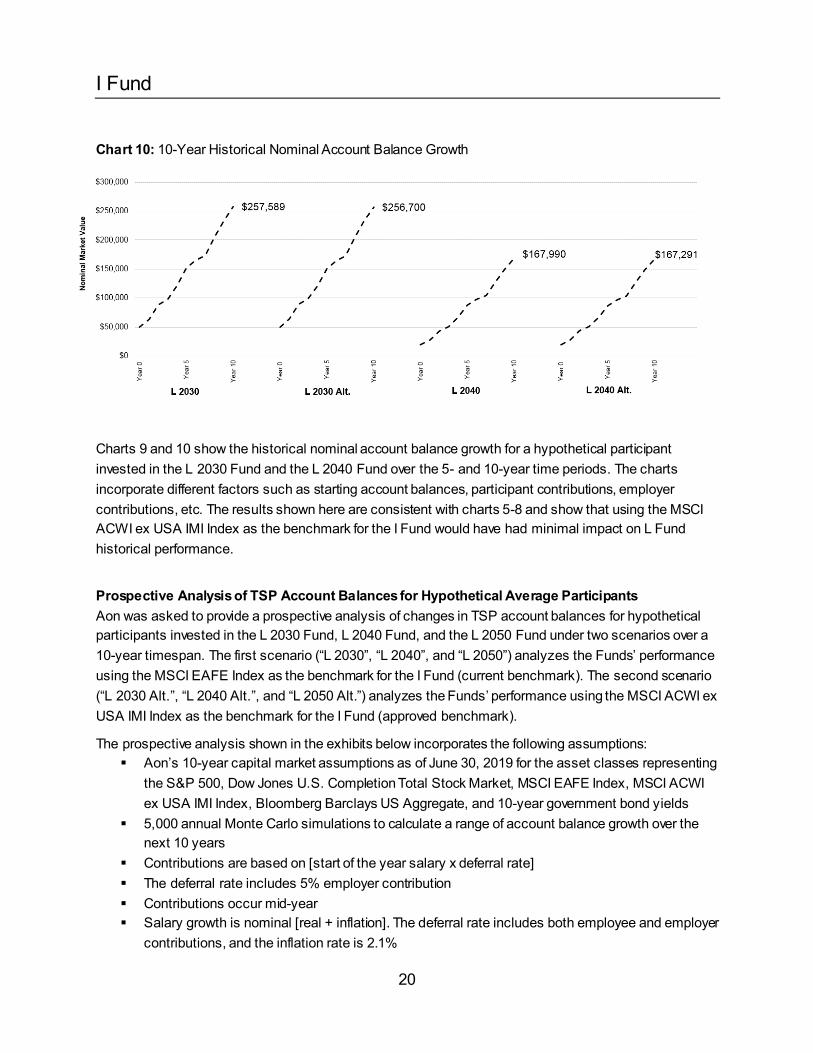
Chart 10: 10-Year Historical Nominal Account Balance Growth
Charts 9 and 10 show the historical nominal account balance growth for a hypothetical participant invested in the L 2030 Fund and the L 2040 Fund over the 5- and 10-year time periods. The charts incorporate different factors such as starting account balances, participant contributions, employer contributions, etc. The results shown here are consistent with charts 5-8 and show that using the MSCI ACWI ex USA IMI Index as the benchmark for the I Fund would have had minimal impact on L Fund historical performance.
Prospective Analysis of TSP Account Balances for Hypothetical Average Participants Aon was asked to provide a prospective analysis of changes in TSP account balances for hypothetical participants invested in the L 2030 Fund, L 2040 Fund, and the L 2050 Fund under two scenarios over a 10-year timespan. The first scenario (“L 2030”, “L 2040”, and “L 2050”) analyzes the Funds’ performance using the MSCI EAFE Index as the benchmark for the I Fund (current benchmark). The second scenario (“L 2030 Alt.”, “L 2040 Alt.”, and “L 2050 Alt.”) analyzes the Funds’ performance using the MSCI ACWI ex USA IMI Index as the benchmark for the I Fund (approved benchmark).
The prospective analysis shown in the exhibits below incorporates the following assumptions: ▪ Aon’s 10-year capital market assumptions as of June 30, 2019 for the asset classes representing
the S&P 500, Dow Jones U.S. Completion Total Stock Market, MSCI EAFE Index, MSCI ACWI ex USA IMI Index, Bloomberg Barclays US Aggregate, and 10-year government bond yields
▪ 5,000 annual Monte Carlo simulations to calculate a range of account balance growth over the next 10 years
▪ Contributions are based on [start of the year salary x deferral rate] ▪ The deferral rate includes 5% employer contribution ▪ Contributions occur mid-year ▪ Salary growth is nominal [real + inflation]. The deferral rate includes both employee and employer
contributions, and the inflation rate is 2.1%
I Fund
21
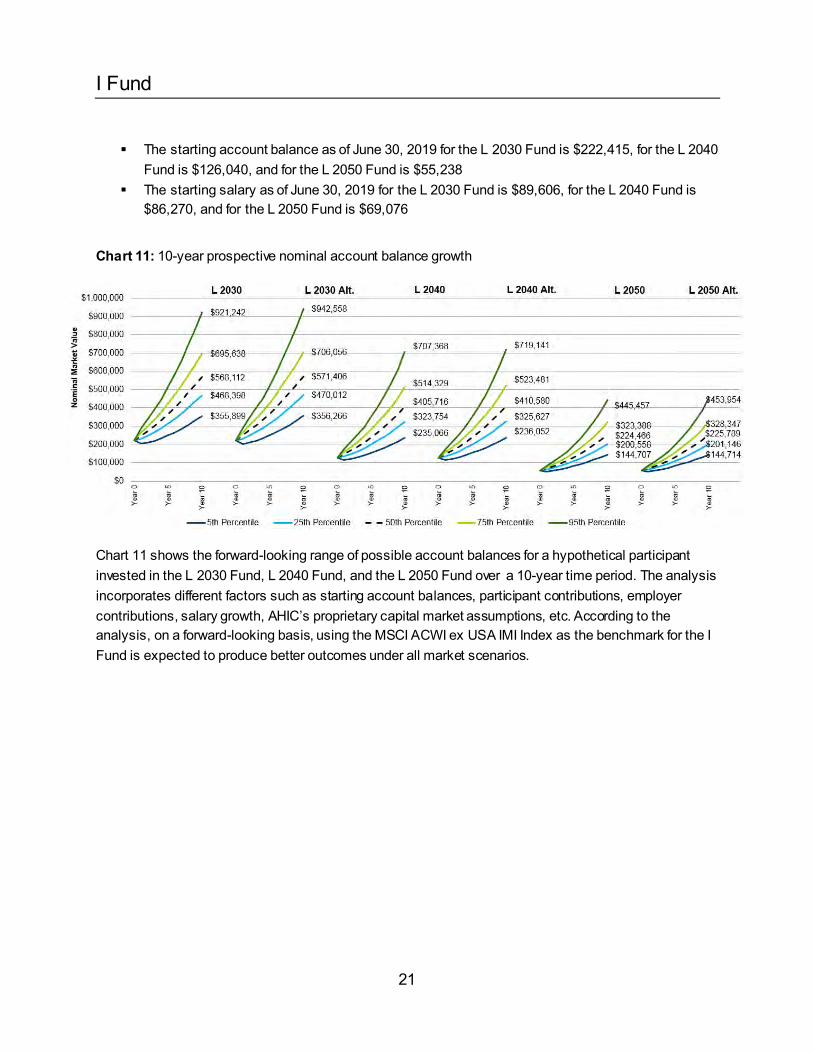
▪ The starting account balance as of June 30, 2019 for the L 2030 Fund is $222,415, for the L 2040 Fund is $126,040, and for the L 2050 Fund is $55,238
▪ The starting salary as of June 30, 2019 for the L 2030 Fund is $89,606, for the L 2040 Fund is $86,270, and for the L 2050 Fund is $69,076
Chart 11: 10-year prospective nominal account balance growth
Chart 11 shows the forward-looking range of possible account balances for a hypothetical participant invested in the L 2030 Fund, L 2040 Fund, and the L 2050 Fund over a 10-year time period. The analysis incorporates different factors such as starting account balances, participant contributions, employer contributions, salary growth, AHIC’s proprietary capital market assumptions, etc. According to the analysis, on a forward-looking basis, using the MSCI ACWI ex USA IMI Index as the benchmark for the I Fund is expected to produce better outcomes under all market scenarios.
I Fund
22
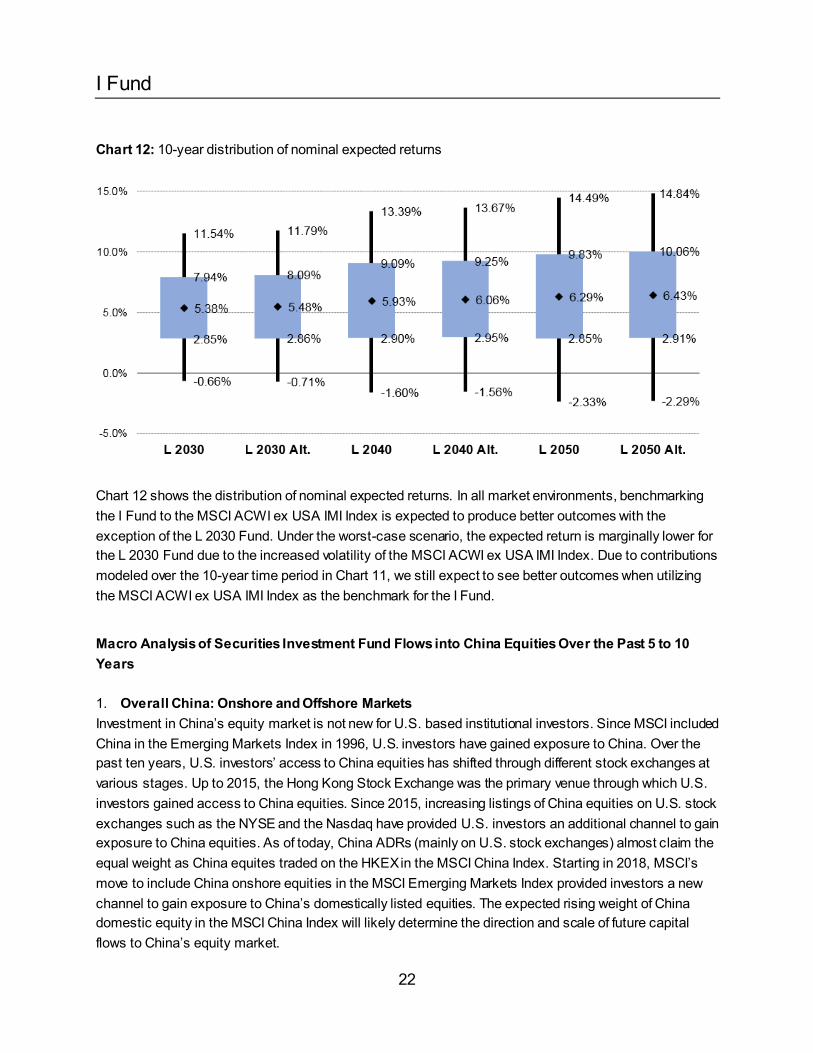
Chart 12: 10-year distribution of nominal expected returns
Chart 12 shows the distribution of nominal expected returns. In all market environments, benchmarking the I Fund to the MSCI ACWI ex USA IMI Index is expected to produce better outcomes with the exception of the L 2030 Fund. Under the worst-case scenario, the expected return is marginally lower for the L 2030 Fund due to the increased volatility of the MSCI ACWI ex USA IMI Index. Due to contributions modeled over the 10-year time period in Chart 11, we still expect to see better outcomes when utilizing the MSCI ACWI ex USA IMI Index as the benchmark for the I Fund.
Macro Analysis of Securities Investment Fund Flows into China Equities Over the Past 5 to 10 Years 1. Overall China: Onshore and Offshore Markets Investment in China’s equity market is not new for U.S. based institutional investors. Since MSCI included China in the Emerging Markets Index in 1996, U.S. investors have gained exposure to China. Over the past ten years, U.S. investors’ access to China equities has shifted through different stock exchanges at various stages. Up to 2015, the Hong Kong Stock Exchange was the primary venue through which U.S. investors gained access to China equities. Since 2015, increasing listings of China equities on U.S. stock exchanges such as the NYSE and the Nasdaq have provided U.S. investors an additional channel to gain exposure to China equities. As of today, China ADRs (mainly on U.S. stock exchanges) almost claim the equal weight as China equites traded on the HKEX in the MSCI China Index. Starting in 2018, MSCI’s move to include China onshore equities in the MSCI Emerging Markets Index provided investors a new channel to gain exposure to China’s domestically listed equities. The expected rising weight of China domestic equity in the MSCI China Index will likely determine the direction and scale of future capital flows to China’s equity market.
I Fund
23
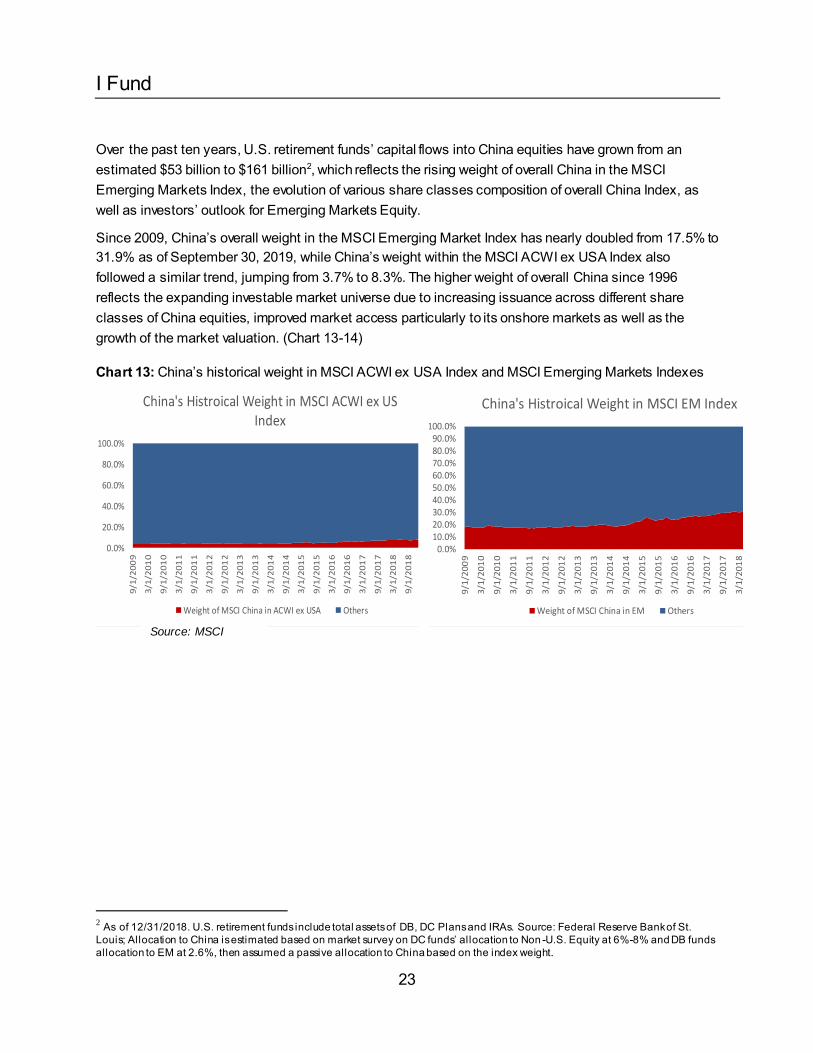
Over the past ten years, U.S. retirement funds’ capital flows into China equities have grown from an estimated $53 billion to $161 billion2, which reflects the rising weight of overall China in the MSCI Emerging Markets Index, the evolution of various share classes composition of overall China Index, as well as investors’ outlook for Emerging Markets Equity.
Since 2009, China’s overall weight in the MSCI Emerging Market Index has nearly doubled from 17.5% to 31.9% as of September 30, 2019, while China’s weight within the MSCI ACWI ex USA Index also followed a similar trend, jumping from 3.7% to 8.3%. The higher weight of overall China since 1996 reflects the expanding investable market universe due to increasing issuance across different share classes of China equities, improved market access particularly to its onshore markets as well as the growth of the market valuation. (Chart 13-14)
Chart 13: China’s historical weight in MSCI ACWI ex USA Index and MSCI Emerging Markets Indexes
2 As of 12/31/2018. U.S. retirement funds include total assets of DB, DC Plans and IRAs. Source: Federal Reserve Bank of St. Louis; Allocation to China is estimated based on market survey on DC funds’ allocation to Non -U.S. Equity at 6%-8% and DB funds allocation to EM at 2.6%, then assumed a passive allocation to China based on the index weight.
0.0%
20.0%
40.0%
60.0%
80.0%
100.0%
9/1
/20
09
3/1
/20
10
9/1
/20
10
3/1
/20
11
9/1
/20
11
3/1
/20
12
9/1
/20
12
3/1
/20
13
9/1
/20
13
3/1
/20
14
9/1
/20
14
3/1
/20
15
9/1
/20
15
3/1
/20
16
9/1
/20
16
3/1
/20
17
9/1
/20
17
3/1
/20
18
9/1
/20
18
3/1
/20
19
9/1
/20
19
China's Histroical Weight in MSCI ACWI ex US Index
Weight of MSCI China in ACWI ex USA Others
0.0%10.0%20.0%30.0%40.0%50.0%60.0%70.0%80.0%90.0%
100.0%
9/1
/20
09
3/1
/20
10
9/1
/20
10
3/1
/20
11
9/1
/20
11
3/1
/20
12
9/1
/20
12
3/1
/20
13
9/1
/20
13
3/1
/20
14
9/1
/20
14
3/1
/20
15
9/1
/20
15
3/1
/20
16
9/1
/20
16
3/1
/20
17
9/1
/20
17
3/1
/20
18
9/1
/20
18
3/1
/20
19
9/1
/20
19
China's Histroical Weight in MSCI EM Index
Weight of MSCI China in EM Others
Source: MSCI
I Fund
24
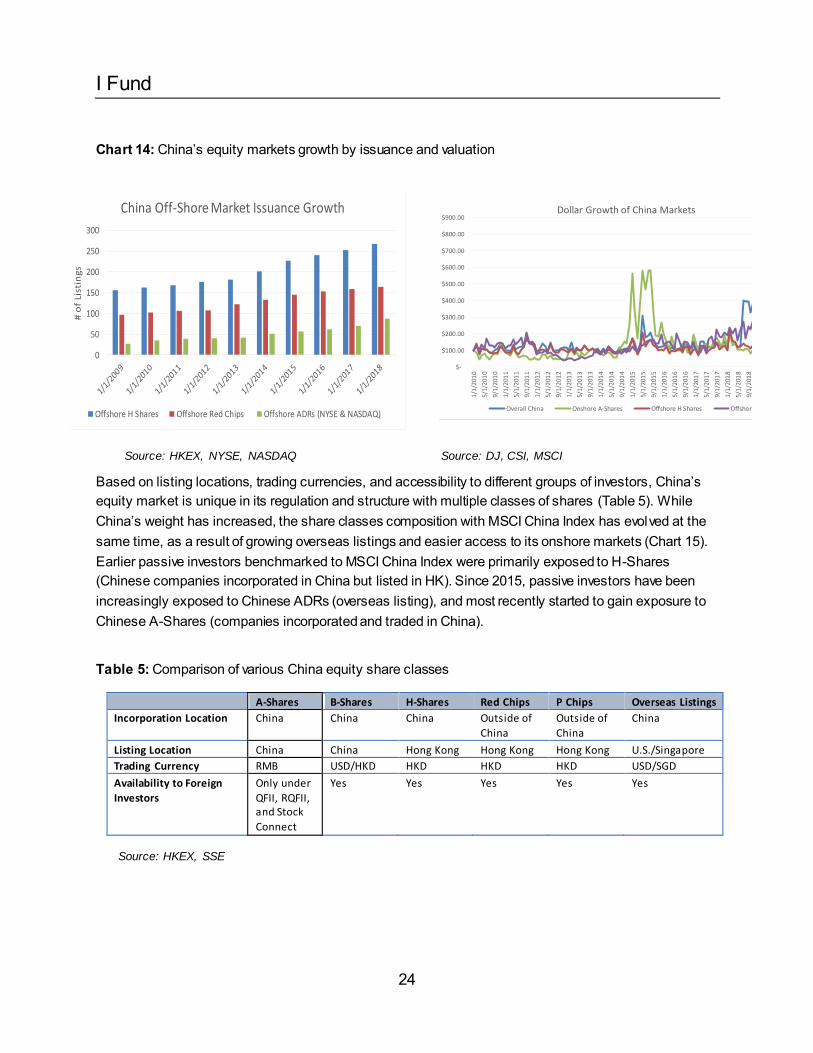
Chart 14: China’s equity markets growth by issuance and valuation
Based on listing locations, trading currencies, and accessibility to different groups of investors, China’s equity market is unique in its regulation and structure with multiple classes of shares (Table 5). While China’s weight has increased, the share classes composition with MSCI China Index has evolved at the same time, as a result of growing overseas listings and easier access to its onshore markets (Chart 15). Earlier passive investors benchmarked to MSCI China Index were primarily exposed to H-Shares (Chinese companies incorporated in China but listed in HK). Since 2015, passive investors have been increasingly exposed to Chinese ADRs (overseas listing), and most recently started to gain exposure to Chinese A-Shares (companies incorporated and traded in China).
Table 5: Comparison of various China equity share classes
0
50
100
150
200
250
300
# o
f Li
stin
gs
China Off-Shore Market Issuance Growth
Offshore H Shares Offshore Red Chips Offshore ADRs (NYSE & NASDAQ)
$438.10
$121.94 $100.86
$242.25
$-
$100.00
$200.00
$300.00
$400.00
$500.00
$600.00
$700.00
$800.00
$900.00
1/1/
201
0
5/1/
201
0
9/1/
201
0
1/1/
201
1
5/1/
201
1
9/1/
201
1
1/1/
201
2
5/1/
201
2
9/1/
201
2
1/1/
201
3
5/1/
201
3
9/1/
201
3
1/1/
201
4
5/1/
201
4
9/1/
201
4
1/1/
201
5
5/1/
201
5
9/1/
201
5
1/1/
201
6
5/1/
201
6
9/1/
201
6
1/1/
201
7
5/1/
201
7
9/1/
201
7
1/1/
201
8
5/1/
201
8
9/1/
201
8
1/1/
201
9
5/1/
201
9
Dollar Growth of China Markets
Overall China Onshore A-Shares Offshore H Shares Offshore ADRs
A-Shares B-Shares H-Shares Red Chips P Chips Overseas Listings
Incorporation Location China China China Outside of
China
Outside of
China
China
Listing Location China China Hong Kong Hong Kong Hong Kong U.S./Singapore
Trading Currency RMB USD/HKD HKD HKD HKD USD/SGD
Availability to Foreign
Investors
Only under
QFII, RQFII, and Stock
Connect
Yes Yes Yes Yes Yes
Source: HKEX, NYSE, NASDAQ Source: DJ, CSI, MSCI
Source: HKEX, SSE
I Fund
25
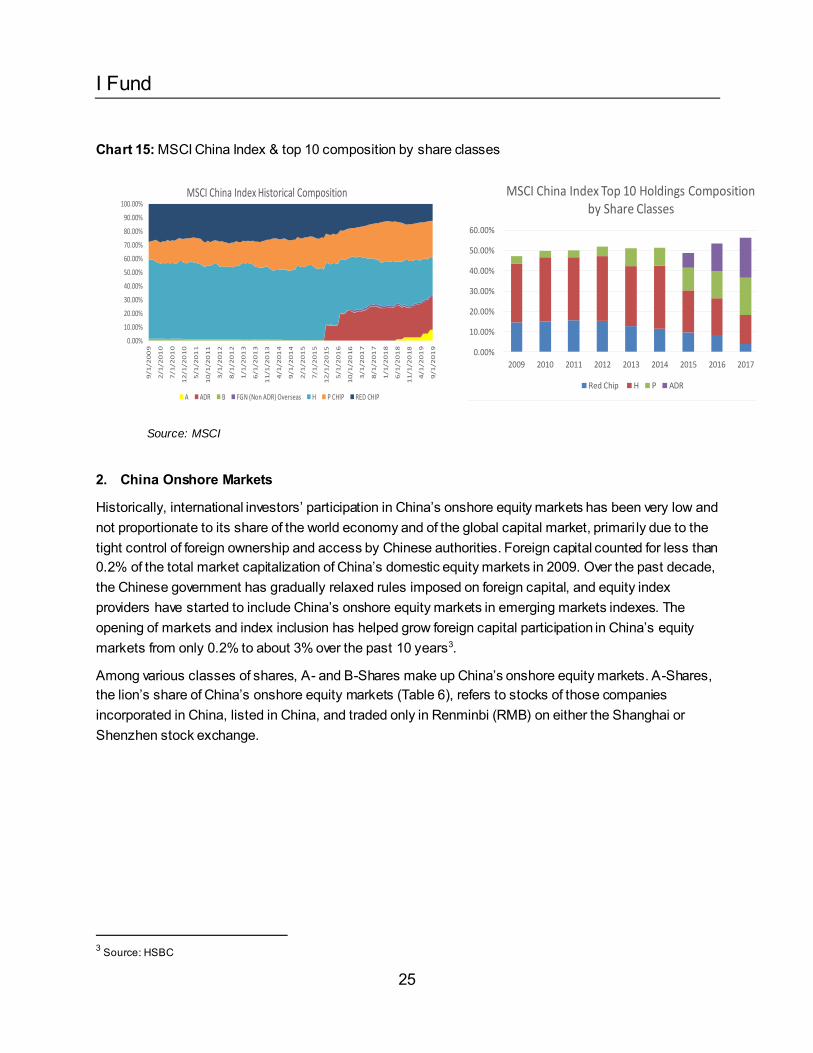
Chart 15: MSCI China Index & top 10 composition by share classes
2. China Onshore Markets
Historically, international investors’ participation in China’s onshore equity markets has been very low and not proportionate to its share of the world economy and of the global capital market, primari ly due to the tight control of foreign ownership and access by Chinese authorities. Foreign capital counted for less than 0.2% of the total market capitalization of China’s domestic equity markets in 2009. Over the past decade, the Chinese government has gradually relaxed rules imposed on foreign capital, and equity index providers have started to include China’s onshore equity markets in emerging markets indexes. The opening of markets and index inclusion has helped grow foreign capital participation in China’s equity markets from only 0.2% to about 3% over the past 10 years3.
Among various classes of shares, A- and B-Shares make up China’s onshore equity markets. A-Shares, the lion’s share of China’s onshore equity markets (Table 6), refers to stocks of those companies incorporated in China, listed in China, and traded only in Renminbi (RMB) on either the Shanghai or Shenzhen stock exchange.
3 Source: HSBC
0.00%
10.00%
20.00%
30.00%
40.00%
50.00%
60.00%
70.00%
80.00%
90.00%
100.00%
9/1
/2
00
9
2/1
/2
01
0
7/1
/2
01
0
12
/1
/2
01
0
5/1
/2
01
1
10
/1
/2
01
1
3/1
/2
01
2
8/1
/2
01
2
1/1
/2
01
3
6/1
/2
01
3
11
/1
/2
01
3
4/1
/2
01
4
9/1
/2
01
4
2/1
/2
01
5
7/1
/2
01
5
12
/1
/2
01
5
5/1
/2
01
6
10
/1
/2
01
6
3/1
/2
01
7
8/1
/2
01
7
1/1
/2
01
8
6/1
/2
01
8
11
/1
/2
01
8
4/1
/2
01
9
9/1
/2
01
9
MSCI China Index Historical Composition
A ADR B FGN (Non ADR) Overseas H P CHIP RED CHIP
0.00%
10.00%
20.00%
30.00%
40.00%
50.00%
60.00%
2009 2010 2011 2012 2013 2014 2015 2016 2017 2018
MSCI China Index Top 10 Holdings Composition by Share Classes
Red Chip H P ADR
Source: MSCI
I Fund
26
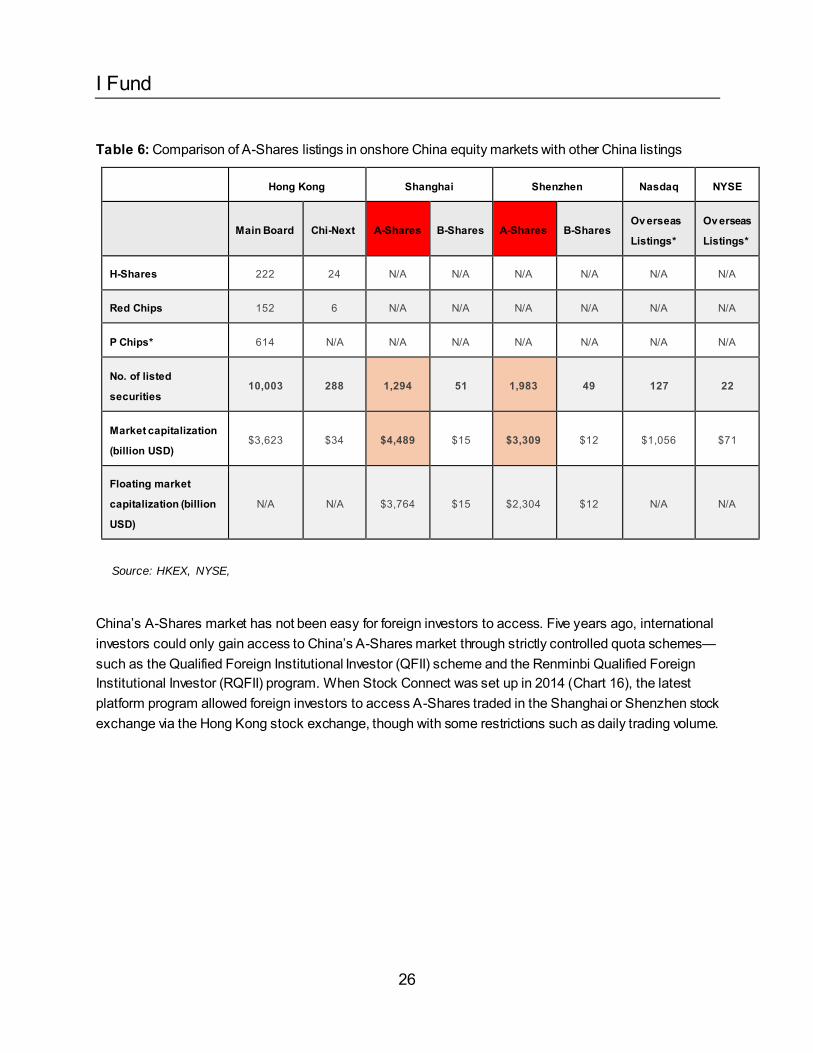
Table 6: Comparison of A-Shares listings in onshore China equity markets with other China listings
Hong Kong Shanghai Shenzhen Nasdaq NYSE
Main Board Chi-Next A-Shares B-Shares A-Shares B-Shares Ov erseas
Listings*
Ov erseas
Listings*
H-Shares 222 24 N/A N/A N/A N/A N/A N/A
Red Chips 152 6 N/A N/A N/A N/A N/A N/A
P Chips* 614 N/A N/A N/A N/A N/A N/A N/A
No. of listed
securities 10,003 288 1,294 51 1,983 49 127 22
Market capitalization
(billion USD) $3,623 $34 $4,489 $15 $3,309 $12 $1,056 $71
Floating market
capitalization (billion
USD)
N/A N/A $3,764 $15 $2,304 $12 N/A N/A
China’s A-Shares market has not been easy for foreign investors to access. Five years ago, international investors could only gain access to China’s A-Shares market through strictly controlled quota schemes—such as the Qualified Foreign Institutional Investor (QFII) scheme and the Renminbi Qualified Foreign Institutional Investor (RQFII) program. When Stock Connect was set up in 2014 (Chart 16), the latest platform program allowed foreign investors to access A-Shares traded in the Shanghai or Shenzhen stock exchange via the Hong Kong stock exchange, though with some restrictions such as daily trading volume.
Source: HKEX, NYSE,
NASDAQ, *As of
5/31/2017
I Fund
27
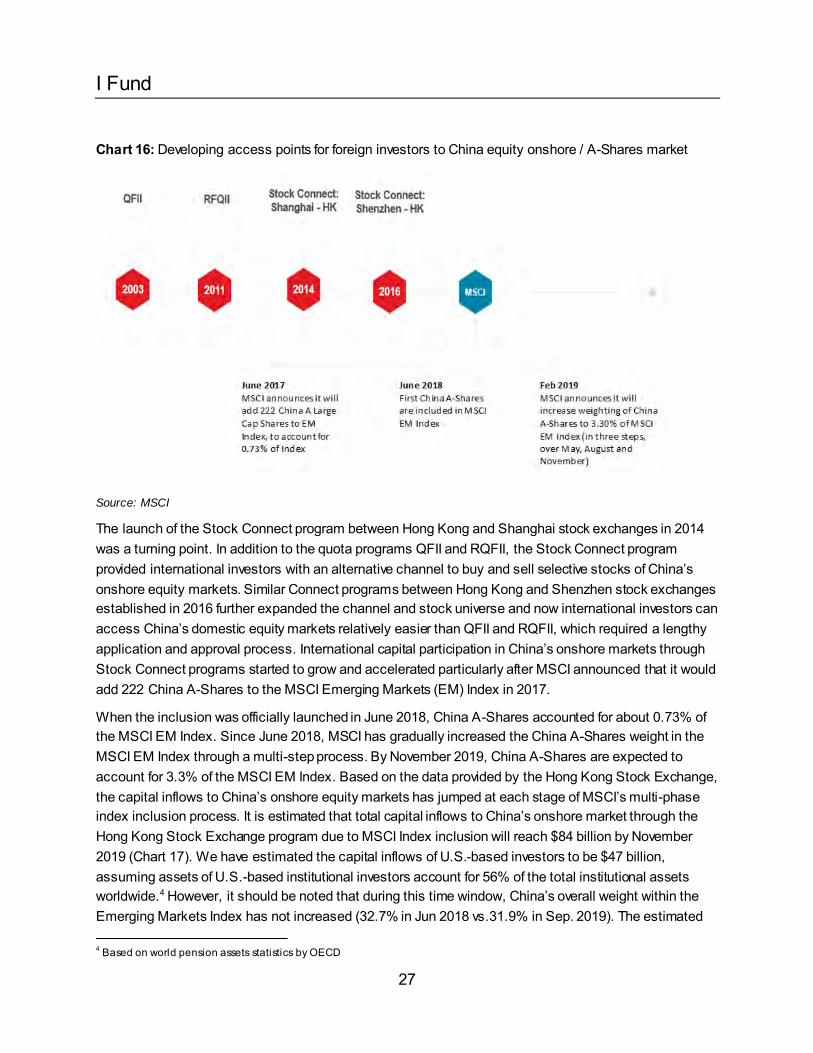
Chart 16: Developing access points for foreign investors to China equity onshore / A-Shares market
Source: MSCI
The launch of the Stock Connect program between Hong Kong and Shanghai stock exchanges in 2014 was a turning point. In addition to the quota programs QFII and RQFII, the Stock Connect program provided international investors with an alternative channel to buy and sell selective stocks of China’s onshore equity markets. Similar Connect programs between Hong Kong and Shenzhen stock exchanges established in 2016 further expanded the channel and stock universe and now international investors can access China’s domestic equity markets relatively easier than QFII and RQFII, which required a lengthy application and approval process. International capital participation in China’s onshore markets through Stock Connect programs started to grow and accelerated particularly after MSCI announced that it would add 222 China A-Shares to the MSCI Emerging Markets (EM) Index in 2017.
When the inclusion was officially launched in June 2018, China A-Shares accounted for about 0.73% of the MSCI EM Index. Since June 2018, MSCI has gradually increased the China A-Shares weight in the MSCI EM Index through a multi-step process. By November 2019, China A-Shares are expected to account for 3.3% of the MSCI EM Index. Based on the data provided by the Hong Kong Stock Exchange, the capital inflows to China’s onshore equity markets has jumped at each stage of MSCI’s multi-phase index inclusion process. It is estimated that total capital inflows to China’s onshore market through the Hong Kong Stock Exchange program due to MSCI Index inclusion will reach $84 billion by November 2019 (Chart 17). We have estimated the capital inflows of U.S.-based investors to be $47 billion, assuming assets of U.S.-based institutional investors account for 56% of the total institutional assets worldwide.4 However, it should be noted that during this time window, China’s overall weight within the Emerging Markets Index has not increased (32.7% in Jun 2018 vs.31.9% in Sep. 2019). The estimated 4 Based on world pension assets statistics by OECD
I Fund
28
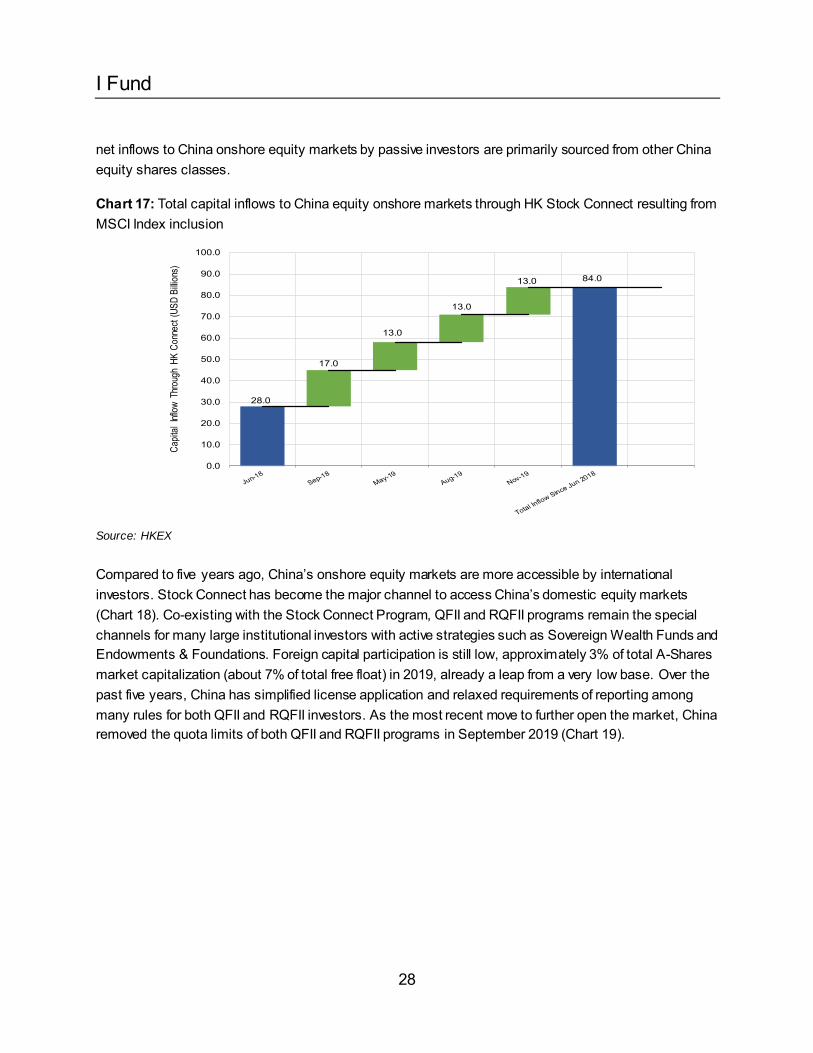
net inflows to China onshore equity markets by passive investors are primarily sourced from other China equity shares classes.
Chart 17: Total capital inflows to China equity onshore markets through HK Stock Connect resulting from MSCI Index inclusion
Source: HKEX
Compared to five years ago, China’s onshore equity markets are more accessible by international investors. Stock Connect has become the major channel to access China’s domestic equity markets (Chart 18). Co-existing with the Stock Connect Program, QFII and RQFII programs remain the special channels for many large institutional investors with active strategies such as Sovereign Wealth Funds and Endowments & Foundations. Foreign capital participation is still low, approximately 3% of total A-Shares market capitalization (about 7% of total free float) in 2019, already a leap from a very low base. Over the past five years, China has simplified license application and relaxed requirements of reporting among many rules for both QFII and RQFII investors. As the most recent move to further open the market, China removed the quota limits of both QFII and RQFII programs in September 2019 (Chart 19).
28.0
84.0
17.0
13.0
13.0
13.0
0.0
10.0
20.0
30.0
40.0
50.0
60.0
70.0
80.0
90.0
100.0
Capit
al In
flow
Thro
ugh
HK C
onne
ct (U
SD B
illion
s)
I Fund
29
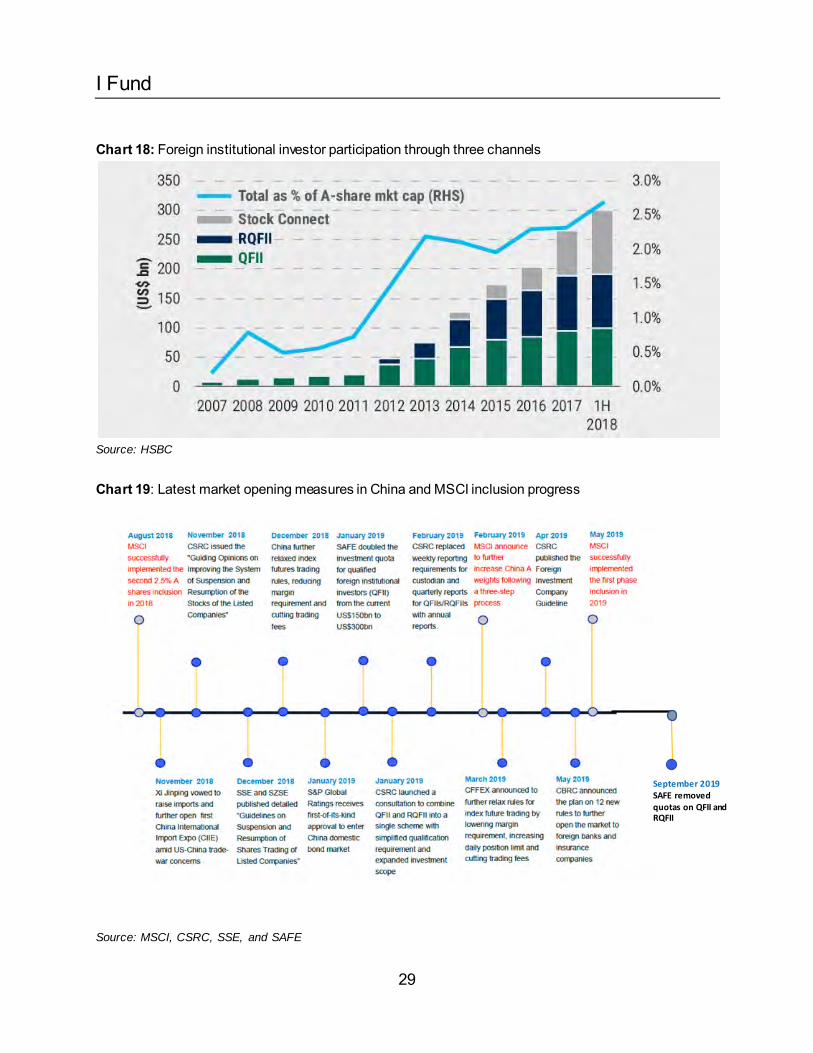
Chart 18: Foreign institutional investor participation through three channels
Source: HSBC
Chart 19: Latest market opening measures in China and MSCI inclusion progress
Source: MSCI, CSRC, SSE, and SAFE
September 2019 SAFE removed quotas on QFII and RQFII
I Fund
30
3. Overall China Weight Outlook
Looking further out, MSCI has illustrated the possibility that China (as a country) could comprise more than 40% of the Emerging Markets Index, rising from the current weight of 32%, when eligible A-Shares are fully included. A-Shares alone could jump from the current 2.5% to 17.4% of the Emerging Markets Index, while other China share classes are displaced by A-Shares. In our earlier paper5, we estimated that A-Shares’ weight rising from 0.7% to 17.4% of MSCI Emerging Markets Index is expected to bring as much as $323 billion in passive capital flows to China’s onshore equity markets, about 5% of the total market capitalization once fully incorporated. We expect future capital inflows to China’s equity market from passive investors to track the rising weight of overall China in the Emerging Markets Index as well as the increasing importance of A-Shares and shrinking shares of other offshore share classes in the MSCI China Index. While the future of MSCI China is expected to be dominated by A-Shares, investors’ access channel to China equities is expected to shift from historically HKEX, then NYSE/NADAQ to China onshore equity markets through HK Exchange. In addition to capital inflows of passive strategies that follows the index moves, we also expect additional inflows to China’s domestic equity markets from active investors. Given the inefficiency of China’s domestic equity markets due to trading dominated by retail investors, active investors will continue to explore alpha opportunities in China’s equity markets, leveraging all three access channels. Securities lending The market demand for lending emerging markets and international small cap equity is generally greater than developed large and mid-cap names. The higher demand is primarily driven by the lack of supply of small capitalization securities available for lending. Other reasons for the higher demand for these two segments are the higher volatility associated with these two markets and less public information compared to developed large and mid-cap names. Across each of the last three calendar years, the income to the TSP I Fund is estimated to have been at least 1.5x as much if the I Fund tracked the MSCI ACWI ex US IMI Index instead of the MSCI EAFE Index. Operational Considerations
Please note the following custody considerations apply to international strategies managed in separate accounts. Most of the world's largest custodians do not have custody operations in every country, requiring these organizations to contract with a local custodian that does have these local capabilities. Requiring global custody services introduces additional risks including: ▪ Failure or default of sub-custodian that could result in losses if proper segregation of securities and
cash is not in place
5 Aon research: MSCI’s Announcement to Add China A-Shares to Its Emerging Markets Index-Looking Beyond the Tiny Percentage, 2017
I Fund
31
▪ Lack of contingency planning and/or sufficient contractual protection by main custodian for adverse organizational events
▪ Settlement and other operational-related risks if the sub-custodian does not have strong controls & processes in place
We believe the above risks are generally mitigated across the world’s largest custodians since the custodian is responsible for selecting the foreign custodian (sub-custodian), which is typically based on a very robust, in depth, and complex due diligence process. Custodians also monitor their sub-custodian relationships on an ongoing basis to ensure financial stability, monitor changes in personnel, and identify any changes to the business (technology, client service structure, etc.) that warrants a change. Settlement Risk Settlement cycles vary across market; settlements tend to range from T+1 to T+5. This can cause out of market balances, overdrafts, or leverage. Passive managers may use broker-facilitated short settlements and their FX trading desk to ensure settlement cycles match up. Local Account Openings A majority of market accounts are expected to take no longer than eight weeks to open, with an exception to India, which is projected to take six months to open. During those six months, passive managers can obtain exposure to the Indian market by using ADRs/GDRs, exchange-traded funds (ETFs), derivatives, and potentially omitting. This can cause the potential for delays in a full replication strategy and also the potential for higher tracking error. Transferability of Stocks In emerging markets, a number of countries do not allow for shares to be transferred between accounts nor do they allow for change of beneficial ownership. If the market does allow assets to be transferred, there is generally an associated charge around exchange fees, stamp taxes, registration fees, etc. Restricted Currencies There are emerging market currencies that are restricted, which means currency trades can only be done by the local sub-custodian. In developed markets, currency trades can be auctioned to a number of banks in order to receive the most favorable rate. Restricted currencies can result in higher tracking error. Major passive providers tend to have a rigorous due diligence framework before utilizing local FX agents. They also conduct ongoing monitoring and review of FX executions. Local Tax Advisor The client is generally responsible for hiring local tax advisors in some emerging markets such as Pakistan, Taiwan, and India. Passive providers may assist the TSP in hiring a local tax advisor in these countries depending on the account structure the TSP has in place. Given the TSP’s existing account structure, the passive manager would generally provide a meaningful amount of assistance in hiring a local tax advisor in these countries.
I Fund
32
Foreign Ownership Limits International companies may impose foreign ownership limits on their stock. Passive managers tend to optimize around foreign ownership limits. Foreign ownership limitations can result in potentially higher tracking error. Repatriation Issues In markets where repatriation issues exist, such as Egypt, custodial standing instructions may be used to begin the repatriation process. Passive managers may also choose to reduce the size of the portfolio’s exposure to such a country to mitigate the risk of delayed repatriation. This can result in a potential delay in receiving proceeds in USD and thus can result in potentially higher tracking error. Political Risk Political risk is managed on a case-by-case basis, in consultation with the passive provider. Passive managers may use various strategies to mitigate emerging market political risk to the extent possible. One example is shifting exposure from local currency names to depository receipts to mitigate liquidity risk in a market that may be at risk for capital restrictions/sanctions. Best Practice in U.S. Defined Contribution Plans The MSCI indexes remain the most popular indexes for U.S.-based institutional investors investing in overseas equity markets.
Best practices for U.S. target date funds include equity investment in emerging markets. Since President George W. Bush signed the Pension Protection Act of 2006 (which defined a qualified default investment alternative) into law, target date funds have become the most-used investment option within defined contribution (“DC”) plans in the United States. (For reference, the TSP’s L Funds are target date funds.) ▪ At the end of 2018, Fidelity and Vanguard, two of the largest recordkeepers of DC plans, reported
that roughly 52% of all participants hold a single target date fund as their sole investment ▪ Vanguard also reported at the end 2018 that 79% of all participants have some exposure to a target
date fund and 57% of all participant-directed contributions were allocated to a target date fund ▪ As of June 30, 2019, Vanguard reported that the top six target date fund providers by assets (e.g.,
Vanguard, Fidelity, T. Rowe Price, BlackRock, JP Morgan, and American Funds) hold 86% of all assets invested in target date funds—that is, more than $1.9 trillion
▪ As of June 30, 2019, the top six target date fund providers invest in emerging market equity
I Fund
33
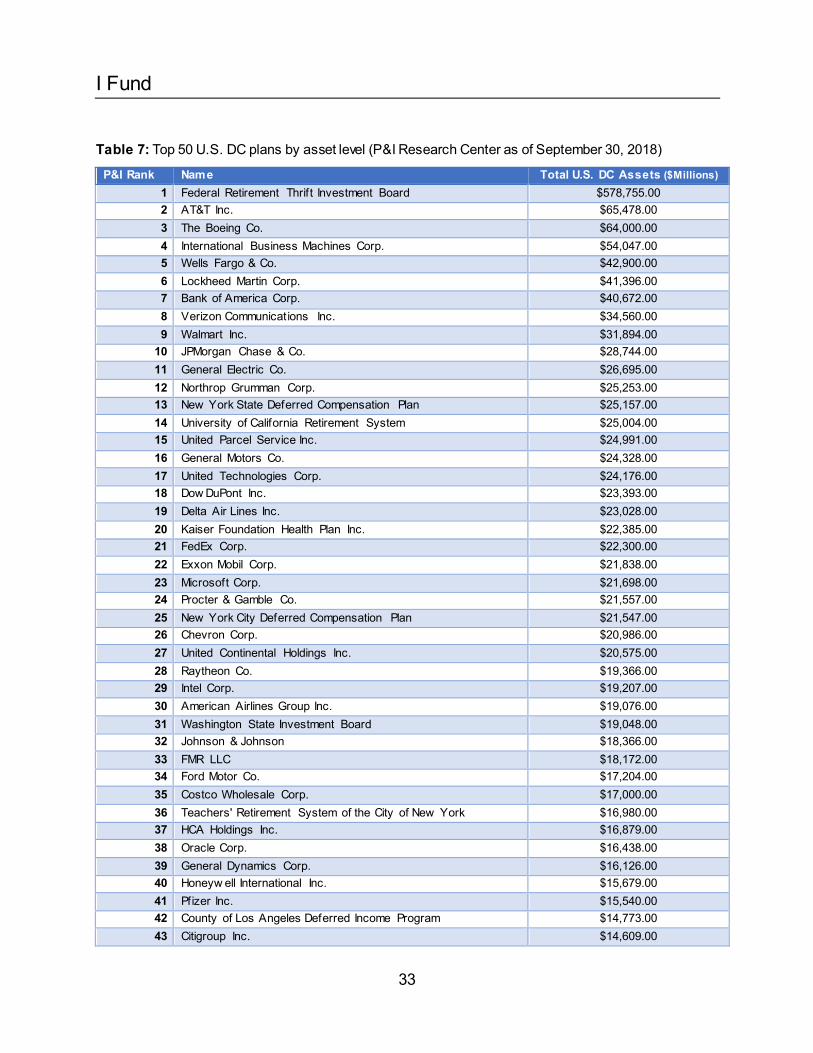
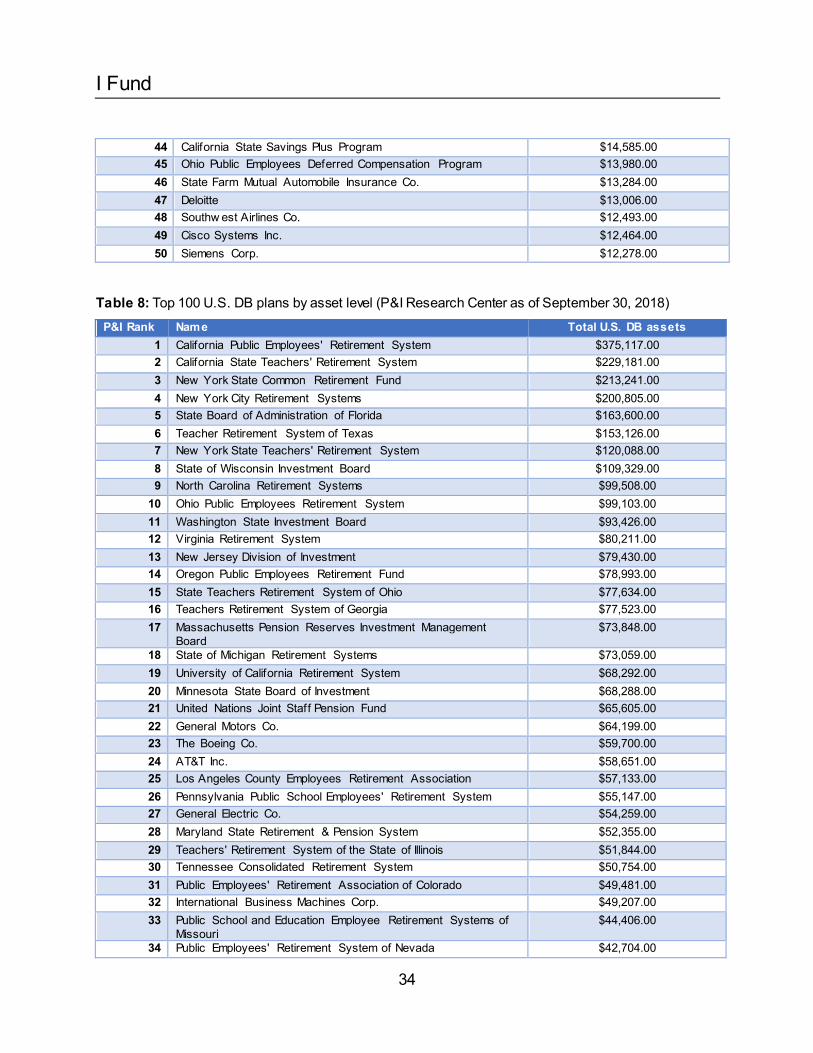
Table 7: Top 50 U.S. DC plans by asset level (P&I Research Center as of September 30, 2018) P&I Rank Name Total U.S. DC Assets ($Millions)
1 Federal Retirement Thrift Investment Board $578,755.00 2 AT&T Inc. $65,478.00 3 The Boeing Co. $64,000.00 4 International Business Machines Corp. $54,047.00 5 Wells Fargo & Co. $42,900.00 6 Lockheed Martin Corp. $41,396.00 7 Bank of America Corp. $40,672.00 8 Verizon Communications Inc. $34,560.00 9 Walmart Inc. $31,894.00
10 JPMorgan Chase & Co. $28,744.00 11 General Electric Co. $26,695.00 12 Northrop Grumman Corp. $25,253.00 13 New York State Deferred Compensation Plan $25,157.00 14 University of California Retirement System $25,004.00 15 United Parcel Service Inc. $24,991.00 16 General Motors Co. $24,328.00 17 United Technologies Corp. $24,176.00 18 Dow DuPont Inc. $23,393.00 19 Delta Air Lines Inc. $23,028.00 20 Kaiser Foundation Health Plan Inc. $22,385.00 21 FedEx Corp. $22,300.00 22 Exxon Mobil Corp. $21,838.00 23 Microsoft Corp. $21,698.00 24 Procter & Gamble Co. $21,557.00 25 New York City Deferred Compensation Plan $21,547.00 26 Chevron Corp. $20,986.00 27 United Continental Holdings Inc. $20,575.00 28 Raytheon Co. $19,366.00 29 Intel Corp. $19,207.00 30 American Airlines Group Inc. $19,076.00 31 Washington State Investment Board $19,048.00 32 Johnson & Johnson $18,366.00 33 FMR LLC $18,172.00 34 Ford Motor Co. $17,204.00 35 Costco Wholesale Corp. $17,000.00 36 Teachers' Retirement System of the City of New York $16,980.00 37 HCA Holdings Inc. $16,879.00 38 Oracle Corp. $16,438.00 39 General Dynamics Corp. $16,126.00 40 Honeyw ell International Inc. $15,679.00 41 Pfizer Inc. $15,540.00 42 County of Los Angeles Deferred Income Program $14,773.00 43 Citigroup Inc. $14,609.00
I Fund
34
44 California State Savings Plus Program $14,585.00 45 Ohio Public Employees Deferred Compensation Program $13,980.00 46 State Farm Mutual Automobile Insurance Co. $13,284.00 47 Deloitte $13,006.00 48 Southw est Airlines Co. $12,493.00 49 Cisco Systems Inc. $12,464.00 50 Siemens Corp. $12,278.00
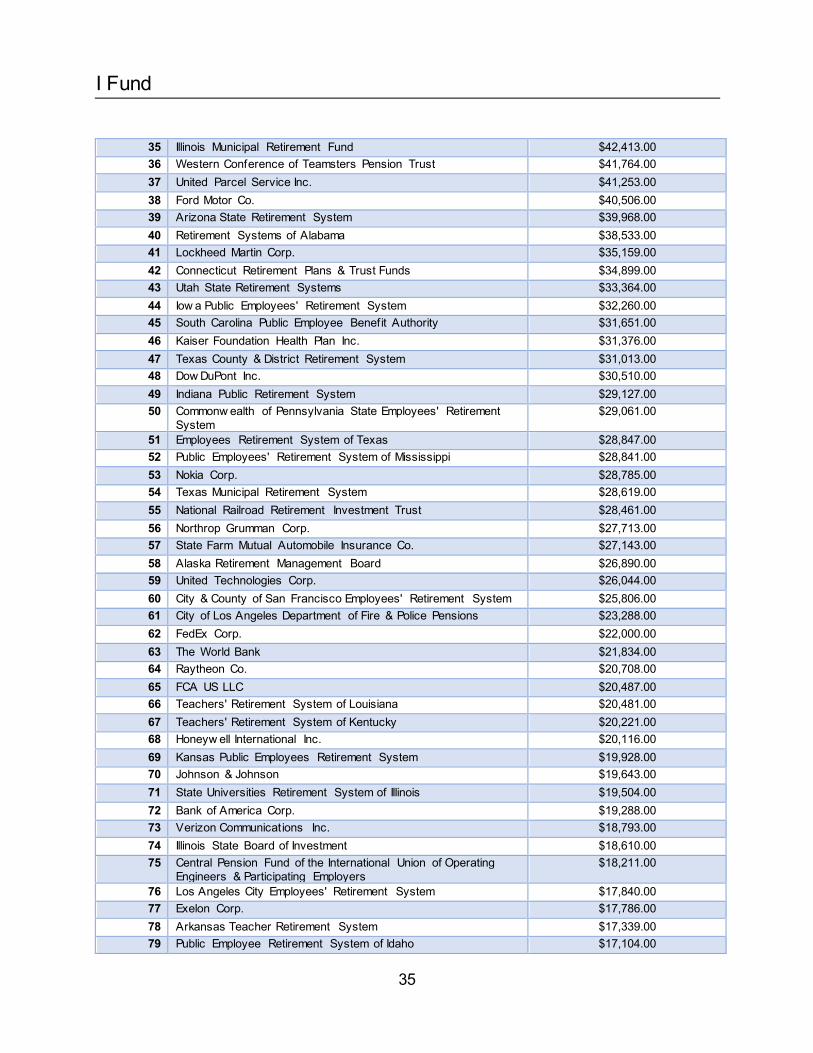
Table 8: Top 100 U.S. DB plans by asset level (P&I Research Center as of September 30, 2018) P&I Rank Name Total U.S. DB assets
1 California Public Employees' Retirement System $375,117.00 2 California State Teachers' Retirement System $229,181.00 3 New York State Common Retirement Fund $213,241.00 4 New York City Retirement Systems $200,805.00 5 State Board of Administration of Florida $163,600.00 6 Teacher Retirement System of Texas $153,126.00 7 New York State Teachers' Retirement System $120,088.00 8 State of Wisconsin Investment Board $109,329.00 9 North Carolina Retirement Systems $99,508.00
10 Ohio Public Employees Retirement System $99,103.00 11 Washington State Investment Board $93,426.00 12 Virginia Retirement System $80,211.00 13 New Jersey Division of Investment $79,430.00 14 Oregon Public Employees Retirement Fund $78,993.00 15 State Teachers Retirement System of Ohio $77,634.00 16 Teachers Retirement System of Georgia $77,523.00 17 Massachusetts Pension Reserves Investment Management
Board $73,848.00
18 State of Michigan Retirement Systems $73,059.00 19 University of California Retirement System $68,292.00 20 Minnesota State Board of Investment $68,288.00 21 United Nations Joint Staff Pension Fund $65,605.00 22 General Motors Co. $64,199.00 23 The Boeing Co. $59,700.00 24 AT&T Inc. $58,651.00 25 Los Angeles County Employees Retirement Association $57,133.00 26 Pennsylvania Public School Employees' Retirement System $55,147.00 27 General Electric Co. $54,259.00 28 Maryland State Retirement & Pension System $52,355.00 29 Teachers' Retirement System of the State of Illinois $51,844.00 30 Tennessee Consolidated Retirement System $50,754.00 31 Public Employees' Retirement Association of Colorado $49,481.00 32 International Business Machines Corp. $49,207.00 33 Public School and Education Employee Retirement Systems of
Missouri $44,406.00
34 Public Employees' Retirement System of Nevada $42,704.00
I Fund
35
35 Illinois Municipal Retirement Fund $42,413.00 36 Western Conference of Teamsters Pension Trust $41,764.00 37 United Parcel Service Inc. $41,253.00 38 Ford Motor Co. $40,506.00 39 Arizona State Retirement System $39,968.00 40 Retirement Systems of Alabama $38,533.00 41 Lockheed Martin Corp. $35,159.00 42 Connecticut Retirement Plans & Trust Funds $34,899.00 43 Utah State Retirement Systems $33,364.00 44 Iow a Public Employees' Retirement System $32,260.00 45 South Carolina Public Employee Benefit Authority $31,651.00 46 Kaiser Foundation Health Plan Inc. $31,376.00 47 Texas County & District Retirement System $31,013.00 48 Dow DuPont Inc. $30,510.00 49 Indiana Public Retirement System $29,127.00 50 Commonw ealth of Pennsylvania State Employees' Retirement
System $29,061.00
51 Employees Retirement System of Texas $28,847.00 52 Public Employees' Retirement System of Mississippi $28,841.00 53 Nokia Corp. $28,785.00 54 Texas Municipal Retirement System $28,619.00 55 National Railroad Retirement Investment Trust $28,461.00 56 Northrop Grumman Corp. $27,713.00 57 State Farm Mutual Automobile Insurance Co. $27,143.00 58 Alaska Retirement Management Board $26,890.00 59 United Technologies Corp. $26,044.00 60 City & County of San Francisco Employees' Retirement System $25,806.00 61 City of Los Angeles Department of Fire & Police Pensions $23,288.00 62 FedEx Corp. $22,000.00 63 The World Bank $21,834.00 64 Raytheon Co. $20,708.00 65 FCA US LLC $20,487.00 66 Teachers' Retirement System of Louisiana $20,481.00 67 Teachers' Retirement System of Kentucky $20,221.00 68 Honeyw ell International Inc. $20,116.00 69 Kansas Public Employees Retirement System $19,928.00 70 Johnson & Johnson $19,643.00 71 State Universities Retirement System of Illinois $19,504.00 72 Bank of America Corp. $19,288.00 73 Verizon Communications Inc. $18,793.00 74 Illinois State Board of Investment $18,610.00 75 Central Pension Fund of the International Union of Operating
Engineers & Participating Employers $18,211.00
76 Los Angeles City Employees' Retirement System $17,840.00 77 Exelon Corp. $17,786.00 78 Arkansas Teacher Retirement System $17,339.00 79 Public Employee Retirement System of Idaho $17,104.00
I Fund
36
80 Teachers' Retirement System of Oklahoma $16,882.00 81 Employees' Retirement System of the State of Haw aii $16,487.00 82 PG&E Corp. $16,289.00 83 Federal Reserve Employee Benefits System $16,239.00 84 Employees' Retirement System of Georgia $16,145.00 85 3M Co. $16,135.00 86 West Virginia Investment Management Board $15,898.00 87 Ohio Police & Fire Pension Fund $15,885.00 88 Orange County Employees Retirement System $15,869.00 89 Public Employees Retirement Association of New Mexico $15,565.00 90 JPMorgan Chase & Co. $15,543.00 91 Shell Oil Co. $15,452.00 92 Pfizer Inc. $15,022.00 93 National Electrical Benefit Fund $14,812.00 94 Consolidated Edison Co. of New York Inc. $14,788.00 95 Los Angeles Water & Pow er Employees' Retirement Plan $14,777.00 96 Maine Public Employees Retirement System $14,623.00 97 Delta Air Lines Inc. $14,600.00 98 School Employees Retirement System of Ohio $14,556.00 99 Exxon Mobil Corp. $14,110.00
100 Teamsters Central States, Southeast & Southw est Areas Pension Fund
$14,094.00
Table 9: Top 10 largest publicly traded U.S. companies’ DC plans
Company TDF’s Non-U.S. Equity Benchmark Core Lineup Non-U.S. Equity Benchmark
Microsoft Corp • MSCI ACWI ex USA IMI Index (BlackRock’s TDF)
• MSCI ACWI ex USA Index
Apple Inc. • MSCI ACWI ex USA IMI Index
(BlackRock’s TDF)
• FTSE Global All Cap ex US Index
Amazon.com Inc • FTSE Global All Cap ex US Index
(Vanguard’s TDF)
• FTSE Global All Cap ex US Index
Facebook Inc • FTSE Global All Cap ex US Index
(Vanguard’s TDF)
• FTSE Global All Cap ex US Index
• MSCI Emerging Market Index
Berkshire Hathaway • FTSE Global All Cap ex US Index
(Vanguard’s TDF)
• FTSE Global All Cap ex US Index
Alphabet Inc • FTSE Global All Cap ex US Index
(Vanguard’s TDF)
• FTSE Global All Cap ex US Index
• MSCI Emerging Market Index
JP Morgan Chase & Co
• MSCI EAFE Index
• MSCI Emerging Market Index
(JP Morgan TDF)
• MSCI EAFE Index
• MSCI Emerging Market Index
Johnson & Johnson • MSCI ACWI ex USA IMI Index • MSCI ACWI ex USA IMI Index
I Fund
37
(Custom TDF)
Visa Inc • FTSE Global All Cap ex US Index
(Vanguard’s TDF)
• FTSE Global All Cap ex US Index
Exxon Mobil Corp • MSCI ACWI ex USA Index • MSCI ACWI ex USA Index
Source: Dow Jones Total Stock Market Index Holdings as of July 31, 2019 and Public Form 5500 Filings
Table 10: Top 10 award Federal Contractors DC plans (Fiscal Year 2018)
Company TDF’s Non-U.S. Equity Benchmark Core Lineup Non-U.S. Equity Benchmark
Lockheed Martin N/A • MSCI EAFE Index
• MSCI Emerging Market Index • MSCI ACWI Index
The Boeing Company
• MSCI ACWI ex USA IMI Index (Custom TDF)
• MSCI ACWI ex USA IMI Index
General Dynamics • FTSE Global All Cap ex US Index
(Vanguard’s TDF)
• FTSE Global All Cap ex US Index
Raytheon • N/A • MSCI ACWI ex USA Index
Northrop Grumman • FTSE Global All Cap ex US Index
(Vanguard’s TDF)
• MSCI EAFE Index
• MSCI Emerging Market Index
McKesson • FTSE Global All Cap ex US Index
(Vanguard’s TDF)
• MSCI EAFE Index
• MSCI Emerging Market Index
United Technologies • MSCI ACWI ex USA Index (AB TDF)
• MSCI EAFE Index • MSCI Emerging Market Index
Leidos Holdings • FTSE Global All Cap ex US Index (Vanguard’s TDF)
• FTSE Global All Cap ex US Index • MSCI Emerging Market Index
Huntington Ingalls • MSCI ACWI ex USA Index
(BlackRock TDF)
• MSCI ACWI ex USA Index
BAE Systems • FTSE Global All Cap ex US Index
(Vanguard’s TDF)
• FTSE Global All Cap ex US Index
• MSCI Emerging Market Index
Source: Bloomberg and Publicly Filed Form 5500
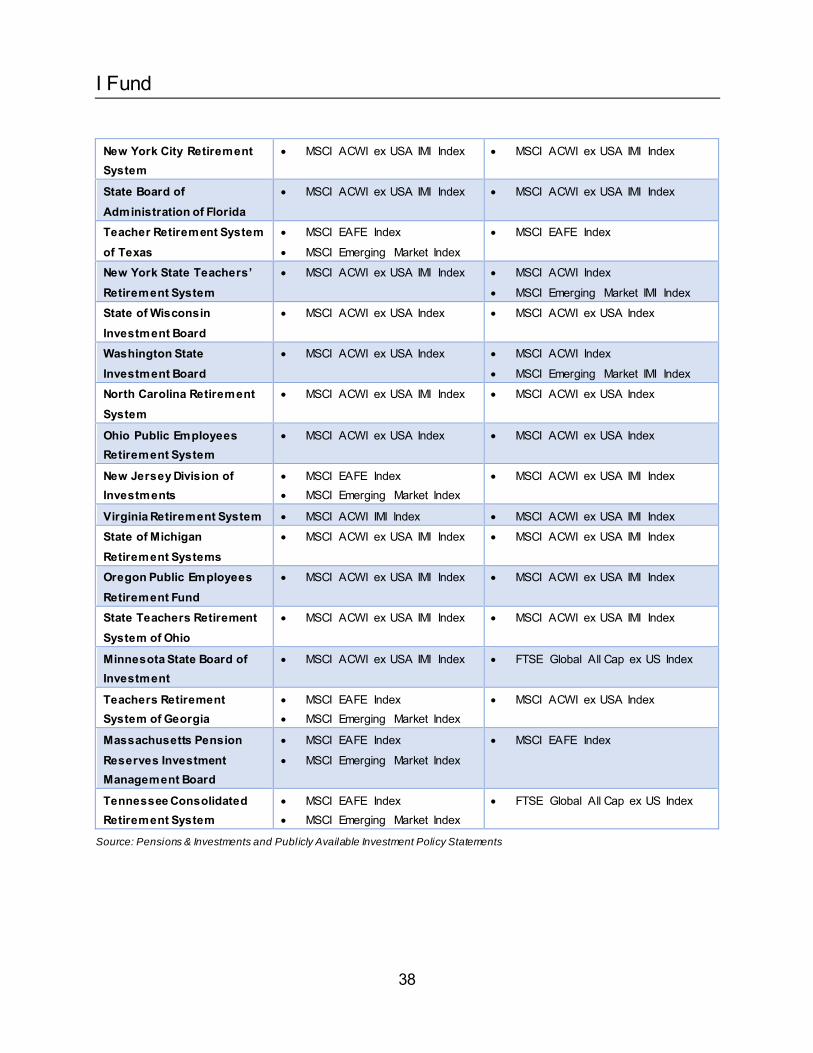
Table 11: Top 20 Largest Public Defined Benefit Plans (as of December 31, 2018)
Company DB Plan Non-U.S. Equity Benchmark
457(b) Plan Non-U.S. Equity Benchmark
California Public Employees Retirement System
• MSCI ACWI IMI Index (Net) • MSCI ACWI ex USA IMI Index
California State Teachers’ Retirement System
• MSCI ACWI ex USA IMI Index • MSCI EAFE Index • MSCI Emerging Market Index
New York State Common Retirement Fund
• MSCI ACWI ex USA IMI Index • MSCI EAFE Index
• MSCI Emerging Market Index
I Fund
38
New York City Retirement System
• MSCI ACWI ex USA IMI Index • MSCI ACWI ex USA IMI Index
State Board of Administration of Florida
• MSCI ACWI ex USA IMI Index • MSCI ACWI ex USA IMI Index
Teacher Retirement System of Texas
• MSCI EAFE Index
• MSCI Emerging Market Index
• MSCI EAFE Index
New York State Teachers’ Retirement System
• MSCI ACWI ex USA IMI Index • MSCI ACWI Index
• MSCI Emerging Market IMI Index
State of Wisconsin Investment Board
• MSCI ACWI ex USA Index • MSCI ACWI ex USA Index
Washington State Investment Board
• MSCI ACWI ex USA Index • MSCI ACWI Index
• MSCI Emerging Market IMI Index
North Carolina Retirement System
• MSCI ACWI ex USA IMI Index • MSCI ACWI ex USA Index
Ohio Public Employees Retirement System
• MSCI ACWI ex USA Index • MSCI ACWI ex USA Index
New Jersey Division of Investments
• MSCI EAFE Index • MSCI Emerging Market Index
• MSCI ACWI ex USA IMI Index
Virginia Retirement System • MSCI ACWI IMI Index • MSCI ACWI ex USA IMI Index
State of Michigan Retirement Systems
• MSCI ACWI ex USA IMI Index • MSCI ACWI ex USA IMI Index
Oregon Public Employees Retirement Fund
• MSCI ACWI ex USA IMI Index • MSCI ACWI ex USA IMI Index
State Teachers Retirement System of Ohio
• MSCI ACWI ex USA IMI Index • MSCI ACWI ex USA IMI Index
Minnesota State Board of Investment
• MSCI ACWI ex USA IMI Index • FTSE Global All Cap ex US Index
Teachers Retirement System of Georgia
• MSCI EAFE Index • MSCI Emerging Market Index
• MSCI ACWI ex USA Index
Massachusetts Pension Reserves Investment Management Board
• MSCI EAFE Index
• MSCI Emerging Market Index
• MSCI EAFE Index
Tennessee Consolidated Retirement System
• MSCI EAFE Index • MSCI Emerging Market Index
• FTSE Global All Cap ex US Index
Source: Pensions & Investments and Publicly Available Investment Policy Statements
I Fund
39
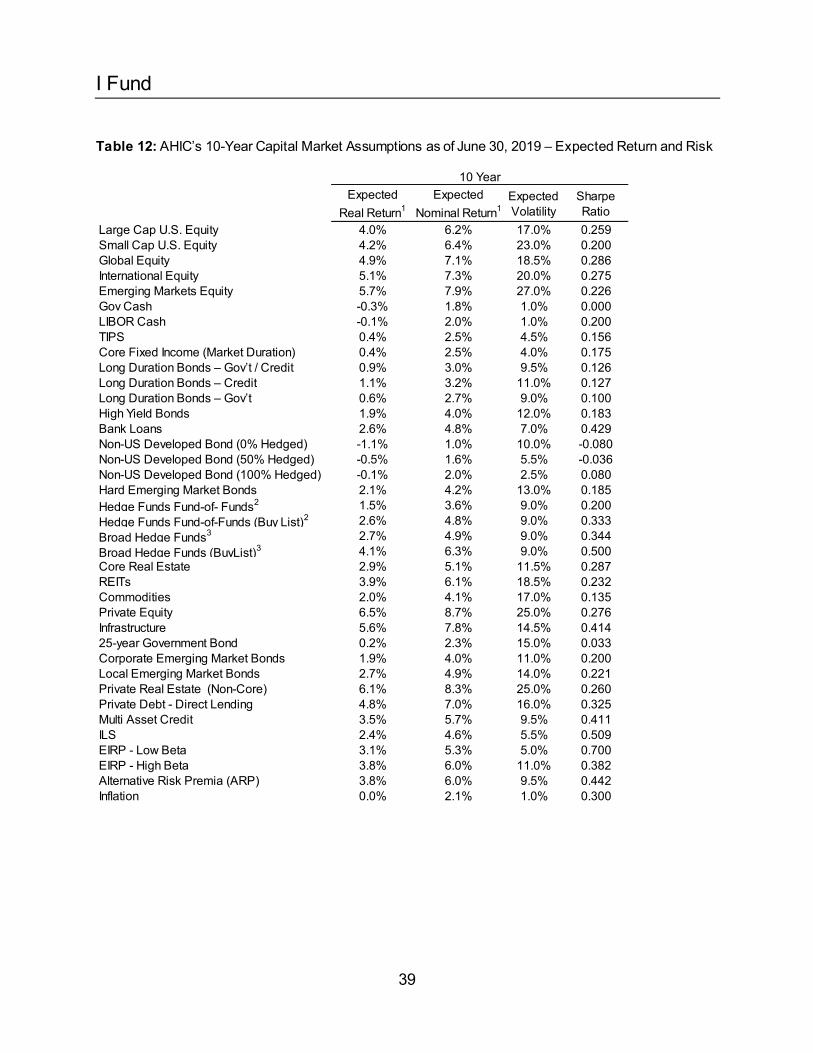
Table 12: AHIC’s 10-Year Capital Market Assumptions as of June 30, 2019 – Expected Return and Risk
Expected Real Return1
Expected Nominal Return1
Expected Volatility
Sharpe Ratio
Large Cap U.S. Equity 4.0% 6.2% 17.0% 0.259Small Cap U.S. Equity 4.2% 6.4% 23.0% 0.200Global Equity 4.9% 7.1% 18.5% 0.286International Equity 5.1% 7.3% 20.0% 0.275Emerging Markets Equity 5.7% 7.9% 27.0% 0.226Gov Cash -0.3% 1.8% 1.0% 0.000LIBOR Cash -0.1% 2.0% 1.0% 0.200TIPS 0.4% 2.5% 4.5% 0.156Core Fixed Income (Market Duration) 0.4% 2.5% 4.0% 0.175Long Duration Bonds – Gov’t / Credit 0.9% 3.0% 9.5% 0.126Long Duration Bonds – Credit 1.1% 3.2% 11.0% 0.127Long Duration Bonds – Gov’t 0.6% 2.7% 9.0% 0.100High Yield Bonds 1.9% 4.0% 12.0% 0.183Bank Loans 2.6% 4.8% 7.0% 0.429Non-US Developed Bond (0% Hedged) -1.1% 1.0% 10.0% -0.080Non-US Developed Bond (50% Hedged) -0.5% 1.6% 5.5% -0.036Non-US Developed Bond (100% Hedged) -0.1% 2.0% 2.5% 0.080Hard Emerging Market Bonds 2.1% 4.2% 13.0% 0.185Hedge Funds Fund-of- Funds2 1.5% 3.6% 9.0% 0.200Hedge Funds Fund-of-Funds (Buy List)2 2.6% 4.8% 9.0% 0.333Broad Hedge Funds3 2.7% 4.9% 9.0% 0.344Broad Hedge Funds (BuyList)3 4.1% 6.3% 9.0% 0.500Core Real Estate 2.9% 5.1% 11.5% 0.287REITs 3.9% 6.1% 18.5% 0.232Commodities 2.0% 4.1% 17.0% 0.135Private Equity 6.5% 8.7% 25.0% 0.276Infrastructure 5.6% 7.8% 14.5% 0.41425-year Government Bond 0.2% 2.3% 15.0% 0.033Corporate Emerging Market Bonds 1.9% 4.0% 11.0% 0.200Local Emerging Market Bonds 2.7% 4.9% 14.0% 0.221Private Real Estate (Non-Core) 6.1% 8.3% 25.0% 0.260Private Debt - Direct Lending 4.8% 7.0% 16.0% 0.325Multi Asset Credit 3.5% 5.7% 9.5% 0.411ILS 2.4% 4.6% 5.5% 0.509EIRP - Low Beta 3.1% 5.3% 5.0% 0.700EIRP - High Beta 3.8% 6.0% 11.0% 0.382Alternative Risk Premia (ARP) 3.8% 6.0% 9.5% 0.442Inflation 0.0% 2.1% 1.0% 0.300
10 Year
I Fund
40
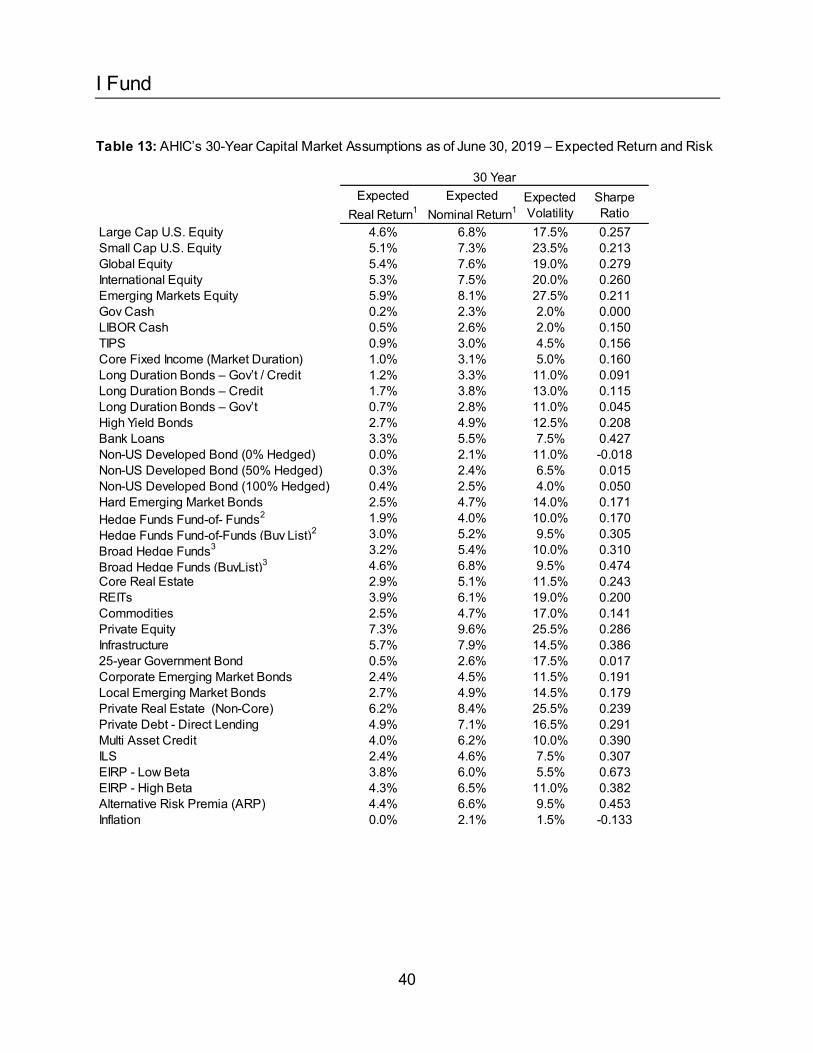
Table 13: AHIC’s 30-Year Capital Market Assumptions as of June 30, 2019 – Expected Return and Risk
Expected Real Return1
Expected Nominal Return1
Expected Volatility
Sharpe Ratio
Large Cap U.S. Equity 4.6% 6.8% 17.5% 0.257Small Cap U.S. Equity 5.1% 7.3% 23.5% 0.213Global Equity 5.4% 7.6% 19.0% 0.279International Equity 5.3% 7.5% 20.0% 0.260Emerging Markets Equity 5.9% 8.1% 27.5% 0.211Gov Cash 0.2% 2.3% 2.0% 0.000LIBOR Cash 0.5% 2.6% 2.0% 0.150TIPS 0.9% 3.0% 4.5% 0.156Core Fixed Income (Market Duration) 1.0% 3.1% 5.0% 0.160Long Duration Bonds – Gov’t / Credit 1.2% 3.3% 11.0% 0.091Long Duration Bonds – Credit 1.7% 3.8% 13.0% 0.115Long Duration Bonds – Gov’t 0.7% 2.8% 11.0% 0.045High Yield Bonds 2.7% 4.9% 12.5% 0.208Bank Loans 3.3% 5.5% 7.5% 0.427Non-US Developed Bond (0% Hedged) 0.0% 2.1% 11.0% -0.018Non-US Developed Bond (50% Hedged) 0.3% 2.4% 6.5% 0.015Non-US Developed Bond (100% Hedged) 0.4% 2.5% 4.0% 0.050Hard Emerging Market Bonds 2.5% 4.7% 14.0% 0.171Hedge Funds Fund-of- Funds2 1.9% 4.0% 10.0% 0.170Hedge Funds Fund-of-Funds (Buy List)2 3.0% 5.2% 9.5% 0.305Broad Hedge Funds3 3.2% 5.4% 10.0% 0.310Broad Hedge Funds (BuyList)3 4.6% 6.8% 9.5% 0.474Core Real Estate 2.9% 5.1% 11.5% 0.243REITs 3.9% 6.1% 19.0% 0.200Commodities 2.5% 4.7% 17.0% 0.141Private Equity 7.3% 9.6% 25.5% 0.286Infrastructure 5.7% 7.9% 14.5% 0.38625-year Government Bond 0.5% 2.6% 17.5% 0.017Corporate Emerging Market Bonds 2.4% 4.5% 11.5% 0.191Local Emerging Market Bonds 2.7% 4.9% 14.5% 0.179Private Real Estate (Non-Core) 6.2% 8.4% 25.5% 0.239Private Debt - Direct Lending 4.9% 7.1% 16.5% 0.291Multi Asset Credit 4.0% 6.2% 10.0% 0.390ILS 2.4% 4.6% 7.5% 0.307EIRP - Low Beta 3.8% 6.0% 5.5% 0.673EIRP - High Beta 4.3% 6.5% 11.0% 0.382Alternative Risk Premia (ARP) 4.4% 6.6% 9.5% 0.453Inflation 0.0% 2.1% 1.5% -0.133
30 Year
I Fund
41
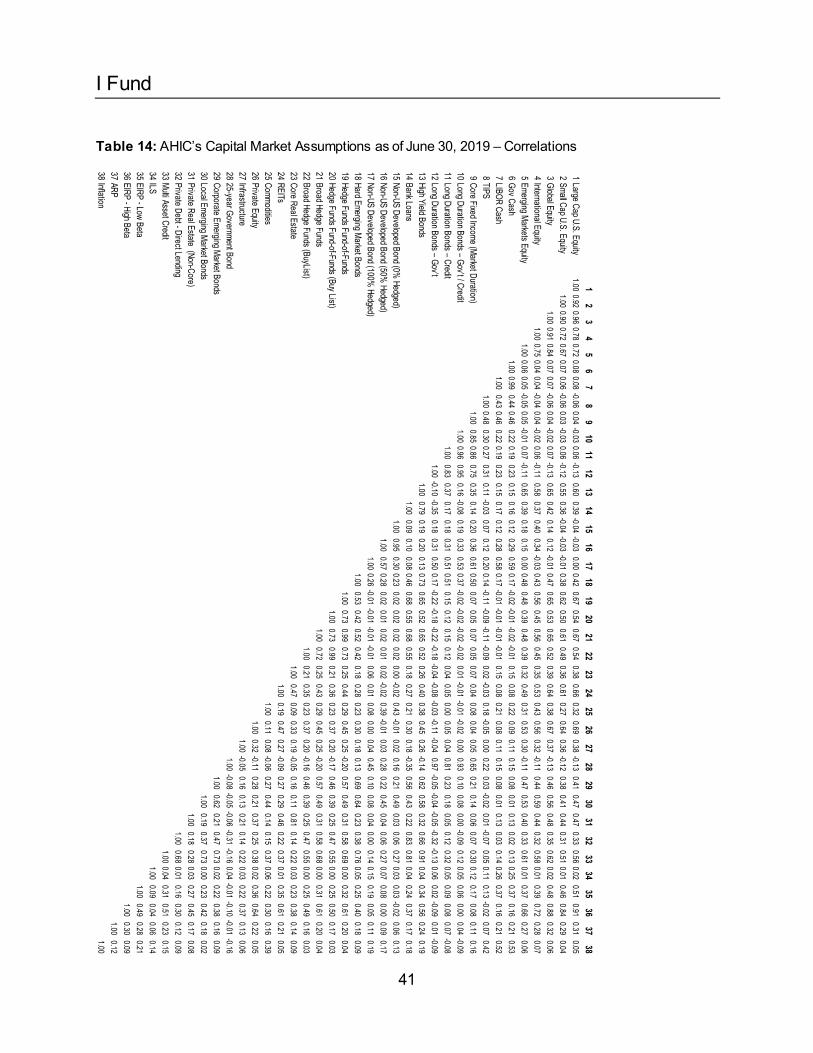
Table 14: AHIC’s Capital Market Assumptions as of June 30, 2019 – Correlations
12
34
56
78
910
1112
1314
1516
1718
1920
2122
2324
2526
2728
2930
3132
3334
3536
3738
1Large Cap U.S. Equity
1.000.92
0.960.78
0.720.08
0.08-0.06
0.04-0.03
0.06-0.13
0.600.39
-0.04-0.03
0.000.42
0.670.54
0.670.54
0.380.66
0.320.69
0.38-0.13
0.410.47
0.470.33
0.560.02
0.510.91
0.310.05
2Small Cap U.S. Equity
1.000.90
0.720.67
0.070.06
-0.060.03
-0.030.06
-0.120.55
0.36-0.04
-0.03-0.01
0.380.62
0.500.61
0.490.36
0.610.27
0.640.36
-0.120.38
0.410.44
0.310.51
0.010.46
0.840.29
0.043
Global Equity1.00
0.910.84
0.070.07
-0.060.04
-0.020.07
-0.130.65
0.420.14
0.12-0.01
0.470.65
0.530.65
0.520.39
0.640.38
0.670.37
-0.130.46
0.560.48
0.350.62
0.020.48
0.880.32
0.064
International Equity1.00
0.750.04
0.04-0.04
0.04-0.02
0.06-0.11
0.580.37
0.400.34
-0.030.43
0.560.45
0.560.45
0.350.53
0.430.56
0.32-0.11
0.440.59
0.440.32
0.580.01
0.390.72
0.280.07
5Emerging Markets Equity
1.000.06
0.05-0.05
0.05-0.01
0.07-0.11
0.650.39
0.180.15
0.000.48
0.480.39
0.480.39
0.320.49
0.310.53
0.30-0.11
0.470.53
0.400.33
0.610.01
0.370.66
0.270.06
6Gov Cash
1.000.99
0.440.46
0.220.19
0.230.15
0.160.12
0.290.59
0.17-0.02
-0.01-0.02
-0.010.15
0.080.22
0.090.11
0.150.08
0.010.13
0.020.13
0.250.37
0.160.21
0.537
LIBOR Cash1.00
0.430.46
0.220.19
0.230.15
0.170.12
0.280.58
0.17-0.01
-0.01-0.01
-0.010.15
0.080.21
0.080.11
0.150.08
0.010.13
0.030.14
0.260.37
0.160.21
0.528
TIPS1.00
0.480.30
0.270.31
0.11-0.03
0.070.12
0.200.14
-0.11-0.09
-0.11-0.09
0.02-0.03
0.18-0.05
0.000.22
0.03-0.02
0.01-0.07
0.050.11
0.13-0.02
0.070.42
9Core Fixed Income (Market Duration)
1.000.85
0.860.75
0.350.14
0.200.36
0.610.50
0.070.05
0.070.05
0.070.04
0.080.04
0.050.65
0.210.14
0.060.07
0.300.12
0.170.08
0.110.16
10Long Duration Bonds – Gov’t / Credit
1.000.96
0.950.16
-0.080.19
0.330.53
0.37-0.02
-0.02-0.02
-0.020.01
-0.01-0.01
-0.020.00
0.930.10
0.080.00
-0.090.12
0.050.06
0.000.04
-0.0911
Long Duration Bonds – Credit1.00
0.830.37
0.170.18
0.310.51
0.510.15
0.120.15
0.120.04
0.050.00
0.050.04
0.810.23
0.180.05
0.120.32
0.050.09
0.080.07
-0.0812
Long Duration Bonds – Gov’t1.00
-0.10-0.35
0.180.31
0.500.17
-0.22-0.18
-0.22-0.18
-0.04-0.08
-0.03-0.11
-0.040.97
-0.05-0.04
-0.05-0.32
-0.130.06
0.02-0.09
0.01-0.09
13High Yield Bonds
1.000.79
0.190.20
0.130.73
0.650.52
0.650.52
0.260.40
0.380.45
0.26-0.14
0.620.58
0.320.66
0.910.04
0.340.56
0.240.19
14Bank Loans
1.000.09
0.100.08
0.460.68
0.550.68
0.550.18
0.270.21
0.300.18
-0.350.56
0.430.22
0.830.81
0.040.24
0.370.17
0.1815
Non-US Developed Bond (0% Hedged)
1.000.95
0.300.23
0.020.02
0.020.02
0.00-0.02
0.43-0.01
0.020.16
0.210.49
0.030.06
0.270.03
0.03-0.02
0.060.13
16Non-US Developed Bond (50%
Hedged)1.00
0.570.28
0.020.01
0.020.01
0.02-0.02
0.39-0.01
0.030.28
0.220.45
0.040.06
0.270.07
0.080.00
0.090.17
17Non-US Developed Bond (100%
Hedged)1.00
0.26-0.01
-0.01-0.01
-0.010.06
0.010.08
0.000.04
0.450.10
0.080.04
0.000.14
0.150.19
0.050.11
0.1918
Hard Emerging Market Bonds1.00
0.530.42
0.520.42
0.180.28
0.230.30
0.180.13
0.690.64
0.230.38
0.760.05
0.250.40
0.180.09
19Hedge Funds Fund-of-Funds
1.000.73
0.990.73
0.250.44
0.290.45
0.25-0.20
0.570.49
0.310.58
0.690.00
0.320.61
0.200.04
20Hedge Funds Fund-of-Funds (Buy List)
1.000.73
0.990.21
0.360.23
0.370.20
-0.170.46
0.390.25
0.470.55
0.000.25
0.500.17
0.0321
Broad Hedge Funds1.00
0.720.25
0.430.29
0.450.25
-0.200.57
0.490.31
0.580.68
0.000.31
0.610.20
0.0422
Broad Hedge Funds (BuyList)1.00
0.210.35
0.230.37
0.20-0.16
0.460.39
0.250.47
0.550.00
0.250.49
0.160.03
23Core Real Estate
1.000.47
0.090.33
0.19-0.05
0.160.11
0.810.14
0.220.03
0.230.38
0.140.09
24REITs
1.000.19
0.470.27
-0.090.27
0.290.46
0.220.37
0.010.35
0.610.21
0.0525
Commodities1.00
0.110.08
-0.060.27
0.440.14
0.150.37
0.060.22
0.300.16
0.3926
Private Equity1.00
0.32-0.11
0.280.21
0.370.25
0.380.02
0.360.64
0.220.05
27Infrastructure
1.00-0.05
0.160.13
0.210.14
0.220.03
0.220.37
0.130.06
2825-year Government Bond
1.00-0.08
-0.05-0.06
-0.31-0.16
0.04-0.01
-0.10-0.01
-0.1629
Corporate Emerging Market Bonds1.00
0.620.21
0.470.73
0.020.22
0.380.16
0.0930
Local Emerging Market Bonds1.00
0.190.37
0.730.00
0.230.42
0.180.02
31Private Real Estate (Non-Core)
1.000.18
0.280.03
0.270.45
0.170.08
32Private Debt - Direct Lending
1.000.68
0.010.16
0.300.12
0.0933
Multi Asset Credit 1.00
0.040.31
0.510.23
0.1534
ILS1.00
0.090.04
0.060.14
35EIRP - Low Beta
1.000.49
0.280.21
36EIRP - High Beta
1.000.30
0.0937
ARP1.00
0.1238
Inflation1.00