Embed Size (px)
Citation preview


Revised 05/10/2016
20152016 Community Based Accountability Measures
I. Fine Arts
Performance
Measure Not Applicable Unacceptable Acceptable Recognized Exemplary
1 Participation of students in fine art courses, classes.
Less than 40% of students are enrolled in Fine Arts
courses / classes.
41% to 49% of students are enrolled in Fine Arts
courses / classes.
50 to 59% of students enrolled in Fine Arts courses
/ classes.
60% or more of students enrolled in Fine Arts courses / classes.
2 Percent of students continuing Fine Arts
compared to preceding year.
Less than 50 % of
students are continuing Fine Arts
51% 70 % of students are continuing Fine Arts
71%80% of students are continuing Fine Arts
Greater than 81 % of students are continuing
Fine Arts
3 Fine Arts UIL or comparable Competition Participation
Less than 5% of participating Fine Arts students involved in UIL or like competitions.
6 to 10% of participating Fine Arts students
involved in UIL or like competitions.
11 to 15% of participating Fine Arts students involved in
UIL or like competitions.
16 to 20% of participating Fine Arts students involved in UIL or like competitions.
4 Fine Arts UIL or comparable
Competition Outcome
Did not participate in UIL Fine Arts Competition
6 or more students earned district acknowledgement
4 or more students earned regional acknowledgement
2 or more students qualified for state
5 Exhibition / Performance opportunities
Less than the acceptable number of opportunities
Primary 5 Elementary 7
Middle School 8 High School 12 opportunities
Primary 10 Elementary 14
Middle School 16 High School 24 opportunities
Primary 15 Elementary 21 Middle School
24 High School 36 opportunities
6 Opportunities to participate in special events
Ex: cultural development, field trips, guest speakers,
artists, , musicians
Less than the acceptable number of opportunities
3 opportunities 4 opportunities 5 opportunities
7
PERCENT OF STUDENTS CONTINUING FINE ARTS
FROM GRADES 78
Less than 50 % of students are continuing
Fine Arts
51% 70 % of students are continuing Fine Arts
71%80% of students are continuing Fine Arts
Greater than 81 % of students are continuing
Fine Arts
Page 1MS 201415

Historically, the five main Fine Arts were painting, sculpture, architecture, music and poetry, with performing arts including theatre and dance. Today, the fine arts commonly include additional forms, such as film, photography, conceptual art, and printmaking.
Fine Arts
1. Participation of students in fine art courses, classes. 58.64%
Beginner band 67; 7th/8th Grade Band 61 = 131 TOTAL
6th Grade Choir 40 total students ended with 20, due to tutorials, sports and other after school activities
6th Grade Piano Classes: 15
7th/8th Grade Choir 15
Choir/Piano total is 50 as of this date.
Art 6th, 7th, and 8th = 159
News Crew = 15
Yearbook = 9
2. Percent of students continuing Fine Arts compared to preceding year. 50.2
3. Fine Arts UIL or comparable Competition Participation. 16.6
4. Fine Arts UIL or comparable Competition Outcome. BAND 76 1st division medals (solo & ensemble); 22 students placed in AllRegion Band
Choir 13 1st division medals (solo & ensemble); 6 students placed in AllRegion Choir Choir Sweepstakes at UIL Concert & Sightreading Contest
Middle School Students do not advance to State Competition
Page 2MS 201415

5. Exhibition / Performance opportunities. Choir 9 Performances Band Concert 8 Performances, Art 3 Performance 20
6. Opportunities to participate in special events, cultural development, field trips, guest speakers, artists, musicians. 22
7. Our cumulative population for Fine Arts was 90%+ for all programs. Fluctuation in bullet 2 only exist because in 6th grade all students take Fine Arts
Page 3MS 201415
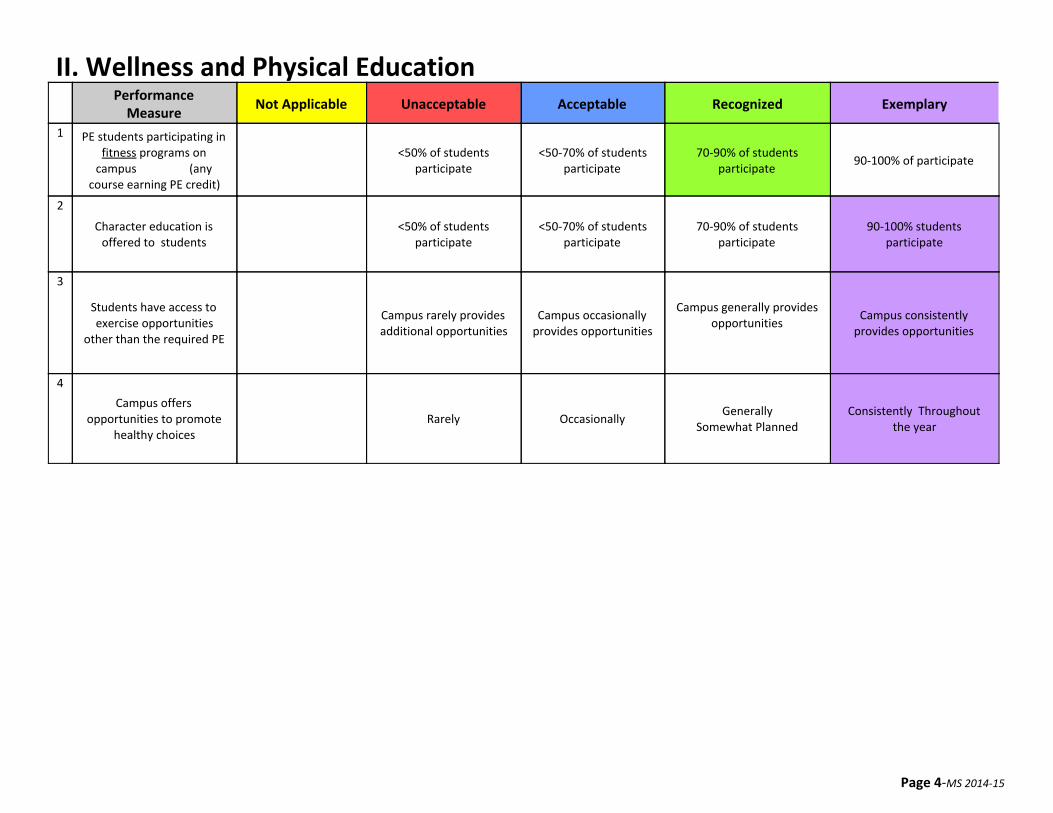
II. Wellness and Physical Education
Performance Measure
Not Applicable Unacceptable Acceptable Recognized Exemplary
1 PE students participating in fitness programs on
campus (any course earning PE credit)
<50% of students
participate <5070% of students
participate 7090% of students
participate 90100% of participate
2
Character education is offered to students
<50% of students
participate <5070% of students
participate 7090% of students
participate 90100% students
participate
3
Students have access to exercise opportunities
other than the required PE
Campus rarely provides additional opportunities
Campus occasionally provides opportunities
Campus generally provides opportunities
Campus consistently provides opportunities
4
Campus offers opportunities to promote
healthy choices Rarely Occasionally
Generally Somewhat Planned
Consistently Throughout the year
Page 4MS 201415

Wellness and Physical Education
1. PE students participating in fitness programs on campus (any course earning PE credit) 75% In PE/Athletics
2. Character education is offered to students 100% of HMS students are exposed to guidance lessons presented by Mrs. Peterson, Mrs. Rollins and all PE teachers. Seventh grade technology students have lessons from Covey’s 7 Habits of Highly Effective Teens.
3. Students have access to exercise opportunities other than the required PE. HMS selected (generally). ● Youth Cross Country Program
● 3 Different Fun Run Activities
● Open Gym / Fall
● Youth Basketball
● Youth Baseball/Softball
● Cheer Team Competition Base Camp
● Dance Team Competition Base Camp
● Tennis, Basketball, Soccer Summer Sports Camps
● Youth Track Meet
4. Campus offers opportunities to promote healthy choices. HMS selected (consistently). ● Hudson Gets Fit Health Fair
● Health Matters
● Vision Screening
● Hearing Screening
● Scoliosis Screening
● Commit for Life blood donation
Page 5MS 201415

● My Pac School Based Clinic
● School Physicals
● Heart Awareness through CHI St. Lukes
● ADAC Presentation / Survey Towards No Tobacco Unit
● Tobacco Survey by Texas Department of Health
● Worth the Wait Sex Ed Program
● 7th Grade Immunization Shot Clinic
● Jump Rope For Heart
● 6th, 7th, and 8th Grade Field Day
Page 6MS 201415

III. Community and Parent Involvement
Performance Measure
Not Applicable Unacceptable Acceptable Recognized Exemplary
1 Campus provides multiple opportunities for parent and community volunteer
service
Less than 50 volunteer hours are recorded
51 100 volunteer hours are recorded
101 150 volunteer hours are recorded
151200 volunteer hours are recorded
2 Programs are scheduled to
engage parents in the education of their students.
Rarely < 3 Occasionally (46) Common Practice
(79) Consistently
Throughout the Year > 10
3
Students participate in community service projects
< 5% of campus
participate in community service projects
5 20% of students participate in
community service projects
21 35% of students participate in
community service projects
> 36% of students participate in community projects
4
Campus actively promotes participation in parent
organizations.
< 5% of parents participate in a parent
organization Booster Band
Club
6 10% of parents participate in one or
more parent organizations
(We have at least 3040 parents help
with CC booster club)
1120% of parents participate in one or
more parent organizations
> 21 % of parents participate in one or more parent
organizations
5
Campus provides multiple opportunities for
community/student based involvement
1 to 5 6 to 10 11 to 15 16 to 20
Page 7MS 201415

Community and Parent Involvement
1. Campus provides multiple opportunities for parent and community volunteer service. Total Hours = 323.5 ● Junior Achievement, Reeder = 42 hrs, 6 Volunteers, Cox = 32 hrs, 6 Volunteers ● Career Mentoring = 59 Hours 13 Career Mentors ● Heart Awareness / Memorial Health = 20 ● ADAC = 10 ● CHI = 10 ● Campus Fundraiser = 9 ● Special Olympics = 96 ● Junior Achievement Career Day = 80 hours ● Naviance Career Assessment = 45.00% ● Texas Virtual College Fair = 59.44% ● Virtual Career Sessions = 8 ● Career Guest Speakers = 10 ● Art Club Field Trip 3 parents 3 days ● Education Student Volunteers (HMS)
2. Programs are scheduled to engage parents in the education of their students. ● 6th Grade Orientation ● Report Card Night ● Three ESL Parent Breakfasts ● ESL Rewards Trip ● ESL ParentStudent Luncheon ● 6, 7, 8th Grade Awards Ceremony ● Band Parent Night ● Pep Rallies ● Academic Pep Rally ● 5th Grade End of Year Tour ● AVID Parent Meeting for Dual Credit, STEP & Associates Degree Path ● Google Hangouts with parents specific to their career and related career cluster Reeder ● AVID Parent Night
Page 8MS 201415

3. Students participate in community service projects. Cumulative HMS student service volunteers 90+%,
before considering for multiple participation opportunities. Meaning the vast majority of the HMS
student population make service related activities a priority. ● Hudson Helps = 45 students, 548 volunteer hours Hudson Helps Hours Logged ● Special Olympics = 35 ● CIA = 25 ● Art Club = 45 ● Alley Cat Recycle = 25 ● Christmas Shoe Giveaway = 422 ● AVID Mentorship Program = 54 Students mentoring peers of lower grade levels. . ● BAND MARCHING IN LUFKIN CHRISTMAS PARADE
4. Campus actively promotes participation in parent organizations. ● Incorporation of HMS parent volunteer program
5. Campus provides multiple opportunities for community/student based involvement opportunities. HMS has 24 documented community/student based involvement opportunities. Link to Hudson Helps Service Organization
● Special Olympics Bowling ● Zoo Boo ● Hudson Gets Healthy ● CISC(Christian Information Service Center) ● CASA Tour of Home ● Salvation Army Bell Ringing ● Mosaic Center ● Buckner Family & Children's Services ● Family Crisis Services Center ● Godtel ● Parks & Rec (cleaned Azalea Trail)
Page 9MS 201415
● Kurth Animal Shelter ● Earth Day at Ellen Trout Zoo ● Castle Pines Nursing Home ● Ally Cat Trash Pickup ● Art Club Trash Pickup remove add Art Club United Way fundraiser ● 2 Canned Food Drive ● Coke Tabs for Ronald McDonald House ● Toy Drive ● Christmas Shoe Giveaway ● Christmas Food Drive ● Special Olympics ● 6th Grade Orientation ● Report Card Night ● 3 x ESL Parent Breakfast ● ESL ParentStudent Luncheon ● ESLRead 180 Reward Party ● 6th, 7th, & 8th Grade Awards Assembly ● Band Parent Night ● Pep Rally’s ● Academic Pep Rally / fire HD 8 Giveaway ● Angelina County Science and Tech Fair Real World Relevancy Essay Contests (VFW Patriot Pen and Daughters of American
Revolution) ● 6th Grade Projects Parents visiting to view projects
● Booster Clubs
Page 10MS 201415
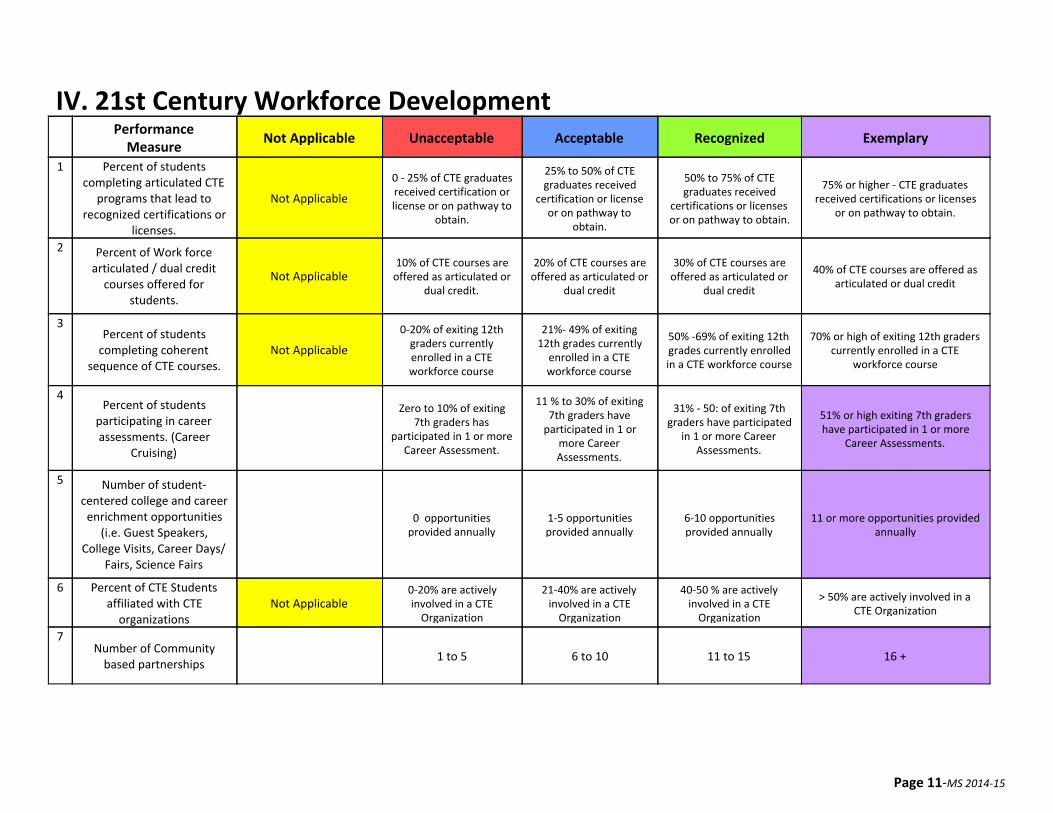
IV. 21st Century Workforce Development
Performance Measure
Not Applicable Unacceptable Acceptable Recognized Exemplary
1 Percent of students completing articulated CTE
programs that lead to recognized certifications or
licenses.
Not Applicable
0 25% of CTE graduates received certification or license or on pathway to
obtain.
25% to 50% of CTE graduates received
certification or license or on pathway to
obtain.
50% to 75% of CTE graduates received
certifications or licenses or on pathway to obtain.
75% or higher CTE graduates received certifications or licenses
or on pathway to obtain.
2 Percent of Work force articulated / dual credit
courses offered for students.
Not Applicable 10% of CTE courses are offered as articulated or
dual credit.
20% of CTE courses are offered as articulated or
dual credit
30% of CTE courses are offered as articulated or
dual credit
40% of CTE courses are offered as articulated or dual credit
3 Percent of students completing coherent
sequence of CTE courses. Not Applicable
020% of exiting 12th graders currently enrolled in a CTE workforce course
21% 49% of exiting 12th grades currently
enrolled in a CTE workforce course
50% 69% of exiting 12th grades currently enrolled in a CTE workforce course
70% or high of exiting 12th graders currently enrolled in a CTE
workforce course
4 Percent of students
participating in career assessments. (Career
Cruising)
Zero to 10% of exiting 7th graders has
participated in 1 or more Career Assessment.
11 % to 30% of exiting 7th graders have participated in 1 or
more Career Assessments.
31% 50: of exiting 7th graders have participated
in 1 or more Career Assessments.
51% or high exiting 7th graders have participated in 1 or more
Career Assessments.
5 Number of student centered college and career enrichment opportunities
(i.e. Guest Speakers, College Visits, Career Days/
Fairs, Science Fairs
0 opportunities provided annually
15 opportunities provided annually
610 opportunities provided annually
11 or more opportunities provided annually
6 Percent of CTE Students affiliated with CTE
organizations Not Applicable
020% are actively involved in a CTE Organization
2140% are actively involved in a CTE Organization
4050 % are actively involved in a CTE Organization
> 50% are actively involved in a CTE Organization
7 Number of Community based partnerships
1 to 5 6 to 10 11 to 15 16 +
Page 11MS 201415

21st Century WorkForce Development
1. Percent of students completing articulated CTE programs that lead to recognized certifications or licenses. N/A
2. Percent of Workforce articulated / dual credit courses offered for students. N/A
3. Percent of students completing coherent sequence of CTE courses. N/A
4. Percent of students participating in career assessments. (Naviance). Mrs. Rollins provided Career guidance to 92% of the 7th grade student population. Mrs. Reeder also uses Naviance with her 8th grade curriculum.
● Creates an ID for each student ● Inventory Assessment ● Research on Careers and Colleges ● Students must complete a College research exercise ● Students are provided a list of possible careers and what those careers entail. ● Then the students complete an interest inventory as well as an assessment on their personal learning style. ● Students explore Naviance video interviews of professionals in careers of interest. ● Students completed a passion project, integrating careers of interest with reallife applications using technology.
5. Number of student centered college and career enrichment opportunities (i.e. Guest Speakers, College Visits, Career Days/ Fairs, Science Fairs). HMS had a total of 15 College / Career enrichment opportunities and 36 Junior Achievement mentoring sessions related to career readiness as well as additional Junior. Achievement related AVID.
● 4 Career Mentoring Days ● Junior Achievement, Reeder = 6 = 42 Hours ● Guest Speaker, Reeder = 1 ● Junior Achievement, AVID = 32 ● Career Day = 1 ● Science Fair = 1 ● College Field Trip = 1 ● College Virtual Field Trip = 4 with guides ● Girls Smart Trip to SFA = 1
Page 12MS 201415
● AVID Guest Speakers = 8 ● AVID Parent Night = 1 ● AVID Information Night for Incoming AVID students = 1 ● AVID College Path Parent Information Night = 2 ● Junior Achievement Career Day 1
6. Percent of CTE Students affiliated with CTE organizations. N/A
7. Number of Community based partnerships. HMS has 25 businesses/education partners. ● Lockheed Martin ● Brookshire Brothers ● CiCi’s Pizza ● Marco’s Pizza ● Outback ● Angelina County Extension ● Sanders Architecture and Design ● KLMN TV Station ● First Bank and Trust ● Hudson City Hall ● Buckner Place ● District Judge ● Gann Medford ● US Forest Service ● Texas Forest Service ● DPS ● Memorial Health Systems ● Shoe Carnival ● Applebee’s ● Posados ● American Concepts ● ADAC ● Junior Achievement ● Angelina Arts Alliance ● Which Wich UIL ● ETECH
Page 13MS 201415
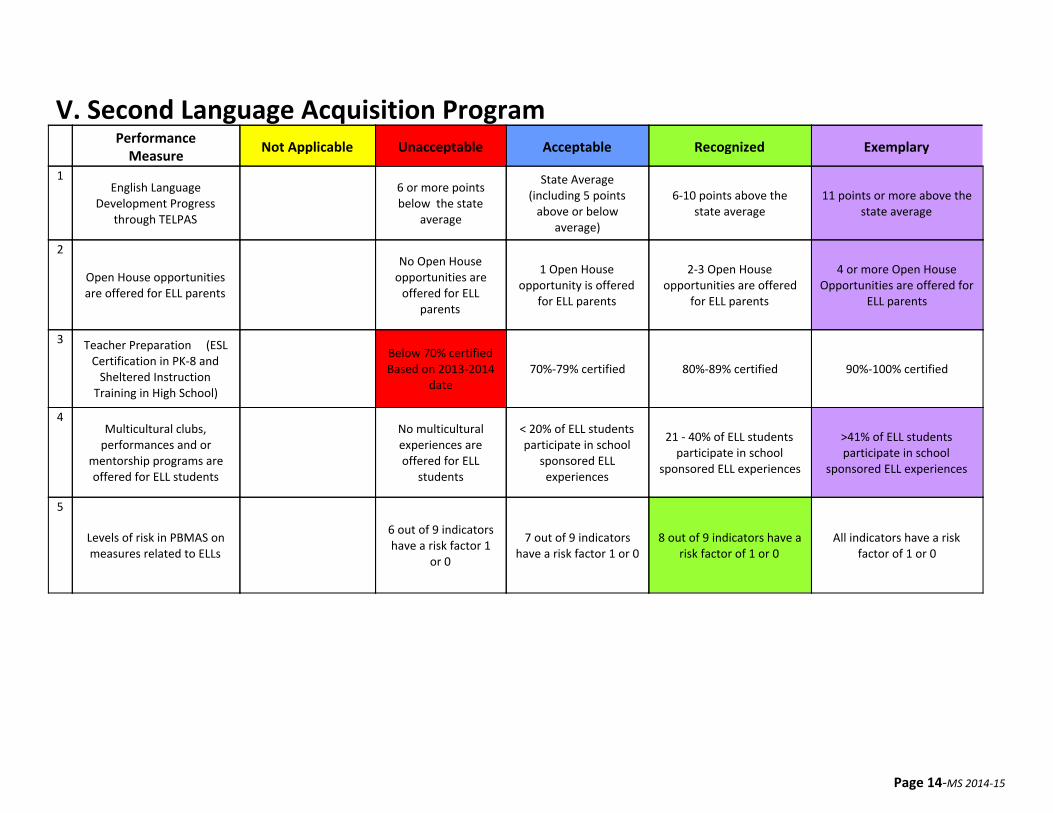
V. Second Language Acquisition Program
Performance Measure
Not Applicable Unacceptable Acceptable Recognized Exemplary
1 English Language
Development Progress through TELPAS
6 or more points below the state
average
State Average (including 5 points above or below
average)
610 points above the state average
11 points or more above the state average
2
Open House opportunities are offered for ELL parents
No Open House opportunities are offered for ELL
parents
1 Open House opportunity is offered
for ELL parents
23 Open House opportunities are offered
for ELL parents
4 or more Open House Opportunities are offered for
ELL parents
3 Teacher Preparation (ESL Certification in PK8 and Sheltered Instruction
Training in High School)
Below 70% certified Based on 20132014
date 70%79% certified 80%89% certified 90%100% certified
4 Multicultural clubs, performances and or
mentorship programs are offered for ELL students
No multicultural experiences are offered for ELL
students
< 20% of ELL students participate in school
sponsored ELL experiences
21 40% of ELL students participate in school
sponsored ELL experiences
>41% of ELL students participate in school
sponsored ELL experiences
5
Levels of risk in PBMAS on measures related to ELLs
6 out of 9 indicators have a risk factor 1
or 0
7 out of 9 indicators have a risk factor 1 or 0
8 out of 9 indicators have a risk factor of 1 or 0
All indicators have a risk factor of 1 or 0
Page 14MS 201415

Page 15MS 201415

Page 16MS 201415

Page 17MS 201415

Page 18MS 201415

Second Language Acquisition Program
1. English Language Development Progress through TELPAS.
2013 State 66.3% HMS 96.29%,
2014 State 79.16 HMS 95%
2015 State 98% HMS 95%
2016 State % HMS 98%
2. Open House opportunities are offered for ELL parents. ● Parent Breakfast Meetings = 3
● Parent / Student Lunch = 1
● ESL Awards Luncheon / Parents available to attend = 2
● Lexile Reward = 1
3. Teacher Preparation (ESL Certification in PK8 and Sheltered Instruction Training in High School). ● 100% of our teachers that teach ESL students are ESL certified. However, the total staff that are ESL certified fall below 70%
4. Multicultural clubs, performances and or mentorship programs are offered for ELL students. ● Reading Counts 13/22 Google Hangout with La Lengua staff?
● iPass 3 / 22 Business speakers from Hispanic & Vietnamese businesses?
● ESL Foundation Acceleration Program 15 Key pals with other multicultural classrooms
● Rosetta Stone 22/22
● Student led multicultural club
● Rewards Trip 12/22
● ESL Read 180 10/22
● ESL Breakfast 3
● ESL Reward Pizza Party
5. Levels of risk in PBMAS on measures related to ELLs ● HMS PBMAS report indicated 8 out of 9 indicators have a risk factor of 1 or 0.
Page 19MS 201415

VI. Digital Learning Environment
Performance Measure
Not Applicable Unacceptable Acceptable Recognized Exemplary
1
Professional development digital learning environment
opportunities
<25% of teachers participating in 3 hr. or > instructional tech PD
sessions
2650% of teachers participate in 3 hr. or > instructional technology
PD sessions
5189% of teachers participate in 3 hr. or >
instructional technology PD
sessions
>90% of teachers participate in 3 hr. or > instructional technology PD sessions
2 Teacher Competency / Proficiency Rate (# of teachers
who meet district tech competency requirements)
<25% of teachers at
each campus are Level 1 Proficient
2650% of teachers at each campus are Level 1
Proficient
5174% of teachers at each campus are Level
1 Proficient
75100% of teachers at each campus are Level 1 Proficient
3 Student Technology
Competencies (# of students who master technology
competencies by grade level)
Not Applicable Lower than 15 points of
the State Average Within 15 points of the
State Average
More than 15 points above the State
average
More than 20 points above the State average
4
21st Century Classrooms
<80 % of classrooms meet district digital
environment spec for 21st century classroom
8189 % of classrooms meet district digital
environment spec for 21st century classroom
90100 % of classrooms meet district digital
environment spec for 21st century classroom
>25% of classrooms exceed the district digital
environment spec for 21st century classroom
5 Digital/Distance learning (% of students successfully
completing courses for original credit in digital environment)
Not Applicable <80% 8189.9% 9096% >97%
6 Student Technology
Competencies Local to State
<10 points Below State Average
+/ 11 points of State Average
1220 points above State Average
21+ points Above State Average
7
Virtual Learning Opportunities 040 4180 81120 121160
Page 20MS 201415

Digital Learning Environment
1. Professional development digital learning environment opportunities. All HMS Teachers were trained in Google Docs, Google Calendar, Google Drive, Screencast, Google Hangout, Powtoon, Prezi, Emaze, Etc.
All HMS Teachers earn 6 hours of professional development during the HISD Technology Showcase, CAST training (Science and Tech),
Google conference, TCEA, Digital textbook training, Read 180, Penda training, Study Island, Learning.com
2. Teacher Competency / Proficiency Rate (# of teachers who meet district tech competency requirements). 100% of HMS Teachers has completed the required Technology Competencies for the calendar year. This is up 25% from last year.
One teacher earned a Google Teacher Certification & Microsoft Innovative Educator Certification.
3. Student Technology Competencies (# of students who master technology competencies by grade level). 68% of 6th grade students scored Proficient or higher on state TA assessment
Seventh grade technology students create projects that integrate with other classes (e. g. a history presentation that covers a lesson
from their history class; a science presentation that covers a lesson from their science class).
4. 21st Century Classrooms, Exemplary, 37% of HMS teachers exceeds the digital environment specs for 21st Century Learning. Teacher Technology Badge Earners 20152016
5. Digital/Distance learning (% of students successfully completing courses for original credit in digital
environment). N/A
(Sandra Wagner7thGrade Technology)Mr. Crenshaw suggested that the 7th grade Computer
Applications class be counted as high school credit.
Page 21MS 201415

6. Due to EOC assessments, TSI assessments, and newly created drone racing competition our advanced
students were not available for this assessment which drastically skewed our percentile ranking when
compared to state and global results. Without question our students would have performed in the
exemplary range as their previous score was at 89%.
7. Hudson Middle School completed a total of 154 virtual learning opportunities during the 20152016
school year. UIL competition for middle school technology students Link to Google Hangout Sheet
Page 22MS 201415

VII. Educational Programs for Gifted and Talented Students
Performance Measure
Not Applicable Unacceptable Acceptable Recognized Exemplary
1 GT Teachers Meeting State GT Hours Requirements
(K12)
< 100% G/T Teachers
Meeting State Requirements
100% GT Teachers Meeting State Requirements
100% GT Teachers Meeting State Requirements AND 20% of those GT teachers have 3 Additional Hours
100% GT Teachers Meeting State Requirements AND >20% of those GT teachers have 6 or
more Additional Hours
2 Parental Involvement Opportunities for GT Program Options
(K12)
Less than One Parental Involvement
Opportunity during an academic year
One Parental Involvement Opportunity during an
academic year
Two Parental Involvement Opportunities during an
academic year
Three or More Parental Involvement Opportunities during an academic year
3 GT Service Opportunities provided for GT
students (K4)
NOT All GT Students are receiving required GT
Service
ALL GT Students Meet Requirements of GT
Service
ALL GT Students Meet Requirements of GT Service PLUS 3 additional service
hours or 1 additional project
ALL GT Students Meet Requirements of GT Service
PLUS >3 additional hours or >1 additional projects
4 GT Service Opportunities
Academies/PreAP/AP (212)
Less than 85% of GT
Students participate in GT Program Options
8590% of GT Students participate in GT Program
Options
9095% of GT Students participate in GT Program
Options
96100% of GT Students participate in GT Program
Options
5 GT Students Participate in
Rigorous Projects (K8)
Do NOT Participate in
Rigorous Projects during an academic year
Participate in ONE Rigorous Project during an
academic year
Participate in TWO Rigorous Projects during an academic
year
Participate in THREE Rigorous Projects during an academic
year
6 Academic UIL
Competition Outcome
Did not participate in UIL Academic Competition
Ranked 3rd in District Academic UIL Competition
Ranked 2nd in District Academic UIL Competition
Ranked 1st in District Academic UIL Competition
7 Student leadership activities, field trips
and/or competitions are planned for GT students
GT students do not have the opportunity to participate in school leadership activities,
dedicated field trips or competitions.
Student leadership activities are provided for GT students
Student leadership activities and a minimum of 1 field trip are provided for GT students
Student leadership activities, a minimum of 1 field trip and 1 competition opportunity are provided for GT students
Page 23MS 201415

Educational Programs for Gifted and Talented Students
1. "GT Teachers Meeting State GT Hours Requirements (K12)" ● All G/T Teachers are G/T certified.
2. "Parental Involvement Opportunities for GT Program Options (K12)". ● Exemplary
● UIL
● Science Fair
● ADV Science Field Trips x 2
● GT Mentoring Trip
● Robotics Program
● Robotics GT Mentoring Program
3. "GT Service Opportunities provided for GT students (K4)". ● All HMS GT students are enrolled in advanced curriculum
● All HMS GT students are exposed to a minimum of 8 projects per year
● HMS Robotics Program
● 3D Printing Class
● GT Pullout for 6th and 7th grades (the title says K4 does this apply to us at HMS?)
4. "GT Service Opportunities Academies/PreAP/AP (212)". ● 100% of HMS GT students participate in GT Program Options.
5. "GT Students Participate in Rigorous Projects (K8)". ● Energy Investigation / Prezi
● Science Fair Project
● Children of the Holocaust Project / Presentation QR code
● World Religions Brochure
● Biography Presentation / presented info through PPT, original book jackets, oral presentations w/costumes and prompts
Page 24MS 201415

● “The Clay” Boat Construction Project The Hour of Code
● Body Systems and Disease Research Project
● Recycling in the Ecosystem (Composting)
● Colonization Project: research, timeline, journal, Venn diagram, advertisement, and table
● Famous Texan Project: research, digital resume, business cards, speech writing, and presentations
● SelfSustaining 3D Island Project
● Formal Research Project
● Student Created YouTube tutorials
● Enchanted Rock Field Trip
● Native Americans in Texas research project with 3D model
● Texas Times – student created newspaper
● Texas History Museum
● AlgebraHigh school course
● Geometry Map Project
● Ration and Rate Project & Presentation
● Graphing Project
● Researched “PI” and presented to class
● Created Review Games and Implemented
● Heritage Booklet
● Biography Presentation
● Boat Construction –Boats built to specific requirements
● The Hour of Code Introduction of computer coding
● Science Fair Project
● Body Systems and Disease Research Project
● Recycling in the Ecosystem
● Guess Who’s Coming to Dinner
● Bill of Rights Video Creation/Presentation
● The 13 Colonies Project
● Student Interviews Use of Classroom Technology
● Poetry Project
● Writing Portfolio
Page 25MS 201415

● Researched Alaska for novel study presented to class
● Research Prezi project using foreign currency and American made products
● Scavenger Hunts for math with Algebra Concepts and Extensions for Eighth Grade TEKS with Real World Applications
● Alternate Exam as a RealWorld Application Project Using Math Concept
● Inventions Project: PowerPoint/Prezi/Google presentation reflecting knowledge of 5 scientific or technological inventions
● Atomic structure research: student built a 3D model of an atom and completed a blog which enabled them to collaborate and
share with their peers.
● Real World Relevancy Writing Essay Contests (VFW Patriot Pen and Daughters of American Revolution)
● My Odyssey Project involving formal research writing and Glogster.edu presentations using several database resources
● Students were provided an opportunity to explore the contributions of various scientists to the development of the cell theory
then write a blog or journal entry from the point of view of that scientist describing his thoughts and feelings as he made his
discovery.
● After researching biomes, students described the current adaptations of an organism to survive in its current ecosystem, then
they moved the organism to another type of ecosystem. They described the new adaptations needed and drew the organism in
its new habitat with its new adaptations.
6. Academic UIL Competition Outcome ● For the 13th year in a row HMS ranked 1st in academic UIL
7. Student leadership activities, field trips and/or competitions are planned for GT students ● Hudson Helps Field Trip
● UIL Field Trip
● Science Field Trip
● Science Fair
● Robotics Competition
● GT Mentoring Field Trip
● Band Field Trip
● In addition, all grade level participate in an end of the year field trip
● Hydro Day (STEM Program) at SFASU
Page 26MS 201415

VIII. Dropout Prevention
Performance Measure
Not Applicable Unacceptable Acceptable Recognized Exemplary
1
Percent of 8th grade students with High
School credit (MS)
<10% 1025% 2650% >50%
2
Percent of students participating in
extracurricular classes (High School)
Not Applicable < 10% 10% 15% 16% 25% > 25%
3 Number of
clubs/organizations offered
<1 23 45
4 Campus has designed intervention programs for atrisk students
Specific intervention programs are not available on the
campus
Campus offers 1 3 intervention
programs/strategies
Campus offers 4 6
intervention programs/strategies
Campus offers more than 6 intervention programs/strategies
5
Mentor programs provided for at risk
students (athlete, Dad's night, peertopeer)
O mentor programs
provided Occasionally Generally Somewhat Consistently Throughout the year
6
Campus incentives are provided to acknowledge
attainment of various educational goals.
Campus does not offer
student incentives
Campus offers a minimum of 1 student
incentive program
Campus offers 2 3 student incentive
programs
Campus offers 4 or more student incentive programs
Page 27MS 201415

Dropout Prevention
1. "Percent of 8th grade students with High School credit (MS)"
23% 46 Students in Algebra I
2. "Percent of students participating in extracurricular classes (High School)"
3. " Number of clubs/organizations offered “ ● Art Club ● CIA ● Hudson Helps ● After school Choir ● Bass Club
4. Campus has designed intervention programs for atrisk students ● Why Try, Local and DAEP ● Special Ed Group and individual Counseling ● IPass x2 ● Read 180 x3 ● ESL Read 180 ● Foundation Acceleration Program ● AVID ● Christmas Shoe Design ● Rosetta Stone ● iPad Giveaway ● 8th Grade AtRisk Counseling Group
Mentor programs provided for at risk students (athlete, Dad's night, peertopeer ● Career Mentoring ● Why Try,
Page 28MS 201415

● Random Acts Of Kindness ● Provide support for Career Cluster project from local professionals
5. Campus incentives are provided to acknowledge attainment of various educational goals. ● Campus Fundraiser ● 6th Grade Rewards Trip ● 7th Grade Rewards Trip ● 8th Grade Rewards Trip ● Fire HD7 Giveaway ● Two ESL Awards Trips ● Three IPass Parties ● Reading Counts Awards Trip ● Dyslexia Rewards Trip ● Hudson Helps Reward Trip ● Various Attendance parties ● Christmas Shoe Giveaway ● 7th Grade Spotlight Students each 9 weeks (author, historian, mathematician, scientist, artist, athlete, instrumentalist) ● Students of the Month Recognition and lunch off campus ● Awards Ceremonies for each grade level
Page 29MS 201415