Embed Size (px)
Citation preview

Analyst-Ready Large Scale Real Time Information Retrieval
Tool for E-Governance
1. Eugene Santos, Jr. (Principal Author)
Thayer School of Engineering,
Dartmouth College,
8000 Cummings Hall
Hanover, NH 03755
E-mail: [email protected]
Phone: (603) 646-6490
Fax: (603) 646-2277
3. Hien Nguyen
Mathematical and Computer Sciences
Department,
University of Wisconsin, Whitewater, WI
Email: [email protected]
Phone: (262) 472-5170
5. John Korah
Department of Computer Science,
Virginia Polytechnic Institute & State
University,
660, McBryde Hall,
Blacksburg, VA-24060
Email: [email protected]
Phone: (540) 231-4346
7. Fei Yu
8000 Cummings,
Thayer School of Engineering,
Dartmouth College,
Hanover, NH 03755
Email: [email protected]
Phone: (603) 646-9945
2. Eunice E. Santos
Department of Computer Science,
Virginia Polytechnic Institute &
State University,
660, McBryde Hall,
Blacksburg, VA-24060
Email: [email protected]
Phone: (540) 231-5368
4. Long Pan
Department of Computer Science,
Virginia Polytechnic Institute &
State University,
660, McBryde Hall,
Blacksburg, VA-24060
Email: [email protected]
Phone: (540) 231-4346
6. Huadong Xia
Department of Computer Science,
Virginia Polytechnic Institute &
State University,
660, McBryde Hall,
Blacksburg, VA-24060
Email: [email protected]
Phone: (540) 231-4346
7. Deqing Li
8000 Cummings,
Thayer School of Engineering,
Dartmouth College,
Hanover, NH 03755
Email:[email protected]
Phone: (603) 646-9945

2
Analyst-Ready Large Scale Real Time Information Retrieval
Tool for E-Governance
ABSTRACT
With the proliferation of the Internet and rapid development of information and
communication infrastructure, E-governance has become a viable option for effective
deployment of government services and programs. Areas of E-governance such as
Homeland security and disaster relief have to deal with vast amounts of dynamic
heterogeneous data. Providing rapid real-time search capabilities for such
databases/sources is a challenge. Intelligent Foraging, Gathering, and Matching (I-FGM) is
an established framework developed to assist analysts to find information quickly and
effectively by incrementally collecting, processing and matching information nuggets.
This framework has previously been used to develop a distributed, free text information
retrieval application. In this paper, we provide a comprehensive solution for the E-GOV
analyst by extending the I-FGM framework to image collections and creating a “live”
version of I-FGM deployable for real-world use. We present a CBIR based image retrieval
tecnique that incrementally processes the images, extracts low-level features and map them
to higher level concepts. Our empirical evaluation of the algorithm shows that our
approach performs competitively compared to some existing approaches in terms of
retrieving relevant images while offering the speed advantages of a distributed and
incremental process, and unified framework for both text and images. We describe our
production level prototype that has a sophisticated user interface which can also deal with

3
multiple queries from multiple users. The interface provides real-time updating of the
search results and provides “under the hood” details of I-FGM processes as the queries are
being processed.
Keywords: Distributed Systems, Agent Technology, Image retrieval, IS Performance Evaluation, Real-Time
IS, Information search and retrieval, Intelligent Agents , CBIR, Heterogeneous databases
INTRODUCTION
One of the main challenges in E-governance is to effectively and efficiently find relevant
information from vast amounts of dynamic heterogeneous sources quickly under the
pressures and limitations of time, supporting tools, and resources. For instance, when
natural disasters such as Hurricane Katrina (2005) or the Asian Tsunami of 2004 happen,
we need to quickly locate the areas that are most affected and collect information in order
to estimate the amount of relief items such as medicines, foods, and drinking water.
Unfortunately, in such a situation, frontline communications are typically chaotic and/or
there are too many channels of information from different sources that make the retrieval of
relevant pieces of information a lot harder. For “hot spots” such as disaster relief areas,
combat zones, etc., information is changing rapidly and as such, there is only a small
window of time during which information remains valid. Additionally, various types of
data representation are used such as images, blogs, maps, news reports, audios, and videos.
Each type of data format contains important and indispensable information for the various
governmental agencies. Therefore, in order to better assist these agencies in addressing
these challenges, there is a clear and urgent need to develop a system that rapidly provides
real-time retrieval capabilities of heterogeneous sources of information. There are three
main issues that we need to address: (i) how to gather and retrieve information quickly in a

4
real-time setting given the limitations of resources and time; (ii) how to address the
problem of heterogeneous data; and, (iii) how to improve retrieval success.
We address the above issues by developing a framework for intelligent foraging,
gathering, and matching (I-FGM) that incrementally and distributively gathers, processes,
and matches information nuggets to assist users at finding information quickly and
effectively. In our previous work (Santos et al, 2005, 2006), I-FGM has been empirically
demonstrated to be an effective tool for text retrieval on large and dynamic search spaces.
Even though unstructured text is a typical format for most databases/sources, images are
also popular with significant support from commercialized search engines such as Google,
Yahoo!, and MSN. In order to demonstrate that I-FGM is a general framework for
information retrieval, it is necessary to study the system‟s ability at effectively handling
such heterogeneous databases which contain at least text and images. In this paper, we
apply the I-FGM framework on image collections by using a Concept Based Image
Retrieval (CBIR) method. We approach this by incrementally processing the images,
extracting low-level features, and then mapping them to higher level concepts. The
novelties of our approach lie with the distributed storage, and incremental processing and
matching of information nuggets extracted from a region-based wavelet image retrieval
scheme. We deploy a concept-based image retrieval algorithm that maps low level features
of the images to high level concepts. In this way, we are also able to translate the visual
information of images into document graphs (Santos et al, 2005) which are used in I-FGM
as a common representation of information for heterogeneous data types. Thus, I-FGM
provides a seamless integration of text and image through a single unifying semantic
representation of content. By implementing and testing our image retrieval algorithm in I-

5
FGM, we can validate the I-FGM framework as a method for future unified rankings of
heterogeneous documents.
The prototypes presented in our previous efforts were primarily aimed at validating the I-
FGM framework and was not meant to be deployed in the field. In order to fully validate I-
FGM as an effective tool for the E-Gov analyst, we implemented a Production-level
system. This system uses 79 high end computing nodes versus the 20 nodes in the earlier
prototypes. The extensive computing resources enable us to guarantee quick results despite
multiple queries from multiple users being processed simultaneously in the system. One
notable difference with the previous prototype is that text and image retrievals are
performed simultaneously for a given query. Additionally, we provide a set of tools for
users to monitor the progress of their search via a graphical user interface. This interface
displays the status of the internal processes in the system and allows the user to tailor the
framework to his/her needs or area of expertise.
This paper is organized as follows: In the methodology section, we first provide a brief
background on current image retrieval systems. Next, we give an overview of the image
retrieval algorithm that was implemented in I-FGM. We then describe the architecture of I-
FGM and the implementation details of the current prototype. This section is followed by a
description of our system evaluation procedure along with simulation results. We validate
the performance of the image algorithm and show that it can be used in I-FGM for faster
retrieval of images. Next, in the production system section, we explain in detail about its
setup and how it interacts with the users. Finally, we will present our conclusions and
future work.

6
METHODOLOGY
Background and Related Work
The goal of the Intelligent Gathering, Foraging, and Matching (I-FGM) framework is to
facilitate real time searches in large and dynamic search spaces. In particular, I-FGM aims
to integrate the retrieval of multiple data types; to enable a unified framework to compare
heterogeneous documents; and, to employ resource allocation policies facilitated by partial
processing to conduct efficient anytime searches. In this paper, we integrate image
retrieval in I-FGM by employing an algorithm based on techniques from Content Based
Image Retrieval (CBIR). We now present the current state of research in CBIR and the
approaches that have been leveraged in I-FGM.
CBIR is an important sub-area of image retrieval that aims to classify, identify, and retrieve
images based on its visual content rather than using human generated information such as
meta-tags, and annotations. Through the previous decade, there has been significant
progress in this field, documented in various surveys (Rui, Huang, & Chang, 1999;
Smeulders, M. Worring, Santini, Gupta, & Jain, 2000; Veltkamp & Tanase, 2000).
Although, a general solution for image retrieval still eludes researchers due to the
difficulties posed by the well-documented phenomena of sensory gap and semantic gap
(Enser & Sandom, 2003), CBIR techniques have shown great promise in automating the
process of interpreting images. We decided to employ CBIR in I-FGM because other
methods require extra-image information such as meta-tags or HTML text from web pages
containing the image. In the CBIR methods, the visual content or low-level features of the
images have to be converted into an intermediate form or signature before it can be
interpreted. Our choice of low-level features and feature signature are important as it has a

7
direct influence on the performance of the system. Examples of low-level features in
images are color, texture, and contrast.
Region-based methods are a widely used type of CBIR. In these methods (Carson,
Belongie, Greenspan, & Malik, 2002; Li, Wang, & Wiederhold, 2000; Ma & Manjunath,
1997; Natsev, 2001), images are divided into regions, each of which has similar pixel
characteristics. This collection of regions forms a signature for the image. The premise
behind these methods is that similar images will have similar regions. Methods such as
WALRUS (Natsev, Rastogi, & Shim, 2004) and SIMPLIcity (Wang, Li, & Wiederhold,
2001) use wavelets (Daubechies, 1992) to represent the feature signature of regions.
Methods such as (Natsev, Rastogi, & Shim, 2004; Wang, Li, & Wiederhold, 2001) generate
regions by calculating a feature signature for a part of the image (window) at a time. The
window is slid across the image such that every pixel of the image is contained in at least
one window. These windows are then clustered based on a distance measure. Each cluster
is then considered to be a region. These methods work well even with complex images,
containing multiple concepts or objects. One of the drawbacks in these methods is that
they take query images, instead of a text query. This is also one of the reasons preventing
its direct usage within the I-FGM framework.
We will use the image segmentation and region clustering techniques from WALRUS in
our image retrieval algorithm. The feature vector that we use to represent the low level
features of the image is similar to the one used in SIMPLIcity. Although SIMPLIcity is a
well known regions method, it does only coarse grained classification of images into
semantic classes such as “outdoor”, “indoor”, “texture”, “non-textured”, and
“photographs”. I-FGM on the other hand deals with more fine-grained classifications. Our

8
algorithm seeks to map low level features to high level concepts, by forming regions of
similar pixel characteristics and then mapping them to the concepts. Although this is
similar to the CAMEL (Natsev, Chadha, Soetarman, & Vitter, 2001) algorithm (a variant of
the WALRUS method), there are significant differences. The concepts used in CAMEL
are single object concepts such as “apple”. It compares the feature vectors for this concept
with incoming images and tries to determine if the concept is contained in the image using
a distance based similarity measure. We found that CAMEL does not deliver the required
performance when implemented with the images that we typically deal with. The main
reason is that it is difficult to accurately identify single object concepts in images. Another
important reason why we cannot use this method is that it uses a distance based similarity
measure that is adversely affected by the presence of non-relevant features in the images.
A better option is to use machine learning techniques to match the low level features of
concepts and images. ALIPR (Li & Wang, 2006) is another automatic annotation method
that tries to map low level features to keywords. ALIPR is an established method that has
given good performance. It has also been used commercially. Unfortunately, it cannot be
used with the partial processing paradigm of I-FGM. In I-FGM, we incrementally process
an image, using each partial step to gain an insight into the relevancy of image and
proportionately grant resources. The information gathered from one step has to be reused
in successive partial steps so as to minimize the overhead. In ALIPR, the probability
distributions associated with its feature vectors cannot be calculated with the incomplete
image information available at each partial step in I-FGM.
Another technology that we will leverage in I-FGM is the prevalent WWW image search
engine. I-FGM uses the Internet as a search space in this paper since it is a rich source of

9
images and dynamic in nature. We will use image search engines such as Google and
MSN to do a first order filtering on the search space similar to the Internet and narrow
down the search space. These search engines cannot be used for real time retrieval as
they use static indexes that are built offline (Kherfi, Ziou, & Bernardi, 2004). Also, they
require human generated information in the form of the html text surrounding the images
(Tsymbalenko, & Munson, 2001) or meta-tags. On the other hand, analysts using I-FGM
must deal with images from various sources: satellite imagery, aerial reconnaissance
images, etc., which may not be accompanied by annotations.
In this paper, we seek to incorporate image search by implementing a concept-based image
retrieval algorithm. Our algorithm will extract low level features of images and map to
pre-defined concepts. We will show how we can convert images into document graphs
which are the common knowledge representation used in I-FGM. By doing so, we will
validate our framework for unifying heterogeneous data types.
Image Retrieval for I-FGM
As mentioned earlier, we have validated I-FGM as a credible framework to provide real
time search in large and dynamic free text databases. Here, we incorporate image retrieval
into the framework. As such, our goal is not about presenting a new method for image
retrieval but rather a method that is built on principles that have been tested and validated
by the image retrieval research community which can be used in the I-FGM framework.
We will use our image retrieval algorithm to validate the I-FGM framework on image
collections. We also intend to show how smart resource allocation strategies can reduce
computational costs and save time when dealing with large and dynamic databases.
Furthermore, by representing the information in images as a document graph, we will have

10
demonstrated how a unified representation can be applied to multimedia (text and/or
image) documents.
Fig. 1: Document graph for the text “Workers at coal mine on strike”
As we mentioned earlier, heterogeneity is a particularly important issue in the databases
that I-FGM expects to deal with, in support of governmental agencies. Our databases may
contain documents of different data type (images, text, multi-media files). Within each
data type, another level of heterogeneity can occur. For example, images can occur in
different forms such as photographs, satellite imagery, maps, etc. A straightforward
method of dealing with this is to use separate retrieval methods for each data type and
somehow combine their ranking results. This is a very ineffective method since the
ranking measures used by the separate methods may share little or no semantic
relationships. For example, it is difficult to decide whether an image of similarity x based
on texture and color values is as relevant to users as a text of the same similarity value
based on keyword matches. We resolve this problem by extracting the information from a
document using a given retrieval method and then representing the semantic contents of the
workers
related_to
coal mine
coal mine
related_to is_a
strike
related_to

11
document in a common graphical structure called the document graph. A document graph
(example in Fig. 1) consists of nodes representing concepts, and edges representing
relations between nodes. This representation extracts the main information contained in
any given document.
The image retrieval method that we use with I-FGM requires certain characteristics as we
alluded to in the previous section. First, it should be amenable to partial processing where
information gleaned from each partial step is re-useable by the next partial step. Next, the
similarity measure calculated from each partial step should be a good indicator of the final
similarity value, which helps in designing resource allocation strategies. Also, the time
taken to process an image with partial processing should not be significantly larger than
one-step processing. Finally, the method should also be able to convert the visual content
of images into document graphs. All of this will allow us to accept natural language
queries so as to be consistent with the text retrieval methodology already deployed within
I-FGM.
Image
p erson
scenery
house
Region extraction Concept matching Concept graph generation
Comparing with query graph
Query
Graph

12
Fig. 2: Image Retrieval in I-FGM
A step-by-step representation of the retrieval process is depicted in Fig 2. When a new
image arrives in the system, it is incrementally processed to extract its low-level features in
the images. These features are compared with those images found in the concept library
and matching concepts are then noted. Here, the concept library is a collection of well
known concepts along with its annotation and an image feature vector representing its
characteristics. The concept feature vector is modeled by a machine learning algorithm
using a training set. The text annotations of these concepts are then combined to form the
textual description of the image. The description is then converted into a document graph
which is then compared with the document graph representation of the natural language
query (query graph) and a similarity value is calculated. We now describe the steps of the
image retrieval algorithm in detail:
a) Low level feature extraction: Each image is represented by a 16 dimensional feature
vector with each dimension representing a region of image. An image is said to have a
maximum of 16 regions. This is borrowed from SIMPLIcity where it was found that 16
regions give good performance. Since we also use the same feature vector, we decided to
use this value. Each region is represented by a six dimensional vector representing the
color and texture information of the images. In order to extract the regions from an image,
the image is incrementally processed with a sliding window. We use the LUV color space.
For each window, a signature is calculated from the average values of the color and the 2x2
wavelet transform on the L component. Haar wavelets are used as they are
computationally efficient and have good performance (Natsev, Rastogi, & Shim, 2004).

13
The first three components of the signature is the average values of L, U and V values of
the pixels in the window, respectively. The high frequency components of the wavelet
transform form the remaining three components of the window signature. The signature of
a window w is of the form:
wwwwwww mmmvulh 321 ,,,,,
where lw, uw, vw are the average values of the pixel color in windows w and m1
w, m2w, m
3w
are the high frequency components of the Haar wavelet transform of the L values in w.
Based on their signatures, the windows are clustered together using a clustering algorithm.
We use the BIRCH (Zhang, Ramakrishnan, & Livny, 1996) clustering algorithm as it is
one of the most efficient clustering algorithms available. Each of the clusters form a region
represented by its centroid. The area of each region is also calculated simultaneously. The
regions are sorted according to its area and the largest region‟s signature form the first
dimension of the image feature vector, the second largest region form the second
dimension and so on. Hence the image feature vector of an image x is represented by the
vector:
16,3
16,2
16,1
16,16,16,1,3
1,2
1,1
1,1,1, ,,,,,.....,,.........,,,,, xxxxxxxxxxxxx mmmvulmmmvulf
where lx,i, ux,i vx,i are the average color values in the centroid for region i and m1
x,i , m2
x,i
m3
x,i are the wavelet transforms for the L color space in the centroid for region i.
b) Creation of the concept library: The library is created offline and this process is
depicted in Fig. 3. It consists of a set of concepts that are commonly found in the image
databases that I-FGM is searching. Each concept is accompanied by a short textual
description, which is generated manually. In our method the low level features of images
are mapped to concepts in the library. The descriptions of the relevant concepts are then

14
used to automatically generate the annotation for the images. This method of automatic
annotation of images has less manual intervention than most other methods that generally
require human generated metadata for each image. A classifier for each concept is
generated by a machine learning algorithm based on logistic regression. A detailed
description of the machine learning algorithm is presented below. A set of training images
are used to create the classifier. The training images are of two types: images that represent
the concept (positive training) and images that do not represent the images (negative
training). The image feature vector is extracted for each of these images and fed into the
machine learning technique to create the classifier.
Fig. 3: Offline creation of concept library
c) Image Matching: This process matches low level features of the images to high level
concepts (Fig 4). For each image, we incrementally compute its feature vector. During
each incremental step, the image feature vector for the portion of the image that has been
processed is calculated and compared against the concept classifiers in the library. A
machine learning algorithm determines if a particular concept is relevant to the image or
Positive
Negative
Training Images
Calculation of feature vector for sliding windows
Clustering of windows into
regions
Calculation of classifier using
Logistic regression
Concept X
Concept Description
Concept classifier
Feature Extraction
Concept Library

15
not. If a concept is relevant, its concept annotation is stored. At the end of the matching
phase, the annotation of all matched concepts are combined together to form the image
description. The description is converted in to a document graph and compared with the
document graph of the query where the similarity is calculated.
Fig. 4: Extraction of relevant concept from the image
d) Machine learning algorithm: Logistic regression (LR) is appropriate for matching
concepts in the concept library with images because it can be modeled as a binomial
classification problem. LR has been found to be appropriate for binary classification and
can be improved to achieve fast speed and reliability (Komarek, 2004). Some studies have
compared LR with some other popular classifiers used in machine learning such as tree
induction (Perlich et al, 2003), Naïve Bayesian classifier (Mitchell, 2005), and support
vector machine (Vapnick, 1999). It has been found (Perlich et al, 2003) that LR performs
better with small training data set while tree induction is better with a large data set. Naïve
Bayesian classifiers require conditional independence among variables. Therefore, its
application is limited, and in situations where such an assumption does not hold, LR is
Images Calculation of
feature vector for
for sliding windows
Clustering of windows into
regions
Calculation of image feature
vector
Feature Extraction
Concept Library
Concept X
Concept Description
Concept classifier Concept matching Image text description Document graph
generation

16
found to perform more accurately than Naïve Bayes (Mitchell, 2005). The loss function
used in LR has been shown to be approximated by a support vector machine (Vapnick,
1999, Zhang et al, 2003). Algorithms based on LR have been used in CBIR (Ksantini,
Ziou, Colin, & Dubeau, 2007) and in relevance feedback (Caenen & Pauwels., 2002) for
image retrieval. Each concept is either relevant to the given image or not. The dependant
variable (relevancy of the concept) can have two values: 0-not relevant and 1-relevant. The
explanatory variables are the centroids of the regions in the image. The classifier for a
particular concept is calculated by using positive and negative images. As mentioned
before, the image vectors of each of these images are used to train the classifier. The
training inputs are of the form:
},,,,,,,.........,,,,,{ 16,3
16,2
16,1
16,16,16,1,3
1,2
1,1
1,1,1, jiiiiiiiiiiiij rmmmvulmmmvult
where lx,i, ux,i vx,i are the average color values in the centroid for region i in the training
image j. m1
x,i , m2x,i m
3x,i are the wavelet transforms for the L color space in the centroid for
region i in the training image j
images positivefor 1
images negativefor 0rj
The logit function for an image vector x is given as
16,3
9616,2
9516,1
9416,9316,92
16,911,3
61,2
51,1
41,31,21,1
.....
..............)(
xxxxx
xxxxxxx
mmmvu
lmmmvulxg
where α, βi (1 ≤ i ≤ 96) are weights calculated by the maximum-likelihood method from
the training images. The logistic regression algorithm is implemented using the WEKA
software (Witten & Frank, June 2005).
17
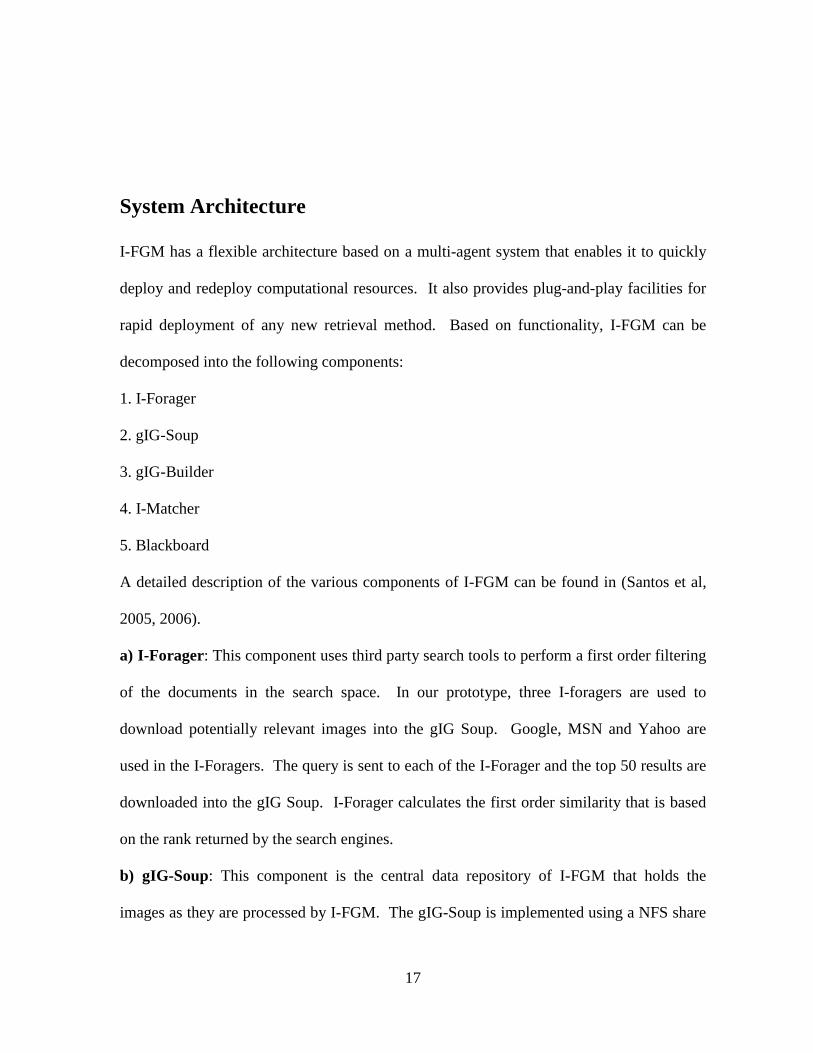
System Architecture
I-FGM has a flexible architecture based on a multi-agent system that enables it to quickly
deploy and redeploy computational resources. It also provides plug-and-play facilities for
rapid deployment of any new retrieval method. Based on functionality, I-FGM can be
decomposed into the following components:
1. I-Forager
2. gIG-Soup
3. gIG-Builder
4. I-Matcher
5. Blackboard
A detailed description of the various components of I-FGM can be found in (Santos et al,
2005, 2006).
a) I-Forager: This component uses third party search tools to perform a first order filtering
of the documents in the search space. In our prototype, three I-foragers are used to
download potentially relevant images into the gIG Soup. Google, MSN and Yahoo are
used in the I-Foragers. The query is sent to each of the I-Forager and the top 50 results are
downloaded into the gIG Soup. I-Forager calculates the first order similarity that is based
on the rank returned by the search engines.
b) gIG-Soup: This component is the central data repository of I-FGM that holds the
images as they are processed by I-FGM. The gIG-Soup is implemented using a NFS share

18
directory to hold the image documents and a MySQL database that stores the document
details such as image file name, similarity values and first order similarity. MySQL tables
are also used to synchronize the working of the different components of I-FGM.
c) gIG-Builder: This component processes the document in the gIG-Soup into a document
graph that is compared with the query graph to calculate its similarity. The gIG-Builders
incrementally process the images and calculate the image feature vector. The feature
vector is compared with classifiers in the concept library and matching concepts selected.
The descriptions of the matched concepts are combined to form the text description of the
concepts. Now that we have a text description of images, we can convert it into a
document graph using the same method that we use for a text document (Santos et al, 2005,
Santos et al, 2006). The image retrieval algorithm was described in detail in the previous
sub-section. gIG-Builders select an image based on the priority values and calculate the
signature of a certain number of windows, which is again dependant on the image priority.
8x8 pixel windows and sliding distance of 4 pixels are used. The feature vectors of the
windows processed until that moment are clustered using the BIRCH clustering algorithm
with a threshold value of 70. The centroids and areas of the clusters or regions are stored.
The feature vector of the image is updated and compared with the classifiers in the library
using the logistic regression algorithm. The text description of the matched concepts are
combined together to provide the text representation of the image.
d) I-Matcher: After the images have been converted into a document graph, it is compared
with the query graph. The query graph is produced when the query is converted into a
document graph. After comparison of the two graphs, a similarity measure is calculated. It

19
is a numerical measure of how close the image is to the query. The similarity is given by
the formula:
21
1
21
21
C where1
C where1
*)*2*2
(),(
CL
C
CL
CC
M
m
N
ndqsim i
where q is the query graph, di is the document graph, n and m are the number of concepts
and relation nodes respectively, of the query graph found in the document graph, and N and
M are the total numbers of concept and relation nodes of the query graph. Two relation
nodes are matched if and only if at least their parent and their child are matched. ρ is a
probability measure of our confidence in the similarity. C1 is the number of concepts
matched to the image and C2 is the number of possible relevant concepts. We calculate C2
from the number of concepts in the query graph. Since the concepts that are matched to the
image are not always correct, we use ρ as a weight to the similarity value. For some
images, the matched concepts are varied; for example "dinosaur", "snowstorm", and
“fruits”. These images happen to have pixel characteristics found in all these concepts. By
using a confidence measure, we are quantifying how sure the machine learning algorithms
is about its matches. If the matches are small in number, that images have certain unique
pixel characteristics that are found in only certain concepts. The confidence measure will
be high for these images. For images that match a large number of concepts, we say that
the machine learning algorithm is not so confident about its matches.

20
The priority value for the image is also calculated after each partial step. The priority
function is used to determine the order in which the documents in the gIG Soup will be
processed. This guides the allocation of computing resources. The amount of processing
done during a particular step is also determined by the priority. The priority formula used
is identical to the one in (Santos et al, 2006) except for the weights that were calculated for
images, are used in the formula.
e) Blackboard: Since the documents are partially processed, its similarity values changes.
In addition to this, the search space is dynamic. The documents having the top similarity
values will change over time. Blackboard will display the most recent results in a rolling
fashion. Such a display is essential when real time search results are required.
DISCUSSION
Results and Analysis
We validate the performance of our image retrieval algorithm in 3 steps. In the first set of
experiments, we validate the ability of the logistic regression based machine learning
technique to match image features to relevant concepts. We do this by comparing with
another machine learning technique called C5.0 (Quinlan, 1993). C5.0 is an established
data mining tool for discovering patterns that delineate categories, assembling them into
classifiers, and using them to make predictions. It does automatic classification using
decision trees. In the field of image classification, it has been used in classification of
satellite imagery (Hurd, Civco, Gilmore, Prisloe, & Wilson, 2006) and protein
crystallization (Zhu, Sun, Cheng, & Bern, 2004) images.

21
After we show the Logistics regression method to be an effective one in matching low level
features in images, we proceed to the second step in our validation, i.e., validating the
whole image retrieval algorithm. In our algorithm, we map regions in the image to known
concepts. We now test if this matching is done effectively. We compare its performance
with a previous prototype of I-FGM that implements WALRUS only. WALRUS is an
established method and we have used WALRUS in I-FGM (Santos et al, 2007) to get good
retrieval results. It may be noted that the concept based I-FGM is built on top of the
WALRUS sub-system. If we can show that the precision of the concept based I-FGM is
similar or better than the WALRUS based I-FGM, we can then conclude that matching of
concepts and low level features is effective and thus validate our algorithm.
Finally, we have to validate whether the image retrieval algorithm coupled with the
distributed processing approach of I-FGM helps in fast retrieval of images. We do this by
comparing its performance with two control systems that represent traditional distributed
methods.
Creation of Testbed
For conducting the experiments, an image testbed containing a sizeable number of images
and a set of queries is created. We chose a scenario titled “Natural disasters” as disaster
relief is one of the areas of E-government where quick retrievals are required in large and
dynamic databases. We select a set of 5 queries from this scenario. They are:
1. Building damaged by hurricane Katrina
2. Firefighters fight wildfires
3. Heavy snow storms in the winter
4. Houses damaged by tornado

22
5. Houses damaged by tsunami
For each query, a testbed is created by running the 3 I-Foragers and downloading the top 50
results from each search engine.
Creation of Concept Library
Before the Concept Based I-FGM can be run, a concept library has to be constructed.
Building a comprehensive library is difficult and time consuming. Instead, we tailor our
library to contain concepts that are related to the “Natural disasters” scenario.
Beach Damaged buildings Cold weather Dinosaur Firefighter
Fires Fruits Tribal People Snow Storm Mud Slide
Mountains Trees Floods Forest fires Rainstorm
Tornado Elephants Flowers Food Tsunami
Hurricane Katrina
Fig. 5: List of concepts in the concept library

23
Concept Concept description
1. Beach Beach has sand. Beach has lines with coconut trees. Beach has a blue ocean. People
sunbath on the beach. Waves can be seen on the beach. People lie on the beach. People
watch boats on the beach. There are boats on the beach. It is windy on the beach. People
relax on the beach. People play on the beach.
2. Damaged
Buildings
Damaged buildings are caused by natural disasters. Damaged buildings are caused by
flood, storm, and hurricane. Damaged buildings have damaged walls, leaking roots,
broken doors, broken windows. Damaged buildings can also be caused by terrorism
attack. For example, World Trade Center was damaged by terrorist attack.
Fig. 6: Examples of concepts and concept description in the concept library
The library must also contain unrelated concepts to provide a fair assessment of our image
retrieval algorithm. We use a set of 22 concepts listed in Fig. 5. Each concept in the
library consists of a brief concept description and the concept classifier. Examples of
concept descriptions are shown in Fig. 6. For each concept, two sets of images (20 each)
representing the positive and negative images are used to train the classifier. These images
are processed to extract its feature vector consisting of the centroids of its constituent
regions. The feature vectors are used to train a classifier in Logistic Regression. Details
about the Logistic regression technique are given in the previous sub-section. The concept
library is stored in the memory of the gIG-Builders at the beginning of the experiment.
Validation of the machine learning technique
In this section we validate the performance of Logistic Regression based machine learning
technique implemented in the concept based I-FGM system by comparing it with C5.0.
The existing studies in the machine learning community (Lim et al. 2000, Perlich et al,
2003) have shown that LR performs competitively with other classifiers and performs
better with small data sets than C4.5 (earlier version of C5.0). We would like to verify this

24
finding on our own data set. The C5.0 algorithm was trained using positive and negative
images for each concept in the concept library and classifiers were created. Our Logistic
Regression (LR) technique and the C5.0 algorithm was used on the image testbed created
for query 4: “Houses damaged by tornado”. For each image the algorithm delivered
matching concepts from the concept library. The relevant concepts for this query are
“Damaged Buildings” and “Tornado”. When the matched concepts of the two algorithms
were compared, we observe that the LR technique matched the relevant concepts
“Damaged Houses” and “Tornado” for more relevant images than the C5.0 algorithm. This
can be observed in the results tabulated in Fig. 7. Due to space limitation, results for only 4
randomly picked images are displayed. Three of the images (1, 2 & 3) are relevant and the
last one (4) is not relevant. For all the images, we see that LR method retrieves more
matched concepts (marked in red in Fig. 7) than C5.0. It may be observed that most of the
matched concepts of LR are also semantically similar. For example, for image 1 in Fig. 7,
two of the matched
Image Matching concepts
Logistic
regression
C5.0
1
Damaged
buildings,
Dinosaur, Fruits,
Snowstorm,
Mountains,
Flood,
Tornado,
Elephants
Flowers
Damaged-
building,
Dinosaur,
Elephant,
Firefighter,
Flood,
Fruit, Rainstorm
2
Damaged
buildings,
cold weather,
dinosaur, fruits
tribal people,
food,
mountains,
trees,
forestfires,
rainstorm
Damaged-
building,
Dinosaur,
Elephants,
Firefighter,
Flood,
Fruit,
Rainstorm

25
tornado, flowers
3
Beach, Flood,
Damaged
buildings,
Cold weather,
Snowstorm,
Mountains,
Rainstorm,
Tornado,
Elephants
Beach
Damaged-
building
Elephants
Flood
Mountains
Rainstorm
4
Fruits, Trees,
Tribal people,
Snowstorm,
Mountains,
Forestfires,
Elephants
Beach, Tree
Damaged –
building,
Elephants,
Flood,
Rainstorm,
Snowstorm
Fig. 7: Concepts matched by the Logistic Regression and C5.0 algorithms
concepts are flood and rainstorm. Though non-relevant, they are semantically related to
Tornado as they all belong to the class of natural disasters. For the relevant images 1, 2,
and 3, the LR algorithm consistently matches the relevant concepts while C5.0 fails to
match the concept “Tornado” to these images. Thus, we see that LR algorithm has a better
performance than C5.0. In future work, user based relevance feedback will be used to
refine the matches made by the machine learning algorithm. Thus we have validated the
performance of the Logistic regression based machine learning technique implemented in
our image retrieval algorithm.

26
Validation of Image Retrieval Algorithm
In this section, we will validate the image retrieval algorithm implemented in I-FGM. In
the algorithm, we map the image features to high level concepts and obtain a textual
description of the images. The document graphs are then generated from the text
descriptions. The document graphs are then compared against the text query to determine
the similarity measures. (The image algorithm was described in detail earlier.) We will
compare the performance of the Concept-based I-FGM prototype with a purely WALRUS
based I-FGM prototype that we developed in (Santos et al, 2007). By getting comparable
or better results in Concept based I-FGM prototypes, we will show that using the concept
mapping on top of WALRUS does not have an adverse effect on performance and we get
just as effective results.
The WALRUS-based I-FGM prototype was the first step towards deploying image retrieval
in I-FGM (Santos et al, 2007). It was developed to show that a regions based image
retrieval algorithm like WALRUS can be easily incorporated into the I-FGM. The
prototype has the same system architecture as the Concept-based I-FGM prototype. The
image retrieval algorithm used in the WALRUS based I-FGM is identical to the Concept
based I-FGM except for 2 differences: 1) WALRUS system uses query images instead of
text queries, and 2) WALRUS system compares the regions of the query image with that of
the search space images, instead of extracting concepts from images. I-matcher extracts the
image feature vector from the query image and compares it with image feature vector of the
search space image. The similarity measure used is
)()(
))(())((),( 11
QareaParea
QareaPareaQPSimilarity i
n
ii
n
i

27
Here P and Q represent the retrieved image and the query image respectively. The set of
ordered pairs {(P1, Q1), …, (Pn, Qn)} form a similarity region pair set for P and Q, where Pi
is similar to Qi and for i j, Pi Pj, Qi Qj.
Both WALRUS-based and Concept-Based I-FGM prototypes are run with the testbed of 5
queries. Precision (Salton & McGill, 1983) is the performance metric that we use to
compare the performance of the concept–based and WALRUS based I-FGM system. It is a
commonly used metric in information retrieval and is defined as the ratio of the relevant
documents (images) retrieved to the total documents (images) retrieved. In this paper we
use a slightly different definition: ratio of the relevant documents (images) among the top n
retrieved documents (images). The two systems are run on each of the query testbed and
the top 15 images for each query are analyzed to determine their relevance and finally
calculate the precision.
Analysis of the validation results
The top 15 images retrieved by the WALRUS based I-FGM prototype for each query are
analyzed to determine if they are relevant or not. We do this using certain criteria. For
example, in query 1: “Building damage by hurricane Katrina”, we only consider images
that depict damaged buildings, especially on the coast as relevant images. The precision
results obtained by the two systems for all the queries are tabulated in Fig. 8. For lack of
space we present the top 15 image results for only query 1 (Figs. 9 (a,b)). Each image is
tagged as x.y where x is the name of the search engine that downloaded the image and y is
the rank provided by it. The images deemed relevant are indicated by a check mark in Fig.
9. A quick glance shows that the performances of the systems are comparable as they

28
retrieve around the same number of relevant documents in each query. The Concept-based
and WALRUS based systems win in two queries each (queries 1 & 3 for Concept-based
system and queries 2 & 4 for WALRUS-based system) and has a tie for query 5. From
these results, we can come to the conclusion that our Concept based image retrieval
algorithm performs as well as WALRUS. It may be noted here that the concept mapping
part of our current prototype is built on top of the WALRUS feature extraction sub-system.
Relevant concepts are matched after the WALRUS sub-system extracts the regions in the
images. The document graphs are then generated and compared with the query. We use
this to provide a unified framework for heterogeneous data. Similar performance results
for both WALRUS and Concept based IFGM show that the performance is not degraded
when concepts matching are used with the feature extraction. This also leads us to
conclude that the regions based feature extraction methodology can indeed be used to
effectively map low level image features to higher level concepts.
Precision
WALRUS-Based I-FGM Concept-based I-FGM
Query 1 9/15 10/15
Query 2 10/15 9/15
Query 3 9/15 11/15
Query 4 13/15 12/15
Query 5 10/15 10/15
Fig. 8: Precision values attained by WALRUS based and Concept based I-FGM

29
Evaluation of Image Retrieval in I-FGM
In this section we will validate the effectiveness of I-FGM for image retrieval. We achieve
this by comparing its performance with two other control systems that represent the
traditional information and distributed processing paradigms.
Fig. 9(a): Precision results for Query1 using WALRUS-based I-FGM
The control systems differ from I-FGM only in the way the documents are chosen for
processing. The control systems are baseline and partially intelligent systems. In the
baseline system, the documents are chosen at random for processing. Each document is
Yahoo.21( ) Yahoo.17( ) Yahoo32 Google33
MSN.27( ) Yahoo.19( ) Yahoo.29 Yahoo.14
Yahoo.22( ) Yahoo.26 Yahoo.35( ) MSN.28( )
Yahoo.23 MSN.26( ) Google.3( )

30
given the exact same chunk of time for processing in each step. In the partially intelligent
system, the priority of a document is static and is equivalent to the first-order similarity.
We use the image testbed created previously to conduct the simulation experiments. The
images are processed by the gIG-Builders and the final similarity measure recorded. The
top n documents are selected as the target document set for each query.
Fig. 9(b): Precision results for Query1 using Concept-based I-FGM
Yahoo.13 Google.41( ) MSN.23 Google.46( )
Google.26( ) Google.55( ) Yahoo.29 Yahoo.39
MSN.28 ( ) Yahoo.19( ) Yahoo.5 Google.8( )
Google.4( ) Yahoo.22( ) Google.3( )
31
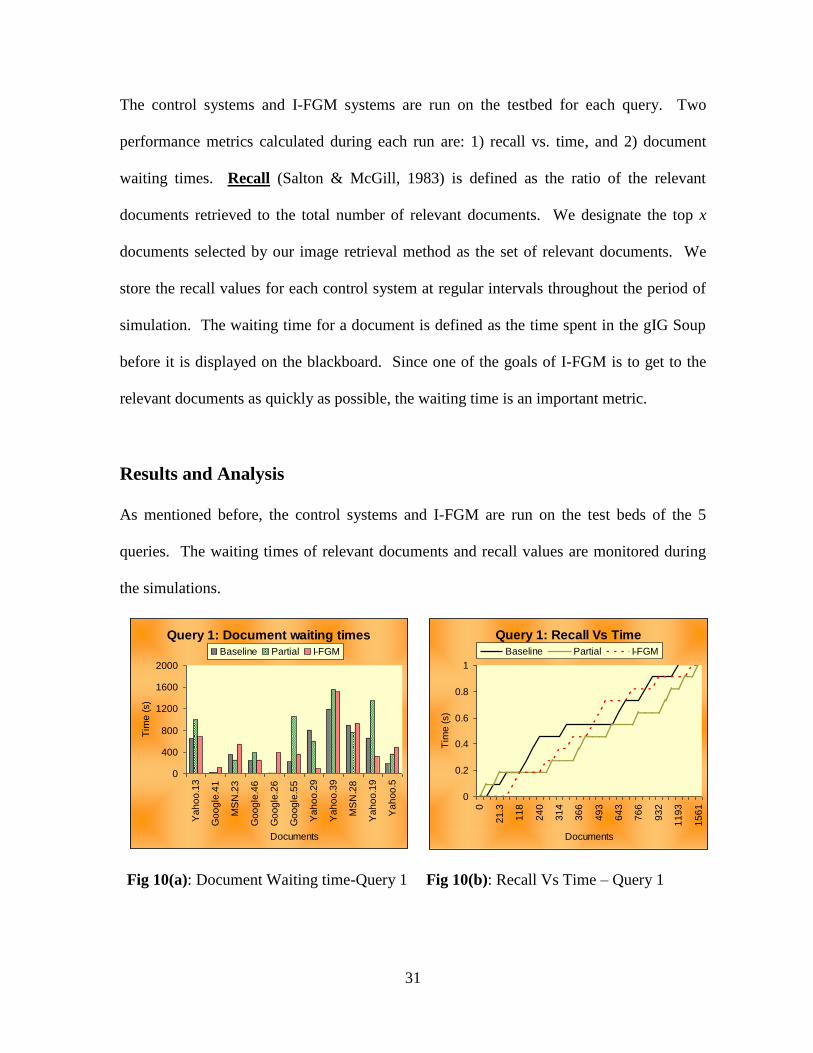
The control systems and I-FGM systems are run on the testbed for each query. Two
performance metrics calculated during each run are: 1) recall vs. time, and 2) document
waiting times. Recall (Salton & McGill, 1983) is defined as the ratio of the relevant
documents retrieved to the total number of relevant documents. We designate the top x
documents selected by our image retrieval method as the set of relevant documents. We
store the recall values for each control system at regular intervals throughout the period of
simulation. The waiting time for a document is defined as the time spent in the gIG Soup
before it is displayed on the blackboard. Since one of the goals of I-FGM is to get to the
relevant documents as quickly as possible, the waiting time is an important metric.
Results and Analysis
As mentioned before, the control systems and I-FGM are run on the test beds of the 5
queries. The waiting times of relevant documents and recall values are monitored during
the simulations.
Query 1: Document waiting times
0
400
800
1200
1600
2000
Ya
ho
o.1
3
Go
og
le.4
1
MS
N.2
3
Go
og
le.4
6
Go
og
le.2
6
Go
og
le.5
5
Ya
ho
o.2
9
Ya
ho
o.3
9
MS
N.2
8
Ya
ho
o.1
9
Ya
ho
o.5
Documents
Tim
e (
s)
Baseline Partial I-FGM
Query 1: Recall Vs Time
0
0.2
0.4
0.6
0.8
1
0
21
.3
11
8
24
0
31
4
36
6
49
3
64
3
76
6
93
2
11
93
15
61
Documents
Tim
e (
s)
Baseline Partial I-FGM
Fig 10(a): Document Waiting time-Query 1 Fig 10(b): Recall Vs Time – Query 1
32
Query 2: Document waiting times
0
400
800
Go
og
le.8
Ya
ho
o.1
7
MS
N.1
1
Ya
ho
o.1
6
Ya
ho
o.2
4
MS
N.3
Go
og
le.0
Go
og
le.1
8
MS
N.0
Ya
ho
o.4
Documents
Tim
e (
s)
Baseline Partial I-FGM
Query 2: Recall Vs Time
0
0.2
0.4
0.6
0.8
1
0 9.776 13.68 26.58 51.02 127.2 300.9 397.5
Time (s)
Re
ca
ll
Baseline Partial I-FGM
Fig. 11(a): Document Waiting time-Query 2 Fig. 11(b): Recall Vs Time – Query 2
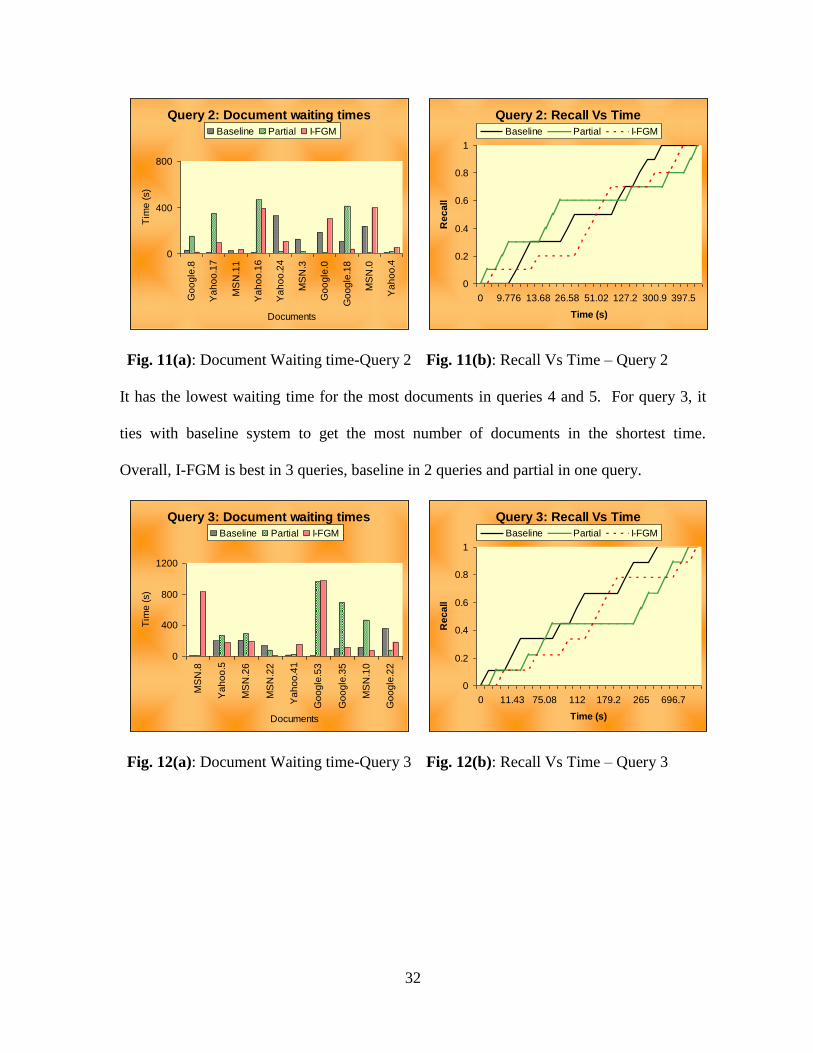
It has the lowest waiting time for the most documents in queries 4 and 5. For query 3, it
ties with baseline system to get the most number of documents in the shortest time.
Overall, I-FGM is best in 3 queries, baseline in 2 queries and partial in one query.
Query 3: Document waiting times
0
400
800
1200
MS
N.8
Ya
ho
o.5
MS
N.2
6
MS
N.2
2
Ya
ho
o.4
1
Go
og
le.5
3
Go
og
le.3
5
MS
N.1
0
Go
og
le.2
2
Documents
Tim
e (
s)
Baseline Partial I-FGM
Query 3: Recall Vs Time
0
0.2
0.4
0.6
0.8
1
0 11.43 75.08 112 179.2 265 696.7
Time (s)
Re
ca
ll
Baseline Partial I-FGM
Fig. 12(a): Document Waiting time-Query 3 Fig. 12(b): Recall Vs Time – Query 3

33
Query 4: Document waiting times
0
400
800
1200
Go
og
le.1
5
Go
og
le.2
6
Ya
ho
o.5
Go
og
le.5
0
Go
og
le.1
0
Ya
ho
o.2
7
Go
og
le.4
8
Go
og
le.4
6
Documents
Tim
e (
s)
Baseline Partial I-FGM
Query 4: Recall Vs Time
0
0.2
0.4
0.6
0.8
1
0 143.92 261.68 278.26 377.86 551.47 835.62
Time (s)
Re
ca
ll
Baseline Partial I-FGM
Fig. 13(a): Document Waiting time-Query 4 Fig. 13(b): Recall Vs Time - Query4
We now carefully analyze the results of each query. In query 1 (Fig 10(a)), baseline
system is the best performing system getting 6 out of the 11 documents the fastest. Partial
comes second getting 4 documents and I-FGM is third with 2 documents. When we
analyze the documents closely, we see that I-FGM performs poorly for this query for one
primary reason. The similarity measure fluctuates, decreasing in one step and increasing in
another.
Query 5: Time to Appear on
Blackboard
0
400
800
1200
1600
MS
N.1
1
MS
N.4
4
Go
og
le.4
8
Go
og
le.4
9
Ya
ho
o.2
2
Go
og
le.4
4
Go
og
le.3
6
Ya
ho
o.2
7
MS
N.2
3
MS
N.3
9
Go
og
le.1
6
Documents
Tim
e (
s)
Baseline Partial I-FGM
Query 5: Recall Vs Time
0
0.2
0.4
0.6
0.8
1
0 35.68 105.8 159.4 302 399 674.8 1064 1220
Time (s)
Re
ca
ll
Baseline Partial I-FGM
Fig. 14(a): Document Waiting time-Query 5 Fig. 14(b): Recall Vs Time - Query5

34
In I-FGM, a priority function (used for selecting from the gIG-Soup) decreases the priority
of an image when its similarity at a particular step does not increase proportional to the
processing time in that particular step or when the similarity decreases. Documents with
rapid fluctuations in similarity do not work well with this priority function. Although we
used an initial set of experimental results to determine the weights in the priority function,
more work needs to be done in formulating a better priority function. As we obtain more
experimental results, the priority function will be refined and this will be part of future
work. From the precision graph (Fig 10 (b)), we see that I-FGM has a better recall for part
of the simulation time. For query 2 (Fig. 11 (a),(b)), partial system has lowest waiting
times for 4 documents while I-FGM and baseline system comes second with 3 documents
each. We can easily see why this is the reason. The relevant documents are highly ranked
by the I-Foragers, i.e. they have a high expected first order similarity. Since the partial
system processes the documents based only on the expected first order similarity, such
documents are most likely to be picked by it quicker than the other systems. This is further
helped by the fact that documents such as MSN.0 and Google.0 are small (around 2000
windows). But it may be noted that the performance of I-FGM is not much worse than
partial as it gets only one document less than the partial systems.
For query 3 (Fig 12 (a),(b)), both I-FGM and baseline system perform the best, getting 4
documents each. Partial system comes in last with 1 document. When we analyze three
documents (Yahoo.41, Google.53, Google.35), which is picked by baseline system the
earliest, we see that these documents have a high similarity value after the first partial step
itself. Since they are lowly ranked by the I-foragers, they have a low initial priority in the
I-FGM system. Therefore I-FGM gets these documents only after a certain amount of

35
simulation time has passed. Baseline system gets lucky by selecting these documents early.
But since these documents give a high similarity value in the first processing step, they
appear in the blackboard after the first processing step. I-FGM has better performance than
baseline and I-FGM for queries 4 (Fig 13 (a),(b)) and 5 (Fig 14 (a),(b)). For query 4, I-
FGM gets 5 out of the 8 relevant documents. Baseline system comes in second with 3
documents. In the recall graph also, I-FGM has a higher recall value than the other systems
for most of the simulation time. For query 5, I-FGM gets 5 documents out of 11 target
documents. Partial and baseline tie for the second place with 4 each. In the recall graph
(Fig 15 (b)), I-FGM has a better recall than other system over the range (0.2-0.7). The
similarity values for images can decrease over time (which does not happen in text
retrieval) and fluctuate rapidly. These factors make the modeling of priority function for
images a difficult task. Despite this, we have shown I-FGM to be better in the majority of
queries, thus proving its feasibility as a quick and reliable retrieval method for images.
PRODUCTION-LEVEL SYSTEM
In the previous sections and in previous work, we demonstrated how the I-FGM framework
can be used to retrieve text and image documents by conducting empirical studies on
prototypes. But these prototypes were basic technology demonstrators, limited in scale by
the small number of processors used. It could not handle multiple queries and each node
could host one I-FGM process. Another important limitation was that the prototypes could
handle only one type of document, either text or images but not both. An easily accessible,
user-friendly interface that displays the real time results and the status of the internal
processes in I-FGM system was also missing. In their current form, these prototypes
cannot be deployed in the field. In order to validate its performance in real-life situation,

36
we prepared an analyst-ready production level system. This system is built using 79 high
end computing nodes. It has a user-interface that is available to the user via the Internet
and can handle multiple queries from multiple users.
System Setup
The production-level system uses 79 nodes from a 100 node cluster. The nodes are high
end Intel Pentium-D 2.8GHz 64-Bit dual processor servers connected by 1GBPS Ethernet
links. Although I-FGM could be extended to all the 100 nodes, we achieved our
performance goals using only 79 nodes. I-FGM components are implemented on the nodes
as shown in Fig.15. In order to increase the variety of sources available to analysts, we
added new I-foragers to search news and blog sources which are also important sources of
real time information. In Fig.15, we have listed out all the search engines used in the I-
Foragers, grouped under text and image headings. They are subdivided according to the
specific type of documents. So text I-Foragers are divided up into blog, news and generic
types. From Fig. 15, we see that 35 and 31 nodes have been used as text and image gIG-
Builders respectively. We used more text gIG-Builders because a typical query brings in
more text documents than images and processing a text document is more computationally
expensive. By simply scaling up the number of processors in the system from 20 to just 79
nodes, we are able to get meaningful search results within 10s of elapsed time. By
implementing this system, we have demonstrated the scalability of the I-FGM framework
to include more computing resources. We also show how the flexible architecture of I-
FGM allows us to rapidly combine retrieval technologies, namely text and image retrieval.
The implementation of the specific components is described in the earlier sections. Once a
query is retrieved from the user, a set of processors pertaining to the different I-FGM

37
components are activated in the corresponding nodes. I-foragers send the query to
particular search engines and retrieve the results. The gIG Builder and I-matcher work
towards processing the documents and determining its final similarity. These processes
terminate when the documents for a query have been fully processed. The results are then
displayed to the user through a User interface GUI that corresponds to the Blackboard
component described in an earlier section.
User Interface
One of the design criteria for the production system is that the users should be able to
access it from any part of the world. Hence a web-based GUI using Java Server Pages
(JSP) and Tomcat web server that is accessible via the Internet was designed. The user can
use any Java enabled web browser to access this interface. The GUI, in addition to
providing a place for the user to input the query and view the results, also displays the
status of the documents in the search space as they are processed. The processed document
graphs of individual documents can be viewed along with the status of the I-FGM
processes. The different functionalities of the user interface are grouped together in
different „tabs‟. These tabs are described in detail below:
1. Search Results Tab (Fig. 16): The user enters the query in this tab and the top 10
text and image results are displayed side by side. Each text result is accompanied
by an automatically generated summary of the document along with a link to the
full text. Each image result is displayed as a thumbnail with a link to the full image.
The results are automatically updated as the documents are processed and more
relevant documents are discovered. There is provision for the user to enter multiple
queries and then cycle through the results for each of the query.

38
2. Process Monitor Tab (Fig. 17): The analyst might be interested in the number of
documents being foraged by a particular I-Forager. This is displayed in the Process
Monitor tab. It also displays the document being processed by each gIG-Builder
along with the percentage processed.
3. gIG-Soup Monitor Tab (Fig. 18): This tab displays the status of the gIG-Soup and
the progress of processing of its documents. As described earlier, I-FGM
incrementally processes the documents, allowing for efficient usage of the
computing resources. gIG-Soup allows the user to monitor this dynamic process by
graphically depicting documents as gradually darkening discs. The dark portion of
a disc is equal to the portion of the corresponding document processed by gIG-
Builders. The disc fills out as the processing of the document proceeds forward.
There are separate section of discs for text and images. Additionally, newly foraged
documents can be monitored separately as they are displayed using red discs.
4. Backend Monitor Tab: provides more details about the top ten results in the search
results tab, such as the time it was foraged and the amount of time for which it was
processed. This allows us to evaluate the processing efficiency of I-FGM and its
ability to focus the computing resources on documents that are ultimately shown to
be relevant.
5. DAG Viewer Tab (Fig. 19): The text and image documents are converted into a
graphical structure called Document Graphs by the gIG-Builders. In order to view
this internal representation of the documents, a DAG (Directed Acyclic Graph)
viewer is implemented using the Scalar Vector Graphics (SVG) standard and the
Adobe SVG Viewer plug-in. The list of documents is displayed in the left panel

39
and the document graph for the document can be viewed by selecting it. The
graphs can be zoomed in or out. If the document is not fully processed, then the
partial graph is displayed.

40
Fig. 15: Allocation of processors to I-FGM agents in Production-level Prototype
I-FGM Prototype – 79 Nodes
Generic search News Search
I-Foragers – 10 Nodes
Image I-Foragers – 3 Nodes
MSN Image Search
Google Image Search
Text I-Foragers – 7 Nodes
Yahoo Image Search
Blog Search
MSN
Yahoo
Google News
Yahoo News
Ice Rocket
Blog Lines
gIG-Builders – 66 Nodes
Text gIG-Builders – 35 Nodes
Image gIG-Builders – 31 Nodes
I-Matcher – 1 Node
gIG-Soup – 2 Nodes

41
6. Image Concept Library Tab (Fig. 20): As mentioned in previous sections, the
image concept library is designed to store a collection of well known concepts. The
Image Concept Library Tab allows the viewing and modification of the entire
concept library. The details of each concept such as title, description can be
changed by the user. Additionally, training images can be added or removed and a
new classifier can be generated. The most important aspect of this tab is the ability
of the user to add new concepts. This will help the analysts to incorporate new
themes into the concept library in lieu with his/her changing areas of interest.
Fig. 16: Screenshot of Search Results Tab

42
Fig 17: Screenshot of Process Monitor Tab
Fig. 18: Screenshot of gIG-Soup Monitor Tab

43
In order to test the new system, we ran the system with a set of queries representing topics
in a variety of scenarios such as natural disasters, terrorism, Iraq war, etc. They were
chosen for the rapid pace of events in the scenarios and due to their relevance to typical
analyst activities. In order to retrieve the image results for these scenarios, we built an
image concept library consisting of 53 concepts pertaining to the topics we are interested
in. The foragers brought in an average of 300 text documents and 50 images for each
query. It took around 20 minutes to process all the documents completely for a query and
we were able to get meaningful results displayed on the user interface in 10 seconds. Most
of the top results were from blogs and news sources, validating their usefulness for
analysts. The system was stress tested by running 10 queries by multiple users
simultaneously on the system. For each query, the system invokes separate I-forager, gIG-
Builder and I-Matcher processes in the nodes. Despite multiple I-FGM processes running
on the nodes, time taken to process the documents and display relevant results was not
affected. However, potential bottlenecks with the MySQL databases and the process
invocation server were noted. Reducing the effects of these bottlenecks is left for future
work.

44
Fig. 19: Screenshot of DAG Viewer Tab
CONCLUSION
In this paper we designed and implemented an image retrieval algorithm based on mapping
low level features of images to higher level concepts. We validated this algorithm on I-
FGM and showed that it can be used to represent the visual information of images as
concepts and relations. Consequently, we also validated the methodology in I-FGM of
providing a unified ranking for heterogeneous data types. I-FGM was also compared
against two control systems to show that the image retrieval algorithm works well with
partial processing and helps in faster retrieval of images. We also presented a deployable
production-level system. This system shows the scalability of I-FGM with respect to
adding computing resources, adding new sources of documents and bringing together

45
different retrieval strategies under the same umbrella. The system has a functional GUI for
interacting with analysts and also provides for simultaneous multiple queries by multiple
analysts.
In the future, we plan to incorporate relevance feedback to allow users to give their inputs
on the retrieval quality. Users can be asked explicitly to indicate which images and texts
are most similar to what they are looking for. We may also observe the users' interactions
with our system to infer implicitly which images pertain to their interests. These retrieved
relevant images then will be used to modify the user's original queries by adding both
textual and image information to them. This process will help guide the retrieval task so
that it returns more relevant images to the user.

46
Fig. 20: Screenshot of Image concept Library
The work was supported in part by the National Geospatial Intelligence Agency Grant Nos.
HM1582-04-1-2027 and HM1582-05-1-2042. This paper updates and extends the
previously published article by (Santos et al. 2008). We would also like to thank Dr.
Qunhua Zhao for his various comments and advice in this project.
REFERENCES
Caenen, G., & Pauwels., E. J. (2002). Logistic Regression Models for Relevance Feedback
in Content-Based Image Retrieval. Storage and Retrieval for Media Databases, San
Jose, California, USA.
Carson, C., Belongie, S., Greenspan, H., & Malik, J. (2002). Blobworld: Image
segmentation using expectation-maximization and its application to image

47
querying. IEEE Transactions on Pattern Analysis and Machine Intelligence, 24(8),
1026-1038.
Daubechies, I. (1992). Ten Lectures on Wavelets. Philadelphia: SIAM.
Enser, P., & Sandom, C. (2003). Towards a comprehensive survey of the semantic gap in
visual image retrieval. (LNCS, 2728,291-299).
Hurd, J. D., Civco, D. L., Gilmore, M. S., Prisloe, S., & Wilson, E. H. (2006). Tidal
wetland classification from Landsat imagery using an integrated pixel-based and
object-based classification approach. Paper presented at the ASPRS 2006 Annual
Conference, Reno, NV.
Kherfi, M. L., Ziou, D., & Bernardi, A. (2004). Image Retrieval from the World Wide
Web: Issues, Techniques, and Systems. ACM Computing Surveys, 36(1), 35-67.
Komarek, P.(2004, May) Logistic Regression for Data Mining and High-Dimensional
Classification, (Tech. report CMU-RI-TR-04-34). Pittsburg, PA: Carnegie Mellon
University, Robotics Institute
Ksantini, R., Ziou, D., Colin, B., & Dubeau, F. (2007). Logistic Regression Models for a
Fast CBIR Method Based on Feature Selection. Paper presented at the International
Joint Conference on Artificial Intelligence.
Li, J., & Wang, J. Z. (2006). Real-time Computerized Annotation of Pictures. Paper
presented at the ACM Multimedia Conference, Santa Barbara, CA.
Li, J., Wang, J. Z., & Wiederhold, G. (2000). IRM: Integrated Region Matching for Image
Retrieval. Paper presented at the ACM Multimedia Conference, Los Angeles, CA. Lim, T.S. Lim, Loh, W.Y. and Shih, Y.S. (2000). A comparison of prediction accuracy,
complexity, and training time for thirty–three old and new classification algorithms.
Machine Learning, 40, 203–228. Ma, W. Y., & Manjunath, B. (1997). NaTra: A Toolbox for Navigating Large Image
Databases. Paper presented at the IEEE International Conference on Image
Processing.
Mitchell, T. (2005). Generative and Discriminative classifiers: Naïve Bayes and Logistic
Regression. Retrieved from http://www.cs.cmu.edu/~tom/mlbook /NBayesLog-
Reg.pdf
Natsev, A. (2001). Multimedia Retrieval By Regions, Concepts, and Constraints. Ph.D.
Thesis, Duke University, Durham, NC.
Natsev, A., Chadha, A., Soetarman, B., & Vitter, J. S. (2001). CAMEL: Concept Annotated
iMagE Libraries. Paper presented at the Storage and Retrieval for Image and Video
Databases, SPIE, San Jose, CA.
Natsev, A., Rastogi, R., & Shim, K. (2004). WALRUS: A Similarity Retrieval Algorithm
for Image Databases. IEEE Transactions on Knowledge and Data Engineering,
16(3), 301-316.
Perlich, C., Provost, F., and Simonoff, J. (2003). Tree Induction vs. Logistic Regression: A
Learning-curve Analysis. Journal of Machine Learning Research. 4, 211-255
Quinlan, J. R. (1993). C4.5: programs for machine learning. San Francisco, CA: Morgan
Kaufmann Publishers Inc.
Rui, Y., Huang, T., & Chang, S. (1999). Image retrieval: current techniques, promising
directions and open issues. Journal of Visual Communication and Image
Representation, 10(4), 39-62.
Salton, G., & McGill, M. (1983). Introduction to Modern Information Retrieval: McGraw-
Hill.

48
Santos, E. Jr., Santos, E., Nguyen, H. Pan, L. and Korah, J. (2005). Large-scale Distributed
Foraging, Gathering, and Matching for Information Retrieval: Assisting the
Geospatial Intelligent Analyst. In Proceedings of SPIE (Vol. 5803, 66-77).
Santos, E. Jr., Santos, E., Nguyen, H. Pan, L., Korah, J. Zhao, Q., and Pittkin. M.(2006) I-FGM
Information Retrieval in Highly Dynamic Search Spaces. In Proceedings of SPIE.
(Vol. 6229, 1-12).
Santos, E., Jr., Santos, E., Nguyen, H., Pan, L., Korah, J., Zhao, Q., and Xia, H. (2007).
Applying I-FGM to Image Retrieval and an I-FGM System Performance Analyses.
In Proceedings of the SPIE: Defense & Security Symposium (Vol. 6560), Orlando,
FL.
Santos, E., Jr., Santos, E., Nguyen, H., Pan, L., Korah, J., and Xia, H. (2008). I-FGM as a
Real Time Information Retrieval Tool for E-Governance. Special Issue: E-
Government Technologies for Managing National Secruity and Defense,
International Journal of Electronic Government Research, 4(1), 14-25.
Smeulders, A. W. M., M. Worring, M., Santini, S., Gupta, A., & Jain, R. (2000). Content-
based image retrieval at the end of the early years. IEEE Transactions on Pattern
Analysis and Machine Intelligence, 22(12), 1349-1380.
Tsymbalenko, Y., & Munson, E.V. (2001). Using HTML metadata to find relevant images
on theWeb. Paper presented at the Internet Computing, Las Vegas.
Vapnik, V. (1999). The Nature of Statistical Learning Theory, 2nd edition. Springer Verlag.
Veltkamp, R. C., & Tanase, M. (2000). Content-Based Image Retrieval Systems: A Survey
(Technical Report No. UU-CS-2000-34): Dept. of Computing Science, Utrecht
University.
Wang, J. Z., Li, J., & Wiederhold, G. (2001). SIMPLIcity: Semantics-Sensitive Integrated
Matching for Picture Libraries. IEEE Transactions on Pattern Analysis and
Machine Intelligence, 23(9), 947-963.
Witten, I. H., & Frank, E. (2005, June). Data Mining: Practical Machine Learning Tools
and Techniques (Second ed.): Morgan Kaufmann.
Zhang, T., Ramakrishnan, R., & Livny, M. (1996). BIRCH: an efficient data clustering
method for very large databases. Paper presented at the ACM SIGMOD
International Conference on Management of Data, Montreal, Canada.
Zhang, J., Jin, R., Yang, Y., Hauptmann, A. G. (2003). Modified Logistic Regression: An
Approximation to SVM and Its Application in Large-Scale Text Categorization¸In
Proceedings of the Twentieth International Conference on Machine Learning 2003.
Washington DC.
Zhu, X., Sun, S., Cheng, S. E., & Bern, M. (2004). Classification of Protein Crystallization
Imagery. Paper presented at the 26th Annual International Conference of IEEE
Engineering in Medicine and Biology Society, San Francisco, California.