Embed Size (px)
Citation preview
IETF Administration LLC FINAL
IETF Community Survey 2021
Introduction
Key findingsOrganisationPeopleParticipationEnvironment
MethodologySurvey design principlesDistributionData validationAnalysis of results
Percentage analysisCoding, coding means and applying a value judgementStatistical significanceCharts
Results and AnalysisTotalsQuestion page: Demographics
Q2. In what region do you live?Q3. How old are you?Q4. What is your gender?Q5. How do you rate your skill with the English language?Q6. What is your employment status and type of employer? (check all that apply)Q7. Which of the following applies to you? (check all the apply)Q8. Which of the following general IETF mailing lists do you subscribe to?Q9. Do you have an IETF Datatracker account (https://datatracker.ietf.org)?Q10. *Do you participate in the IETF? (this question cannot be skipped)
Question page: ParticipationQ11. In what year did you first participate in the IETF?Q12. Why [do/did] you participate in the IETF? (check all that apply)Q13. On average, how many hours per week [do/did] you spend on IETF activities?Q14. How many mailing lists do you actively participate in?Q15. How many mailing lists do you just monitor without actively participating?Q16. Over the next year do you expect to spend more or less time on IETF activities?Q17. In what year did you cease participating in the IETF?Q18. Why did you cease participating in the IETF? (check all that apply)Q19. How likely are you to participate in the IETF at some point in the future?
13 August 2021 1
IETF Administration LLC FINAL
Q20. How likely are you to recommend IETF participation to a friend or colleague?Question page: Preferences
Q21. Why don't you subscribe to [email protected] (the general announcementlist)? (check all that apply)Q22. How do you prefer to be informed of IETF activities?Q23. How [do/did] you prefer to provide feedback to the IETF leadership and decisionmakers?Q24. How [do/did] you prefer to participate in the discussions and decisions of theIETF?
Question page: PerceptionsQ25. How true are the following statements about the work of the IETF?Q26. How true are the following statements about your participation in the IETF?Q27. How true are the following statements about the IETF working groups (WGs) thatyou participate in?Q28. How important is the IETF for the development of the Internet?
Question page: Related organisationsQ29. Which other standards setting organisations do you participate in? (check allthat apply)Q30. How well do you think the IETF compares to other standards settingsorganisations?Q31. Which other Internet organisations do you participate in? (check all that apply)Q32. How well do you think the IETF compares to other Internet organisations?
Next steps
IntroductionThis survey is the first time the IETF has attempted to survey everyone who in someform participates in the IETF, however limited their participation. The aim is todeliver these three outcomes:
1. A current size and demographic breakdown of the IETF community.2. Data on IETF community views that can be used by IETF leadership in
planning how to address the major strategic challenges facing the IETF.3. The first step in a time series of data that can be used to assess the natural
changes affecting the IETF and the effectiveness of major programs,organisational changes and leadership actions.
13 August 2021 2
IETF Administration LLC FINAL
Key findingsA number of the key findings presented here are based on applying a valuejudgement to the results as explained in the section below on Coding, coding meansand applying a value judgement, which gives ranks answers as very poor, poor,acceptable, good or excellent.
OrganisationThe IETF mostly delivers its mission and principles
From Q25 we learn that the quality and relevance of RFCs is good whereas the focuson the most important work is minimally acceptable, and from Q25 and Q27 thatthe support for consensus is strong. Q26 and Q27 differ on the ability to share views,with it judged as minimally acceptable for the IETF in general but good for WGs.
IETF processes are mostly acceptable but major improvement is needed
Q25 tells us that IETF processes have minimally acceptable effectiveness andsimilarly Q26 tells us that the ease of finding information, understanding it and thequality of that information is acceptable. Q27 goes into more detail on WG processesand those mostly range from minimally acceptable to good.
The standout exception is the slowness of the entire IETF process, judged as poor inboth Q25 and Q27.
The IETF has an issue with mass communication and how (or why) to reach thefull IETF community
From Q21 we learn that we have a bootstrapping problem with mass communicationgiven the lack of knowledge about ietf-announce and a problem with its content forthose that do. From Q22 we learn that alternative communication mechanisms toemail announcements are much less preferred now, but are preferred by youngerparticipants.
PeopleThe IETF has a sense of community, but only just and not one that people canrecommend
From Q26 we learn that a minimally acceptable number feel part of the community,feel treated the same as the rest of the community, feel that the IETF communicateswith them well and from Q27 that behaviour is minimally acceptable, contributionsare valued and that WGs are a good use of time.
13 August 2021 3
IETF Administration LLC FINAL
From Q10 we learn that people are unclear about what participation in the IETFactually means.
Q20 on how likely respondents are to recommend participation uses Net PromoterScore scoring and our result shows that the IETF has a poor score for promotersminus detractors of -24.31%.
The IETF has a big problem with gender, a smaller problem with regionality butno problem with age
From Q4 we learn that females make up between 10.7% and 9.2% of the IETFcommunity, significantly lower than the percentage of the population or thepercentage split of IT workers, and from Q11 and Q18 that this percentage has notgrown in some time. We learn from Q18 that females are disproportionatelydeterred by the culture of the IETF, from Q26 that they are less likely to feel treatedthe same as the rest of the community as males and from Q27 that they are lesslikely to feel their contributions are valued and that the behaviour of otherparticipants is acceptable.
From Q2 we learn that the US/Canada and Europe still dominate IETF participationand from Q11 that this is only slowly changing. Female representation from Europeand Africa is notably lower than from other regions.
From Q3 we see a good age spread for participants. Q25, Q26 and Q27 show minordifferences by age with some lower scores for the 18-24 age range but nothing more.
ParticipationThe principle of people participating for the benefit of the Internet is true butnot the strongest factor
RFC 39351 states that our participants and our leadership are people who come tothe IETF because they want to do work that furthers the IETF's mission of "makingthe Internet work better" and this is partly supported by Q12 which puts “making theInternet work better” as the second highest reason and with high support. Thehighest reason is personal interest and the third is professional development,pointing at a much stronger personal benefit than otherwise understood.
The foundations of people participating as individuals is very complex and onlypartly supported
1 https://www.rfc-editor.org/rfc/rfc3935.html
13 August 2021 4
IETF Administration LLC FINAL
RFC 24182 states that participation is by individual technical contributors, rather thanby formal representatives of organizations and this is also partly supported by Q12with only 30% reporting that they participate because their job requires them to,implying that the other 70% could choose not to.
The same question also tells us that 48% participate because their job allows themto, Q13 tells us that only 33% of all time spent on the IETF is personal time, and Q18gives two of the top 3 reasons why people cease participating as work related. Thisindicates that people use their autonomy to choose what work they do (and possiblywhat employer they work for) to favour the IETF. What the survey did not address iswhat obligation they have to advocate for their employers interests if they choose toparticipate.
The two pillars of email and English have very strong support
From Q22 and Q24 we see high support for email announcements and mailing listinteractions, significantly higher than the presented alternatives, and from Q23email is the preferred method for providing feedback to IETF leadership. All threeresults have a tight clustering of support from all age groups, with support slightlystronger the older the respondent.
From Q5 we learn that the general skill with English is excellent and from Q26 thatits individual suitability for full participation is also excellent. These are the onlyexcellent scores in the whole survey.
Support for new modes of participation is limited and age dependent
From Q24 we learn that support for new modes of participation is limited incomparison to email and that there is a strong inverse correlation between age andstrength of support. Future surveys will tell us if people maintain these preferencesas they age and if the IETF should therefore be planning for this change.
EnvironmentThe IETF is a very important part of a well connected ecosystem
In Q28, which uses Net Promoter Score, we get a Great score for the number thatthink the IETF is important for the development of the Internet. From Q29 we learnthat 44% of respondents participate in one or more other standards settingorganisations and from Q30 that the IETF is rated very favourably in comparison tothose other organisations.
2 https://www.rfc-editor.org/rfc/rfc2418.html
13 August 2021 5
IETF Administration LLC FINAL
Methodology
Survey design principlesThe survey was designed and questions were constructed with the followingprinciples in mind:
Return a representative sample of the wider IETF community
Previous surveys, such as post-meeting surveys or I-D authors surveys, have generallybeen targeted either directly or indirectly at those that are most active in the IETF.The intent of this survey was to reach as widely as possible in order to get arepresentative sample of the 56,000 mailing subscribers. This meant includingdirect questions about the level of participation and specific questions aboutnon-participation.
Design for an international survey
The IETF community is global and the language was carefully chosen to ensure thatall respondents interpret the questions easily and similarly through simple, directand idiom-free language.
Maximise the number of responses
This principle influenced the question design in a number of ways, all of which aimedto reduce the cognitive load required to complete the survey.
The friction people feel with mandatory questions was largely eliminated by allowingthem to skip almost all the questions. The only mandatory question was used forrouting people to different sets of questions around participation andnon-participation.
The problem this introduces is how to understand what it means when someonesees but skips a question. Is it that they do not wish to answer, or they do not careenough to answer or is it because none of the options apply to them.
For questions with a scale that includes a ‘neutral’ option, a ‘No opinion’ option wasadded to avoid people choosing the neutral option and distorting the results.Anyone one who skipped such a question is counted as also having no opinion.
For multiple choice questions, a “none of the above” option was not added as thatoption is not always obvious and instead it is assumed that anyone who did notanswer the question did so because none of the options presented were relevant.This decision may be revisited in future surveys.
13 August 2021 6
IETF Administration LLC FINAL
Ensure that the responses can be processed.
As this was going to 56,000+ email addresses it was expected that there would bethousands of responses and it simply would not be possible to process that numberof free text answers so there are no free text boxes.
Prioritise questions that can be repeated every year
The intent is to repeat this survey every year at roughly the same time so that a trendcan be seen over multiple years. This also means that there are no trend questions inthe survey (e..g “Has community behaviour got better or worse over the last year?”)as that is more accurate if derived from multi-year analysis because perception overa period of time differs so much from individual to individual.
Don’t ask questions that are best answered by other means.
For example, we have some basic questions about mailing list subscriptions, butmore accurate answers can be obtained from mailing list analysis. Similarly, it wouldbe better to send each WG a survey than ask for information about specific WGs inthis survey.
DistributionTo distribute this survey, an address list was created by amalgamating themembership lists of all active IETF mailing lists and de-duplicating for addressesusing ‘+’ notation. The resulting 56,517 addresses were silently subscribed to amailing list with all members moderated to prevent unwanted use.
A pre-announcement3 was sent to [email protected] and then the invitation toparticipate4 was sent to this list and distributed to all on 7 May 2021. A finalreminder5 email was sent to the mailing list on 13 May 2021.
Approximately 700 people unsubscribed and at least 600 addresses bounced. Theunsubscribed addresses will be noted and added to a “do not contact” list for futureiterations of this survey.
Two respondents wrote that they subscribe to IETF lists with multiple emailaddresses using their own domain name and so had received multiple invitations.They were manually unsubscribed.
For analysing the survey, a population of 56,000 is used.
5 https://mailarchive.ietf.org/arch/msg/ietf-surveys/Ex7l8dwWjTobcgLP1eGQ05QmRmA/4 https://mailarchive.ietf.org/arch/msg/ietf-surveys/k0Z3Mdk53witIbdf97XxHtbp4Po/3 https://mailarchive.ietf.org/arch/msg/ietf-announce/mNiqq0NDuAvAOWbGzJU1zLayRY4/
13 August 2021 7
IETF Administration LLC FINAL
Data validationThe initial protection of the integrity of the data was left to the survey system, whichwas configured to detect bots and prevent repeated survey responses. After thesurvey the data was examined to identify obviously invalid survey responses and 5were deleted as a result.
Analysis of results
Percentage analysisMost of the question analysis displays the results as a percentage, with differentforms of percentage used:
● Percentage of survey respondents. Used for questions where we need toinclude those people who did not answer the question in the results becausetheir non-answer is meaningful. For example, for the questions about whatother organisations participate in, we assume those that did not answer donot participate in any. This shows the number of responses to a particularoption as a percentage of the total number of respondents to the survey(2039). These percentages will always add up to 100%.
● Percentage of question respondents. Used for questions where we are onlyinterested in the views of those that responded to the question and we wantto understand how each option compares to the total of those thatresponded, not relative to each other. For example, the question on whetheror not people participate This shows the number of responses to a particularoption as a percentage of the total number of respondents to this question.For multiple choice questions, these percentages will generally total to morethan 100%.
● Percentage of responses. Used for multiple choice questions where we wantto assign a fractional ‘score’ for each option selected by the same person toenable comparison between options. For example, with the question abouttypes of employment, if someone ticks two options then we want that tocount as one half of a vote for each option. This shows the number ofresponses to a particular option as a percentage of the total number ofresponses to the question. These percentages will always add up to 100%.
● Others There are a number that are derived from the total number of surveyrespondents and should be clear from the label.
Coding, coding means and applying a value judgementA number of questions have categorical responses on a scale. For example, “Muchmore” through to “Much less”. For the analysis, each response is assigned a code
13 August 2021 8
IETF Administration LLC FINAL
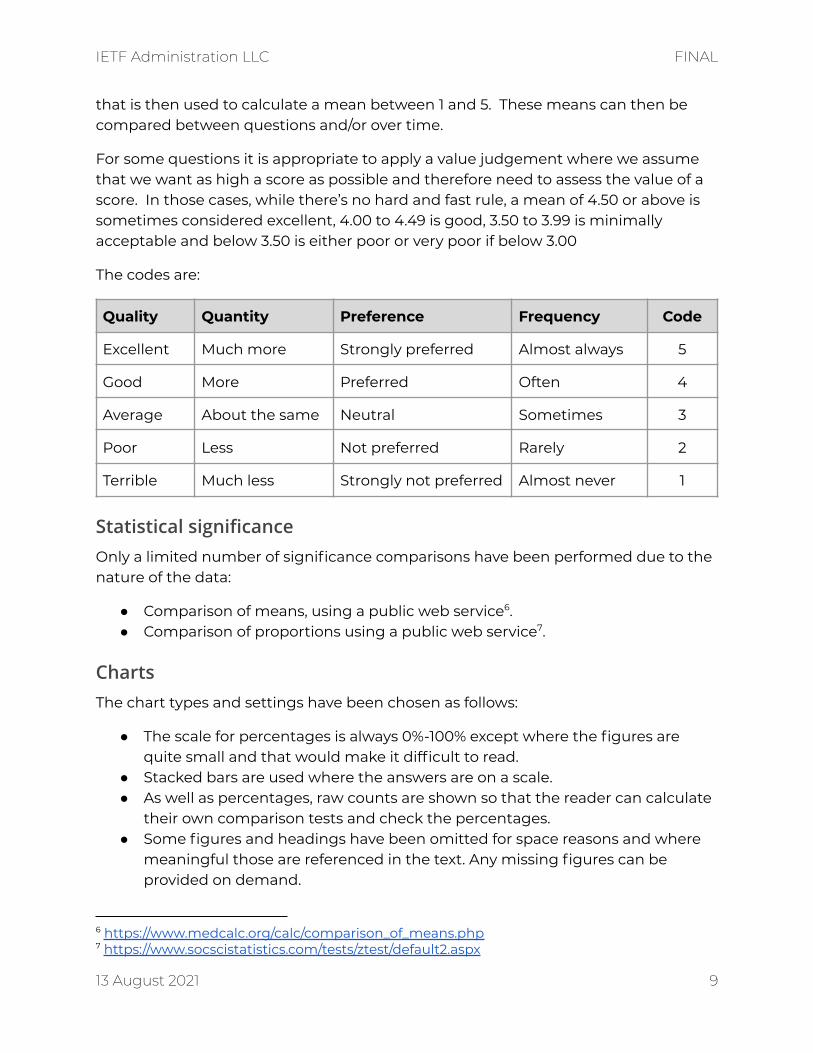
that is then used to calculate a mean between 1 and 5. These means can then becompared between questions and/or over time.
For some questions it is appropriate to apply a value judgement where we assumethat we want as high a score as possible and therefore need to assess the value of ascore. In those cases, while there’s no hard and fast rule, a mean of 4.50 or above issometimes considered excellent, 4.00 to 4.49 is good, 3.50 to 3.99 is minimallyacceptable and below 3.50 is either poor or very poor if below 3.00
The codes are:
Quality Quantity Preference Frequency Code
Excellent Much more Strongly preferred Almost always 5
Good More Preferred Often 4
Average About the same Neutral Sometimes 3
Poor Less Not preferred Rarely 2
Terrible Much less Strongly not preferred Almost never 1
Statistical significanceOnly a limited number of significance comparisons have been performed due to thenature of the data:
● Comparison of means, using a public web service6.● Comparison of proportions using a public web service7.
ChartsThe chart types and settings have been chosen as follows:
● The scale for percentages is always 0%-100% except where the figures arequite small and that would make it difficult to read.
● Stacked bars are used where the answers are on a scale.● As well as percentages, raw counts are shown so that the reader can calculate
their own comparison tests and check the percentages.● Some figures and headings have been omitted for space reasons and where
meaningful those are referenced in the text. Any missing figures can beprovided on demand.
7 https://www.socscistatistics.com/tests/ztest/default2.aspx6 https://www.medcalc.org/calc/comparison_of_means.php
13 August 2021 9
IETF Administration LLC FINAL
Results and Analysis
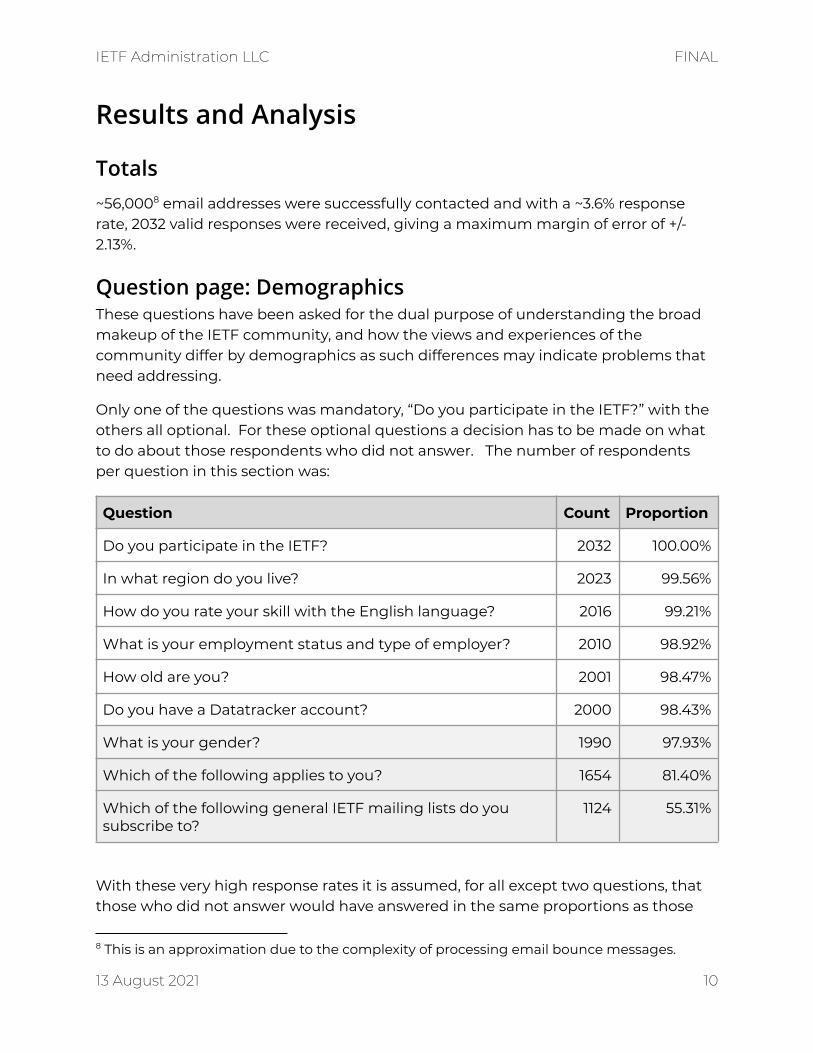
Totals~56,0008 email addresses were successfully contacted and with a ~3.6% responserate, 2032 valid responses were received, giving a maximum margin of error of +/-2.13%.
Question page: DemographicsThese questions have been asked for the dual purpose of understanding the broadmakeup of the IETF community, and how the views and experiences of thecommunity differ by demographics as such differences may indicate problems thatneed addressing.
Only one of the questions was mandatory, “Do you participate in the IETF?” with theothers all optional. For these optional questions a decision has to be made on whatto do about those respondents who did not answer. The number of respondentsper question in this section was:
Question Count Proportion
Do you participate in the IETF? 2032 100.00%
In what region do you live? 2023 99.56%
How do you rate your skill with the English language? 2016 99.21%
What is your employment status and type of employer? 2010 98.92%
How old are you? 2001 98.47%
Do you have a Datatracker account? 2000 98.43%
What is your gender? 1990 97.93%
Which of the following applies to you? 1654 81.40%
Which of the following general IETF mailing lists do yousubscribe to?
1124 55.31%
With these very high response rates it is assumed, for all except two questions, thatthose who did not answer would have answered in the same proportions as those
8 This is an approximation due to the complexity of processing email bounce messages.
13 August 2021 10
IETF Administration LLC FINAL
who did answer, and so these will be analysed using the percentage of questionrespondents. The two exceptions are:
● “Which of the following applies to you?”. It is assumed that those who did notanswer this did not think any applied to them. This will be analysed using thepercentage of survey respondents.
● “What is your gender?”. Some may consider this a personally sensitivequestion and so this will be analysed in a number of ways.
A note about participation and interaction
While respondents were asked to self-identify their participation status in Q10, theresponses to Q7 show significantly different interpretations of ‘participation’ ashundreds have reported that they have never participated in the IETF, but then listmultiple interactions where they have participated. Consequently, participationstatus is not used for cross tabulating any question
Participation status was used to filter what questions were displayed during thesurvey and so these questions can only be presented as asked. However, analysisof the demographic questions shows no statistically significant difference in theanswers given by participation status and so for the filtered questions, it can beassumed that the proportions would not be significantly different if allrespondents had been asked.
As participation status cannot be used for cross tabulation, a replacementindicator “Interaction status” has been derived from the data on self-reporting ofinteraction, with anyone who reported no interactions categorised as “Notinteracted” and all others as “ Interacted”.
There are 1654 respondents categorised as “Interacted” and 378 categorised as“Not interacted”. Of those categorised as “Not interacted”, 323 state that they havenever participated in the IETF, 31 state that they currently participate and 24 statethat they previously participated.
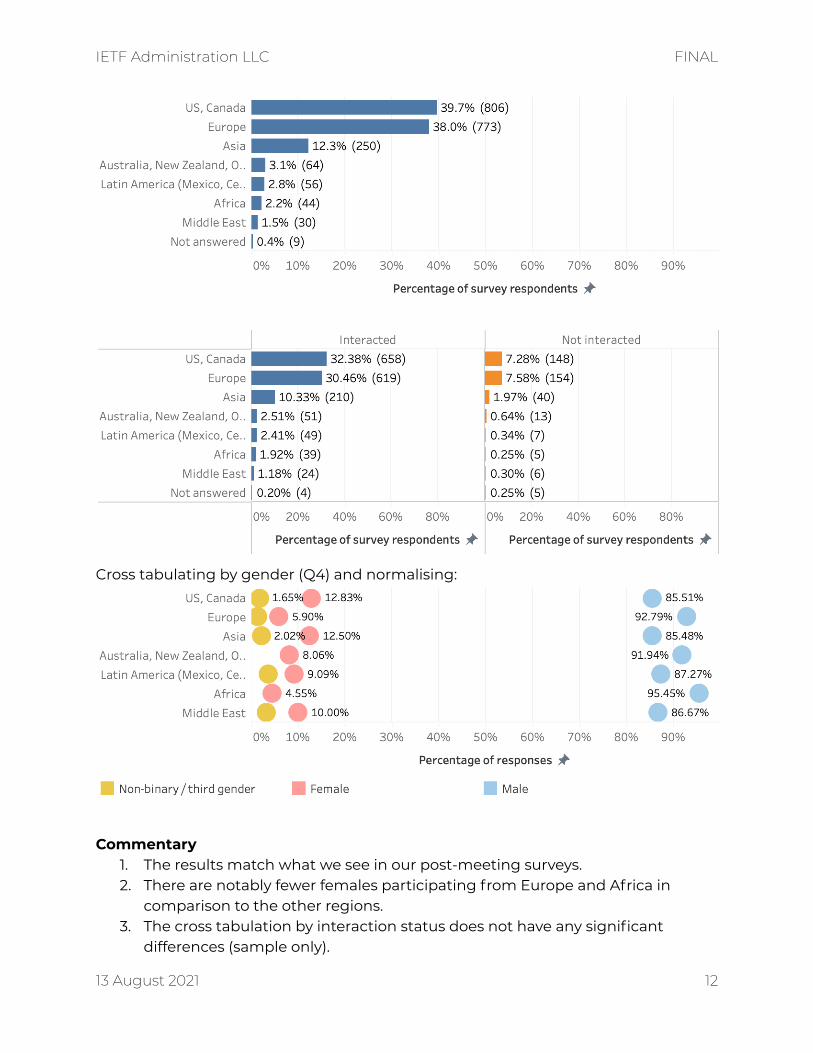
Q2. In what region do you live?This question uses the standard IETF regions and is the same question asked in mostof our other surveys, such as post-meeting surveys. It was asked of all 2032 surveyrespondents with 2023 responses.
13 August 2021 11
IETF Administration LLC FINAL
Cross tabulating by gender (Q4) and normalising:
Commentary1. The results match what we see in our post-meeting surveys.2. There are notably fewer females participating from Europe and Africa in
comparison to the other regions.3. The cross tabulation by interaction status does not have any significant
differences (sample only).
13 August 2021 12
IETF Administration LLC FINAL
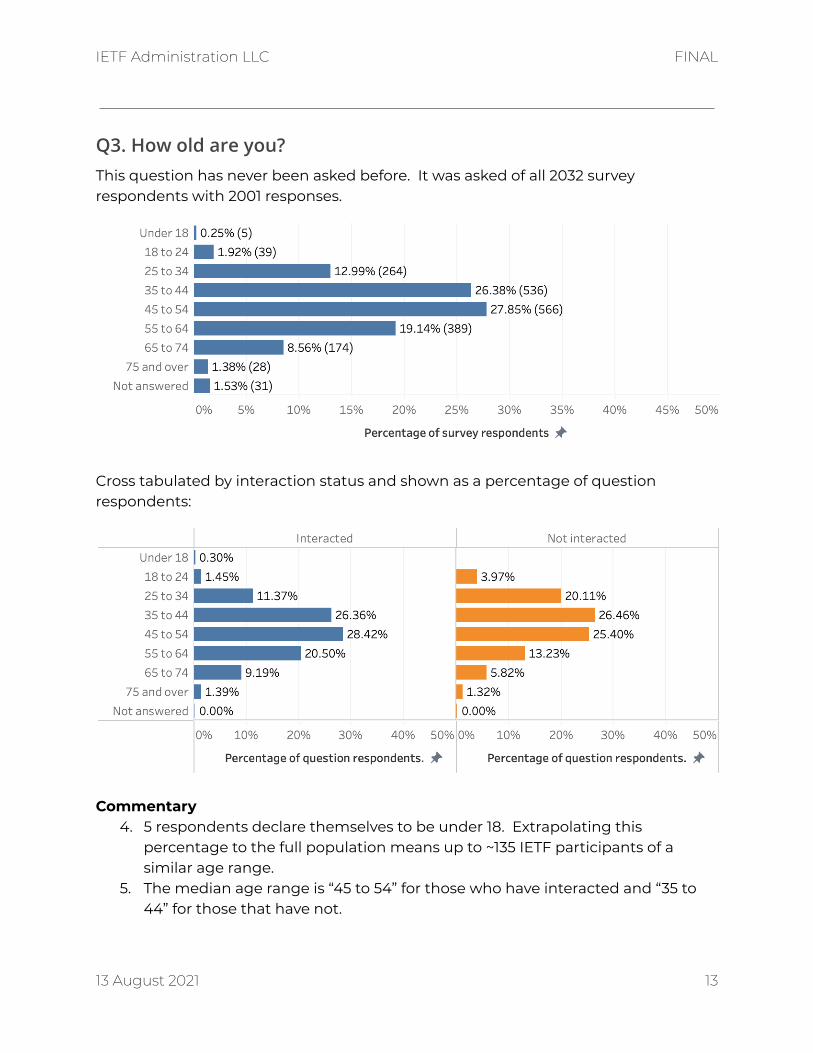
Q3. How old are you?This question has never been asked before. It was asked of all 2032 surveyrespondents with 2001 responses.
Cross tabulated by interaction status and shown as a percentage of questionrespondents:
Commentary4. 5 respondents declare themselves to be under 18. Extrapolating this
percentage to the full population means up to ~135 IETF participants of asimilar age range.
5. The median age range is “45 to 54” for those who have interacted and “35 to44” for those that have not.
13 August 2021 13
IETF Administration LLC FINAL
6. There are other two significant differences when cross tabulated byinteraction status with those below 35 less likely to have interacted and thoseover 54 more likely to have.
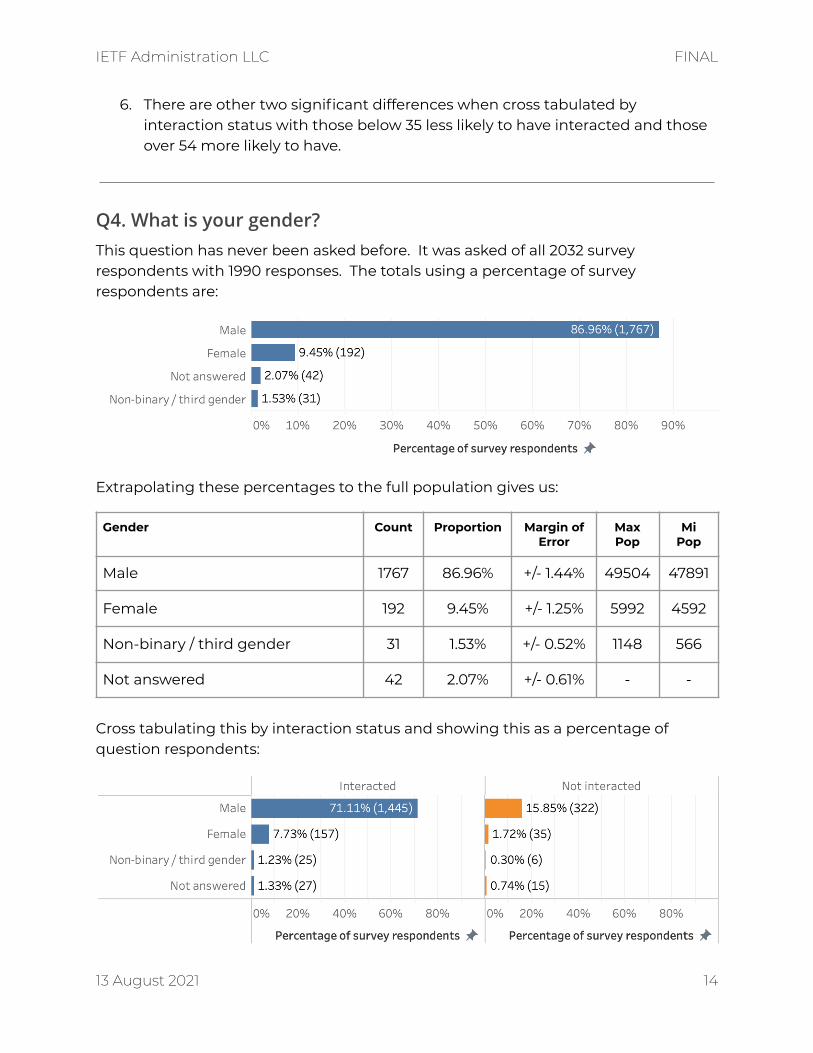
Q4. What is your gender?This question has never been asked before. It was asked of all 2032 surveyrespondents with 1990 responses. The totals using a percentage of surveyrespondents are:
Extrapolating these percentages to the full population gives us:
Gender Count Proportion Margin ofError
MaxPop
MiPop
Male 1767 86.96% +/- 1.44% 49504 47891
Female 192 9.45% +/- 1.25% 5992 4592
Non-binary / third gender 31 1.53% +/- 0.52% 1148 566
Not answered 42 2.07% +/- 0.61% - -
Cross tabulating this by interaction status and showing this as a percentage ofquestion respondents:
13 August 2021 14
IETF Administration LLC FINAL
Commentary7. Clearly, the gender balance within the IETF community is significantly
different from that in the general population and the IT profession9, withwomen greatly under-represented.
8. There is no difference in gender proportions by interaction status.9. In response to feedback, the wording of this question will be improved in
future surveys, with “Man” replacing “Male” and “Woman” replacing “Female”.
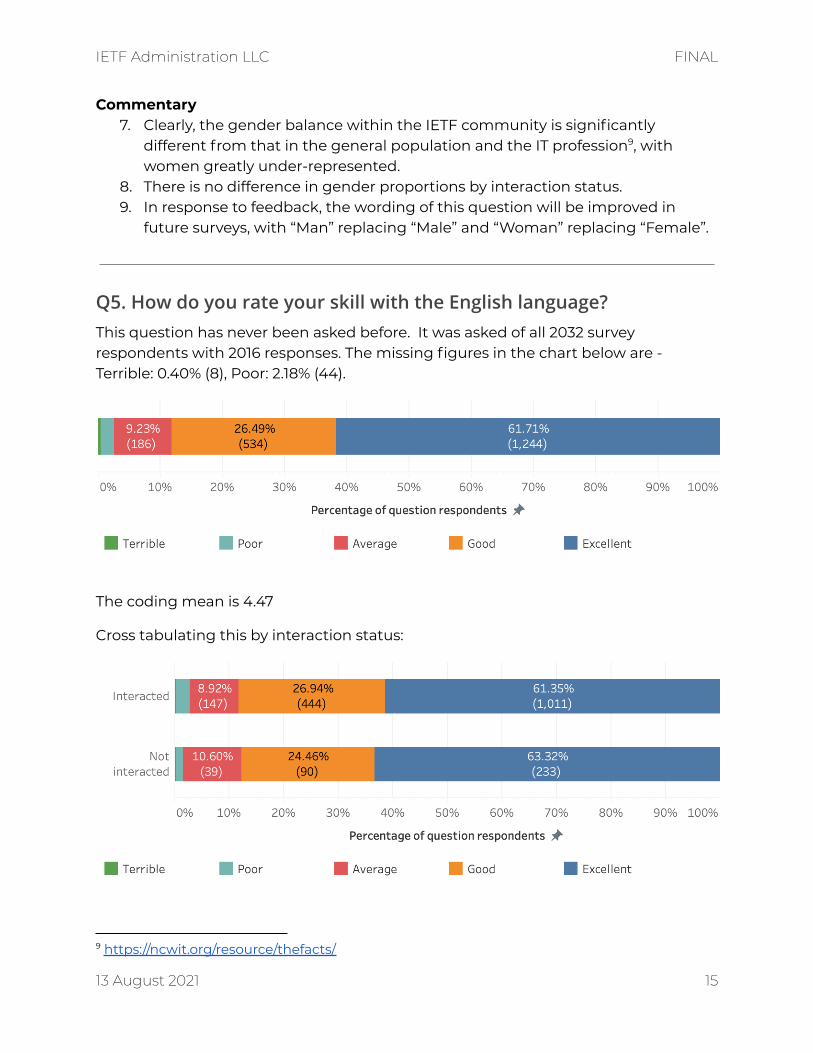
Q5. How do you rate your skill with the English language?This question has never been asked before. It was asked of all 2032 surveyrespondents with 2016 responses. The missing figures in the chart below are -Terrible: 0.40% (8), Poor: 2.18% (44).
The coding mean is 4.47
Cross tabulating this by interaction status:
9 https://ncwit.org/resource/thefacts/
13 August 2021 15
IETF Administration LLC FINAL
Commentary10. The general skill with English is high with only 2.58% reporting terrible or poor
English. This extrapolates to approximately ~1445 people.11. There are no significant differences in skill with English between interaction
statuses and therefore we can discount this as a reason for non-interaction forthose who are subscribed to IETF mailing lists.
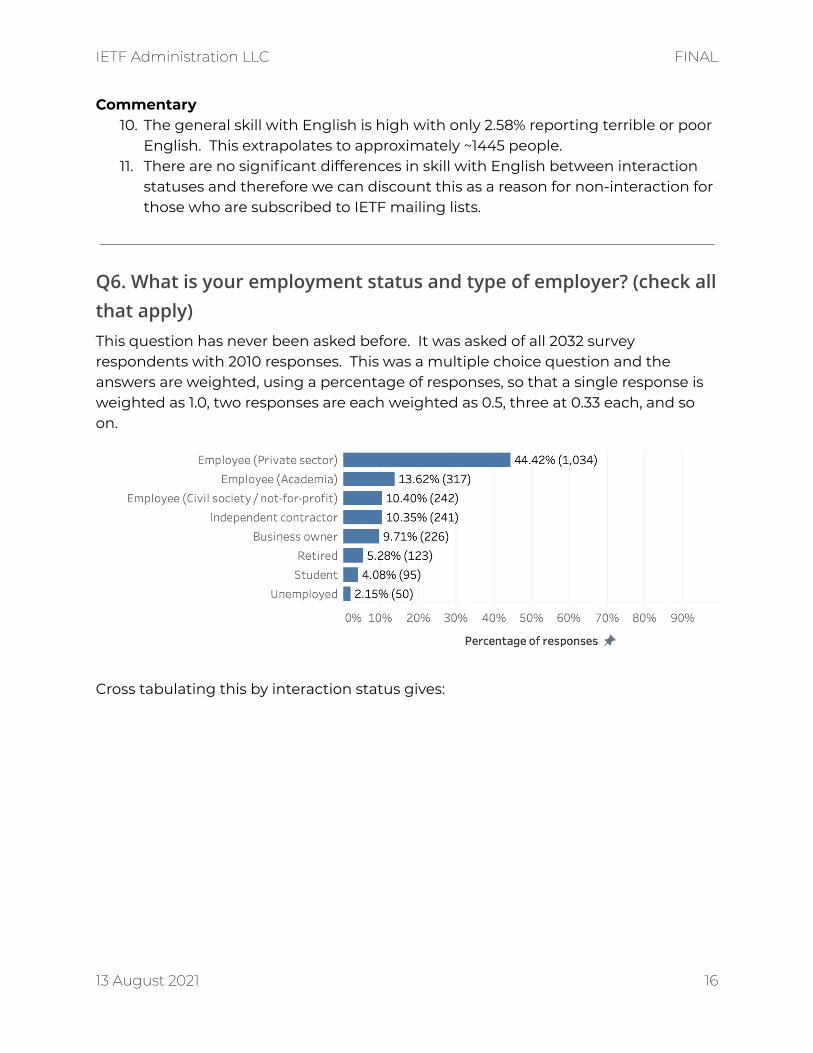
Q6. What is your employment status and type of employer? (check allthat apply)This question has never been asked before. It was asked of all 2032 surveyrespondents with 2010 responses. This was a multiple choice question and theanswers are weighted, using a percentage of responses, so that a single response isweighted as 1.0, two responses are each weighted as 0.5, three at 0.33 each, and soon.
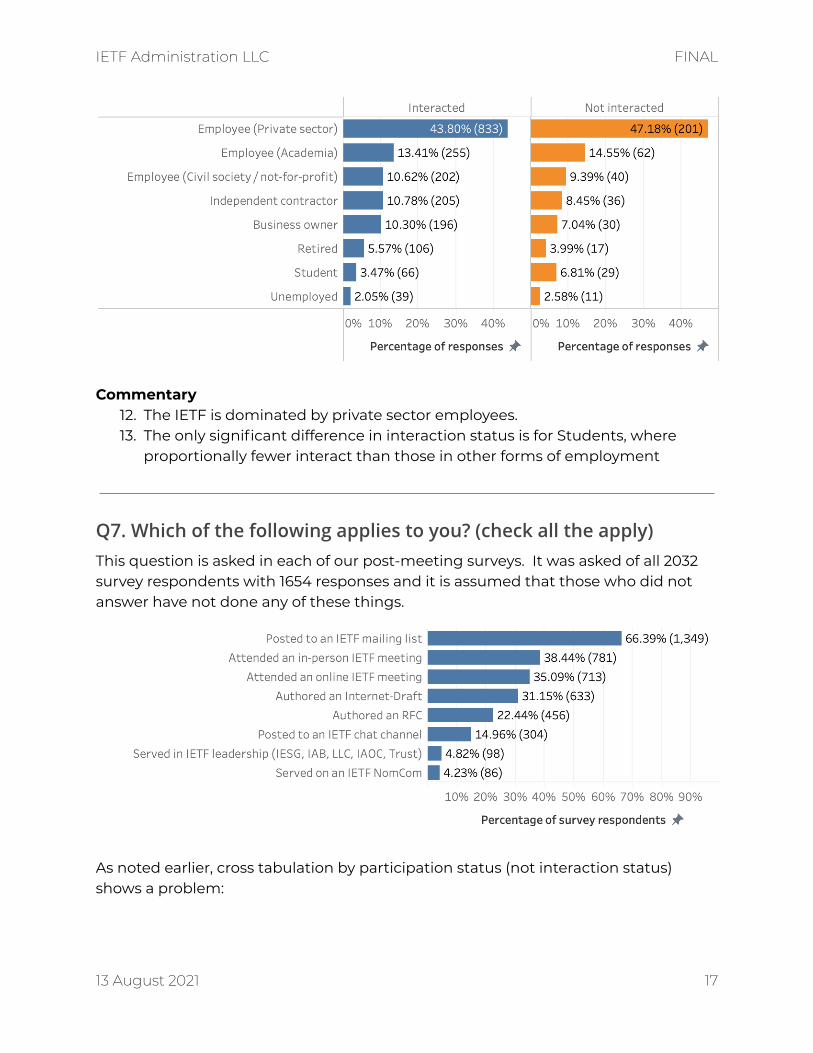
Cross tabulating this by interaction status gives:
13 August 2021 16
IETF Administration LLC FINAL
Commentary12. The IETF is dominated by private sector employees.13. The only significant difference in interaction status is for Students, where
proportionally fewer interact than those in other forms of employment
Q7. Which of the following applies to you? (check all the apply)This question is asked in each of our post-meeting surveys. It was asked of all 2032survey respondents with 1654 responses and it is assumed that those who did notanswer have not done any of these things.
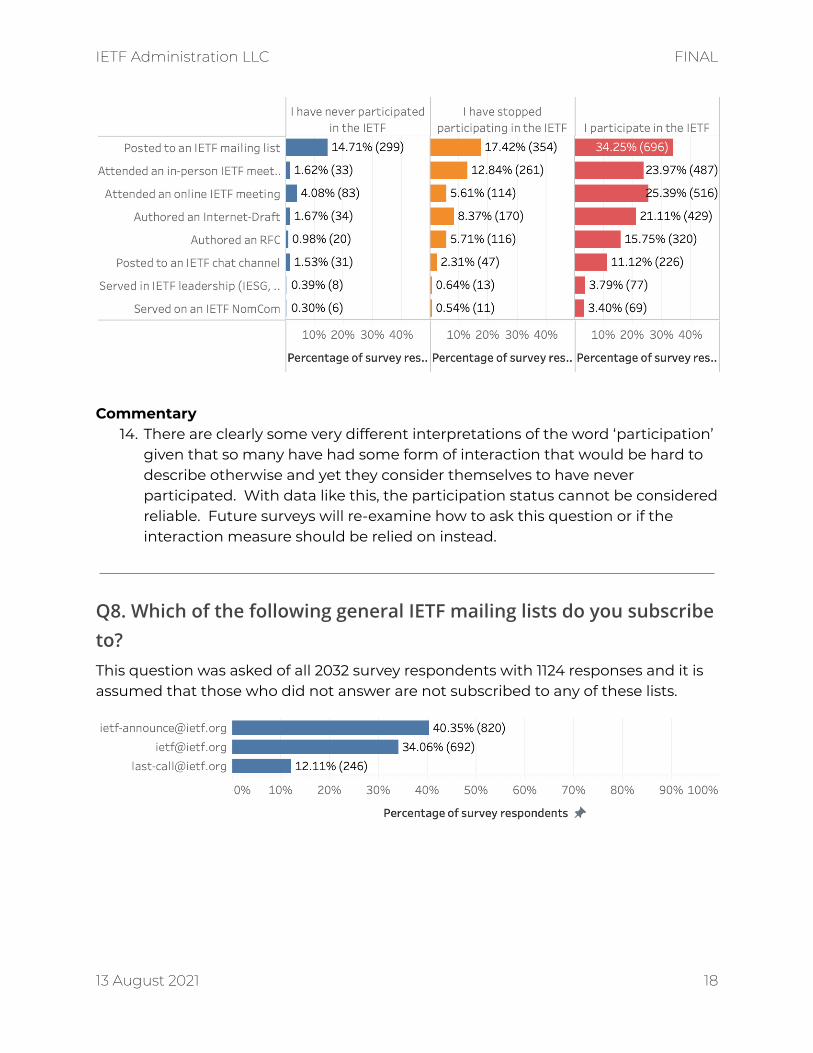
As noted earlier, cross tabulation by participation status (not interaction status)shows a problem:
13 August 2021 17
IETF Administration LLC FINAL
Commentary14. There are clearly some very different interpretations of the word ‘participation’
given that so many have had some form of interaction that would be hard todescribe otherwise and yet they consider themselves to have neverparticipated. With data like this, the participation status cannot be consideredreliable. Future surveys will re-examine how to ask this question or if theinteraction measure should be relied on instead.
Q8. Which of the following general IETF mailing lists do you subscribeto?This question was asked of all 2032 survey respondents with 1124 responses and it isassumed that those who did not answer are not subscribed to any of these lists.
13 August 2021 18
IETF Administration LLC FINAL
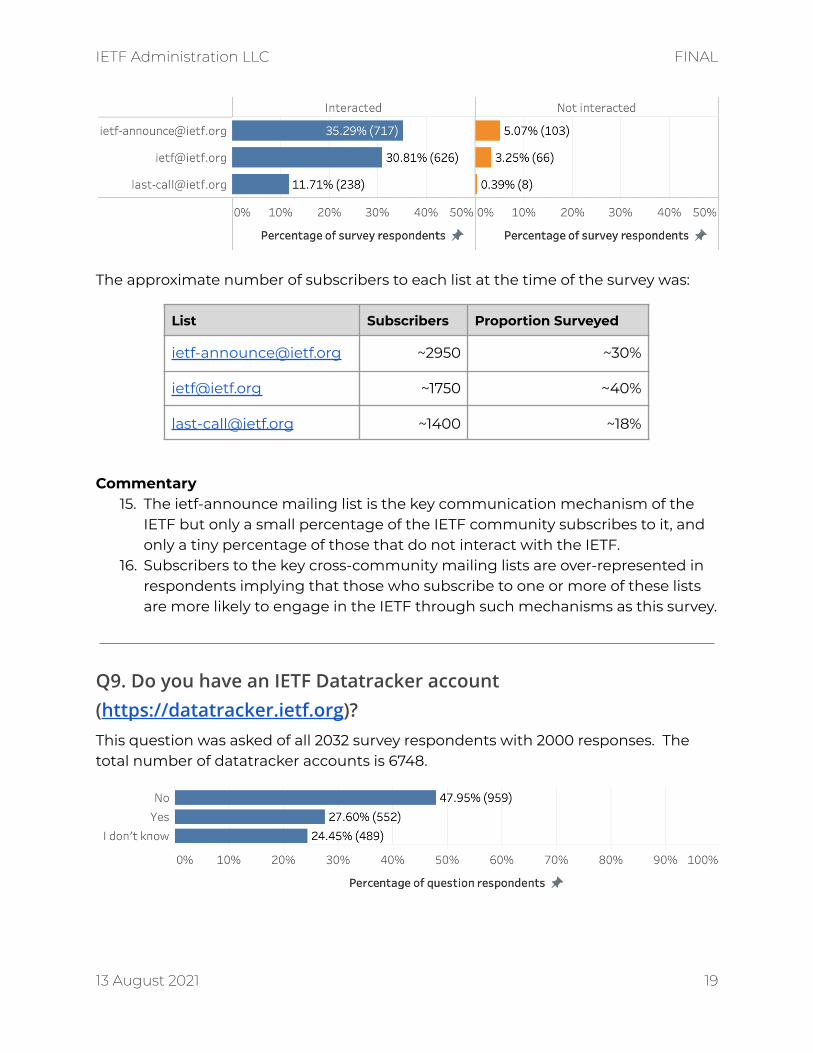
The approximate number of subscribers to each list at the time of the survey was:
List Subscribers Proportion Surveyed
[email protected] ~2950 ~30%
[email protected] ~1750 ~40%
[email protected] ~1400 ~18%
Commentary15. The ietf-announce mailing list is the key communication mechanism of the
IETF but only a small percentage of the IETF community subscribes to it, andonly a tiny percentage of those that do not interact with the IETF.
16. Subscribers to the key cross-community mailing lists are over-represented inrespondents implying that those who subscribe to one or more of these listsare more likely to engage in the IETF through such mechanisms as this survey.
Q9. Do you have an IETF Datatracker account(https://datatracker.ietf.org)?This question was asked of all 2032 survey respondents with 2000 responses. Thetotal number of datatracker accounts is 6748.
13 August 2021 19
IETF Administration LLC FINAL
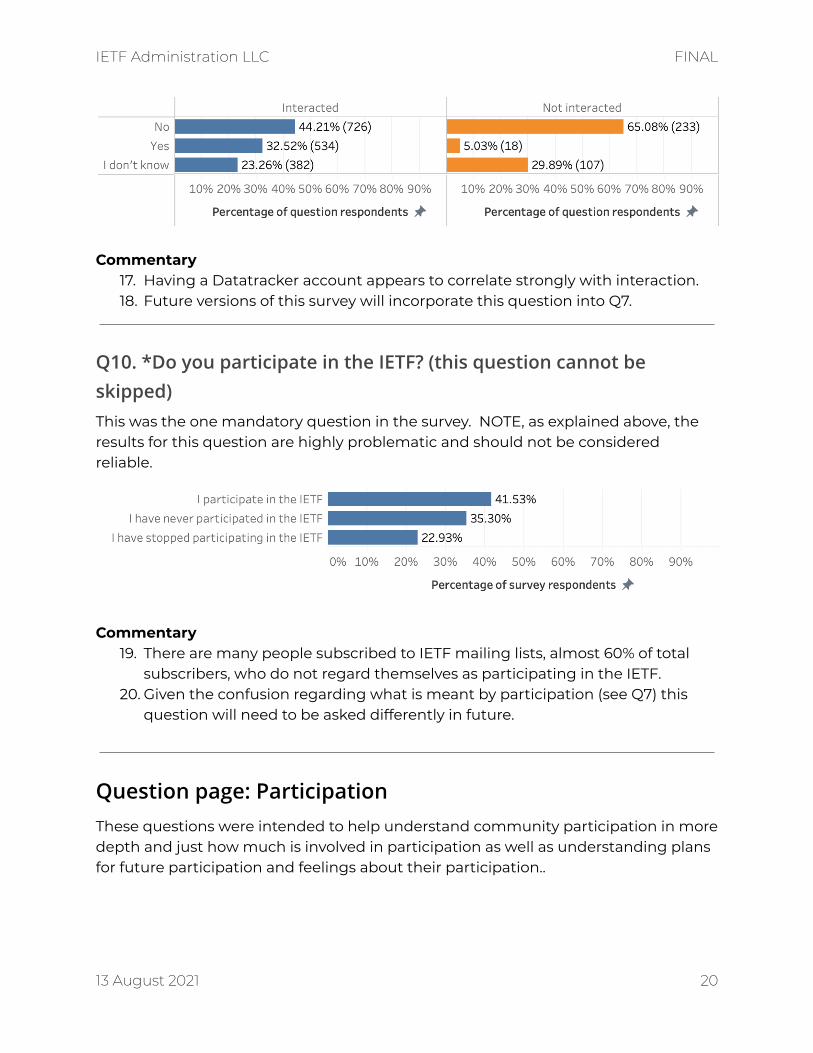
Commentary17. Having a Datatracker account appears to correlate strongly with interaction.18. Future versions of this survey will incorporate this question into Q7.
Q10. *Do you participate in the IETF? (this question cannot beskipped)This was the one mandatory question in the survey. NOTE, as explained above, theresults for this question are highly problematic and should not be consideredreliable.
Commentary19. There are many people subscribed to IETF mailing lists, almost 60% of total
subscribers, who do not regard themselves as participating in the IETF.20. Given the confusion regarding what is meant by participation (see Q7) this
question will need to be asked differently in future.
Question page: ParticipationThese questions were intended to help understand community participation in moredepth and just how much is involved in participation as well as understanding plansfor future participation and feelings about their participation..
13 August 2021 20
IETF Administration LLC FINAL
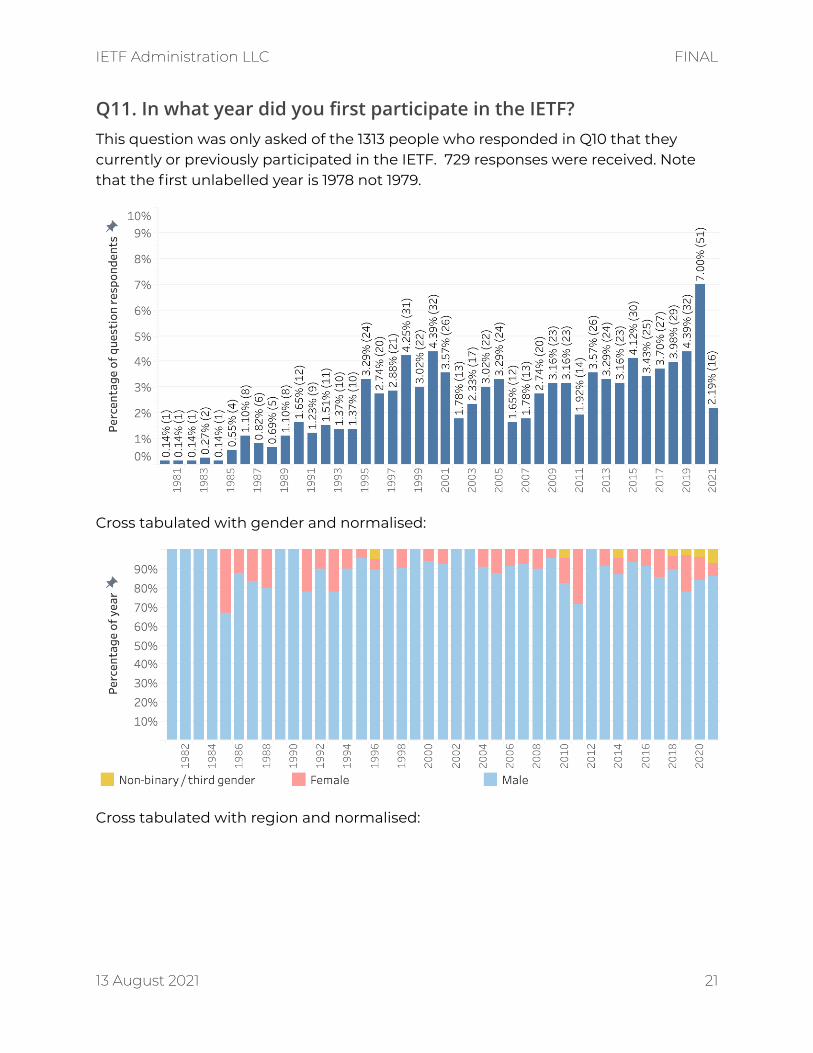
Q11. In what year did you first participate in the IETF?This question was only asked of the 1313 people who responded in Q10 that theycurrently or previously participated in the IETF. 729 responses were received. Notethat the first unlabelled year is 1978 not 1979.
Cross tabulated with gender and normalised:
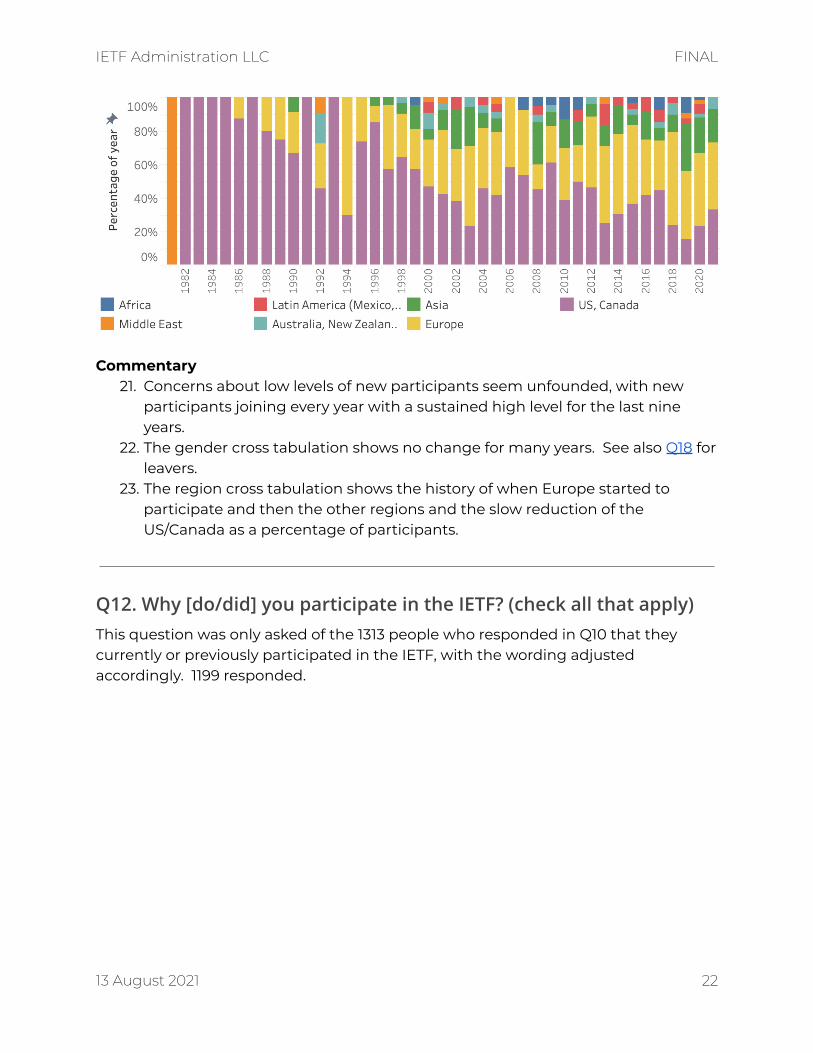
Cross tabulated with region and normalised:
13 August 2021 21
IETF Administration LLC FINAL
Commentary21. Concerns about low levels of new participants seem unfounded, with new
participants joining every year with a sustained high level for the last nineyears.
22. The gender cross tabulation shows no change for many years. See also Q18 forleavers.
23. The region cross tabulation shows the history of when Europe started toparticipate and then the other regions and the slow reduction of theUS/Canada as a percentage of participants.
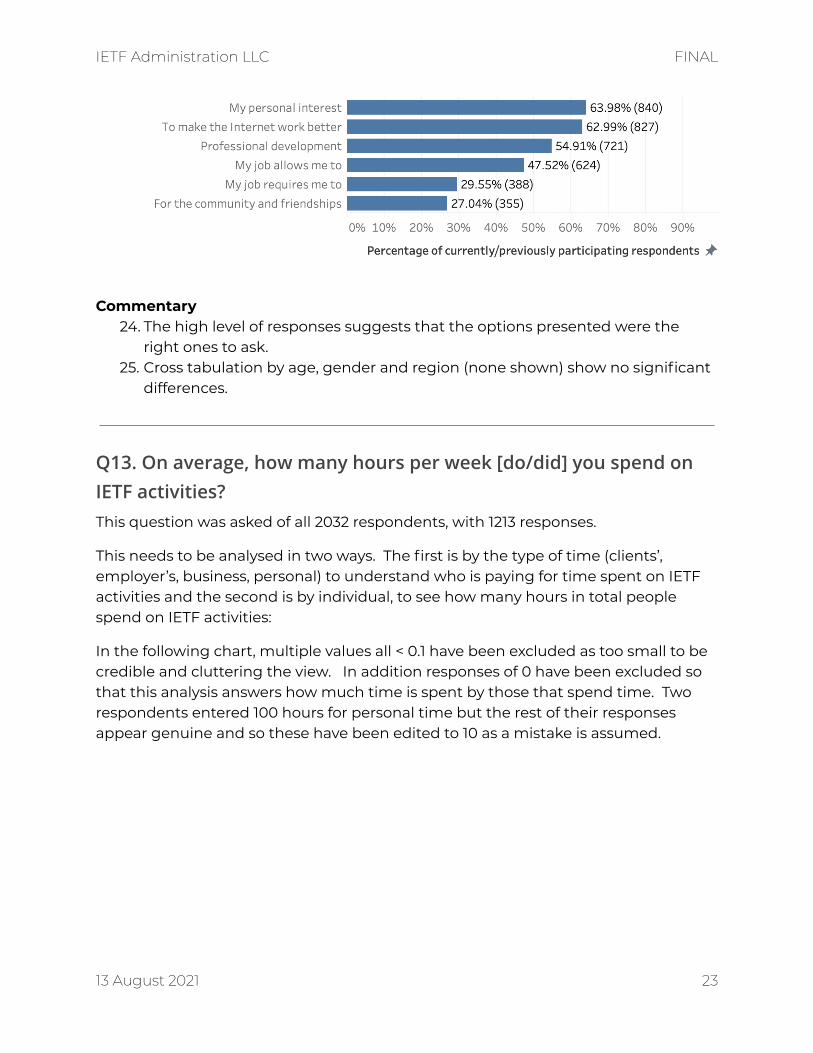
Q12. Why [do/did] you participate in the IETF? (check all that apply)This question was only asked of the 1313 people who responded in Q10 that theycurrently or previously participated in the IETF, with the wording adjustedaccordingly. 1199 responded.
13 August 2021 22
IETF Administration LLC FINAL
Commentary24. The high level of responses suggests that the options presented were the
right ones to ask.25. Cross tabulation by age, gender and region (none shown) show no significant
differences.
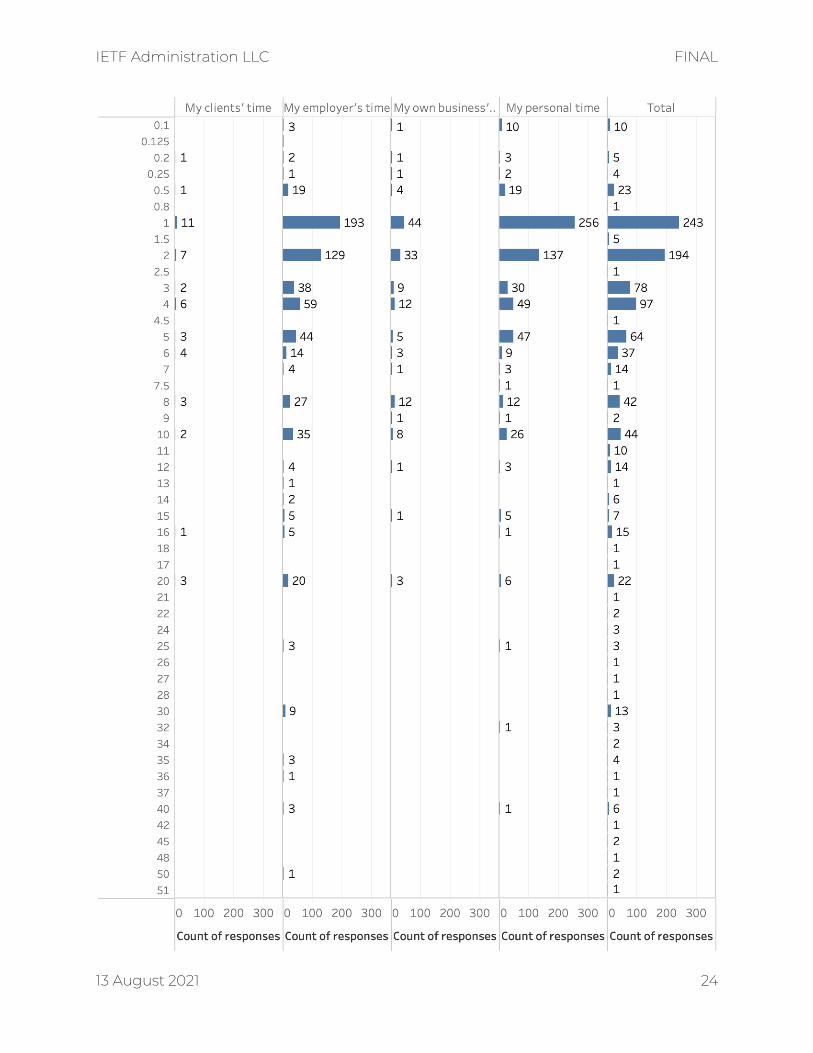
Q13. On average, how many hours per week [do/did] you spend onIETF activities?This question was asked of all 2032 respondents, with 1213 responses.
This needs to be analysed in two ways. The first is by the type of time (clients’,employer’s, business, personal) to understand who is paying for time spent on IETFactivities and the second is by individual, to see how many hours in total peoplespend on IETF activities:
In the following chart, multiple values all < 0.1 have been excluded as too small to becredible and cluttering the view. In addition responses of 0 have been excluded sothat this analysis answers how much time is spent by those that spend time. Tworespondents entered 100 hours for personal time but the rest of their responsesappear genuine and so these have been edited to 10 as a mistake is assumed.
13 August 2021 23
IETF Administration LLC FINAL
13 August 2021 24
IETF Administration LLC FINAL
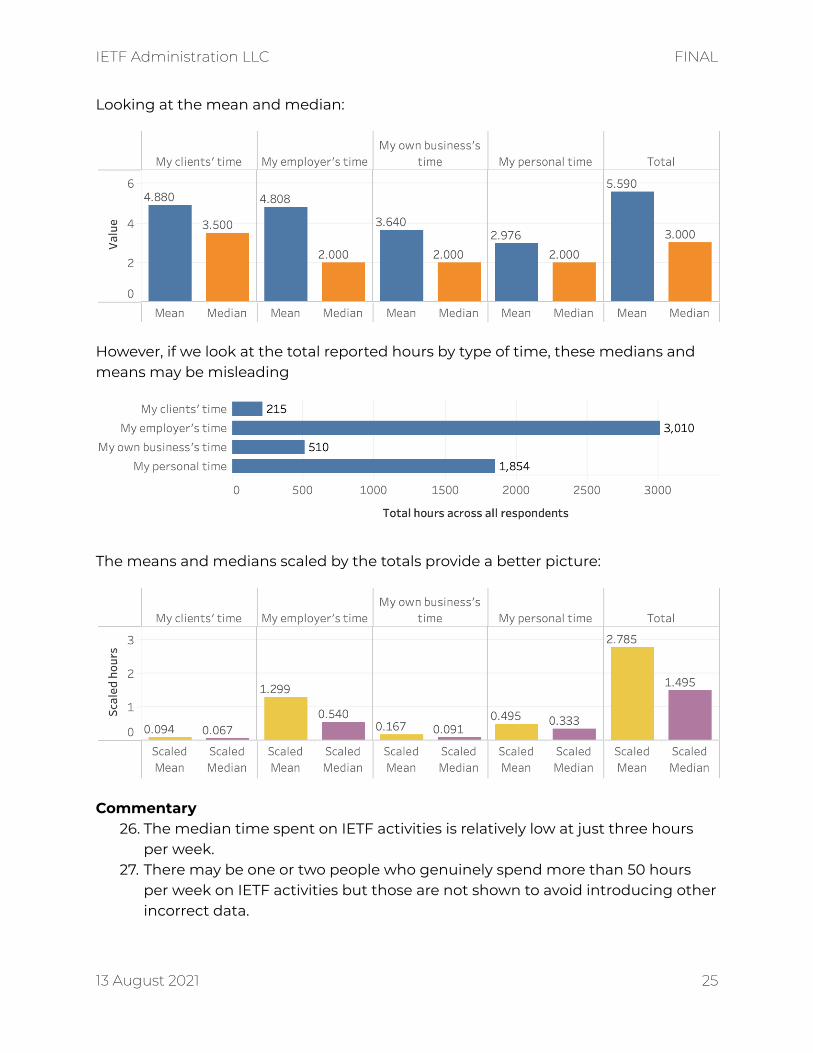
Looking at the mean and median:
However, if we look at the total reported hours by type of time, these medians andmeans may be misleading
The means and medians scaled by the totals provide a better picture:
Commentary26. The median time spent on IETF activities is relatively low at just three hours
per week.27. There may be one or two people who genuinely spend more than 50 hours
per week on IETF activities but those are not shown to avoid introducing otherincorrect data.
13 August 2021 25
IETF Administration LLC FINAL
28. Time paid for by employers accounts for almost 50% of all time spent on IETFactivities.
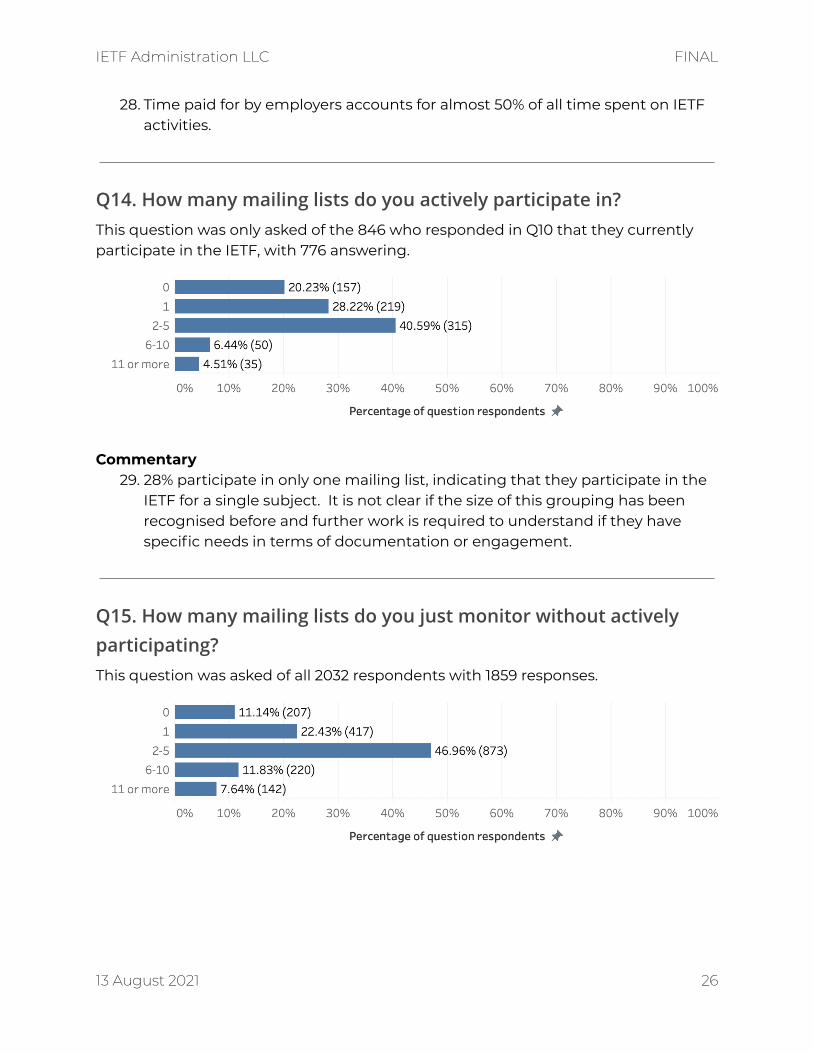
Q14. How many mailing lists do you actively participate in?This question was only asked of the 846 who responded in Q10 that they currentlyparticipate in the IETF, with 776 answering.
Commentary29. 28% participate in only one mailing list, indicating that they participate in the
IETF for a single subject. It is not clear if the size of this grouping has beenrecognised before and further work is required to understand if they havespecific needs in terms of documentation or engagement.
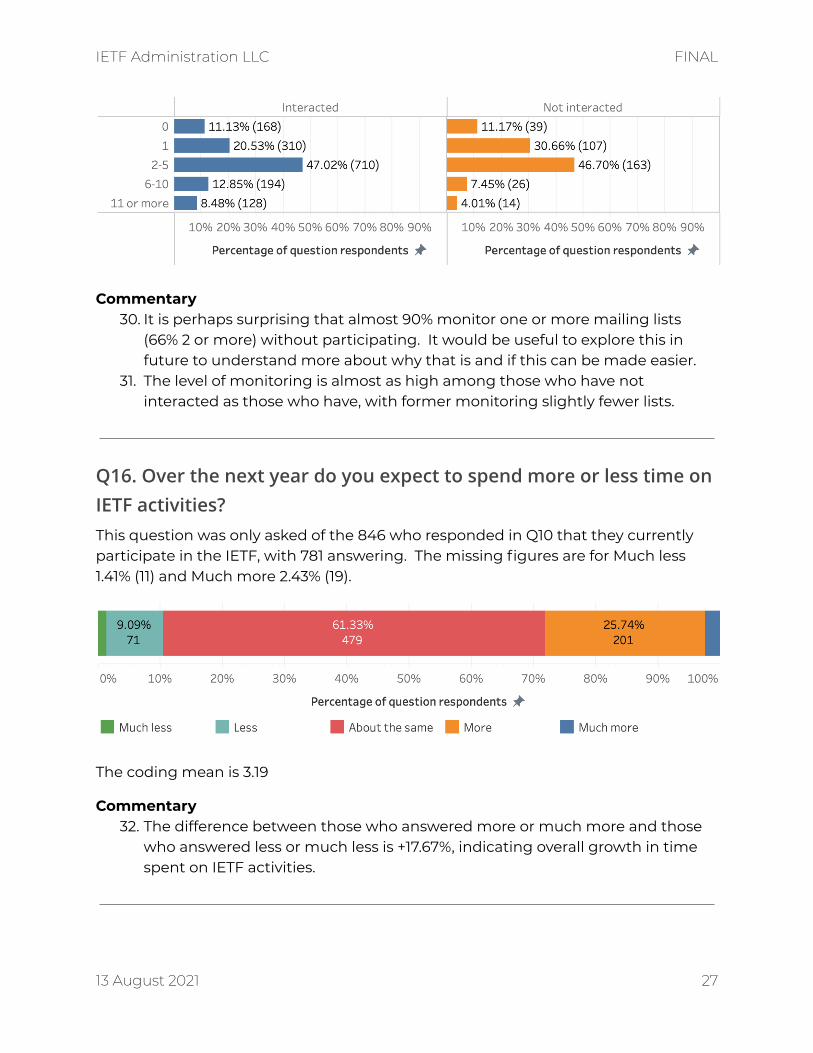
Q15. How many mailing lists do you just monitor without activelyparticipating?This question was asked of all 2032 respondents with 1859 responses.
13 August 2021 26
IETF Administration LLC FINAL
Commentary30. It is perhaps surprising that almost 90% monitor one or more mailing lists
(66% 2 or more) without participating. It would be useful to explore this infuture to understand more about why that is and if this can be made easier.
31. The level of monitoring is almost as high among those who have notinteracted as those who have, with former monitoring slightly fewer lists.
Q16. Over the next year do you expect to spend more or less time onIETF activities?This question was only asked of the 846 who responded in Q10 that they currentlyparticipate in the IETF, with 781 answering. The missing figures are for Much less1.41% (11) and Much more 2.43% (19).
The coding mean is 3.19
Commentary32. The difference between those who answered more or much more and those
who answered less or much less is +17.67%, indicating overall growth in timespent on IETF activities.
13 August 2021 27
IETF Administration LLC FINAL
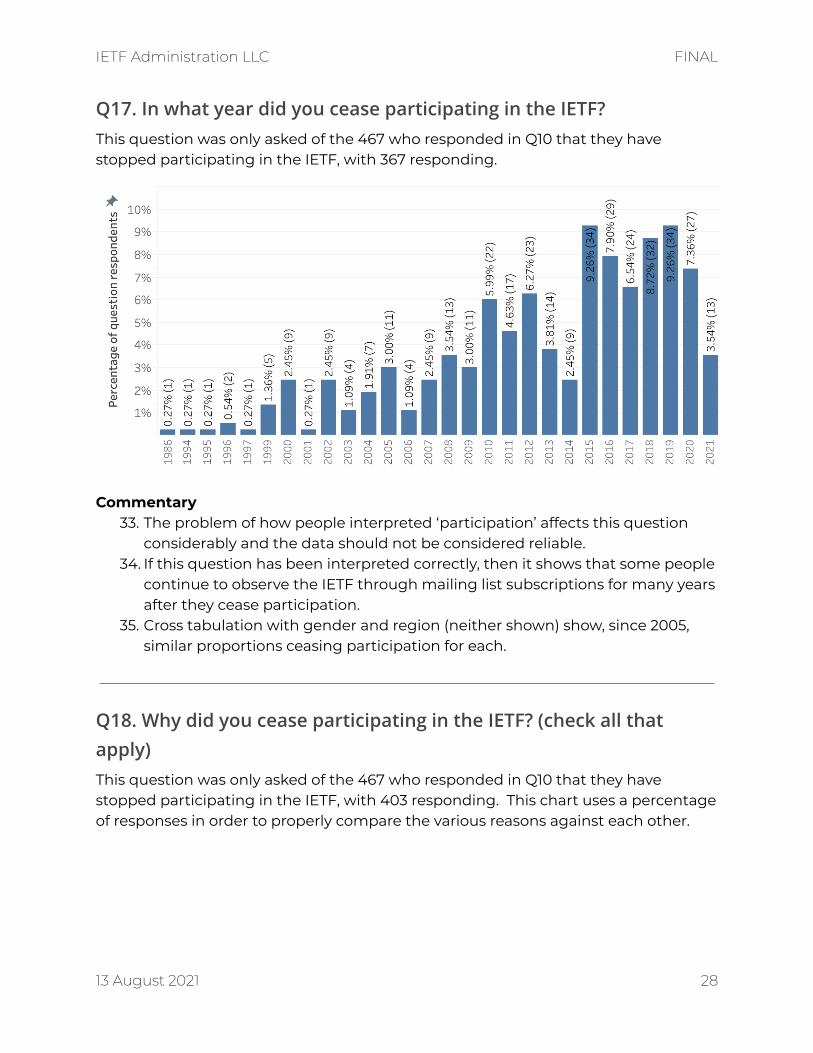
Q17. In what year did you cease participating in the IETF?This question was only asked of the 467 who responded in Q10 that they havestopped participating in the IETF, with 367 responding.
Commentary33. The problem of how people interpreted ‘participation’ affects this question
considerably and the data should not be considered reliable.34. If this question has been interpreted correctly, then it shows that some people
continue to observe the IETF through mailing list subscriptions for many yearsafter they cease participation.
35. Cross tabulation with gender and region (neither shown) show, since 2005,similar proportions ceasing participation for each.
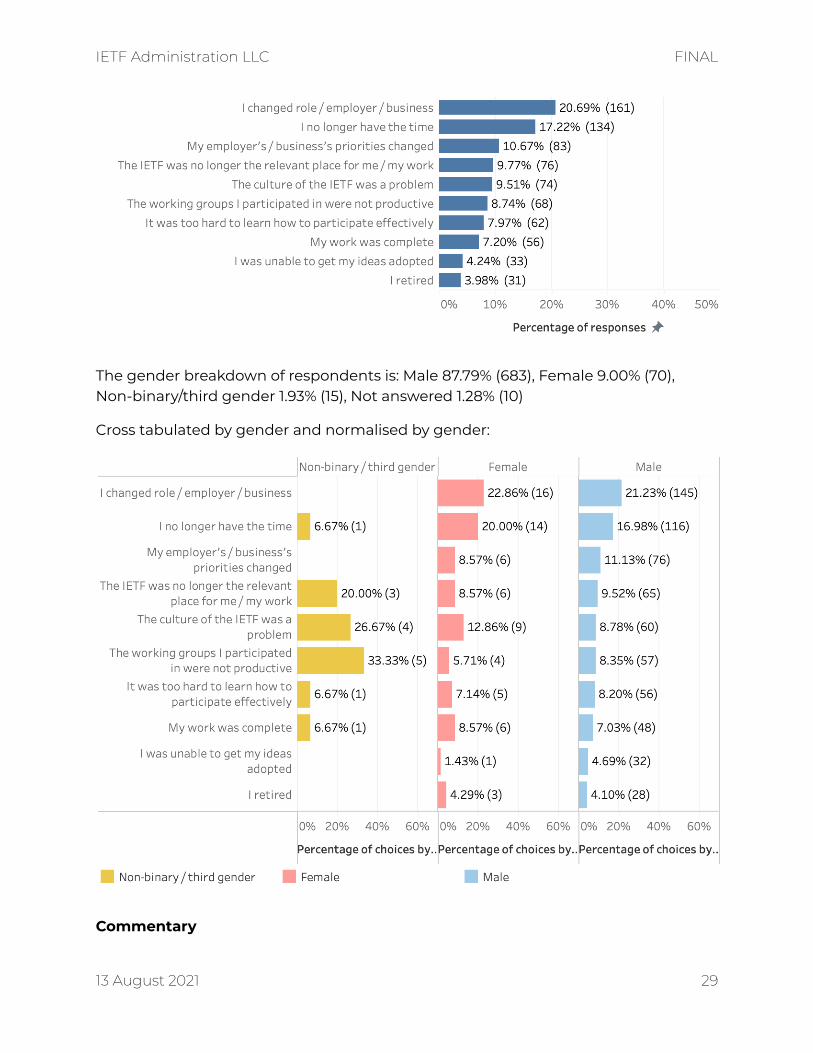
Q18. Why did you cease participating in the IETF? (check all thatapply)This question was only asked of the 467 who responded in Q10 that they havestopped participating in the IETF, with 403 responding. This chart uses a percentageof responses in order to properly compare the various reasons against each other.
13 August 2021 28
IETF Administration LLC FINAL
The gender breakdown of respondents is: Male 87.79% (683), Female 9.00% (70),Non-binary/third gender 1.93% (15), Not answered 1.28% (10)
Cross tabulated by gender and normalised by gender:
Commentary
13 August 2021 29
IETF Administration LLC FINAL
36. The problem of how people interpreted ‘participation’ affects this questionconsiderably and the data should not be considered reliable.
37. The gender breakdown of those leaving matches the current breakdown ofIETF participants from Q4, so no gender leaves disproportionately to theothers, though the number of non-binary/third gender respondents is toosmall for reliable analysis.
38. Employers allowing or supporting participation is the largest single reason,and at 31.26% in total, is close to the 29.55% from Q12 who participate becausetheir work requires them to.
39. Taken together, the things that are within the control of the IETF to fix,culture, productivity and learning to participate, account for 26.22% of reasonsfor leaving.
40.The personal culture of the IETF disproportionately pushes away femalescompared to males while other factors have less of an impact.
41. An inability to get ideas adopted disproportionately pushes away males incomparison to females while other factors have less of an impact.
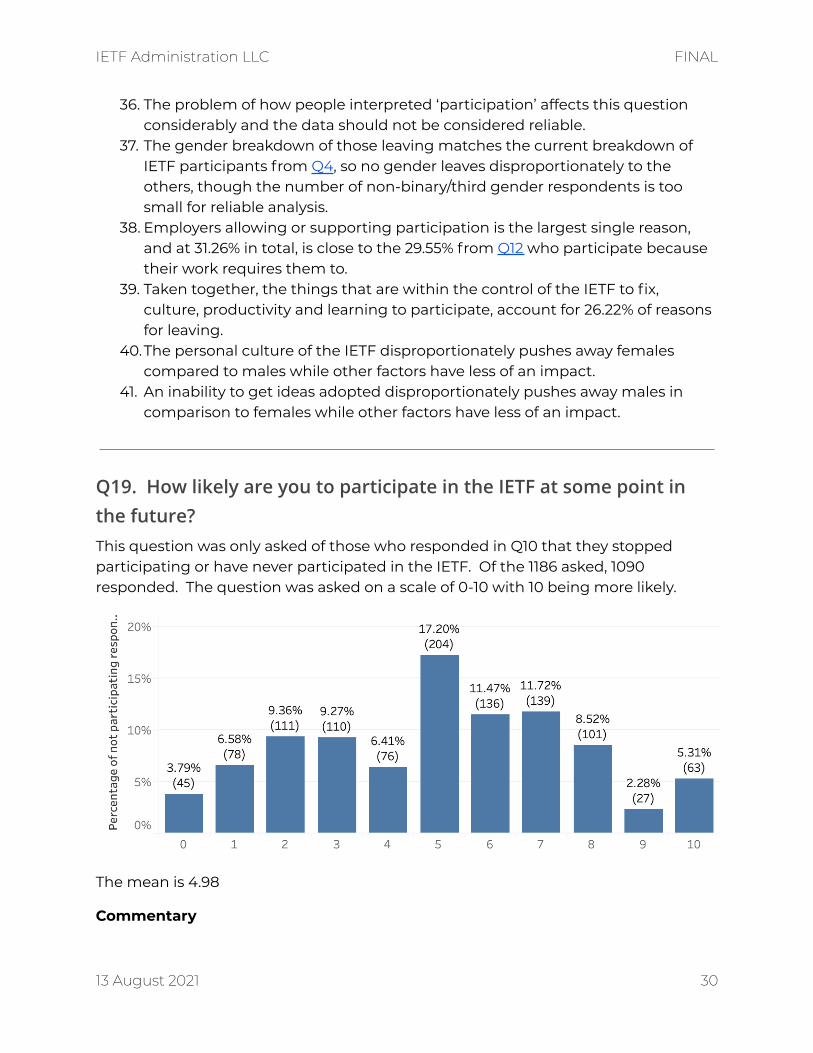
Q19. How likely are you to participate in the IETF at some point inthe future?This question was only asked of those who responded in Q10 that they stoppedparticipating or have never participated in the IETF. Of the 1186 asked, 1090responded. The question was asked on a scale of 0-10 with 10 being more likely.
The mean is 4.98
Commentary
13 August 2021 30
IETF Administration LLC FINAL
42. This result may be affected by the problem of how people interpreted‘participation’.
43. Aside from the bump at one end and a slight dip in the middle, this is close toa normal distribution and so may not tell us anything useful.
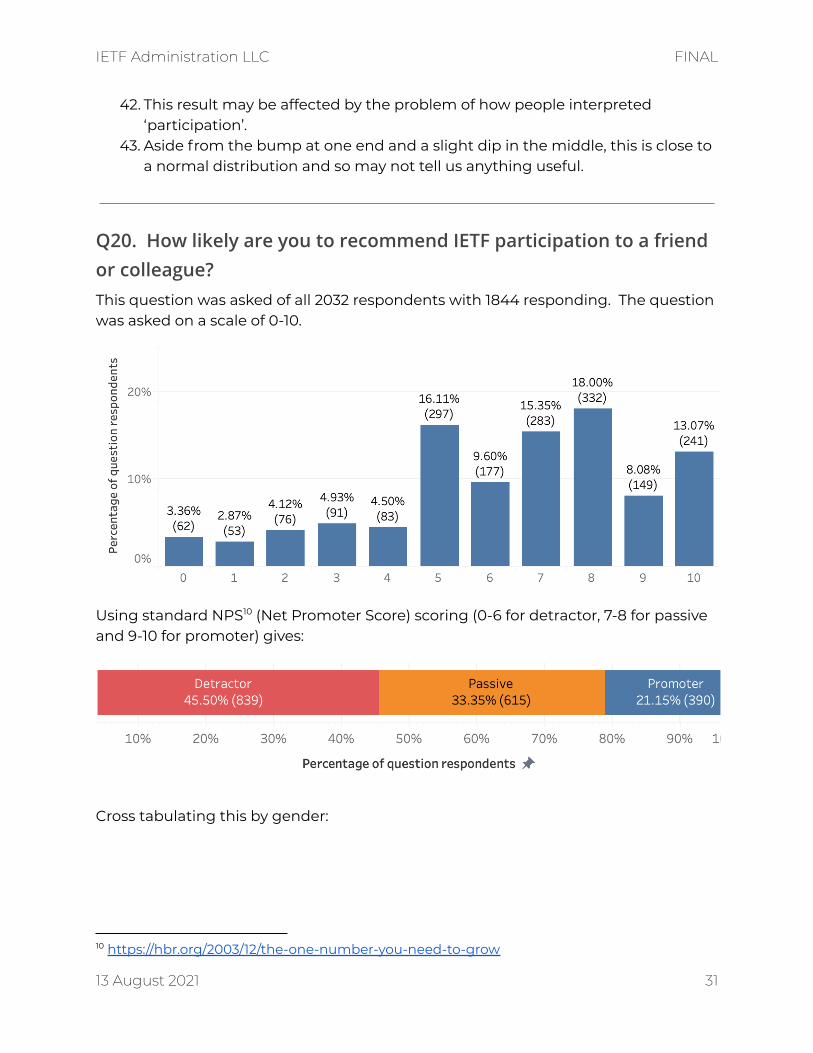
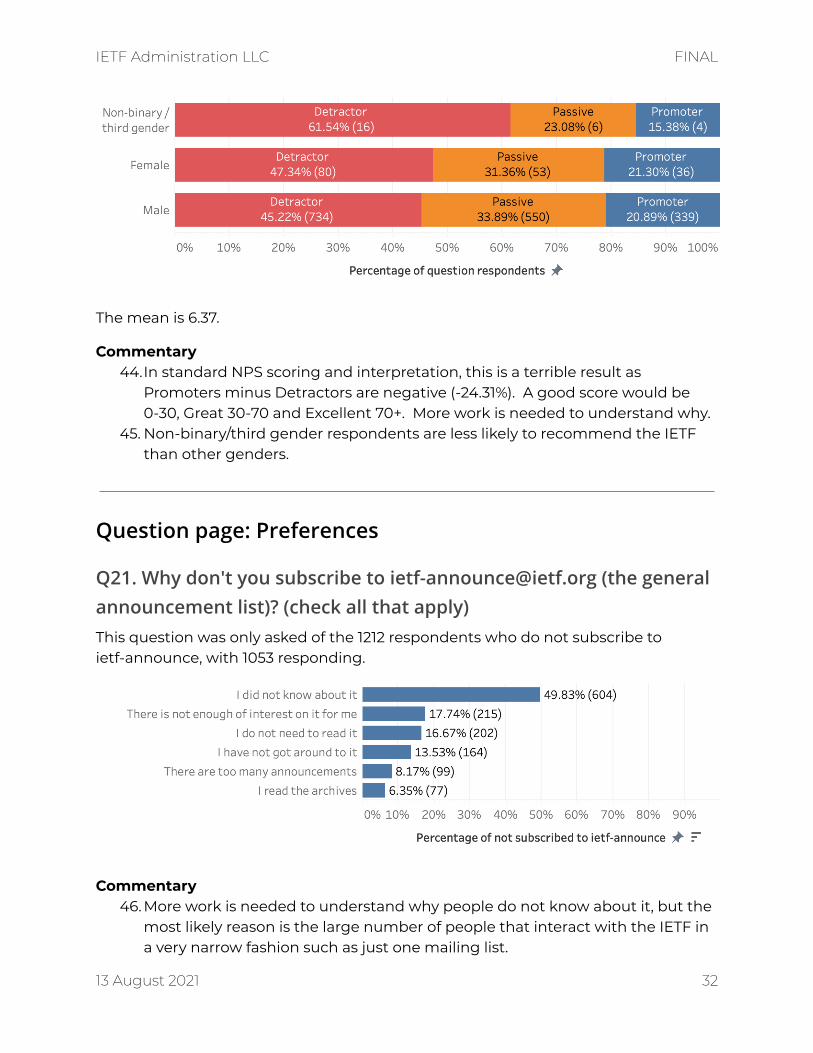
Q20. How likely are you to recommend IETF participation to a friendor colleague?This question was asked of all 2032 respondents with 1844 responding. The questionwas asked on a scale of 0-10.
Using standard NPS10 (Net Promoter Score) scoring (0-6 for detractor, 7-8 for passiveand 9-10 for promoter) gives:
Cross tabulating this by gender:
10 https://hbr.org/2003/12/the-one-number-you-need-to-grow
13 August 2021 31
IETF Administration LLC FINAL
The mean is 6.37.
Commentary44.In standard NPS scoring and interpretation, this is a terrible result as
Promoters minus Detractors are negative (-24.31%). A good score would be0-30, Great 30-70 and Excellent 70+. More work is needed to understand why.
45. Non-binary/third gender respondents are less likely to recommend the IETFthan other genders.
Question page: Preferences
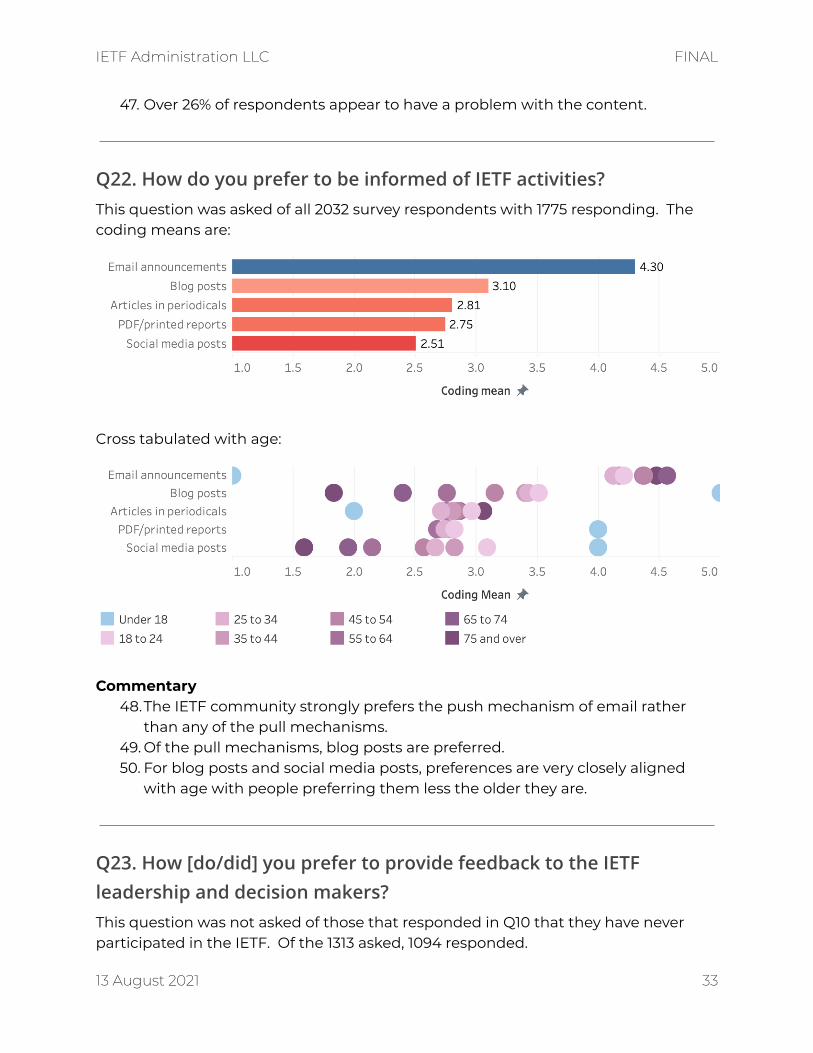
Q21. Why don't you subscribe to [email protected] (the generalannouncement list)? (check all that apply)This question was only asked of the 1212 respondents who do not subscribe toietf-announce, with 1053 responding.
Commentary46. More work is needed to understand why people do not know about it, but the
most likely reason is the large number of people that interact with the IETF ina very narrow fashion such as just one mailing list.
13 August 2021 32
IETF Administration LLC FINAL
47. Over 26% of respondents appear to have a problem with the content.
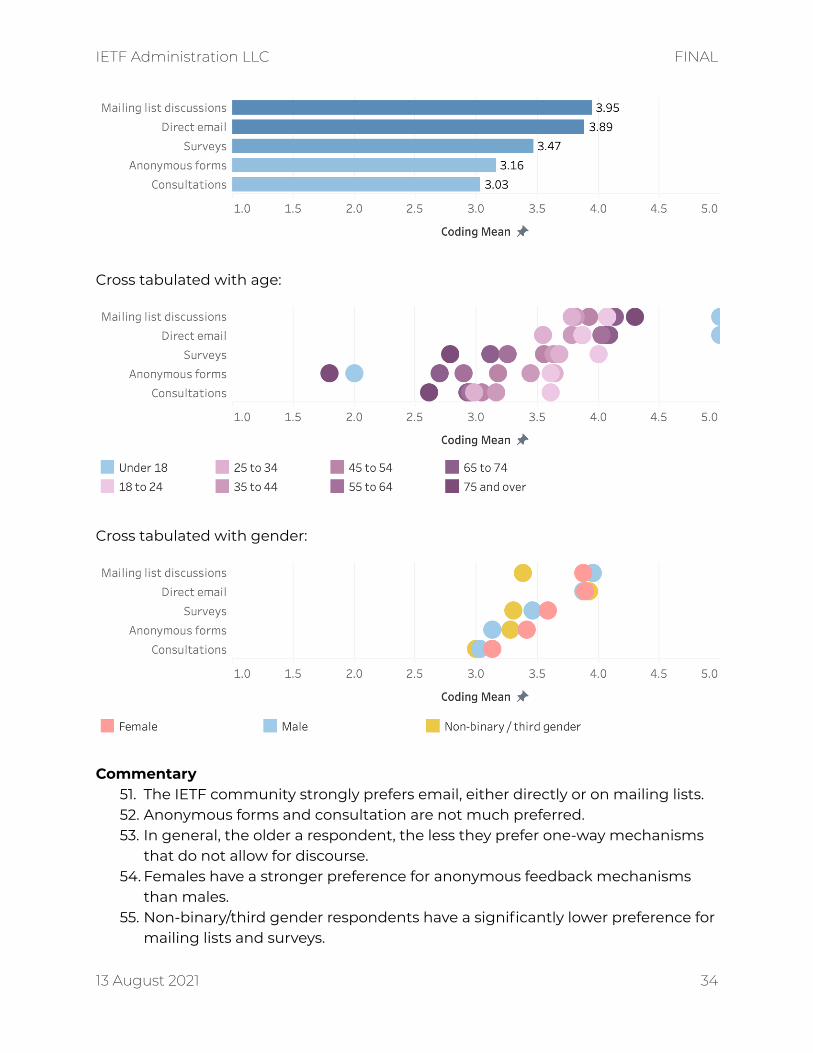
Q22. How do you prefer to be informed of IETF activities?This question was asked of all 2032 survey respondents with 1775 responding. Thecoding means are:
Cross tabulated with age:
Commentary48.The IETF community strongly prefers the push mechanism of email rather
than any of the pull mechanisms.49. Of the pull mechanisms, blog posts are preferred.50. For blog posts and social media posts, preferences are very closely aligned
with age with people preferring them less the older they are.
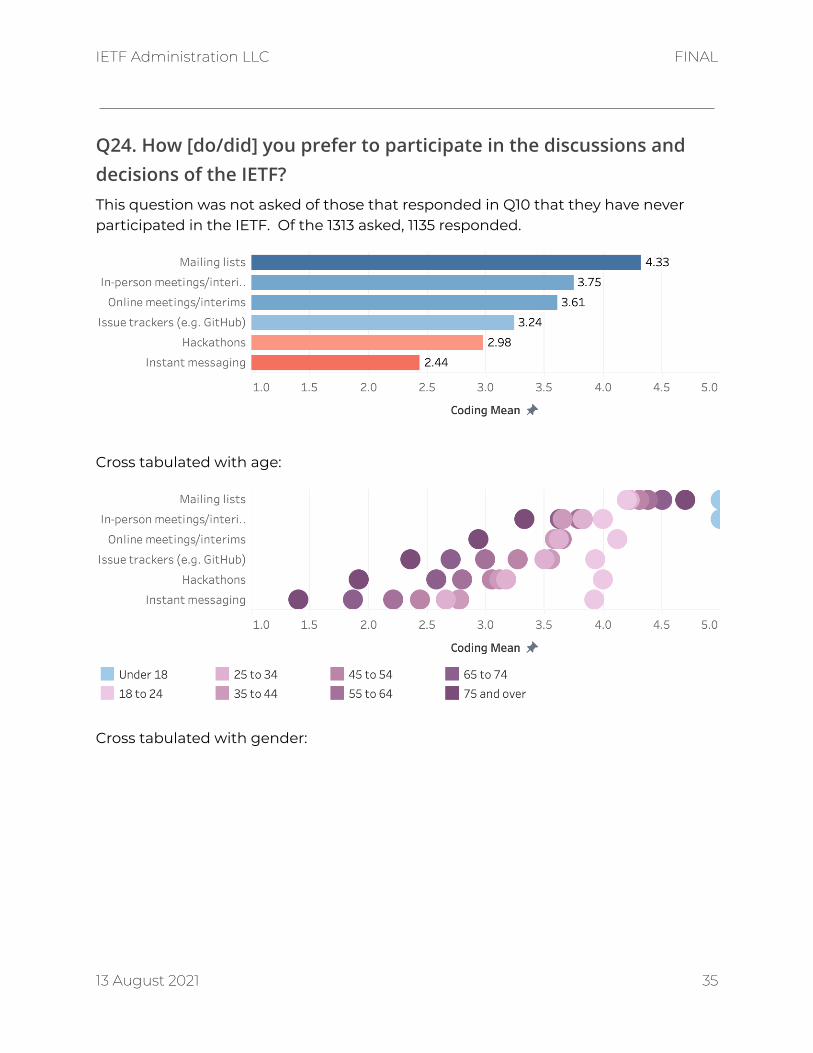
Q23. How [do/did] you prefer to provide feedback to the IETFleadership and decision makers?This question was not asked of those that responded in Q10 that they have neverparticipated in the IETF. Of the 1313 asked, 1094 responded.
13 August 2021 33
IETF Administration LLC FINAL
Cross tabulated with age:
Cross tabulated with gender:
Commentary51. The IETF community strongly prefers email, either directly or on mailing lists.52. Anonymous forms and consultation are not much preferred.53. In general, the older a respondent, the less they prefer one-way mechanisms
that do not allow for discourse.54. Females have a stronger preference for anonymous feedback mechanisms
than males.55. Non-binary/third gender respondents have a significantly lower preference for
mailing lists and surveys.
13 August 2021 34
IETF Administration LLC FINAL
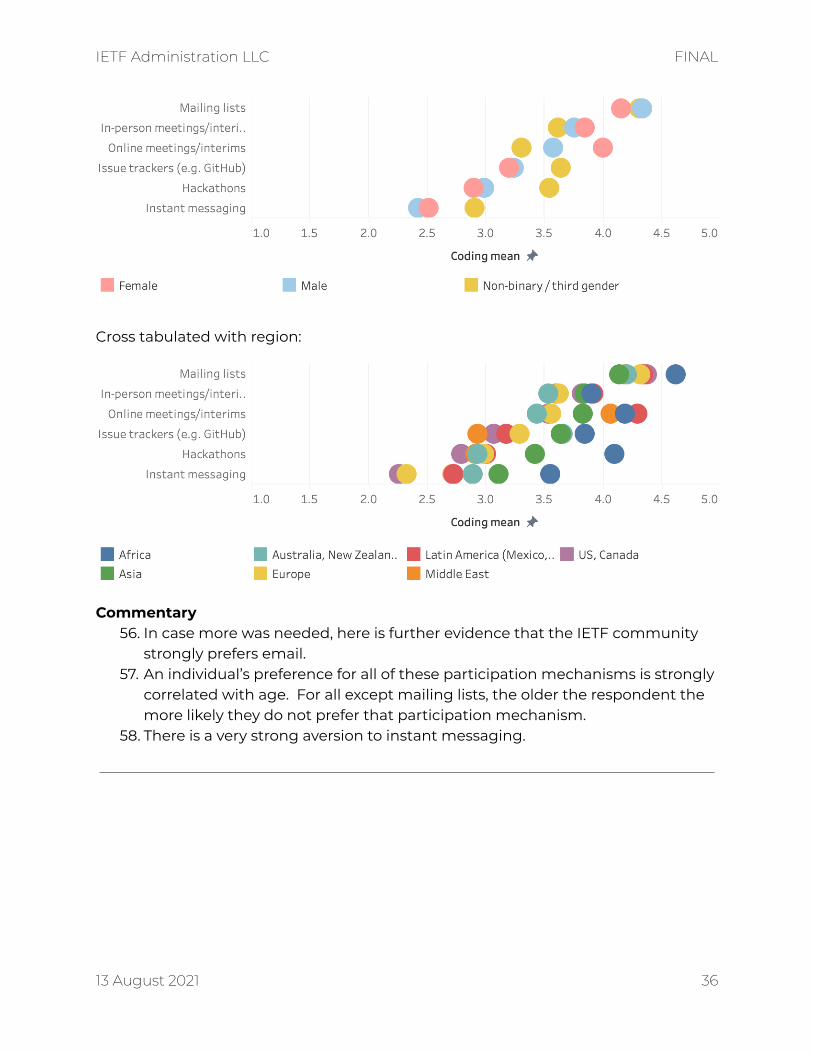
Q24. How [do/did] you prefer to participate in the discussions anddecisions of the IETF?This question was not asked of those that responded in Q10 that they have neverparticipated in the IETF. Of the 1313 asked, 1135 responded.
Cross tabulated with age:
Cross tabulated with gender:
13 August 2021 35
IETF Administration LLC FINAL
Cross tabulated with region:
Commentary56. In case more was needed, here is further evidence that the IETF community
strongly prefers email.57. An individual’s preference for all of these participation mechanisms is strongly
correlated with age. For all except mailing lists, the older the respondent themore likely they do not prefer that participation mechanism.
58. There is a very strong aversion to instant messaging.
13 August 2021 36
IETF Administration LLC FINAL
Question page: Perceptions
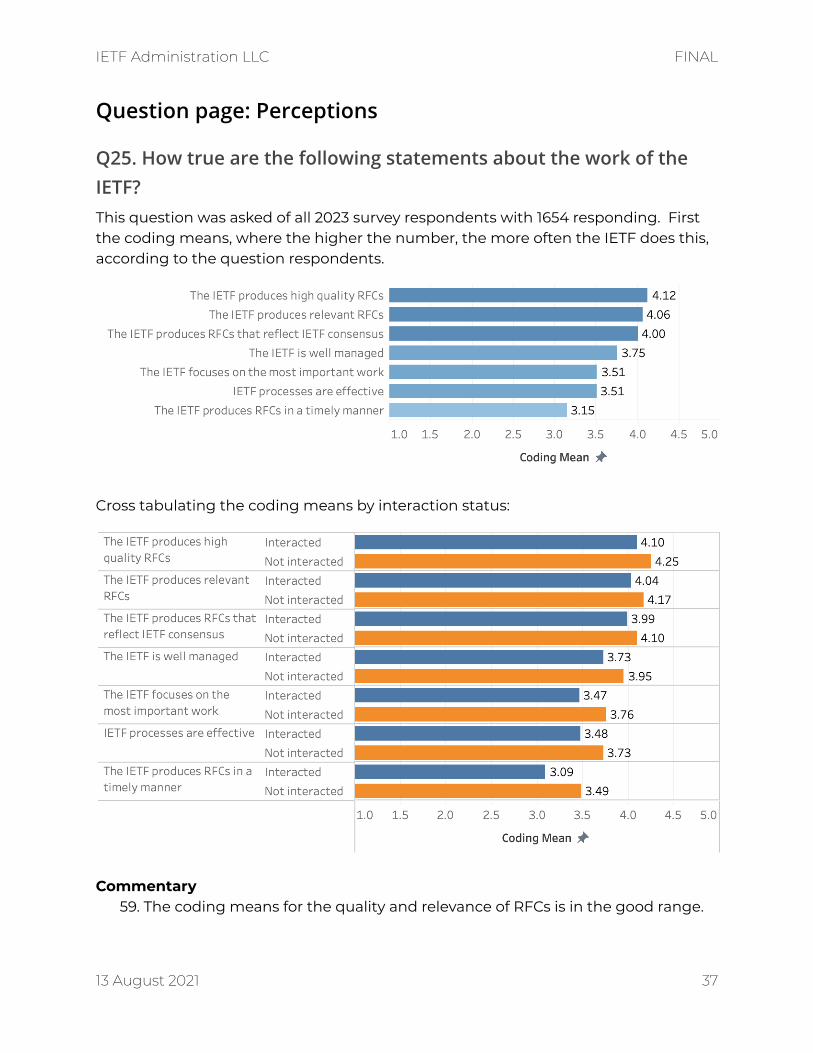
Q25. How true are the following statements about the work of theIETF?This question was asked of all 2023 survey respondents with 1654 responding. Firstthe coding means, where the higher the number, the more often the IETF does this,according to the question respondents.
Cross tabulating the coding means by interaction status:
Commentary59. The coding means for the quality and relevance of RFCs is in the good range.
13 August 2021 37
IETF Administration LLC FINAL
60. The coding mean for the timeliness of RFCs is very low in comparison to theothers, and even more so when looking only at those that have interactedwith the IETF.
61. Those who have not interacted with the IETF have a consistently betterassessment of it than those who have.
62. Cross tabulation by age, gender and region (none shown) show no significantdifferences.
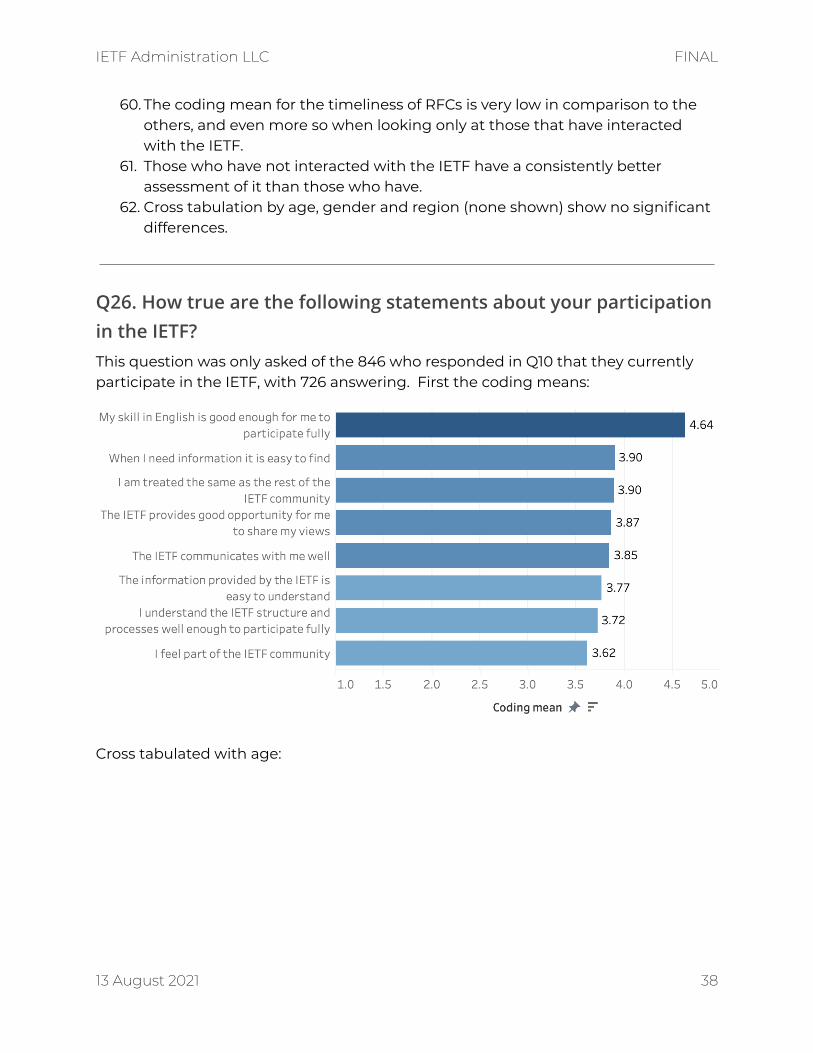
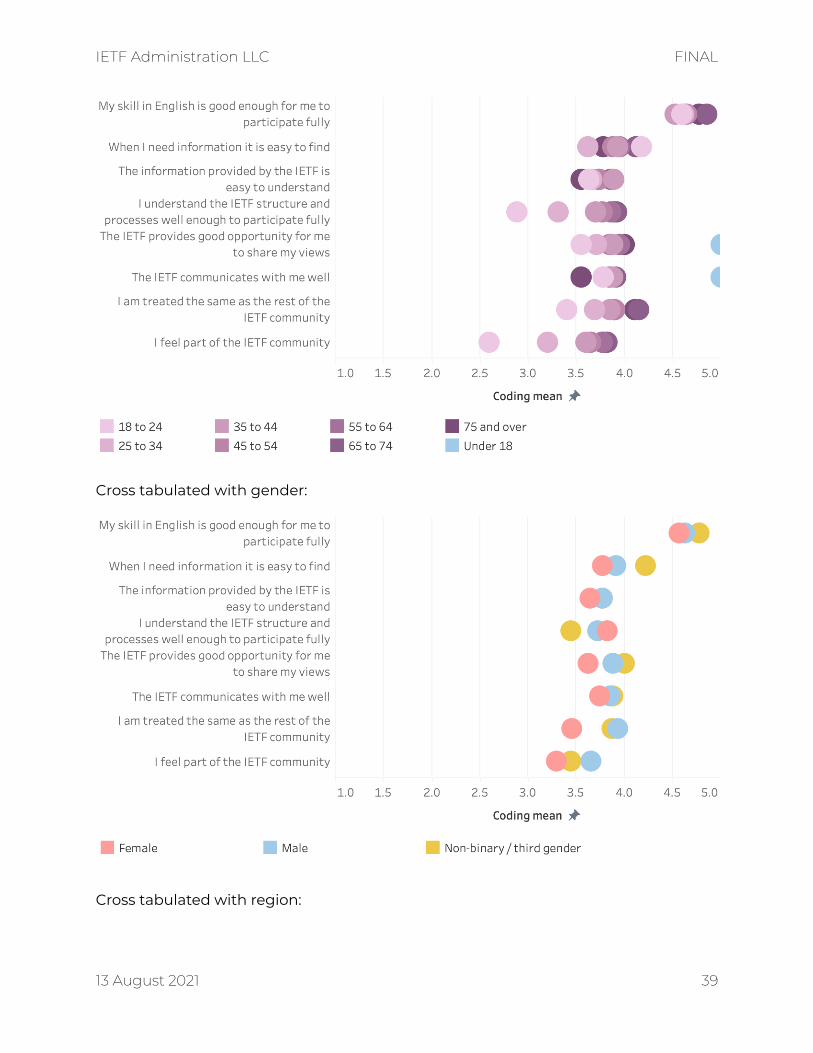
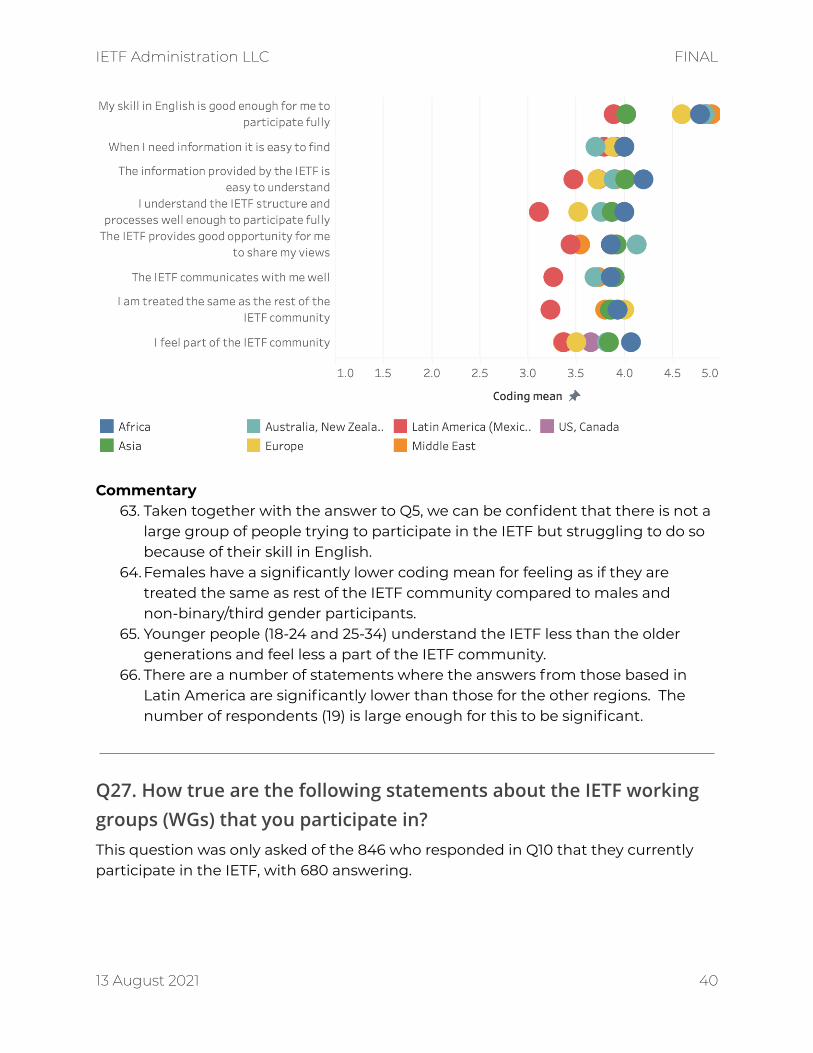
Q26. How true are the following statements about your participationin the IETF?This question was only asked of the 846 who responded in Q10 that they currentlyparticipate in the IETF, with 726 answering. First the coding means:
Cross tabulated with age:
13 August 2021 38
IETF Administration LLC FINAL
Cross tabulated with gender:
Cross tabulated with region:
13 August 2021 39
IETF Administration LLC FINAL
Commentary63. Taken together with the answer to Q5, we can be confident that there is not a
large group of people trying to participate in the IETF but struggling to do sobecause of their skill in English.
64. Females have a significantly lower coding mean for feeling as if they aretreated the same as rest of the IETF community compared to males andnon-binary/third gender participants.
65. Younger people (18-24 and 25-34) understand the IETF less than the oldergenerations and feel less a part of the IETF community.
66. There are a number of statements where the answers from those based inLatin America are significantly lower than those for the other regions. Thenumber of respondents (19) is large enough for this to be significant.
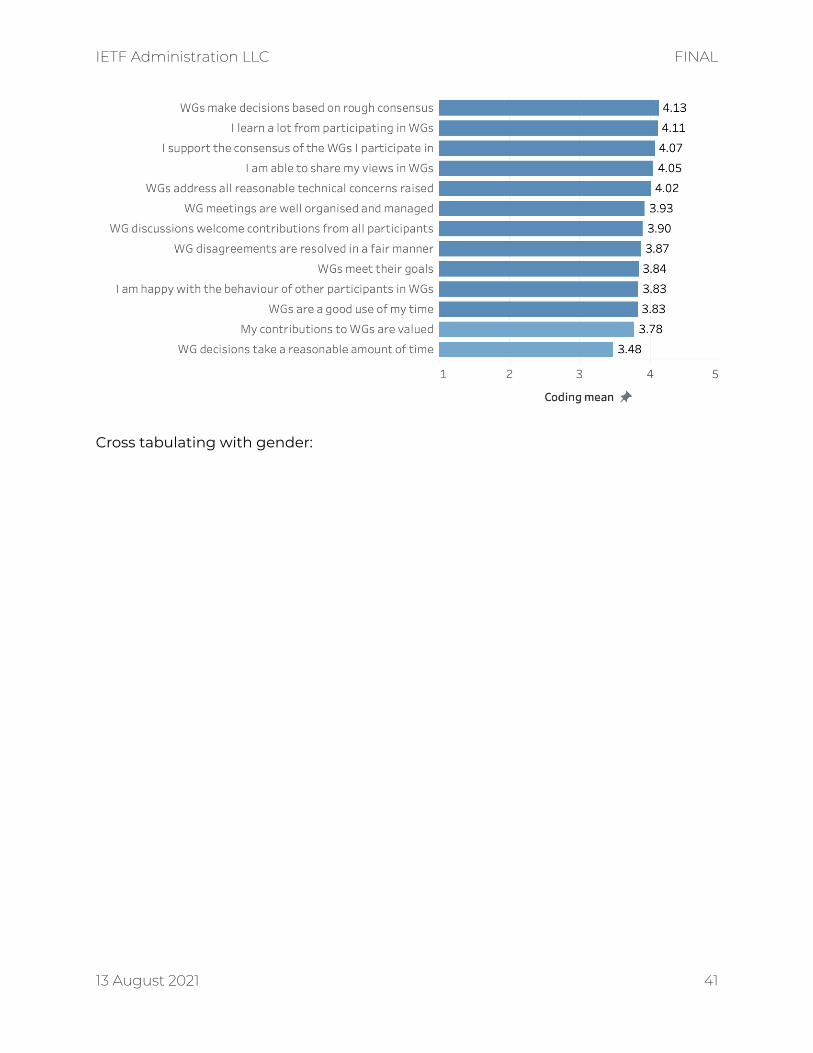
Q27. How true are the following statements about the IETF workinggroups (WGs) that you participate in?This question was only asked of the 846 who responded in Q10 that they currentlyparticipate in the IETF, with 680 answering.
13 August 2021 40
IETF Administration LLC FINAL
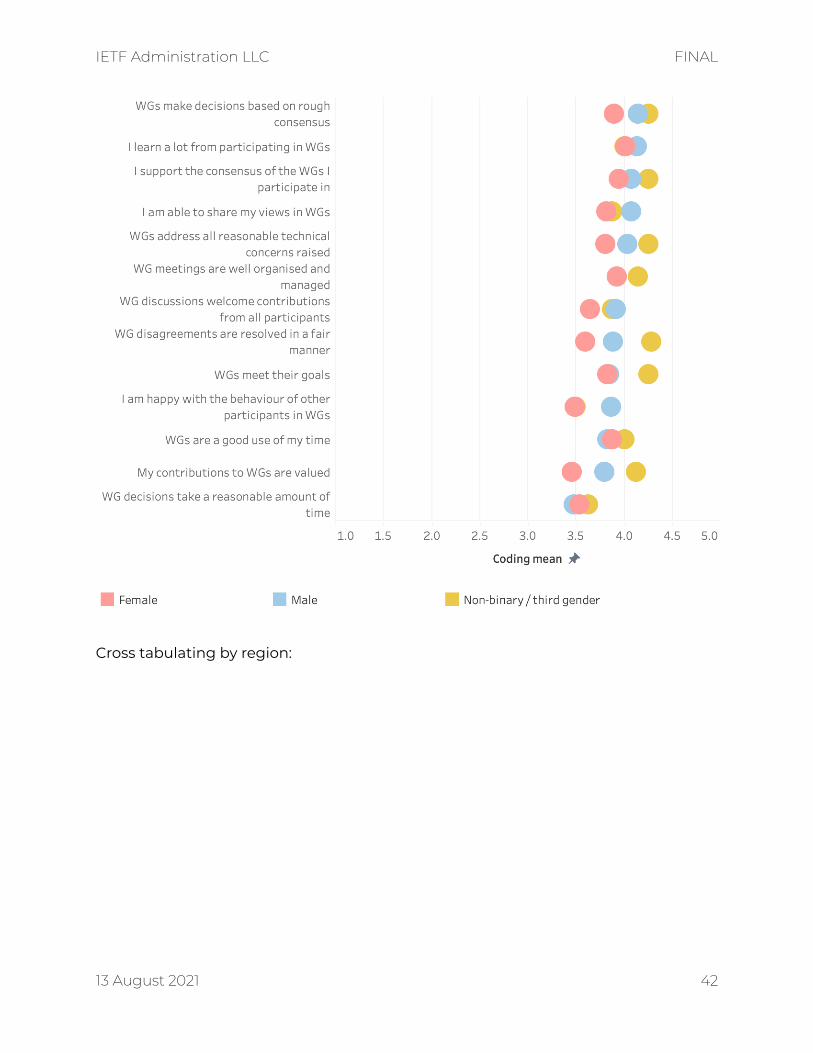
Cross tabulating with gender:
13 August 2021 41
IETF Administration LLC FINAL
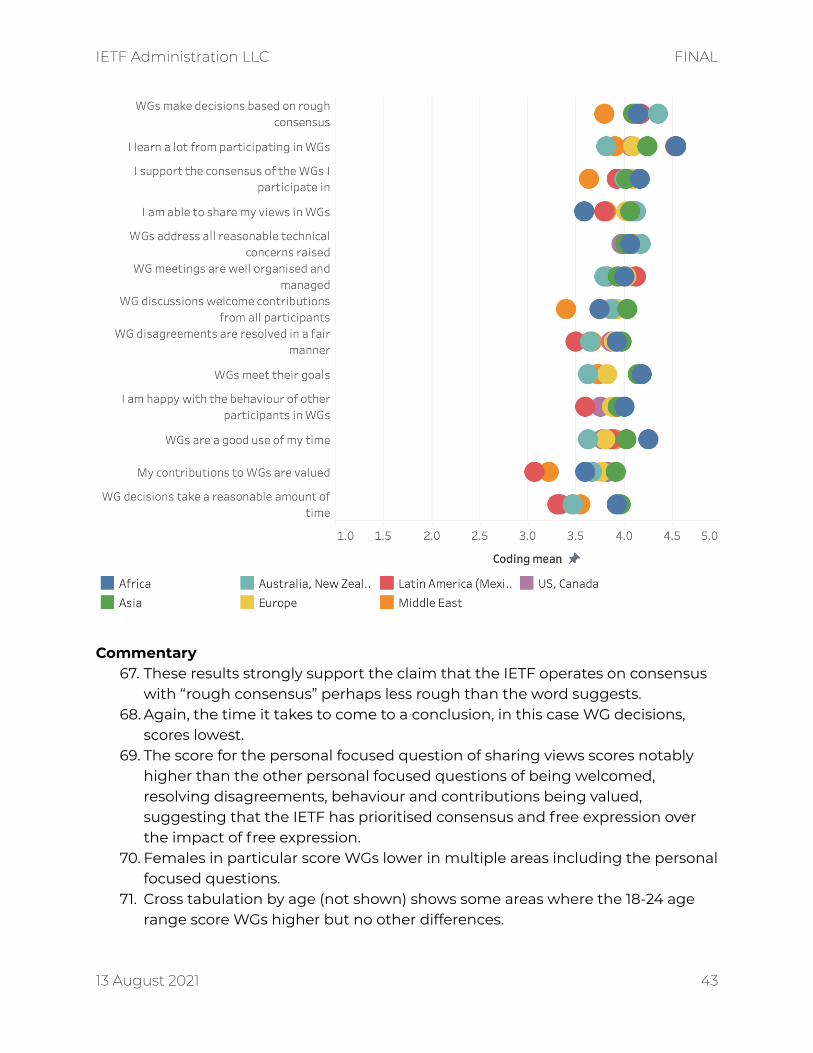
Cross tabulating by region:
13 August 2021 42
IETF Administration LLC FINAL
Commentary67. These results strongly support the claim that the IETF operates on consensus
with “rough consensus” perhaps less rough than the word suggests.68. Again, the time it takes to come to a conclusion, in this case WG decisions,
scores lowest.69. The score for the personal focused question of sharing views scores notably
higher than the other personal focused questions of being welcomed,resolving disagreements, behaviour and contributions being valued,suggesting that the IETF has prioritised consensus and free expression overthe impact of free expression.
70. Females in particular score WGs lower in multiple areas including the personalfocused questions.
71. Cross tabulation by age (not shown) shows some areas where the 18-24 agerange score WGs higher but no other differences.
13 August 2021 43
IETF Administration LLC FINAL
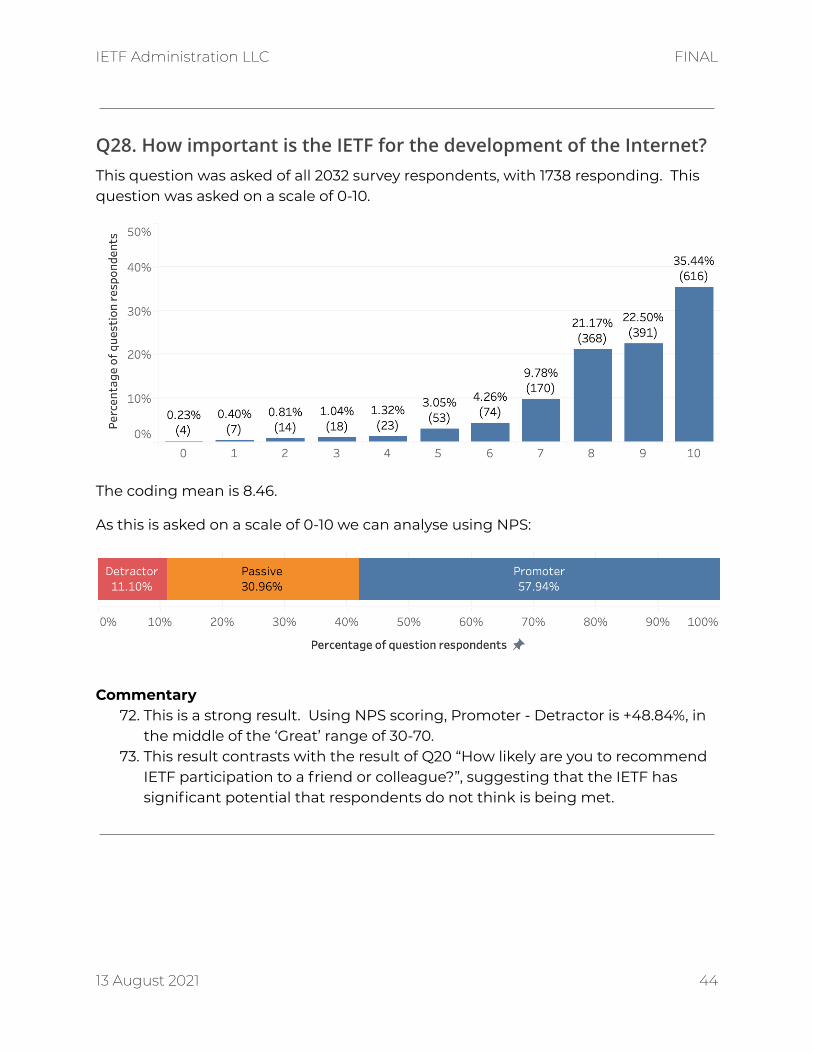
Q28. How important is the IETF for the development of the Internet?This question was asked of all 2032 survey respondents, with 1738 responding. Thisquestion was asked on a scale of 0-10.
The coding mean is 8.46.
As this is asked on a scale of 0-10 we can analyse using NPS:
Commentary72. This is a strong result. Using NPS scoring, Promoter - Detractor is +48.84%, in
the middle of the ‘Great’ range of 30-70.73. This result contrasts with the result of Q20 “How likely are you to recommend
IETF participation to a friend or colleague?”, suggesting that the IETF hassignificant potential that respondents do not think is being met.
13 August 2021 44
IETF Administration LLC FINAL
Question page: Related organisationsThis final page had a small number of questions to help understand theinterconnectedness of the IETF community, and by proxy the IETF, and how the IETFis perceived to compare to other organisations.
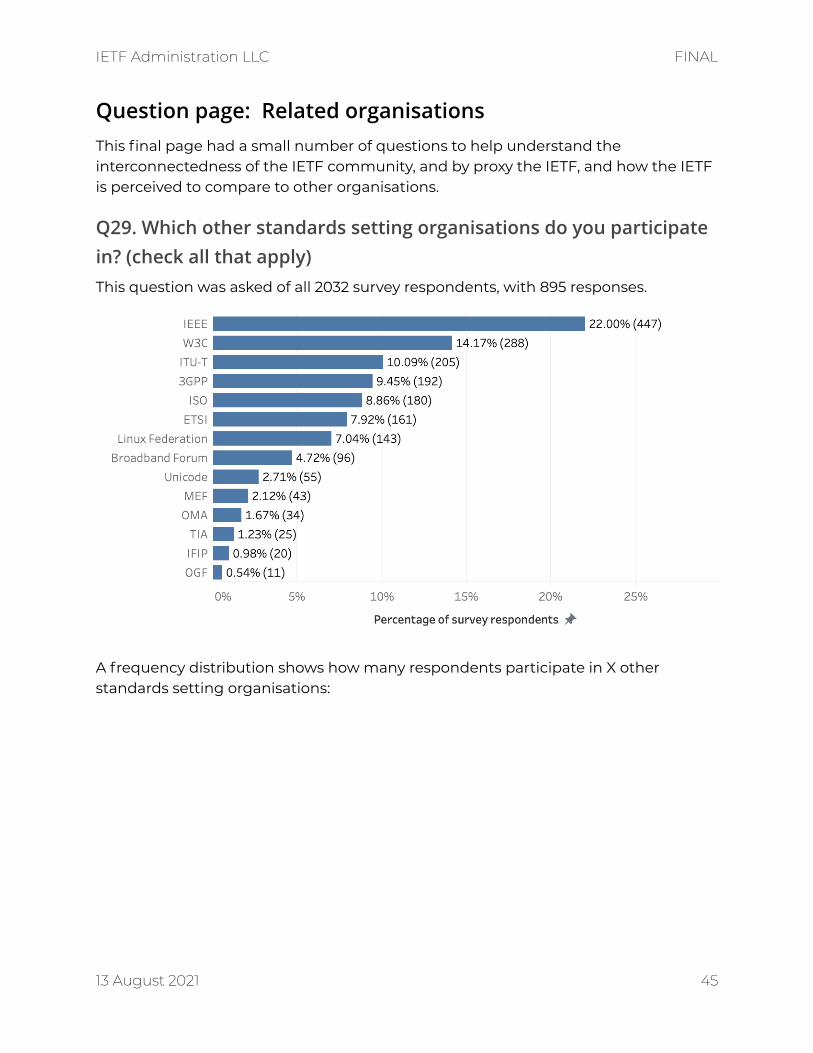
Q29. Which other standards setting organisations do you participatein? (check all that apply)This question was asked of all 2032 survey respondents, with 895 responses.
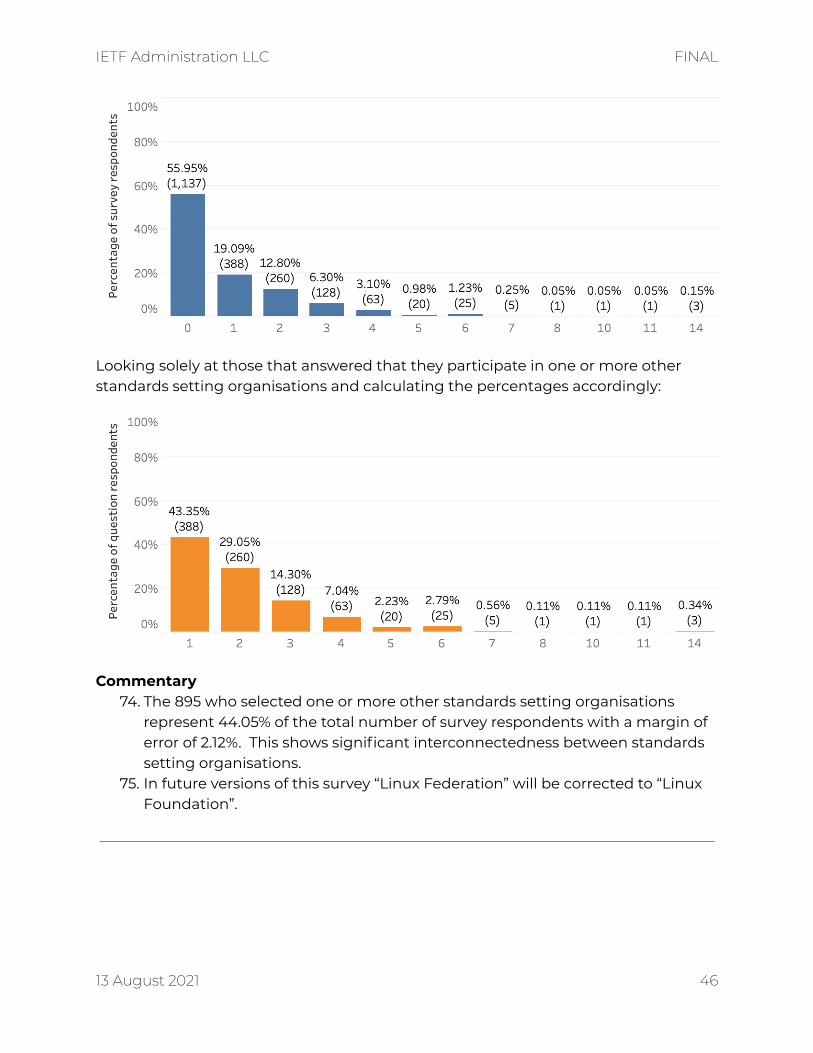
A frequency distribution shows how many respondents participate in X otherstandards setting organisations:
13 August 2021 45
IETF Administration LLC FINAL
Looking solely at those that answered that they participate in one or more otherstandards setting organisations and calculating the percentages accordingly:
Commentary74. The 895 who selected one or more other standards setting organisations
represent 44.05% of the total number of survey respondents with a margin oferror of 2.12%. This shows significant interconnectedness between standardssetting organisations.
75. In future versions of this survey “Linux Federation” will be corrected to “LinuxFoundation”.
13 August 2021 46
IETF Administration LLC FINAL
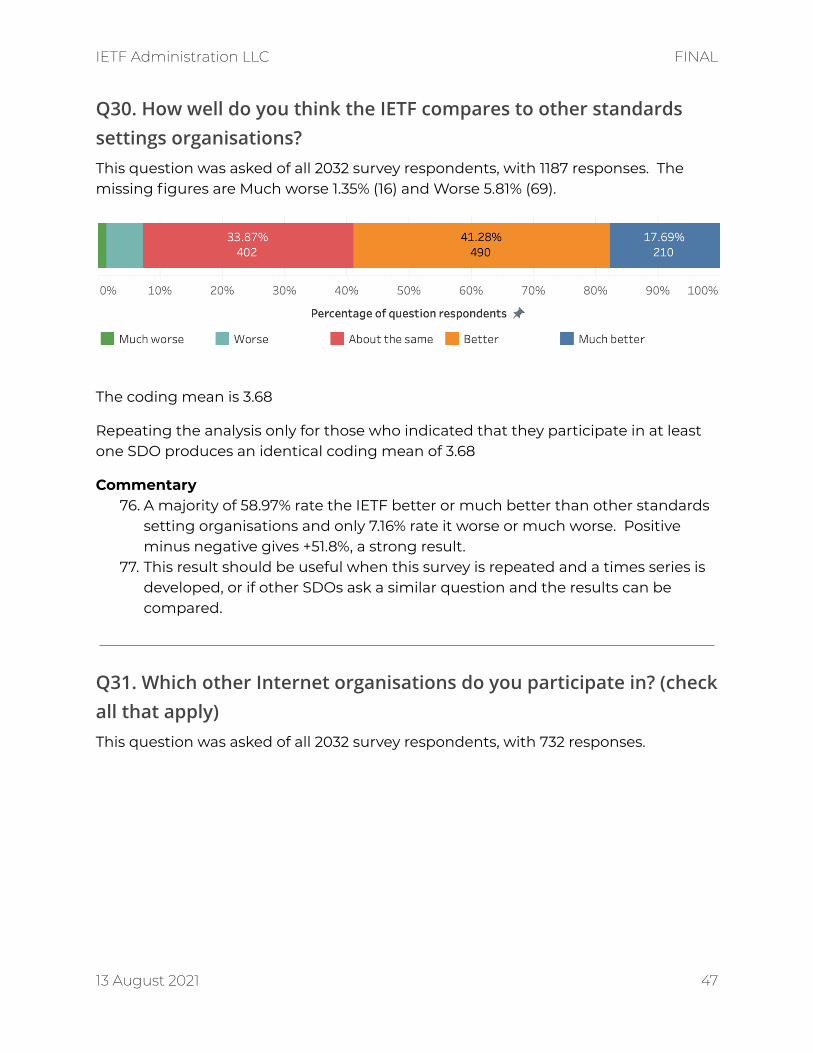
Q30. How well do you think the IETF compares to other standardssettings organisations?This question was asked of all 2032 survey respondents, with 1187 responses. Themissing figures are Much worse 1.35% (16) and Worse 5.81% (69).
The coding mean is 3.68
Repeating the analysis only for those who indicated that they participate in at leastone SDO produces an identical coding mean of 3.68
Commentary76. A majority of 58.97% rate the IETF better or much better than other standards
setting organisations and only 7.16% rate it worse or much worse. Positiveminus negative gives +51.8%, a strong result.
77. This result should be useful when this survey is repeated and a times series isdeveloped, or if other SDOs ask a similar question and the results can becompared.
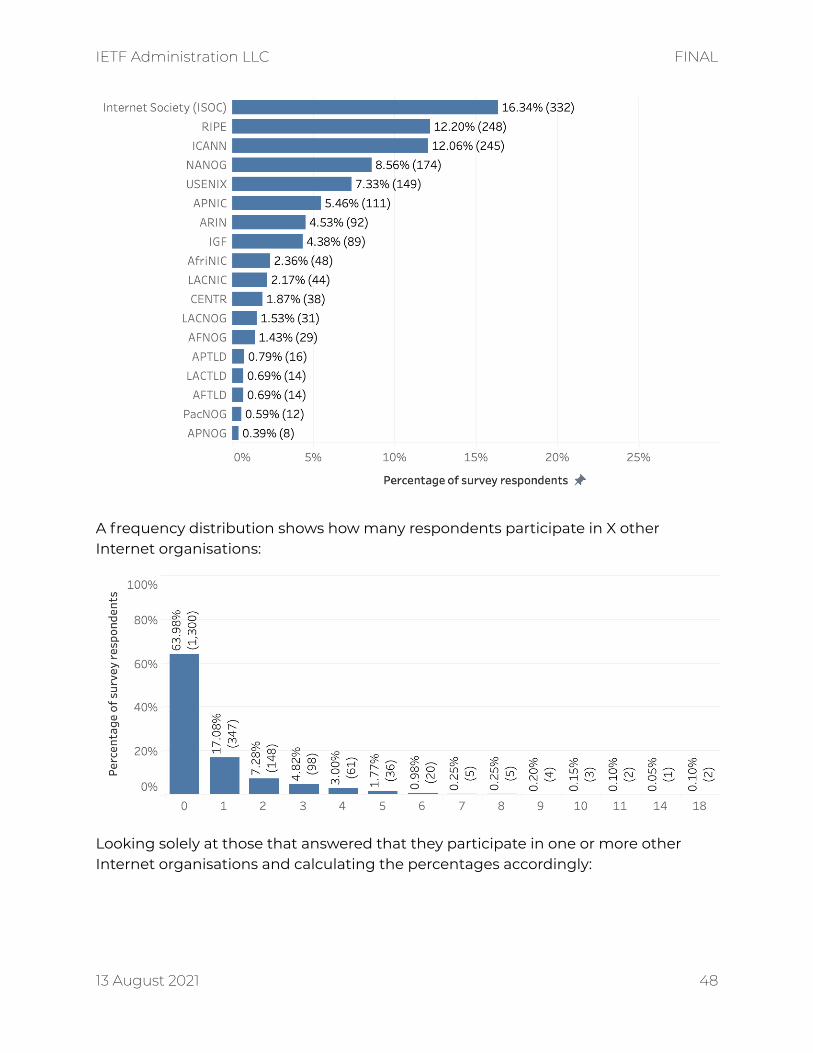
Q31. Which other Internet organisations do you participate in? (checkall that apply)This question was asked of all 2032 survey respondents, with 732 responses.
13 August 2021 47
IETF Administration LLC FINAL
A frequency distribution shows how many respondents participate in X otherInternet organisations:
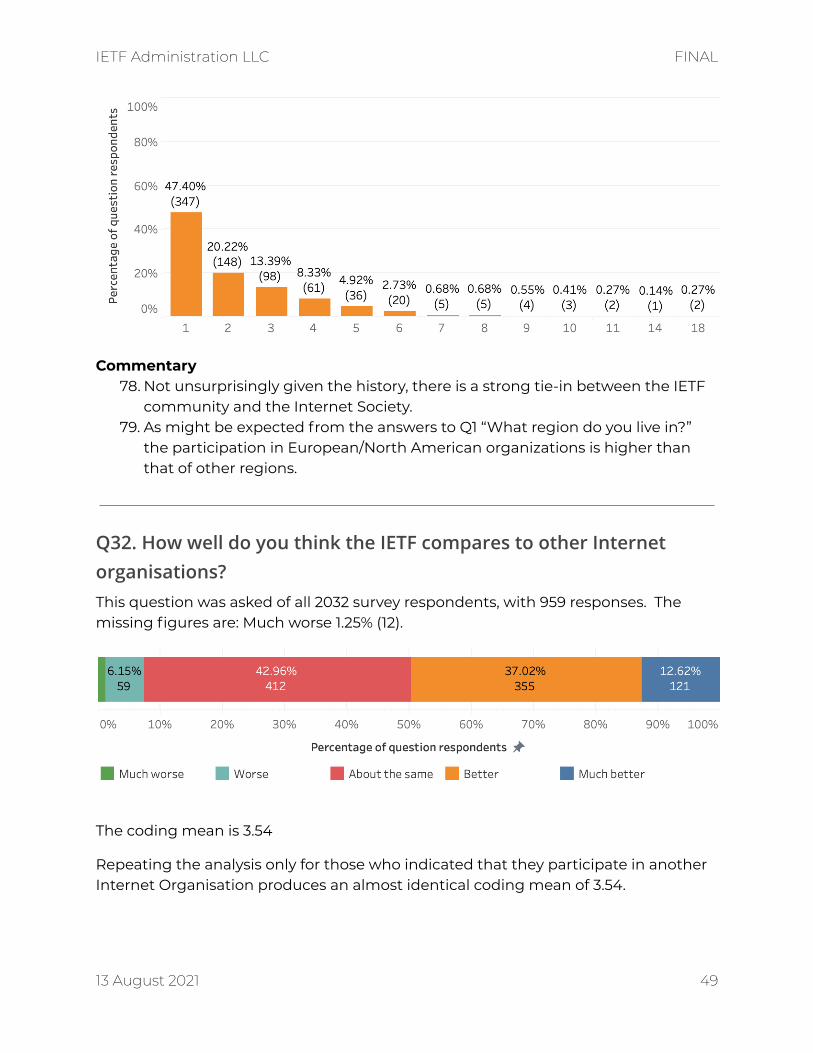
Looking solely at those that answered that they participate in one or more otherInternet organisations and calculating the percentages accordingly:
13 August 2021 48
IETF Administration LLC FINAL
Commentary78. Not unsurprisingly given the history, there is a strong tie-in between the IETF
community and the Internet Society.79. As might be expected from the answers to Q1 “What region do you live in?”
the participation in European/North American organizations is higher thanthat of other regions.
Q32. How well do you think the IETF compares to other Internetorganisations?This question was asked of all 2032 survey respondents, with 959 responses. Themissing figures are: Much worse 1.25% (12).
The coding mean is 3.54
Repeating the analysis only for those who indicated that they participate in anotherInternet Organisation produces an almost identical coding mean of 3.54.
13 August 2021 49
IETF Administration LLC FINAL
Commentary80. Slightly less than the majority of respondents, 49.64% rate the IETF better or
much better than other Internet organisations and only 7.40% rate it worse ormuch worse. Positive minus negative gives a result of +42.24, a strong result.
Next stepsThe results of this survey will be used by the IESG and IETF LLC over the next year asthey plan and carry out their work. In particular, the survey will be regularlyreferenced in decision making to ensure a data-driven approach is taken thatemphasises addressing areas that the evidence shows are high priority concernsreducing time spent on those the evidence shows are not actually concerns.
One action that has already been taken is to add a sign-up link to ietf-announce tothe mailing list welcome email.
This survey will be repeated annually, with some adjustments, in order to build up atime series of data and to see whether the high priority concerns are beingaddressed. It is likely that some cleaning up of mailing lists will be undertakenbefore then, leading to a small total population and more accurate results.
Finally, thank you to all those who took part in this survey and provided us with suchvaluable feedback. Please raise any questions or feedback on [email protected] mailing list.
Lars Eggert Jay DaleyIETF Chair IETF Executive [email protected] [email protected]
13 August 2021 50