Embed Size (px)
Citation preview
A monotonous electrovectorcardiographic pattern gives us the diagnostic clue
I do not understand
anything about
ECG/VCG....

Andrés Ricardo Pérez-Riera, M.D. Ph.D.
Laboratorio de Escrita Científica da
Faculdade de Medicina do ABC, Santo
André, São Paulo, Brazil
https://ekgvcg.wordpress.com
Raimundo Barbosa-Barros, MD
Centro Coronariano do Hospital de
Messejana Dr. Carlos Alberto
Studart Gomes, Fortaleza – CE-
Brazil
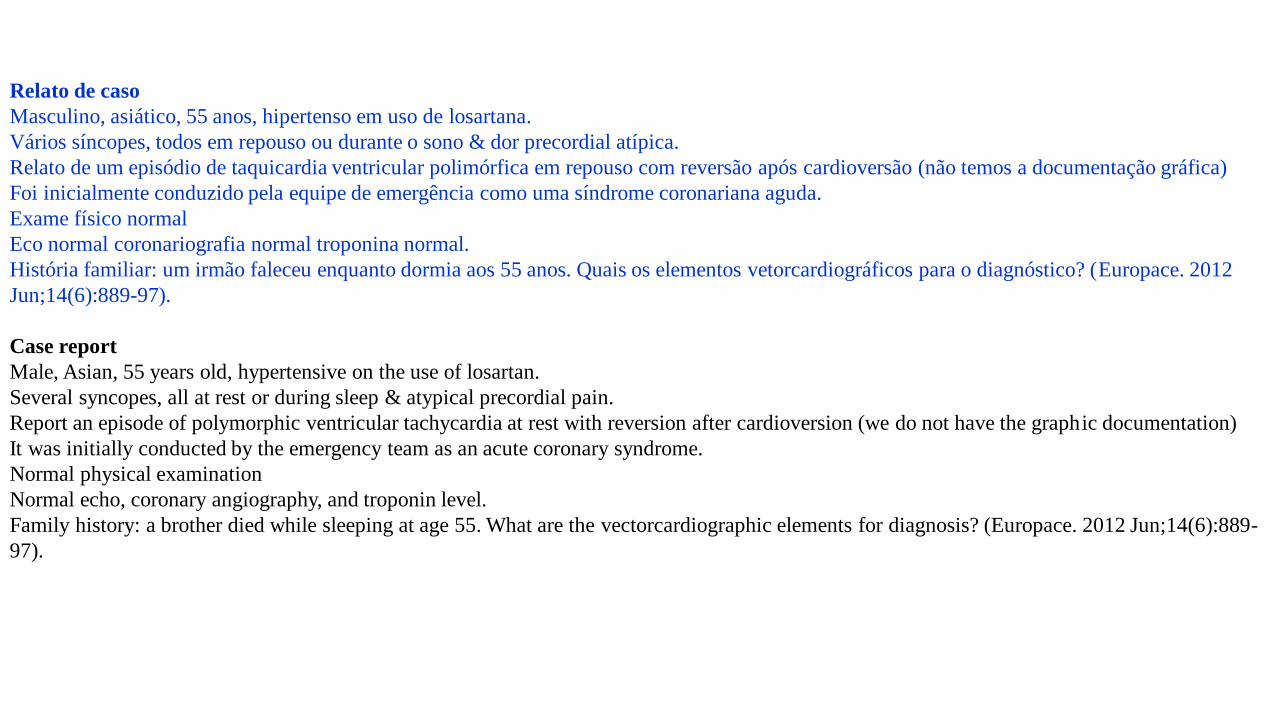
Relato de caso
Masculino, asiático, 55 anos, hipertenso em uso de losartana.
Vários síncopes, todos em repouso ou durante o sono & dor precordial atípica.
Relato de um episódio de taquicardia ventricular polimórfica em repouso com reversão após cardioversão (não temos a documentação gráfica)
Foi inicialmente conduzido pela equipe de emergência como uma síndrome coronariana aguda.
Exame físico normal
Eco normal coronariografia normal troponina normal.
História familiar: um irmão faleceu enquanto dormia aos 55 anos. Quais os elementos vetorcardiográficos para o diagnóstico? (Europace. 2012
Jun;14(6):889-97).
Case report
Male, Asian, 55 years old, hypertensive on the use of losartan.
Several syncopes, all at rest or during sleep & atypical precordial pain.
Report an episode of polymorphic ventricular tachycardia at rest with reversion after cardioversion (we do not have the graphic documentation)
It was initially conducted by the emergency team as an acute coronary syndrome.
Normal physical examination
Normal echo, coronary angiography, and troponin level.
Family history: a brother died while sleeping at age 55. What are the vectorcardiographic elements for diagnosis? (Europace. 2012 Jun;14(6):889-
97).
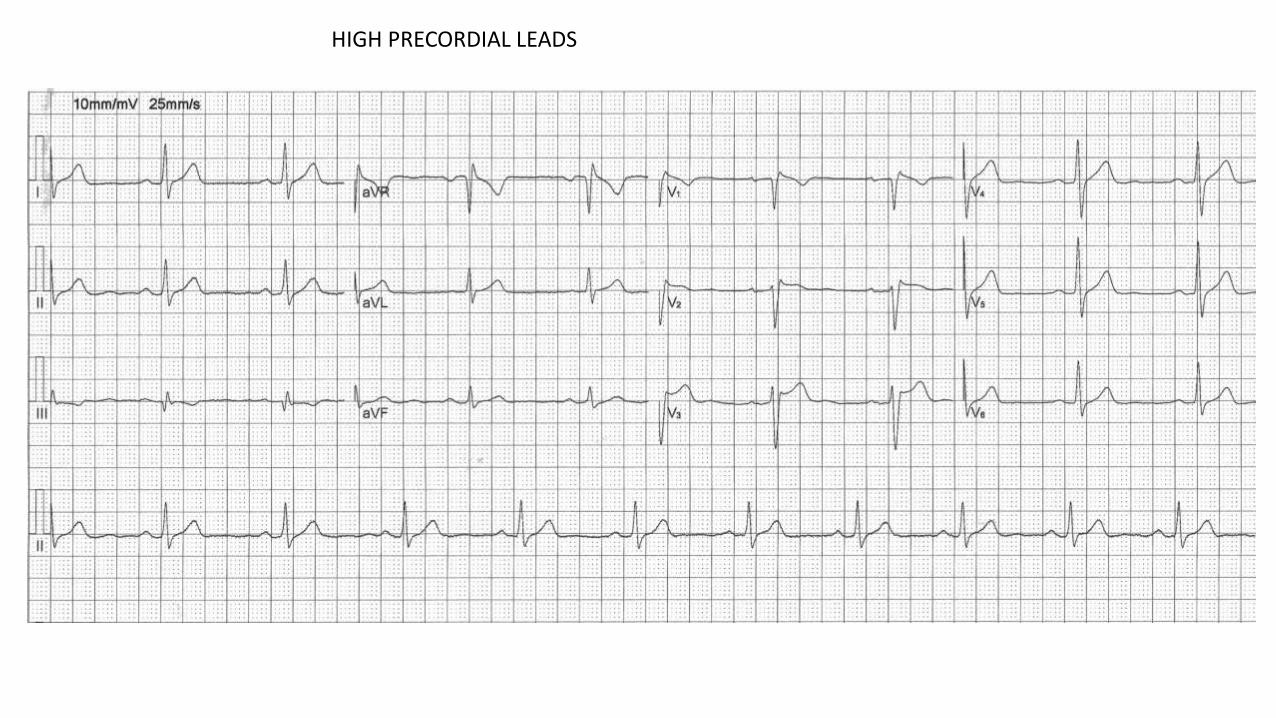
HIGH PRECORDIAL LEADS
V1
V2
V3
V2

Colleagues opinions
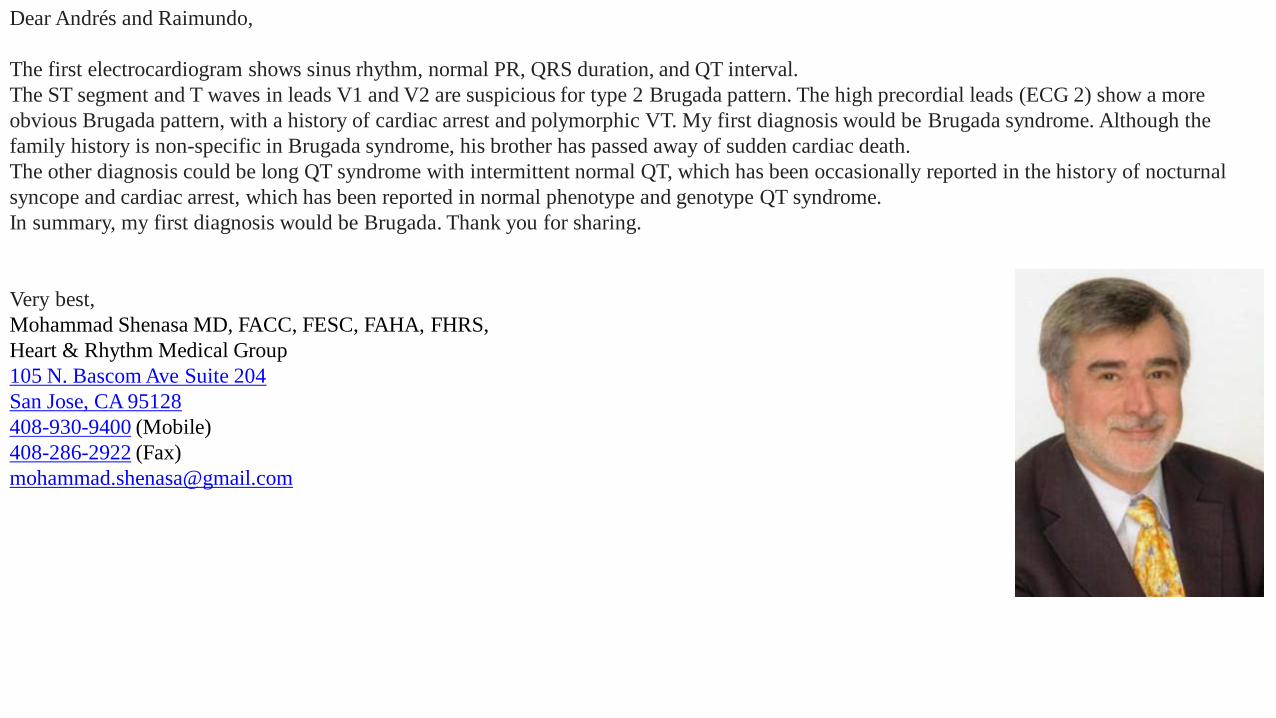
Dear Andrés and Raimundo,
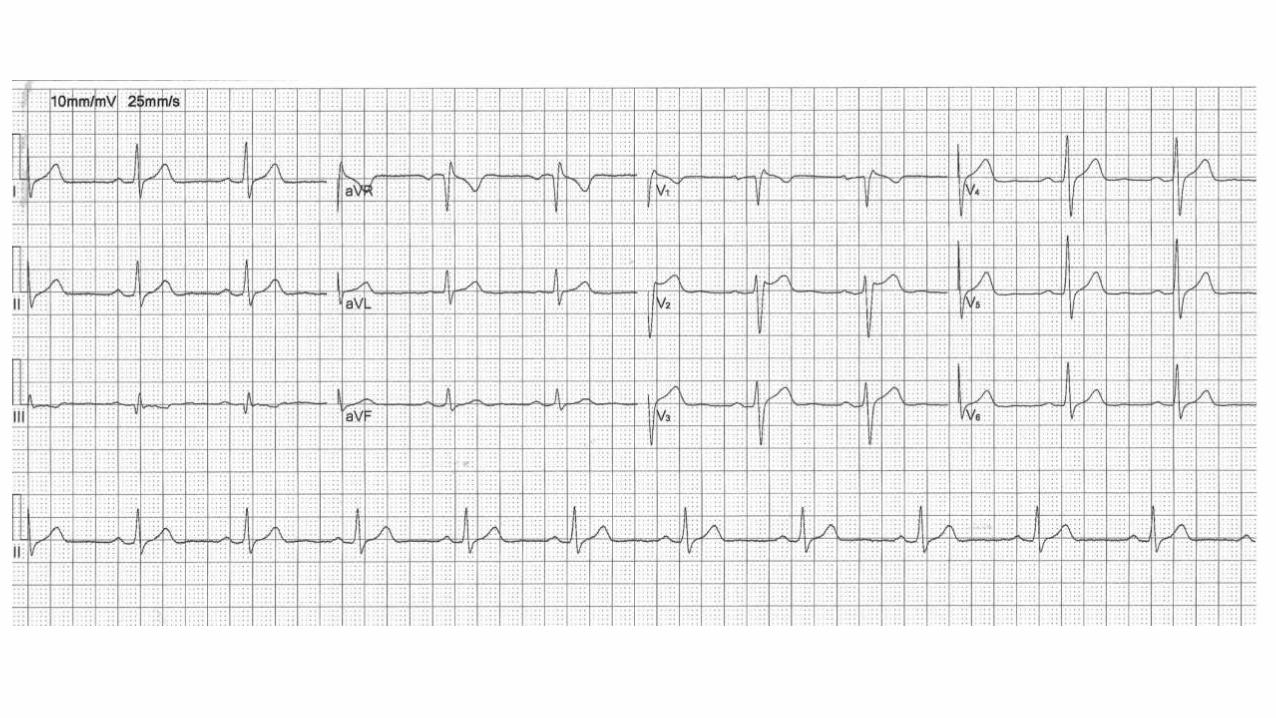
The first electrocardiogram shows sinus rhythm, normal PR, QRS duration, and QT interval.
The ST segment and T waves in leads V1 and V2 are suspicious for type 2 Brugada pattern. The high precordial leads (ECG 2) show a more
obvious Brugada pattern, with a history of cardiac arrest and polymorphic VT. My first diagnosis would be Brugada syndrome. Although the
family history is non-specific in Brugada syndrome, his brother has passed away of sudden cardiac death.
The other diagnosis could be long QT syndrome with intermittent normal QT, which has been occasionally reported in the history of nocturnal
syncope and cardiac arrest, which has been reported in normal phenotype and genotype QT syndrome.
In summary, my first diagnosis would be Brugada. Thank you for sharing.
Very best,
Mohammad Shenasa MD, FACC, FESC, FAHA, FHRS,
Heart & Rhythm Medical Group
105 N. Bascom Ave Suite 204
San Jose, CA 95128
408-930-9400 (Mobile)
408-286-2922 (Fax)
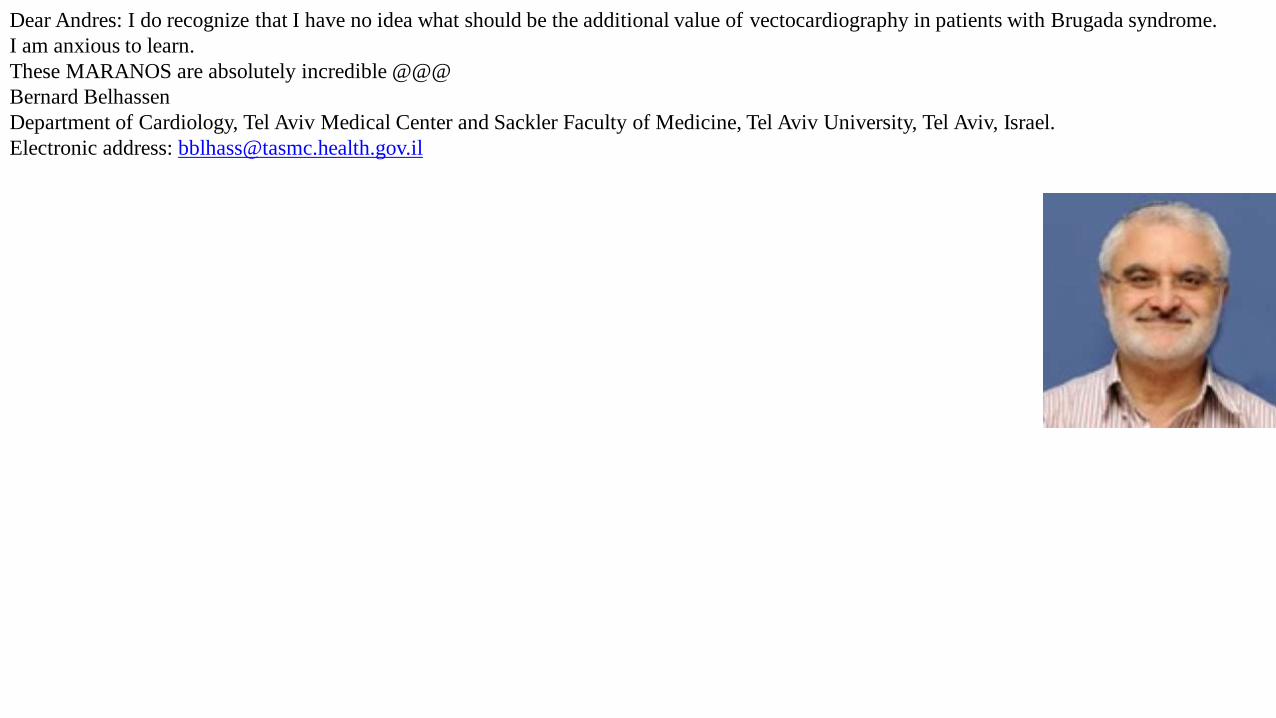
Dear Andres: I do recognize that I have no idea what should be the additional value of vectocardiography in patients with Brugada syndrome.
I am anxious to learn.
These MARANOS are absolutely incredible @@@
Bernard Belhassen
Department of Cardiology, Tel Aviv Medical Center and Sackler Faculty of Medicine, Tel Aviv University, Tel Aviv, Israel.
Electronic address: [email protected]
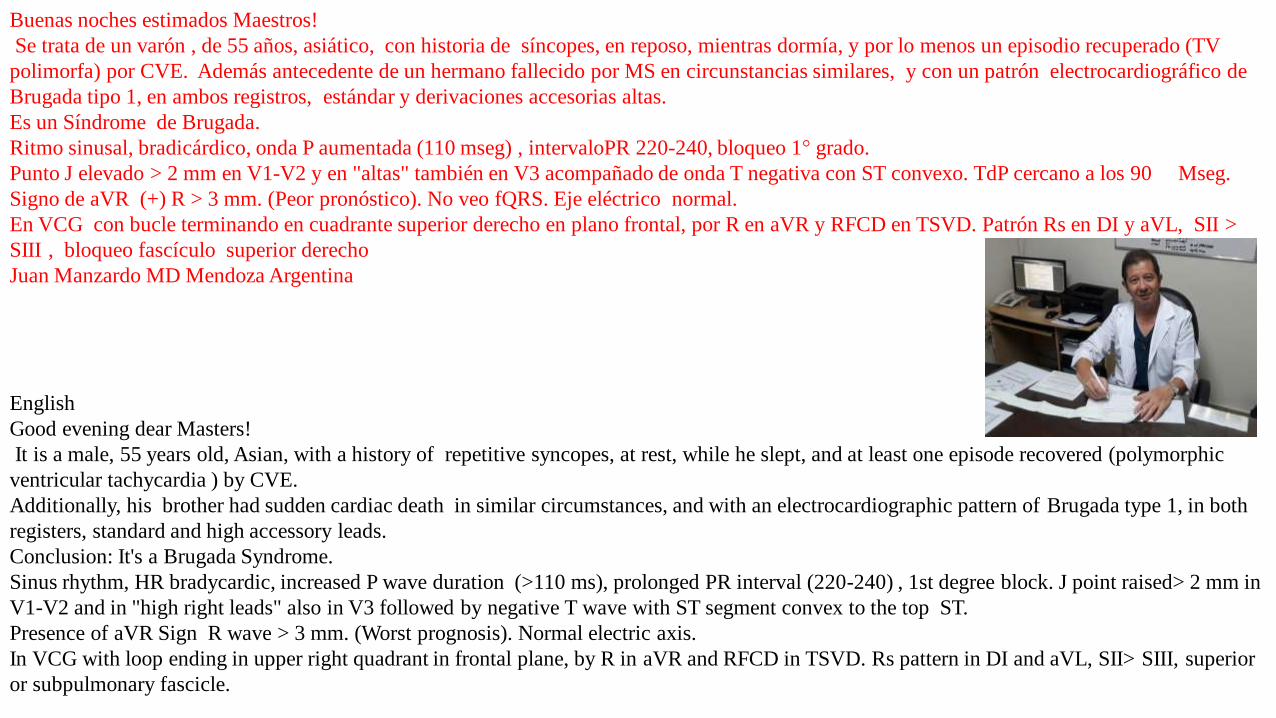
Buenas noches estimados Maestros!
Se trata de un varón , de 55 años, asiático, con historia de síncopes, en reposo, mientras dormía, y por lo menos un episodio recuperado (TV
polimorfa) por CVE. Además antecedente de un hermano fallecido por MS en circunstancias similares, y con un patrón electrocardiográfico de
Brugada tipo 1, en ambos registros, estándar y derivaciones accesorias altas.
Es un Síndrome de Brugada.
Ritmo sinusal, bradicárdico, onda P aumentada (110 mseg) , intervaloPR 220-240, bloqueo 1° grado.
Punto J elevado > 2 mm en V1-V2 y en "altas" también en V3 acompañado de onda T negativa con ST convexo. TdP cercano a los 90 Mseg.
Signo de aVR (+) R > 3 mm. (Peor pronóstico). No veo fQRS. Eje eléctrico normal.
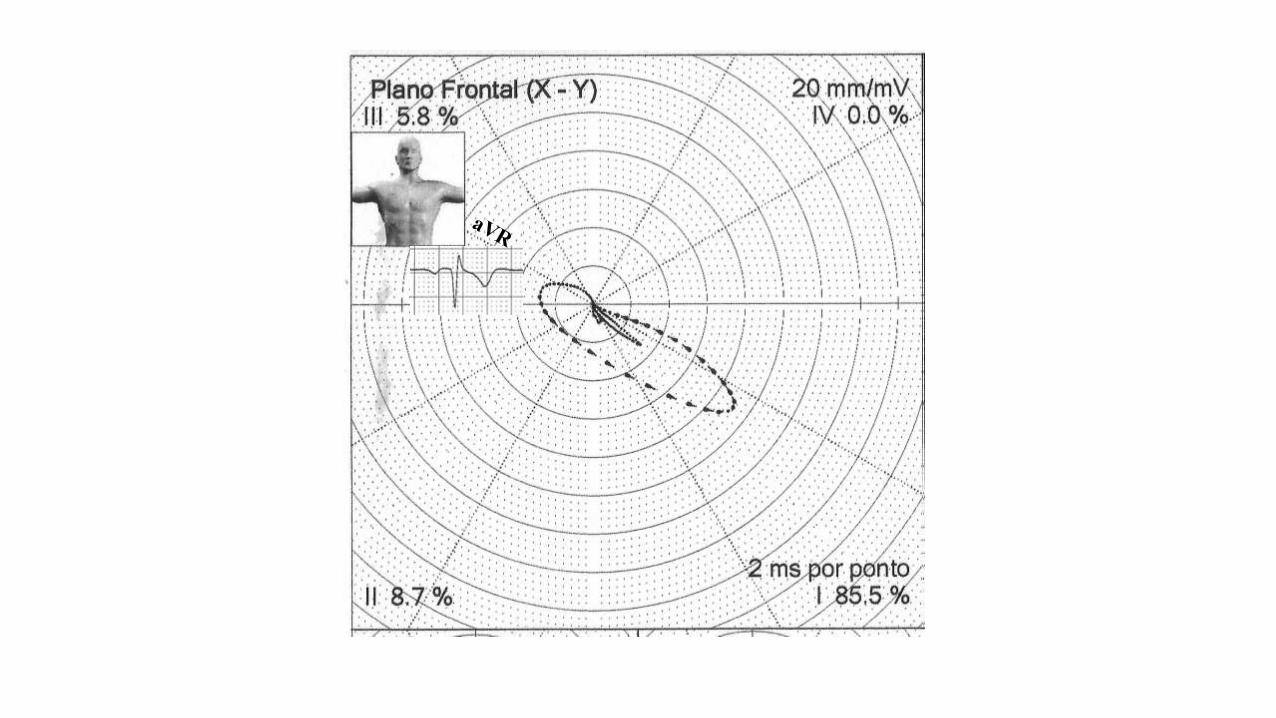
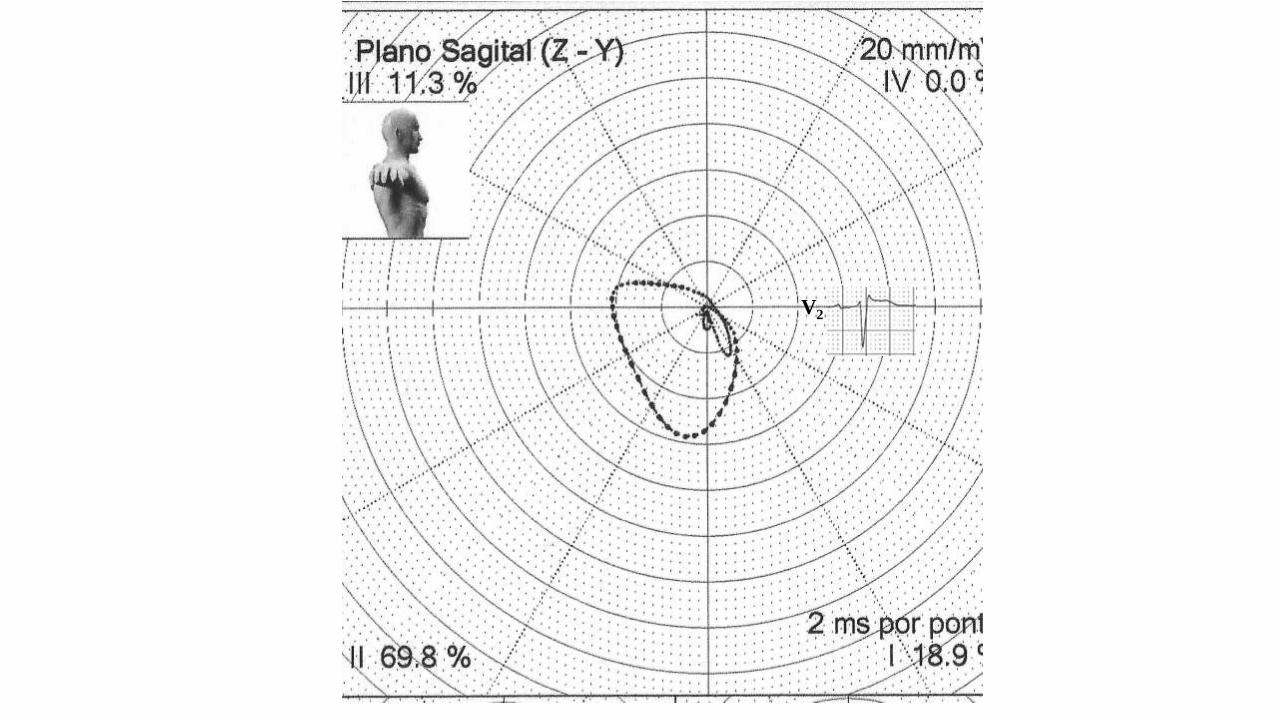
En VCG con bucle terminando en cuadrante superior derecho en plano frontal, por R en aVR y RFCD en TSVD. Patrón Rs en DI y aVL, SII >
SIII , bloqueo fascículo superior derecho
Juan Manzardo MD Mendoza Argentina
English
Good evening dear Masters!
It is a male, 55 years old, Asian, with a history of repetitive syncopes, at rest, while he slept, and at least one episode recovered (polymorphic
ventricular tachycardia ) by CVE.
Additionally, his brother had sudden cardiac death in similar circumstances, and with an electrocardiographic pattern of Brugada type 1, in both
registers, standard and high accessory leads.
Conclusion: It's a Brugada Syndrome.
Sinus rhythm, HR bradycardic, increased P wave duration (>110 ms), prolonged PR interval (220-240) , 1st degree block. J point raised> 2 mm in
V1-V2 and in "high right leads" also in V3 followed by negative T wave with ST segment convex to the top ST.
Presence of aVR Sign R wave > 3 mm. (Worst prognosis). Normal electric axis.
In VCG with loop ending in upper right quadrant in frontal plane, by R in aVR and RFCD in TSVD. Rs pattern in DI and aVL, SII> SIII, superior
or subpulmonary fascicle.
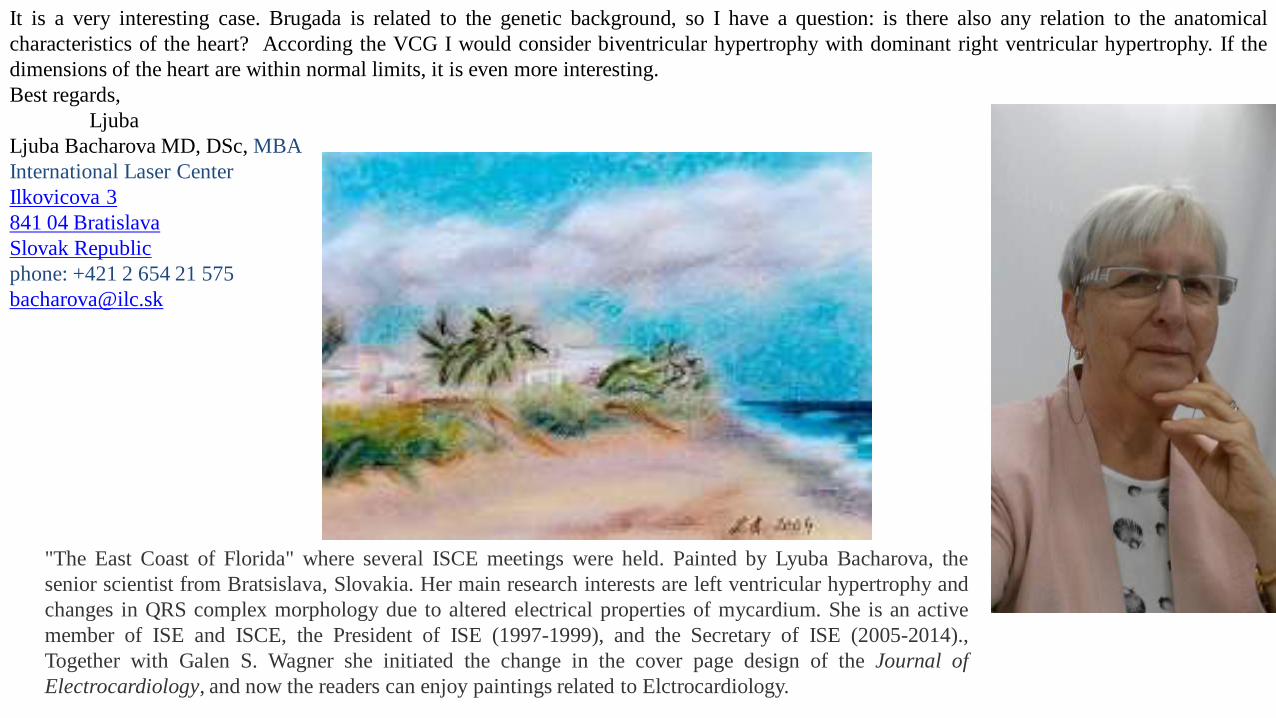
It is a very interesting case. Brugada is related to the genetic background, so I have a question: is there also any relation to the anatomical
characteristics of the heart? According the VCG I would consider biventricular hypertrophy with dominant right ventricular hypertrophy. If the
dimensions of the heart are within normal limits, it is even more interesting.
Best regards,
Ljuba
Ljuba Bacharova MD, DSc, MBA
International Laser Center
Ilkovicova 3
841 04 Bratislava
Slovak Republic
phone: +421 2 654 21 575
"The East Coast of Florida" where several ISCE meetings were held. Painted by Lyuba Bacharova, the
senior scientist from Bratsislava, Slovakia. Her main research interests are left ventricular hypertrophy and
changes in QRS complex morphology due to altered electrical properties of mycardium. She is an active
member of ISE and ISCE, the President of ISE (1997-1999), and the Secretary of ISE (2005-2014).,
Together with Galen S. Wagner she initiated the change in the cover page design of the Journal of
Electrocardiology, and now the readers can enjoy paintings related to Elctrocardiology.
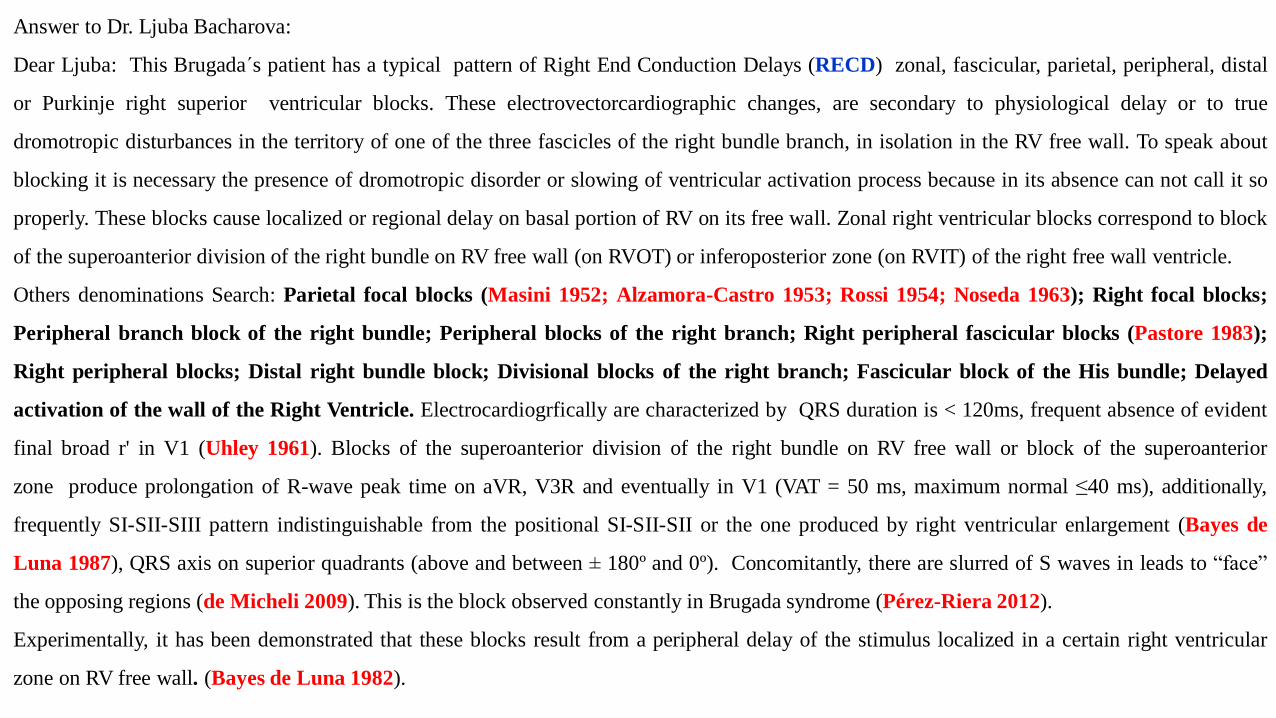
Answer to Dr. Ljuba Bacharova:
Dear Ljuba: This Brugada´s patient has a typical pattern of Right End Conduction Delays (RECD) zonal, fascicular, parietal, peripheral, distal
or Purkinje right superior ventricular blocks. These electrovectorcardiographic changes, are secondary to physiological delay or to true
dromotropic disturbances in the territory of one of the three fascicles of the right bundle branch, in isolation in the RV free wall. To speak about
blocking it is necessary the presence of dromotropic disorder or slowing of ventricular activation process because in its absence can not call it so
properly. These blocks cause localized or regional delay on basal portion of RV on its free wall. Zonal right ventricular blocks correspond to block
of the superoanterior division of the right bundle on RV free wall (on RVOT) or inferoposterior zone (on RVIT) of the right free wall ventricle.
Others denominations Search: Parietal focal blocks (Masini 1952; Alzamora-Castro 1953; Rossi 1954; Noseda 1963); Right focal blocks;
Peripheral branch block of the right bundle; Peripheral blocks of the right branch; Right peripheral fascicular blocks (Pastore 1983);
Right peripheral blocks; Distal right bundle block; Divisional blocks of the right branch; Fascicular block of the His bundle; Delayed
activation of the wall of the Right Ventricle. Electrocardiogrfically are characterized by QRS duration is < 120ms, frequent absence of evident
final broad r' in V1 (Uhley 1961). Blocks of the superoanterior division of the right bundle on RV free wall or block of the superoanterior
zone produce prolongation of R-wave peak time on aVR, V3R and eventually in V1 (VAT = 50 ms, maximum normal ≤40 ms), additionally,
frequently SI-SII-SIII pattern indistinguishable from the positional SI-SII-SII or the one produced by right ventricular enlargement (Bayes de
Luna 1987), QRS axis on superior quadrants (above and between ± 180º and 0º). Concomitantly, there are slurred of S waves in leads to “face”
the opposing regions (de Micheli 2009). This is the block observed constantly in Brugada syndrome (Pérez-Riera 2012).
Experimentally, it has been demonstrated that these blocks result from a peripheral delay of the stimulus localized in a certain right ventricular
zone on RV free wall. (Bayes de Luna 1982).
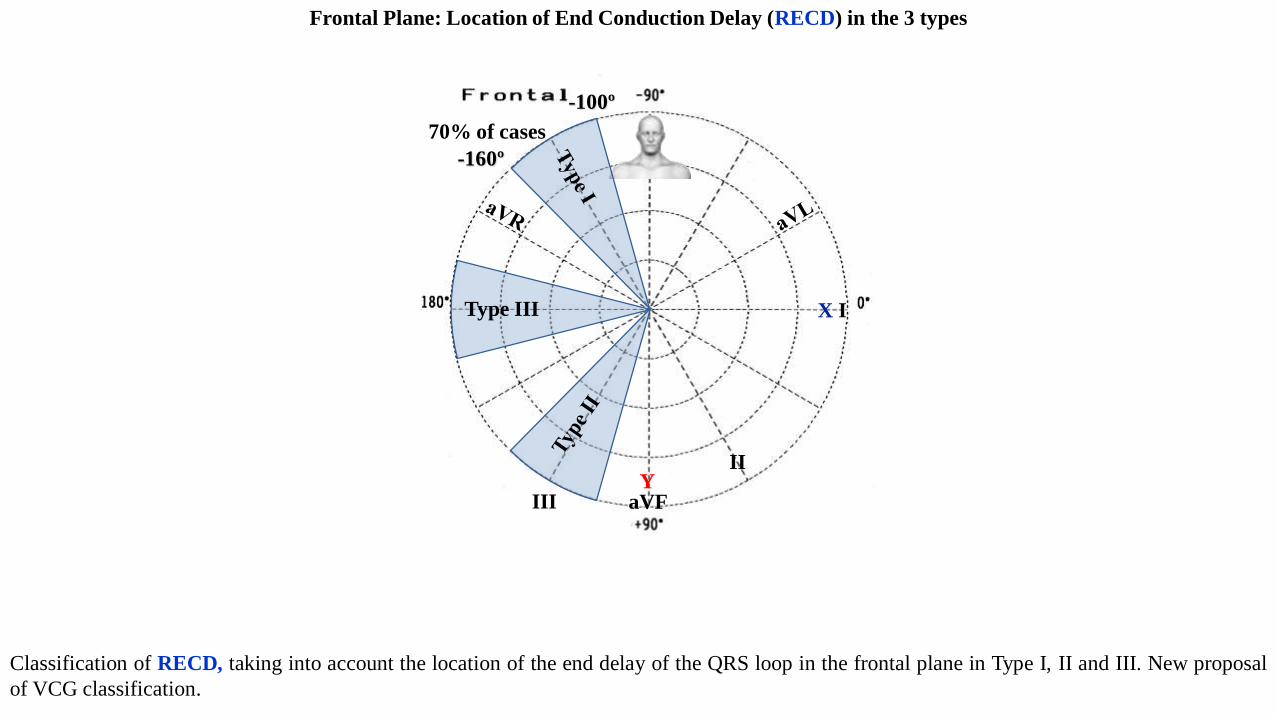
Frontal Plane: Location of End Conduction Delay (RECD) in the 3 types
Classification of RECD, taking into account the location of the end delay of the QRS loop in the frontal plane in Type I, II and III. New proposal
of VCG classification.
II
III aVF
X I
Y
Type III
70% of cases
-100º
-160º
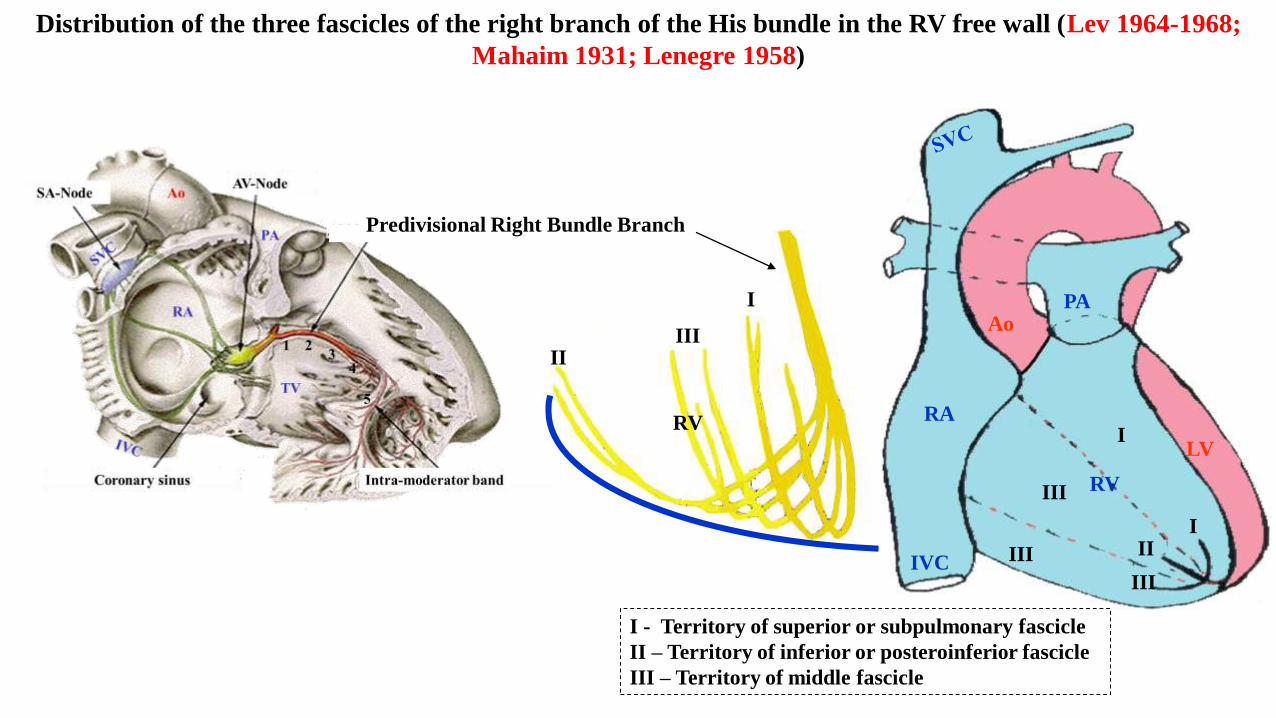
Distribution of the three fascicles of the right branch of the His bundle in the RV free wall (Lev 1964-1968;
Mahaim 1931; Lenegre 1958)
AoPA
RA
IVC
III
III
III
III
I
RV
LV
I
IIIII
RV
I - Territory of superior or subpulmonary fascicle
II – Territory of inferior or posteroinferior fascicle
III – Territory of middle fascicle
Predivisional Right Bundle Branch
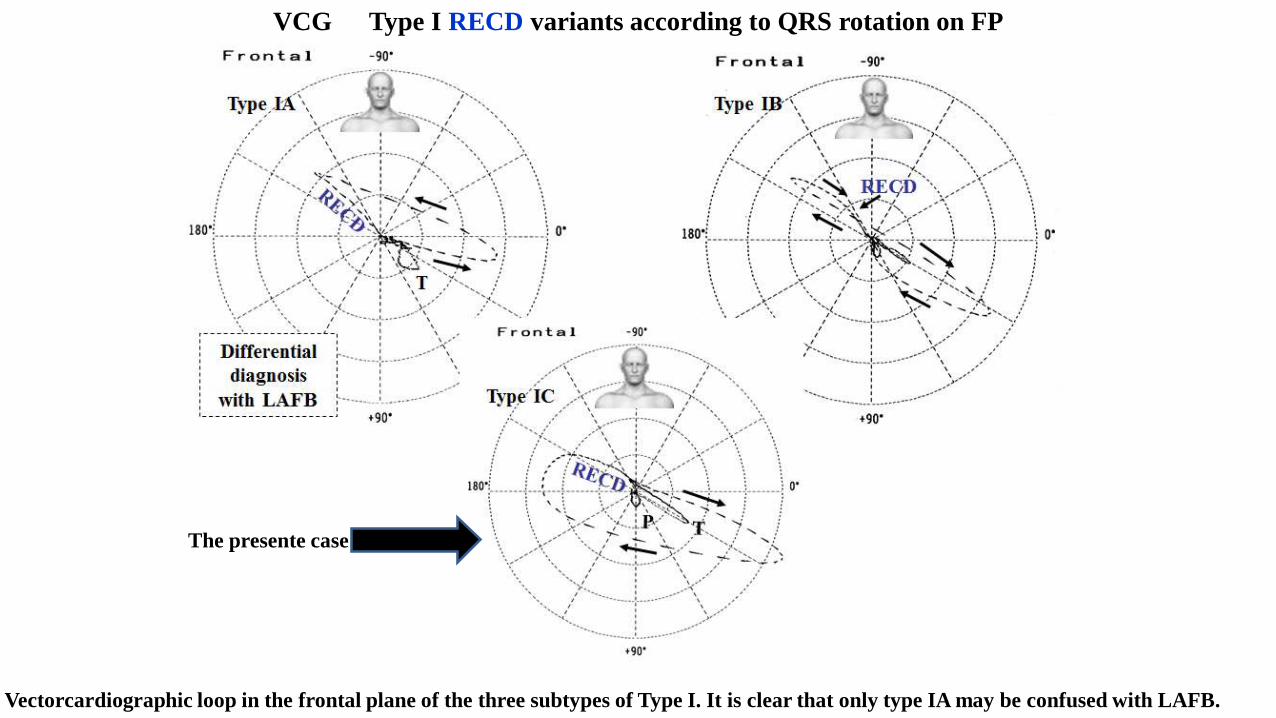
Vectorcardiographic loop in the frontal plane of the three subtypes of Type I. It is clear that only type IA may be confused with LAFB.
VCG Type I RECD variants according to QRS rotation on FP
The presente case
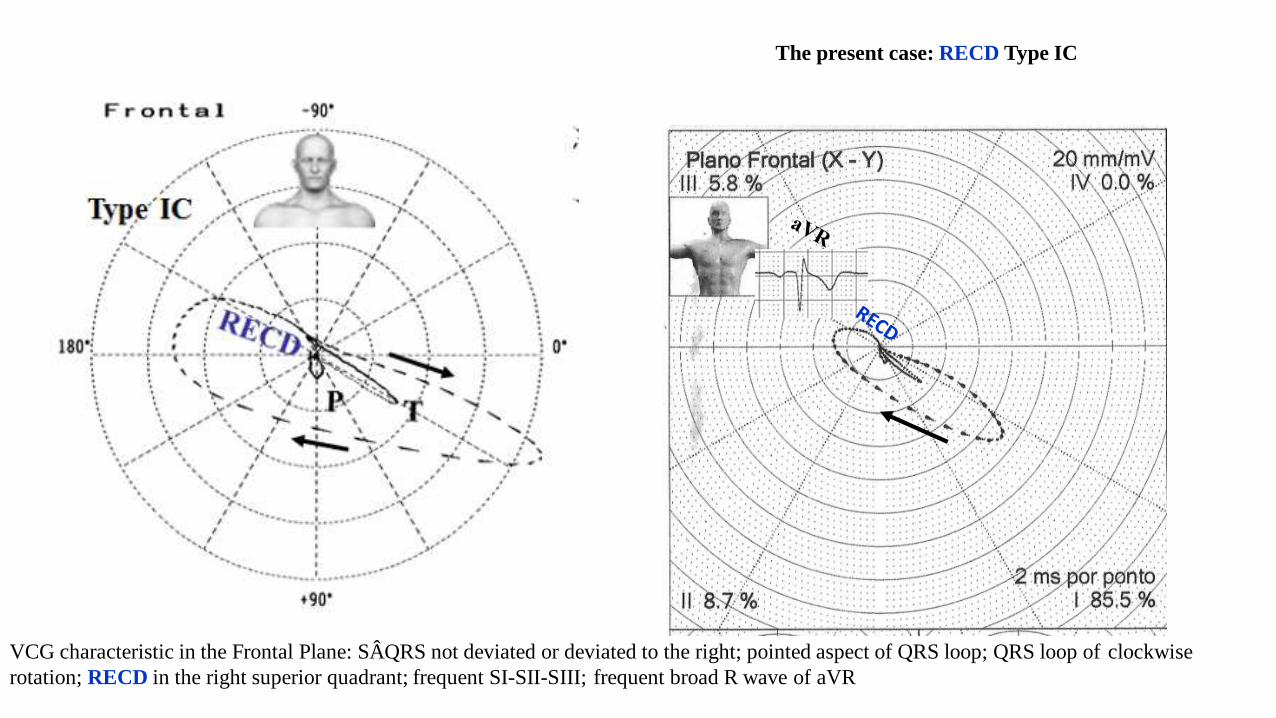
The present case: RECD Type IC
VCG characteristic in the Frontal Plane: SÂQRS not deviated or deviated to the right; pointed aspect of QRS loop; QRS loop of clockwise
rotation; RECD in the right superior quadrant; frequent SI-SII-SIII; frequent broad R wave of aVR
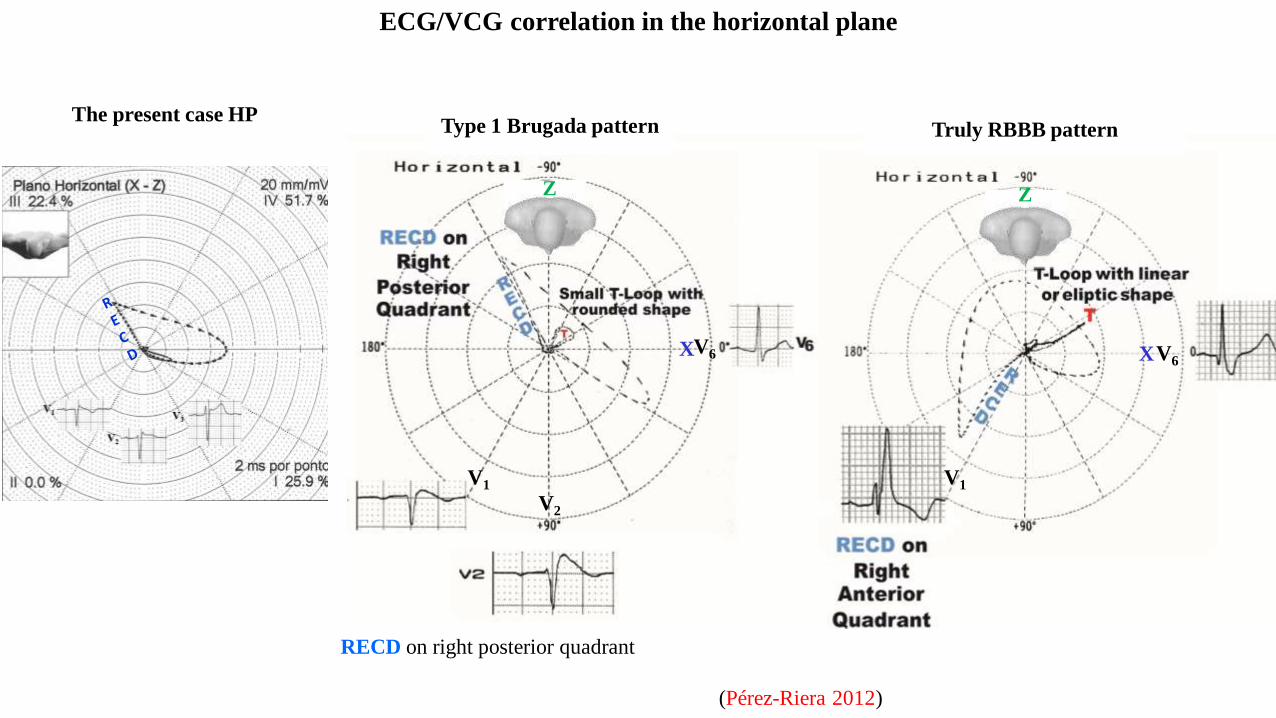
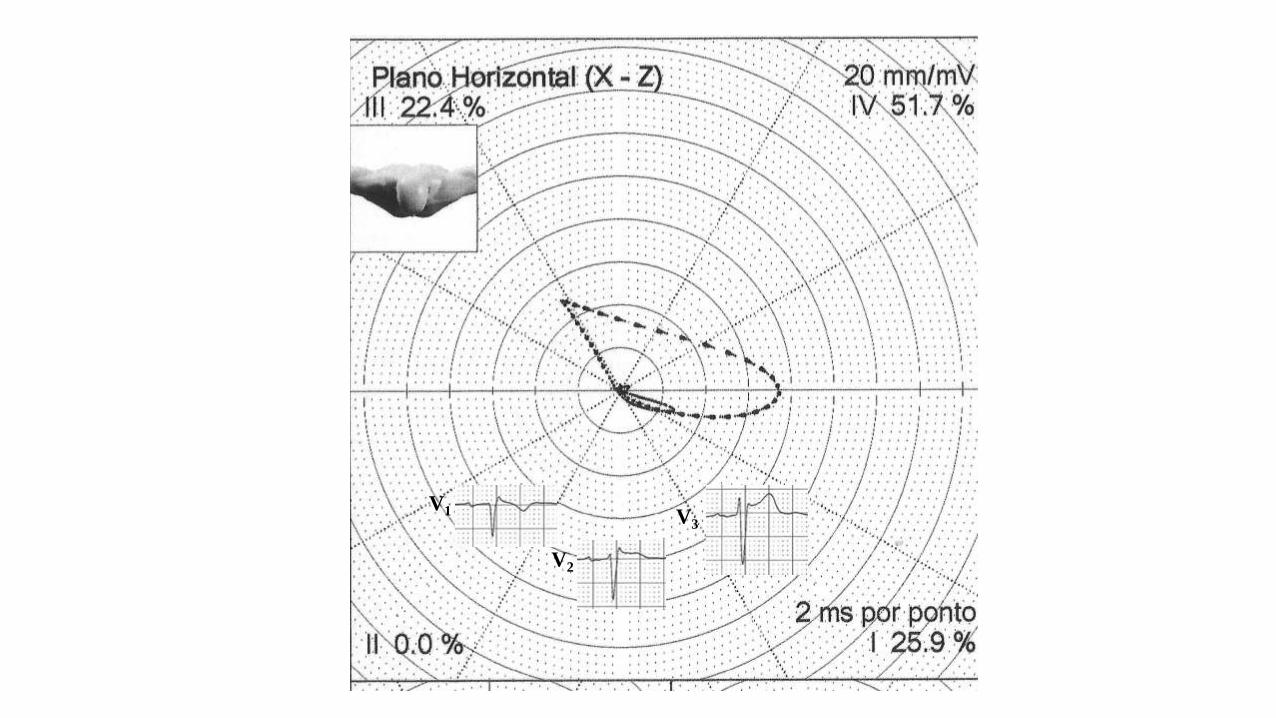
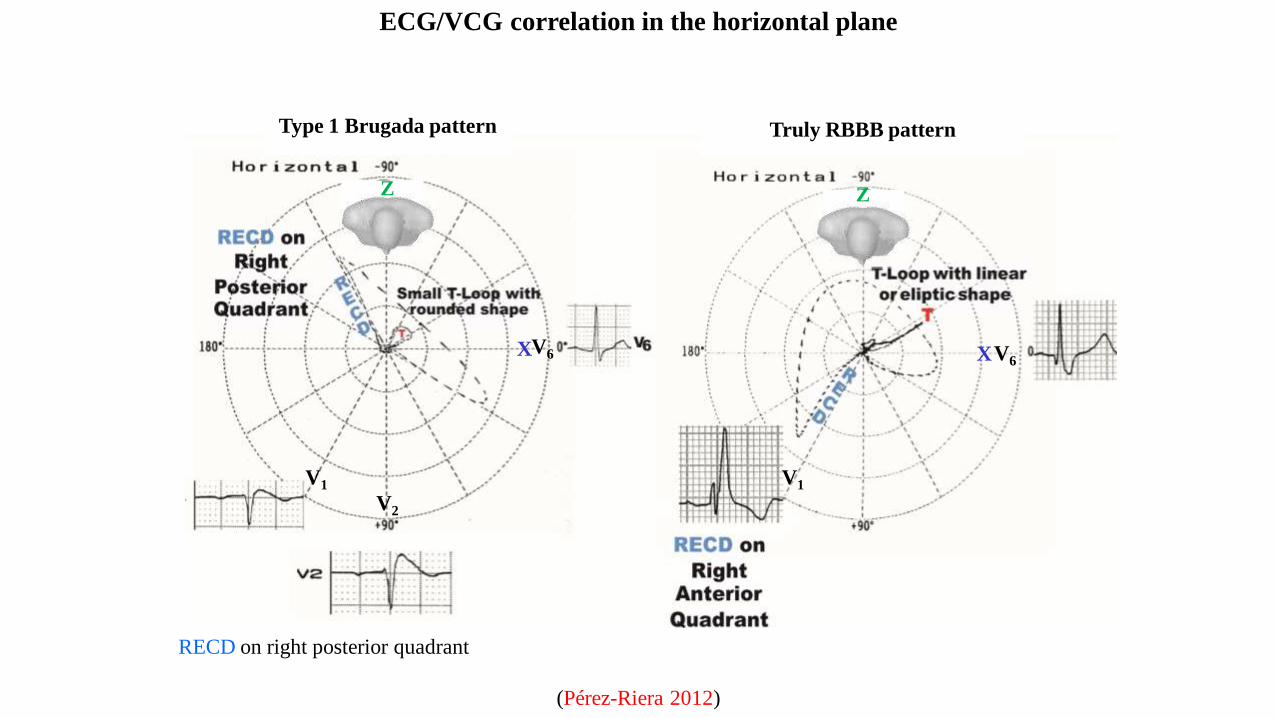
ECG/VCG correlation in the horizontal plane
Type 1 Brugada pattern Truly RBBB pattern
RECD on right posterior quadrant
V6
V1
X
Z
V6
V1
X
Z
V2
(Pérez-Riera 2012)
The present case HP
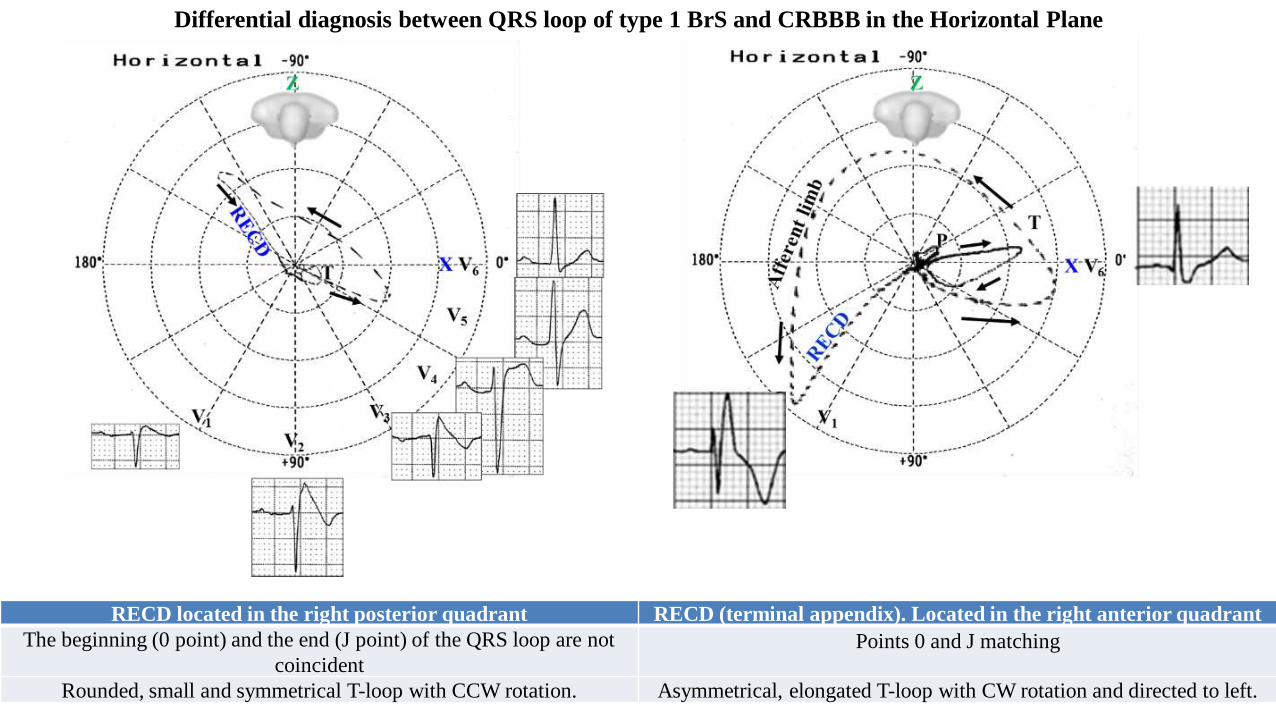
Differential diagnosis between QRS loop of type 1 BrS and CRBBB in the Horizontal Plane
RECD located in the right posterior quadrant RECD (terminal appendix). Located in the right anterior quadrant
The beginning (0 point) and the end (J point) of the QRS loop are not
coincident Points 0 and J matching
Rounded, small and symmetrical T-loop with CCW rotation. Asymmetrical, elongated T-loop with CW rotation and directed to left.
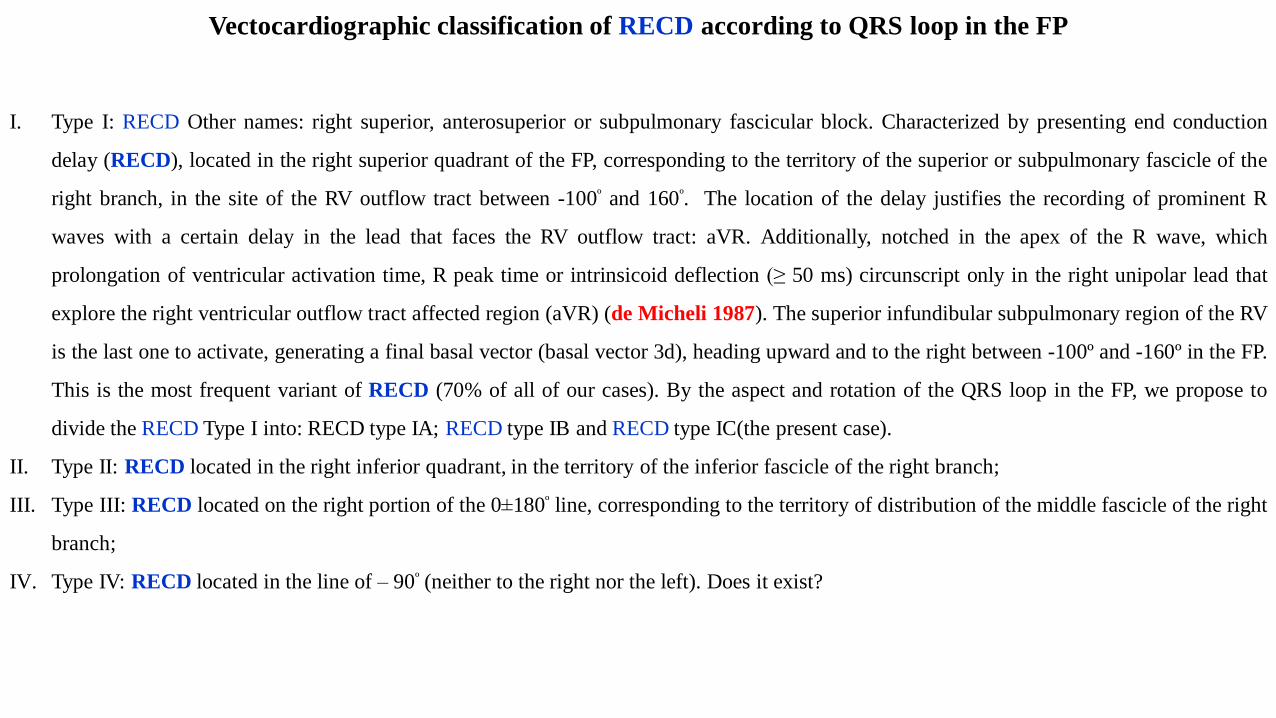
Vectocardiographic classification of RECD according to QRS loop in the FP
I. Type I: RECD Other names: right superior, anterosuperior or subpulmonary fascicular block. Characterized by presenting end conduction
delay (RECD), located in the right superior quadrant of the FP, corresponding to the territory of the superior or subpulmonary fascicle of the
right branch, in the site of the RV outflow tract between -100º and 160º. The location of the delay justifies the recording of prominent R
waves with a certain delay in the lead that faces the RV outflow tract: aVR. Additionally, notched in the apex of the R wave, which
prolongation of ventricular activation time, R peak time or intrinsicoid deflection (≥ 50 ms) circunscript only in the right unipolar lead that
explore the right ventricular outflow tract affected region (aVR) (de Micheli 1987). The superior infundibular subpulmonary region of the RV
is the last one to activate, generating a final basal vector (basal vector 3d), heading upward and to the right between -100º and -160º in the FP.
This is the most frequent variant of RECD (70% of all of our cases). By the aspect and rotation of the QRS loop in the FP, we propose to
divide the RECD Type I into: RECD type IA; RECD type IB and RECD type IC(the present case).
II. Type II: RECD located in the right inferior quadrant, in the territory of the inferior fascicle of the right branch;
III. Type III: RECD located on the right portion of the 0±180º line, corresponding to the territory of distribution of the middle fascicle of the right
branch;
IV. Type IV: RECD located in the line of – 90º (neither to the right nor the left). Does it exist?
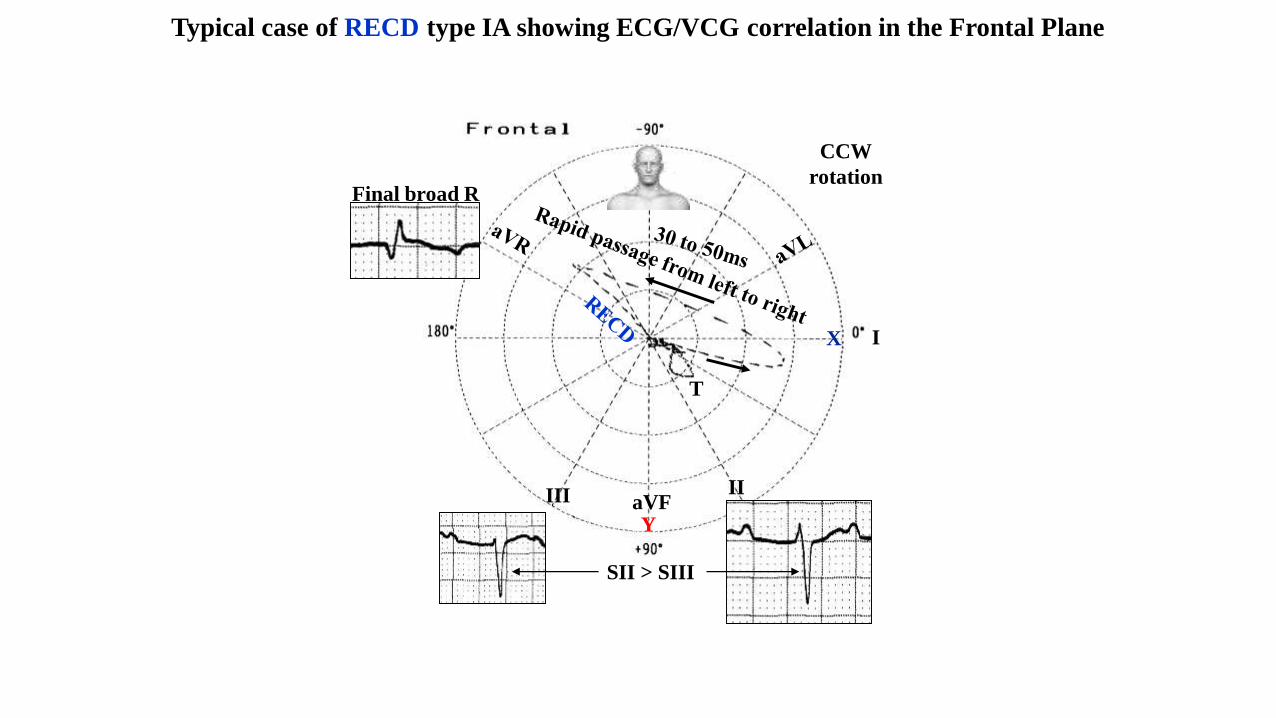
T
IIIII
CCW
rotation
SII > SIII
Final broad R
Typical case of RECD type IA showing ECG/VCG correlation in the Frontal Plane
aVF
X
Y
I
T
IIIII
CCW
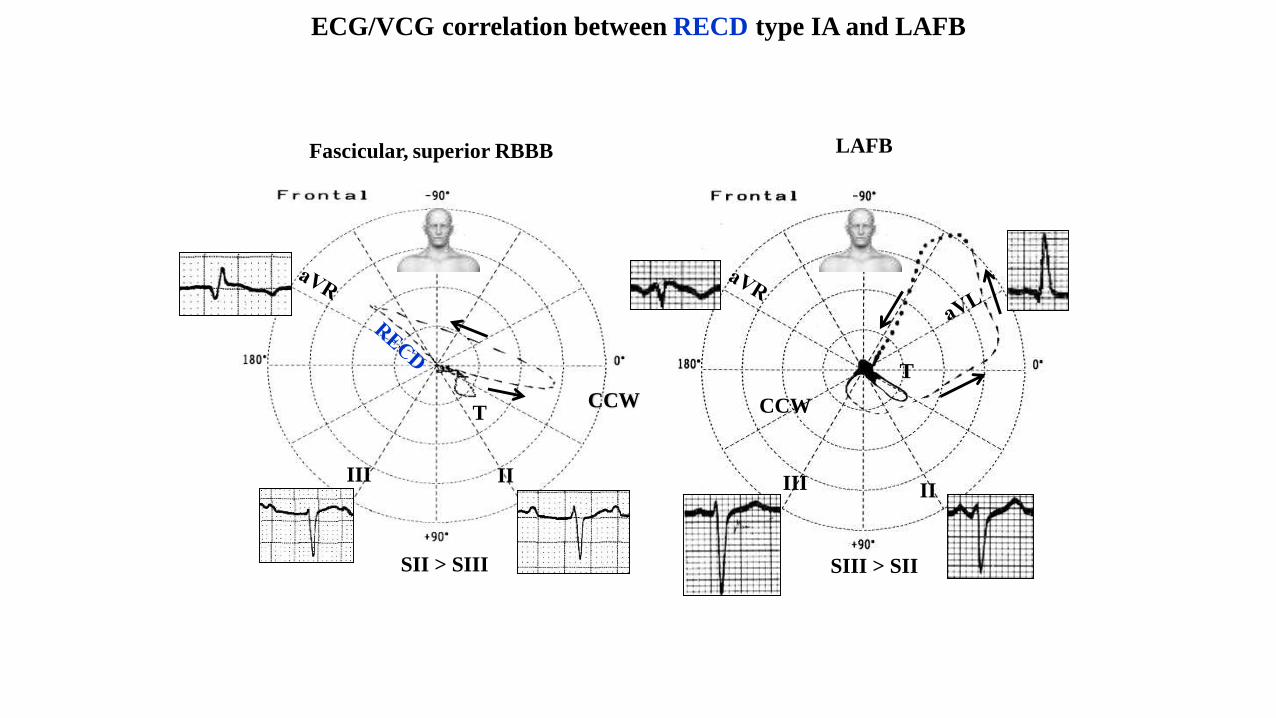
Fascicular, superior RBBB LAFB
T
II
SIII > SII SII > SIII
CCW
ECG/VCG correlation between RECD type IA and LAFB
III
V1
T
T
T
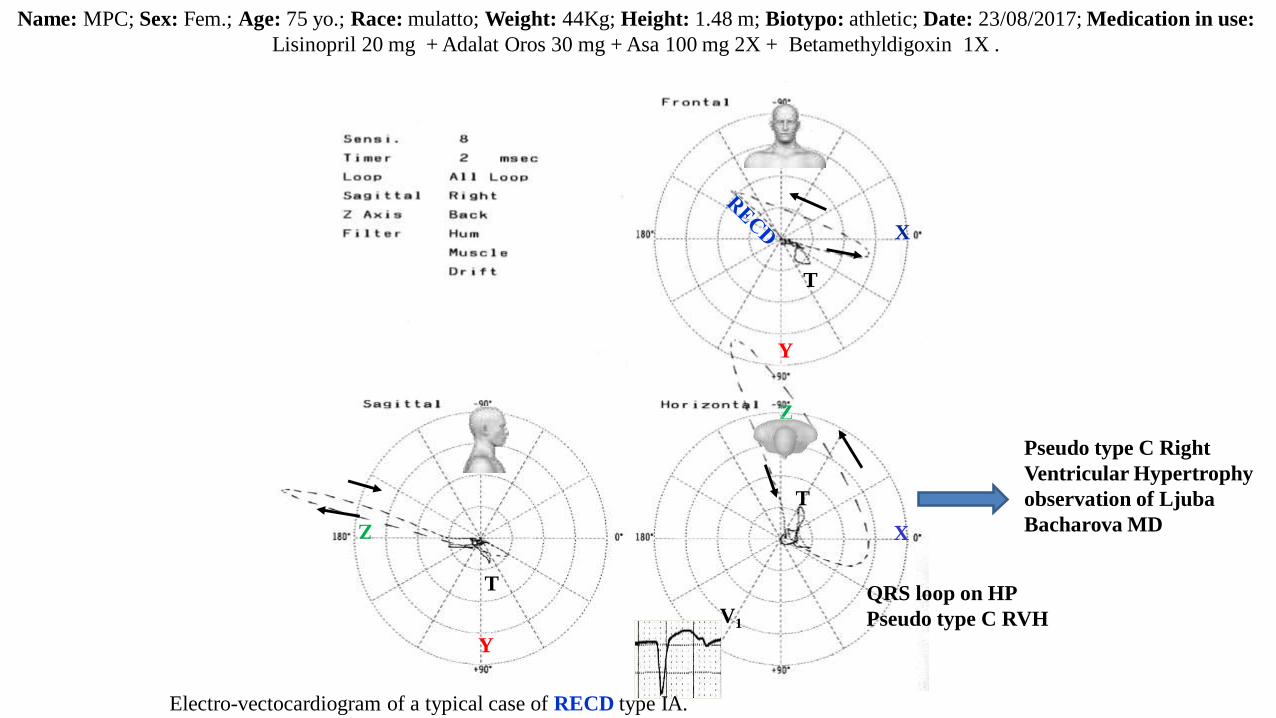
Electro-vectocardiogram of a typical case of RECD type IA.
Name: MPC; Sex: Fem.; Age: 75 yo.; Race: mulatto; Weight: 44Kg; Height: 1.48 m; Biotypo: athletic; Date: 23/08/2017; Medication in use:
Lisinopril 20 mg + Adalat Oros 30 mg + Asa 100 mg 2X + Betamethyldigoxin 1X .
X
Y
X
Z
Y
Z
QRS loop on HP
Pseudo type C RVH
Pseudo type C Right
Ventricular Hypertrophy
observation of Ljuba
Bacharova MD
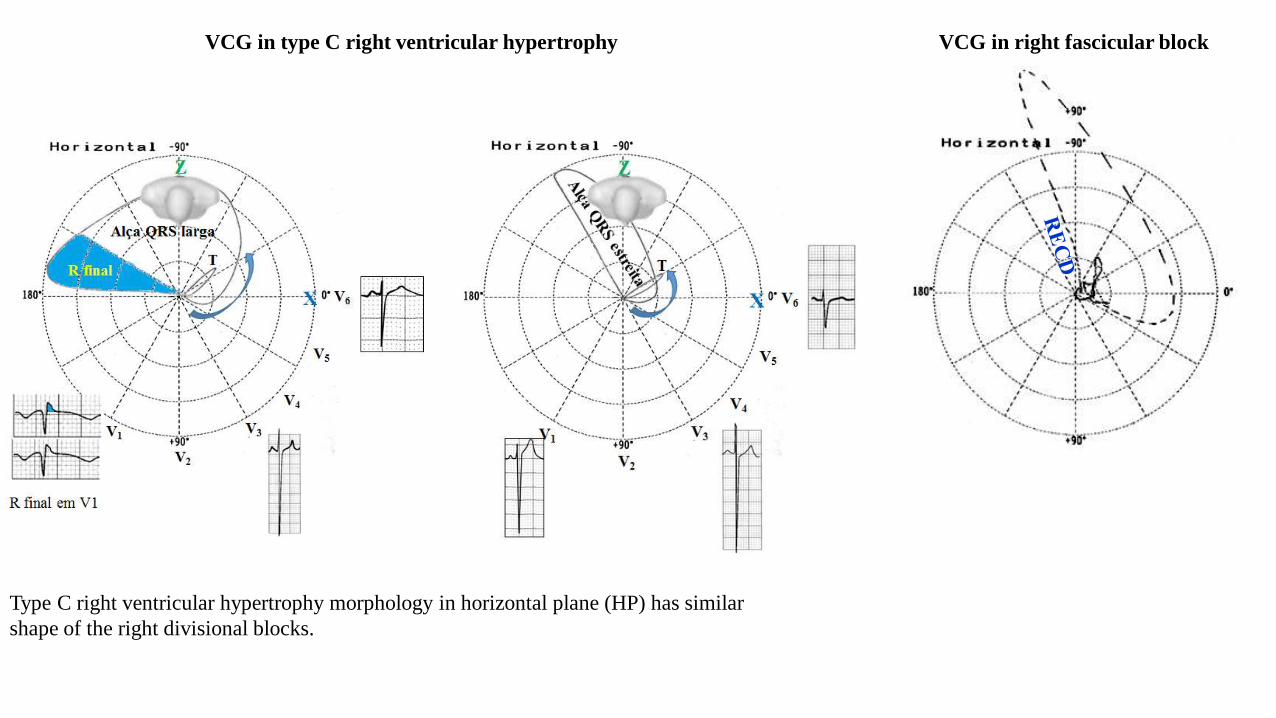
VCG in type C right ventricular hypertrophy
Type C right ventricular hypertrophy morphology in horizontal plane (HP) has similar
shape of the right divisional blocks.
VCG in right fascicular block
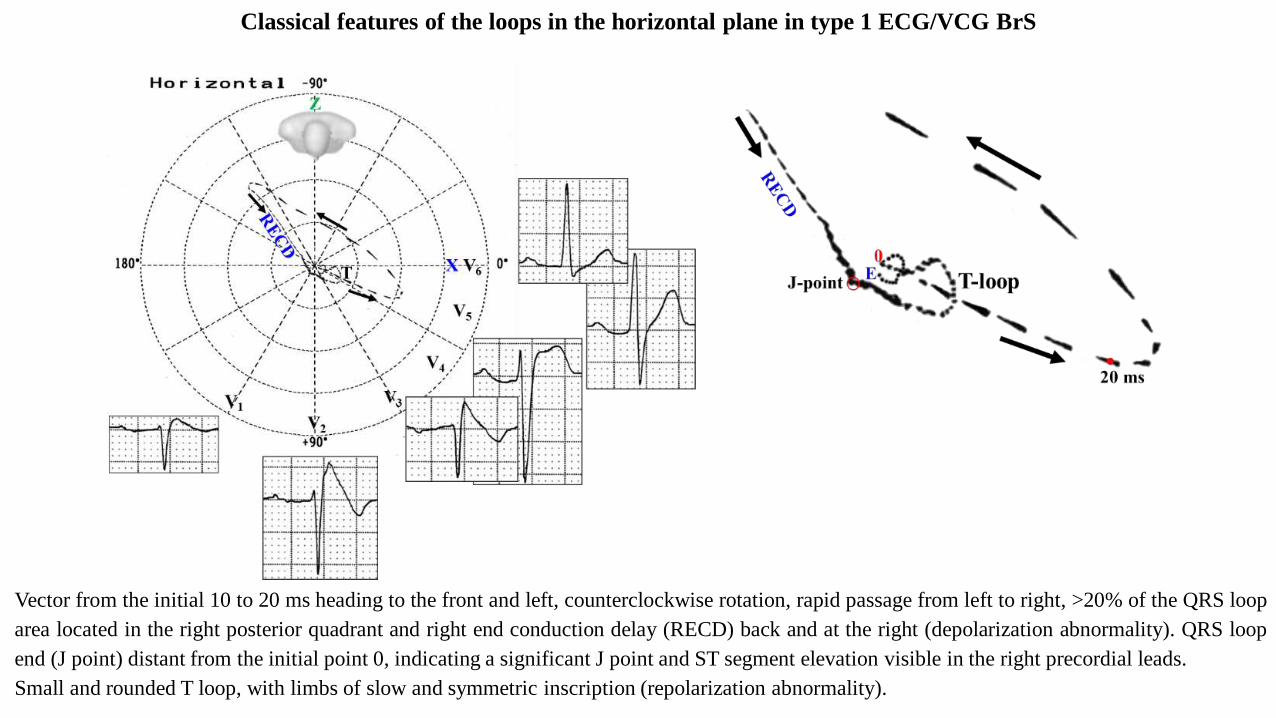
Classical features of the loops in the horizontal plane in type 1 ECG/VCG BrS
Vector from the initial 10 to 20 ms heading to the front and left, counterclockwise rotation, rapid passage from left to right, >20% of the QRS loop
area located in the right posterior quadrant and right end conduction delay (RECD) back and at the right (depolarization abnormality). QRS loop
end (J point) distant from the initial point 0, indicating a significant J point and ST segment elevation visible in the right precordial leads.
Small and rounded T loop, with limbs of slow and symmetric inscription (repolarization abnormality).
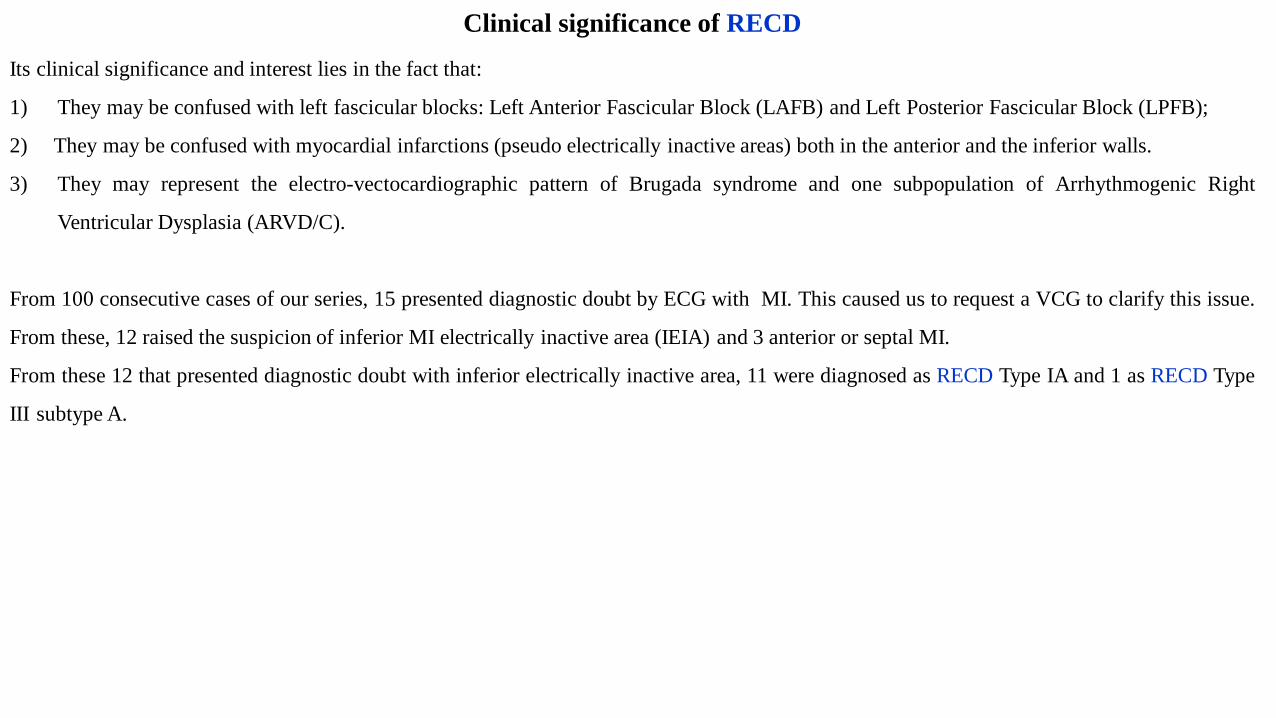
Clinical significance of RECD
Its clinical significance and interest lies in the fact that:
1) They may be confused with left fascicular blocks: Left Anterior Fascicular Block (LAFB) and Left Posterior Fascicular Block (LPFB);
2) They may be confused with myocardial infarctions (pseudo electrically inactive areas) both in the anterior and the inferior walls.
3) They may represent the electro-vectocardiographic pattern of Brugada syndrome and one subpopulation of Arrhythmogenic Right
Ventricular Dysplasia (ARVD/C).
From 100 consecutive cases of our series, 15 presented diagnostic doubt by ECG with MI. This caused us to request a VCG to clarify this issue.
From these, 12 raised the suspicion of inferior MI electrically inactive area (IEIA) and 3 anterior or septal MI.
From these 12 that presented diagnostic doubt with inferior electrically inactive area, 11 were diagnosed as RECD Type IA and 1 as RECD Type
III subtype A.
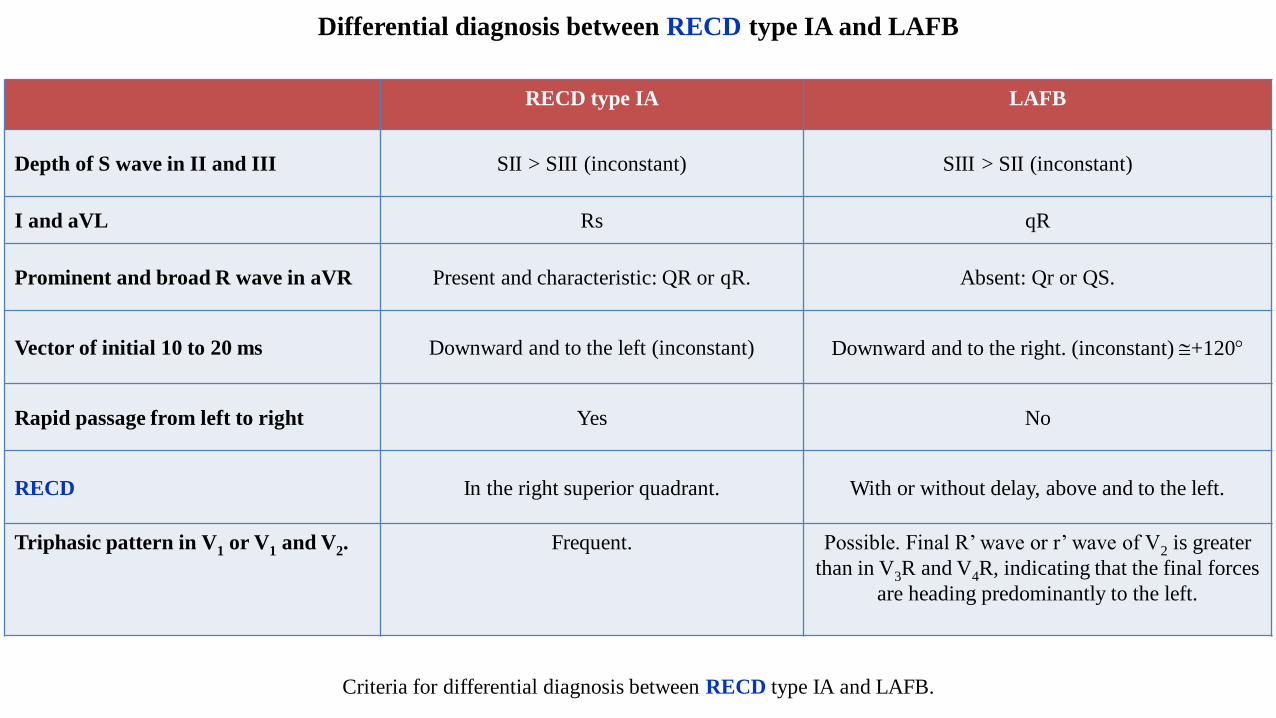
Differential diagnosis between RECD type IA and LAFB
RECD type IA LAFB
Depth of S wave in II and III SII > SIII (inconstant) SIII > SII (inconstant)
I and aVL Rs qR
Prominent and broad R wave in aVR Present and characteristic: QR or qR. Absent: Qr or QS.
Vector of initial 10 to 20 ms Downward and to the left (inconstant) Downward and to the right. (inconstant) +120
Rapid passage from left to right Yes No
RECD In the right superior quadrant. With or without delay, above and to the left.
Triphasic pattern in V1 or V1 and V2. Frequent. Possible. Final R’ wave or r’ wave of V2 is greater
than in V3R and V4R, indicating that the final forces
are heading predominantly to the left.
Criteria for differential diagnosis between RECD type IA and LAFB.
RVOT
RVIT
RA RA
IVC
SVC
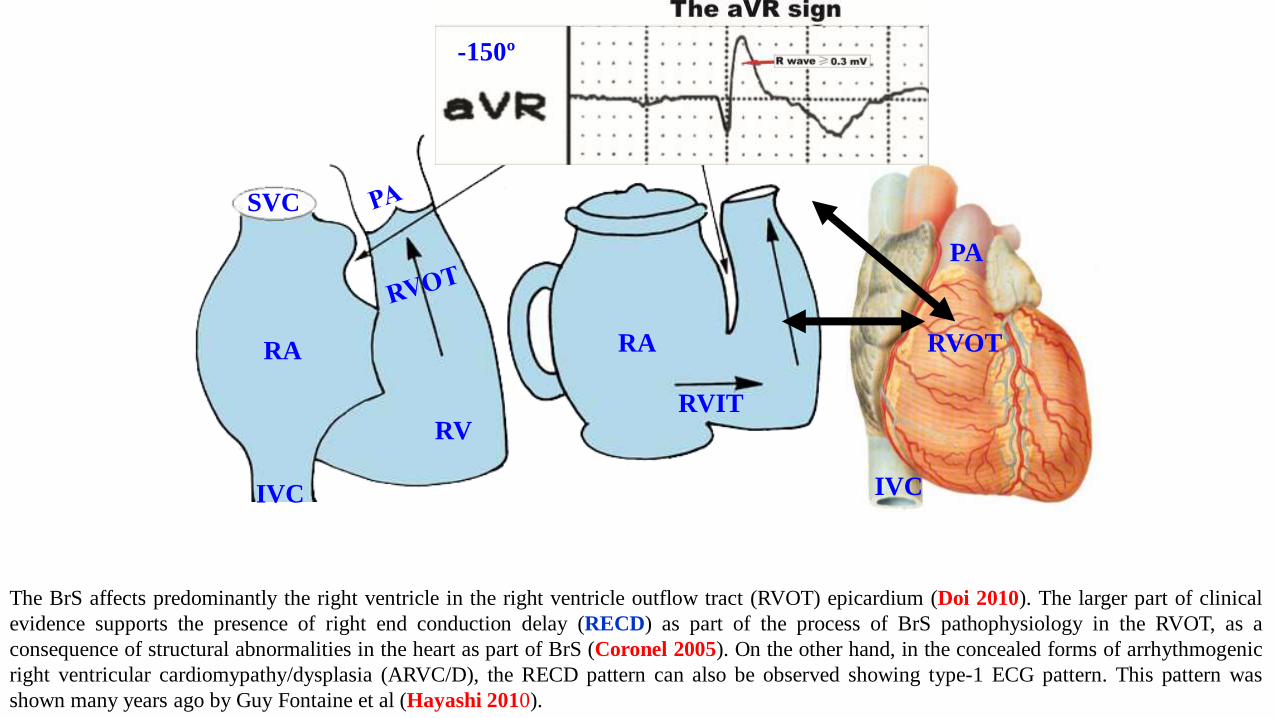
The BrS affects predominantly the right ventricle in the right ventricle outflow tract (RVOT) epicardium (Doi 2010). The larger part of clinical
evidence supports the presence of right end conduction delay (RECD) as part of the process of BrS pathophysiology in the RVOT, as a
consequence of structural abnormalities in the heart as part of BrS (Coronel 2005). On the other hand, in the concealed forms of arrhythmogenic
right ventricular cardiomypathy/dysplasia (ARVC/D), the RECD pattern can also be observed showing type-1 ECG pattern. This pattern was
shown many years ago by Guy Fontaine et al (Hayashi 2010).
PA
RV
IVC
-150º
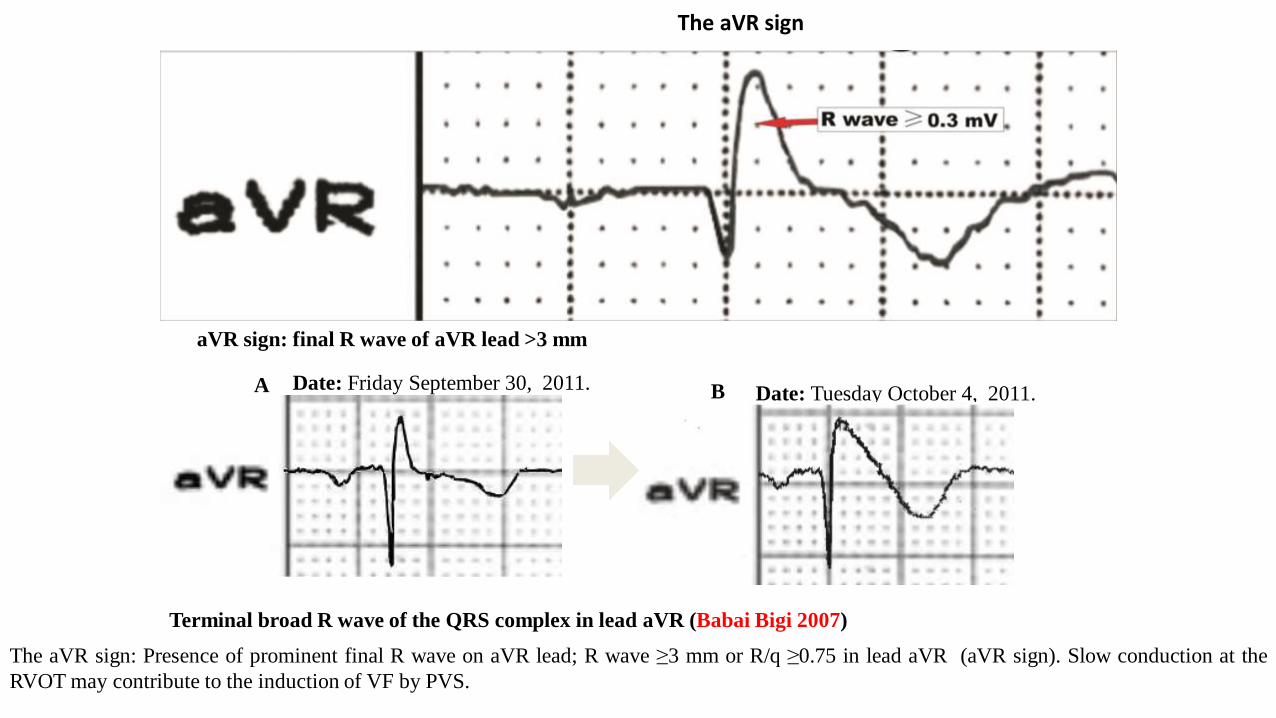
aVR sign: final R wave of aVR lead >3 mm
The aVR sign: Presence of prominent final R wave on aVR lead; R wave ≥3 mm or R/q ≥0.75 in lead aVR (aVR sign). Slow conduction at the
RVOT may contribute to the induction of VF by PVS.
Date: Friday September 30, 2011.
Terminal broad R wave of the QRS complex in lead aVR (Babai Bigi 2007)
A Date: Tuesday October 4, 2011.B
The aVR sign
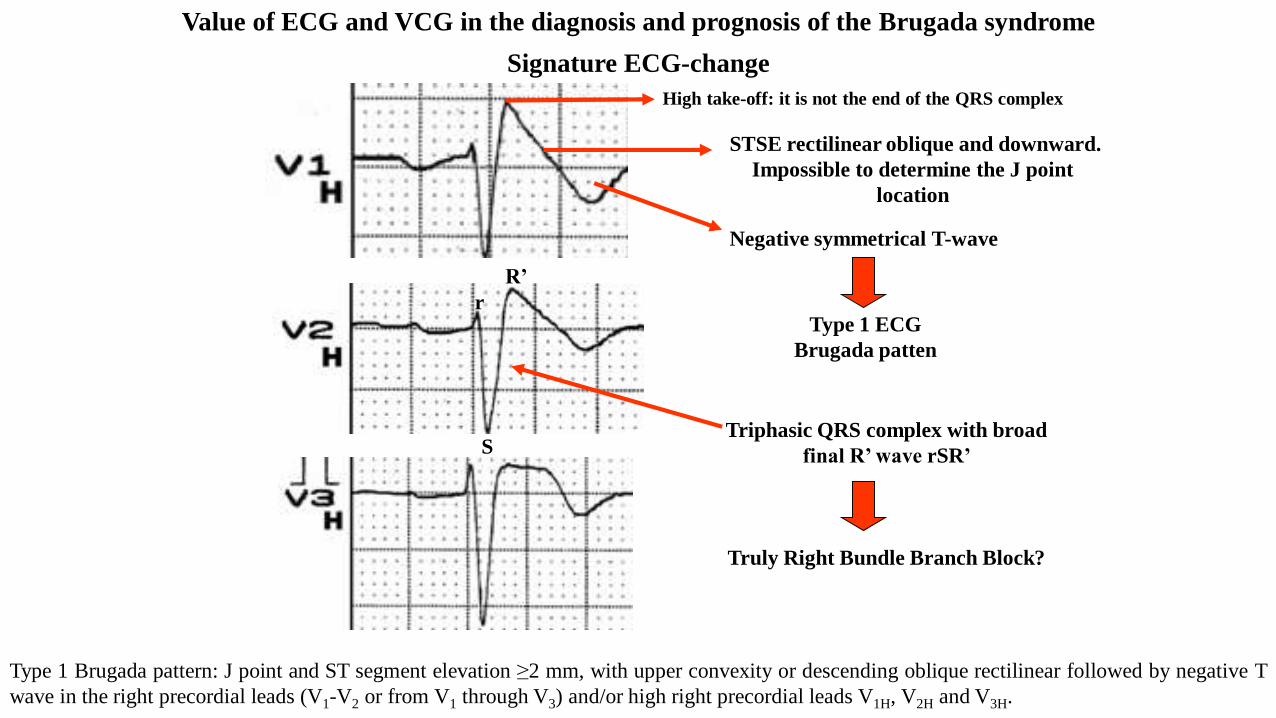
Signature ECG-change
High take-off: it is not the end of the QRS complex
STSE rectilinear oblique and downward.
Impossible to determine the J point
location
Negative symmetrical T-wave
Triphasic QRS complex with broad
final R’ wave rSR’
Truly Right Bundle Branch Block?
S
r
R’
Type 1 ECG
Brugada patten
Value of ECG and VCG in the diagnosis and prognosis of the Brugada syndrome
Type 1 Brugada pattern: J point and ST segment elevation ≥2 mm, with upper convexity or descending oblique rectilinear followed by negative T
wave in the right precordial leads (V1-V2 or from V1 through V3) and/or high right precordial leads V1H, V2H and V3H.
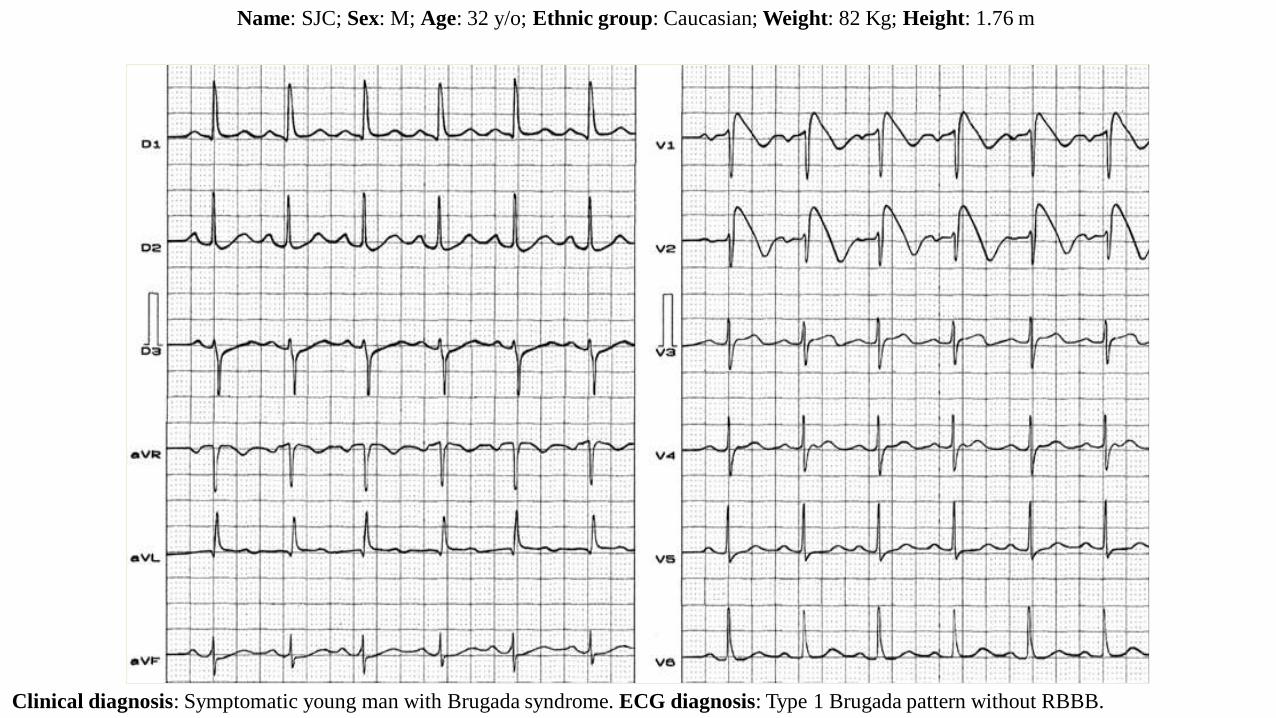
Name: SJC; Sex: M; Age: 32 y/o; Ethnic group: Caucasian; Weight: 82 Kg; Height: 1.76 m
Clinical diagnosis: Symptomatic young man with Brugada syndrome. ECG diagnosis: Type 1 Brugada pattern without RBBB.
ECG/VCG correlation in the horizontal plane
Type 1 Brugada pattern Truly RBBB pattern
RECD on right posterior quadrant
V6
V1
X
Z
V6
V1
X
Z
V2
(Pérez-Riera 2012)
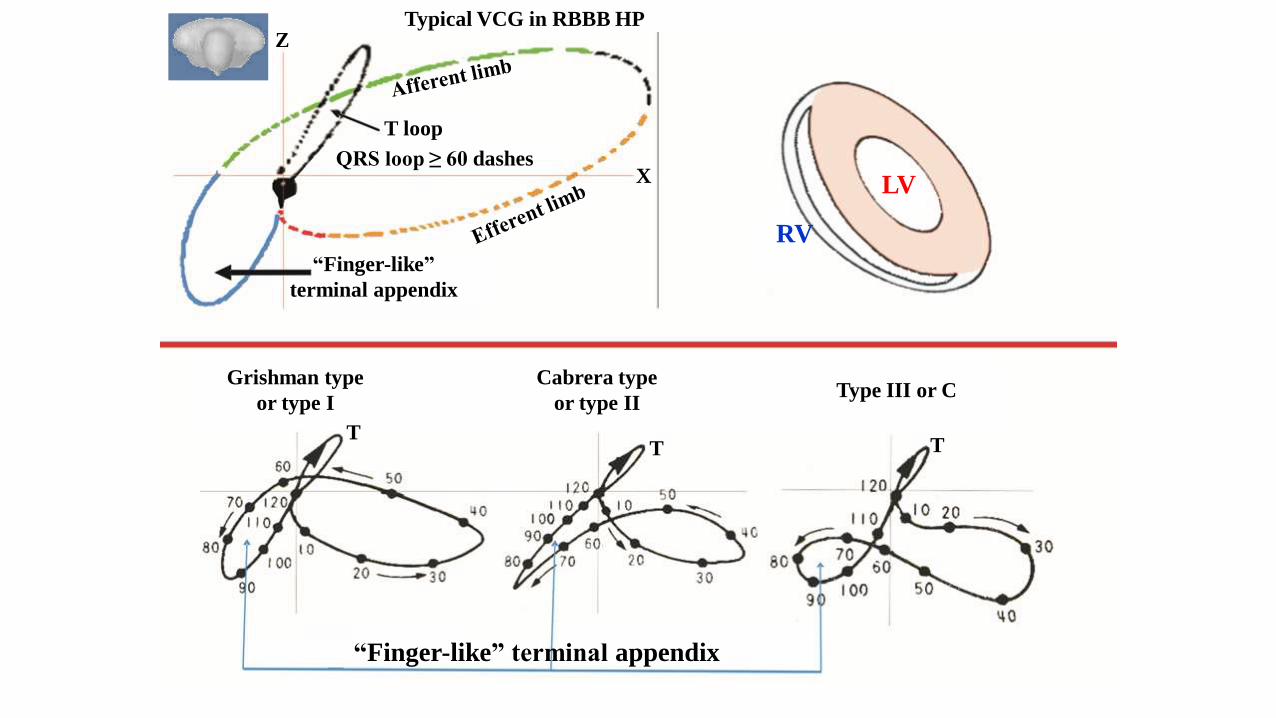
“Finger-like” terminal appendix
Grishman type
or type I
Cabrera type
or type IIType III or C
TTT
LV
RV
T loop
QRS loop ≥ 60 dashes
“Finger-like”
terminal appendix
X
ZTypical VCG in RBBB HP
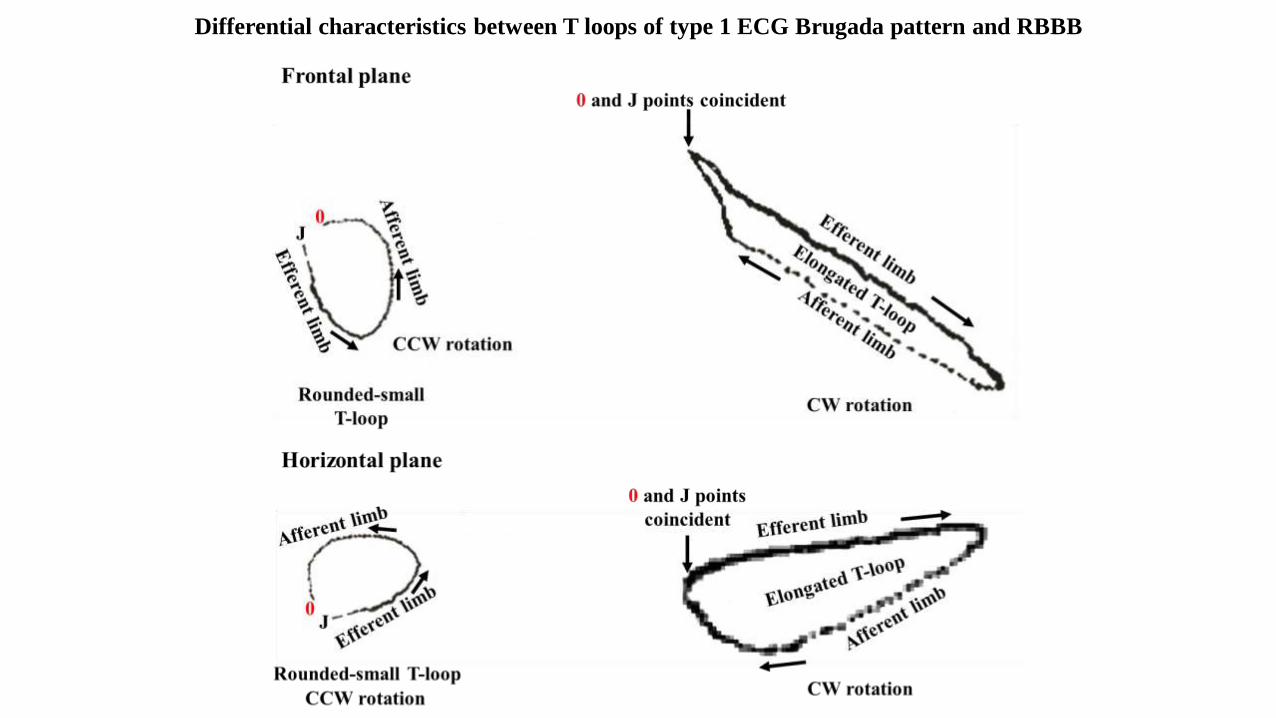
Differential characteristics between T loops of type 1 ECG Brugada pattern and RBBB
Numerous manuscripts have been published using different methods with the aim of clarifying the substrate and pathophysiological mechanism
underlying BrS, such as depolarization, conduction abnormalities or conduction delay versus repolarization abnormality, for the purpose of
prevention of VT/VF events (epicardial RFCA) and elimination of Brugada ECG pattern with epicardial substrate RFCA.
The methods used can be non-invasive, minimally invasive, invasive, post-mortem necropsy with molecular pathological study, and in vivo open
thoracotomy RFCA experiments in animals.
Noninvasive: Body Surface (Eckardt 2002), tissue Doppler echocardiography (Tukkie 2004), vectorcardiogram, signal-averaged
electrocardiogram (SAECG), and non-invasive epicardial and endocardial mapping (Rudic 2016).
Minimally invasive: (the epicardial electrogram of the RVOT directly, introducing an electrical guidewire into the conus branch of the right
coronary artery before and after class IC antiarrhythmic drug administration with SAECG (Nagase 2002), electrophysiology study, mapping,
RFCA over the anterior RVOT epicardium, endocardial mapping and focal RFCA for ventricular fibrillation prevention (Haïssaguerre 2003), RV
endocardial electroanatomic mapping and stimulation studies. With these methods, Postema et al observed wide and fractionated electrograms at
the RV endocardium. Type 1 ECG Brugada pattern patients display additional dromotropic disturbances during sinus rhythm and premature
stimulation along with abnormal transversal conduction velocity restitution caused by abnormal active membrane processes and electric coupling.
The authors concluded that BrS is not solely attributable to abnormal electrophysiological properties but requires the conspiring effects of
conduction slowing and tissue discontinuities (Postema 2008). The underlying electrophysiological mechanism in patients with BrS is
dromotropic disturbance in the epicardium of the RVOT. RFCA over this abnormal area results in the normalization of type 1 ECG Brugada
pattern and prevents events, both during electrophysiological studies as well as spontaneous recurrent Vt/VF episodes (Nademanee 2011). Using
combined epicardial and endocardial electroanatomical mapping, Cortez-Dias et al performed extensive epicardial RFCA of RVOT which
eliminated the fractionated electrograms, led to the disappearance of the type 1 ECG Brugada pattern six weeks after RFCA and despite
discontinuation of quinidine, no further events occurred during follow-up (Cortez-Dias 2014).
Biopsy: it demonstrates that BrS is associated with epicardial surface and interstitial fibrosis and reduced gap junction expression in the RVOT.
Additionally, BrS is also associated with increased collagen throughout the heart. Abnormal myocardial structure and conduction abnormalities are
therefore responsible for BrS (Nademanee 2015).
Post mortem: patients with explanted heart studied electrophysiologically and histopathologically showed dromotropic disturbance based on
interstitial fibrosis, but not transmural repolarization differences (repolarization abnormality) (Coronel 2005). The post mortem necropsies were
conducted with molecular pathological study screened using PCR and direct Sanger sequencing methods (Huang 2017).
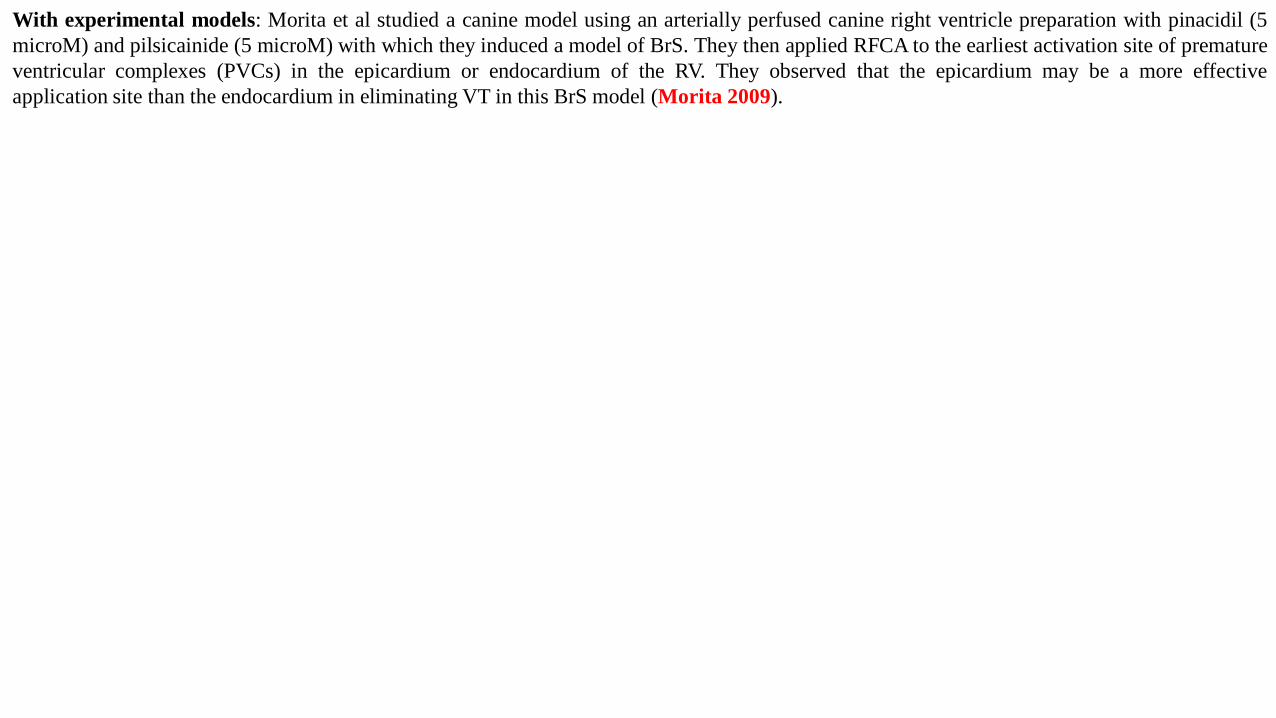
With experimental models: Morita et al studied a canine model using an arterially perfused canine right ventricle preparation with pinacidil (5
microM) and pilsicainide (5 microM) with which they induced a model of BrS. They then applied RFCA to the earliest activation site of premature
ventricular complexes (PVCs) in the epicardium or endocardium of the RV. They observed that the epicardium may be a more effective
application site than the endocardium in eliminating VT in this BrS model (Morita 2009).
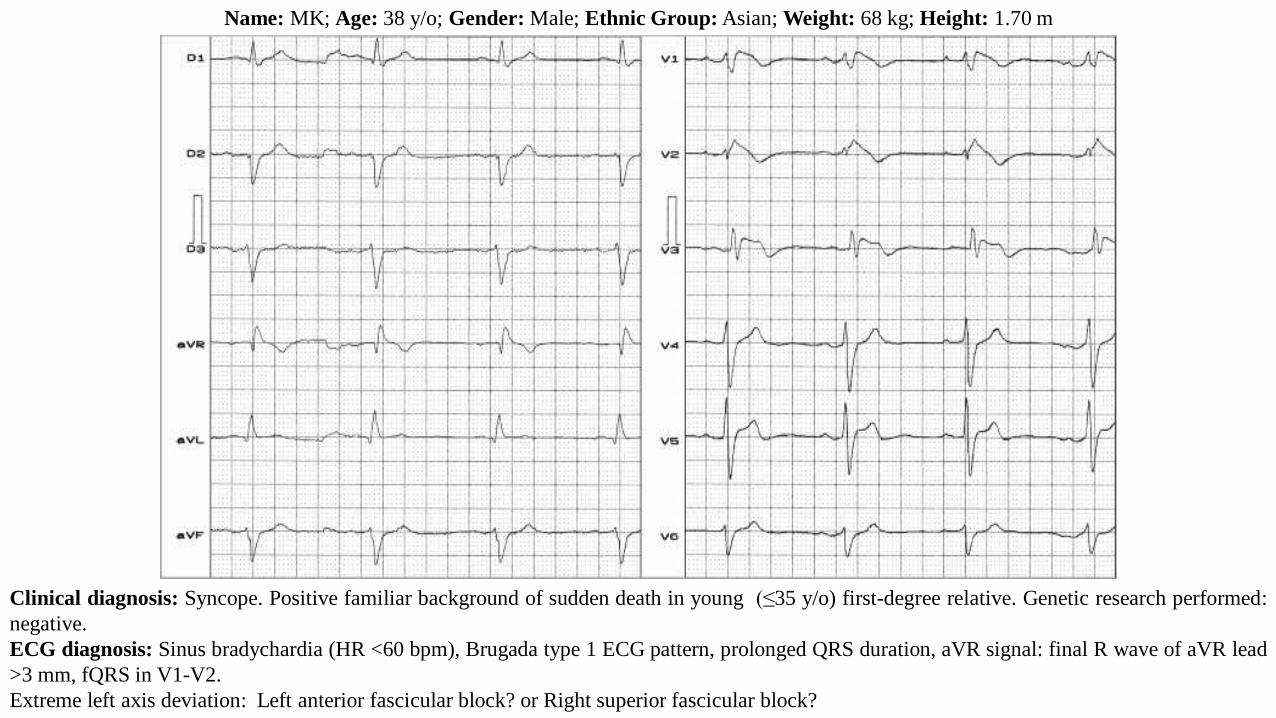
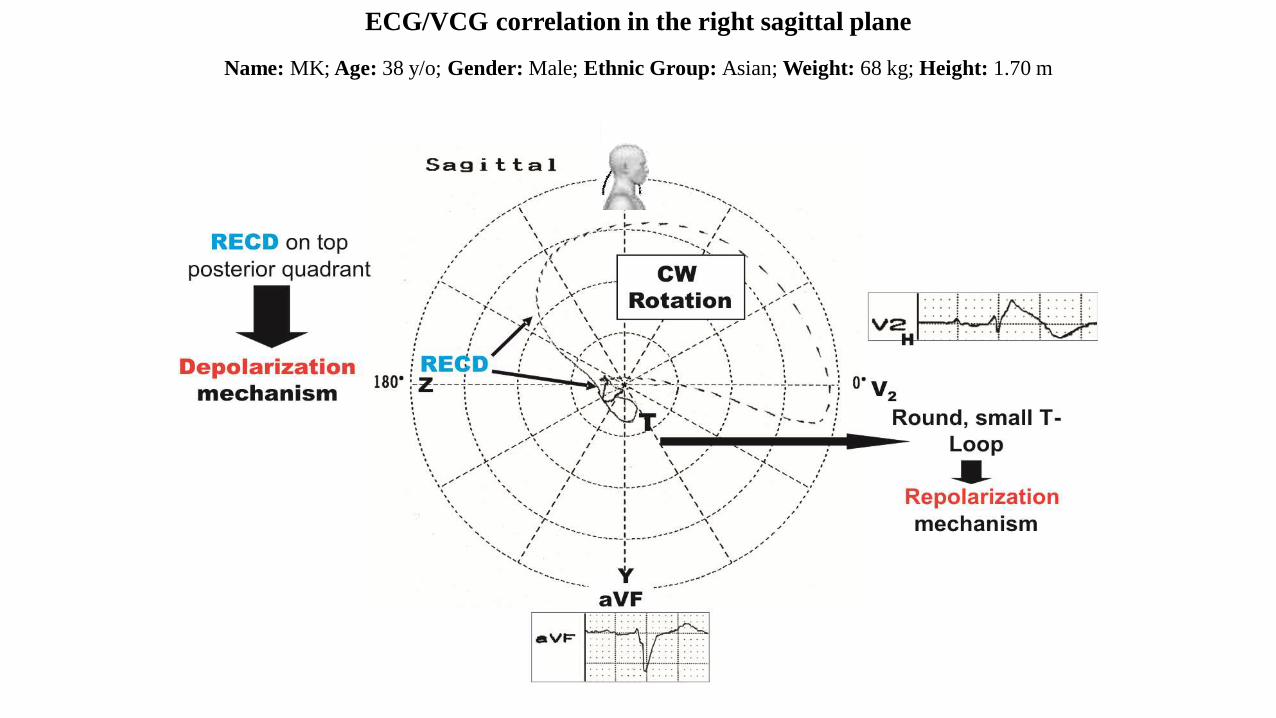
Name: MK; Age: 38 y/o; Gender: Male; Ethnic Group: Asian; Weight: 68 kg; Height: 1.70 m
Clinical diagnosis: Syncope. Positive familiar background of sudden death in young (≤35 y/o) first-degree relative. Genetic research performed:
negative.
ECG diagnosis: Sinus bradychardia (HR <60 bpm), Brugada type 1 ECG pattern, prolonged QRS duration, aVR signal: final R wave of aVR lead
>3 mm, fQRS in V1-V2.
Extreme left axis deviation: Left anterior fascicular block? or Right superior fascicular block?
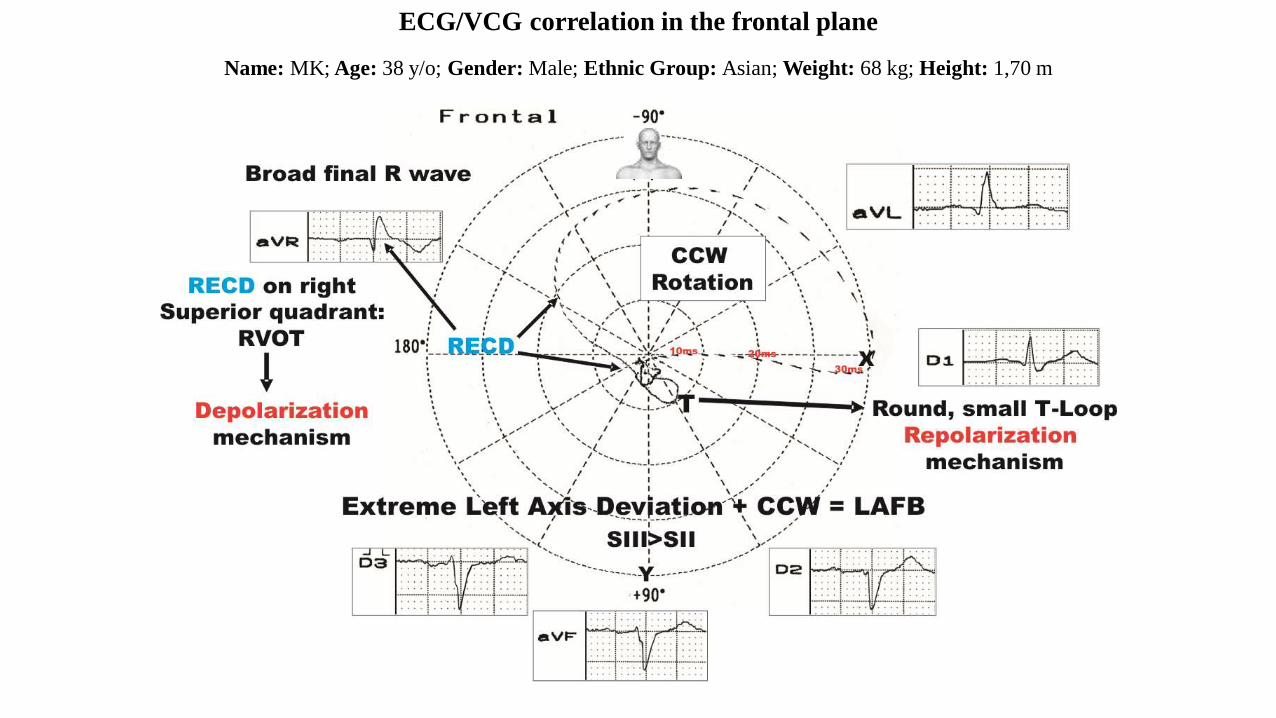
Name: MK; Age: 38 y/o; Gender: Male; Ethnic Group: Asian; Weight: 68 kg; Height: 1,70 m
ECG/VCG correlation in the frontal plane
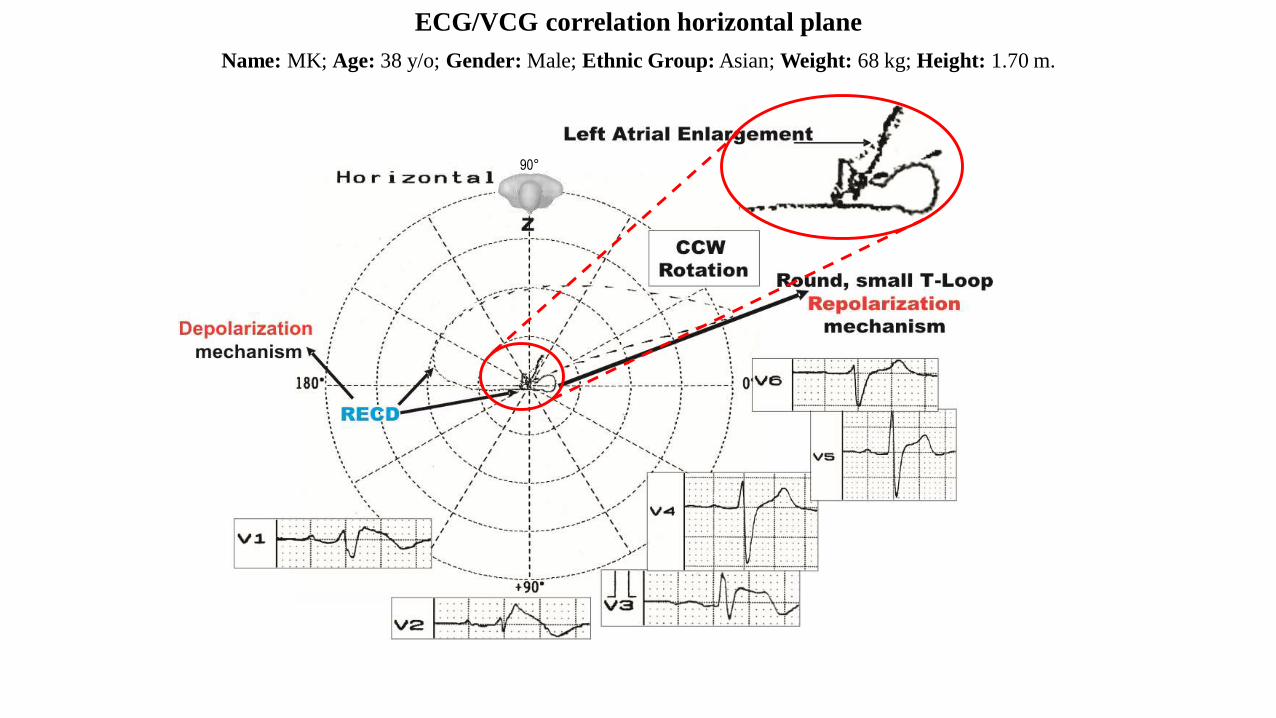
Name: MK; Age: 38 y/o; Gender: Male; Ethnic Group: Asian; Weight: 68 kg; Height: 1.70 m.
ECG/VCG correlation horizontal plane
90°
Name: MK; Age: 38 y/o; Gender: Male; Ethnic Group: Asian; Weight: 68 kg; Height: 1.70 m
ECG/VCG correlation in the right sagittal plane
References
1. Alzamora-Castro V, Abugattas R, Rubio C, et al. Parietal focal block; an experimental and electrocardiographic study. Circulation.
1953;7(1):108-15.
2. Babai Bigi MA, Aslani A, Shahrzad S. aVR sign as a risk factor for life-threatening arrhythmic events in patients with Brugada syndrome.
Heart Rhythm. 2007;4(8):1009-12.
3. Bayés de Luna A , Cosin J, Carrió J, et al. Right Ventricular peripheric blocks: Diagnostic Problem. In Masoni A, Alboni P, eds. Cardiac
Electrophysiology Today. Academic Press, London; New York, 1982, 401.
4. Bayés de Luna A, Carrió I, Subirana MT, et al. Electrophysiological mechanisms of the SI SII SIII electrocardiographic morphology. J
Electrocardiol. 1987;20(1):38-44.
5. Coronel R, Casini S, Koopmann TT, et al. Right ventricular fibrosis and conduction delay in a patient with clinical signs of Brugada
syndrome: a combined electrophysiological, genetic, histopathologic, and computational study. Circulation. 2005;112(18):2769-77.
6. Cortez‐Dias N, Placido R, Marta L, Bernardes A, Sobral S, Carpinteiro L, de Sousa J. Epicardial ablation for prevention of ventricular
fibrillation in a patient with Brugada syndrome. Rev Port Cardiol. 2014;33(5):305.e301–307.
7. de Micheli A, Medrano GA. [Disorders of intraventricular conduction]. Arch Inst Cardiol Mex. 1987 May-Jun;57(3):247-58.
8. de Micheli A, Medrano GA, Iturralde-Torres P. Uncomplicated and complicated myocardial peripheral blocks. Arch Cardiol Mex. 2009;79
Suppl 2:3-12.
9. Doi A, Takagi M, Maeda K, Tatsumi H, Shimeno K, Yoshiyama M. Conduction delay in right ventricle as a marker for identifying high-risk
patients with Brugada syndrome. J Cardiovasc Electrophysiol. 2010;21(6):688-96.
10. Eckardt L, Bruns HJ, Paul M, et al. Body surface area of ST elevation and the presence of late potentials correlate to the inducibility of
ventricular tachyarrhythmias in Brugada syndrome. J Cardiovasc Electrophysiol. 2002;13(8):742-9.
11. Haïssaguerre M, Extramiana F, Hocini M, et al. Mapping and ablation of ventricular fibrillation associated with long-QT and Brugada
syndrome. Circulation 2003;108(8):925-8.
12. Hayashi H, Sumiyoshi M, Yasuda M, et al. Prevalence of the Brugada-type electrocardiogram and incidence of Brugada syndrome in patients
with sick sinus syndrome. Circ J. 2010;74(2):271-7.
13. Huang L, Tang S, Chen Y, et al. Molecular pathological study on LRRC10 in sudden unexplained nocturnal death syndrome in the Chinese
Han population. Int J Legal Med. 2017;131(3):621-8.
14. Lenègre J. Contribution a l’Etude des Blocs de Branche. Paris, JB Bailliere, 1958.
15. Lev M. The normal anatomy of the conduction system in man and its pathology in atrioventricular block. Ann N Y Acad Sci. 1964;111:817-29.
16. Lev M. The conduction system. In: Gould S. Pathology of the heart and blood vessels. Springfield, III. Ed. Charles C Thomas; 1968. pp. 180.
17. Mahaim I. Les maladies organiques du faisceau de His-Tawara. Paris. Ed. Masson & Cie; 1931. pp. 31.
18. Masini V, Testoni F, Farulla A. Focal blocks of the right intraventricular conduction: morphology, pathogenesis and clinical significance.
Cardiologia. 1952;21(3):171-87.
19. Morita M, Zipes DP, Morita ST, Lopshire JC, Wu J. Epicardial ablation eliminates ventricular arrhythmias in an experimental model of
Brugada syndrome. Heart Rhythm 2009;6(5):665-71.
20. Nagase S, Kusano KF, Morita H, et al. Longer repolarization in the epicardium at the right ventricular outflow tract causes type 1
electrocardiogram in patients with Brugada syndrome. J Am Coll Cardiol. 2008;51(12):1154-61.
21. Nademanee K, Veerakul G, Chandanamattha P, et al. Prevention of ventricular fibrillation episodes in Brugada syndrome by catheter ablation
over the anterior right ventricular outflow tract epicardium. Circulation 2011;123(12):1270-9.
22. Nademanee K, Raju H, de Noronha SV, et al. Fibrosis, Connexin-43, and Conduction Abnormalities in the Brugada Syndrome. J Am Coll
Cardiol. 2015;66(18):1976-86.
23. Noseda V, Santi A, Aguggini G, et al. Experimental focal block in the sheep and the dog. An electrocardiographic and histological study.
Cardiologia. 1963;42:243-55.
24. Pastore CA, Moffa PJ, Spiritus MO, et al. Fascicular blocks of the right branch. Standardization of vectorelectrocardiographic findings. Arq
Bras Cardiol. 1983;41(3):161-6.
25. Peréz-Riera AR, Ferreira Filho C, de Abreu LC, et al. Do patients with electrocardiographic Brugada type 1 pattern have associated right
bundle branch block? A comparative vectorcardiographic study. Europace. 2012;14(6):889-97.
26. Postema PG, van Dessel PF, de Bakker JM, et al. Slow and discontinuous conduction conspire in Brugada syndrome: a right ventricular
mapping and stimulation study. Circ Arrhythm Electrophysiol. 2008;1(5):379-86.
27. Rossi P. Atypical electrocardiographic aspects of focal blocks of the right intraventricular conduction. Cuore Circ. 1954;38(1):16-22
28. Rudic B, Chaykovskaya M, Tsyganov A, et al. Simultaneous Non-Invasive Epicardial and Endocardial Mapping in Patients With Brugada
Syndrome: New Insights Into Arrhythmia Mechanisms. J Am Heart Assoc. 2016;5(11). pii: e004095.
29. Tukkie R, Sogaard P, Vleugels J, de Groot IK, Wilde AA, Tan HL. Delay in right ventricular activation contributes to Brugada syndrome.
Circulation. 2004;109(10):1272-7.
30. Uhley HN, Rivkin L. ECG patterns following interruption of main and peripheral branches of the canine right bundle Am J Cardiol.
1961;7:810-6.


![monotonous [muh- not -n-uhs] ( adj .)](https://img.pdfslide.us/doc/110x75/56815754550346895dc4fb9e/monotonous-muh-not-n-uhs-adj-.jpg)