Embed Size (px)
Citation preview
SFB 649 Discussion Paper 2012-062
Brand equity – how is it affected by critical incidents and what
moderates the effect
Sven Tischer * Lutz Hildebrandt *
* Humboldt-Universität zu Berlin, Germany
This research was supported by the Deutsche Forschungsgemeinschaft through the SFB 649 "Economic Risk".
http://sfb649.wiwi.hu-berlin.de
ISSN 1860-5664
SFB 649, Humboldt-Universität zu Berlin Spandauer Straße 1, D-10178 Berlin
SFB
6
4 9
E
C O
N O
M I
C
R
I S
K
B
E R
L I
N
Brand equity – how is it affected by critical incid ents and what moderates the
effect 1
Sven Tischer and Lutz Hildebrandt2
Abstract
To explore how occurring critical incidents affect customer-brand relations, this
study measures the impact on the basis of an online experiment. For this purpose,
1,122 usable responses are gathered considering the smartphone brands of Apple
and Nokia as well as different scenarios. The respective reactions to these negative
incidents are evaluated using the concept of customer-based brand equity. More
precisely, a structure equation model is specified and differences in latent factor
means are estimated taking into account perceived quality, various brand
associations, loyalty and overall brand equity. The findings indicate that brand equity
dimensions are not equally affected. Moreover, the results demonstrate that both
brand equity and the business relationship before crisis moderate the effect of
distinct critical incidents.
Key words
Brand equity, critical incidents, negative publicity, structure equation modeling,
online experiment
JEL Classification:
M14, M31, C12, C14, C38, C93
1 This research was supported by the Deutsche Forschungsgemeinschaft through the SFB 649 "Economic Risk".
SFB 649, Humboldt-Universität zu Berlin, Spandauer Straße 1, D-10178 Berlin 2 Humboldt-Universität zu Berlin, School of Business and Economics, Institute of Marketing, Spandauer Straße 1,
D-10178 Berlin,{ tischesv, hildebr}@wiwi.hu-berlin.de

1 Introduction
In comparison to the past, relations between customers and brands are less
exclusive today (Rust, Lemon & Zeithaml, 2004). Therefore, in order to retain
competitive advantages, it is becoming much more important to improve or, at least,
to maintain established customer-brand relations. As a result, marketing research
has been intensifying to figure out which incidents destabilize these relationships
(e.g. Keaveaney, 1995) in which ways (e.g. Aaker, Fournier & Brasel, 2004; Klein &
Dawar, 2004).
Roos (2002) defines such critical incidents (CI) as extraordinary events which are
perceived or recalled negatively by customers before purchase, during purchase or
during consumption. The possible impact of these negative perceptions, especially
on loyalty, have led to many qualitative studies to be analyzed (e.g. Bitner, Booms &
Tetreault, 1990; Gardial, Fisher, Flint & Woodruff, 1996; Roos, Edvardsson, &
Gustafsson, 2004). In contrast, just a few studies quantify effects of critical incidents,
but most of them focus on service failures (e.g. Maxham & Netemeyer, 2002;
Gustafsson, Johnson & Roos, 2005; van Doorn & Verhoef, 2008). The remaining
quantitative studies analyze either product harm crises (Ahluwalia, Burnkrant &
Unnava, 2000; Dawar & Pillutla, 2000; Klein & Dawar, 2004; Cleeren, Dekimpe &
Helsen, 2008; Dawar & Lei, 2009) or unethical marketing behavior (Ingram, Skinner
& Taylor, 2005).
All of these studies aim to shed some light on negative information processing in
the case of occurring critical incidents in order to be able to develop impact-
minimizing marketing strategies. Consequently, the following questions arise: When
will the customer-brand relation be damaged and, if so, to which extent? Which brand
dimensions are affected by critical incidents and should be addressed afterwards?
Does the kind of critical incident matter? Are there moderators which influence the
information processing?
Addressing these questions, this study follows Dawar and Pillutla (2000) and uses
the concept of customer-based brand equity (CBBE) to quantify relational changes.
For this purpose, an experimental design was developed reducing some criticized
weaknesses of such experiments. By focusing on product brands, this study gains
insights into immediate reactions to different critical incidents considering various
brand strengths (Ahluwalia et al., 2000; Dawar & Pillutla, 2000; Cleeren et al., 2008)
and previous relations (Ahluwalia, 2002; Dawar & Lei, 2009; van Doorn & Verhoef,
2008). As a result, this study is the first which explores an integrated relationship-
branding perspective and compares the effect of distinct critical incidents regarding
various brand equity dimensions.
The article first reviews literature to develop the conceptual framework and
hypotheses. The following sections present the research methodology, the sample
and the results. In the end, discussion and limitations of this research are presented.
2 Conceptual framework
2.1 Brand equity and its dimensions
Given the increased importance of brand equity since its conception by Aaker
(1991), various brand measures have been developed. Ailawadi, Lehmann and
Neslin (2003) classify these measures as product-market outcomes, financial market
outcomes or customer mind-set measures. In order to quantify changes in customer-
brand relations, this study employs customer mind-set measures adapting the
multidimensional concept of CBBE defined by Keller (1993) as “differential effect that
brand knowledge has on consumer response to the marketing of that brand”.
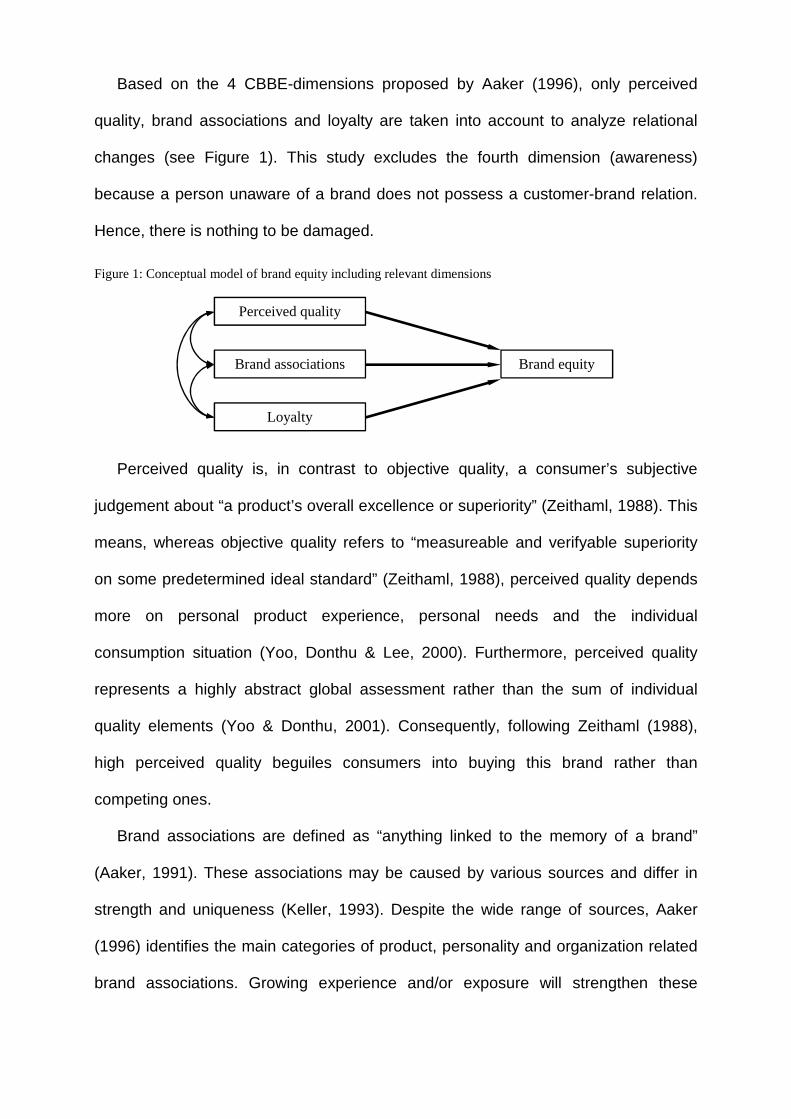
Based on the 4 CBBE-dimensions proposed by Aaker (1996), only perceived
quality, brand associations and loyalty are taken into account to analyze relational
changes (see Figure 1). This study excludes the fourth dimension (awareness)
because a person unaware of a brand does not possess a customer-brand relation.
Hence, there is nothing to be damaged.
Figure 1: Conceptual model of brand equity including relevant dimensions
Perceived quality is, in contrast to objective quality, a consumer’s subjective
judgement about “a product’s overall excellence or superiority” (Zeithaml, 1988). This
means, whereas objective quality refers to “measureable and verifyable superiority
on some predetermined ideal standard” (Zeithaml, 1988), perceived quality depends
more on personal product experience, personal needs and the individual
consumption situation (Yoo, Donthu & Lee, 2000). Furthermore, perceived quality
represents a highly abstract global assessment rather than the sum of individual
quality elements (Yoo & Donthu, 2001). Consequently, following Zeithaml (1988),
high perceived quality beguiles consumers into buying this brand rather than
competing ones.
Brand associations are defined as “anything linked to the memory of a brand”
(Aaker, 1991). These associations may be caused by various sources and differ in
strength and uniqueness (Keller, 1993). Despite the wide range of sources, Aaker
(1996) identifies the main categories of product, personality and organization related
brand associations. Growing experience and/or exposure will strengthen these
Perceived quality
Loyalty
Brand associations Brand equity
associations (Aaker, 1991). Finally, positive associations signal high quality and
commitment leading to more favorable buying decisions for the brand (Yoo et al.,
2000).
Loyalty is defined by Aaker (1991) as “the attachment that a customer has to a
brand.” This brand attachment can be conceptualized from a behavioral or an
attitudinal perspective. Whereas behavioral loyalty focuses on repurchase behavior,
attitudinal loyalty reflects the intention or “tendency to be loyal to a focal brand” (Yoo
& Donthu, 2001). In the end, consumers with a high level of loyalty increase brand
equity by purchasing a brand routinely and resisting other brand offers (Yoo et al.,
2000).
2.2 Critical incidents (CI)
Bitner et al. (1990) describe an incident which contributes significantly either
positively or negatively to an activity or phenomenon as critical. Focusing on negative
incidents as defined by Roos (2002; see introduction), a negatively changed buying
behavior can be triggered by these incidents (e.g. Gustafsson et al., 2005; Bitner et
al., 1990). This would mean that companies lose operating efficiencies and future
revenue streams as a result of customers who reduce their spending and purchase
frequency, purchase at discount instead of full prices or switch to another supplier.
Different causes may trigger these consequences. According to Keaveney (1995),
CI result from either pricing problems, lack of convenience, core service (product)
failures, service encounter failures, inadequate response to failures, attraction by
competitors or ethical problems. Concentrating on service failures, Keaveney (1995)
distinguishes only two ethical problems occuring while interacting with the customer:
dishonest or intimidating behavior and conflicts of interest related to commission-
based recommendations.

However, public awareness has changed with regard to what is deemed to be an
ethical problem. Furthermore, due to better educated, increasingly skeptical and
demanding consumers (Mangold & Faulds, 2009) and their ability to publish negative
incidents easily via the internet, customers do not experience most CI personally
nowadays. Instead, people perceive especially ethical problems in the media as
negative publicity. As a consequence, Shleifer (2004) takes a more general
perspective on ethical problems and differentiates, additionally to Keaveney (1995),
between employment of children, excessive executive payments, corporate earnings
manipulation, involvement of universities in commercial activities and corruption.
In order to compare the results of this study with existing analyses, attitudinal
changes concerning a product failure are quantified. Also, due to the increased
importance of ethical problems and to compare distinct CI, this study examines
changes in the customer-brand relation becoming aware of corruption.
3 Development of hypotheses
3.1 Relations between brand equity and its dimensions (model hypotheses)
According to Aaker (1996), loyalty is a key indicator of brand equity and can be
strengthened by perceived quality and brand associations. Myers (2003) refines this
statement, arguing that brand loyalty is a dependent variable of perceived quality and
the components of brand associations. Additionally, Buil, de Chernatony and
Martinez (2008) claim perceived value, brand personality and organizational
associations reflect the relevant brand associations and complete the structural
model. Hence, the following hypotheses are proposed:
Hypothesis 1: Rising attitudinal loyalty (LOY) enhances brand equity (EQU).
Hypothesis 2: Higher perceived quality (PQU) increases loyalty (LOY).
Hypothesis 3a: The greater the perceived value (PVA), the greater the loyalty.
Hypothesis 3b: The greater the brand personality (BPE), the greater the loyalty (LOY).
Hypothesis 3c: The greater the organizational associations (ORG), the greater the
loyalty (LOY).
Integrating the concept of perceived value takes into account that a high quality
perception is necessary, but not sufficient, to become a loyal customer due to
perceived price-performance ratio. Therefore, perceived value is assumed to mediate
the effect towards loyalty. As a result of Germany-wide similar prices for the same
brands, the following hypotheses are proposed:
Hypothesis 4a: Perceived value (PVA) mediates the influence of perceived quality
(PQU) on loyalty (LOY).
Hypothesis 4b: The greater the perceived quality (PQU), the greater the perceived
value (PVA).
Given that perceived value has to be positive to increase loyalty, organizational
associations, such as credibility, esteem and trust, will affect loyalty only in addition
to perceived value. Consequently, considering the interdependencies of these
organizational associations and following Sirdesmukh, Singh and Sabol (2002),
perceived value is assumed to be a mediator between organizational associations
and loyalty. In addition, an effect of organizational associations might exist detached
from product or service characteristics. Therefore, the following hypotheses are
proposed:
Hypothesis 5: Perceived value (PVA) mediates the influence of organizational
associations (ORG) on loyalty (LOY).
Hypothesis 6: The greater the organizational associations (ORG), the greater the
overall brand equity (EQU).
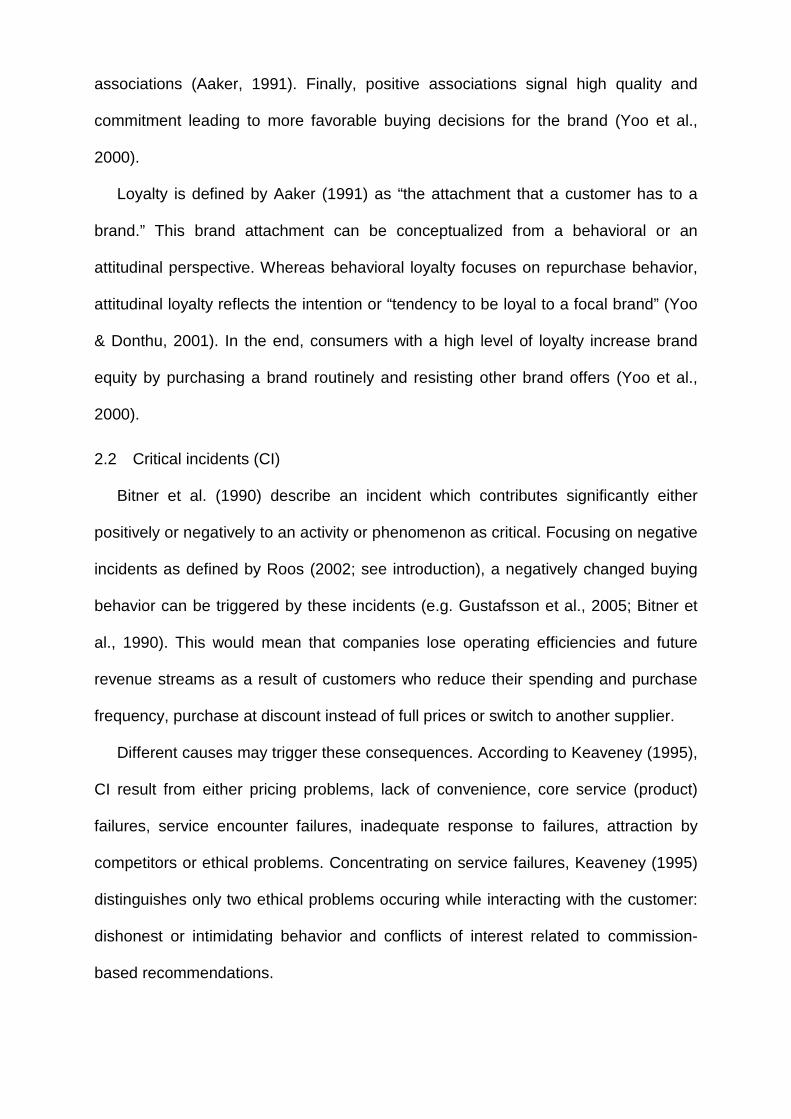
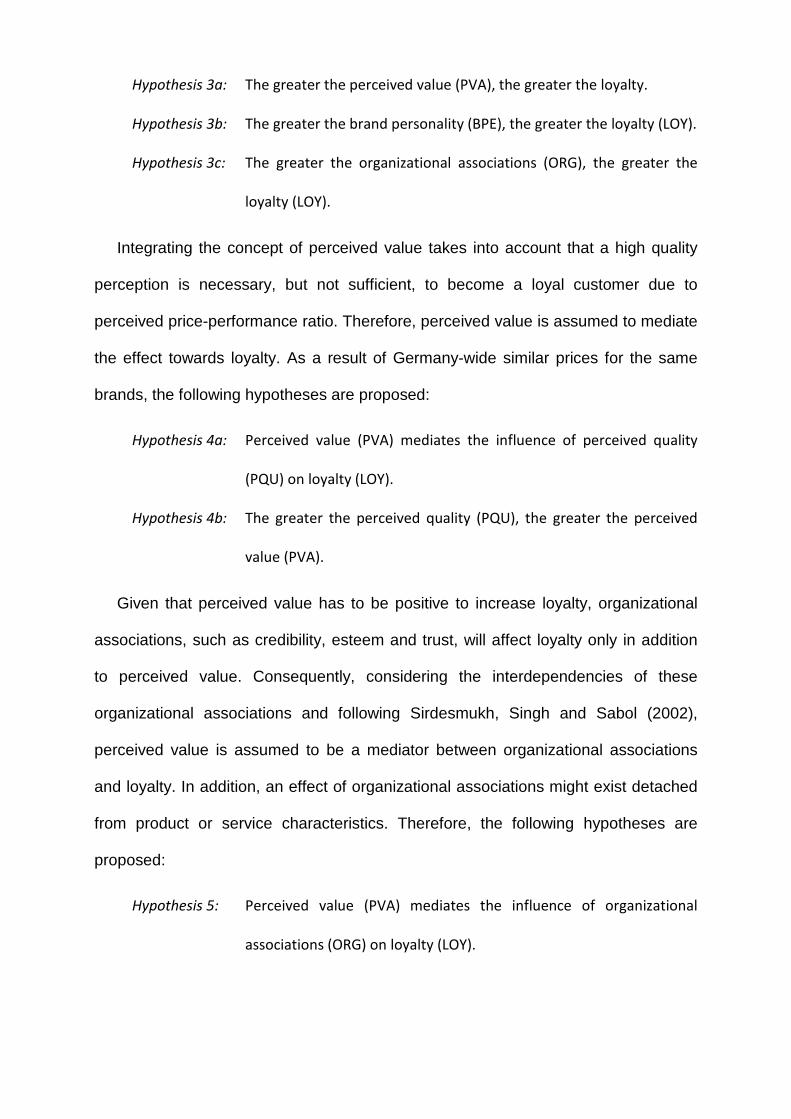
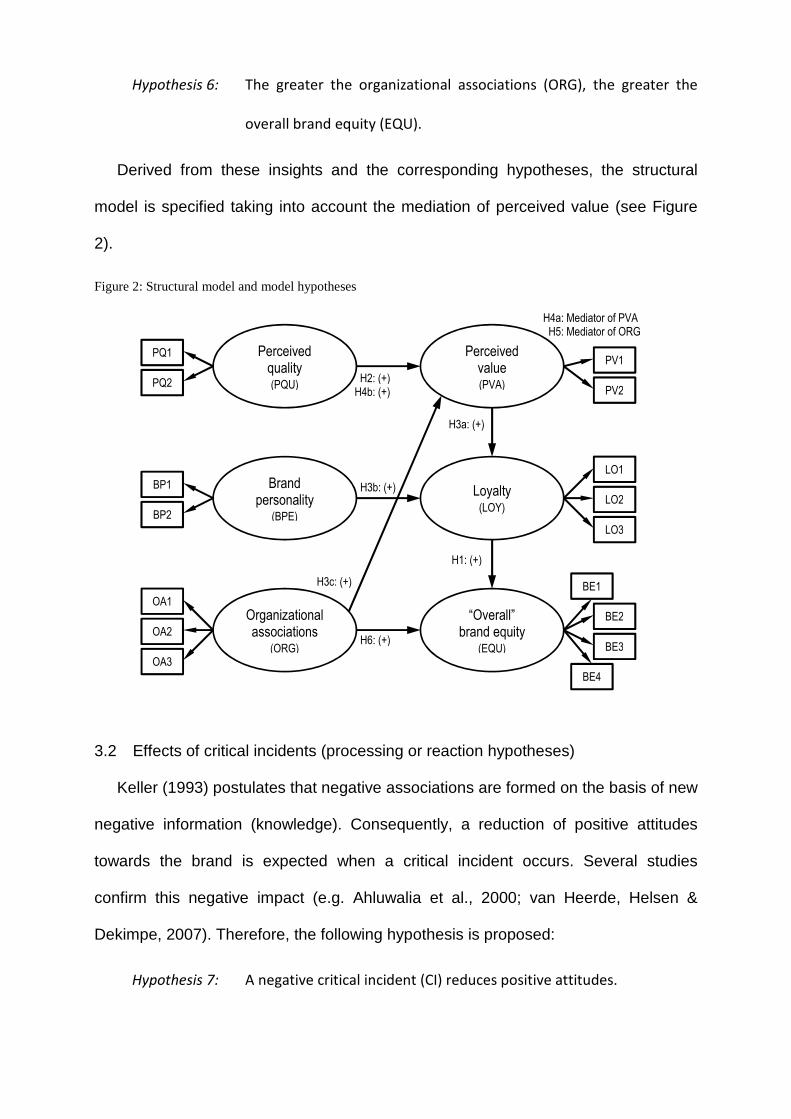
Derived from these insights and the corresponding hypotheses, the structural
model is specified taking into account the mediation of perceived value (see Figure
2).
Figure 2: Structural model and model hypotheses
3.2 Effects of critical incidents (processing or reaction hypotheses)
Keller (1993) postulates that negative associations are formed on the basis of new
negative information (knowledge). Consequently, a reduction of positive attitudes
towards the brand is expected when a critical incident occurs. Several studies
confirm this negative impact (e.g. Ahluwalia et al., 2000; van Heerde, Helsen &
Dekimpe, 2007). Therefore, the following hypothesis is proposed:
Hypothesis 7: A negative critical incident (CI) reduces positive attitudes.
Brand personality
(BPE)
“Overall” brand equity
(EQU)
Perceived quality (PQU)
Loyalty (LOY)
Organizational associations
(ORG)
Perceived value (PVA)
PQ1
PQ2
BP1
BP2
OA1
OA2
OA3
PV1
PV2
LO1
LO2
BE1
BE2
BE3
LO3
BE4
H1: (+)
H3a: (+)
H3b: (+)
H4a: Mediator of PVA H5: Mediator of ORG
H2: (+) H4b: (+)
H3c: (+)
H6: (+)
However, closer examination reveals indications that perceptions, and hence the
impact of critical incidents, vary depending on customer-brand relation, crisis and the
medium which transmits the message.
With regard to customer-brand relation, various studies show a moderating effect
of pre-crisis levels using the concepts familiarity (Ahluwalia, 2002; Cleeren et al.,
2008; Dawar & Lei, 2009), commitment (Ahluwalia et al., 2000; Ingram et al., 2005)
and brand equity (Dawar & Pillutla, 2000; Cleeren et al., 2008). Specifically, this
means critical incidents have less influence on familiar customers, customers who
are highly committed to a brand as well as customers with substantial CBBE. These
buffering effects can be caused, on the one hand, by more likely biased processing
of loyal customers (Ahluwalia et al., 2000) and their tendencies to resist or discount
disconfirmatory information (Dawar & Pillutla, 2000). On the other hand, potential
customers miss the opportunity to increase their personal experience, which is
instrumental in maintaining brand equity during a crisis (Aaker & Biel, 1993).
Consequently, they are more affected (van Heerde et al., 2007). Therefore, the
following hypotheses are derived considering the importance of loyalty to brand
equity (Aaker, 1996):
Hypothesis 8: Higher brand equity leads to smaller effects of the critical incident.
Hypothesis 9: The smaller the effect of the critical incident, the greater the loyalty.
Furthermore, supposing that loyal customers possess generally more brand
knowledge as well as stronger associations (Romaniuk, 2008) and are hence more
familiar and committed compared to potential customers, the following hypotheses
result:
Hypothesis 10: Associations are stronger for customers compared to non-customers.
Hypothesis 11: Current customers reduce their attitudes less compared to non-
customers.
According to Dawar and Lei (2009), the influence of the nature of crisis depends
on whether key benefit associations are affected. This implies different critical
incidents influence different brand dimensions. One reason is that risk perceptions
differ depending on the nature of crisis (Weißgerber, 2007). Therefore, in the case of
a product failure, perceived quality (PQU) is presumed to be directly affected in
consequence of perceived functional and/or physical risks. In contrast, in the case of
corruption, a significant direct effect is expected on associations towards the
company (ORG), such as trust, credibility and esteem due to psychological and/or
social risks (personal identification). With regard to both critical incidents, perceived
value is assumed to decrease as a result of its mediating role and the expected direct
effects. Consequently, the following hypotheses are proposed:
Hypothesis 12a: In the event of corruption, organizational associations (ORG) are
significantly affected.
Hypothesis 12b: Perceived quality (PQU) is significantly affected in the event of a
product failure.
Hypothesis 12c: In both cases, perceived value (PVA) is significantly affected.
In addition to the nature of crisis, Laufer, Gillespie, McBride and Gonzalez (2005)
show that perceived severity mediates the impact of critical incidents. Dawar and Lei
(2009) confirm this mediation on negative perceptions measuring seriousness.
Assuming that the perception of seriousness depends on the potential amount of
damage, geographic and chronological proximity as well as whether or not the
persons are directly affected, the following hypotheses are proposed:
Hypothesis 13: When the persons are not directly affected, the critical incident
impacts loyalty (LOY) less than other constructs.
Hypothesis 14: CI which are perceived as less critical affect brand dimensions less.
Finally, considering that people strive to avoid cognitive dissonance, mediums
transmitting bad news are key planks. This means the more credible the medium is
perceived to be, the more likely and extensive the processing of information.
Consequently, the final hypothesis is offered:
Hypothesis 15: Less credible perceived news items affect brand dimensions less.
4 Methodology
4.1 Study design
In order to test these specified hypotheses, attitudinal data are gathered via the
internet using an experimental pretest-posttest-control design. The experimental
design considers additionally three independent variables – level of brand equity (low
vs. high, respectively Nokia vs. Apple), current relationship (customer vs. non-
customer) and the nature of the critical incident (product failure vs. ethical problem).
Consequently, the design consists of 8 treatment and 4 control groups (2x2x3). All
test subjects are assigned randomly to a treatment or control group except current
customers of the brands under investigation. Nokia and Apple customers are
allocated randomly to a treatment or control group in their respective survey to reach
or rather to exceed a minimum threshold of responses in every group. This means,
all responses regarding Nokia do not contain the responses of customers who
currently use an Apple mobile phone and vice versa (see Figure 3).
The treatments are fictitious articles claiming a product failure or corruption
happened recently in and limited to East Asia. Consequently, the incidents do not
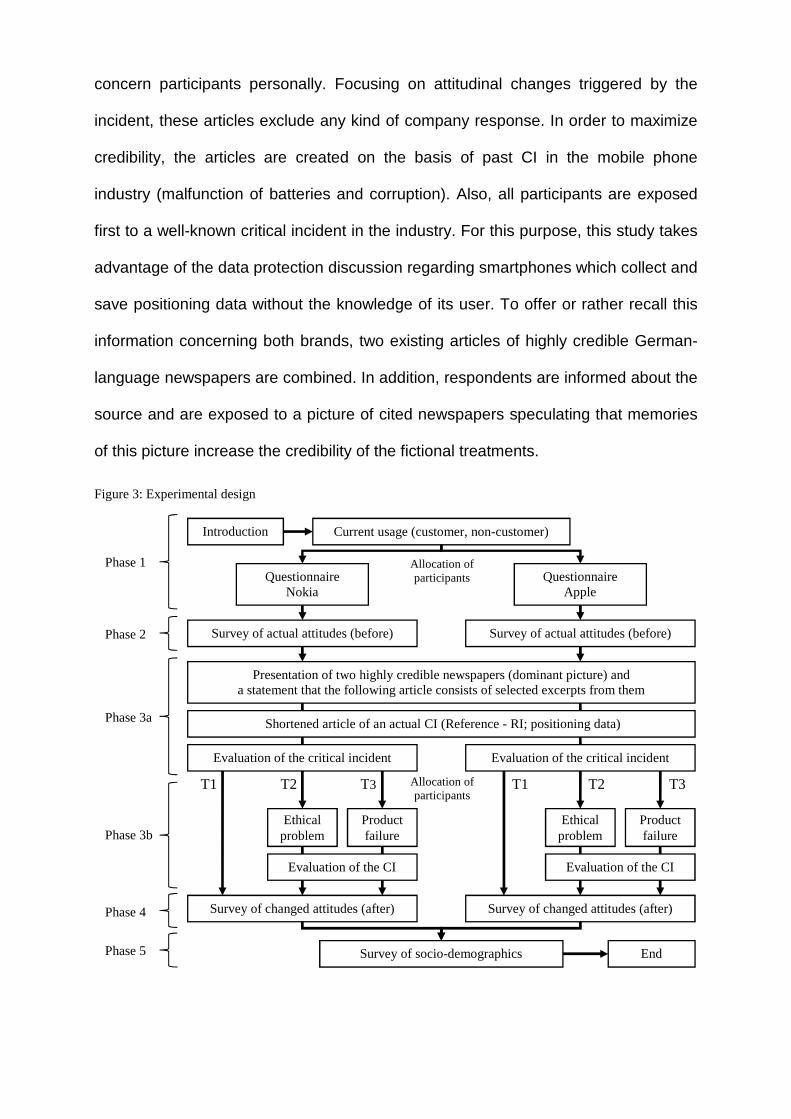
concern participants personally. Focusing on attitudinal changes triggered by the
incident, these articles exclude any kind of company response. In order to maximize
credibility, the articles are created on the basis of past CI in the mobile phone
industry (malfunction of batteries and corruption). Also, all participants are exposed
first to a well-known critical incident in the industry. For this purpose, this study takes
advantage of the data protection discussion regarding smartphones which collect and
save positioning data without the knowledge of its user. To offer or rather recall this
information concerning both brands, two existing articles of highly credible German-
language newspapers are combined. In addition, respondents are informed about the
source and are exposed to a picture of cited newspapers speculating that memories
of this picture increase the credibility of the fictional treatments.
Figure 3: Experimental design
Phase 1
Phase 2
Phase 3a
Phase 3b
Phase 4
Phase 5
Current usage (customer, non-customer) Introduction
Survey of actual attitudes (before)
Survey of changed attitudes (after)
Survey of socio-demographics
Ethical problem
Product failure
Evaluation of the critical incident
End
Questionnaire Nokia
Questionnaire Apple
Allocation of participants
Allocation of participants
Shortened article of an actual CI (Reference - RI; positioning data)
Evaluation of the critical incident
Evaluation of the CI
Presentation of two highly credible newspapers (dominant picture) and a statement that the following article consists of selected excerpts from them
Survey of actual attitudes (before)
T1 T2 T3
Ethical problem
Product failure
Evaluation of the CI
T1 T2 T3
Survey of changed attitudes (after)

Examining the success of manipulation and the influence of these mediators,
subsequent to every article presentation respondents evaluate their knowledge,
perceived credibility and criticality of the critical incident. The article presentation (one
per control group and two per treatment group) follows a second measurement of all
brand equity dimensions. Consequently, pretest results reflect actual attitudes to a
specific smartphone brand based on past perceptions and/or direct experiences,
whereas, the second measurement covers the reaction to critical incidents. Finally,
socio-demographics are collected.
4.2 Measures
According to Christodoulides and de Chernatony’s (2010) distinction between
indirect and direct approaches to measure CBBE, this study applies both to measure
attitudinal changes with regard to occurring critical incidents. Both indirect
approaches and direct approaches are measured using a seven-point Likert scale
(strongly disagree to strongly agree). Additionally, avoiding a forced choice, each
item offers an alternative no-answer-option. All multi-item measurement scales are
adopted from existing measures. In order to ensure that German translations are
appropriate, first, a group composed of 20 students translated the original measures.
Second, another group translated the most frequent translations of each item back
into English. Finally, the translation which corresponds more closely to the original
measures is chosen for each item.
The used perceived quality scale (PQU) is adopted from Yoo and Donthu (2001)
and consists of two items. The scale reflects the dimensions of perceived
functionality, which is usually a key benefit of technical devices, and perceived quality
of the corresponding smartphone brand.
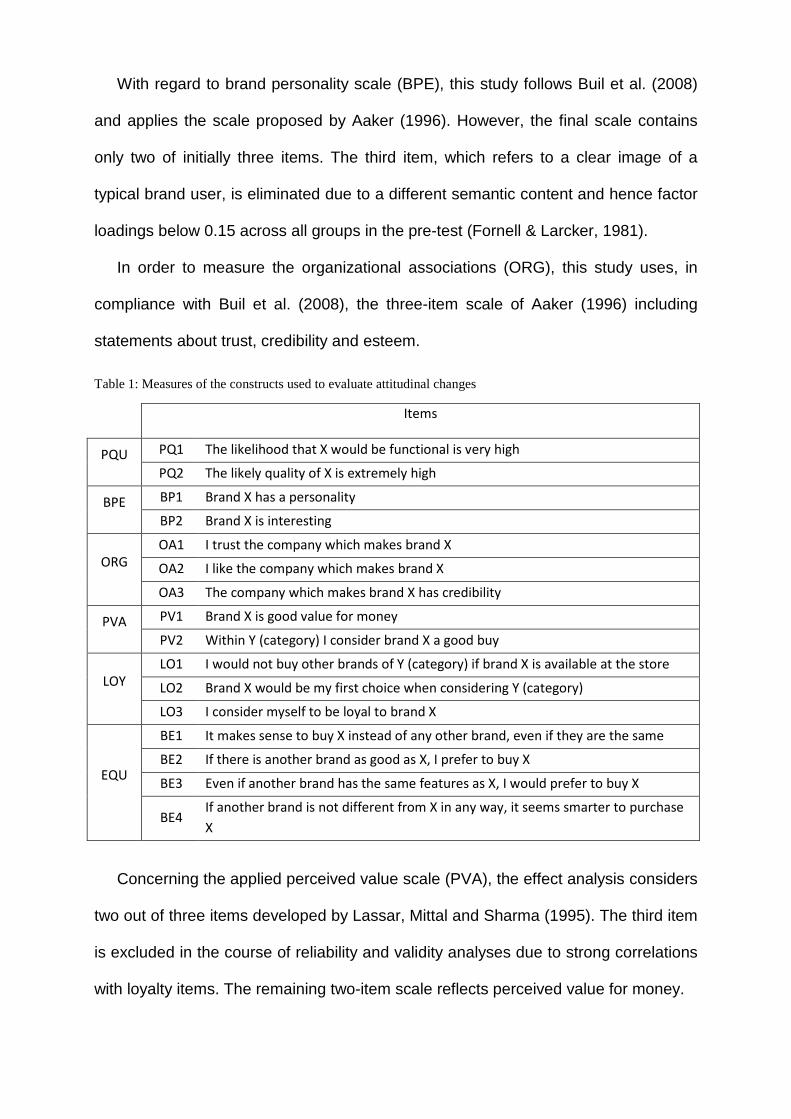
With regard to brand personality scale (BPE), this study follows Buil et al. (2008)
and applies the scale proposed by Aaker (1996). However, the final scale contains
only two of initially three items. The third item, which refers to a clear image of a
typical brand user, is eliminated due to a different semantic content and hence factor
loadings below 0.15 across all groups in the pre-test (Fornell & Larcker, 1981).
In order to measure the organizational associations (ORG), this study uses, in
compliance with Buil et al. (2008), the three-item scale of Aaker (1996) including
statements about trust, credibility and esteem.
Table 1: Measures of the constructs used to evaluate attitudinal changes
Items
PQU PQ1 The likelihood that X would be functional is very high
PQ2 The likely quality of X is extremely high
BPE BP1 Brand X has a personality
BP2 Brand X is interesting
ORG OA1 I trust the company which makes brand X
OA2 I like the company which makes brand X
OA3 The company which makes brand X has credibility
PVA PV1 Brand X is good value for money
PV2 Within Y (category) I consider brand X a good buy
LOY LO1 I would not buy other brands of Y (category) if brand X is available at the store
LO2 Brand X would be my first choice when considering Y (category)
LO3 I consider myself to be loyal to brand X
EQU
BE1 It makes sense to buy X instead of any other brand, even if they are the same
BE2 If there is another brand as good as X, I prefer to buy X
BE3 Even if another brand has the same features as X, I would prefer to buy X
BE4 If another brand is not different from X in any way, it seems smarter to purchase
X
Concerning the applied perceived value scale (PVA), the effect analysis considers
two out of three items developed by Lassar, Mittal and Sharma (1995). The third item
is excluded in the course of reliability and validity analyses due to strong correlations
with loyalty items. The remaining two-item scale reflects perceived value for money.

Both the applied loyalty scale and the used direct measurement of CBBE, the
overall brand equity scale, are adopted from Yoo et al. (2000). The three-item loyalty
scale includes statements about attitudinal loyalty. In contrast, the overall brand
equity scale consists of 4 items regarding brand preferences. Table 1 gives an
overview of all applied measures which are restricted to load only onto one
prespecified construct.
4.3 Model evaluation and hypotheses tests
Before evaluating the conceptual model, first, this study examines the assumption
of differences both in actual attitudes towards distinct brands and between loyal and
potential customers. Second, an analysis verifies the hypotheses that Nokia and
Apple have respectively low or high brand equity. For these purposes, descriptive
statistics are compared and an ANOVA examines for each item whether associations
depend on group membership. Additionally, ANOVA includes multiple comparisons
with Bonferroni correction to test for significance of differences between individual
groups to assess hypothesis 10.
Following Hu and Bentler (1998), this study applies structure equation modeling
(SEM) to evaluate the fit of the proposed model. More precisely, this study uses
LISREL with mean structures in order to consider item means and invariance across
samples or time according to Baumgartner and Steenkamp (2006). In other words,
this means configural, metric, strong factorial and strict factorial invariance are
sequently analyzed using multi-sample-analyses based on covariances and means.
The estimated parameters (Maximum Likelihood Estimation) show the effect of
variables in an absolute sense and are used to compare similar models in other
populations (Bagozzi, 1977). If the proposed model is adequate, the respective
exogenous and endogenous measurement models are evaluated seperately. Due to
Sörbom’s (1974) extension of the classical model of factorial invariance, these
separate models are necessary to identify differences in both exogenous and
endogenous latent variables. Consequently, the fit and invariance of these
measurement models are also examined across groups.
The evaluation starts examining reliability and validity of the measurement model.
During the further course, the significance, sign and level of each estimated path
coefficient are considered and interpreted with regards to hypotheses 1 to 6.
Model evaluation follows an analysis of potential mediators such as knowledge,
credibility and criticality. Between-subject-effects are examined using ANOVA and
multiple comparisons with Bonferroni correction. Within-subject-effects of paired
samples are analyzed to identify differences in perceptions of distinct incidents
(reference incident (RI) to corruption (T2) or product failure (T3)).
Immediate attitudinal changes triggered by various CI and invariance over time
(pre-posttest) are examined using LISREL with mean structures. To evaluate the
reactions, differences in latent factor means (κ) are simultaneously estimated within
groups (pre-posttest). To obtain these group-specific differences, exogenous and
endogenous factor models are estimated seperately. Furthermore, the latent variable
mean (κ) of the pretest, including all respondents within one group, is used as
reference point and consequently set (fixed) to be zero. In contrast, κ is set to be free
regarding all treatment groups. Additionally, the factor loadings (λ), intercept terms (τ)
and measurement errors (δ) are declared to be invariant between pre- and posttest
measurement. As a result, latent variables are uniformly scaled within one
simultaneously estimated group regardless of treatments. Consequently, absolute
differences in latent factor means caused by various CI are directly comparable.
5 Sample
5.1 Data collection and profile of respondents
The data are collected online using a snowball-sampling. For this purpose, an
internet link was spread via student mailing lists asking them to forward it via
Facebook to friends. A total of 1,122 usable completed responses were gathered.
657 out of these 1,122 respondents (58.6%) used a smartphone at the date of the
survey. Remaining treatments unconsidered, in comparison to 252 responses of
current customers and 256 of non-customers regarding the Nokia survey, 227 current
customer and 387 non-customer responses are collected regarding the Apple survey.
The demographic results are similar in all four groups with regard to gender (��(3)
= 4.38; .224) and age (��(18) = 28.36; .057) using Pearson chi-square tests and
comparisons of column proportions with adjusted p-values (Bonferroni method, p <
.05). In general, the sample is balanced with a proportion of 49.4% female to 50.6%
male respondents. However, the age cohort of 21- to 30-year old respondents is
over-represented with 78.5 percent. Due to the addressing of students first, the
sample includes an above-average share of 74.2% being students. Therefore, the
lowest income group is over-represented with 63.7% including people who have no
more than 1,000€ net income per month. Regarding monthly net income, chi-square
test results reveal differences across groups (��(9) = 33.94; .000), but comparisons
of column proportions show that only the Apple-customer group differs significantly
from the remaining three comparable groups (see Table 2).
This means while the proportion of low paid persons earning monthly a maximum
of 1,000€ is significant smaller in the Apple customers group, persons with a net
income between 1,001€ and 2,000€ are over-represented in comparison to other
groups. These higher incomes reflect the significant higher proportion of employed
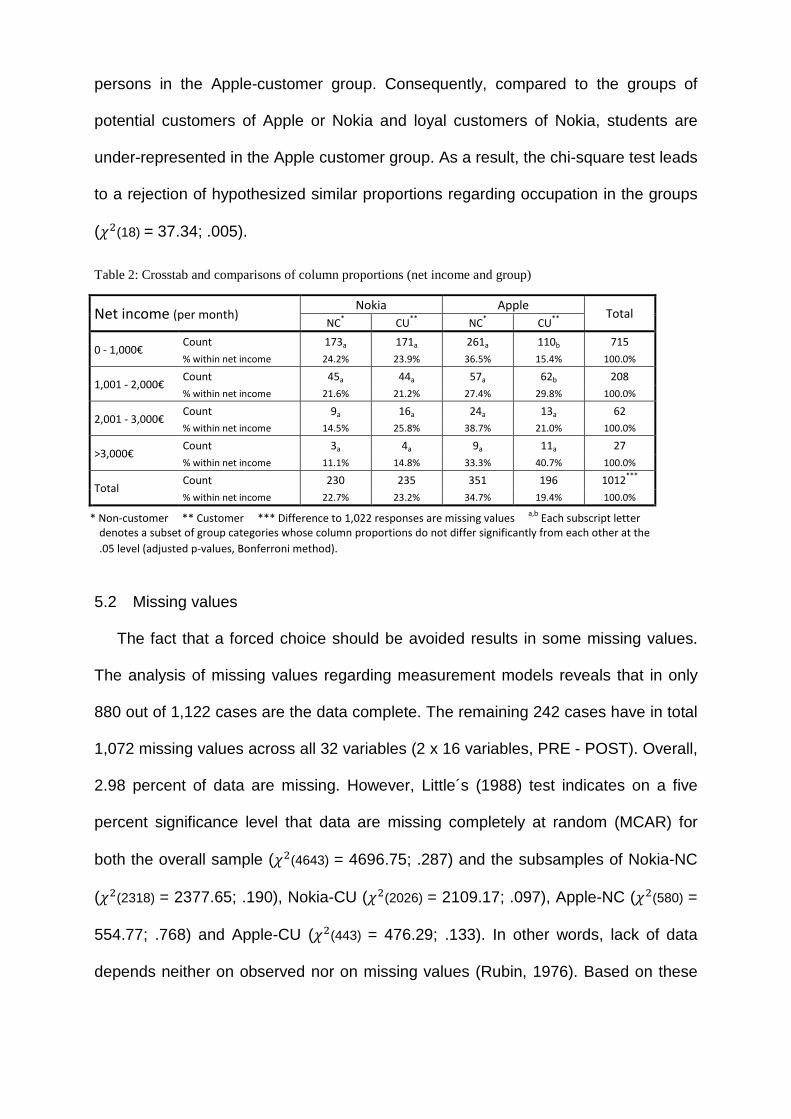
persons in the Apple-customer group. Consequently, compared to the groups of
potential customers of Apple or Nokia and loyal customers of Nokia, students are
under-represented in the Apple customer group. As a result, the chi-square test leads
to a rejection of hypothesized similar proportions regarding occupation in the groups
(��(18) = 37.34; .005).
Table 2: Crosstab and comparisons of column proportions (net income and group)
Net income (per month) Nokia Apple
Total NC
* CU
** NC
* CU
**
0 - 1,000€ Count 173a 171a 261a 110b 715
% within net income 24.2% 23.9% 36.5% 15.4% 100.0%
1,001 - 2,000€ Count 45a 44a 57a 62b 208
% within net income 21.6% 21.2% 27.4% 29.8% 100.0%
2,001 - 3,000€ Count 9a 16a 24a 13a 62
% within net income 14.5% 25.8% 38.7% 21.0% 100.0%
>3,000€ Count 3a 4a 9a 11a 27
% within net income 11.1% 14.8% 33.3% 40.7% 100.0%
Total Count 230 235 351 196 1012
***
% within net income 22.7% 23.2% 34.7% 19.4% 100.0%
* Non-customer ** Customer *** Difference to 1,022 responses are missing values a,b
Each subscript letter
denotes a subset of group categories whose column proportions do not differ significantly from each other at the
.05 level (adjusted p-values, Bonferroni method).
5.2 Missing values
The fact that a forced choice should be avoided results in some missing values.
The analysis of missing values regarding measurement models reveals that in only
880 out of 1,122 cases are the data complete. The remaining 242 cases have in total
1,072 missing values across all 32 variables (2 x 16 variables, PRE - POST). Overall,
2.98 percent of data are missing. However, Little´s (1988) test indicates on a five
percent significance level that data are missing completely at random (MCAR) for
both the overall sample (��(4643) = 4696.75; .287) and the subsamples of Nokia-NC
(��(2318) = 2377.65; .190), Nokia-CU (��(2026) = 2109.17; .097), Apple-NC (��(580) =
554.77; .768) and Apple-CU (��(443) = 476.29; .133). In other words, lack of data
depends neither on observed nor on missing values (Rubin, 1976). Based on these
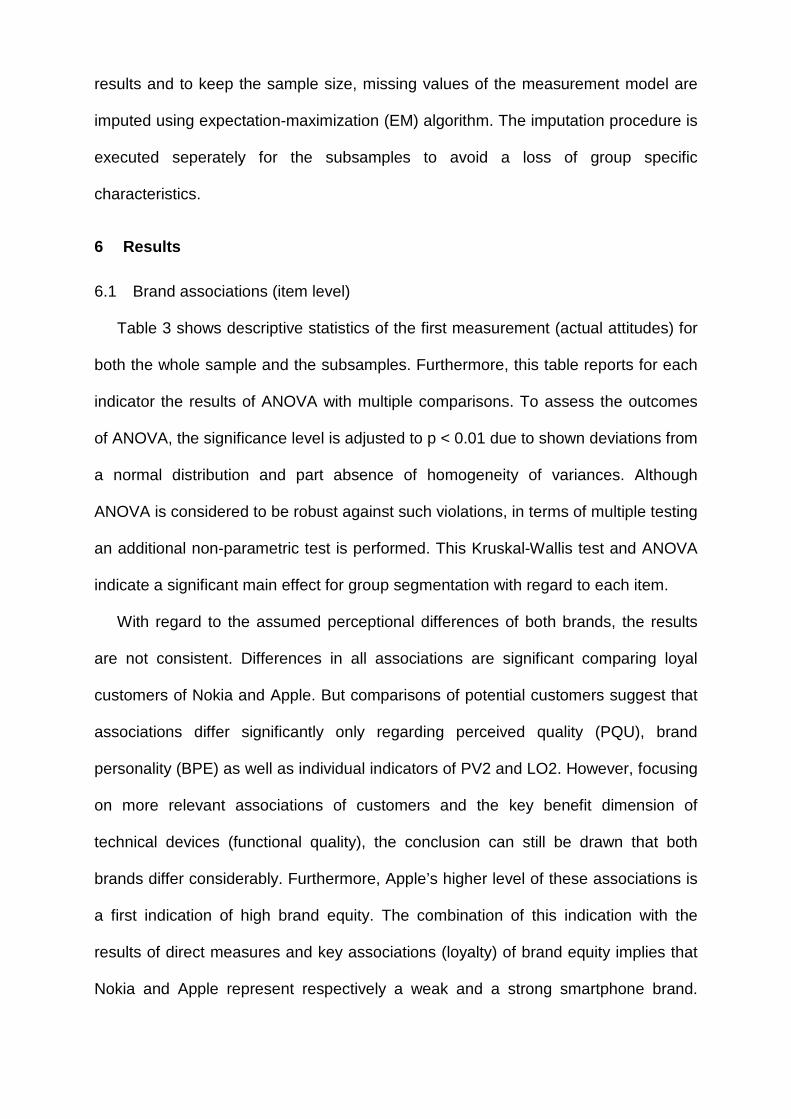
results and to keep the sample size, missing values of the measurement model are
imputed using expectation-maximization (EM) algorithm. The imputation procedure is
executed seperately for the subsamples to avoid a loss of group specific
characteristics.
6 Results
6.1 Brand associations (item level)
Table 3 shows descriptive statistics of the first measurement (actual attitudes) for
both the whole sample and the subsamples. Furthermore, this table reports for each
indicator the results of ANOVA with multiple comparisons. To assess the outcomes
of ANOVA, the significance level is adjusted to p < 0.01 due to shown deviations from
a normal distribution and part absence of homogeneity of variances. Although
ANOVA is considered to be robust against such violations, in terms of multiple testing
an additional non-parametric test is performed. This Kruskal-Wallis test and ANOVA
indicate a significant main effect for group segmentation with regard to each item.
With regard to the assumed perceptional differences of both brands, the results
are not consistent. Differences in all associations are significant comparing loyal
customers of Nokia and Apple. But comparisons of potential customers suggest that
associations differ significantly only regarding perceived quality (PQU), brand
personality (BPE) as well as individual indicators of PV2 and LO2. However, focusing
on more relevant associations of customers and the key benefit dimension of
technical devices (functional quality), the conclusion can still be drawn that both
brands differ considerably. Furthermore, Apple’s higher level of these associations is
a first indication of high brand equity. The combination of this indication with the
results of direct measures and key associations (loyalty) of brand equity implies that
Nokia and Apple represent respectively a weak and a strong smartphone brand.
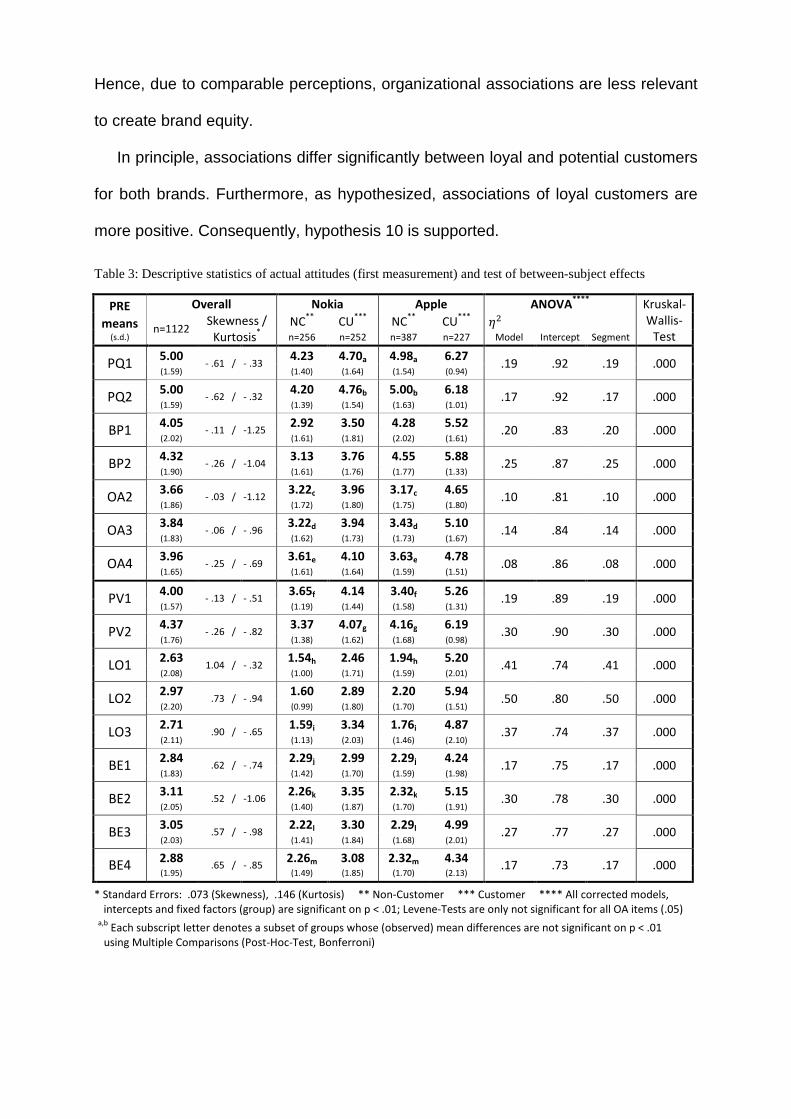
Hence, due to comparable perceptions, organizational associations are less relevant
to create brand equity.
In principle, associations differ significantly between loyal and potential customers
for both brands. Furthermore, as hypothesized, associations of loyal customers are
more positive. Consequently, hypothesis 10 is supported.
Table 3: Descriptive statistics of actual attitudes (first measurement) and test of between-subject effects
PRE
means (s.d.)
Overall Nokia Apple ANOVA****
Kruskal-
Wallis-
Test n=1122
Skewness /
Kurtosis*
NC**
CU***
NC**
CU***
�� n=256 n=252 n=387 n=227 Model Intercept Segment
PQ1 5.00
- .61 / - .33 4.23 4.70a 4.98a 6.27
.19 .92 .19 .000 (1.59) (1.40) (1.64) (1.54) (0.94)
PQ2 5.00
- .62 / - .32 4.20 4.76b 5.00b 6.18
.17 .92 .17 .000 (1.59) (1.39) (1.54) (1.63) (1.01)
BP1 4.05
- .11 / -1.25 2.92 3.50 4.28 5.52
.20 .83 .20 .000 (2.02) (1.61) (1.81) (2.02) (1.61)
BP2 4.32
- .26 / -1.04 3.13 3.76 4.55 5.88
.25 .87 .25 .000 (1.90) (1.61) (1.76) (1.77) (1.33)
OA2 3.66
- .03 / -1.12 3.22c 3.96 3.17c 4.65
.10 .81 .10 .000 (1.86) (1.72) (1.80) (1.75) (1.80)
OA3 3.84
- .06 / - .96 3.22d 3.94 3.43d 5.10
.14 .84 .14 .000 (1.83) (1.62) (1.73) (1.73) (1.67)
OA4 3.96
- .25 / - .69 3.61e 4.10 3.63e 4.78
.08 .86 .08 .000 (1.65) (1.61) (1.64) (1.59) (1.51)
PV1 4.00
- .13 / - .51 3.65f 4.14 3.40f 5.26
.19 .89 .19 .000 (1.57) (1.19) (1.44) (1.58) (1.31)
PV2 4.37
- .26 / - .82 3.37 4.07g 4.16g 6.19
.30 .90 .30 .000 (1.76) (1.38) (1.62) (1.68) (0.98)
LO1 2.63
1.04 / - .32 1.54h 2.46 1.94h 5.20
.41 .74 .41 .000 (2.08) (1.00) (1.71) (1.59) (2.01)
LO2 2.97
.73 / - .94 1.60 2.89 2.20 5.94
.50 .80 .50 .000 (2.20) (0.99) (1.80) (1.70) (1.51)
LO3 2.71
.90 / - .65 1.59i 3.34 1.76i 4.87
.37 .74 .37 .000 (2.11) (1.13) (2.03) (1.46) (2.10)
BE1 2.84
.62 / - .74 2.29j 2.99 2.29j 4.24
.17 .75 .17 .000 (1.83) (1.42) (1.70) (1.59) (1.98)
BE2 3.11
.52 / -1.06 2.26k 3.35 2.32k 5.15
.30 .78 .30 .000 (2.05) (1.40) (1.87) (1.70) (1.91)
BE3 3.05
.57 / - .98 2.22l 3.30 2.29l 4.99
.27 .77 .27 .000 (2.03) (1.41) (1.84) (1.68) (2.01)
BE4 2.88
.65 / - .85 2.26m 3.08 2.32m 4.34
.17 .73 .17 .000 (1.95) (1.49) (1.85) (1.70) (2.13)
* Standard Errors: .073 (Skewness), .146 (Kurtosis) ** Non-Customer *** Customer **** All corrected models,
intercepts and fixed factors (group) are significant on p < .01; Levene-Tests are only not significant for all OA items (.05) a,b
Each subscript letter denotes a subset of groups whose (observed) mean differences are not significant on p < .01
using Multiple Comparisons (Post-Hoc-Test, Bonferroni)
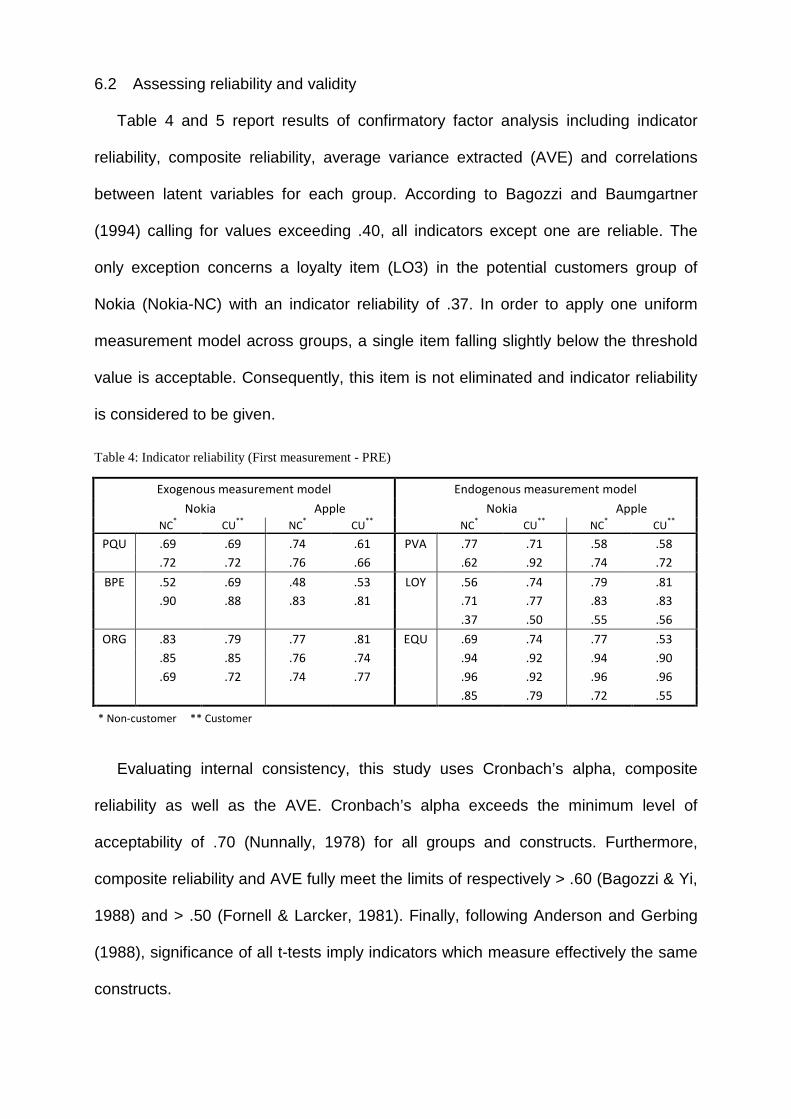
6.2 Assessing reliability and validity
Table 4 and 5 report results of confirmatory factor analysis including indicator
reliability, composite reliability, average variance extracted (AVE) and correlations
between latent variables for each group. According to Bagozzi and Baumgartner
(1994) calling for values exceeding .40, all indicators except one are reliable. The
only exception concerns a loyalty item (LO3) in the potential customers group of
Nokia (Nokia-NC) with an indicator reliability of .37. In order to apply one uniform
measurement model across groups, a single item falling slightly below the threshold
value is acceptable. Consequently, this item is not eliminated and indicator reliability
is considered to be given.
Table 4: Indicator reliability (First measurement - PRE)
Exogenous measurement model Endogenous measurement model
Nokia Apple Nokia Apple
NC
* CU
** NC
* CU
**
NC
* CU
** NC
* CU
**
PQU .69 .69 .74 .61 PVA .77 .71 .58 .58
.72 .72 .76 .66
.62 .92 .74 .72
BPE .52 .69 .48 .53 LOY .56 .74 .79 .81
.90 .88 .83 .81
.71 .77 .83 .83
.37 .50 .55 .56
ORG .83 .79 .77 .81 EQU .69 .74 .77 .53
.85 .85 .76 .74
.94 .92 .94 .90
.69 .72 .74 .77
.96 .92 .96 .96
.85 .79 .72 .55
* Non-customer ** Customer
Evaluating internal consistency, this study uses Cronbach’s alpha, composite
reliability as well as the AVE. Cronbach’s alpha exceeds the minimum level of
acceptability of .70 (Nunnally, 1978) for all groups and constructs. Furthermore,
composite reliability and AVE fully meet the limits of respectively > .60 (Bagozzi & Yi,
1988) and > .50 (Fornell & Larcker, 1981). Finally, following Anderson and Gerbing
(1988), significance of all t-tests imply indicators which measure effectively the same
constructs.
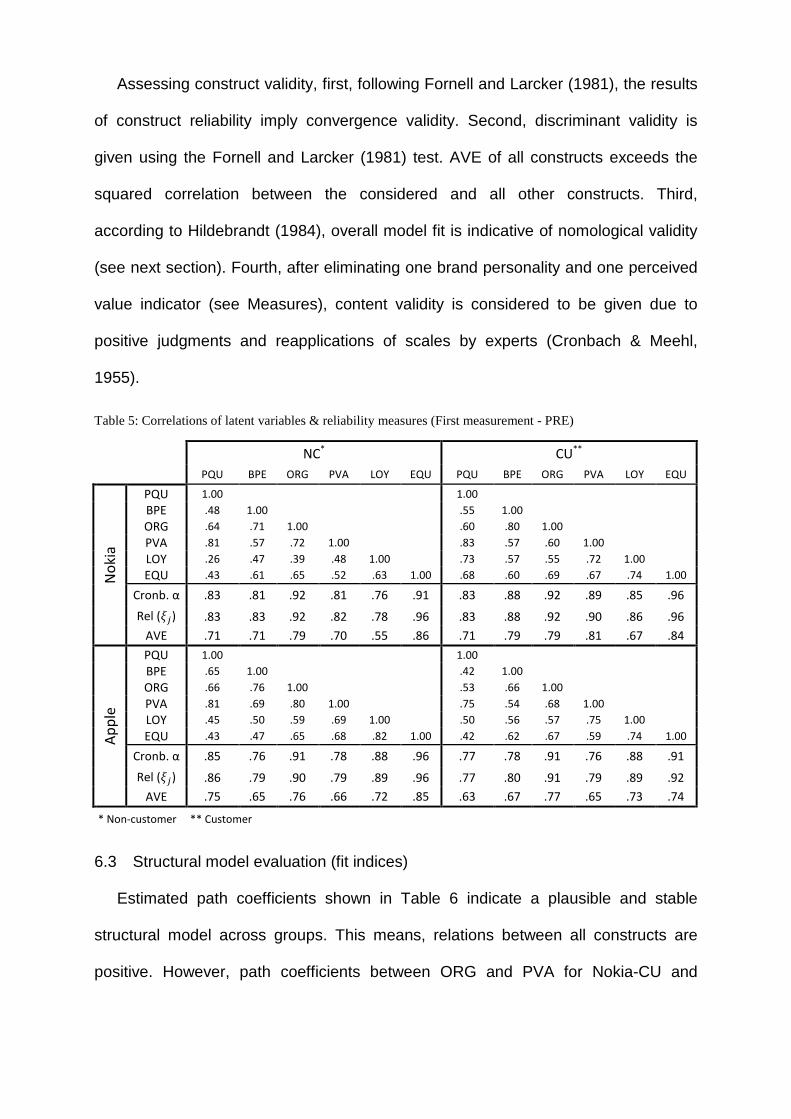
Assessing construct validity, first, following Fornell and Larcker (1981), the results
of construct reliability imply convergence validity. Second, discriminant validity is
given using the Fornell and Larcker (1981) test. AVE of all constructs exceeds the
squared correlation between the considered and all other constructs. Third,
according to Hildebrandt (1984), overall model fit is indicative of nomological validity
(see next section). Fourth, after eliminating one brand personality and one perceived
value indicator (see Measures), content validity is considered to be given due to
positive judgments and reapplications of scales by experts (Cronbach & Meehl,
1955).
Table 5: Correlations of latent variables & reliability measures (First measurement - PRE)
NC* CU**
PQU BPE ORG PVA LOY EQU PQU BPE ORG PVA LOY EQU
No
kia
PQU 1.00
1.00
BPE .48 1.00
.55 1.00
ORG .64 .71 1.00
.60 .80 1.00
PVA .81 .57 .72 1.00
.83 .57 .60 1.00
LOY .26 .47 .39 .48 1.00
.73 .57 .55 .72 1.00
EQU .43 .61 .65 .52 .63 1.00 .68 .60 .69 .67 .74 1.00
Cronb. α .83 .81 .92 .81 .76 .91 .83 .88 .92 .89 .85 .96
Rel (��) .83 .83 .92 .82 .78 .96 .83 .88 .92 .90 .86 .96
AVE .71 .71 .79 .70 .55 .86 .71 .79 .79 .81 .67 .84
Ap
ple
PQU 1.00
1.00
BPE .65 1.00
.42 1.00
ORG .66 .76 1.00
.53 .66 1.00
PVA .81 .69 .80 1.00
.75 .54 .68 1.00
LOY .45 .50 .59 .69 1.00
.50 .56 .57 .75 1.00
EQU .43 .47 .65 .68 .82 1.00 .42 .62 .67 .59 .74 1.00
Cronb. α .85 .76 .91 .78 .88 .96 .77 .78 .91 .76 .88 .91
Rel (��) .86 .79 .90 .79 .89 .96 .77 .80 .91 .79 .89 .92
AVE .75 .65 .76 .66 .72 .85 .63 .67 .77 .65 .73 .74
* Non-customer ** Customer
6.3 Structural model evaluation (fit indices)
Estimated path coefficients shown in Table 6 indicate a plausible and stable
structural model across groups. This means, relations between all constructs are
positive. However, path coefficients between ORG and PVA for Nokia-CU and
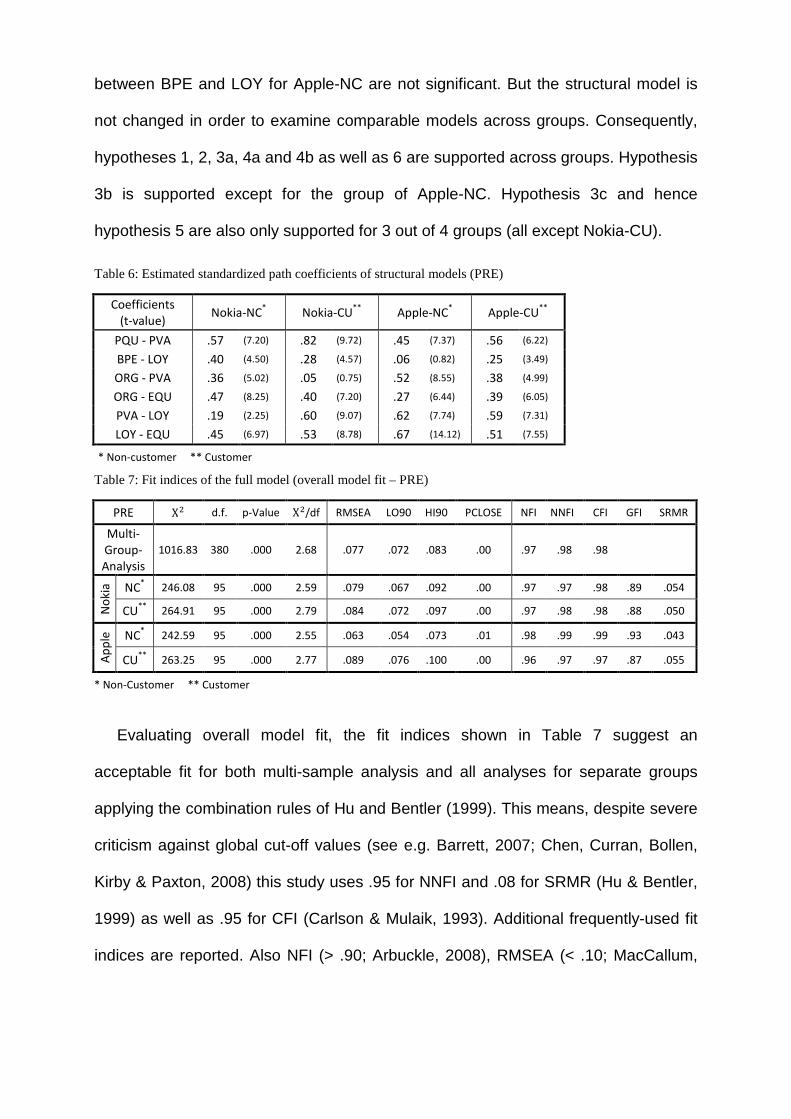
between BPE and LOY for Apple-NC are not significant. But the structural model is
not changed in order to examine comparable models across groups. Consequently,
hypotheses 1, 2, 3a, 4a and 4b as well as 6 are supported across groups. Hypothesis
3b is supported except for the group of Apple-NC. Hypothesis 3c and hence
hypothesis 5 are also only supported for 3 out of 4 groups (all except Nokia-CU).
Table 6: Estimated standardized path coefficients of structural models (PRE)
Coefficients
(t-value) Nokia-NC
* Nokia-CU
** Apple-NC
* Apple-CU
**
PQU - PVA .57 (7.20) .82 (9.72) .45 (7.37) .56 (6.22)
BPE - LOY .40 (4.50) .28 (4.57) .06 (0.82) .25 (3.49)
ORG - PVA .36 (5.02) .05 (0.75) .52 (8.55) .38 (4.99)
ORG - EQU .47 (8.25) .40 (7.20) .27 (6.44) .39 (6.05)
PVA - LOY .19 (2.25) .60 (9.07) .62 (7.74) .59 (7.31)
LOY - EQU .45 (6.97) .53 (8.78) .67 (14.12) .51 (7.55)
* Non-customer ** Customer
Table 7: Fit indices of the full model (overall model fit – PRE)
PRE Χ� d.f. p-Value Χ�/df RMSEA LO90 HI90 PCLOSE NFI NNFI CFI GFI SRMR
Multi-
Group-
Analysis
1016.83 380 .000 2.68 .077 .072 .083 .00 .97 .98 .98
No
kia NC
* 246.08 95 .000 2.59 .079 .067 .092 .00 .97 .97 .98 .89 .054
CU**
264.91 95 .000 2.79 .084 .072 .097 .00 .97 .98 .98 .88 .050
Ap
ple
NC* 242.59 95 .000 2.55 .063 .054 .073 .01 .98 .99 .99 .93 .043
CU**
263.25 95 .000 2.77 .089 .076 .100 .00 .96 .97 .97 .87 .055
* Non-Customer ** Customer
Evaluating overall model fit, the fit indices shown in Table 7 suggest an
acceptable fit for both multi-sample analysis and all analyses for separate groups
applying the combination rules of Hu and Bentler (1999). This means, despite severe
criticism against global cut-off values (see e.g. Barrett, 2007; Chen, Curran, Bollen,
Kirby & Paxton, 2008) this study uses .95 for NNFI and .08 for SRMR (Hu & Bentler,
1999) as well as .95 for CFI (Carlson & Mulaik, 1993). Additional frequently-used fit
indices are reported. Also NFI (> .90; Arbuckle, 2008), RMSEA (< .10; MacCallum,
Browne & Sugawara, 1996) and chi-square-value divided by degrees of freedom
(��/d.f. < 3; Homburg & Giering, 1996) indicate an acceptable fit.
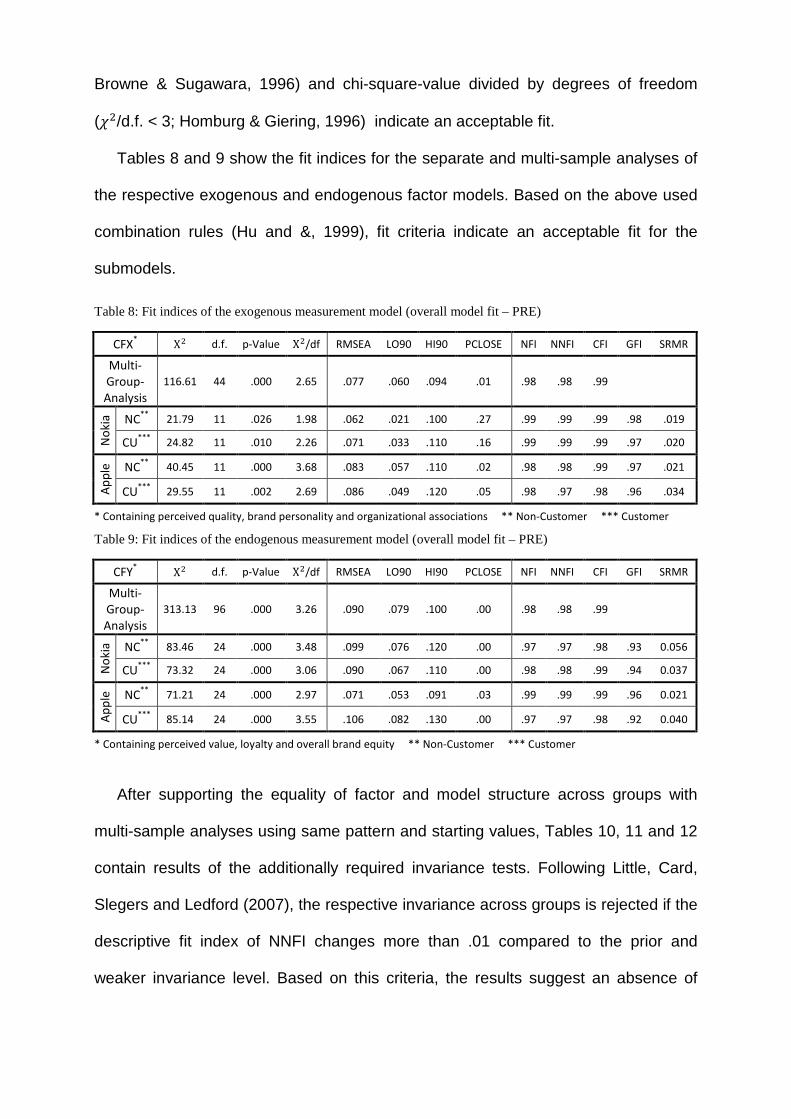
Tables 8 and 9 show the fit indices for the separate and multi-sample analyses of
the respective exogenous and endogenous factor models. Based on the above used
combination rules (Hu and &, 1999), fit criteria indicate an acceptable fit for the
submodels.
Table 8: Fit indices of the exogenous measurement model (overall model fit – PRE)
CFX* Χ� d.f. p-Value Χ�/df RMSEA LO90 HI90 PCLOSE NFI NNFI CFI GFI SRMR
Multi-
Group-
Analysis
116.61 44 .000 2.65 .077 .060 .094 .01 .98 .98 .99
No
kia NC
** 21.79 11 .026 1.98 .062 .021 .100 .27 .99 .99 .99 .98 .019
CU***
24.82 11 .010 2.26 .071 .033 .110 .16 .99 .99 .99 .97 .020
Ap
ple
NC**
40.45 11 .000 3.68 .083 .057 .110 .02 .98 .98 .99 .97 .021
CU***
29.55 11 .002 2.69 .086 .049 .120 .05 .98 .97 .98 .96 .034
* Containing perceived quality, brand personality and organizational associations ** Non-Customer *** Customer
Table 9: Fit indices of the endogenous measurement model (overall model fit – PRE)
CFY* Χ� d.f. p-Value Χ�/df RMSEA LO90 HI90 PCLOSE NFI NNFI CFI GFI SRMR
Multi-
Group-
Analysis
313.13 96 .000 3.26 .090 .079 .100 .00 .98 .98 .99
No
kia NC
** 83.46 24 .000 3.48 .099 .076 .120 .00 .97 .97 .98 .93 0.056
CU***
73.32 24 .000 3.06 .090 .067 .110 .00 .98 .98 .99 .94 0.037
Ap
ple
NC**
71.21 24 .000 2.97 .071 .053 .091 .03 .99 .99 .99 .96 0.021
CU***
85.14 24 .000 3.55 .106 .082 .130 .00 .97 .97 .98 .92 0.040
* Containing perceived value, loyalty and overall brand equity ** Non-Customer *** Customer
After supporting the equality of factor and model structure across groups with
multi-sample analyses using same pattern and starting values, Tables 10, 11 and 12
contain results of the additionally required invariance tests. Following Little, Card,
Slegers and Ledford (2007), the respective invariance across groups is rejected if the
descriptive fit index of NNFI changes more than .01 compared to the prior and
weaker invariance level. Based on this criteria, the results suggest an absence of
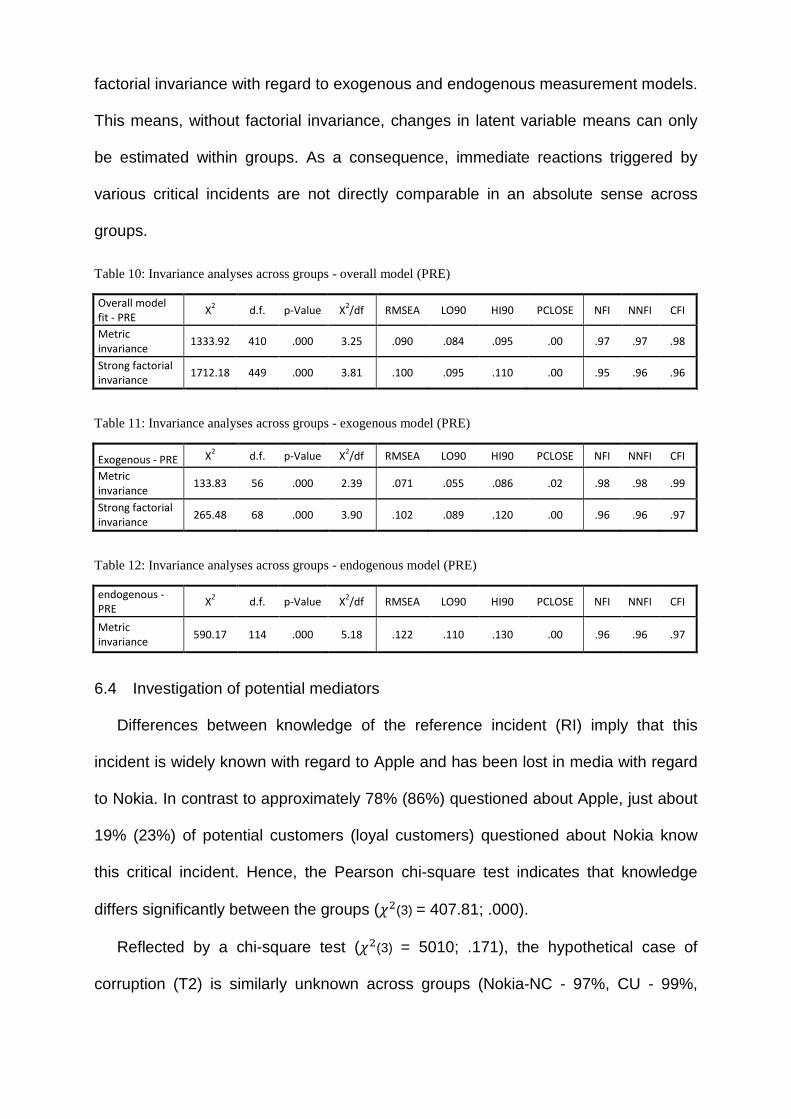
factorial invariance with regard to exogenous and endogenous measurement models.
This means, without factorial invariance, changes in latent variable means can only
be estimated within groups. As a consequence, immediate reactions triggered by
various critical incidents are not directly comparable in an absolute sense across
groups.
Table 10: Invariance analyses across groups - overall model (PRE)
Overall model
fit - PRE X
2 d.f. p-Value X
2/df RMSEA LO90 HI90 PCLOSE NFI NNFI CFI
Metric
invariance 1333.92 410 .000 3.25 .090 .084 .095 .00 .97 .97 .98
Strong factorial
invariance 1712.18 449 .000 3.81 .100 .095 .110 .00 .95 .96 .96
Table 11: Invariance analyses across groups - exogenous model (PRE)
Exogenous - PRE X2 d.f. p-Value X
2/df RMSEA LO90 HI90 PCLOSE NFI NNFI CFI
Metric
invariance 133.83 56 .000 2.39 .071 .055 .086 .02 .98 .98 .99
Strong factorial
invariance 265.48 68 .000 3.90 .102 .089 .120 .00 .96 .96 .97
Table 12: Invariance analyses across groups - endogenous model (PRE)
endogenous -
PRE X
2 d.f. p-Value X
2/df RMSEA LO90 HI90 PCLOSE NFI NNFI CFI
Metric
invariance 590.17 114 .000 5.18 .122 .110 .130 .00 .96 .96 .97
6.4 Investigation of potential mediators
Differences between knowledge of the reference incident (RI) imply that this
incident is widely known with regard to Apple and has been lost in media with regard
to Nokia. In contrast to approximately 78% (86%) questioned about Apple, just about
19% (23%) of potential customers (loyal customers) questioned about Nokia know
this critical incident. Hence, the Pearson chi-square test indicates that knowledge
differs significantly between the groups (��(3) = 407.81; .000).
Reflected by a chi-square test (��(3) = 5010; .171), the hypothetical case of
corruption (T2) is similarly unknown across groups (Nokia-NC - 97%, CU - 99%,

Apple-NC - 93% and CU - 96%). Due to better known hypothetical product failure
(T3) regarding Apple, variations are unexpectedly significant (��(3) = 23.71; .000).
Although this critical incident is based on an event which happened to Nokia several
years ago, 29% (32%) of Apple respondents claim to know the incident in contrast to
9% (14%) of potential (loyal) customers of Nokia.
Table 13: Descriptive statistics for evaluations of the actual incident and test of between-subject (group) effects
RI
means (s.d.)
Overall Nokia Apple ANOVA****
Kruskal-
Wallis-
Test n=1122
Skewness /
Kurtosis*
NC**
CU***
NC**
CU***
�� n=256 n=252 n=387 n=227 Model Intercept Segment
Credibility 5.07
- .47 / - .47 5.08a 5.00a 5.06a 5.16a
x x x .563 (1.53) (1.48) (1.47) (1.63) (1.48)
Criticality 5.48
- .93 / .18 5.82b 5.64b 5.72b 4.53
.10 .93 .10 .000 (1.54) (1.37) (1.41) (1.41) (1.69)
* Standard Errors: .073 (Skewness), .146 (Kurtosis) ** Non-Customer *** Customer **** All shown corrected
models, intercepts and fixed factors (groups) are significant on p < .01; Levene-Test is only not significant for credibility
(p < .05)
a,b Each subscript letter denotes a subset of groups whose (observed) mean differences are not significant on p < .01 using
Multiple Comparisons (Post-Hoc-Test, Bonferroni)
Against this background, varying credibility is expected between brands for the
reference incident and the product failure. However, analyses of potential mediators
do not indicate significant variations between groups (see Table 13 to 15).
Comparing both hypothetical incidents within groups reveals that credibility differs
significantly between subjects for loyal Apple and Nokia customers (see Table 16).
Table 14: Descriptive statistics for evaluations of corruption and test of between-subject (group) effects
T2
means (s.d.)
Overall Nokia Apple ANOVA****
Kruskal-
Wallis-
Test n=427
Skewness /
Kurtosis*
NC**
CU***
NC**
CU***
�� n=105 n=91 n=151 n=80 Model Intercept Segment
Credibility 4.77
- .09 / - .35 5.02a 4.60a 4.78a 4.60a
x x x .114 (1.24) (1.19) (1.33) (1.18) (1.29)
Criticality 5.19
- .52 / - .20 5.29b 5.19b 5.47b 4.51
.06 .93 .06 .000 (1.41) (1.39) (1.46) (1.27) (1.44)
* Standard Errors: .118 (Skewness), .236 (Kurtosis) ** Non-Customer *** Customer **** All shown corrected
models, intercepts and fixed factors (segment) are significant on p < .01; Levene-Test is not significant for both items
(p < .05)
a,b Each subscript letter denotes a subset of groups whose (observed) mean differences are not significant on p < .01 using
Multiple Comparisons (Post-Hoc-Test, Bonferroni)
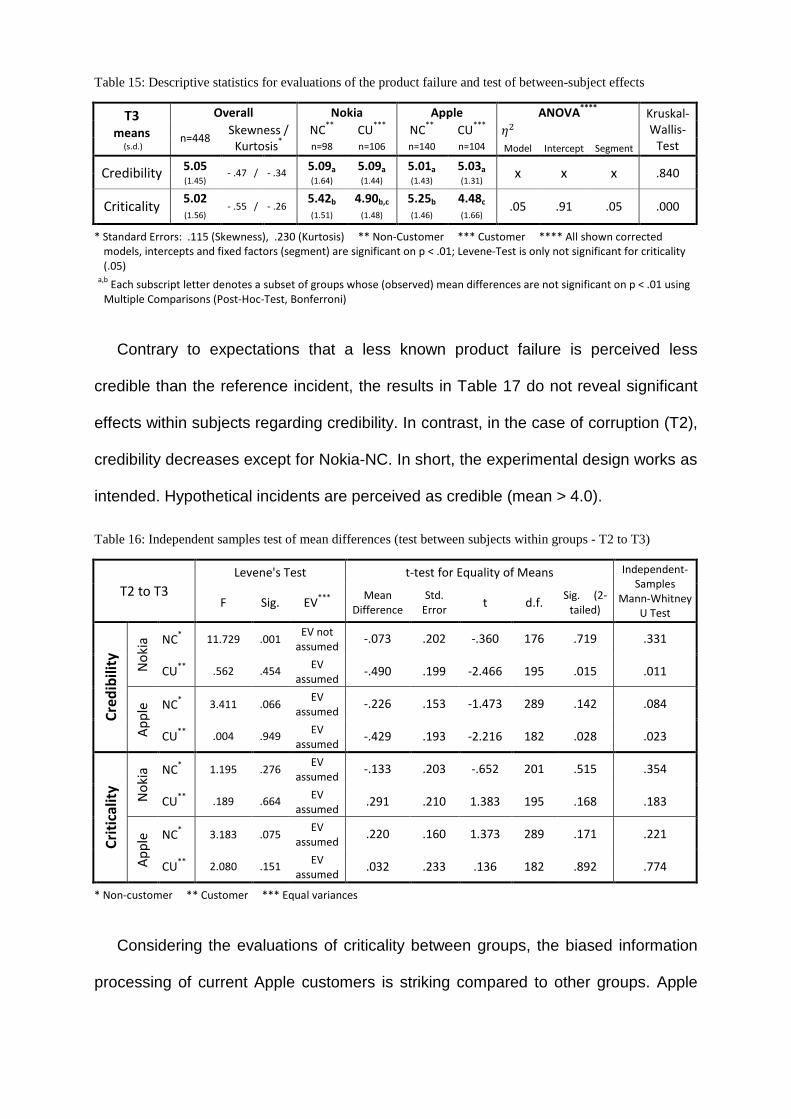
Table 15: Descriptive statistics for evaluations of the product failure and test of between-subject effects
T3
means (s.d.)
Overall Nokia Apple ANOVA****
Kruskal-
Wallis-
Test n=448
Skewness /
Kurtosis*
NC**
CU***
NC**
CU***
�� n=98 n=106 n=140 n=104 Model Intercept Segment
Credibility 5.05
- .47 / - .34 5.09a 5.09a 5.01a 5.03a
x x x .840 (1.45) (1.64) (1.44) (1.43) (1.31)
Criticality 5.02
- .55 / - .26 5.42b 4.90b,c 5.25b 4.48c .05 .91 .05 .000
(1.56) (1.51) (1.48) (1.46) (1.66)
* Standard Errors: .115 (Skewness), .230 (Kurtosis) ** Non-Customer *** Customer **** All shown corrected
models, intercepts and fixed factors (segment) are significant on p < .01; Levene-Test is only not significant for criticality
(.05)
a,b Each subscript letter denotes a subset of groups whose (observed) mean differences are not significant on p < .01 using
Multiple Comparisons (Post-Hoc-Test, Bonferroni)
Contrary to expectations that a less known product failure is perceived less
credible than the reference incident, the results in Table 17 do not reveal significant
effects within subjects regarding credibility. In contrast, in the case of corruption (T2),
credibility decreases except for Nokia-NC. In short, the experimental design works as
intended. Hypothetical incidents are perceived as credible (mean > 4.0).
Table 16: Independent samples test of mean differences (test between subjects within groups - T2 to T3)
T2 to T3
Levene's Test t-test for Equality of Means Independent-
Samples
Mann-Whitney
U Test F Sig. EV
***
Mean
Difference
Std.
Error t d.f.
Sig. (2-
tailed)
Cre
dib
ilit
y
No
kia NC
* 11.729 .001
EV not
assumed -.073 .202 -.360 176 .719 .331
CU**
.562 .454 EV
assumed -.490 .199 -2.466 195 .015 .011
Ap
ple
NC* 3.411 .066
EV
assumed -.226 .153 -1.473 289 .142 .084
CU**
.004 .949 EV
assumed -.429 .193 -2.216 182 .028 .023
Cri
tica
lity
No
kia NC
* 1.195 .276
EV
assumed -.133 .203 -.652 201 .515 .354
CU**
.189 .664 EV
assumed .291 .210 1.383 195 .168 .183
Ap
ple
NC* 3.183 .075
EV
assumed .220 .160 1.373 289 .171 .221
CU**
2.080 .151 EV
assumed .032 .233 .136 182 .892 .774
* Non-customer ** Customer *** Equal variances
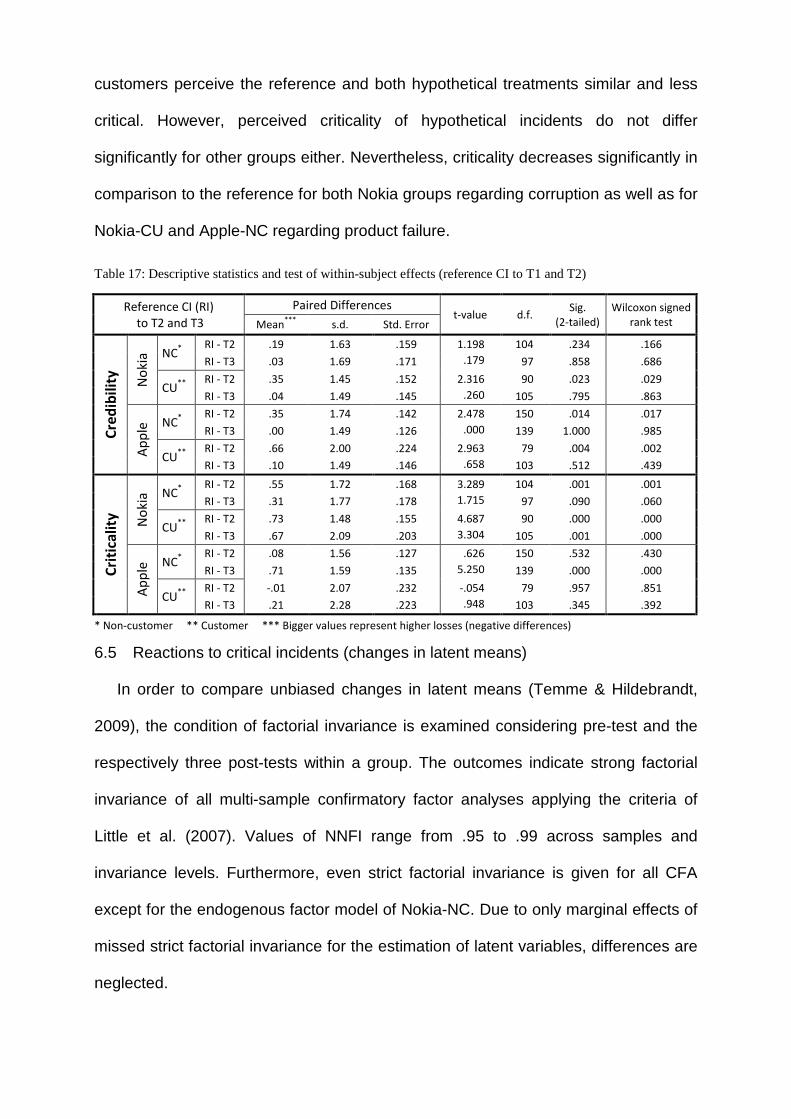
Considering the evaluations of criticality between groups, the biased information
processing of current Apple customers is striking compared to other groups. Apple
customers perceive the reference and both hypothetical treatments similar and less
critical. However, perceived criticality of hypothetical incidents do not differ
significantly for other groups either. Nevertheless, criticality decreases significantly in
comparison to the reference for both Nokia groups regarding corruption as well as for
Nokia-CU and Apple-NC regarding product failure.
Table 17: Descriptive statistics and test of within-subject effects (reference CI to T1 and T2)
Reference CI (RI)
to T2 and T3
Paired Differences t-value d.f.
Sig.
(2-tailed)
Wilcoxon signed
rank test Mean***
s.d. Std. Error
Cre
dib
ilit
y
No
kia NC
*
RI - T2 .19 1.63 .159 1.198 104 .234 .166
RI - T3 .03 1.69 .171 .179 97 .858 .686
CU**
RI - T2 .35 1.45 .152 2.316 90 .023 .029
RI - T3 .04 1.49 .145 .260 105 .795 .863
Ap
ple
NC*
RI - T2 .35 1.74 .142 2.478 150 .014 .017
RI - T3 .00 1.49 .126 .000 139 1.000 .985
CU**
RI - T2 .66 2.00 .224 2.963 79 .004 .002
RI - T3 .10 1.49 .146 .658 103 .512 .439
Cri
tica
lity
No
kia NC
*
RI - T2 .55 1.72 .168 3.289 104 .001 .001
RI - T3 .31 1.77 .178 1.715 97 .090 .060
CU**
RI - T2 .73 1.48 .155 4.687 90 .000 .000
RI - T3 .67 2.09 .203 3.304 105 .001 .000
Ap
ple
NC*
RI - T2 .08 1.56 .127 .626 150 .532 .430
RI - T3 .71 1.59 .135 5.250 139 .000 .000
CU**
RI - T2 -.01 2.07 .232 -.054 79 .957 .851
RI - T3 .21 2.28 .223 .948 103 .345 .392
* Non-customer ** Customer *** Bigger values represent higher losses (negative differences)
6.5 Reactions to critical incidents (changes in latent means)
In order to compare unbiased changes in latent means (Temme & Hildebrandt,
2009), the condition of factorial invariance is examined considering pre-test and the
respectively three post-tests within a group. The outcomes indicate strong factorial
invariance of all multi-sample confirmatory factor analyses applying the criteria of
Little et al. (2007). Values of NNFI range from .95 to .99 across samples and
invariance levels. Furthermore, even strict factorial invariance is given for all CFA
except for the endogenous factor model of Nokia-NC. Due to only marginal effects of
missed strict factorial invariance for the estimation of latent variables, differences are
neglected.
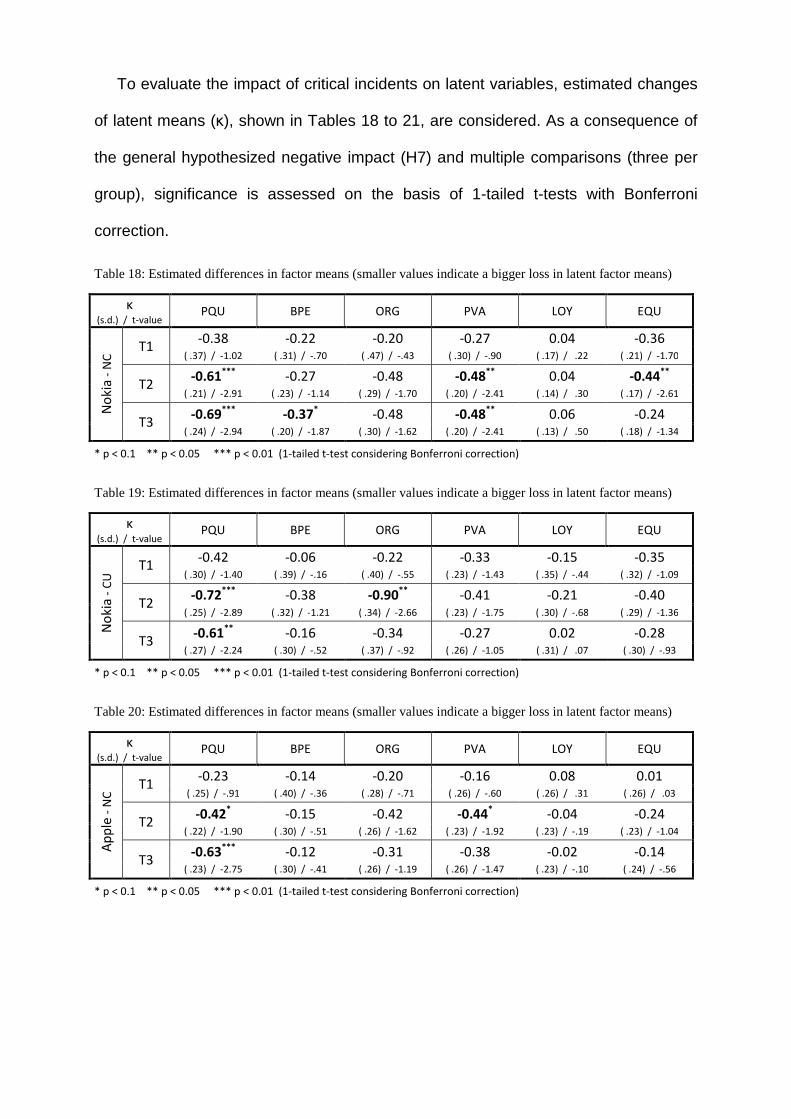
To evaluate the impact of critical incidents on latent variables, estimated changes
of latent means (κ), shown in Tables 18 to 21, are considered. As a consequence of
the general hypothesized negative impact (H7) and multiple comparisons (three per
group), significance is assessed on the basis of 1-tailed t-tests with Bonferroni
correction.
Table 18: Estimated differences in factor means (smaller values indicate a bigger loss in latent factor means)
κ (s.d.) / t-value
PQU BPE ORG PVA LOY EQU
No
kia
- N
C T1
-0.38 -0.22 -0.20 -0.27 0.04 -0.36 ( .37) / -1.02 ( .31) / -.70 ( .47) / -.43 ( .30) / -.90 ( .17) / .22 ( .21) / -1.70
T2 -0.61
*** -0.27 -0.48 -0.48
** 0.04 -0.44
**
( .21) / -2.91 ( .23) / -1.14 ( .29) / -1.70 ( .20) / -2.41 ( .14) / .30 ( .17) / -2.61
T3 -0.69
*** -0.37
* -0.48 -0.48
** 0.06 -0.24
( .24) / -2.94 ( .20) / -1.87 ( .30) / -1.62 ( .20) / -2.41 ( .13) / .50 ( .18) / -1.34
* p < 0.1 ** p < 0.05 *** p < 0.01 (1-tailed t-test considering Bonferroni correction)
Table 19: Estimated differences in factor means (smaller values indicate a bigger loss in latent factor means)
κ (s.d.) / t-value
PQU BPE ORG PVA LOY EQU
No
kia
- C
U T1
-0.42 -0.06 -0.22 -0.33 -0.15 -0.35 ( .30) / -1.40 ( .39) / -.16 ( .40) / -.55 ( .23) / -1.43 ( .35) / -.44 ( .32) / -1.09
T2 -0.72
*** -0.38 -0.90
** -0.41 -0.21 -0.40
( .25) / -2.89 ( .32) / -1.21 ( .34) / -2.66 ( .23) / -1.75 ( .30) / -.68 ( .29) / -1.36
T3 -0.61
** -0.16 -0.34 -0.27 0.02 -0.28 ( .27) / -2.24 ( .30) / -.52 ( .37) / -.92 ( .26) / -1.05 ( .31) / .07 ( .30) / -.93
* p < 0.1 ** p < 0.05 *** p < 0.01 (1-tailed t-test considering Bonferroni correction)
Table 20: Estimated differences in factor means (smaller values indicate a bigger loss in latent factor means)
κ (s.d.) / t-value
PQU BPE ORG PVA LOY EQU
Ap
ple
- N
C T1
-0.23 -0.14 -0.20 -0.16 0.08 0.01 ( .25) / -.91 ( .40) / -.36 ( .28) / -.71 ( .26) / -.60 ( .26) / .31 ( .26) / .03
T2 -0.42
* -0.15 -0.42 -0.44* -0.04 -0.24
( .22) / -1.90 ( .30) / -.51 ( .26) / -1.62 ( .23) / -1.92 ( .23) / -.19 ( .23) / -1.04
T3 -0.63
*** -0.12 -0.31 -0.38 -0.02 -0.14 ( .23) / -2.75 ( .30) / -.41 ( .26) / -1.19 ( .26) / -1.47 ( .23) / -.10 ( .24) / -.56
* p < 0.1 ** p < 0.05 *** p < 0.01 (1-tailed t-test considering Bonferroni correction)
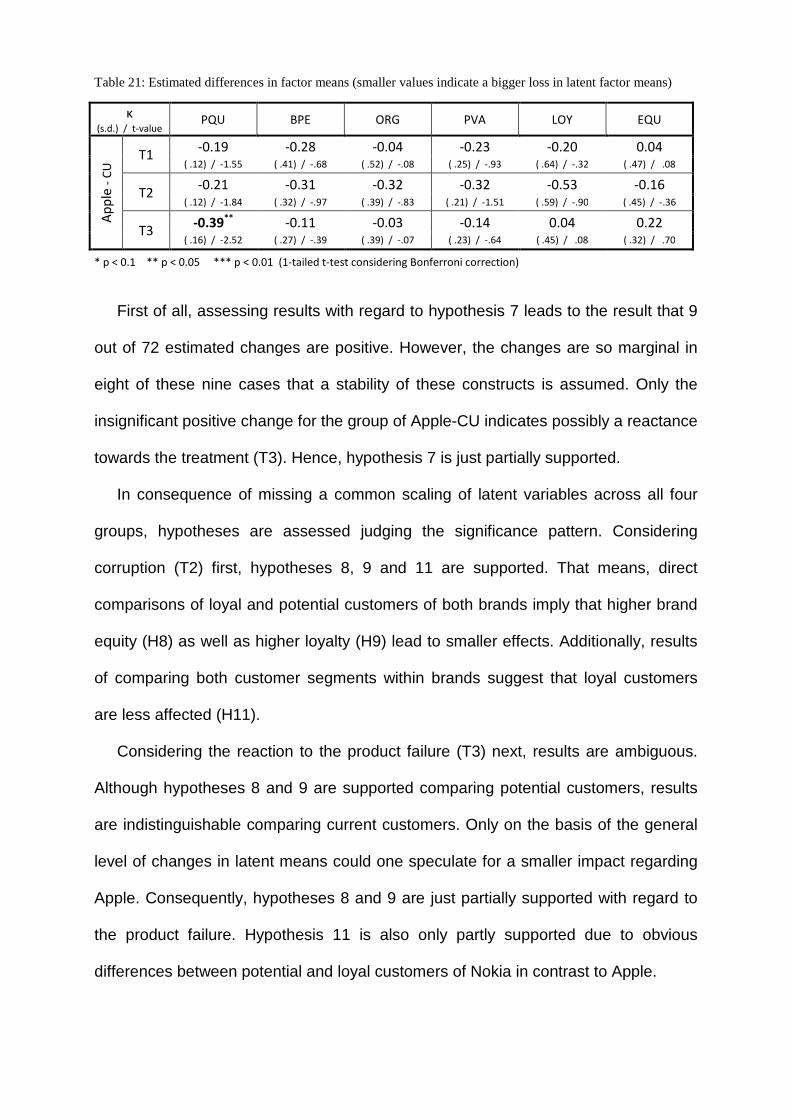
Table 21: Estimated differences in factor means (smaller values indicate a bigger loss in latent factor means)
κ (s.d.) / t-value
PQU BPE ORG PVA LOY EQU A
pp
le -
CU
T1 -0.19 -0.28 -0.04 -0.23 -0.20 0.04
( .12) / -1.55 ( .41) / -.68 ( .52) / -.08 ( .25) / -.93 ( .64) / -.32 ( .47) / .08
T2 -0.21 -0.31 -0.32 -0.32 -0.53 -0.16
( .12) / -1.84 ( .32) / -.97 ( .39) / -.83 ( .21) / -1.51 ( .59) / -.90 ( .45) / -.36
T3 -0.39
** -0.11 -0.03 -0.14 0.04 0.22 ( .16) / -2.52 ( .27) / -.39 ( .39) / -.07 ( .23) / -.64 ( .45) / .08 ( .32) / .70
* p < 0.1 ** p < 0.05 *** p < 0.01 (1-tailed t-test considering Bonferroni correction)
First of all, assessing results with regard to hypothesis 7 leads to the result that 9
out of 72 estimated changes are positive. However, the changes are so marginal in
eight of these nine cases that a stability of these constructs is assumed. Only the
insignificant positive change for the group of Apple-CU indicates possibly a reactance
towards the treatment (T3). Hence, hypothesis 7 is just partially supported.
In consequence of missing a common scaling of latent variables across all four
groups, hypotheses are assessed judging the significance pattern. Considering
corruption (T2) first, hypotheses 8, 9 and 11 are supported. That means, direct
comparisons of loyal and potential customers of both brands imply that higher brand
equity (H8) as well as higher loyalty (H9) lead to smaller effects. Additionally, results
of comparing both customer segments within brands suggest that loyal customers
are less affected (H11).
Considering the reaction to the product failure (T3) next, results are ambiguous.
Although hypotheses 8 and 9 are supported comparing potential customers, results
are indistinguishable comparing current customers. Only on the basis of the general
level of changes in latent means could one speculate for a smaller impact regarding
Apple. Consequently, hypotheses 8 and 9 are just partially supported with regard to
the product failure. Hypothesis 11 is also only partly supported due to obvious
differences between potential and loyal customers of Nokia in contrast to Apple.
Evaluating cross effects (comparing customers with non-customers of the other
brand), reactions in fringe groups (Nokia-NC and Apple-CU) correspond to
hypotheses, whereas comparisons of Nokia-CU and Apple-NC lead to ambiguous
results. However, due to a very challenging isolation of causes, a closer examination
of cross effects is neglected.
Assessing weakened dimensions of brand equity depending on the type of critical
incident implies that hypotheses 12a (ORG) and 12c (PVA) are only partially
supported. In contrast, hypothesis 12b (PQU) is supported without any kind of
restrictions. Organizational associations are a bit more affected in the case of
corruption than when the product failure occurred, but the effect is only significant for
customers of Nokia. Whereas, in the case of a product failure, the negative effect on
the perceived quality dimension is significant for all groups. Significant effects
regarding the perceived value exist only for potential customers of Apple and Nokia
in the case of corruption or respectively in both cases. However, corruption
apparently affects the perceived quality dimension significantly for all groups except
Apple-CU.
Evaluating results with regard to hypothesis 13 (loyalty is less effected) points out
that loyalty is marginally or not affected (see above, positive changes), especially for
potential customers. Moreover, marginal changes and the absence of significant
effects for customers after the product failure indicate stability of the loyalty construct.
Hence, hypothesis 13 is supported.
Hypothesis 14 (less critical incidents affect brand equity less) is not supported.
With the exception of Apple-CU, where a similar critical and less credible perceived
incident induces equally strong effects (comparing RI to T2, see Table 17), all results

contradict this hypothesis. This means, reactions are stronger despite comparable or
lower criticality.
With regard to hypothesis 15, presuming that less credible incidents have a minor
effect on brand equity, results are contradictory. On the one hand, less credible and
similarly critical perceived incidents lead to smaller effects comparing T2 and T3
(Apple-CU). On the other hand, despite the smaller credibility of corruption (T2) the
occurring effect is stronger for Nokia’s customers.
However, comparing reactions to hypothetical incidents, effects overlap regarding
criticality and credibility. But stronger reactions to corruption imply that perceived
criticality dominates the effect over credibility taking into account the conditions
(comparable critical and less credible) and results of Apple-CU. Overall, it is apparent
that the immediate reactions triggered by corruption result in a bigger loss of positive
associations compared to product failure for all groups except the customers of
Apple. In conclusion, the following table presents all results with regard to reaction
hypotheses.
Table 22: Overview of results (reaction hypotheses)
Reaction hypotheses Product failure Corruption
7 CI reduces positive attitudes Support in 20/24 Support in 23/24
8 High EQU leads to smaller effects Support in 4/8 Supported (8/8)
9 Effects of CI are less the greater LOY Support in 4/8 Supported (8/8)
11 CU reduce their attitudes less than NC Nokia: supported
Apple: not supported Supported (2/2)
12a Corruptions affect ORG significantly X Support in 1/4
12b Product failures affect PQU significantly Supported (4/4) X
12c PVA is affected in both cases NC: support in 1/2
CU: not supported
NC: supported (2/2)
CU: not supported
13 LOY is less affected Supported (4/4) Supported (4/4)
14 CI perceived less critical, affect EQU less Not supported
15 Less credible news affects EQU less Support in 1/12
7 Discussion
Nowadays, consumers are often confronted, deliberately or otherwise, with
various critical incidents independent of their current business relation with a
company. For this reason, this paper addresses the essential questions. When and
to what extent do such critical incidents damage the customer-brand relationship?
More precisly, this study examines which dimensions of customer based brand equity
are affected depending on distinct critical incidents and which moderators play a role.
For this purpose, an online experiment was conducted whose design increases
external validity and overcomes some criticism of previous experiments (e.g. Cleeren
et al., 2008; van Heerde et al., 2007, Grewal, Roggeveen & Tsiros, 2008). Therefore,
first, participants receive some information of the critical incidents via internet as
negative publicity (Ahluwalia et al., 2000) in their familiar surroundings. Second,
incidents are based on actual historical events and are transmitted via real credible
media. Third, this study analyzes effects regarding distinct customer segments,
various incidents and brands at the same time on the basis of large samples. Finally,
effects are examined taking into account real brands and business relations.
The results indicate a differing immediate negative effect depending on various
factors. In principle, the results imply that a strong brand equity buffers negative
perception of critical incidents as hypothesized earlier (Hess, Ganesan & Klein, 2003;
Tax, Brown & Chandrashekaran, 1998). However, not only brand equity works as a
moderator, the current usage of a brand reduces the negative impact too. Comparing
loyal with potential customers, this analysis shows, as supposed by Dawar and
Pillutla (2000), actual customers shift their attitudes less. Even the consequence of a
BPE decrease for potential Nokia customers is in line with outcomes of Dawar and
Pillutla (2000) after a product failure. This means, on the one hand, potential
customers tend to lose interest in a brand faster because they are missing a strong
relation and an opportunity to be reassured that the product is safe. On the other
hand, when a critical incident occurs and the user is not personally affected, the
current usage works as an attitude stabilizing anchor.
This effect confirms indirectly the existence of moderators such as commitment
(e.g. Ingram et al., 2005) and familiarity (e.g. Ahluwalia, 2002). Following Morgan and
Hunt (1994) and taking commitment as a key factor for successful sales for granted,
customers possess a high commitment because they have already bought the brand.
However, in the case of necessary post crisis communication, the differentiation
between loyal and potential customers seems more appropriate in practice because
these groups are easier to separate and to address.
Moreover, outcomes suggest that number and type of affected dimensions of
CBBE as well as the effect size depend on both type of incident and the above
mentioned moderators. There are indications that key benefit dimensions (PQU –
function of technical devices) are almost always affected. Whereas in the case of
corruption, organizational associations tend to be additionally more affected.
However, the reduction of perceived quality triggered by corruption contradicts the
statement of Dawar and Lei (2009) that core associations shift only when directly
affected by crisis. In principle, post crisis communication should focus especially on
significantly damaged dimensions of CBBE. Indeed, given that attitudinal loyalty is a
necessary preliminary stage of loyal behavior, outcomes of robust attitudinal loyalty
imply that critical incidents do not induce in general a changed behavior.
Consequently, appropriate handling of rare critical incidents and the corresponding
bad news can be an opportunity to improve brand equity in the long run.
8 Limitations and future research
This analysis may be subject to some limitations. First, this study focuses on
smartphone brands and hence on basically utilitarian products with high involvement.
Hence, the findings can be limited to mobile phones or these types of goods.
Therefore, future research has to figure out whether and how effects vary in other
combinations of utilitarian, hedonistic as well as low and high involvement goods.
Second, data are collected using snowball-sampling and a self-administered
online experiment. Conseqently, sample composition and representativeness might
raise some concerns about the generalizability of results. However, taking the typical
target group of smartphones into account, the used sample seems adequate
containing mainly young technically inclined people and an above average share of
smartphone users (58.6%).
Third, the experimental design and the context of research possibly limits the
external validity and generalizability of findings. On the one hand, immediate shifts
may differ to reactions in the long run. Moreover, being more often exposed to a
critical incident may lead to modified attitudinal changes. On the other hand, people
personally affected by a critical incident probably react more emotionally and hence
differently.
Fourth, the applied methodology requires multivariate normal distributed
variables, but variables of the used sample are not even univariate normal
distributed. However, following Boomsma and Hoogland (2001), Yuan, Bentler and
Zhang (2005), Ryu (2011) and West, Finch and Curran (1995), violations are less
critical for large samples (> 200) and positive or negative skewness and kurtosis
below 2.0 and 7.0 respectively.

Finally, these limitations, other types of critical incidents, other cultures, brands
and branches as well as other measurement models are possible fruitful lines for
further research.
References
Aaker, D. A. (1991). Managing brand equity. New York: The Free Press.
Aaker, D. A. (1996). Building strong brands. New York: The Free Press.
Aaker, D. A. & Biel, A. L. (1993). Brand equity & advertising: Advertising’s role in building
strong brands. Hillsdale, New Jersey: Erlbaum.
Aaker, J. L., Fournier, S. & Brasel, A. S. (2004). When good brands do bad. Journal of
Consumer Research, 31 (June), 1-16.
Ahluwalia, R., Burnkrant, R. E. & Unnava, R. H. (2000). Consumer response to negative
publicity: the moderating role of commitment. Journal of Marketing Research, 37,203-
214.
Ahluwalia, R. (2002). How prevalent is the negativity effect in consumer environments?
Journal of Consumer Research, 29, 270-279.
Ailawadi, K. L., Lehmann, D. R. & Neslin, S. A. (2003). Revenue premium as an outcome
measure of brand equity. Journal of Marketing, 67 (4), 1-17.
Anderson, J. C. & Gerbing, D. W. (1988). Structural equation modeling in practice - a review
and recommended two-step approach. Psychological Bulletin, 103 (3), 411-423.
Arbuckle, J. L. (2008). AMOSTM
17.0 User’s Guide, Chicago.
Bagozzi, R. P. (1977). Structural Equation Models in Experimental Research. Journal of
Marketing Research, 14 (2), 209-226.
Bagozzi, R. P. & Baumgartner, H. (1994). The evaluation of structural equation models and
hypotheses testing. Principles of Marketing Research, Cambridge: Bagozzi, R. P. (ed.),
386-422.
Bagozzi, R. P. & Yi, Y. (1988). On the evaluation of structural equation models. Journal of the
Academy of Marketing Science, 16 (1), 74-94.
Barrett, P. (2007). Structural equation modeling: Adjudging model fit. Personality and
Individual differences, 42, 815-824.
Baumgartner, H. & Steenkamp, J. B. (2006). An extended paradigm for measurement
analysis of marketing constructs applicable to panel data. Journal of Marketing
Research, 43 (3), 431-442.
Bitner, M. J., Booms, B. H. & Tetreault, M. (1990). The service encounter: diagnosing
favorable and unfavorable incidents. Journal of Marketing, 54 (1), 71-84.
Boomsma, A., & Hoogland, J. J. (2001). The robustness of LISREL modeling revisited. R.
Cudeck, S. du Toit, & D. Sörbom (Eds.), Structural equation models: Present and future. A
Festschrift in honor of Karl Jöreskog. Chicago: Scientific Software International, 139-168.
Buil, I., de Chernatony, L. & Martinez, E. (2008). A cross-national validation of the consumer-
based brand equity scale. Journal of Product & Brand Management, 17 (6), 384-392.
Carlson, M. & Mulaik, S. (1993). Trait ratings from descriptions of behavior as mediated by
components of meaning. Multivariate Behavioral Research, 28, 111-159.
Chen, F., Curran, P. J., Bollen, K. A., Kirby, J. & Paxton, P. (2008). An empirical evaluation of
the use of fixed cutoff points in RMSEA test statistic in structural equation models.
Sociological Methods & Research, 36 (4), 462-494.
Christodoulides, G. & de Chernatony, L. (2010). Consumer-based brand equity
conceptualization and measurement: A literature review. International Journal of
Market Research, 52 (1), 43-66.
Cleeren, K., Dekimpe, M. G. & Helsen, K. (2008). Weathering product-harm crises. Journal of
the Academy of Marketing Science, 36, 262-270.
Cronbach, L. J. & Meehl, P. E. (1955). Construct validity in psychological tests. Psychological
Bulletin, 52, 281-302.
Dawar, N. & Pillutla, M. M. (2000). Impact of product-harm crises on brand equity: the
moderating role of consumer expectations. Journal of Marketing Research, 37, 215-226.
Dawar, N. & Lei, J. (2009). Brand crises: the roles of brand familiarity and crisis relevance in
determining the impact on brand evaluations. Journal of Business Research, 62, 509-516.
Fornell, C. & Larcker, D. (1981). Evaluating structural equation models with unobservable
variables and measurement error. Journal of Marketing Research, 18 (1), 39-50.
Gardial, S., Fisher, D., Flint, J. & Woodruff, R. B. (1996). Trigger events: exploring the
relationships between critical events and consumers’ evaluations, standards, emotions,
values and behavior. Journal of Consumer Satisfaction, Dissatisfaction and Complaining
Behavior, 9, 35–51.
Grewal, D., Roggeveen, A. L. & Tsiros, M. (2008). The effect of compensation on repurchase
intentions in service recovery. Journal of Retailing, 84 (4), 424-434.
Gustafsson, A., Johnson, M.D. & Roos, I. (2005). The effects of customer satisfaction,
relationship commitment dimensions, and triggers on customer retention. Journal of
Marketing, 69, 210-218.
Ingram, R., Skinner, S. J. & Taylor, V.A. (2005). Consumers‘ evaluation of unethical marketing
behaviors: The role of customer commitment. Journal of Business Ethics, 3, 237-252.
Hess, R. L., Ganesan, S. & Klein, N. M. (2003). Service failure and recovery: the impact of
relationship factors on customer satisfaction. Journal of the Academy of Marketing
Science, 31 (2), 127-145.
Hildebrandt, L. (1984). Kausalanalytische Validierung in der Marketingforschung. Marketing:
Zeitschrift für Forschung und Praxis, 6 (1), 5-24.
Homburg, C. & Giering, A. (1996). Konzeptualisierung und Operationalisierung komplexer
Konstrukte – Ein Leitfaden für die Marketingforschung. Zeitschrift für Forschung und
Praxis, 18 (1), 5-24.
Hu, L.-T. & Bentler, P. M. (1998). Fit indices in covariance structure analysis: sensitivity to
underparameterized model misspecification. Psychological Methods, 3, 424−453.
Hu, L.-T. & Bentler, P. M. (1999). Cutoff criteria for fit indexes in covariance structure
analysis: conventional criteria versus new alternatives. Structural Equation Modeling, 6,
1-55.
Keaveney, S. M. (1995). Customer switching behavior in service industries: an exploratory
study. Journal of Marketing, 59 (2), 71-82.
Keller, K. L. (1993). Conceptualizing, measuring, and managing customer-based brand equity.
Journal of Marketing, 57 (1), 1-22.
Klein, J. & Dawar, N. (2004). Corporate social responsibility and consumer’s attributions and
brand evaluations in a product-harm crisis. International Journal of Research in
Marketing, 21, 203-217.
Lassar, W., Mittal, B. & Sharma, A. (1995). Measuring customer-based brand equity. Journal
of Consumer Marketing, 12 (4), 11-19.
Laufer, D., Gillespie, K., McBride, B. & Gonzalez, S. (2005). The role of severity in consumer
attributions of blame: defensive attributions in product-harm crises in Mexico. Journal
of International Consumer Marketing, 17 (2/3), 33-50.
Little, R. J. A. (1988). A test of missing completely at random for multivariate data with
missing values. Journal of the American Statistical Association, 83 (404), 1198-1202.
Little, T. D., Card, N. A., Slegers, D. W. & Ledford, E. C. (2007). Representing contextual
effects in multiple groups MACS models. Modeling Contextual Effects in Longitudinal
Studies, Mahwah, New Jersey: Little, Bovaird & Card, 121-147.
MacCallum, R. C., Browne, M. W. & Sugawara, H. M. (1996). Power analysis and
determination of sample size for covariance structure Modeling. Psychological Methods,
1 (2), 130-149.
Mangold, W. G. & Faulds, D. J. (2009). Social media: The new hybrid element of the
promotion mix. Business Horizons, 52, 357-365.
Maxham, J. G. & Netemeyer, R. G. (2002). A longitudinal study of complaining customers’
evaluations of multiple service failures and recovery efforts. Journal of Marketing, 66,
52-71.
Morgan, R. M. & Hunt, S. D. (1994). The commitment-trust theory of relationship marketing.
Journal of Marketing, 58 (3), 20-38.
Myers, C. (2003). Managing brand equity: a look at the impact of attributes. Journal of
Product & Brand Management, 12 (1), 39-51.
Nunnally, J. C. (1978). Psychometric Theory. 2nd edition, New York.
Romaniuk, J. (2008). Comparing methods of measuring brand personality traits. Journal of
Marketing Theory and Practice, 2, 153-161.
Roos, I. (2002). Methods of investigating Critical Incidents: a comparative review. Journal of
Service Research, 4, 193–204.
Roos, I., Edvardsson B. & Gustafsson, A. (2004). Customer switching patterns in competitive
and noncompetitive Service Industries. Journal of Service Research, 6, 256–271.
Rubin, D. B. (1976). Inference and missing data. Biometrika, 63 (3), 581-592.
Rust, R. T., Lemon, K. N. & Zeithaml, V. A. (2004). Return on Marketing: Using Customer
Equity to Focus Marketing Strategy. Journal of Marketing, 68, 109–127.
Ryu, E. (2011). Effects of skewness and kurtosis on normal-theory based maximum likelihood
test statistic in multilevel structural equation modeling. Behavior Research Methods, 43
(4), 1066-1074.
Shleifer, A. (2004). Does Competition Destroy Ethical Behavior? American Economic Review
Papers and Proceedings, 94, 414–418.
Sirdeshmukh, D., Singh, J. & Sabol, B. (2002). Consumer trust, value, and loyalty in relational
exchanges. Journal of Marketing, 66 (1), 15-37.
Sörbom, D. (1974). A general method for studying differences in factor means and factor
structure between groups. British Journal of Statistical Psychology, 27, 137-163.
Tax, S. S., Brown S. W. & Chandrashekaran, M. (1998). Customer evaluations of service
complaint experiences: implications for relationship marketing. Journal of Marketing, 62
(2), 60-76.
Temme, D. & Hildebrandt, L. (2009). Gruppenvergleiche bei hypothetischen Konstrukten –
Die Prüfung der Übereinstimmung von Messmodellen mit der Strukturgeleichungs-
methodik. Zfbf, 61 (2), 138-185.
van Doorn, J. & Verhoef, P. C. (2008). Critical incidents and the impact of satisfaction on
customer share. Journal of Marketing, 72, 123-142.
van Heerde, H. J., Helsen, K. & Dekimpe, M. G. (2007). The impact of a product-harm crisis
on marketing effectiveness. Marketing Science, 26 (2), 230-245.
Weißgerber, A. (2007). Konsumentenverhalten in ereignisinduzierten Markenkrisen – Der
Einfluss der Markenbeziehungsqualität. Dissertation. Wiesbaden: Gabler.

West, S. G., Finch, J. F. & Curran, P. J. (1995). Structural equation modeling with nonnormal
variables. Problems and remedies. In R. H. Hoyle (Ed.), Structural Equation Modeling:
Concepts, Issues, Applications, 56-75. Thousand Oaks, CA: Sage.
Yoo, B., Donthu, N. & Lee, S. (2000). An examination of selected marketing mix elements and
brand equity. Journal of the Academy of Marketing Science, 28 (2), 195-211.
Yoo, B. & Donthu, N. (2001). Developing and validating a multidimensional consumer-based
brand equity scale. Journal of Business Research, 52, 1-14.
Yuan, K. H., Bentler, P. M. & Zhang, W. (2005). The effect of skewness and kurtosis on mean
and covariance structure analysis: The univariate case and its multivariate implication.
Sociological Methods & Research, 34, 240–258.
Zeithaml, V. A. (1988). Consumer perceptions of price, quality, and value: a means-end
model and synthesis of evidence. Journal of Marketing, 52 (3), 2-22
SFB 649 Discussion Paper Series 2012
For a complete list of Discussion Papers published by the SFB 649, please visit http://sfb649.wiwi.hu-berlin.de.
SFB 649, Spandauer Straße 1, D-10178 Berlin http://sfb649.wiwi.hu-berlin.de
This research was supported by the Deutsche
Forschungsgemeinschaft through the SFB 649 "Economic Risk".
001 "HMM in dynamic HAC models" by Wolfgang Karl Härdle, Ostap Okhrin and Weining Wang, January 2012.
002 "Dynamic Activity Analysis Model Based Win-Win Development Forecasting Under the Environmental Regulation in China" by Shiyi Chen and Wolfgang Karl Härdle, January 2012.
003 "A Donsker Theorem for Lévy Measures" by Richard Nickl and Markus Reiß, January 2012.
004 "Computational Statistics (Journal)" by Wolfgang Karl Härdle, Yuichi Mori and Jürgen Symanzik, January 2012.
005 "Implementing quotas in university admissions: An experimental analysis" by Sebastian Braun, Nadja Dwenger, Dorothea Kübler and Alexander Westkamp, January 2012.
006 "Quantile Regression in Risk Calibration" by Shih-Kang Chao, Wolfgang Karl Härdle and Weining Wang, January 2012.
007 "Total Work and Gender: Facts and Possible Explanations" by Michael Burda, Daniel S. Hamermesh and Philippe Weil, February 2012.
008 "Does Basel II Pillar 3 Risk Exposure Data help to Identify Risky Banks?" by Ralf Sabiwalsky, February 2012.
009 "Comparability Effects of Mandatory IFRS Adoption" by Stefano Cascino and Joachim Gassen, February 2012.
010 "Fair Value Reclassifications of Financial Assets during the Financial Crisis" by Jannis Bischof, Ulf Brüggemann and Holger Daske, February 2012.
011 "Intended and unintended consequences of mandatory IFRS adoption: A review of extant evidence and suggestions for future research" by Ulf Brüggemann, Jörg-Markus Hitz and Thorsten Sellhorn, February 2012.
012 "Confidence sets in nonparametric calibration of exponential Lévy models" by Jakob Söhl, February 2012.
013 "The Polarization of Employment in German Local Labor Markets" by Charlotte Senftleben and Hanna Wielandt, February 2012.
014 "On the Dark Side of the Market: Identifying and Analyzing Hidden Order Placements" by Nikolaus Hautsch and Ruihong Huang, February 2012.
015 "Existence and Uniqueness of Perturbation Solutions to DSGE Models" by Hong Lan and Alexander Meyer-Gohde, February 2012.
016 "Nonparametric adaptive estimation of linear functionals for low frequency observed Lévy processes" by Johanna Kappus, February 2012.
017 "Option calibration of exponential Lévy models: Implementation and empirical results" by Jakob Söhl und Mathias Trabs, February 2012.
018 "Managerial Overconfidence and Corporate Risk Management" by Tim R. Adam, Chitru S. Fernando and Evgenia Golubeva, February 2012.
019 "Why Do Firms Engage in Selective Hedging?" by Tim R. Adam, Chitru S. Fernando and Jesus M. Salas, February 2012.
020 "A Slab in the Face: Building Quality and Neighborhood Effects" by Rainer Schulz and Martin Wersing, February 2012.
021 "A Strategy Perspective on the Performance Relevance of the CFO" by Andreas Venus and Andreas Engelen, February 2012.
022 "Assessing the Anchoring of Inflation Expectations" by Till Strohsal and Lars Winkelmann, February 2012.
SFB 649 Discussion Paper Series 2012
For a complete list of Discussion Papers published by the SFB 649, please visit http://sfb649.wiwi.hu-berlin.de.
023 "Hidden Liquidity: Determinants and Impact" by Gökhan Cebiroglu and Ulrich Horst, March 2012.
024 "Bye Bye, G.I. - The Impact of the U.S. Military Drawdown on Local German Labor Markets" by Jan Peter aus dem Moore and Alexandra Spitz-Oener, March 2012.
025 "Is socially responsible investing just screening? Evidence from mutual funds" by Markus Hirschberger, Ralph E. Steuer, Sebastian Utz and Maximilian Wimmer, March 2012.
026 "Explaining regional unemployment differences in Germany: a spatial panel data analysis" by Franziska Lottmann, March 2012.
027 "Forecast based Pricing of Weather Derivatives" by Wolfgang Karl Härdle, Brenda López-Cabrera and Matthias Ritter, March 2012.
028 “Does umbrella branding really work? Investigating cross-category brand loyalty” by Nadja Silberhorn and Lutz Hildebrandt, April 2012.
029 “Statistical Modelling of Temperature Risk” by Zografia Anastasiadou, and Brenda López-Cabrera, April 2012.
030 “Support Vector Machines with Evolutionary Feature Selection for Default Prediction” by Wolfgang Karl Härdle, Dedy Dwi Prastyo and Christian Hafner, April 2012.
031 “Local Adaptive Multiplicative Error Models for High-Frequency Forecasts” by Wolfgang Karl Härdle, Nikolaus Hautsch and Andrija Mihoci, April 2012.
032 “Copula Dynamics in CDOs.” by Barbara Choroś-Tomczyk, Wolfgang Karl Härdle and Ludger Overbeck, May 2012.
033 “Simultaneous Statistical Inference in Dynamic Factor Models” by Thorsten Dickhaus, May 2012.
034 “Realized Copula” by Matthias R. Fengler and Ostap Okhrin, Mai 2012. 035 “Correlated Trades and Herd Behavior in the Stock Market” by Simon
Jurkatis, Stephanie Kremer and Dieter Nautz, May 2012 036 “Hierarchical Archimedean Copulae: The HAC Package” by Ostap Okhrin
and Alexander Ristig, May 2012. 037 “Do Japanese Stock Prices Reflect Macro Fundamentals?” by Wenjuan
Chen and Anton Velinov, May 2012. 038 “The Aging Investor: Insights from Neuroeconomics” by Peter N. C. Mohr
and Hauke R. Heekeren, May 2012. 039 “Volatility of price indices for heterogeneous goods” by Fabian Y.R.P.
Bocart and Christian M. Hafner, May 2012. 040 “Location, location, location: Extracting location value from house
prices” by Jens Kolbe, Rainer Schulz, Martin Wersing and Axel Werwatz, May 2012.
041 “Multiple point hypothesis test problems and effective numbers of tests” by Thorsten Dickhaus and Jens Stange, June 2012
042 “Generated Covariates in Nonparametric Estimation: A Short Review.” by Enno Mammen, Christoph Rothe, and Melanie Schienle, June 2012.
043 “The Signal of Volatility” by Till Strohsal and Enzo Weber, June 2012. 044 “Copula-Based Dynamic Conditional Correlation Multiplicative Error
Processes” by Taras Bodnar and Nikolaus Hautsch, July 2012
SFB 649, Spandauer Straße 1, D-10178 Berlin http://sfb649.wiwi.hu-berlin.de
This research was supported by the Deutsche
Forschungsgemeinschaft through the SFB 649 "Economic Risk".
SFB 649, Spandauer Straße 1, D-10178 Berlin http://sfb649.wiwi.hu-berlin.de
This research was supported by the Deutsche
Forschungsgemeinschaft through the SFB 649 "Economic Risk".
SFB 649 Discussion Paper Series 2012
For a complete list of Discussion Papers published by the SFB 649, please visit http://sfb649.wiwi.hu-berlin.de.
045 "Additive Models: Extensions and Related Models." by Enno Mammen, Byeong U. Park and Melanie Schienle, July 2012.
046 "A uniform central limit theorem and efficiency for deconvolution estimators" by Jakob Söhl and Mathias Trabs, July 2012
047 "Nonparametric Kernel Density Estimation Near the Boundary" by Peter Malec and Melanie Schienle, August 2012
048 "Yield Curve Modeling and Forecasting using Semiparametric Factor Dynamics" by Wolfgang Karl Härdle and Piotr Majer, August 2012
049 "Simultaneous test procedures in terms of p-value copulae" by Thorsten Dickhaus and Jakob Gierl, August 2012
050 "Do Natural Resource Sectors Rely Less on External Finance than Manufacturing Sectors? " by Christian Hattendorff, August 2012
051 "Using transfer entropy to measure information flows between financial markets" by Thomas Dimpfl and Franziska J. Peter, August 2012
052 "Rethinking stock market integration: Globalization, valuation and convergence" by Pui Sun Tam and Pui I Tam, August 2012
053 "Financial Network Systemic Risk Contributions" by Nikolaus Hautsch, Julia Schaumburg and Melanie Schienle, August 2012
054 "Modeling Time-Varying Dependencies between Positive-Valued High-Frequency Time Series" by Nikolaus Hautsch, Ostap Okhrin and Alexander Ristig, September 2012
055 "Consumer Standards as a Strategic Device to Mitigate Ratchet Effects in Dynamic Regulation" by Raffaele Fiocco and Roland Strausz, September 2012
056 "Strategic Delegation Improves Cartel Stability" by Martijn A. Han, October 2012
057 "Short-Term Managerial Contracts and Cartels" by Martijn A. Han, October 2012
058 "Private and Public Control of Management" by Charles Angelucci and Martijn A. Han, October 2012
059 "Cartelization Through Buyer Groups" by Chris Doyle and Martijn A. Han, October 2012
060 "Modelling general dependence between commodity forward curves" by Mikhail Zolotko and Ostap Okhrin, October 2012
061 "Variable selection in Cox regression models with varying coefficients" by Toshio Honda and Wolfgang Karl Härdle, October 2012
062 "Brand equity – how is it affected by critical incidents and what moderates the effect" by Sven Tischer and Lutz Hildebrandt, October 2012


![[1996-01(062)] BATMAN](https://img.pdfslide.us/doc/110x75/563dba54550346aa9aa4b062/1996-01062-batman.jpg)