Embed Size (px)
Citation preview

PO Box 12546 Portland, Oregon 97212 PH: 503-459-7638 FAX: 503-236-6164
MEMORANDUM TO: Ryan L. Sass, P.E., City of Everett Clark Worth, Barney & Worth, Inc.
FROM: Rick Williams, Rick Williams Consulting Owen Ronchelli, Rick Williams Consulting Pete Collins, Rick Williams Consulting
DATE: February 9, 2016 (v2) RE: 2015 Everett Downtown Parking Utilization Study I. BACKGROUND
The City of Everett initiated a downtown parking utilization study in 2015 as a follow-up to a similar data collection effort in 2007. New 2015 data allows for evaluation and comparison of parking behavior in the eight years since the initial study. Rick Williams Consulting (RWC) was retained as a sub-consultant to Barney & Worth, Inc. to evaluate changes in Everett’s parking demand for the on- and off-street supply in the downtown. II. PURPOSE OF THE PARKING INVENTORY ANALYSIS The purpose of the study is to derive a comprehensive and detailed understanding of parking dynamics in the downtown that can be used to support and inform decision-making. Elements include:
(1) Development of a data template for all on- and off-street parking in the study area, noting stalls by time stay and type.
(2) A complete survey of on-street and a representative sample of off-street parking use on a
typical day—Tuesday, October 20, 20151. The 2007 parking study was conducted on Wednesday, November 7, 2007.
1 This date was chosen in consultation with the City of Everett. Public schools and local colleges were in session and no major events were scheduled for the downtown. Weather conditions were initially overcast with drizzle at times, then transitioned to partly sunny and dry during the afternoon and early evening hours.

Page | 2 Rick Williams Consulting / Barney & Worth
(3) Analysis of on- and off-street supply in the study area.
(4) Analysis of parking utilization and turnover, including:
a. Quantification of the study area (on-street and select off-street spaces). b. Hourly occupancy counts over one 12-hour day (7:00 AM–7:00 PM). c. Turnover analysis (on-street). d. Duration-of-stay analysis (on-street).
(5) Identification of surpluses and constraints within the parking supply.
III. STUDY AREA The parking inventory study area was established in the initial project scoping process in consultation with the City of Everett. The area is very similar to that studied in 2007, but expands to the west and contracts to the north, primarily between 26th Street and Everett Avenue. The redefined area is bounded by 25th Street on the north, Broadway on the east, 32nd Street on the south and the terminus of Hewitt Avenue on the west. Figure A (next page) provides a map of the 2015 study area.
The study zone reflects the City’s understanding of current parking activity and land use densities in the area defined as “the downtown.” Quantifying parking activity offers a comprehensive look at parking patterns, trends, and surpluses/deficits in this area of the downtown.
2015 Downtown Everett Parking Study Page | 3
Figure A – 2015 Everett Downtown Study Area
IV. METHODOLOGY The following methodology describes the variability between the 2007 and 2015 data sets and the assumptions made to facilitate their direct comparison. Elements include:
(1) Differences in Study Areas (2007 vs. 2015):
a. In 2007, a total of 4,548 parking stalls were surveyed, of which 1,955 were on-street and 2,593 off-street. This sample represented about 57% of all parking within the study area (7,696 stalls). One hundred percent of on-street stalls were surveyed, while approximately 45% of the off-street supply was sampled (2,593 of 5,741 stalls).

Page | 4 Rick Williams Consulting / Barney & Worth
b. In 2015, a total of 5,104 parking stalls were surveyed, of which 1,842 were on-street and 3,262 off-street. This sample represented about 62% of all parking within the study area (8,220 stalls). One-hundred percent of on-street stalls were surveyed, while approximately 51% of the off-street supply was sampled (3,262 of 6,378 stalls). An additional 556 stalls, 7% of the total parking supply, were surveyed in 2015.
(2) Comparable Survey Times and Days:
Comparable survey days were chosen to reflect normal parking activity in the downtown. The data collection periods were the same for both study years: 7:00 AM–7:00 PM.
2007 – Wednesday, November 7 2015 – Tuesday, October 20
(3) Analysis of on-street parking utilization:
a. Hourly license plate counts were made for each stall in the on-street supply over the 12-hour period. b. Utilization counts recorded license plate numbers of parked vehicles occupying on-
street stalls. Counts exclude loading zones, reserved stalls, or stalls used exclusively by permit holders.
(4) Analysis of off-street parking utilization:
a. In 2015, hourly counts were made at 25 off-street parking sites: four garages and 21 surface lots. In 2007, counts were made at 13 off-street parking sites: three garages and 10 surface lots.
(5) Identification of parking surpluses and constraints within the on-street parking supply.
(6) Comparative analysis of data between study samples.
V. GENERAL CHARACTERISTICS OF THE STUDY AREA On-street parking is generally free, whereas the off-street supply is a mix of paid and free parking. Table 1 (next page) categorizes on-street parking stalls by time stay and corresponding percentage of total stalls for each survey year. Off-street stalls are shown separately as stalls surveyed (51% sample) and total off-street stalls (100% of inventory).

2015 Downtown Everett Parking Study Page | 5
Table 1 – Everett On-Street Parking Inventory - Comparative
2015 2007
Stall Type Stalls % of Total Stalls % of Total
10 Minutes N/A N/A 5 <1%
15 Minutes N/A N/A 4 <1% 30 Minutes 59 3.2% 86 4.4%
1 Hour 29 1.6% 226 11.6% 90 Minutes 1,375 74.6% 896 45.8%
2 Hours 65 3.5% 507 25.9% 4 Hours N/A N/A 41 2.1% No Limit 189 10.3% 189 10.3% Handicap 97 5.3% N/A2 N/A
Permit Only 1 <1% 28 1.4% Senior Citizen Only 27 1.5% N/A N/A
On-Street Surveyed Subtotal 1,842 100% 1,955 100%
Off-Street Surveyed Subtotal 3,262 51% 2,593 45%
Total Supply Surveyed 5,104 62% 4,593 62%
All Off-Street Subtotal 6,378 100% 5,741 100%
Total (All On and Off-Street) 8,220 100% 7,696 100%
As Table 1 indicates, the downtown study area currently has a high percentage of 90-minute stalls: 75% versus 46% in 2007. Since 2007, 10-minute, 15-minute, and 4-hour stalls have been eliminated, and 30-minute, 1-hour, and 2-hour stalls have been greatly reduced. No Limit stalls are the second most common type at 10%. Overall, the on-street supply has been greatly simplified to feature 90-minute stalls.
VI. ON-STREET PEAK HOUR AND GENERAL OCCUPANCIES - COMPARATIVE “Peak hour” is the period during the business day in which the downtown experiences its highest utilization of parking stalls. Peaks may vary between the on- and off-street systems. Peak-hour occupancies for all stalls in on-street and off-street locations are summarized below. A. On-Street Parking Summary The 2015 peak hour for the on-street public inventory is 11:00 AM to 12:00 PM for the combined system (all stalls, all use types). In 2007 the peak was an hour later, from 12:00 to 1:00 PM.
2 The methodology for tracking handicap stalls has changed. In 2007, handicap stalls were inventoried as they were not “accessible” to all users. That outdated methodology is no longer used, and handicap stalls are a well-documented part of the on-street inventory.

Page | 6 Rick Williams Consulting / Barney & Worth
Table 2 provides a comparative summary of the two study years for each stall type in use at the time, and notes the peak hour, peak occupancy rate, number of empty stalls, average length of stay, and violation rate.
Table 2 – Everett On-Street Parking Utilization by Time Stay
Type of Stall Year Stalls Peak Hour Peak
Occupancy Stalls
Available Average
Length of Stay Violation
Rate
On-Street Peak 2015 1,842
11:00 AM – 12:00 PM
65.0% 607 1 hr/ 52 min 14.2%
2007 1,955 12:00 – 1:00 PM 69.5% 603 1 hr/ 57 min 19.9%
30 Minute 2015 59 12:00 – 1:00 PM 71.2% 14 1 hr/ 20 min 14.5%
2007 86 1:00 – 2:00 PM 60.5% 34 N/A 18.5%
1 Hour 2015 29 9:00 – 11:00 AM 86.2% 1 1 hr/ 24 min 26.6%
2007 226 12:00 – 1:00 PM 81.0% 43 1 hr/ 31 min 25.6%
90 Minutes 2015 1,375
11:00 AM – 12:00 PM
64.4% 416 1 hr/ 45 min 13.5%
2007 896 12:00 – 1:00 PM 72.1% 250 1 hr/ 50 min 16.6%
2 Hours 2015 65 6:00 – 7:00 PM 49.2% 33 2 hr/ 31 min 27.7%
2007 507 6:00 – 7:00 PM 65.5% 175 2 hr/ 18 min 24.7%
No Limit 2015 189 2:00 – 3:00 PM 59.3% 53 5 hr/ 3 min N/A
2007 162 10:00 – 11:00 AM 83.3% 27 3 hr/ 38 min N/A
Handicapped 2015 97
11:00 AM – 12:00 PM
44.3% 50 1 hr/ 54 min N/A
2007 N/A N/A N/A N/A N/A N/A
Permit Only 2015 1
7:00 – 8:00 AM
9:00 AM – 7:00 PM 100% 0 5 hr/ 30 min N/A
2007 28 5:00 – 6:00 PM 92.9% 2 1 hr/ 48 min N/A
Senior Citizen Only
2015 27 4:00 – 7:00 PM 96.3% 1 2 hr/ 44 min N/A
2007 N/A N/A N/A N/A N/A N/A
From Table 2, the following can be concluded:

2015 Downtown Everett Parking Study Page | 7
• The 2015 on-street survey evaluated 1,842 stalls, 113 fewer than the 2007 survey (1,955 stalls). • The overall peak-hour occupancy decreased by nearly 5%, from 69.5% in 2007 to 65.0% in 2015. • The average time stay across all stalls decreased by five minutes, from 1 hour 57 minutes in 2007 to
1 hour 52 minutes. • 2015 violation rates (14.2%), while reduced compared to the 2007 study (19.9%), continue to be
well above the industry standard of between 5% and 7% for an efficient parking system. As in 2007, 1- and 2-hour stalls experienced the highest levels of violations, 27% and 28% respectively.
• The number of 1-hour stalls was dramatically reduced, from 226 stalls in 2007 to 29 stalls in 2015. However, these stalls continue to have average time stays approaching 90 minutes and very high rates of violation, suggesting that 1-hour stalls are not meeting customer need.
• Senior Citizen Only and Permit Only stalls maintained high occupancies at 96.3% and 100%, respectively.
Figure B compares hourly on-street parking occupancies for each of the two survey years. From this figure the following can be derived: • Hourly occupancies for 2007 exceed 2015 in each of the 12 hours surveyed. Differences between
the two data sets vary from as little as 3% at 11:30 AM to as much as 18% at 8:30 AM. • Despite the variation in occupancies, utilization patterns are nearly identical, showing a relatively
sharp increase in the morning hours, peaking at midday, and slowly tapering in the afternoon and early evening hours.
Figure B – Hourly On-Street Parking Utilization - Comparative

Page | 8 Rick Williams Consulting / Barney & Worth
Figure C shows weekday peak-hour on-street occupancies for 2015 by block face. Parking utilization ”heat maps” display areas of high peak-hour occupancy using color codes: red indicates a parking constraint (85%+ occupancy), orange indicates robust activity (70% - 84%), yellow moderate activity (55% - 69%) and green low activity (<55%). As the map illustrates, downtown Everett’s 2015 peak is 65%, a level of moderate activity based on this scale. From Figure C, the following can be derived:
• Thirty-eight of 143 block faces surveyed are constrained. This represents 27% of all on-street parking.
• Higher occupancies occur in the central and southern areas of the downtown. • Block faces exceeding 85% occupancy are clustered along Colby and Wall Streets, with
additional pockets of constraint on the periphery of the study area (see Section VII, page 7 below).
Figure C – 2015 Everett On-Street Parking Peak Hour Occupancy Heat Map

2015 Downtown Everett Parking Study Page | 9
B. On-Street: Usage Characteristics (Turnover, Duration of Stay, Volume and Exceeding Time Stays) Everett’s on-street parking supply shows relatively high turnover despite evidence of abuse of posted time limits. Usage characteristics derived from the data underscore this conclusion, as summarized in Table 3 below:
Table 3 – Everett On-Street Parking General Use Characteristics - Comparison
Use Characteristics 2015 2007
Average length of stay per vehicle per occupied stall
1 hr/ 52 min 1 hr/ 57 min
Vehicle trips (unique vehicles) 6,013 7,473
Vehicle hours parked 11,243 14,595
Turnover rate (number of cars to use a single occupied stall over a 12 hour period)
6.42 6.1
% of unique vehicles violating the posted time stay
14.2% 19.9%
% of total vehicle hours spent in violation of posted time stay
20.0% 27.3%
Actual number of vehicles parked for time stays over 4 hours (% of unique vehicles)
380 (6.3%) 815 (10.9%)
1. Average Length of Stay • The 2015 average stay for all on-street parking stalls is 1 hour 52 minutes (or 1.87 hours). The 2007
average was five minutes longer at 1 hour 57 minutes. • The longest stays are at No Limit stalls, where vehicles stay an average of 5 hours 3 minutes. Eight
years earlier the average stay at a No Limit stall was 3 hours 38 minutes. • All short-term stalls (1-hour, 90-minute and 2-hour stalls) have average time stays that exceed the
posted limit, leading to a violation rate in excess of 14%. 2. Volume On the survey day, 6,013 unique vehicles accessed the on-street system between 7:00 AM and 7:00 PM, making for 11,243 vehicle hours parked. The 2007 study recorded 7,473 unique vehicles making for 14,595 vehicle hours parked. The decrease can be partly accounted for by the smaller stall count (113 fewer stalls surveyed in 2015); however, it is evident that there has not been a noticeable increase in parking demand in downtown Everett. Overall, there were 1,460 fewer vehicles using the on-street system in 2015 compared to 2007.

Page | 10 Rick Williams Consulting / Barney & Worth
3. Turnover: Efficiency of the Parking System In most cities, the primary time limit allows for calculation of an intended turnover rate. For example, if the limit for a stall is two hours, it should be expected to turn over six times in a 12-hour period. If the turnover rate is less than 6.0, the system would be deemed inefficient, while a rate of 6.0 or higher indicates that the system is operating as intended. Given the average stay of 1.87 hours, an on-street stall in downtown Everett will turn over an average of 6.42 times in a 12-hour day. This reflects an active urban retail center. The 2007 study found a similar healthy turnover rate of 6.15; however, many stalls were being occupied by employees who were “moving to evade”, i.e. - moving their vehicles every couple of hours to avoid parking citations. Table 4 illustrates that in 2015, 360 on-street users were found to be moving their vehicles a combined total of 495 times, likely to evade enforcement. The data suggests that high numbers of employees are using the on-street system to park, limiting access for customers and visitors who bring sales revenue to the downtown. Given that these vehicles move every 90 minutes to two hours, the turnover rate may be inflated.
Table 4 – Users Moving To Evade
Moving To Evade Parking Citations Values
Occurrence of license plates observed moving to evade parking citations (i.e., employees moving their car every few hours)
360
(6.7% of unique vehicles)
Number of total moves observed 495
Average moves per unique license plate 1.4
4. Exceeding Time Stays The 2015 survey revealed that 14.2% of unique vehicles parked in on-street stalls exceed the posted time stay. In addition, 20% of all vehicle hours parked were in violation of the posted time stay. Both of these numbers have decreased since 2007, when 19.9% of vehicles exceeded the posted time stay and 27.3% of vehicle hours parked were in violation. These numbers suggest that while Everett has made modest improvement in enforcement, further strides need to be taken to lessen abuse of the parking system. Best practices within the parking industry, an efficient system maintains violation rates in the range of 5% to 7%.

2015 Downtown Everett Parking Study Page | 11
4. Parking in excess of 4 hours A vehicle parking in a short-term stall in excess of four hours is considered to be an employee vehicle. In 2007, over 800 unique vehicles were recorded parking more than four hours in time-limited stalls, nearly 11% of all unique vehicles. This number dropped significantly in 2015 to 380 vehicles; however, when this number is added to those moving to evade (360), it becomes apparent that high numbers of employees are parking on-street. As many as 740 of the 1,842 available stalls are being used by employees—over 40% of the total supply. VII. ON-STREET NODE ANALYSIS COMPARISONS To better understand the dynamics of the parking system, the study area was broken down into “nodes”: areas of similar use or activity such as government, commercial, retail, entertainment, etc.
The following section details two nodes: a retail corridor that includes Colby and Hoyt Avenues (a zone looked at in previous studies), and a larger area that demonstrated a high level of parking activity throughout the study period—a “high-occupancy node”. A. On-Street Parking Summary - Hoyt/Colby Node
This four-block area includes all on-street parking in the area bounded by Colby Avenue on the east, Pacific Avenue on the south, Hoyt Avenue on the west, and Everett Avenue on the north. On Everett and Pacific Avenues, only parking on the interior block faces was included. Table 5 categorizes all on-street parking surveyed in the Hoyt/Colby node during the two study years. Figure D (next page) illustrates this node’s peak-hour occupancy in heat map format.
Table 5 – On-Street Parking Inventory – Hoyt/Colby Node
• There are a total of 313 on-street stalls in the Hoyt/Colby node (2015). There was an increase of
four stalls from 2007 to 2015. • Today over three-quarters (77.6%) of the stalls have a 90-minute time stay, whereas in 2007 90-
minute stalls constituted only 55% of the node’s inventory. • Similarly, 1-hour stalls saw an 80% decrease (88 stalls).
Stalls by Type 2015 % of Total 2007 % of Total
30 Minute 23 7.3% 28 9.1% 1 Hour 22 7.0% 110 35.6%
90 Minutes 243 77.6% 169 54.7% Handicapped 24 7.7% 0 0%
Permit Only 1 < 1% 0 0%
Total On-Street Supply 313 100% 309 100%

Page | 12 Rick Williams Consulting / Barney & Worth
• Handicap stalls make up nearly 8% of the on-street supply in this node.
Figure D – 2015 Everett On-Street Parking Occupancy Heat Map – Hoyt/Colby Node

1. On-Street Parking Utilization – Hoyt/Colby Node The peak hour for the Hoyt/Colby node is consistent with the larger on-street study: from 11:00 AM to 12:00 PM. The peak occupancy is 81.8%, nearly 17 percentage points greater than the overall on-street peak-hour occupancy of 65%. Table 6 summarizes occupancies by type of stall. Figure E (next page) provides a comparative graphic of occupancies by hour of day for the two study years. Table 6 - On-Street Parking Summary by Time-Stay – Hoyt/Colby Node
Everett On-Street Parking Utilization - Hoyt/Colby Node
Stall Type Year Stalls Peak Hour Peak Occupancy
Stalls Available
Average Length of Stay
Violation Rate
On-Street Peak
2015 313 11:00 AM – 12:00 PM 81.8% 53 1 hr/ 36 min 14.2%
2007 309 12:00 – 1:00 PM 75.4% 76 1 hr/ 32 min 18.5%
30 Minute 2015 23
12:00 – 1:00 PM
6:00 – 7:00 PM 78.3% 5 1 hr/ 12 min 14.3%
2007 28 6:00 – 7:00 PM 75.0% 7 N/A 13.1%
1 Hour 2015 22 9:00 – 11:00 AM 95.5% 1 1 hr/ 22 min 22.9%
2007 110 12:00 – 1:00 PM 92.7% 8 1 hr/ 26 min 24.0%
90 Minutes 2015 243 12:00 – 1:00 PM 76.5% 37 1 hr/ 40 min 12.9%
2007 169 12:00 – 1:00 PM 65.7% 58 1 hr/ 42 min 14.2%
Handicap 2015 243 12:00 – 1:00 PM 76.5% 37 1 hr/ 40 min 12.9%
2007 0 N/A N/A N/A N/A N/A
From Table 6, the following can be derived: • Occupancies in the node increased from 75.4% in 2007 to 81.8% in 2015. • Peak hour shifted one hour earlier, from 12:00–1:00 PM in 2007 to 11:00 AM–12:00 PM in 2015. • The number of 90-minute stalls increased from 169 to 243, and occupancy increased from 65.7% to
76.5% between 12:00 and 1:00 PM in these stalls. • The average duration of stay remained relatively unchanged, from 1 hour 32 minutes to 1 hour 36
minutes. • Violations decreased from 18.5% of unique vehicles to 14.2%.

Page | 14 Rick Williams Consulting / Barney & Worth
Figure E - Comparative On-Street Parking Occupancies – Hoyt/Colby Node
Information in Figure D (page 13) and Figure E yields the following:
• 2015 occupancies exceed 2007 results in 10 of 12 hours surveyed, the exceptions being 8:00–9:00 AM and 6:00–7:00 PM.
• Despite the variations in hourly occupancies, parking utilization patterns were similar in both 2007 and 2015 in this section of the downtown.
• Several block faces in this node are constrained during the peak hour (highlighted in red in Figure D). Half of all parkable block faces (11 of 21) exceed the 85% occupancy threshold during the peak hour.
• The heat map shows particularly high occupancies along the Colby corridor, while some availability exists along Hoyt. The east/west streets connecting the two corridors experience high parking utilization during the late morning/early afternoon peak hour.
33.6
%
47.3
%
67.8
%
71.9
% 81
.8%
80.8
%
69.5
%
69.5
%
65.8
%
62.0
%
66.4
%
65.8
%
32.7
%
51.5
%
58.9
% 68
.9%
71.5
%
75.4
%
64.7
%
61.2
%
57.9
%
57.6
%
64.1
%
69.3
%
0%
10%
20%
30%
40%
50%
60%
70%
80%
90%
Everett Parking Utilization Hoyt/Colby 2015 vs 2007 On-Street Occupancies (313 stalls)
2015 2007

2015 Downtown Everett Parking Study Page | 15
2. On-Street: Usage Characteristics – Hoyt/Colby Node
The Hoyt/Colby node has remarkably similar statistics from one study year to the next. Vehicle trips were down by 3% (51 trips) in 2015 compared to 2007, and vehicle hours parked showed a 1% increase (17 hours) over 2007. The node showed a higher turnover rate than the overall study area, averaging 7.50 turns per 12-hour period, down slightly from 2007, when there was an average 7.8 turns during the study hours. The violation rate remains high at 14.2%. The number of likely employees parked in violation increased in 2015 to 68 vehicles, 4.8% of unique vehicles and 22% of total stalls. Though the violation rate showed a 4% decrease compared to 2007, the rate continues to indicate an inefficient system. These findings are summarized in Table 7.
Table 7 – On-Street Parking General Use Characteristics – Hoyt/Colby Node
Use Characteristics 2015 2007
Average length of stay per vehicle 1 hr/ 36 min 1 hr/ 32 min
Vehicle trips 1,428 1,479
Vehicle hours parked 2,284 2,267
Turnover rate (number of cars to use a single occupied stall over a 12 hour period)
7.50 7.8
% of vehicles violating the posted time stay 14.2% 18.5%
% of vehicle hours spent in violation of posted time stay
16.5% 21.2%
Vehicles parked for 4 or more hours 68 (4.8%) 60 (4.1%)
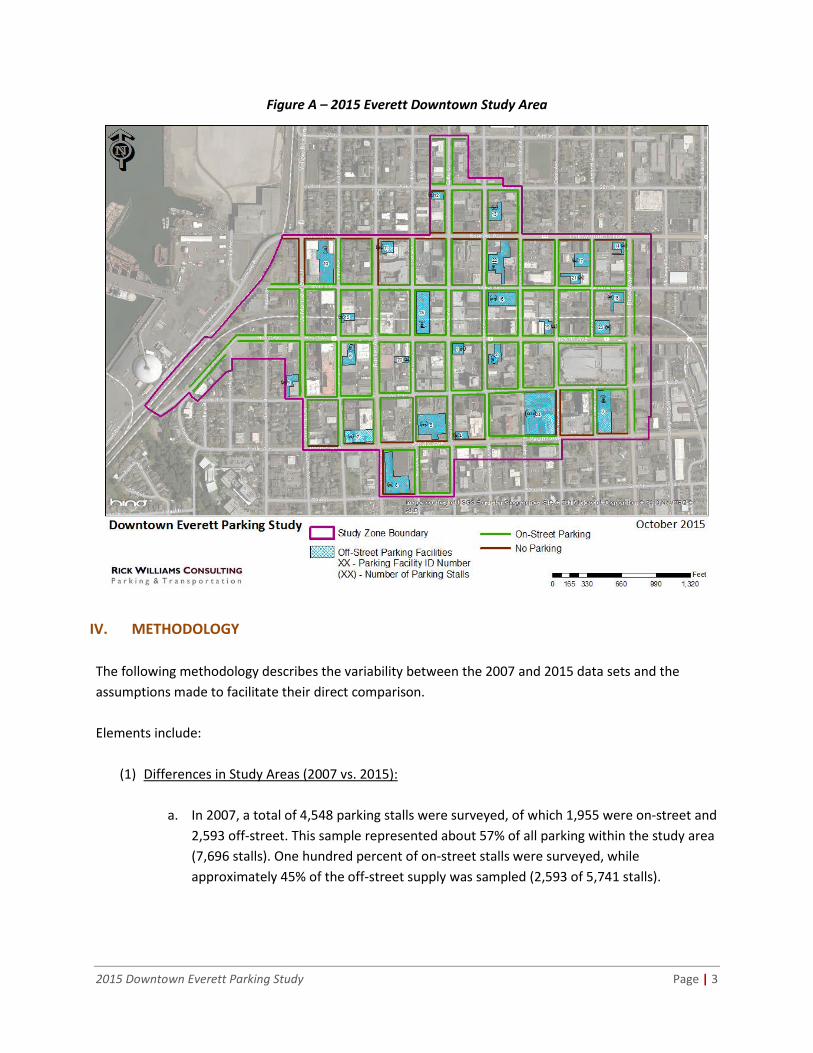
B. On-Street Parking Summary – “High Occupancy Node” (HON) This nine-block high-occupancy area is bounded by Oakes Avenue on the east, Wall Street on the south, Colby Avenue on the west, and Everett Avenue on the north. This area includes all on-street parking on both sides of the street with the exception of Everett Avenue, where only the adjoining block face was included. As indicated earlier, this node had the highest occupancy rate in 2007. Figure F (next page) illustrates the HON’s peak-hour occupancy in heat map format.
Page | 16 Rick Williams Consulting / Barney & Worth
Figure F – 2015 Everett On-Street Parking Heat Map– High Occupancy Node Table 8 (next page) categorizes on-street parking surveyed in the HON.
• There are a total of 579 on-street stalls in the HON node, compared to 546 in the 2007 study. • Of this total, 90-minute stalls constitute 81.5% of the supply, 30-minute and Handicap stalls
6.7%, and 1-hour stalls 5.0%. • The node is similar to the larger study area in that 1-hour stalls have largely been converted to
90-minute stalls.

2015 Downtown Everett Parking Study Page | 17
Table 8 – On-Street Parking Inventory – High Occupancy Node
Stalls Type 2015 % of Total 2007 % of Total
30 Minute 39 6.7% 37 6.8% 1 Hour 29 5.0% 163 29.9%
90 Minutes 472 81.5% 247 45.2% 2 Hours 0 0% 99 18.1%
Handicap 39 6.7% 0 0%
Stall Total 579 100% 546 100%
1. On-Street Parking Utilization – HON Node The peak hour for the HON is 11:00 AM to 12:00 PM, consistent with both the larger study area and the Hoyt/Colby Node. The peak occupancy is 78.2% (robust activity); 13 percentage points greater than the overall on-street peak-hour occupancy of 65% (moderate activity). Table 9, below, summarizes occupancies by type of stall. Table 9 – On-Street Parking Summary by Time-Stay – High Occupancy Node
On-Street Parking Utilization Summary - High Occupancy Node
Stall Type Year Stalls Peak Hour Peak Occupancy
Stalls Available
Average Length of Stay
Violation Rate
On-Street Peak
2015 579 11:00 AM – 12:00 PM 78.2% 123 1 hr/ 39 min 13.0%
2007 546 6:00 – 7:00 PM 92.1% 43 1 hr/ 39 min 18.4%
30 Minute 2015 39 12:00 – 1:00 PM 76.9% 7 1 hr/ 12 min 12.8%
2007 37 6:00 – 7:00 PM 86.5% 5 N/A 19.9%
1 Hour 2015 29 9:00 – 11:00 AM 86.2% 1 1 hr/ 24 min 26.6%
2007 163 12:00 – 1:00 PM 92.6% 12 1 hr/ 28 min 24.3%
90 Minutes 2015 472 11:00 AM – 12:00 PM 79.0% 91 1 hr/ 42 min 11.9%
2007 247 6:00 – 7:00 PM 93.1% 17 1 hr/ 45 min 15.8%
2 Hour 2007 29 9:00 – 11:00 AM 86.2% 1 1 hr/ 24 min 26.6%
Handicap 2015 39 11:00 AM – 12:00 PM 51.3% 18 1 hr/ 55 min N/A
From Table 9, the following can be derived:

Page | 18 Rick Williams Consulting / Barney & Worth
• Occupancies in the node have decreased from 92.1% in 2007 to 78.2% in 2015. • Peak hour shifted from early evening in 2007 to midday in 2015, perhaps suggesting a different mix
of businesses that may not attract an evening crowd (e.g., restaurants). • Similar to the Hoyt/Colby Node, the average duration of stay remained unchanged at 1 hour 39
minutes for each of the study years. • The average time stay in 90-minute stalls was 1 hour 42 minutes, suggesting customers may need
more time to complete their errands. • Violations decreased from 18.3% of unique vehicles to 13.0%.
Figure G – On-Street Parking Summary – High Occupancy Node
From Figure F (page 17) and Figure G (above), the following can be derived:
• 2007 occupancies exceed 2015 results in all 12 hours surveyed. • In 2007, occupancy patterns were more sustained throughout the day; beginning at 10:00 AM,
nine consecutive hours showed occupancies exceeding 80%. In 2015, only five consecutive hours exceeded 70%, also beginning at 10:00 AM.
• Several block faces in this node are constrained during the peak hour (highlighted in red in Figure F). One-third of all parkable block faces (13 blocks of 37) exceed the 85% occupancy threshold during the peak hour.
29.6
% 43
.7%
67.1
% 76
.5%
78.2
%
74.0
%
73.8
%
71.9
%
68.3
%
64.1
%
58.6
%
60.0
%
44.7
%
68.5
% 78
.6%
80.8
%
85.9
%
88.3
%
82.8
%
81.0
%
83.9
%
81.9
%
84.2
%
92.1
%
0%
10%
20%
30%
40%
50%
60%
70%
80%
90%
100%
Everett Parking Utilization High Occupancy Node 2015 vs 2007 On-Street (579 stalls)
2015 2007

2015 Downtown Everett Parking Study Page | 19
• Two areas in particular stand out where occupancies exceed 85%: Colby and Wall Streets.
2. On-Street: Usage Characteristics – High Occupancy Node
The High Occupancy Node is similar between 2007 and 2015 only in average time stay (1 hour 39 minutes) and turnover rate (7.3 turns in a 12-hour period). All other metrics related to this section of the downtown are in contrast. There was a 17% drop in the number of vehicle trips from 2007 to 2015, and there is a corresponding 17% drop in the number of total vehicle hours parked. The one encouraging statistic shows a five percentage point drop in the violation rate, from 18.4% to 13.0 percent. Nonetheless, a 13% violation rate is still considered high by industry standards; violation rates should be in the range of 5% to 7% to be considered efficient. This is reinforced by the high number of vehicles still parking in excess of four hours in the HON (133). A complete summary of these findings is provided in Table 10.
Table 10 – On-Street Parking General Use Characteristics – HON Node
Use Characteristics 2015 2007
Average length of stay per vehicle 1 hr/ 39 min 1 hr/ 39 min
Vehicle trips 2,634 3,159
Vehicle hours parked 4,326 5,201
Turnover rate (number of cars to use a single occupied stall over a 12 hour period)
7.31 7.3
% of vehicles violating the posted time stay 13.0% 18.4%
% of vehicle hours spent in violation of posted time stay
16.4% 23.4%
Vehicles parked for 4 or more hours 133 (5.0%) 183 (5.8%)
VIII. OFF-STREET PEAK HOUR AND GENERAL OCCUPANCIES While the on-street system operates at 65% combined peak occupancy, it is important to evaluate how the off-street system operates in relation and how the two systems are working together. Constraints in the on-street system, whether now or in the future, will need to be directed into the off-street system; therefore, understanding its capacity to absorb growth in parking demand is vital.

Page | 20 Rick Williams Consulting / Barney & Worth
The off-street parking supply in downtown Everett was sampled and analyzed by the consultant team. The sampling was done in consultation with the City of Everett and with the help of several downtown parking operators. Twenty-five facilities were chosen based on their geographic distribution, type of facility (surface lot, parking garage, public vs. private, etc.) and as an appropriate representative sample of the larger off-street system. These 25 facilities accommodate 3,262 stalls, approximately 51% of the total off-street supply and a 6% increase in sample size compared to the 2007 study. The results from the sample provide a statistically accurate representation of the behaviors and habits associated with the entire off-street parking system within the study area. Table 11 provides an inventory of the off-street parking facilities surveyed in 2015.
Table 11 – 2015 Everett Off-Street Parking Sample Inventory Lot ID Parking Facility Stalls % of Total
1 Bank of America 83 2.5%
2 US Bank 45 1.4%
3 Senior Center 100 3.1%
4 7-Eleven 16 <1%
5 Pacific Colby Medical Bldg./Community Health Care 155 4.8%
6 US Post Office 24 <1%
7 Retail parking (First floor) 39 1.2%
8 Crossfit Everett 28 <1%
9 Citrine Health 34 1.0%
10 Everett Herald 97 3.0%
11 Library parking garage 109 3.3%
12 Monthly Parking/For lease 32 1.0%
13 Awards of Praise/KSER 52 1.6%
14 KFC 23 <1%
15 Hewitt/Grand 26 <1%
16 Trinity Garage 375 11.5%
17 Old VFW Lot 62 1.9%
18 Volunteers of America 40 1.2%
19 Seattle Lighting 22 <1%
20 1420 Hewitt 23 <1%
21 2727 Oakes 24 <1%
22 YMCA 96 2.9%
23 Comcast Arena Lot 54 1.7%
24 County Garage 1,210 37.1%

2015 Downtown Everett Parking Study Page | 21
Lot ID Parking Facility Stalls % of Total
25 Everpark Garage 493 15.1%
Off-Street Supply Surveyed 3,262 100%
A. Off-Street Parking Summary Results were similar between the two survey years in that overall peak-hour occupancies varied less than one percentage point, from 72.1% in 2007 to 71.2% in 2015. The peak hour changed from 10:00–11:00 AM in 2007 to 12:00–1:00 PM in 2015. The sample size increased from 13 to 25 parking facilities, and 669 additional stalls were surveyed, marking a 26% increase. Table 12 provides a utilization comparison between the 2007 and 2015 off-street counts. Table 12 – Off-Street Parking Occupancy Comparison
Use Type Year Stalls Peak Hour Peak
Occupancy Stalls
Available
Off-Street Supply Surveyed 2015 3,262 12:00 – 1:00 PM 71.2% 939
2007 2,593 10:00 – 11:00 AM 72.1% 723
Figure H (next page) illustrates comparative parking occupancies for each hour of the 12-hour survey day. The combined peak-hour occupancy for off-street facilities is 71.2% from 12:00 to 1:00 PM. Off-street results are more similar to the previous survey than those for the overall on-street system or the individual nodes: utilization patterns were nearly identical, and differences in hourly occupancies varied only slightly more than two percentage points between 10:00 AM and 4:00 PM. Occupancies from 2007 exceeded 2015 results in seven of the 12 hours studied.

Page | 22 Rick Williams Consulting / Barney & Worth
Figure H – Comparative Off-Street Parking Utilization
Table 13shows individual peak-hour occupancies and number of available stalls for each off-street facility sampled during the 2015 survey. Peak occupancy rates ranged from a low of 19.2% (Awards of Praise/KSER ) to a high of 99.6% (County Garage). Table 13 – 2015 Everett Off-Street Parking Summary by Time Stay
Lot ID Parking Facility Stalls Peak Hour Peak
Occupancy Stalls
Available
1 Bank of America 83 3:00 – 4:00 PM 22.9% 64
2 US Bank 45 9:00 – 10:00 AM 44.4% 25
3 Senior Center 100 12:00 – 1:00 PM 80.0% 20
4 7-Eleven 16 12:00 – 1:00 PM 4:00 – 5:00 PM
43.8% 9
5 Pacific Colby Medical Bldg./Community Health Care
155 1:00 – 2:00 PM 80.6% 30
6 US Post Office 24 12:00 – 1:00 PM 83.3% 4
7 Retail parking (First floor) 39 11:00 AM – 12:00 PM 46.2% 21
8 Crossfit Everett 28 4:00 – 6:00 PM 75.0% 7
9 Citrine Health 34 12:00 – 1:00 PM 44.1% 19
10 Everett Herald 97 1:00 – 2:00 PM 75.3% 24
11 Library parking garage 109 4:00 – 5:00 PM 60.6% 43
12.4
%
38.7
%
60.7
%
68.5
%
70.5
%
71.2
%
66.3
%
64.3
%
62.7
%
56.8
%
46.2
%
19.7
% 32
.1%
55.8
% 69
.8%
72.1
%
68.2
%
66.6
%
67.9
%
65.8
%
62.4
%
48.7
%
26.1
%
20.5
%
0%
10%
20%
30%
40%
50%
60%
70%
80%
Everett Parking Utilization Comparative 2015 vs 2007 Off-Street Occupancies (3,262 stalls)
2015 2007

2015 Downtown Everett Parking Study Page | 23
Lot ID Parking Facility Stalls Peak Hour Peak
Occupancy Stalls
Available
12 Monthly Parking/For lease 32 3:00 – 4:00 PM 53.1% 15
13 Awards of Praise/KSER 52 12:00 – 1:00 PM 2:00 – 3:00 PM
19.2% 42
14 KFC 23 11:00 AM – 12:00 PM
2:00 – 3:00 PM 26.1% 17
15 Hewitt/Grand 26 11:00 AM – 12:00 PM 80.8% 5
16 Trinity Garage 375 11:00 AM – 12:00 PM 58.9% 154
17 Old VFW Lot 62 11:00 AM – 12:00 PM 72.6% 17
18 Volunteers of America 40 3:00 – 4:00 PM 85.0% 6
19 Seattle Lighting 22 11:00 AM – 2:00 PM
3:00 – 4:00 PM 54.5% 10
20 1420 Hewitt 23 1:00 – 2:00 PM 56.5% 10
21 2727 Oakes 24 10:00 AM – 12:00 PM
2:00 – 3:00 PM 50.0% 12
22 YMCA 96 2:00 – 3:00 PM 63.5% 35
23 Comcast Arena Lot 54 11:00 AM – 12:00 PM
1:00 – 3:00 PM 37.0% 34
24 County Garage 1,210 10:00 – 11:00 AM 99.6% 5
25 Everpark Garage 493 12:00 – 1:00 PM 66.3% 166
Off-Street Supply Surveyed 3,262 12:00 – 1:00 PM 71.2% 939
All Off-Street 6,378 12:00 – 1:00 PM 71.2% 1,837
Figure I (next page) illustrates off-street peak-hour occupancies in heat map format. Only one facility shows occupancies in excess of 85%: the County Garage, which is effectively full at 99.6%. Six facilities experience moderate occupancy levels, four experience modest levels, and 14 experience low levels during the combined off-street peak hour.

Page | 24 Rick Williams Consulting / Barney & Worth
Figure I – 2015 Everett On-Street Parking Heat Map
IX. COMBINED ON & OFF-STREET PARKING SYSTEM COMPARISONS To understand how the complete parking supply is performing, RWC combined both on- and off-street datasets and contrasted them for each of the two survey years. The total number of parking stalls surveyed in 2015 increased 12% (556 stalls) over 2007 (4,548). The trend found in the analysis thus far holds true for the combined system, as overall parking occupancies have decreased two percentage points since 2007, from 69.4% to 67.1%. Table 14 (next page) depicts the combined comparative parking utilization data in both 2007 and 2015.

2015 Downtown Everett Parking Study Page | 25
Table 14 – Combined On & Off-Street Parking Supply Utilization
Use Type Year Stalls Peak Hour Peak
Occupancy Stalls
Available
On-Street 2015 1,842 11:00 AM – 12:00 PM 65.0% 607
2007 1,955 12:00 – 1:00 PM 69.5% 603
Off-Street Supply Surveyed 2015 3,262 12:00 – 1:00 PM 71.2% 939
2007 2,593 10:00 – 11:00 AM 72.1% 723
Total Supply Surveyed 2015 5,104 11:00 AM – 12:00 PM 67.1% 1,678
2007 4,548 10:00 – 11:00 AM 69.4% 1,393
Figure J provides a combined hour-by-hour comparison of the parking system in 2007 versus 2015. Utilization in 2007 exceeded 2015 results except for the 5:00–6:00 PM hour, and from 4:00–5:00 PM when occupancies were identical.
Figure J – Combined On & Off-Street Parking System Utilization
X. CONCLUSION & SUMMARY A. Conclusion From comparative data derived from the 2007 and 2015 studies, the following can be concluded for the combined parking system:
18.3
%
38.6
% 56
.9%
64.3
%
67.1
%
66.6
%
63.0
%
61.2
%
59.7
%
54.7
%
47.3
%
30.3
%
37.8
% 57
.3%
66.4
%
69.4
%
68.1
%
67.7
%
67.3
%
65.0
%
63.0
%
54.7
%
40.5
%
38.1
%
0.0%10.0%20.0%30.0%40.0%50.0%60.0%70.0%80.0%
Everett Parking Utilization Comparative Combined On & Off-Street Supply Occupancies (5,104 stalls)
2015 2007

Page | 26 Rick Williams Consulting / Barney & Worth
• Occupancies have marginally decreased. The peak-hour occupancy of the downtown’s combined on- and off-street parking system is 67.5%, down slightly from the 2007 combined occupancy of 70.5%. The on-street peak-hour utilization rate decreased from 69.5% to 65%, and the off-street rate decreased slightly from 72.1% to 71.2%. Both supplies remain under 85% in the peak hour.
• The average duration of stay exceeds 90 minutes. The City must consider more effective enforcement to limit employee use of the on-street supply, and a time-stay format that works for customers.
• On-street parking is constrained for approximately 40 block faces in Everett’s downtown core. During the midday peak of 11:00 AM to 12:00 PM, 38 of the 143 total block faces exceed the 85% threshold.
• While there are some constraints in the on-street system, there is also an abundance of parking available during the peak hour, particularly on the periphery of the study area.
• Transitioning longer-term parkers from constrained on-street areas (e.g., Hoyt/Colby node, high occupancy node) to the off-street supply should be feasible given the current availability of off-street stalls.
• A large number of employees continue to park in on-street spaces despite off-street availability. The evidence includes:
o High violation rate – The average violation rate among all on-street stalls was 14.2%. Twenty percent of total vehicle hours are in violation of posted time stays, leading to a loss of revenue, a disregard of enforcement, and a disruption in the intended use of the on-street system. Industry best practices target a violation rate between 5% and 7%. The city should consider increasing enforcement efforts.
o Vehicles parked for longer than four hours – 380 vehicles (6% of all vehicles) were parked on-street for stays of four hours or more. Despite a significant decrease from 2007, too many vehicles are staying longer than the posted time stay.
o Moving to evade – 360 vehicles were observed moving to evade parking citations. There
were 495 total moves to avoid enforcement and to escape paying for off-street parking.
• As Everett continues to develop and add new businesses, demand for both on- and off-street parking will grow steadily throughout the study area. The City should continue to track changes in parking demand and recalibrate the system as needed to maximize ease of use.
B. Summary
Comparing the 2007 and 2015 studies shows that parking activity by hour of occupancy is moderate (see Figure J, page 24) and relatively stable. However, when the data is viewed in smaller sub-sets, it

2015 Downtown Everett Parking Study Page | 27
becomes apparent that specific blocks in the downtown are experiencing some constraint. This is particularly evident in the areas along Colby Avenue, Wall Street, and Hewitt Avenue (Figure C). The off-street system displays similar utilization patterns as the on-street, but the County Garage facility is at full capacity (Figure I). From 2007 to 2015, conclusions and subsequent recommendations have not varied tremendously. The City should consider the following action items: Evaluate existing enforcement protocols and procedures and consider restructuring
enforcement activities achieve a violation rate between 5% and 7%. At minimum, convert existing 1-hour stalls to 90 minutes. Transition longer-term stays into off-street facilities. Monitor to ensure that time stays remain relevant and appropriate for on-street users.
This memorandum is intended to inspire on-going discussion, raise some thought-provoking questions, and serve as a platform for decision-making.