Embed Size (px)
Citation preview


1
Table of Contents Page
I. BACKGROUND.................................................................................................................................................... 3
A. The Policy Planning Process ............................................................................................................................ 3 B. Consultative Process for the PRSP.................................................................................................................. 4
II. THE STATUS OF POVERTY IN TANZANIA............................................................................................... 5
A. Income Poverty: Current Status and Recent Trends ..................................................................................... 5 B. Non-Income Poverty.......................................................................................................................................... 7 C. Regional Poverty and Welfare Ranking .......................................................................................................10 D. Poverty as Assessed by the Poor Themselves .............................................................................................11
III. POVERTY REDUCTION: PERSPECTIVES OF VARIOUS STAKEHOLDERS .................................11
A. “Grassroots” views as expressed at the Zonal Workshops........................................................................11 B. View of Parliamentarians................................................................................................................................ 13 C. Views of Various Stakeholders at the National Workshop .......................................................................13
IV. THE STRATEGY FOR POVERTY REDUCTION.......................................................................................13
A. Income Poverty .................................................................................................................................................14 B. Human Capabilities, Survival and Well-being............................................................................................18
V. FINANCING OF THE POVERTY REDUCTION PROGRAMME.......................................................... 22
A. Basic Considerations ........................................................................................................................................22 B. Overall Financing Envelope ...........................................................................................................................22 C. Composition of Public Expenditure ..............................................................................................................23 D. Specific Poverty Reduction Interventions.................................................................................................... 26
VI. MONITORING AND EVALUATION OF THE POVERTY REDUCTION STRATEGY...................29
A. Current and Proposed Indicators.................................................................................................................... 29 B. Indicators of Income Poverty.........................................................................................................................30 C. Indicators of Quality of Life and Social Well-Being .................................................................................30 D. Water and sanitation.........................................................................................................................................30 E. Macroeconomic Stability ................................................................................................................................ 30 F. Social Safety Nets ............................................................................................................................................31 G. Governance ........................................................................................................................................................31 H. Resource Allocation.........................................................................................................................................31 I. Indicators of participatory process ………………………… ...................................................................31
Box
1 Tanzania: The Policy Planning Process ………………………………………………………….. 3 2 Tanzania: Consultative Steps in Preparing the PRSP……….…………………………………….… 5 3 Tanzania: Regional Variation in Poverty, 1999…………………………………………………….10 Chart 1: Share of OC for the Priority Areas in Total Discretionary Recurrent Expenditures……….….. .27 Text Tables 1 Tanzania: Selected Economic and Financial Indicators, 1998-2002………………………………. 16 2 Breakddown of Expenditure Priority Items: FY 1999/2000 - 2002-2003…………………………..25 3 Proposed Budgetary Allocation for Priority Sectors, FY 1999/2000-2002/2003…………………. .28 Appendix Tables 1 Regional Welfare Ranking…………………………………………..………………………………….32 2 Tanzania: Central Government Operations, 1996/1997-2002/2003.………………………………….. 33 2 Tanzania: Central Government Operations, 1996/1997-2002/2003.………………………………….. 34 3 Disaggregation of Priority Sectors: FY2000-2003 ….………………………………….……………...35 3 Disaggregation of Priority Sectors: FY2000-2003 ………………….…………………………………36 Map Tanzania: Regional Variation in Poverty………………………………………………………… 37
2
Annex I : The Participatory Process of the PRSP……………………………………………………..38 Annex II : Logical Frame for the Tanzania PRSP……………………………………………………. 41 Annex III : Monitoring and Evaluations System for the Poverty Reduction Strategy………………… 48

3
I. BACKGROUND Since independence in 1961, the Government of Tanzania has been preoccupied with three development problems: ignorance, disease and poverty. National efforts to tackle these problems were initially channeled through centrally directed, medium-term and long-term development plans, and resulted in a significant improvement in per capita income and access to education, health and other social services until the 1970s. Thereafter, these gains could not be sustained because of various domestic and external shocks, and policy weaknesses. Indeed, despite sustained efforts since the mid-1980s, to address the country’s economic and social problems, one half of all Tanzanians today are considered to be basically poor, and approximately one-third live in abject poverty.
A. The Policy Planning Process More recent efforts to tackle poverty and the other development problems have been pursued under relatively decentralized, but largely complementary policy initiatives (Box 1).
Box 1 Tanzania: The Policy Planning Process
Policy Planning Initiative Objective § Vision 2025 National vision of economic and social objectives to
be attained by the year 2025 § National Poverty Eradication Strategy
(NPES) National Strategy and objectives for poverty eradication efforts through 2010
§ Tanzania Assistance Strategy (TAS) Medium-term national strategy of economic and social development, encompassing joint efforts of Government and the international community
§ Poverty Reduction Strategy Paper (PRSP) Medium-term strategy of poverty reduction, developed through broad consultation with national and international stakeholders, in the context of the enhanced Highly Indebted Poor Countries (HIPC) Initiative
Building Blocks 1. Policy reforms aimed at ensuring macroeconomic stability and market efficiency, being supported partly by the by the International Monetary Fund and the World Bank under the Poverty Reduction and Growth Facility (PRGF) and the Programmatic Structural Adjustment Credit (PSAC-I), respectively. 2. Reform of the public sector (including central and local Government), being supported under PRGF, PSAC-I, Public Service Reform Pr ogramme (PSRC) and by other initiatives supported by international partners 3. Development of sector-specific strategies, being supported by many international partners.. Vision 2025 lays out the long-term developmental goals and perspectives, against which the strategy for poverty alleviation (NPES) was formulated. The TAS is the result of a mutually felt need by the Government of Tanzania and its international partners for a comprehensive development agenda, around which issues pertaining to ongoing activities can be regularly discussed and assessed. As such, the TAS covers all the development areas that have characteristically been supported by the international partners, both within and outside the framework of the central Government budget. It is hoped that the TAS will provide a useful framework for organizing periodic consultations and dialogue among all development partners. The PRSP is an integral part of the HIPC process, focusing mainly on poverty
4
alleviation, subject to a relatively hard (central Government) budget constraint, starting in FY 2000/2001. Nevertheless, the PRSP encompasses poverty-oriented extra-budgetary activities, and various non-financial considerations that have an important bearing on poverty reduction. The elaboration of the PRSP has entailed broad consultation among the stakeholders—a factor that has contributed to underlying consistency in the country’s development policy objectives, including the strategy for poverty alleviation. This notwithstanding, the national policy planning process has features that call for continuous review and reassessment. First , substantial efforts toward poverty reduction by international partners are still being implemented outside the framework of the central Government budget. To ensure maximum progress toward poverty reduction and improved predictability of budgets, these efforts would need to be rationalized and realigned progressively, to reflect the PRSP priorities. Second, a large amount of international resources is being channeled through specific donor -driven projects, sometimes entailing duplication. An effective struggle against poverty will require continued efforts to channel these resources in the context of sector -wide development strategies. Third, a key step in the area of public sector reform, notably the Medium-Term Expenditure Framework (MTEF) exercise for FY 2000/2001 (July-June), preceded the formulation of the PRSP. The priority objectives of the latter will, therefore, need to be reflected more fully in the MTEF for 2001/2002 and the subsequent years. Finally, major reforms in key areas, especially local Government, education, and agriculture, are still being formulated, and their implication for poverty reduction and resource requirement cannot be assessed accurately now. The Government will, therefore, continue to review and adjust the poverty reduction strategy, in order to reflect the ramification of these reforms.
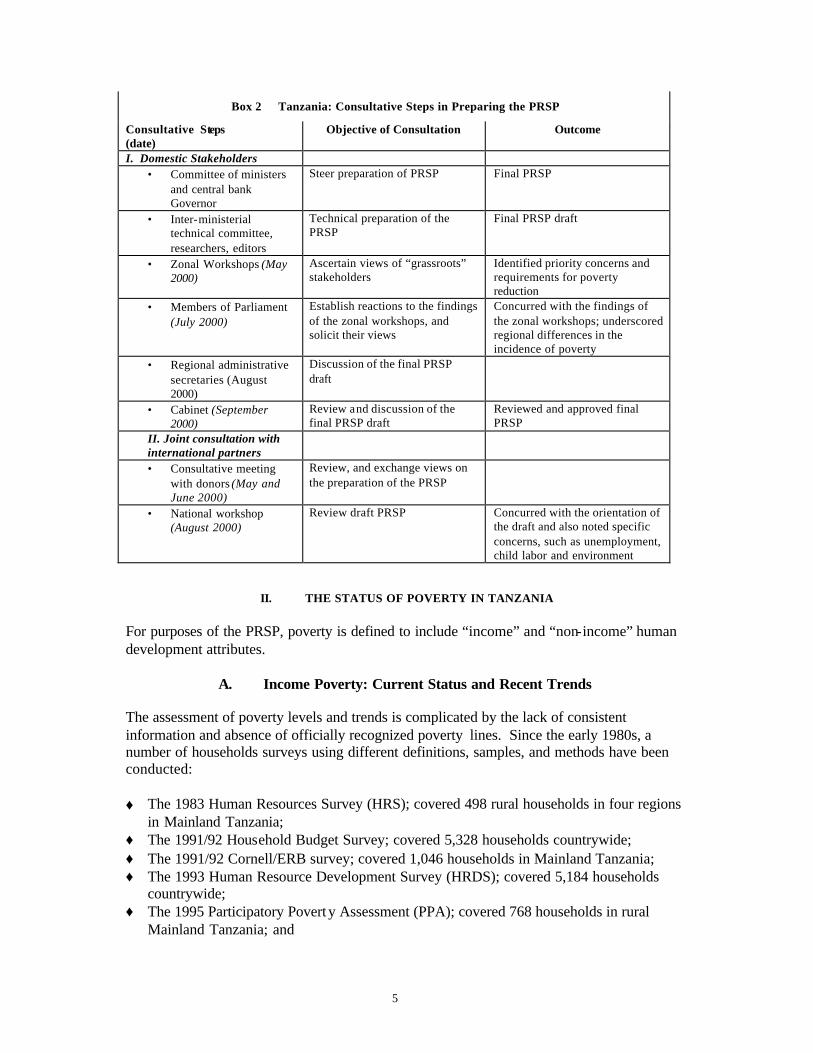
B. Consultative Process for the PRSP As noted above, the PRSP has been prepared through a process of consultation, detailed in Annex I and summarized in Box 2. The Zonal Workshops, which included a large number of representatives for the poor at the village level, were key in this process, and yielded results paralleling those of earlier participatory poverty assessments (PPA) by the World Bank (“Voices of the Poor” in the 1995 report) and the UNDP in Shinyanga (1997).1 In retrospect, the coverage of the poor could have been broadened even further, to include unemployed and under-employed youths, and the informal sectors. It is also possible that with a different sampling of the poor, the emphasis placed on certain views and concerns could have been somewhat different. The Government intends to continue to seek fuller representation of the poor and other stakeholders in the implementation, monitoring, and evaluation of the poverty strategy, and in subsequent revisions of the PRSP.
1 Among the findings of the World Bank study (“Voices of the poor”) is the importance which the poor attach to secure land tenure; availability of inputs, credit and suitable technology; ac cess to markets and health services; ability to save; and social capital (such as trust, unity, and participatory involvement).
5
Box 2 Tanzania: Consultative Steps in Preparing the PRSP
Consultative Steps (date)
Objective of Consultation Outcome
I. Domestic Stakeholders • Committee of ministers
and central bank Governor
Steer preparation of PRSP Final PRSP
• Inter-ministerial technical committee, researchers, editors
Technical preparation of the PRSP
Final PRSP draft
• Zonal Workshops (May 2000)
Ascertain views of “grassroots” stakeholders
Identified priority concerns and requirements for poverty reduction
• Members of Parliament (July 2000)
Establish reactions to the findings of the zonal workshops, and solicit their views
Concurred with the findings of the zonal workshops; underscored regional differences in the incidence of poverty
• Regional administrative secretaries (August 2000)
Discussion of the final PRSP draft
• Cabinet (September 2000)
Review and discussion of the final PRSP draft
Reviewed and approved final PRSP
II. Joint consultation with international partners
• Consultative meeting with donors (May and June 2000)
Review, and exchange views on the preparation of the PRSP
• National workshop (August 2000)
Review draft PRSP Concurred with the orientation of the draft and also noted specific concerns, such as unemployment, child labor and environment
II. THE STATUS OF POVERTY IN TANZANIA For purposes of the PRSP, poverty is defined to include “income” and “non-income” human development attributes.
A. Income Poverty: Current Status and Recent Trends The assessment of poverty levels and trends is complicated by the lack of consistent information and absence of officially recognized poverty lines. Since the early 1980s, a number of households surveys using different definitions, samples, and methods have been conducted: ♦ The 1983 Human Resources Survey (HRS); covered 498 rural households in four regions
in Mainland Tanzania; ♦ The 1991/92 Household Budget Survey; covered 5,328 households countrywide; ♦ The 1991/92 Cornell/ERB survey; covered 1,046 households in Mainland Tanzania; ♦ The 1993 Human Resource Development Survey (HRDS); covered 5,184 households
countrywide; ♦ The 1995 Participatory Povert y Assessment (PPA); covered 768 households in rural
Mainland Tanzania; and

6
♦ The 1998 REPOA survey; covered 649 rural households in three regions in Mainland Tanzania, and 148 peri-urban households in Dar es Salaam.
Partly due to the absence of official poverty lines, some studies have used their own lines. Thus, “lower lines” denote basic food needs, based on specific assumptions about eating habits, nutritional requirements, and cost; and “upper lines” cover, in addition to such food requirements, other essential needs, such as clothing, housing, water, and health. Moreover, a poverty line of one US dollar per day in real terms (using purchasing power parity exchange rate) has been used to facilitate comparison with other countries. Notwithstanding the data problems, poverty is, no doubt, pervasive and deep. Based on the 1991/1992 HBS, around 27 percent of the people were in households with total expenditure that was insufficient to obtain enough food to meet nutritional requirements, and about 48 percent of the households were unable to meet their food and non-food basic requirements. The results of various updated estimates for year 2000 suggest that poverty levels may have increased, to well over 50 percent for Mainland Tanzania. For the purpose of this PRSP, and given the inconclusiveness of the updated results, the 1991/1992 poverty baselines are used extensively in the discussion below, and references to other sources are made where appropriate. These baselines will be updated, based on the preliminary results of the ongoing HBS, which will be available in early 2001.
(a) Characteristics of Income Poverty
(i) Poverty is largely a rural phenomenon
In the rural areas, incomes are lower and poverty is more widespread and deeper, than in the urban centres. According to the 1991/92 HBS, basic needs rural poverty incidence is estimated at 57 percent, and the food poverty incidence is about 32 percent. Tentative estimates for year 2000 suggest that the incidence of poverty in the rural areas may have increased.
(ii) The poor are concentrated in subsistence agriculture
The 1993/1994 HRDS indicates that within the rural areas farmers are poorer than non-farmers. According to the 1991/1992 HBS, the poverty incidence for households whose heads work in own farms is 57 percent. These results are also supported by the 1998 REPOA rural survey. In addition, farmers that grow cash crops have higher incomes than those who do not, holding farm size, education, and other factors constant.
(iii) Urban poverty is also widespread and increasing
Although poverty is less acute in the urban area, it is still a serious problem, especially in urban areas other than Dar es Salaam. According to the 1991/1992 HBS, the basic needs poverty incidence for Dar es Salaam was 5.6 percent, and for the other urban areas, 41 percent. These results are supported by the 1993/1994 HRDS, with corresponding figures of 4.2 percent and 30.8 percent, respectively. Results from updated estimates for year 2000 suggest

7
that the incidence of poverty may have increased further. The urban poor are concentrated in the informal sector.
(iv) The youth, the old, and large households are more likely to be poor
According to the 1991/1992 HBS, 44 percent of the population is below the age of 15, and 4 percent is aged 60 or over, implying a dependency ratio of over 0.9. Other surveys show higher dependency ratios. The REPOA (1998) rural survey data yields an overall dependency ratio of 1.1. Moreover, the 1991/1992 HBS indicates that the proportion of the poor increases as the level of dependency rises. Households with a dependency ratio of 0 – 0.25 showed a basic needs poverty incidence of 32.1 percent, while those with a ratio of 0.75 – 1.0 showed a poverty level of 55.8 percent. Other surveys also confirm the relationship between household size and poverty. According to the 1991/1992 HBS, people living in households of seven or more are two thirds more likely to be poor than those living in households of six or less. The 1993 HRDS data indicates that households of 6-10 people are nearly twice as likely to be poor than households of 1-5 people.
(v) Although female-headed households are not necessarily poorer than male-
headed households, women are generally perceived to be poorer than men
Women represent 51 percent of the population and head 14 percent of the households. Results from household surveys show that women-headed households are not necessarily poorer than male-headed households. For example, the 1991/1992 HBS shows a poverty incidence level of 45 percent for female -headed households, and 49 percent for male-headed households. A recent case study established that male-headed household (without wives) are likely to be as poor as female-headed households (without husbands). This notwithstanding, a good number of studies suggest that women are in fact poorer than men. In particular, according to the results of the PPA (1995) survey, women perceive themselves to be poorer than men owing to their vulnerability, the lack of asset ownership (including land and livestock) and limited schooling.
(b) Changes in the Incidence of Poverty
The incidence of poverty appears to have declined during 1983-1991 and 1991-1993, and risen during 1993-1998. The more recent deterioration in the poverty situation is probably attributable to worsening income inequality, and relatively low rate of economic growth, particularly in the rural areas.
B. Non-Income Poverty
(a) Education
Broadly based primary school education plays a major role in strengthening human capabilities and reducing poverty. Tanzania’s literacy rate was estimated at 84 percent in 1997, with the rate for women being somewhat lower than that for men. Primary school gross enrolment rate is currently estimated at 78 percent, reflecting

8
approximately equal rates for boys and girls (79 percent and 77 percent, respectively). The overall net enrolment rate is, however, much lower (57 percent).
The available data suggests that the poor are more likely to be less educated. In 1991, 54.3 percent of the rural poor were literate, compared to 61 percent for the rural population as a whole. Between 1983 and 1991, illiteracy among the poor increased, while the proportion of illiterate women remained more or less the same, but still higher than any other socio-economic group. In addition, data from the HRDS (1993/1994) suggest that gross enrolment rates among poor children aged 7-9 decreased from 82 percent in 1983 to 80 percent in 1993.
(b) Survival
High mortality rates (especially among infants and under-five children) and corresponding low life expectancy are an important dimension of poverty. In 1999, infant mortality was estimated at 99 per 1,000 live births, and under-five mortality was 158 per 1,000 live births. Although these rates represent a major improvement over the 1970 rates, recent evidence suggests that infant and the under-five mortality rates have begun to level off, and some areas may even be witnessing a slight increase at present. The leading killer diseases for infants and under-five children are malaria, anemia and pneumonia. In addition, maternal mortality is still high, currently estimated at 529 per 100,000 live births. Recent estimates put the average life expectancy at birth at 48 years of age, compared to 52 years in 1990 and 45.3 years in 1970. The more recent decline in life expectancy is largely attributable to the impact of HIV/AIDS and other communicable diseases. At present, AIDS is the leading killer disease in the age group 15-59 years in sampled districts of Dar es Salaam, Hai and Morogoro rural. For example, AIDS accounts for as high as 35.5 percent and 44.5 percent of male and female deaths in that age group in Dar es Salaam; AIDs is followed closely by malaria and tuberculosis.
Infant mortality rates appear to be much higher for the poor, especially in the rural areas, than for the general population. The Demographic and Health Survey data shows a high rate (per 1,000 live births) of 113.7 for the first asset quintile, compared to 87.7 for the fourth asset quintile in 1991. The corresponding rates for 1996 were 116.2 and 99.9.
(c) Nutrition
Malnutrition among children is a good indicator of poverty levels or social well-being. Available statistics reveal that there is a considerable degree of chronic malnutrition in Tanzania. In 1996, 43 percent of the children under five were found to be stunted (low height for age) and 18 percent were severely stunted. Acute malnutrition is measured in terms of weight for height, (that is “wasting”). In 1996, 7 percent of the children under five were classified as wasted, and 1 percent were severely wasted. A combined measure of chronic and acute malnutrition is weight for age. More than 30 percent of the children under five are under weight for their age. Comparisons with earlier data on children’s nutrition status show that there has hardly been any improvement over the past decade.

9
According to the HRDS data, malnutrition increases with poverty. In 1991, about 43 percent of the stunted children came from families in the first asset quintile, and 26 percent came from families in the fifth asset quintile. The corresponding percentages for 1996 are 46 percent and about 8 percent. The majority of the poor in the rural areas, who produce their own food for consumption, are more likely to be malnourished. Localised food insecurity and famine are common, and compounded by inadequate resource endowments at the household level.
(d) Clean and safe drinking water
About 68 percent of the urban population have some kind of access to piped water, and less than half of them obtain 24-hour service. In the rural areas, about 45 percent of the population have access to a safe water source, and about 30 percent of the facilities are not functioning properly. According to the 1991/92 HBS, about 53 percent of the population use unprotected water sources. These people are more likely to be poorer (with poverty incidence of 52.5 percent) than those who use pipe water in their homes (17.5 percent), and those who use private pipes located outside their houses (24.8 percent). In addition, only a limited number of the existing waste waters treatment facilities work. Outbreaks of cholera and waterborne diseases affect mostly low-income neighbourhoods, with households that have no access to piped water. Moreover, many poor families rely on water vendors who charge rather heavily for their service, or spend a substantial amount of their time fetching water.
(e) Social well-being
Tanzania has a long history of participatory planning and implementation of public programmes. However, institutional disruptions that took place in the late 1960s and early 1970s fostered centralized Government control at the expense of participatory involvement of the poor and grassroots organizations. Ongoing political and administrative reforms are aimed at reversing this trend. The right to security, justice, peaceful life, and freedom are important aspects of survival. In general, Tanzania has enjoyed peace, stability and unity since independence. Recently, the effectiveness of the instruments of law and order, and the judiciary appears to have eroded. For example, the proportion of filed cases that are decided on a timely basis is only 63 percent, and the High Court of Appeal holds only 50 percent of its planned sessions. Moreover, the Warioba report cites the police and judiciary as highly corrupt institutions.2
(f) Vulnerability
A major concern of the poor is their vulnerability to unpredictable events. In Tanzania, famine often results from either floods or drought. Since the mid-1990s, Tanzania has in fact experienced a series of adverse weather conditions, which undermined food security. Another threat is the increasing impact of HIV/AIDS on the number of orphans, currently estimated at 680,000. Many communities have to deal with growing numbers of AIDS victims and orphans, the handicapped, the very old, and refugees. There is, therefore, a growing need for safety-nets. This point was
2 The report contains the findings of a presidential commission on corruption, established in 1995 and headed by Justice Joseph Warioba (former Prime Minister).
10
noted in the recent Zonal Workshops. The apparent breakdown of traditional systems that used to take care of vulnerable groups and the escalating number of dependent persons have increased the need for safety-net programmes. Several initiatives to update the database for poverty analysis are being implemented, namely: a new Household Budget Survey covering 15,000 households (being carried out over the period April 2000-April 2001) to enable an update of the poverty status; a pilot labour survey to establish the baseline data for the labour market; a Demographic and Health Survey in 2001; an updated Social Accounting Matrix to allow impact assessment of income and policy interventions on poverty; and Population and Housing Census in 2002 (see Annex II for further details).
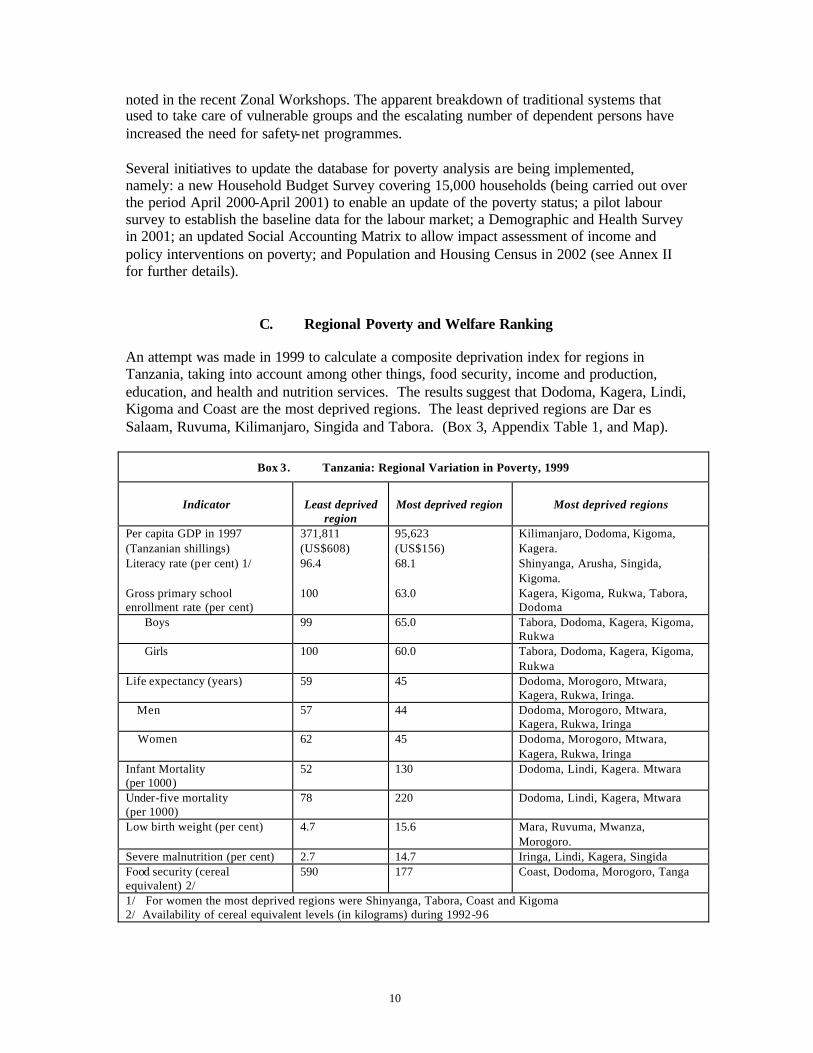
C. Regional Poverty and Welfare Ranking An attempt was made in 1999 to calculate a composite deprivation index for regions in Tanzania, taking into account among other things, food security, income and production, education, and health and nutrition services. The results suggest that Dodoma, Kagera, Lindi, Kigoma and Coast are the most deprived regions. The least deprived regions are Dar es Salaam, Ruvuma, Kilimanjaro, Singida and Tabora. (Box 3, Appendix Table 1, and Map).
Box 3. Tanzania: Regional Variation in Poverty, 1999
Indicator
Least deprived
region
Most deprived region
Most deprived regions
Per capita GDP in 1997 (Tanzanian shillings)
371,811 (US$608)
95,623 (US$156)
Kilimanjaro, Dodoma, Kigoma, Kagera.
Literacy rate (per cent) 1/ 96.4 68.1 Shinyanga, Arusha, Singida, Kigoma.
Gross primary school enrollment rate (per cent)
100 63.0 Kagera, Kigoma, Rukwa, Tabora, Dodoma
Boys 99 65.0
Tabora, Dodoma, Kagera, Kigoma, Rukwa
Girls 100 60.0
Tabora, Dodoma, Kagera, Kigoma, Rukwa
Life expectancy (years) 59 45 Dodoma, Morogoro, Mtwara, Kagera, Rukwa, Iringa.
Men 57 44
Dodoma, Morogoro, Mtwara, Kagera, Rukwa, Iringa
Women 62 45
Dodoma, Morogoro, Mtwara, Kagera, Rukwa, Iringa
Infant Mortality (per 1000)
52 130 Dodoma, Lindi, Kagera. Mtwara
Under-five mortality (per 1000)
78 220
Dodoma, Lindi, Kagera, Mtwara
Low birth weight (per cent) 4.7 15.6 Mara, Ruvuma, Mwanza, Morogoro.
Severe malnutrition (per cent) 2.7 14.7 Iringa, Lindi, Kagera, Singida Food security (cereal equivalent) 2/
590 177 Coast, Dodoma, Morogoro, Tanga
1/ For women the most deprived regions were Shinyanga, Tabora, Coast and Kigoma 2/ Availability of cereal equivalent levels (in kilograms) during 1992-96

11
D. Poverty as Assessed by the Poor Themselves Two major participatory poverty assessments have been carried out in Tanzania; one by the World Bank (‘Voices of the Poor’, in 1995) and the other by the UNDP (in Shinyanga, 1997). Both assessments provide useful additional information on poverty in the country. The ‘Voices of the Poor’ study, which covered more than 6,000 people in 87 villages, revealed differences between men and women in the perception of poverty. According to the study, the poor attached importance to secure land tenure, availability of agricultural inputs, credit and suitable technology; good transport; access to markets; and the potential to save. Limited access to quality health services was also identified as a cause of poverty. Perhaps the most striking finding of the World Bank study, was the important role that “social capital” (trust, unity and spirit of participation) and plans at the village level in fostering development. A UNDP study was carried out in 8 localities in Shinyanga Region during 1997. This study highlighted livelihood insecurity, poor social service provision, and gender inequality as factors that contribute significantly to poverty. Cultural constraints, weak governance, scarcity of funding, and poor infrastructure were also identified as development obstacles. Gender bias in the control of household resources, was of particular concern to women. These factors were reiterated in the zonal workshops organised in the course of the PRSP process.
III. POVERTY REDUCTION: PERSPECTIVES OF VARIOUS STAKEHOLDERS
A. “Grassroots” views as expressed at the Zonal Workshops At the Zonal Workshops, six problem areas, largely conforming to the broad concept of poverty discussed above, were identified; participants also proposed various ways of dealing with the respective problems. The consultation with other stakeholders reconfirmed the findings from the Zonal Workshops and provided complementary insights that have been taken into account in formulating the PRSP. (a) Income poverty Various causes of income poverty, especially in the agricultural sector, were identified, namely: ♦ Poor working tools and technology (highlighted by over one -third of the groups involved
in the workshops); ♦ Non-availability of farm inputs (approximately one third); ♦ Poor roads (nearly one third); ♦ Limited access to markets (one third); ♦ Non-availability of credits (almost one third); ♦ Collapse of cooperatives (one sixth); ♦ Adverse climatic conditions (one -sixth); and ♦ Absence of safety-nets to cope with (weather-related) short-term fluctuations in income
(one-sixth).
12
In order to cope with these problems, the participants at these workshops underscored the need for (i) new and strengthened rural credit mechanisms; (ii) improved research and extension services, possibly including one extension agent per village; (iii) enhanced ability, especially at the community level, to repair and maintain rural roads; (iv) the revival of agricultural cooperatives; (v) improvement and expansion of irrigated farming; and (vi) effective safety-nets, to assist vulnerable groups. (b) Education Over one half of the groups participating in the Zonal Workshops cited education as a major concern, and specifically noted the following problems: ♦ Limited access to primary school education; ♦ Poor quality; ♦ Inhibiting role, especially in regard to access, of the cost-sharing mechanisms, including
the misuse, and lack of transparency in the deployment of funds contributed by parents; ♦ High dropout rates; and ♦ High rate of illiteracy. Virtually all groups participating in the Zonal Workshops were of the view that under the PRSP, the Government should give overriding attention to these problems. More specifically, the participants called for interventions to bolster primary school enrollment and retention rates; raise the quality and relevance of education; and facilitate access to primary school education, including a review of the cost-sharing arrangements. (c) Health Health was ranked third, next to education and agriculture, among the areas deserving prior ity attention under the PRSP. Specific concerns of the participants included the poor level of health education; weak service provision, especially in the rural areas; and the limited involvement of the poor in the design of health plans and programs. Underlying these concerns was a sense of alarm (shared by groups from all the regions) in regard to the HIV/AIDS epidemic, and high rates of morbidity and mortality. (d) Governance Over one-half of the groups in the Zonal Workshops noted that poor governance was an area of concern. In this connection, the groups underscored the lack of transparency and accountability, notably at lower levels of Government administration; and the inadequate financial support being provided for sectors that are deemed key in poverty reduction. (e) Gender, social, and cultural issues Slightly over one-half of groups at the workshops mentioned that cultural customs and traditions were an obstacle to poverty reduction. A related issue that was cited by about one-sixth of the groups was gender discrimination, especially in regard to customary ownership of property; participation in wage employments; and decision making at the national and household level. A breakdown, by gender, of the concerns of the workshop participants revealed that (i) rural women were proportionately more concerned about the role of cultural customs and traditions than rural men; (ii) women raised the issue of gender discrimination

13
more frequently than men; and (iii) about one quarter of the women expressed concern about laziness and drunkenness among men. (f) Other areas of concern Other areas that were emphasized by the participants in the 62 groups formed at the Zonal Workshops included the development of the economic infrastructure, notably all-weather roads and building local capacity for road repair and maintenance (mentioned by 44 groups); the development of water resources (22), telecommunications (15), and financial markets (12); and the promotion of environmentally sensitive exploitation of land (4) and other natural resources.
B. View of Parliamentarians Parliamentarians reviewed and concurred with reported findings of the Zonal Workshops. However, they emphasized one point that was not a focus of zonal discussion—they stressed that the poverty reduction strategy would need to take into account regional differences in regard to the status of the poor.
C. Views of Various Stakeholders at the National Workshop
During the national workshop that was held to review the draft of the PRSP, partic ipants (including international partners) concurred that the outlined strategy to reduce poverty in Tanzania constituted an appropriate response to the concerns and views of the poor, as evinced at the Zonal Workshops. The participants at this workshop also made complementary observations concerning the need to (i) address the problem of unemployment among youths and in the urban areas; (ii) arrest environmental degradation; (iii) stop the use of child labour; (iv) increase financial support (including through extra debt cancellation and other forms of international support) for programs aimed at reducing poverty; (iv) develop rural financial mechanism that meet the needs of the “small” farmer; (v) develop “micro”, small and medium enterprises; (vi) inculcate a sense of self -reliance; (vii) intensify efforts aimed at developing an enabling environment for the private sector; and (viii) facilitate the use of relevant research findings.
IV. THE STRATEGY FOR POVERTY REDUCTION3
The poverty reduction strategy is based on three considerations. First, the strategy is viewed as an instrument for channeling national efforts toward broadly agreed objectives and specific inputs and outputs. The elaboration and implementation of the strategy are fundamentally ongoing processes. While a wide variety of key interventions has already been launched, the preparation of strategies for certain sectors, such as agriculture and education, are still underway. Moreover, the implementation of reforms aimed at shifting the responsibility for formulating, implementing, and monitoring poverty reduction intervention by the districts, municipalities, and communities at the grassroots, has started, but it will take some time to complete. The overall strategy of poverty reduction will, therefore, need to be managed
3 A more detailed outline of impact, outcome, and intermediate indicators and requisite actions is contained in Annex II

14
flexibly, to accommodate additional action plans and activities emanating from the ongoing work. Second, the poverty reduction strategy is to a large extent, an integral part of ongoing macroeconomic and structural reforms that are being supported by Tanzania’s multilateral and bilateral partners. Some of these reforms, including those being supported under the PRGF and the PSAC-1, are expected to have a significant impact on the welfare of the poor.4 Accordingly, the Government has chosen, as detailed below, to accelerate selected reforms that are likely to have a major impact on poverty reduction. Finally, in keeping with the concerns of the stakeholders, and guided by the overarching orientation of Vision 2025 and the NPES, the focus of the poverty reduction strategy concentrates on efforts aimed at (i) reducing income poverty; (ii) improving human capabilities, survival and social well-being; and (iii) containing extreme vulnerability among the poor.
A. Income Poverty Available quantitative analysis, from within and outside the country, provides strong evidence that economic growth is a powerful means of reducing income poverty. Because of this, a key objective of the poverty reduction strategy will be to promote accelerated and equitable growth. Specifically, over the three-year period, 2000/2001-2002/2003 (July-June), annual GDP growth is targeted to accelerate from about 5.2 per cent to 6 per cent. Moreover, under the three-year period, real value-added of agriculture, w hich provides a livelihood for the majority of the poor, is expected to increase at an average annual rate of about 5 per cent, compared to 3.6 per cent during 1990-1998. In keeping with past trends, the growth of the industrial and service sectors is anticipated to be higher than that of agriculture. The Government believes that these rather ambitious targets are achievable, in view of the potential beneficial effect of a stable macroeconomic environment and the efficiency-promoting structural reforms, some of which will be front-loaded. Moreover, provided the envisaged growth in agriculture and the rest of the economy is distribution-neutral, the available simulations indicate the targeted pattern of sectoral growth is consistent with: ♦ Reducing the proportion of the population below the basic poverty line from 48 percent in
2000 to 42 per cent in 2003 (compared to a longer-term target under the NPES of 24 percent by 2010);
♦ Reducing the proportion of the rural population below the basic poverty from 57 pe r cent to 49.5 per cent (29 percent in 2010); and
♦ Reducing the proportion of the food poor from 27 per cent to 23.5 per cent (14 per cent in 2010).
In pursuit of the above poverty reduction objectives, supporting measures will be needed in four strategic areas. First, the Government will continue to maintain sound macroeconmic policies and intensify the implementation of reforms aimed at bolstering market efficiency, notably in agriculture, and raising factor productivity. Second, while the budgetary expenditure will continue to be restrained because of macroeconomic considerations, special efforts will be made to channel the limited Government resources toward the support of key programs and social services under the poverty reduction strategy (discussed in Section V). Third, the Government will put increased emphasis on reforms aimed at promoting export-
4 The policy matrix in the Interim PRSP also outlined details of the reform measures being implemented.
15
oriented expansion and diversification of the “pro-poor” sectors, with a view to enabling the poor to share increasingly in the benefits of globalization. Fourth, efforts will be made to raise steadily investment as a percent of GDP from 15 per cent to approximately 17 per cent, including through initiatives focusing on bolstering private investment in the cultivation of traditional and new crops, small and medium size enterprises, and informal sector activities. (a) Sustaining Macroeconomic Stability Since the mid-1990s, significant progress has been made toward restoring macroeconomic stability. In particular, inflation has been reduced to a single digit level, and fiscal imbalances are now in a prudent range. As part of the poverty reduction strategy, the Government will continue to consolidate the substantial progress that has been achieved in the macroeconomic area. In addition to the above-noted objective of accelerating GDP growth to 6 percent, other macroeconomic objectives include (i) sustained efforts to maintain domestic inflation at approximately 4 per cent annually (broadly in line with anticipated inflation in Tanzania’s main trading partners, Table 1); (ii) ensuring that the exchange rate for the Tanzanian shilling will continue to be market-determined; and (iii) maintaining gross official international reserves at the equivalent of approximately 4 months of imports of goods and non-factor services.

16
In support of these objectives, budgetary performance will be strengthened, with the overall fiscal deficit (including grants, on a cheques cashed basis) being maintained at a modest level. To this end, the tax effort will be intensified through measures to broaden the tax base (including through the control of tax evasion) and tax administration will be improved (reform of customs administration and introduction of Tax-payer Identification Number). The allocation of budgetary expenditure will continue to reflect the MTEF and PER guidelines and also take into account the objectives of poverty reduction. Moreover, fiscal accountability will be fostered through expanded use of the Integrated Financial Management System and ongoing efforts to strengthen financial management capacity at the local Government level. These, and other measures aimed at promoting macroeconomic stability and accelerating growth, are contained in a comprehensive program that is being supported under the PRGF and PSAC-I. (b) Rural Sector Development and Export Growth Prior to the mid-1980s, attempts at agricultural transformation encountered problems of design and implementation. State involvement substituted for grassroots initiatives, and agriculture was heavily taxed. More recently, there has been a significant shift away from these policies, to market-oriented approaches. Notwithstanding the generally positive impact of these reforms, notably on output and average productivity, there has been wide- spread dissatisfaction, evident from the findings of the Zonal Workshops, concerning the limited availability of, and access to, credit agricultural inputs and extension services, and the low level of technology.
Table 1. Tanzania: Selected Economic and Financial Indicators, 1998-2002
1998 1999 2000 2001 2002Prov. Proj. Proj. Proj.
GDP and pricesReal GDP 4.0 4.7 5.2 5.6 6.0Real GDP per capita 1.2 1.9 2.3 2.7 3.1Consumer price index annual average 12.8 7.9 5.6 4.5 4.0
Public finance 1/Domestic revenue (excluding grants) 11.3 11.2 11.3 11.8 12.0Expenditure 14.7 16.9 16.5 17.3 16.8Overall balance (including grants; checks cleared) 2/ 0.3 -1.7 -0.4 -1.0 -0.4
Savings and investmentGross domestic savings 6.4 6.2 6.3 6.5 6.6
Government 0.9 0.9 0.9 0.9 0.9Nongovernment 5.6 5.4 5.5 5.6 5.8
Investment 15.6 15.2 16.0 16.5 17.0Government 3.3 3.1 4.5 4.4 4.4Nongovernment 12.4 12.1 11.5 12.1 12.6
Resource balance -9.2 -8.9 -9.7 -10.0 -10.4
Gross official reserves in months of imports of goods 3.4 4.1 4.2 4.2 4.3and nonfactor services
1/ Fiscal years (July-June), beginning in the year indicated in the column header.2/ Excluding the cost of bank recapitalization.
(Change in percent, unless otherwise indicated)
(In percent of GDP, unless otherwise indicated)

17
In response to these concerns, the Government will endeavor to ensure that the poor and the private sector in general, take the lead in developing durable mechanisms and schemes that are effective and, as far as possible, market-oriented. In particular it is expected that: ♦ Credit will be provided by crop buyers, banks, and cooperatives rather than the
Government; ♦ Farmers will be encouraged to organize themselves in groups or cooperatives, with a view
to improving their prospects for obtaining credit from financial institutions, as well as carrying out crop-specific research and other initiatives, to bolster output and raise the quality of their products;
♦ Private crop buyers or traders will be encouraged to continue to experiment with voucher schemes and other mechanisms to facilitate the purchase of fertilizers and insecticides;
♦ Local communities will play a more active role in rehabilitating and maintaining rural roads;
♦ Communities will also be encouraged (as far as possible with the support of the Government) to develop irrigated farming.
For its part, the Government will confine its own interventions mainly to the elaboration of sound policies, and also support the rural sector through: ♦ Training primary societies or cooperatives on organizational and financial management
aspects; ♦ Providing demand-driven research, and crop extension services; ♦ Working with international partners in providing training and other forms of support to
local communities in the repair and maintenance of rural roads; ♦ Supporting labour -intensive, agro-processing (notably of cashewnuts, cotton, coffee and
other crops); ♦ Putting into effect the new Land Act and ensuring that related regulations facilitate the
use of land as collateral for purposes of commercial transactions; ♦ Rationalizing physical controls that constrain crop movements within the country and
across international borders; ♦ Particular attention to the most deprived regions, including through priority allocation of
budgetary resources; and ♦ Encouraging the on-going efforts by NGOs and local banks to provide credit, training,
and other forms of support to the informal sector, as well as small-and medium-scale enterprises.
A forward-looking dimension of the poverty reduction strategy will include concerted efforts to increase traditional and new export products and, to the extent possible, non-agricultural products of small- and medium-scale enterprise. The above-noted efforts to raise the quantity and quality of marketed agricultural products will be key. Additionally, the Government will, where appropriate, provide extension, training, “best practices” workshops, and other forms of support to entrepreneurs seeking to produce or export new products. Most of the above-listed interventions are already in the process of implementation. The Government will continue to review their effectiveness, and examine other ways of strengthening its intervention in support of the development of the rural sector. The outcome of these efforts will be incorporated in an agriculture sector strategy that is under preparation, as well as in a broadened strategy for the development of the rural sector.

18
(c) Private Sector Development Since 1993, the Government has been taking a variety of measures to spur private investment. These measures include adoption of the Tanzania Investment Act, the privatization of public enterprises, and the establishment of the Tanzania Investment Centre (TIC). Despite these and other measures which have been taken, the response of private investors has fallen below expectation (except in the mining and tourism sectors). Accordingly, the Government has resolved, on its own, to bring forward a number of important reforms that had been programmed under PSAC-I. Among the reforms that will now be implemented before mid-2001 are: ♦ Restructuring and restaffing of the TIC, to serve as an investment -promotion agency in
keeping with its newly developed corporate strategy; ♦ Preparing the Commercial Court project plan, and establishing an automatic filing and
registry system through computerization; ♦ Submitting the new companies legislation to Parliament for approval; and ♦ Approving a proposal to relax restrictions on foreign portfolio investment in equities with
appropriate safeguards. In addition, the Government has decided to: ♦ implement forcefully reforms that will help reduce the excessive cost of utilities
(including electricity) to industry; and ♦ accelerate adoption of key reforms in the National Anti-Corruption Strategy.
B. Human Capabilities, Survival and Well-being While the picture in regard to the overall strategy and objectives for improving human capabilities, survival, and well-being is fairly clear, an assessment of required inputs and their costing is still continuing. The Government is determined to have this outstanding work completed quickly. In this regard, the following tasks will be carried out or launched in the course of FY 2000/2001: ♦ A national strategy for primary school education by July 2001, together with detailed
district plans (including costing of needed inputs) for 50 districts that will be covered under the ongoing school mapping exercise. Guidelines for preparing these district plans will be issued shortly by the Ministry of Education;
♦ A national agricultural strategy (including costing of key interventions) will be finalized and approved by June 2001, building on a draft strategy that is currently being reviewed;
♦ Based on the above noted-strategy, the Government will elaborate a broader development strategy for the rural sector, covering all dimensions of poverty reduction and seek to have it completed by December 2001; and
♦ The Government intends to bring all districts under the Local Government Reform Programme (LGRP), and will develop district-specific poverty reduction plans by the end of FY 2002/2003.
Subject to these caveats, the strategy on the non-income side of the poverty reduction strategy will reflect a number of important considerations. First, the Government is aware that a large proportion of existing service delivery facilities are in poor condition and that the services

19
being provided are of poor quality. Primary emphasis will, therefore, be placed on rehabilitating existing structures and raising the quality of the services being offered. Decisions to construct new facilities will, however, be left mainly to local authorities. Second , although the Government will be seeking to bring externally funded operations within the purview of the budget, a large volume of activities will probably continue to be donor driven and remain outside the budget. Because of this, the Government will involve its development partners in reviewing the sectoral strategies under preparation and the key aspects of the LGRP, with a view to enlisting strong and coherent support for the poverty reduction strategy, thereby ensuring greater consistency of donor programs with government priorities. Third , while the Government, guided by the 2000/01 MTEF and PER exercises, is resolved to bolster budgetary support for key social services, it is almost certain that an effective programme of poverty reduction will, as discussed below, call for “additionality” of resources. The Government is planning to provide a more detailed assessment of financial requirements for the poverty reduction programme in the context of the budget for FY 2001/2002. (a) Education The Government intends to achieve the following specific objectives in the area of education during the three-year period ending 2003:
♦ Raise gross primary school enrolment to 85 percent; ♦ Increase the transition rate from primary to secondary school from 15 percent to 21
percent, and reduce the drop-out rate in primary school from 6.6 percent to 3 percent; ♦ Raise net primary school enrolment from 57 percent to 70 percent; ♦ Increase the number of students passing Standard VII examination at a reasonably high
standard (to be specified) from 20 percent to 50 percent; and ♦ Expand adult education programmes. In pursuit of these objectives, special efforts (including teacher upgrading and reallocation, strengthening of inspectorate services, improvement in availability of textbooks, rehabilitation of classrooms, and appropriate modification in the pupil-teacher ratios) will be made to raise educational attainment. The Government will continue to support basic costs in primary education, especially salaries of teachers. Moreover, in a reversal of past policies, it is intended to abolish primary school fees, starting in FY 2001/2002.
(b) Health In order to raise the productive life of Tanzanians, the Government will place special emphasis on reducing morbidity, improving nutrition, and strengthening access to health services and safe water. The national goal in this regard will be to arrest the decline in life expectancy (owing to the impact of HIV/AIDS), and then raise it to 52 years by the year 2010. In line with this overarching goal, the Government intends to pursue policies and programs, which will: ♦ Lower infant mortality rate from 99 per 1000 to 85 per 1000 by 2003; ♦ Reduce under-five mortality from 158 to 127 per 1000 by 2003; ♦ Lower maternal mortality from 529 pe r 100,000 to 450 per 100,000 by 2003; ♦ Reduce malaria -related fatality for under-five children from 12.8 percent to 10 percent by
2003; and
20
♦ Raise the proportion of the rural population that has access to safe and clean water from 48.5 percent in 2000 to 55 percent in 2003.
In pursuit of these objectives, the Government is making substantial progress toward the immunization of children under 2 years against measles and DPT. The national objective of raising the percentage of immunized children under 2 years, from 71 percent in 2000 to 85 percent in 2003, should be attained. The Government is also determined to improve the availability of drugs and medical supplies. To this end, revolving funds have now been established in virtually all hospitals in the country. Moreover, special efforts will be made to raise the share of districts with active HIV/AIDS awareness campaigns to 75 percent by 2003, and increase, over the same period, the coverage of births by trained personnel from 50 percent to 80 percent. A number of initiatives that will be developed and costed over the coming months: ♦ Provision of quality health service, through essential health package delivery; ♦ Strengthening and reorienting the delivery of secondary and tertiary health services, to
ensure more effective support of primary health care; ♦ Personnel training; ♦ Promotion and coordination of private sector and civil society activities in the health
sector; ♦ Rehabilitation of malfunctioning water supply schemes, protection of water sources, and
some expansion of new schemes (to be determined by local communities); ♦ Promotion of nutrition education, especially to mothers, and reinforcement of
reproductive health and family planning; ♦ Raising the proportion of the rural population that has access to safe and clean water; ♦ Promoting HIV/AIDS and public health awareness, including through peer education in
schools; and ♦ Strengthening the program of Integrated Management of Childhood Illness. (c) Social Well-being In the past three years, the Government has promoted participatory approaches to the determination of development programs and has opened up the public expenditure review process to the public. Simultaneously, the Government has adopted a program of devolving responsibilities for key services to the local authorities. Given the progress in political liberalization, the fast growing role of the public media, and the increasing dynamism of civil society, the poor are participating more effectively in shaping development policies. The ongoing Local Government reforms should lend momentum to this encouraging development. The well-being of the poor is also dependent on personal security afforded by the state. In this regard, the most important factors are personal safety, access to justice, and overall efficiency, fairness, and transparency of the administrative system. Accordingly, the Government intends to take the following steps: ♦ Speed up settlement of cases in the primary courts by, among other things, reducing the
estimated shortage of magistrates (approximately 700) by one half; ♦ Promote community-based security arrangements; and ♦ Rehabilitate building and other facilities of the primary courts.

21
These initiatives, which are expected to be elaborated and costed more carefully over the coming months by the local authorities, will be paralleled by decisive efforts at higher level of Government to strengthen the justice system and governance. Such efforts, the detailed action plans of which are under preparation, will include: ♦ Speeding up court decisions and raising of the ratio of decided to filed cases from 63
percent to 80 percent by end-2003; ♦ Reducing the average time taken to settle commercial disputes to 18 months by the end of
2003; ♦ Raising the ratio of actual Court of Appeal sessions to planned sessions from the current
50 percent to 100 percent by end-2003; and ♦ Carrying out diagnostic surveys of corruption in the Judiciary; in the Ministries of Works,
Education, Health and Home Affairs; in the Attorney General’s Office; and in the Tanzania Revenue Authority.
(d) Vulnerability The Government will give specific attention to vulnerable groups through its own programmes and by enlisting the involvement of its development partners. Local Communities will be expected to play a major role in identifying the needs of vulnerable groups. Specific interventions in this area will include food-for -work programmes and other initiatives that are implemented under the World Bank supported Tanzania Social Action Fund (TASAF). The Government will also examine other interventions that would be targeted at the most vulnerable groups (orphans and handicapped). The Government already has in place an early warning system to predict weather-related variations in crop yields. However, in order to increase food security, the Government will seek to reduce dependence on rain-fed agriculture by supporting irrigation schemes in the arid areas, and improving access to food supplies in surplus regions. Related initiatives will also include the development of drought resistant crops and sustained efforts in re-afforestation. (e) Environment The poor in Tanzania are heavily dependent on the environment. Specifically, households in Tanzania are heavily dependent on environmental resources for income generation. For example, as much as 50 percent of their cash incomes in some areas derive from the sale of forest products such as charcoal, honey, wild fruits and firewood. There is evidence as well, that the poorest households are the most dependent on woodland resources. Other studies show very high levels of dependency on environmental resources for consumption. The Government intends to find ways of incorporating environmental quality indicators into its poverty monitoring system in a way, which captures these levels of dependency. Future iterations of the PRSP and the MTEF will capture more fully these linkages and help define a more consistent framework for managing activities aimed at protecting the environment.
22
V. FINANCING OF THE POVERTY REDUCTION PROGRAMME
A. Basic Considerations
In assessing the financial resources that will be required for the poverty reduction program, the government had to take into account seven basic considerations. First, pending the completion of the above-noted key tasks (notably in the ministries of Agriculture and Education, and in regard to the LGRP) the estimated financing for the poverty reduction programme will be kept under review and updated to reflect the impact of more thoroughly costed interventions. Second, while it is certain that the financing of the poverty reduction programme will derive principally from domestic sources, notably the central government budget, an assessment of the revenue impact of ongoing improvement in tax enforcement and administration is fraught with uncertainty. Accordingly, the government has chosen to proceed on the basis of conservative estimate of central government budgetary revenue over the medium term. This underscores the importance, once again, of continuing to review the financing requirements. Third, the financing of the poverty alleviation efforts will, as in the past, depend substantially on external funding, the availability of which could differ from the projected path. Because of this, the government’s monetary programme, including government recourse to bank credit, will be managed flexibly, to allow for some compensation in unforeseen shortfall of projected external financing. Fourth, on the basis of insights from the MTEF and PER exercises, it is evident that the poverty reduction programme will be constrained severely by available resources. Because of this, the government has opted for a slight deterioration in the fiscal balance, and will also place special emphasis on the cost-effectiveness of intended poverty reduction initiatives. Fifth, the government will strategically support cost-sharing, co-financing, and other initiatives aimed at catalyzing deeper involvement by communities and other shareholders in well-conceived poverty reduction programmes. Sixth, the government is envisaging that there will be significant changes in the financing modalities for the poverty reduction programme, following the planned devolution of responsibilities to the local government authorities, and the attendant decentralization of public finances. The financial consequences of these prospective institutional changes will be kept under review, and incorporated more explicitly in the budget for FY 2001/2002. Finally , the government, guided by the findings from the stakeholders’ workshops, will confine its financial interventions mostly to (i) education (notably at primary school level); (ii) health (primary health care); (iii) agriculture (research and extension); (iv) roads (in the rural areas); (v) water; (vi) judiciary; and (vii) HIV/AIDS. The deterioration of some key indicators of social well-being between 1989 and 1996 paralleled the decline in budgetary resources allocated to social sectors, particularly those for financing maintenance and operating expenses. Therefore, it is expected that a boost in budgetary support for these sectors along with improved efficiency in the delivery of public services will enhance access to better quality services for the poor.
B. Overall Financing Envelope In line with the macroeconomic framework outlined above, and assuming that the average level of international support (grants and concessional loans) will be maintained at a slightly higher level than that of the preceding years, total budgetary expenditure during FY

23
2000/2001 – 2002/2003 is expected to increase slightly to about 17 – 18 percent of GDP, compared to 15.5 percent during the preceding four-year period (Appendix Table 2). Domestic revenue will cover nearly 70 percent of the envisaged total expenditure, and external support, including savings from the HIPC debt relief, will finance 30 percent. In this connection, the government is determined to redouble its reform efforts, with a view to meeting all the conditions for the HIPC completion point by mid-2001. The exact level of budgetary expenditure, including the impact of poverty reduction programmes, will reflect, as explained above, a more detailed costing of interventions in key sectors, especially at the local government level. Depending upon the outcome of this exercise, the government may have to modify its monetary program, including planned government recourse to bank credit, subject to the overriding goal of maintaining macroeconomic stability.
C. Composition of Public Expenditure The costing of priority interventions has been based partly on the analysis of recurrent cost implications of sector investment programmes, and also reflects inputs from PER and MTEF exercises of previous years, as well as from sector -specific studies carried out in Health, Education, Water and Transportation. More specifically, these technical studies defined “basic units of service” and their estimated costs. Following these technical guidelines, financing requirements were derived for the medium term, subject to the resource envelope. For example, in the case of health, the technical studies indicated that the financing of acceptable levels of health care in Tanzania would cost about US$9 per head. Of the US$9, about 67 percent would cover recurrent expenditures, including salaries (36 percent), drugs and supplies (19 percent) and other charges (11 percent). The remainder, 33 percent, would cater for development expenditure. However, observance of a per capita expenditure of US$9 would entail a doubling of the present budget allocation for the health sector. Budgetary provision for the sector had, therefore, to be constrained to available resources, implying that the delivery of health services under the present circumstances would fall below acceptable levels in the short term. Likewise, in the case of education, the PER and MTEF studies developed a basic unit of service, which for primary education comprises salary and non-salary items (textbooks, exercise note books, rulers, pens, schoolbags and school supplies). The unit was costed and provided, as in the case of health, as a guideline for estimating required expenditure. In pursuit of the poverty reduction objectives, similar cost assessments will also be attempted for key interventions in other areas. For water anti-corruption and HIV/AIDS, specific actions were identified and costed. Pending the completion of this detailed work, the government has made a deliberate decision starting in FY 2000/2001, to increase allocations for personnel and other charges, in order to improve key social services for poverty reduction (Table 2 and Chart 1). This decision contrasts sharply with past experience when, following the introduction of the cash budget system, expenditures on “other charges” served as a residual item, to cushion shocks to revenue or statutory payments. Moreover, expenditure allocations for the “core” sectors are expected to increase significantly when compared to allocations for other sectors (Text Table 3). In particular, total allocation for “other charges” for all priority sectors is projected to increase (as a proportion of discretionary expenditure) over the medium term from about 21 percent in FY 2000/2001 to over 22 percent and nearly 26 percent in FY 2001/2002 and FY 2002/2003, respectively. Simultaneously, the allocation for “other charges” for the “core” areas is projected to increase, respectively, from 11.3 percent to 13.4 percent and 16 percent.

24
A more disaggregated picture of budgetary allocations for priority activities is provided in Appendix Table 3.

25
P E OC TOTAL P E OC TOTAL P E OC TOTAL P E OC TOTAL
Education 121704 37213 158917 127789 54272 182061 205402 67840 275515 265870 91584 357454 Basic Education 82898 13421 96319 120316 20974 142424 139909 27935 167844 181096 36097 217193
Health 1/ 32020 21850 53870 33621 32685 65970 39096 40856 87970 50605 55156 105761 Primary Health 15013 13768 28781 21510 20804 42314 25013 27708 52721 32376 35804 68180
Water 3229 2123 5352 2111 4862 5064 2455 6078 6388 3177 8205 11382
Roads 4325 37887 42212 4541 55106 50147 5279 57861 52868 6835 60754 67589 Rural Roads 1237 14357 15593 1851 26998 28849 2152 35959 38111 2786 46465 49251
Judiciary 4035 3913 7947 3955 5700 7855 4599 7125 9793 5953 9619 15572
Agriculture 8210 5475 13685 3867 6331 8213 4529 8164 10351 5863 11022 16885 Agr. Res. and Ext. 6913 4753 11666 2298 4595 6893 2672 6121 8793 3459 7909 11368
HIV/AIDS 2/ 0 0 0 0 4800 4800 0 6393 6393 0 8261 8261
Total Priority Sectors 3/ 173523 108461 281984 175884 163756 339640 261360 194317 455677 338303 244600 582903 Total Priority Items 3/ 113324 52335 165659 152041 88734 240775 176800 117318 294118 228847 152360 381207
Discretionary recurrent Exp. 4/ 668464 783059 783059 945872
Education 18.2 5.6 23.8 16.3 6.9 23.2 23.5 7.8 31.5 28.1 9.7 37.8 Basic Education 12.4 2.0 14.4 15.4 2.7 18.2 16 3.2 19.2 19.1 3.8 23
Health /1 4.8 3.3 8.1 4.3 4.2 8.4 4.5 4.7 10.1 5.4 5.8 11.2
Primary Health 2.2 2.1 4.3 2.7 2.7 5.4 2.9 3.2 6 3.4 3.8 7.2
Total Water 0.5 0.3 0.8 0.3 0.6 0.6 0.3 0.7 0.7 0.3 0.9 1.2
Roads 0.6 5.7 6.3 0.6 7 6.4 0.6 6.6 6 0.7 6.4 7.1
Rural Roads 0.2 2.1 2.3 0.2 3.4 3.7 0.2 4.1 4.4 0.3 4.9 5.2
Judiciary 0.6 0.6 1.2 0.5 0.7 1 0.5 0.8 1.1 0.6 1 1.6
Agriculture 1.2 0.8 2 0.5 0.8 1 0.5 0.9 1.2 0.6 1.2 1.8
Agr. Res. and Ext. 1.0 0.7 1.7 0.3 0.6 0.9 0.3 0.7 1 0.4 0.8 1.2
HIV/AIDS 2/ 0.0 0.0 0 0 0.6 0.6 0 0.7 0.7 0 0.9 0.9
Total Priority Sectors 3/ 26.0 16.2 42.2 22.5 20.9 43.4 29.9 22.2 52.1 35.8 25.9 61.6 Total Priority Items 3/ 17.0 7.8 24.8 19.4 11.3 30.7 20.2 13.4 33.6 24.2 16.1 40.3
Discretionary Rec. Exp.4// 100.0 100.0 100.0 100.0 100.0 100.0 100.0 100.0 100.0 100.0 100.0 100.0
Source: Ministry of Finance1/ Includes HIV/AIDS2/ Expenditure on HIV/AIDS will basically fund awareness campaigns, development of strategic plans for combating HIV/AIDS,preventive measures such as the provision of condoms, and carrying out studies and monitoring/surveillance of the incidenceand impact of the pandemic, as well as actions taken to fight it.3/ That is, basic education, primary health, rural roads, judiciary, agricultural research and extension, and HIV/AIDS.4/ Discretionary recurrent expenditure is defined as total recurrent expenditure less "contractual" obligations (such as debtservice and pensions contributions).
As a percent of discretionary Recurrent Expenditure 4/
1999/2000 2000/01 Budget 2001/02 Proj.
Text Table 2 : Breadkdown of Expenditure Priority Items: FY 1999/00 - 2002-03(PE=Personal Emoluments; OC=Other Charges)
In Million of Tanzania shillings
2002/03 Proj.
26
D. Specific Poverty Reduction Interventions (a) Abolition of primary school fees: The government will, as noted above, abolish primary school fees in order to ensure that children, especially from poor families, will have access to primary school education. This measure will be introduced in the context of the FY 2001/2002 budget at an estimated cost of Tsh10 – 12 billion, or one percent of recurrent expenditure. (b) Catalyzing communities and other stakeholders: Local communities at the village, ward, and district levels will continue to play a major role in poverty reduction through self-help schemes to construct classrooms, teachers’ houses, health centers, dispensaries, water facilities, and rural roads. Moreover, extra-budgetary interventions by international and other development partners will continue to provide substantial complementary support for poverty reduction. The government intends to provide some financial resources, starting in FY 2001/2002, in order to catalyze “pro-poor” interventions by other stakeholders. (c) Employment creation: The government intends to spend about Tsh.100 million annually, to support demand-driven skill development over the medium term. This effort will also be directed at assisting vulnerable persons.

27
Chart 1: Share of OC for the Priority Areas in Total Discretionary Recurrent Expenditures
0 . 0 %
2 . 0 %
4 . 0 %
6 . 0 %
8 . 0 %
1 0 . 0 %
1 2 . 0 %
1 4 . 0 %
1 6 . 0 %
1 9 9 9 / 0 0 2 . 0 % 2 . 1 % 0 . 3 % 2 . 1 % 0 . 7 % 0 . 6 % 0 . 0 % 7 . 8 %
2 0 0 0 / 0 1 2 . 7 % 2 . 6 % 0 . 4 % 3 . 4 % 0 . 6 % 0 . 5 % 0 . 6 % 1 0 . 8 %
2 0 0 1 / 0 2 3 . 2 % 3 . 1 % 0 . 4 % 4 . 1 % 0 . 7 % 0 . 6 % 0 . 7 % 1 2 . 8 %
2 0 0 2 / 0 3 3 . 7 % 3 . 6 % 0 . 5 % 4 . 7 % 0 . 8 % 0 . 7 % 0 . 8 % 1 4 . 8 %
B a s i c
E d u c a t i o n
P r i m a r y
H e a l t hW a t e r
R u r a l
R o a d s
A g r i c .
R e s e a r c h
& E x t .
J u d i c i a r y H I V / A I D S
T o t a l
P r i o r i t y
I t e m s

28
1999/2000 2000/2001 2001/2002 2002/2003 Preliminary Budget Projection Projection
Education 40,447.17 87,808.70 103,053.54 128,558.21 Recurrent (OC) 54,272.00 67,840.00 91,584.00 Development 33,536.70 35,213.54 36,974.21
Health 24,724.70 75,566.20 85,881.51 102,432.46 Recurrent (OC) 32,685.00 40,856.25 55,155.94 Development 42,881.20 45,025.26 47,276.52
Water 4,813.78 37,606.00 40,458.70 44,304.89 Recurrent (OC) 4,862.00 6,077.50 8,204.63 Development 32,744.00 34,381.20 36,100.26
Judiciary 3,412.65 6,100.00 7,545.00 10,059.75 Recurrent (OC) 5,700.00 7,125.00 9,618.75 Development 400.00 420.00 441.00
Agriculture 6,059.87 33,475.80 36,455.87 40,727.94 Recurrent (OC) 6,531.40 8,164.25 11,021.74 Development 26,944.40 28,291.62 29,706.20
Roads 46,955.61 86,838.00 92,036.66 76,816.79 Recurrent (OC) 55,106.00 57,861.30 60,754.37 Development 31,732.00 34,175.36 16,062.42
TOTAL (OC+Developments) 126,413.78 327,394.70 365,431.28 402,900.03
Source: Ministry of Finance
Text Table 3: Proposed Budgetary Allocation for Priority Sectors, FY 1999/2000-2002/2003(In millions of Tanzania shillings; OC=other charges)
29
VI. MONITORING AND EVALUATION OF THE POVERTY REDUCTION STRATEGY 5
A. Current and Proposed Indicators The Vice-President’s Office (VPO) will have the overall responsibility for monitoring the implementation and impact of the poverty reduction strategy. The specific institutional mandates in the gathering and analysis of relevant data are identified in Annex III. To these ends, the government will develop plans, to be included in the MTEF for FY2001/2002, to strengthen capacity in the VPO and other concerned institutions. Monitoring and evaluation (M&E) of the poverty reduction strategy will require indicators or qualitative assessments pitched at different levels. First , M&E will require impact and outcome indicators. Impact indicators will describe progress towards overall poverty eradication objectives, while outcome indicators will refer to results of interventions (inputs) directed at poverty reduction. The government has already coordinated a consultative process to draw up a list of poverty and welfare monitoring indicators (PMI), which contains many of the required impact and outcome indicators. These indicators have been incorporated into the Tanzania Socio-Economic Database (TSED), which contains a wider set of indicators. The impact and outcome indicators identified below therefore draw largely on the PMI and TSED. Second, proxy indicators will be developed to substitute for impact and outcome indicators that are more difficult to measure, or are available only at infrequent intervals. Third, intermediate indicators will be used to provide supplementary information for assessment of progress under the poverty reduction strategy. Fourth, resource allocation for, and expenditure on, priority poverty reduction initiatives will be monitored under the PER and MTEF framework. Fifth, M&E will also seek to assess the extent of participatory involvement by the poor, as well as other shareholders, in subsequent revisions of the PRSP and in the implementation, monitoring and evaluation of related programmes and projects. Sixth, M&E, supported by well-targeted research, will assess the impact on the poor of policies that transcend the immediate agenda of the poverty reduction strategy. Seventh, A set of gender-oriented indicators, will be developed as an integral part of the M&E. Finally, given financial and technical constraints, the M&E system will be limited to “core” strategic indicators that can be used readily by policy makers and other stakeholders. Moreover, a special effort will be made to include indicators with at least two observations during the three-year horizon of the poverty reduction strategy.
5 Additional detailed information on data sources for the monitoring indicators, institutional arrangements, and financial issues is contained in Annex III

30
B. Indicators of Income Poverty (a) Impact and outcome indicators: ♦ Food poverty line (for urban and rural areas); ♦ Basic needs poverty line (for urban and rural areas); (b) Proxy indicators ♦ Ownership of “standard” consumer assets (could include items in the HBS, preferably
those which are owned by most households); ♦ Use of modern building materials in the construction of dwelling units (in particular, for
floors, walls, and roofing). (c) Intermediate indicators (available annually or at shorter intervals) ♦ Overall real GDP growth; ♦ Growth in value-added of agriculture; ♦ Seasonal production of key food and cash crops; and ♦ Kilometers of rehabilitated rural roads.
C. Indicators of Quality of Life and Social Well-Being (a) Survival ♦ Infant and under-five mortality rates (by sex and for rural and urban areas); ♦ Percentage of children fully immunized by their first birthday (by sex and for rural and
urban areas); and ♦ Proportion of districts with active HIV/AIDS awareness campaigns (as intermediate
indicator). (b) Human capabilities (by sex and for rural and urban regions) ♦ Net enrolment rate for primary education; ♦ Net primary school intake rate; ♦ The enrolment rate in grade seven; and ♦ Passing rate in grade seven.
D. Water and Sanitation ♦ Proportion of households with access to safe drinking water (in rural and urban areas).
E. Macroeconomic Stability ♦ Rate of inflation; ♦ Gross official international reserves; ♦ Movement in the exchange rate; and ♦ Fiscal balance;
31
F. Social Safety Nets ♦ It is intended to establish databases on vulnerable groups at local and central levels of
government administration.
G. Governance ♦ Quarterly data on, or assessment of, progress toward achievement of the objectives listed
above for the judiciary.
H. Resource Allocation
♦ Actual, budgetary allocation for basic education, primary health care, water and sanitation, rural roads, agriculture extension and HIV/AIDS (to be monitored semi-annually).
I. Indicators of participatory monitoring
♦ Dissemination of implementation reports ♦ Consultative workshops; ♦ Attendance at workshops; and ♦ Inputs received from civil society.
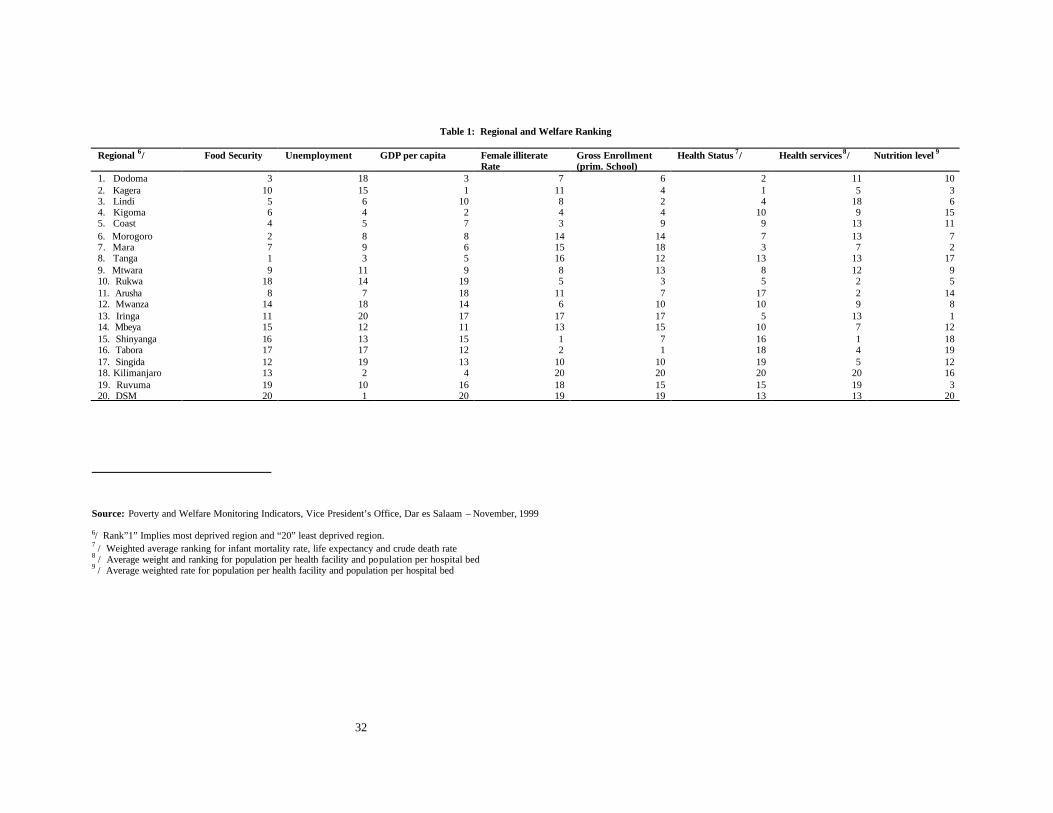
32
Table 1: Regional and Welfare Ranking
Regional 6/ Food Security Unemployment GDP per capita Female illiterate Rate
Gross Enrollment (prim. School)
Health Status 7/ Health services8/ Nutrition level 9
1. Dodoma 3 18 3 7 6 2 11 10 2. Kagera 10 15 1 11 4 1 5 3 3. Lindi 5 6 10 8 2 4 18 6 4. Kigoma 6 4 2 4 4 10 9 15 5. Coast 4 5 7 3 9 9 13 11 6. Morogoro 2 8 8 14 14 7 13 7 7. Mara 7 9 6 15 18 3 7 2 8. Tanga 1 3 5 16 12 13 13 17 9. Mtwara 9 11 9 8 13 8 12 9 10. Rukwa 18 14 19 5 3 5 2 5 11. Arusha 8 7 18 11 7 17 2 14 12. Mwanza 14 18 14 6 10 10 9 8 13. Iringa 11 20 17 17 17 5 13 1 14. Mbeya 15 12 11 13 15 10 7 12 15. Shinyanga 16 13 15 1 7 16 1 18 16. Tabora 17 17 12 2 1 18 4 19 17. Singida 12 19 13 10 10 19 5 12 18. Kilimanjaro 13 2 4 20 20 20 20 16 19. Ruvuma 19 10 16 18 15 15 19 3 20. DSM 20 1 20 19 19 13 13 20
Source: Poverty and Welfare Monitoring Indicators, Vice President’s Office, Dar es Salaam – November, 1999 6/ Rank”1” Implies most deprived region and “20” least deprived region. 7 / Weighted average ranking for infant mortality rate, life expectancy and crude death rate 8 / Average weight and ranking for population per health facility and population per hospital bed 9 / Average weighted rate for population per health facility and population per hospital bed

33
Appendix
Table 2. Tanzania: Central Government Operations, 1996/97–2002/03 1/
1996/97 1997/98 1998/99 1999/2000 2000/01 2001/02 2002/03 Prog. 2/ Rev. Prog. Prog. 2/ Rev. Prog. Proj. Proj.
Total revenue 572.1 619.1 689.5 777.6 768.7 869.2 861.4 982.8 1108.1Tax revenue 514.6 566.1 616.5 711.3 687.6 795.6 772.6 884.1 999.5Taxes on imports 174.2 180.7 218.9 233.8 216.8 253.3 325.0 374.0 415.4Sales and excise taxes on local goods 141.7 140.5 161.3 179.9 180.1 199.2 194.6 224.1 260.4Income taxes 134.2 149.8 162.9 212.6 201.3 252.7 167.9 194.1 224.3Other taxes 64.5 90.4 73.4 85.0 89.4 90.4 85.1 91.8 99.4Nontax revenue 57.5 53.0 73.0 66.3 81.1 73.6 88.8 98.7 108.6
Total expenditure and net lending 638.4 765.1 898.8 1078.1 1,161.8 1,207.7 1,256.1 1,443.0 1,542.2Recurrent expenditure 528.1 567.7 657.3 811.4 830.4 911.8 942.6 1,053.2 1,129.6Wages and salaries 199.2 218.8 220.5 287.3 287.3 315.0 315.9 356.8 396.5Interest payments 110.8 115.9 95.9 106.4 109.9 106.9 111.3 110.6 111.2Domestic 73.5 50.6 38.2 70.0 73.7 57.0 75.0 72.8 70.6Foreign 37.3 65.3 57.7 36.4 36.2 49.9 36.3 37.8 40.6Other goods and services and transfers 218.1 233.0 340.9 417.7 433.2 489.9 515.4 585.8 621.9Of which: priority sector spending n/a 64.9 96.2 100.2 99.0 132.8 142.3 172.8 219.3Net lending ... ... -6.4 ... ... ... ... ... ...Development expenditure 3/ 110.3 197.4 247.9 266.7 331.5 295.9 313.5 389.8 412.6Of which: expenditure financed domestically … … 18.8 23.4 23.4 40.6 38.0 93.1 100.2
Overall balance before grants (checks issued) -66.4 -146.0 -209.3 -300.5 -393.1 -338.5 -394.7 -460.3 -434.1
Grants 152.4 156.4 240.4 269.1 278.0 292.1 366.6 379.3 394.9Program 75.0 38.3 74.6 118.7 116.4 136.1 124.3 113.9 116.1Project 77.4 118.1 165.8 150.4 150.4 155.7 195.9 212.2 221.1HIPC Initiative interim relief (IMF and World Bank) ... ... 11.2 ... 46.1 53.2 57.7
Overall balance after grants (checks issued) 86.0 10.4 31.1 -31.4 -115.1 -46.4 -28.4 -81.0 -39.2
Adjustment to cash and other items (net) 4/ -7.1 -1.3 -13.1 ... ... ... ... ... ...
Overall balance (checks cleared) 78.9 9.1 18.0 -31.4 -115.1 -46.4 -28.4 -81.0 -39.2
Cost of bank recapitalization 5/ ... ... 69.8 60.3 100.8 ... ... ... ...
Augmented overall balance (checks cleared) 78.9 9.1 -51.8 -91.7 -215.9 -46.4 28.4 -81.0 -39.2
Financing -78.9 -9.1 51.8 91.7 215.9 46.4 28.4 81.0 39.2Foreign (net) -20.2 50.0 27.0 55.7 121.0 66.4 27.7 106.6 83.1Foreign loans 34.0 106.1 98.3 147.1 211.9 174.1 152.0 200.7 166.9Program loans 21.4 65.8 35.0 54.3 54.3 74.4 72.4 116.1 75.5Development project loans 12.6 40.3 63.3 92.8 157.6 99.7 79.6 84.6 91.4Amortization -54.2 -56.1 -71.3 -91.4 -90.9 -107.7 -124.3 -94.1 -83.8Domestic (net) -31.5 -22.1 -10.0 -8.0 ... ... ... ... ...Bank -18.4 -47.9 -1.9 -9.4 -1.4 ... ... ... ...Nonbank -13.1 25.8 -8.1 1.4 1.4 ... ... ... ...Bank recapitalization 5/ ... ... 69.8 60.3 88.8 ... ... ... ...Privatization 12.7 6.5 11.5 ... 12.0 ... 15.0 ... ...Change in arrears 6/ -39.9 -43.5 -46.5 -16.4 -5.9 ... -14.3 ... ...Planning reserve 7/ ... ... ... ... ... -20.2 0.0 -25.6 -43.8 Memorandum items: Primary balance (after grants; checks issued) 44.4 -30.1 127.0 75.0 -5.2 60.6 82.9 29.6 71.9Overall balance before grants, excluding Foreign- financed development expenditure 19.8 -57.2 -85.1 -83.1 -119.2 -163.5 -121.7Overall balance after grants and grant element 110.3 86.2 101.4 73.8 36.4 38.8 80.3 62.5 80.1 0.0 27.3 15.8 -87.9 -87.9 -86.9 -85.9
1/ Fiscal years run from July to June. Pending the completion of thorough estimates, the figures do not include the impact of abolishing primary school fees And certain special initiative for employment creation and catalyzation of extra-budgetary support for the poverty reduction programmes. 3/ Includes fees, charges, and operating margins collected by the Tanzania Revenue Authority and disbursed to Tanzanian - Italian Petroleum Refinery (TIPER) to Cover operating costs. In 1998/99, the subsidy to TIPER includes T Sh 5 billion as a special subsidy. In 1999/2000, all subsidies to the petroleum sector
Are included. 4/ Includes contingency as net expenditures. 5/ Development expenditure is on a checks -issued basis. Beginning in 1997/98, a broader coverage of in- kind project expen ditures financed by External grants and loans is included; the increased coverage represents a break in the series of a magnitude of about 1 percent of GDP. 6/ Difference between the overall deficit on a checks- issued basis and the total financing, which reflects expenditure based on checks cleared by the Bank of Tanzania (BoT). This difference is due to the change in the check float at the end of the fiscal year and unrecorded revenue or expenditure. 7/ Consisting of bonds issued to the National Microfinance Bank and the conversion into bonds of interest arrears owed to the BoT. For program -monitoring Purposes, such bonds are excluded from domestic financing. 8/ Clearance of arrears on utility and suppliers' credit.
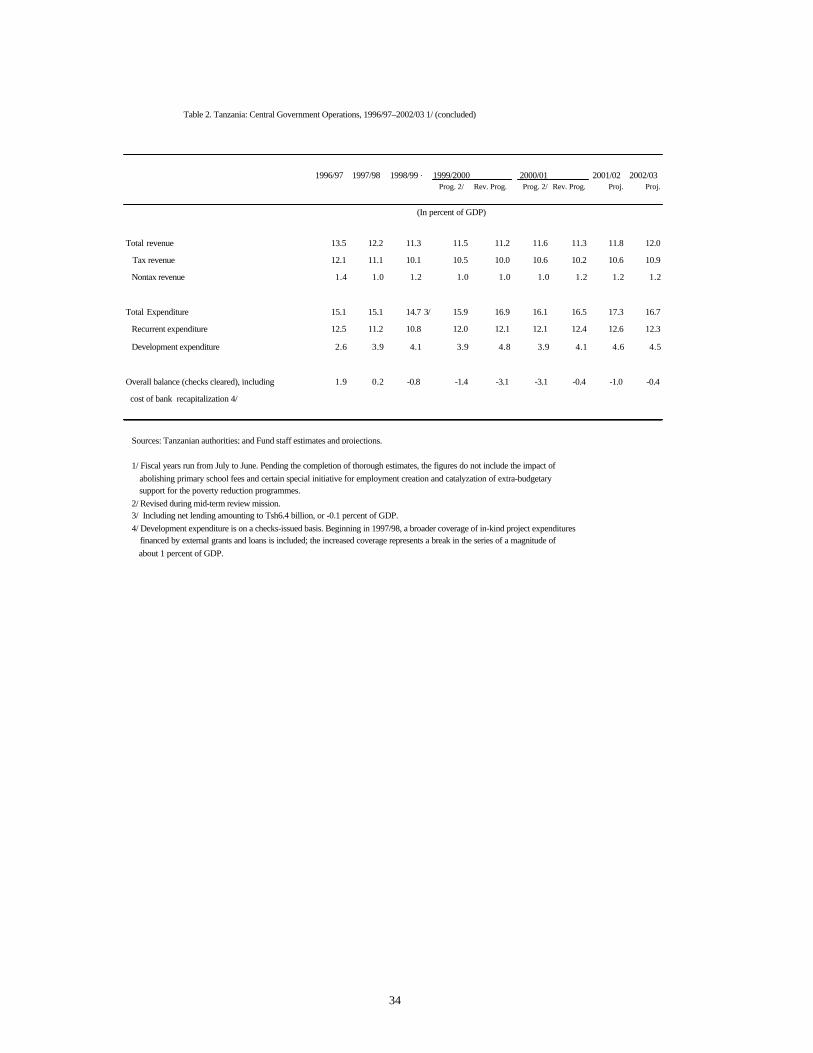
34
Table 2. Tanzania: Central Government Operations, 1996/97–2002/03 1/ (concluded)
1996/97 1997/98 1998/99 1999/2000 2000/01 2001/02 2002/03Prog. 2/ Rev. Prog. Prog. 2/ Rev. Prog. Proj. Proj.
(In percent of GDP)
Total revenue 13.5 12.2 11.3 11.5 11.2 11.6 11.3 11.8 12.0
Tax revenue 12.1 11.1 10.1 10.5 10.0 10.6 10.2 10.6 10.9
Nontax revenue 1.4 1.0 1.2 1.0 1.0 1.0 1.2 1.2 1.2
Total Expenditure 15.1 15.1 14.7 3/ 15.9 16.9 16.1 16.5 17.3 16.7
Recurrent expenditure 12.5 11.2 10.8 12.0 12.1 12.1 12.4 12.6 12.3
Development expenditure 2.6 3.9 4.1 3.9 4.8 3.9 4.1 4.6 4.5
Overall balance (checks cleared), including 1.9 0.2 -0.8 -1.4 -3.1 -3.1 -0.4 -1.0 -0.4
cost of bank recapitalization 4/
Sources: Tanzanian authorities; and Fund staff estimates and projections.
1/ Fiscal years run from July to June. Pending the completion of thorough estimates, the figures do not include the impact of abolishing primary school fees and certain special initiative for employment creation and catalyzation of extra-budgetary support for the poverty reduction programmes.
2/ Revised during mid-term review mission.3/ Including net lending amounting to Tsh6.4 billion, or -0.1 percent of GDP.4/ Development expenditure is on a checks-issued basis. Beginning in 1997/98, a broader coverage of in-kind project expenditures
financed by external grants and loans is included; the increased coverage represents a break in the series of a magnitude of about 1 percent of GDP.

35
Table 3: DISAGGREGATION OF PRIORITY ITEMS WITHIN PRIORITY SECTORS: FY00 – FYO3 (in millions Tshs.)
VOTE SUBVOTE ITEM DESCRIPTION FY00 Prel. Actual FY01 Budget est. FY02 Proj. FY03 Proj.
P.E. O.C. TOTAL P.E. O.C. TOTAL P.E. O.C. TOTAL P.E. O.C. TOTAL 1. BASIC EDUCATION:
70-89 101** all O.C.Subvention to Local Authorities 79607 11107 90714 114865 17429 132294 133570 23214 156784 172891 29996 202887 70-89 204 2012 Examination expenses in the RAS budget 92 556 648 0 670 670 0 892 892 0 1153 1153
46 301 all MoEC - Basic Educ.Subvote O.C. 58 10 68 79 23 102 92 31 123 119 40 159 46 501 all MoEC - Teacher Educ.Subvote O.C. 1891 861 2752 2595 995 3590 3018 1325 4343 3906 1712 5618 46 202 all MoEC - 75% of Inspectorate Subvote O.C. 542 241 783 821 516 1337 954 688 1642 1235 888 2123 46 201 30630 Subvention to Institute of Adult Education 414 3 417 634 31 665 737 41 778 954 53 1007 46 101 30625 Subvention to Nat. Examination Cou ncil 242 529 771 581 707 1288 676 941 1617 875 1216 2091 67 all all 75% of TSC O.C. 52 114 166 742 603 1345 863 804 1667 1116 1038 2154
Sub-Total Basic Education 82898 13421 96319 120316 20974 141290 139909 27935 167844 181096 36097 217193 2. PRIMARY HEALTH:
70-89 101** all O.C.Subvention to Local Authorities 14504 2628 17132 21153 7959 29112 24598 10600 35198 31839 13698 45537 52 201 1709 Local Authorities drugs allocation (kits) 0 0 0 0 0 0 0 0 0 0 0 0 Budgeted under MoH 0 6600 6600 0 7357 7357 0 9798 9798 0 12661 12661
52 301 all MoH Preventive Subvote O.C. 312 3637 3949 216 5388 5604 251 7176 7427 325 9273 9598 70-89 302 all Regions Preventive Subvote O.C. 198 903 1101 140 100 240 163 133 296 211 172 383
Sub-Total Primary Health 15013 13768 28781 21510 20804 42314 25013 27708 52721 32376 35804 68180 3. WATER
70-89 101** all O.C.Subvention to Local Authorities 1408 1065 2473 1669 3374 5043 1941 4218 6159 2513 5693 8206 49 401 all MoWater O.C. 1802 1002 2804 442 875 1317 514 1093 1607 665 1476 2141
70-89 204 1803/1818 Regions O.C. items 18 57 75 0 614 614 0 767 767 0 1035 1035 Total Water 3229 2123 5352 2111 4862 6973 2455 6078 8533 3177 8205 11382
4. RURAL ROADS
70-89 101** all O.C.Subvention to Local Authorities 880 361 1241 1406 1177 2583 1636 1568 3204 2117 2026 4143 56 202 2301 Road Fund budgeted for Districts 0 13989 13989 0 15252 15252 0 20314 20314 0 26249 26249 47 701 all MoW -Rural Roads Subvote O.C. 356 7 363 444 10570 11014 517 14077 14594 669 18191 18860
Total Rural Roads 1237 14357 15594 1851 26998 28849 2152 35959 38111 2786 46465 49251
5. JUDICIARY 40 all all All O.C. under Judiciary Department 4035 3913 7948 3955 5700 9655 4599 7125 11724 5953 9619 15572
6. AGRICULTURE RESEARCH AND EXTENSION 70-89 101** all O.C.Subvention to Local Authorities 0 0 0 0 977 977 0 1302 1302 0 1682 1682
43 301 all MoA - Research Development Subvote O.C. 654 775 1429 637 388 1025 740 516 1256 958 667 1625 43 201 all MoA - Crops Development Subvote O.C. 3351 1962 5313 985 833 1818 1146 1110 2256 1483 1434 2917 43 401 all MoA - Cooperative Development Subvote O.C. 402 1330 1732 108 2060 2168 126 2744 2870 163 3545 3708 43 601 all MoA - Livestock Development Subvote O.C. 2506 687 3193 568 337 905 660 449 1109 855 580 1435
Total Agriculture Research and Extension 6913 4753 11666 2298 4595 6893 2672 6121 8793 3459 7909 11368 7. HIV/AIDS* 0 0 0 0 4800 4800 0 6393 6393 0 8261 8261
Total Priority Sectors 113324 52335 165659 152041 88734 240775 176800 117318 294118 228847 152360 381207 % Share of Total Recurrent Budget (excl. CFS) 17.0% 7.8% 24.8% 19.4% 11.3% 30.5% 20.2% 13.4% 33.2% 24.2% 16.1% 40.3%
* Expenditure on HIV/AIDS will basically fund awareness campaigns, development of strategic plans for combating HIV/AIDS, preventive measures such as the provision of condoms, and carrying out studies and monitoring/surveillance of the incidence and impact of the pandemic as well as actions taken to fight it.

36
Source: Ministry of Finance Table 3: DISAGGREGATION OF PRIORITY ITEMS WITHIN PRIORITY SECTORS: FY00 – FYO3 (in percentage)
VOTE SUBVOTE ITEM DESCRIPTION FY00 Prel. Actual FY01 Budget est. FY02 Proj. FY03 Proj.
P.E. O.C. TOTAL P.E. O.C. TOTAL P.E. O.C. TOTAL P.E. O.C. TOTAL 1. BASIC EDUCATION:
70- 89 101** all O.C.Subvention to Local Authorities 96.0% 82.8% 94.2% 95.5% 83.1% 93.6% 95.5% 83.1% 93.4% 95.5% 83.1% 93.4%70- 89 204 2012 Examination expenses in the RAS budget 0.1% 4.1% 0.7% 0.0% 3.2% 0.5% 0.0% 3.2% 0.5% 0.0% 3.2% 0.5%
46 301 all MoEC - Basic Educ.Subvote O.C. 0.1% 0.1% 0.1% 0.1% 0.1% 0.1% 0.1% 0.1% 0.1% 0.1% 0.1% 0.1%46 501 all MoEC - Teacher Educ.Subvote O.C. 2.3% 6.4% 2.9% 2.2% 4.7% 2.5% 2.2% 4.7% 2.6% 2.2% 4.7% 2.6%46 202 all MoEC - 75% of Inspectorate Subvote O.C. 0.7% 1.8% 0.8% 0.7% 2.5% 0.9% 0.7% 2.5% 1.0% 0.7% 2.5% 1.0%46 201 30630 Subvention to Institute of Adult Education 0.5% 0.0% 0.4% 0.5% 0.1% 0.5% 0.5% 0.1% 0.5% 0.5% 0.1% 0.5%46 101 30625 Subvention to Nat. Examination Council 0.3% 3.9% 0.8% 0.5% 3.4% 0.9% 0.5% 3.4% 1.0% 0.5% 3.4% 1.0%67 all all 75% of TSC O.C. 0.1% 0.8% 0.2% 0.6% 2.9% 1.0% 0.6% 2.9% 1.0% 0.6% 2.9% 1.0%
Sub-Total Basic Education 100.0% 100.0% 100.0% 100.0% 100.0% 100.0% 100.0% 100.0% 100.0% 100.0% 100.0% 100.0% 2. PRIMARY HEALTH:
70- 89 101** all O.C.Subvention to Local Authorities 96.6% 19.1% 59.5% 98.3% 38.3% 68.8% 98.3% 38.3% 66.8% 98.3% 38.3% 66.8%52 201 1709 Local Authorities drugs allocation (kits) 0.0% 0.0% 0.0% 0.0% 0.0% 0.0% 0.0% 0.0% 0.0% 0.0% 0.0% 0.0% Budgeted under MoH 0.0% 47.9% 22.9% 0.0% 35.4% 17.4% 0.0% 35.4% 18.6% 0.0% 35.4% 18.6%
52 301 all MoH Preventive Subvote O.C. 2.1% 26.4% 13.7% 1.0% 25.9% 13.2% 1.0% 25.9% 14.1% 1.0% 25.9% 14.1%70- 89 302 all Regions Preventive Subvote O.C. 1.3% 6.6% 3.8% 0.7% 0.5% 0.6% 0.7% 0.5% 0.6% 0.7% 0.5% 0.6%
Sub-Total Primary Health 100.0% 100.0% 100.0% 100.0% 100.0% 100.0% 100.0% 100.0% 100.0% 100.0% 100.0% 100.0%
3. WATER 70- 89 101** all O.C.Subvention to Local Authorities 43.6% 50.2% 46.2% 79.1% 69.4 % 72.3% 79.1% 69.4% 72.2% 79.1% 69.4% 72.1%
49 401 all MoWater O.C. 55.8% 47.2% 52.4% 20.9% 18.0% 18.9% 20.9% 18.0% 18.8% 20.9% 18.0% 18.8%70- 89 204 1803/1818 Regions O.C. items 0.6% 2.7% 1.4% 0.0% 12.6% 8.8% 0.0% 12.6% 9.0% 0.0% 12.6% 9.1%
Total Water 100.0% 100.0% 100.0% 100.0% 100.0% 100.0% 100.0% 100.0% 100.0% 100.0% 100.0% 100.0%
4. RURAL ROADS 70- 89 101** all O.C.Subvention to Local Authorities 71.1% 2.5% 8.0% 76.0% 4.4% 9.0% 76.0% 4.4% 8.4% 76.0% 4.4% 8.4%
56 202 2301 Road Fund budgeted for Districts 0.0% 97.4% 89.7% 0.0% 56.5% 52.9% 0.0% 56.5% 53.3% 0.0% 56.5% 53.3%47 701 all MoW - Rural Roads Subvote O.C. 28.8% 0.0% 2.3% 24.0% 39.2% 38.2% 24.0% 39.1% 38.3% 24.0% 39.1% 38.3%
Total Rural Roads 100.0% 100. 0 % 100.0% 100.0% 100.0% 100.0% 100.0% 100.0% 100.0% 100.0% 100.0% 100.0%
5. JUDICIARY 40 all all All O.C. under Judiciary Department 100.0% 100.0% 100.0% 100.0% 100.0% 100.0% 100.0% 100.0% 100.0% 100.0% 100.0% 100.0%
6. AGRICULTURE RESEARCH AND EXTENSION 70- 89 101** all O.C.Subvention to Local Authorities 0.0% 0.0% 0.0% 0.0% 21.3% 14.2% 0.0% 21.3% 14.8% 0.0% 21.3% 14.8%
43 301 all MoA - Research Development Subvote O.C. 9.5% 16.3% 12.2% 27.7% 8.4% 14.9% 27.7% 8.4% 14.3% 27.7% 8.4% 14.3%43 201 all MoA - Crops Development Subvote O.C. 48.5% 41.3% 45.5% 42.9% 18.1% 26.4% 42.9% 18.1% 25.7% 42.9% 18.1% 25.7%43 401 all MoA - Cooperative Development Subvote O.C. 5.8% 28.0% 14.8% 4.7% 44.8% 31 .5% 4.7% 44.8% 32.6% 4.7% 44.8% 32.6%43 601 all MoA - Livestock Development Subvote O.C. 36.3% 14.5% 27.4% 24.7% 7.3% 13.1% 24.7% 7.3% 12.6% 24.7% 7.3% 12.6%
Total Agriculture Research and Extension 100.0% 100.0% 100.0% 100.0% 100.0% 100.0% 100.0% 100.0% 100.0% 100.0% 100.0% 100.0% 7. HIV/AIDS* 0.0% 0.0% 0.0% 0.0% 100.0% 100.0% 0.0% 100.0% 100.0% 0.0% 100.0% 100.0%
* Expenditure on HIV/AIDS will basically fund awareness campaigns, development of strategic plans for combating HIV/AIDS, preventive measures such as the provision of condoms, and carrying out studies and monitoring/surveillance of the incidence and impact of the pandemic as well as actions taken to fight it. Source: Ministry of Finance

37
Insert Map : Tanzania: Regional Variation in Poverty
38
Annex I
The Participatory Process for the PRSP
(i) Policy and Technical Coordination of the PRSP Work In October 1999, a Committee of twelve Ministers and the Governor of the Bank of Tanzania was formed to steer the process of preparing the PRSP. This Committee was supported by a Technical Committee comprising officials from the Vice President’s Office, Prime Minister’s Office, Planning Commission, Ministry of Finance, Education, Health, Works, Community Development, Local Government, Agriculture, Water, Energy and Minerals, Labour and Youth Development and the Bank of Tanzania and was coordinated by the Ministry of Finance. The process of preparing the PRSP was coordinated by the Vice President’s Office. The Technical Committee was specifically asked to prepare the interim and final PRSP and organize the Zonal PRSP, and National Workshops. (ii) Interim PRSP The interim PRSP was prepared by the Technical Committee in early January 2000; discussed at a consultative technical meeting, including Government representatives and stakeholders from the donor community and civil society; and reviewed and approved the Cabinet in early February 2000. (iii) The Zonal Workshops In preparation for the Zonal Workshops, the Technical Committee secured expert assistance to draft a Reference Document which outlined, among other things, objectives of the workshops; issues to guide the discussion; composition and numbers of participants; and methodology to be used in conducting the workshops. The Zonal Workshops, which were mainly aimed at soliciting views from the grassroots stakeholders, were conducted concurrently during May 11-12, 2000 in seven zones covering all regions in Mainland Tanzania. The zones include: Lake Zone (Mwanza, Mara and Kagera); Western Zone (Kigoma, Shinyanga and Tabora); Northern Zone (Arusha, Kilimanjaro and Tanga); Central Zone (Dodoma and Singida); Southern Highlands Zone (Mbeya, Ruvuma, Rukwa and Iringa); Southern Zone (Mtwara, and Lindi); and Eastern Zone (Dar es Salaam, Morogoro and Coast). Each district was represented by 4 villagers (sampled randomly from two villages), one district councilor, one town councilor, and one district executive director (DED). For every zonal workshop, civil society was represented by five NGOs (with one person each). In total, 804 participants attended the workshops, comprising of 426 villagers, 215 councilors, 110 District Executive Directors (DED) and 53 persons from NGOs. Of the participants, 180 (or 22 percent) were women. The workshops were conducted through working groups, followed by plenary presentations. To ensure active participation, villagers were grouped according to region and gender, councilors by region; DEDs by region; and NGOs by zone. Among the issues discussed by each group were: definition of poverty,
39
causes of poverty, characteristics of poverty, indicators for poverty, identification of priority areas for poverty reduction and actions required. Generally, the zonal workshops were successful in highlighting the views and reactions of grassroots participants, particularly women. The report on each zonal workshop was presented to the Technical Committee on May 16, 2000. In summary, participants in all zones identified education as the top priority area for poverty reduction, followed by agriculture, health, roads, and water. The following were identified as constraints in the effort to reduce poverty: “poor governance”, cultural factors, illiteracy, poor condition of rural roads and marketing system for agricultural produce, unavailability of inputs and implements, and inadequate (and poor) extension services. (iv) Consultative Group (CG) meeting May 22, 2000 At the CG meeting, which took place in Dar es Salaam, the Government reported on progress toward the preparation of the PRSP, including the outcome of the Zonal Workshops. (v) Preparation of the Initial Draft of the PRSP The initial draft of the PRSP was prepared by a team of experts from key ministrie s using the results of consultations with the stakeholders and background papers such as Tanzania Development Vision 2025 (1998); Tanzania Assistance Strategy (TAS), National Poverty Eradication Strategy (1997); National External Debt Strategy (1998); and Public Expenditure Review (PER). Specific studies on education, health agriculture, rural development, environment, employment, HIV/AIDS, land reform, institutional reform, and governance also provided useful background information. (vi) Consultation with Donor Community The Government convened a consultative meeting with Donor community on June 30, 2000 to seek comments of the Donor community on the PRSP process and the draft PRSP. A joint World Bank/IMF Mission also attended the meeting. (vii) Consultation with Members of Parliament On July 1, 2000, the parliamentarians were briefed on the concerns and priorities identified at the Zonal Workshops. This background information gave the parliamentarians an opportunity to indicate their concerns and priorities regarding poverty reduction efforts. (viii) National Workshop on the PRSP A national workshop with 25 participants, was held on August 3-4, 2000. Among the participants were Permanent Secretaries, Regional Commissioners, representatives of the donor community, the multilateral institutions, private sector organizations, non-Governmental organizations, the public media, and informal sector representative. The major objective of this workshop was to seek further reactions to the targets, priorities and actions as outlined in the draft PRSP.

40
(ix) Retreat Workshop for Regional Administrative Secretaries (RAS) The draft PRSP was also presented to RAS during their retreat workshop held at Lobo in Serengeti on August 3-4, 2000 for further discussions. (x) Presentation of PRSP to the Cabinet A revised draft PRSP was presented to the Cabinet for review and approval on August 31, 2000.

41
ANNEX II
LOGICAL FRAME FOR THE TANZANIA PRSP OBJECTIVE/IMPACT
INDICATORS TARGETS/OUTCOME
INDICATORS INTERMEDIATE
INDICATORS ACTIONS
I. Reduced Income Poverty Long Term Medium Term
(i) Breadth – proportion of population below PL
Reduced the proportion of the population below PL by half (from 48% to 24%) by 2010. Reduced proportion of the rural poor by half (from 57% to 29%) by 2010 Reduced proportion of food poor by half (from 27% to 14%) by 2010.
Reduced the proportion of the population below PL from 48% to 42% by 2003. Reduced proportion of rural poor by 7.5% points by 2003. Reduced proportion of food poor by 3.5% points by 20003
Overall GDP growth of 6%. Expanded Investment (Physical & Human) Improved Investment Productivity Growth of agriculture by at least 5% by 2003. Developed Private Sector Strat egy by 2003.
Maintain macro stability. Improve rural roads and other infrastructure services (water, power, telecoms, etc.). Develop micro finance facilities Improve investment climate in line with the PSD programme: - A growing strong and diversified private sector. - Reduce the costs of doing business. - An efficient and effective legal system. Prepare and adopt Private Sector Development Strategy to ensure coordination between Government and Donor initiatives. Improve access to agriculture research and extension. Facilitate access to micro-finance/agricultural credit. Promote rural finance, improve trading/marketing of output and inputs, and remove administrative fiat. Promote exportation of agricultural products as well as agro-processed commodities. Promote community based irrigation. Distribute land suitable for irrigation in favour of the poor. Ensure enabling environment for Micro, Small and Medium Enterprises (MSMEs) and informal sector activities.

42
OBJECTIVE/IMPACT INDICATORS
TARGETS/OUTCOME INDICATORS
INTERMEDIATE INDICATORS
ACTIONS
Rehabilitated 4,500 km of rural roads under the Urgent Roads Rehabilitation Program (URRP) in twelve identified poorest regions – Dodoma, Kagera, Lindi, Kigoma, Coast, Mtwara, Morogoro, Mara, Tanga, Rukwa, Tabora and Singida) by 2003. Undertaken routine and periodic maintenance promptly on all rural road network.
Taxation (levels and rationalization) Promote training in demand driven skills and employment, counselling. Increase budget allocation to financing rehabilitation and maintenance of rural roads Develop and apply labour intensive technology for rehabilitation and maintenance and increase the use of local contractors. Strengthen the capacity at district level to manage road rehabilitation and maintenance carried out by contractors.
II. Improve Quality of Life and Social Well-being (i) Human Capabilities Reduced
illiteracy by 100% by 2010
Achieved gender equality in primary and secondary education by 2005. Increased the proportion of school age children successfully completing primary education.
Increased gross enrolment to 85% by 2003. Increased transition rate of primary to secondary level from 15% to 21% by the year 2002/03. Reduced drop-out from 6.6% to 3%. Increased net primary schol enrolment from 57% to 70%. Increased the number of students passing at specified mark in standard 7 examination from 20% to 50% by 2003.
Strengthen the management capacity of districts, schools, TTCs and adult education centres. School mapping and improvement plans. Increase the capacity and improve inspection services coverage. Improve the quality and distribution of primary school teachers through inservice training at anual rate of 10% up to the year 2003. Improve learning environment at all levels (textbooks, materials, furniture, sanitation, classrooms, teachers houses, etc) Promote private and community based secondary education Improve and protect basic education spending share.

43
OBJECTIVE/IMPACT INDICATORS
TARGETS/OUTCOME INDICATORS
INTERMEDIATE INDICATORS
ACTIONS
Reduced burden of disease through reduced morbidity
Increased the % of passing Standard 7 examination at a specified score. Reduced burden of disease through reduced morbidity
Increase secondary enrolment from 5% to 7% by 2003
Provide/construct additional classrooms and rehabilitate existing ones. Increase the level and improve allocation of budget resources for basic health care. Provide quality health services to all within reachable distances. Strengthen and reorient secondary and tertiary services delivery to support primary health care services. Strengthen the national support systems for personnel management, drugs and supplies, medical equipment. Promote the participatio of private sector and civil society involvement in public health services delivery.
Facilitated the provision of adequate, safe and clean water to the rural areas from 48.5% population coverage in 2000 to 85% by 2010.
Facilitated the provision of adequate, safe and clean water in rural areas from 48.5% in 2000 to 55% by 2003.
Fully implement the 2000 Water Policy according to plan.
Rehabilitate all malfunctioning and non-operative water supply schemes and earth moving and drilling equipment. Conduct needs assessment of different social groups in rural areas. Strengthen the water resource and water quality data bases. Increase spending in rural water supply. Promote the use of rainwater harvesting. Carry out hydrological and hydrogeological surveys. Carry out regular water supply quality surveilance and apply the WHO quality standards.
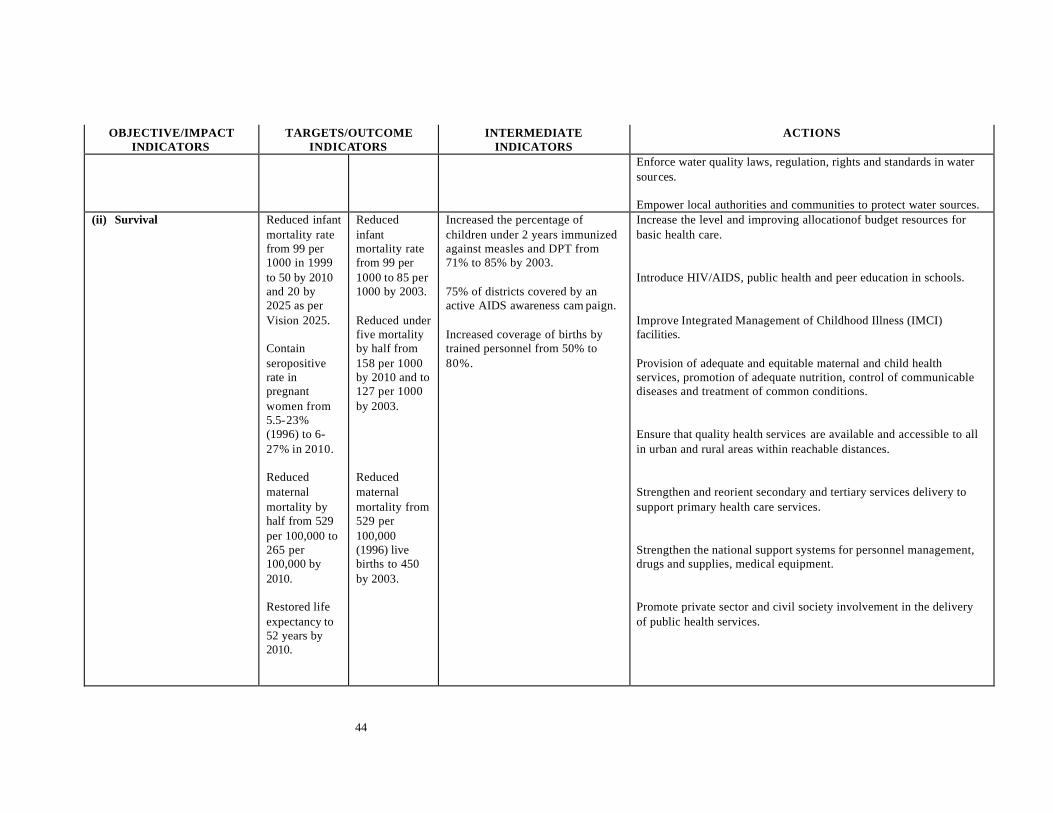
44
OBJECTIVE/IMPACT INDICATORS
TARGETS/OUTCOME INDICATORS
INTERMEDIATE INDICATORS
ACTIONS
Enforce water quality laws, regulation, rights and standards in water sources. Empower local authorities and communities to protect water sources.
(ii) Survival Reduced infant mortality rate from 99 per 1000 in 1999 to 50 by 2010 and 20 by 2025 as per Vision 2025. Contain seropositive rate in pregnant women from 5.5-23% (1996) to 6-27% in 2010. Reduced maternal mortality by half from 529 per 100,000 to 265 per 100,000 by 2010. Restored life expectancy to 52 years by 2010.
Reduced infant mortality rate from 99 per 1000 to 85 per 1000 by 2003. Reduced under five mortality by half from 158 per 1000 by 2010 and to 127 per 1000 by 2003. Reduced maternal mortality from 529 per 100,000 (1996) live births to 450 by 2003.
Increased the percentage of children under 2 years immunized against measles and DPT from 71% to 85% by 2003. 75% of districts covered by an active AIDS awareness cam paign. Increased coverage of births by trained personnel from 50% to 80%.
Increase the level and improving allocationof budget resources for basic health care. Introduce HIV/AIDS, public health and peer education in schools. Improve Integrated Management of Childhood Illness (IMCI) facilities. Provision of adequate and equitable maternal and child health services, promotion of adequate nutrition, control of communicable diseases and treatment of common conditions. Ensure that quality health services are available and accessible to all in urban and rural areas within reachable distances. Strengthen and reorient secondary and tertiary services delivery to support primary health care services. Strengthen the national support systems for personnel management, drugs and supplies, medical equipment. Promote private sector and civil society involvement in the delivery of public health services.

45
OBJECTIVE/IMPACT INDICATORS
TARGETS/OUTCOME INDICATORS
INTERMEDIATE INDICATORS
ACTIONS
Malaria in-patient case fatality rate for under -five children decreased from 12.8% (1997) to 8% by 2010
Reduced Malaria case fatality for under five children from 12.8% to 10% by 2003
Implement national malaria control program as planned for 2000/01 – 2002/03.
(iii) Social well being Social inclusion Personal security Ensure effective participation of all stakeholders in the formulation, implementation and monitoring the Strategy
Fully implemented Poverty Reduction Strategy as planned
Fully implemented LGRP by 2003 Speed up primary court decisions, raising the ratio of decided filed cases from 63% to 80% Reduce average time taken to settle commercial disputes to 18 months by 2003 Raise coverage of actual allocation for OC requirement in the judiciary from the current 50% to 100% Number of workshops held and composion of committees
Complete all components of the local government reform programme in all rural and urban councils Speed up primary court decisions Raise OC in the Judiciary Promote community based security arrangements Promote effective participation of all stakeholders
(iv) Nutrition
Reduced prevalence of stunting from 43.4% to 20%.
Reduced the prevalence of wasting from 7.2% to 2%.
Improved child feeding practices and implement fully malaria control programme and IMCI.
Promote nutritional education, especially to mothers. Provide health services to mothers and children. Provide school funding program

46
OBJECTIVE/IMPACT INDICATORS
TARGETS/OUTCOME INDICATORS
INTERMEDIATE INDICATORS
ACTIONS
(v) Extreme vulnerability
Built capacity to all communities needing safety net s programmes.
Established data base for the vulnerable groups by 2003. Promoted the production of drought resistant crops in all drought prone areas Promoted community managed irrigation schemes in all potential irrigation areas by 2003
Facilitate creat ion of data base for vulnerable groups. Promote drought resistant crops Create Equalization Fund to cater for disadvantage areas. Promote community managed irrigation schemes Promote community-based care programmes for most vulnerable groups. Scale up efforts for afforestation and destocking.
III. Achieve and Sustain a Conducive Development Environment (i) Macroeconomic stability
Attained inflation rate at par with trading partners Maintained fiscal balances
Consumer price inflation of 4.0% by end of June 2003. Sustainable current account balance. Reserves sufficient to finance four months imports.
Maintain prudent fiscal and monetary policies and reduce trade gap, as per macro frame.
(ii) Governance Improve effectiveness in the delivery of public services and the overall incentive environment
Rolled out the IFMs to all ministries and sub-treasuries; ensure that all budgetary votes at the central and sub-treasury levels are managed through IFMs; and record all expenditure commitments
A governance system that is efficiently and effectively decentralized.
Use only IFMs as central government budgeting, accounting, and financial information systems for the recurrent expenditure, and re-classify the development budget according to the GFS.
Extend the IFMS to all Ministries, Departments, Agencies in Dar es Salaam and in all regional sub-treasuries by 2002. Encourage all donors to participate in the Integrated Financial Management Information System.

47
OBJECTIVE/IMPACT INDICATORS
TARGETS/OUTCOME INDICATORS
INTERMEDIATE INDICATORS
ACTIONS
and arrears through the IFMs. Reduced the spread and magnitude of corruption.
Minimize resource leakage and strengthen accountability
Developed and approved specific anti-corruption action plans for the ministries of Agriculture and Cooperatives, Education and Culture; Health; and Water; and the CSD based on the National Anti-corruption Strategy. Improved integrity and transparency in the accounting system.
Carry out diagnostic surveys for and implement sector specific anti-corruption plans for the Judiciary; Ministries of Works; Education and Culture; Health; and Home Affairs; the AG’s Office, TRA and approve ooperational strategies for these areas. Make the Central Tender Board’s results public through press release. Strengthen systems for more efficient cash management, procurement, payment and expenditure control, inventory, equipment and asset management and timely audit reports.
Improve the performance of the public sector
Strengthened professional and cost effectiveness of the public service system. Improved public service capacity, motiv ation and performance. Improved budget management at central and lower levels.
Developed and approved performance improvement modules for priority sectors. Allowed institutional pluralism in the delivery of public services. Timely prepared budgets at al l levels.
Implement actions under Public Sector Reform Program (CSPR &LGR). Follow -up resource mobilization efforts to support the poverty reduction strategy programme.
48
Annex III
Monitoring and Evaluation System for the Poverty Reduction Strategy 1. Sources of Information Several data sources will be used in the M&E system for the PRSP. They can be grouped into three categories: - Indicators measured through administrative systems. This is where authorities at a lower
level are required to transmit information to higher authorities periodically, as an integrated part of their duties and responsibilities. This category includes progress reporting as well as routine data collection. Many of the indicators in the education, health and roads sectors a re collected in this way. Routine data collection by government has as a major advantage that it provides a continuous stream of detailed data at little additional cost. However, because the data is generally collected at institutions, there can be a degree of bias in the figures. Another weakness of these systems is that they often rely on population estimates, which may not be accurate. Indicators measured through routine data collection systems therefore have to be cross-checked regularly with measurement through other means.
- Indicators measured through censuses and surveys. These include all indicators that may
not be obtained through administrative records altogether or as a way of cross-checking the institution-based data from routine monitoring systems. Indicators which can only be collected through censuses and surveys include, income poverty indicators and mortality indicators. Indicators that can be collected through the administrative system but require periodic cross-checking through surveys include, for example, immunisation rates.
- Indicators measured at community level, primarily for use by the ward and village,
through village register and community interviews. While the primary use of these data is for local planning purposes, these sources can also provide useful indications on trends in poverty. This category also includes participatory assessments.
- The integration of a regular PPA in the monitoring system for the PRSP will provide
invaluable qualitative data, which will serve to cross-check quantitative data, help us judge the effectiveness of policy measures and more generally will help us understand the causal links between the action programme of the PRSP and changes in poverty. But most importantly, it will help us listen to the concerns, perceptions and opinions of the poor themselves.
The clusters of indicators identified in the previous section can be matched to sources as follows: Income As described in the chapter on poverty status, the results of the 1991/92 Household Budget Survey and the listing exercise for the 2000/2001 Household Budget Survey have been used

49
by the National Bureau of Statistics to estimate poverty headcount ratios for 2000. There are, however, major methodological caveats related to these estimates. A more accurate baseline poverty headcount ratio will be known once the results of the 2000/2001 Household Budget Survey are released in 2001. It is not anticipated that another Household Budget Survey will be held during the implementation period of this PRSP. Annual poverty monitoring surveys will measure proxy indicators for income. These proxy indicators will be used to estimate changes in the poverty headcount ratio. A baseline for the proxy indicators will be derived from the 2000/2001 Household Budget Survey. The 2002 Census will provide additional measurements of proxy indicators. Among the intermediate indicators for income poverty, a baseline and annual updates are available from the National Accounts and the Economic Survey prepared by NBS and the Planning Commission for the GDP growth rate, the agriculture growth rate and investment as a percentage of GDP. A baseline and subsequent updates on the kilometres of rural roads rehabilitated can be obtained from the Road Sector reports prepared by the Ministry of Works and the Ministry of Regional and Local Government. Survival Mortality figures are typically measured through the Population Census, held approximately at ten-year intervals and through Demographic and Health Surveys, held approximately every five years. Baseline estimates for infant and under-five mortality are available from the 1999 Tanzania Reproductive and Child Health Survey (Interim DHS). Although the sample of the 1999 TRCHS was relatively small when compared to a full DHS, it is proposed to use the 1999 estimates as baseline figures for infant and under-five mortality. Updates on mortality figures will be available from the 2002 Census and from the next DHS, which is expected to be held during the implementation period of this PRSP. A baseline estimate for immunisation coverage can be found in the 1999 Tanzania Reproductive and Child Health Survey. Annual updates can be obtained from the Health Information System and the next DHS. The percentage of births attended by trained personnel can also be monitored by using the 1999 TRCHS and the next DHS. The proportion of districts with an active AIDS awareness campaign is monitored by the National AIDS Control Programme. Nutrition Baseline estimates for the nutritional status of children are available from the Tanzania Child and Reproductive Health Survey 1999, which will be used here, despite its small sample. A new estimate will be available from the next DHS. The nutritional status of children is also measured through community-leve l monitoring and routine monitoring at health centres. The annual poverty monitoring surveys may also include an anthropometric module. Human capabilities All education indicators in this section can be measured through the routine data collection system of the Ministry of Education, which provides data annually. The 2002 Census will provide a cross-check on the institution-based data for enrollment. The ongoing School Mapping exercise will also provide valuable new estimates on some of these indicators.

50
Water The water indicator will be monitored through the 2002 Census and the next DHS. Baseline figures are available from the 1999 TRCHS. Macro-economic stability The consumer fiscal deficit, foreign exchange reserve level and price inflation rate are measured in the annual economic survey. Good Governance/Tracking of public expenditure The resource allocation indicators will be monitored through the PER, MTEF and Annual Budget processes. The PER will remain the main annual instrument for monitoring expenditure allocation and result orientation. The quarterly review meetings should be retained for ongoing reviews to catch possible problems earlier. The rolling out of IFMS to all levels of Government will help obtain timely and consistent reports on expenditures. The lynchpin of the monitoring system will be the MTEF, which is the main instrument for determining whether expenditure allocations are being adjusted to support poverty reduction. Under the PER process, Expenditure tracking through the different levels of government to the actual service delivery unit already carried out for education, health and road fund will be scaled up to cover priority sectors and if possible to be carried out every year. The government will also institute a system of “independent” monitors within the framework of the Tanzania Assistance Strategy to follow up governments commitments to improve governance and institutional framework for higher integrity and more transparent accountability as well as donor coordination, improved integration of external assistance into the exchequer system, and simplification of aid disbursement procedures. 2. Institutional framework for monitoring and evaluation The M&E system for the PRSP needs an appropriate institutional framework, which consists of two elements: institutional arrangements and an institutional environment. Appropriate institutional arrangements specify clear lines of responsibility for the various sectors and agencies in order to promote demand-driven data generation, compilation and analysis. Clearly specified institutional arrangements will maximise benefits arising from specialisation and minimise overlaps and conflicts. A proper institutional environment sets ‘rules of the game’ by defining standards and putting in place appropriate incentives for the smooth implementation of the monitoring system. Institutional arrangements There is a wide range of actors involved in PRSP monitoring activities, which range over data collection, processing, analysis and utilisation. A clear and agreed institutional arrangement for monitoring is paramount if these monitoring activities are to be integrated into a coherent monitoring system. This framework should clearly spell out roles and responsibilities at different levels.

51
The overall responsibility for monitoring poverty at the national level lies with the Vice-President’s Office the government institution charged with the co-ordination of poverty eradication initiatives to ensure that all relevant stakeholders are involved in the monitoring process, the government intends to establish monitoring committees with broad membership. For actual data collection, the leading institutions are the National Bureau of Statistics, the line ministries and academic and research institutions. The National Bureau of Statistics is responsible for large household surveys, the Census and national accounts. The line ministries collect sectoral data, most importantly through routine data collection mechanisms and administrative systems. Academic and research institutions collect data through ad hoc research on specific issues. The findings of poverty monitoring need to be applied to policy making. This is the responsibility of policy makers, supported by the Vice-President’s Office, the National Planning Commission and academic and research institutions. In order to develop the monitoring system a mechanism has to be designed to allow broad stakeholder discussion about the monitoring system. One could think of a forum similar to the TAS data and information task group. This group would meet regularly to discuss and decide on issues related to the monitoring system, including the setting of standards. Institutional environment Apart from making the required institutional arrangements, it is also important to create the right institutional environment. This entails setting standards for monitoring and making sure the correct incentives and disincentives are in place to ensure smooth implementation of the monitoring system. There is an important role for the stakeholders forum described above, in collaboration with the National Bureau of Statistics and the Vice-President’s office. The other element of the institutional environment is the need for the right incentives and disincentives to ensure that all actors in the monitoring system play their role as agreed. These incentives and disincentives could be in the area of funding, access to training and other elements of institutional capacity-building, etc. The stakeholder forum for the monitoring system should play the leading role in determining and administering the incentive system. Data storage There is a definite need for central storage of the data collected through the PRSP monitoring system, in an easily accessible format that facilitates analysis and the use of data in policy analysis. The National Bureau of Statistics is co-ordinating a Socio-Economic Database initiative, which is most suitable as an instrument for this purpose. The Tanzania Socio-Economic Database (TSED) exists in working proto-type and a first release of the full working version will be available on CD-ROM by the end of August, and on the government network and the world wide web by the end of 2000. The Poverty Module in TSED can easily be modified to serve as the PRSP database. TSED will be co-ordinated by the National Bureau of Statistics, while ministries and other data collecting institutions will make available and upload their data sets. The database will eventually contain data on over 300 indicators and where available will contain time series, multiple estimates from various sources, disaggregated data down to district level, by sex and urban/rural strata. TSED allows user-friendly analysis, through table, graph and map options and provides an opportunity to calculate composite indices. It is an ideal tool to facilitate the use of data by policy makers. As there are many weaknesses in Tanzania’s current poverty monitoring activities the PRSP provides a golden opportunity to enhance poverty monitoring in the country and to build a
52
coherent poverty monitoring system. To take advantage of this opportunity, it is necessary to make a significant investment in capacity-building. Capacity-building is needed at all levels. For the data collecting agencies, there is a need to strengthen existing data collection mechanisms. Line ministries will need support to enhance their routine surveillance and administrative data systems. The National Bureau of Statistics will need extra support, in particular for the new annual poverty monitoring surveys it is to carry out, but also to strengthen its operations in the regions. Local government, civil society organisation and research institutions will need support to build their capacity to implement the participatory poverty assessments. At the level of compilation and dissemination, NBS will need support for the annual poverty monitoring surveys, particularly if they depend on high-tech data capture such as scanning and optical map reading. Capacity needs to be built among line ministries and in NBS for the successful implementation and management of the Tanzania Socio-Economic Database. In data analysis, the academic and research institutions and the Planning Commission need to be supported to ensure that they have the minimum required staff and equipment in place. A major investment is required in building the capacity of the Vice-President’s office and other government agencies to facilitate the application of findings to policy making. As the scope of capacity-building intervent ions is so vast, a comprehensive needs assessment is required, which should be carried out as a matter of urgency. Linking M&E data and policy making The M&E system outlined in this chapter is collecting data with the aim to facilitate an assessment of the effectiveness of the Poverty Reduction Strategy. It will be crucial, therefore, to make sure that data is available to policy makers in a user-friendly format and that interpretation of the M&E findings is stimulated. The government proposes to hold annual workshops for senior policy makers in the relevant ministries to reflect on progress with the PRSP and to review M&E data. These workshops would ideally be preceded by national or zonal workshops where a wide range of stakeholders is invited to share their assessment of PRSP implementation. The main conclusions of these stakeholder workshops would provide an important input to the policy maker workshops. The detail of these arrangements will be worked out during the first year of implementation of the PRSP. Evaluation It is proposed that towards the end of the third year of implementation, an evaluation of the PRSP is carried out by a team of representatives of the major stakeholders. The team will review all quantitative and qualitative data collected during the implementation period, thus using the monitoring system as the basis for its work. The team will also collect additional information through interviews with key informants. The results of the evaluation will be presented at workshops for policy makers and at stakeholder workshops and will serve to inform the design of the next phase of the Poverty Reduction Strategy. 3. Costing the M & E Proposals The different elements of the monitoring system for the PRSP have not received sufficient resources in budget allocations so far, as the details and requirements of this system were not

53
available when the budget and MTEF were drawn up. It is therefore important to indicate what the cost implications of the monitoring system described above could be, so that appropriate budget action can be taken. The cost implications are of two types. It is estimated that the cost of the capacity needs assessment and the resulting capacity-building interventions in the first year of implementation of the PRSP may cost in the region of US$750,000. This will include training as well as other aspects of institutional capacity-building. The enhancement of existing data collection mechanisms and the introduction of annual poverty monitoring surveys and PPAs may cost in the region of US$1.5 million. The total amount required for the establishment and first year of operation of the PRSP monitoring system (additional to already planned expenditure), is in the region of US$2.25 million. In subsequent years, the required budget will be nearer US$1.5 million. 4. Next Steps In order to secure adequate funding for the M&E system, the government will coordinate the preparation of a proposal, which will be submitted to donors and used to secure appropriate allocations for monitoring purposes. In addition, it will be noted that the description of the M&E system is not yet very specific on a number of issues. This is unavoidable at this stage. Detailed discussions will need to be held between key stakeholders to decide on the details of the institutional framework and the exact nature of some of the data collection mechanisms, such as the annual poverty monitoring surveys and the participatory poverty assessments. The government will, as a matter of urgency, facilitate these discussions, even before implementation of the strategy starts.