Embed Size (px)
Citation preview
BV: Income and Asset Approaches VALUATION METHODS
© 1995–2015 by National Association of Certified Valuators and Analysts (NACVA). All rights reserved. Chapter Six – 1 Used by Institute of Business Appraisers with permission of NACVA for limited purpose of collaborative training. 2015.v1
CHAPTER SIX
VALUATION METHODS
I. ASSET-BASED APPROACH: ADJUSTED NET ASSETS METHOD
The Adjusted Net Assets Method is an asset-oriented approach. This method is used to value a
business based on the difference between the fair market value (FMV) of the business assets and its
liabilities. Depending on the particular purpose or circumstances underlying the valuation, this
method sometimes uses the replacement or liquidation value of the company’s assets less the
liabilities. Under this method, the analyst adjusts the book value of the assets to fair market,
replacement, or liquidation values, and then reduces the total adjusted value of assets by the FMV of
any recorded or unrecorded liabilities. Tangible as well as intangible assets are valued in
determining total adjusted net assets. If the analyst will be relying on other professional appraisers
for values of certain tangible assets, the analyst should be aware of the standard of value used for the
appraisal. This method is used to derive a total value for the business or for component parts of the
business.
The Adjusted Net Assets Method is a sound method for estimating the value of a non-operating
business, e.g., holding or investment companies. It is also a good method for estimating the value of
a business that continues to generate losses or which is to be liquidated.
Some valuators believe the Adjusted Net Assets Method sets a “floor value” for determining total
entity value. In a valuation of a controlling interest where the business is a going concern, there
would have to be a reason why the controlling owner would be willing to take less than the
business’s asset value. However, if the Adjusted Net Asset Method results in a higher value than the
income or market approaches, you need to carefully review the fair market value of the assets to
determine whether the fair market values are overstated. This might occur where the assets are
underperforming, resulting in a value estimate less than the adjusted net assets value but more than
the liquidation value.
The negative aspect to this method is that it ignores the business’s operating earnings. Therefore, it
would be inappropriate to use this method to value intangible assets, such as patents or copyrights,
which are typically valued and based on operating earnings, e.g., royalties. However, replacement
cost methodology may be utilized in determining values of intangibles, e.g., patents.
Exercise
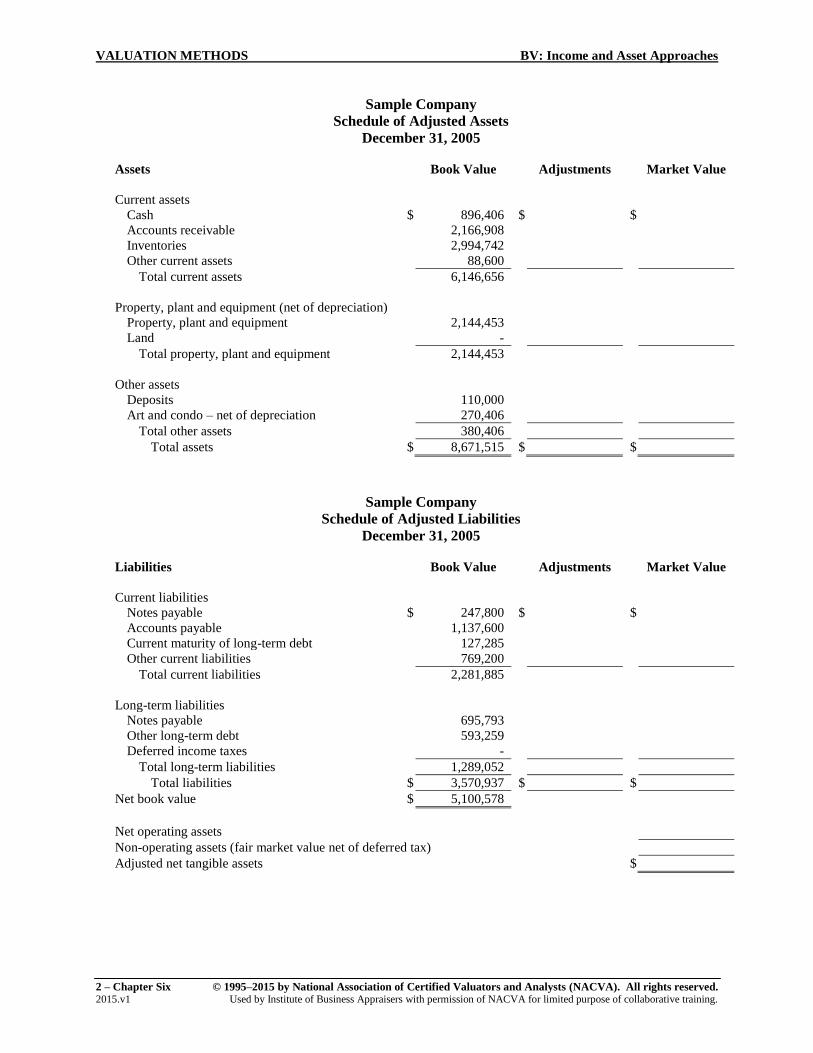
Calculate the adjusted net assets. Assume that your analysis of the net assets indicated that $200,000
of the cash is excess cash, reserve for bad debts is $163,000, LIFO reserve is $312,600, fair market
value of the property, plant and equipment is $2,500,000, the fair market value of the art and condo
(non-operating assets) is $450,000. You should treat the excess cash, art and condo as non-operating
assets. Net present value of deferred taxes on built-in gains is $190,000, of which $50,000 is
attributable to the non-operating assets.
VALUATION METHODS BV: Income and Asset Approaches
2 – Chapter Six © 1995–2015 by National Association of Certified Valuators and Analysts (NACVA). All rights reserved. 2015.v1 Used by Institute of Business Appraisers with permission of NACVA for limited purpose of collaborative training.
Sample Company
Schedule of Adjusted Assets
December 31, 2005
Assets Book Value Adjustments Market Value
Current assets
Cash $ 896,406 $ $
Accounts receivable 2,166,908
Inventories 2,994,742
Other current assets 88,600
Total current assets 6,146,656
Property, plant and equipment (net of depreciation)
Property, plant and equipment 2,144,453
Land -
Total property, plant and equipment 2,144,453
Other assets
Deposits 110,000
Art and condo – net of depreciation 270,406
Total other assets 380,406
Total assets $ 8,671,515 $ $
Sample Company
Schedule of Adjusted Liabilities
December 31, 2005
Liabilities Book Value Adjustments Market Value
Current liabilities
Notes payable $ 247,800 $ $
Accounts payable 1,137,600
Current maturity of long-term debt 127,285
Other current liabilities 769,200
Total current liabilities 2,281,885
Long-term liabilities
Notes payable 695,793
Other long-term debt 593,259
Deferred income taxes -
Total long-term liabilities 1,289,052
Total liabilities $ 3,570,937 $ $
Net book value $ 5,100,578
Net operating assets
Non-operating assets (fair market value net of deferred tax)
Adjusted net tangible assets $
BV: Income and Asset Approaches VALUATION METHODS
© 1995–2015 by National Association of Certified Valuators and Analysts (NACVA). All rights reserved. Chapter Six – 3 Used by Institute of Business Appraisers with permission of NACVA for limited purpose of collaborative training. 2015.v1
Sample Company
Adjusted Net Asset Method Summary
December 31, 2005
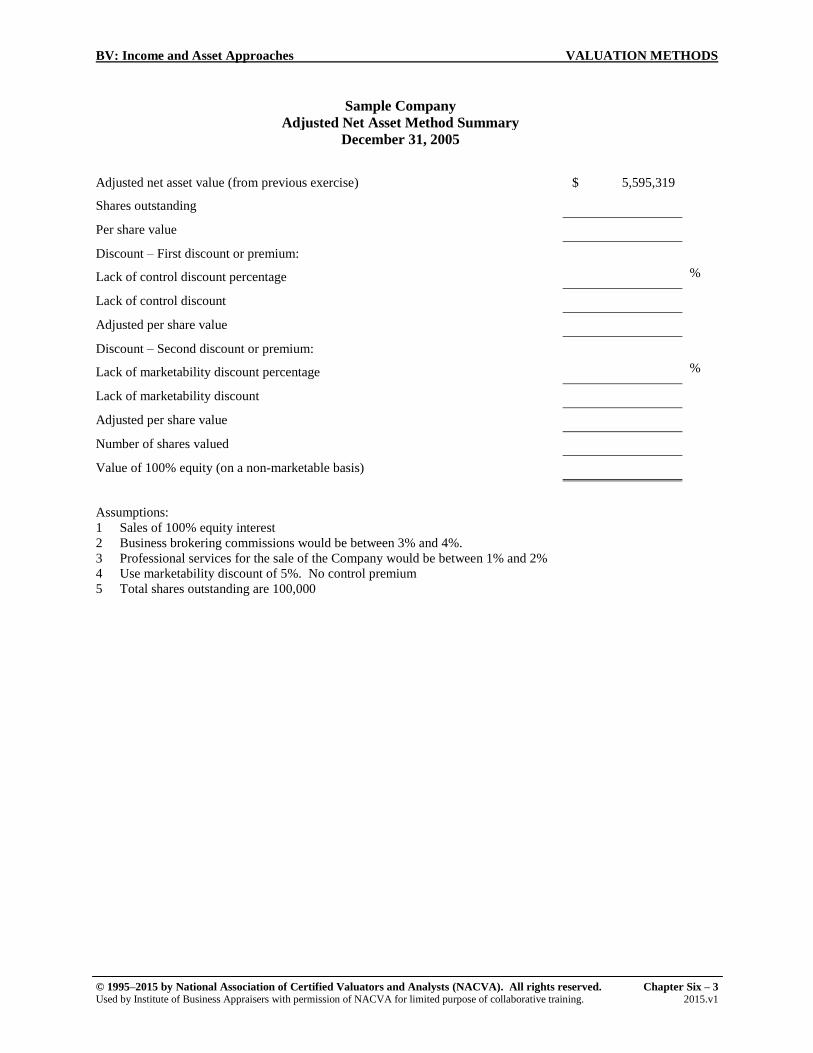
Adjusted net asset value (from previous exercise) $ 5,595,319
Shares outstanding
Per share value
Discount – First discount or premium:
Lack of control discount percentage %
Lack of control discount
Adjusted per share value
Discount – Second discount or premium:
Lack of marketability discount percentage %
Lack of marketability discount
Adjusted per share value
Number of shares valued
Value of 100% equity (on a non-marketable basis)
Assumptions:
1 Sales of 100% equity interest
2 Business brokering commissions would be between 3% and 4%.
3 Professional services for the sale of the Company would be between 1% and 2%
4 Use marketability discount of 5%. No control premium
5 Total shares outstanding are 100,000
VALUATION METHODS BV: Income and Asset Approaches
4 – Chapter Six © 1995–2015 by National Association of Certified Valuators and Analysts (NACVA). All rights reserved. 2015.v1 Used by Institute of Business Appraisers with permission of NACVA for limited purpose of collaborative training.
II. INCOME APPROACH: CAPITALIZATION OF EARNINGS METHOD
The Capitalization of Earnings Method1 is an income-oriented approach. This method is used to
value a business based on the future estimated earnings to be generated by the company. These
estimated future earnings are then capitalized using an appropriate capitalization rate. This method
assumes all of the tangible or intangible assets are indistinguishable parts of the business and does
not attempt to separate the two values. In other words, the critical component to the business value is
its earnings. This method expresses a relationship between the following:
Estimated future earnings amount
Yield (rate of return) on the total investment (capitalization rate)
Estimated business value
Any income or expense items generated from non-operating related assets and liabilities should be
removed prior to applying this method.
This method is more theoretically sound in valuing a profitable business where the investor’s intent
is to provide for a return on investment (ROI) above a reasonable compensation amount, and future
benefits streams or earnings are likely to be even.
Exercise
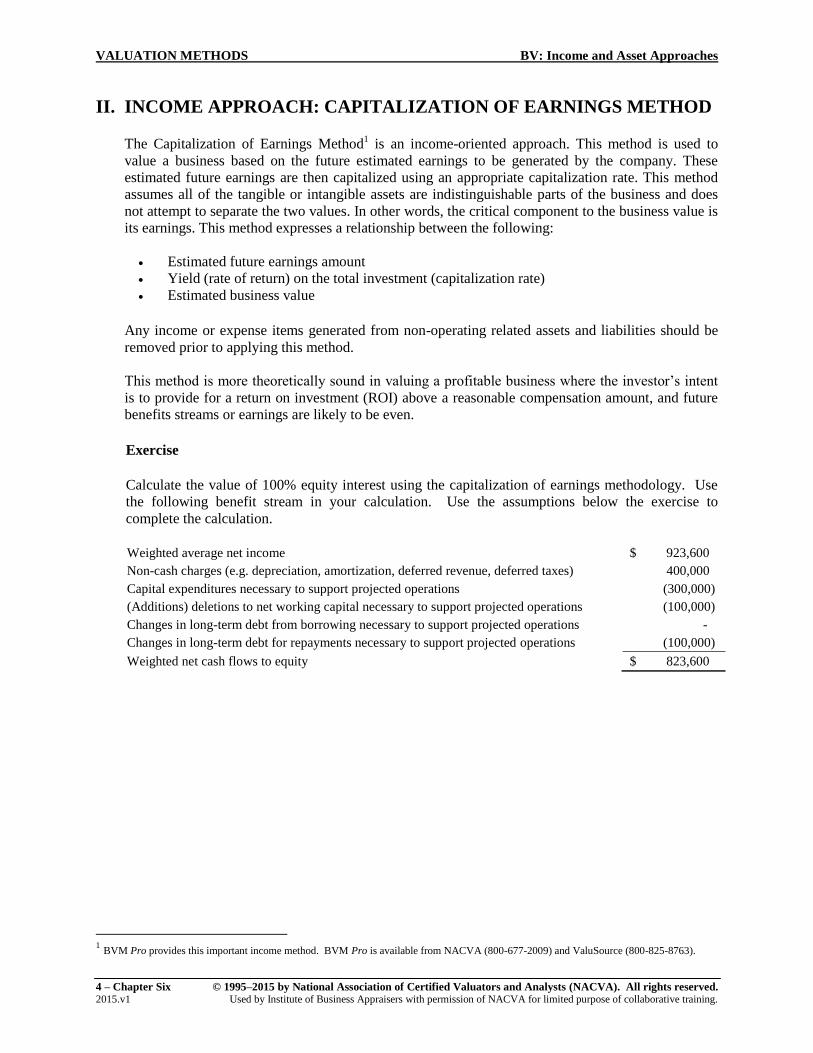
Calculate the value of 100% equity interest using the capitalization of earnings methodology. Use
the following benefit stream in your calculation. Use the assumptions below the exercise to
complete the calculation.
Weighted average net income $ 923,600
Non-cash charges (e.g. depreciation, amortization, deferred revenue, deferred taxes) 400,000
Capital expenditures necessary to support projected operations (300,000)
(Additions) deletions to net working capital necessary to support projected operations (100,000)
Changes in long-term debt from borrowing necessary to support projected operations -
Changes in long-term debt for repayments necessary to support projected operations (100,000)
Weighted net cash flows to equity $ 823,600
1 BVM Pro provides this important income method. BVM Pro is available from NACVA (800-677-2009) and ValuSource (800-825-8763).
BV: Income and Asset Approaches VALUATION METHODS
© 1995–2015 by National Association of Certified Valuators and Analysts (NACVA). All rights reserved. Chapter Six – 5 Used by Institute of Business Appraisers with permission of NACVA for limited purpose of collaborative training. 2015.v1
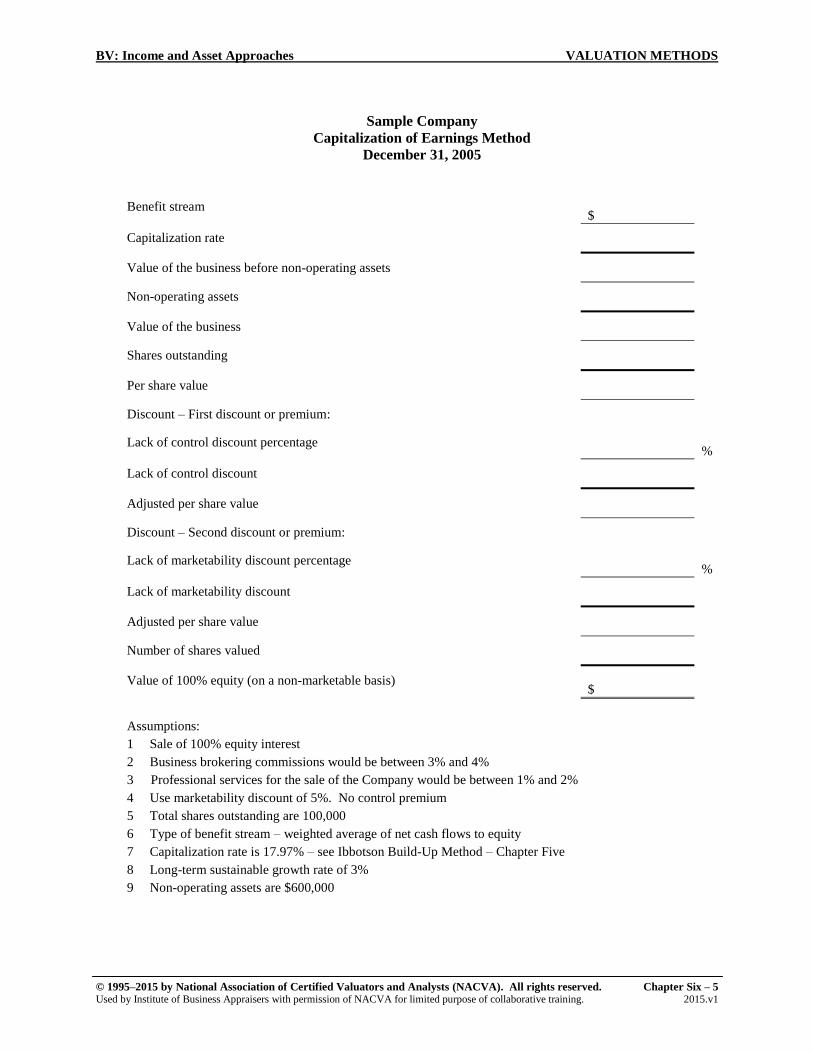
Sample Company
Capitalization of Earnings Method
December 31, 2005
Benefit stream
$
Capitalization rate
Value of the business before non-operating assets
Non-operating assets
Value of the business
Shares outstanding
Per share value
Discount – First discount or premium:
Lack of control discount percentage
%
Lack of control discount
Adjusted per share value
Discount – Second discount or premium:
Lack of marketability discount percentage
%
Lack of marketability discount
Adjusted per share value
Number of shares valued
Value of 100% equity (on a non-marketable basis)
$
Assumptions:
1 Sale of 100% equity interest
2 Business brokering commissions would be between 3% and 4%
3 Professional services for the sale of the Company would be between 1% and 2%
4 Use marketability discount of 5%. No control premium
5 Total shares outstanding are 100,000
6 Type of benefit stream – weighted average of net cash flows to equity
7 Capitalization rate is 17.97% – see Ibbotson Build-Up Method – Chapter Five
8 Long-term sustainable growth rate of 3%
9 Non-operating assets are $600,000
VALUATION METHODS BV: Income and Asset Approaches
6 – Chapter Six © 1995–2015 by National Association of Certified Valuators and Analysts (NACVA). All rights reserved. 2015.v1 Used by Institute of Business Appraisers with permission of NACVA for limited purpose of collaborative training.
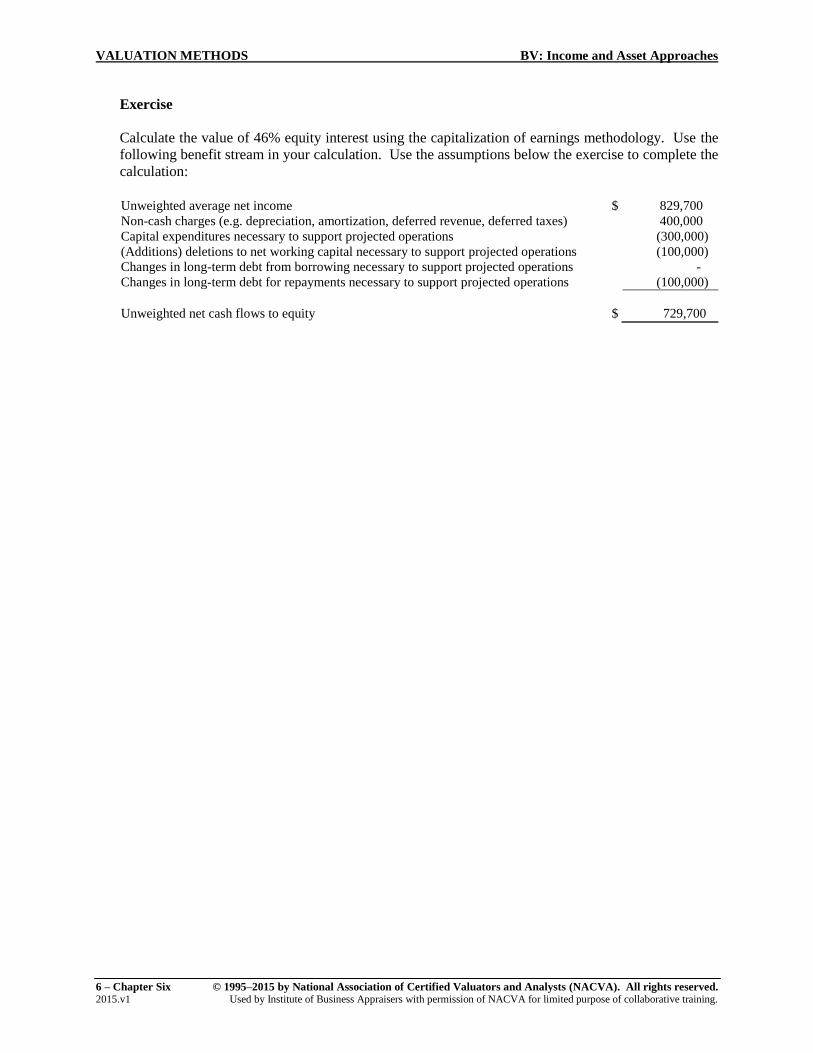
Exercise
Calculate the value of 46% equity interest using the capitalization of earnings methodology. Use the
following benefit stream in your calculation. Use the assumptions below the exercise to complete the
calculation:
Unweighted average net income $ 829,700
Non-cash charges (e.g. depreciation, amortization, deferred revenue, deferred taxes) 400,000
Capital expenditures necessary to support projected operations (300,000)
(Additions) deletions to net working capital necessary to support projected operations (100,000)
Changes in long-term debt from borrowing necessary to support projected operations -
Changes in long-term debt for repayments necessary to support projected operations (100,000)
Unweighted net cash flows to equity $ 729,700
BV: Income and Asset Approaches VALUATION METHODS
© 1995–2015 by National Association of Certified Valuators and Analysts (NACVA). All rights reserved. Chapter Six – 7 Used by Institute of Business Appraisers with permission of NACVA for limited purpose of collaborative training. 2015.v1
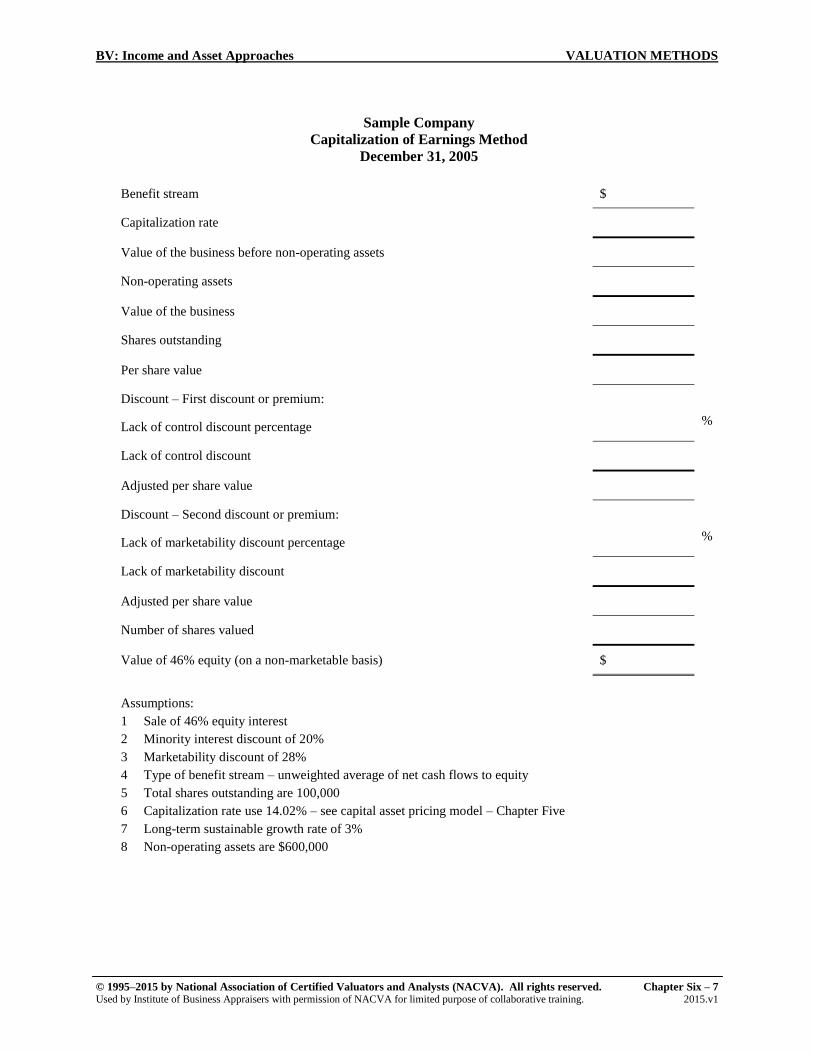
Sample Company
Capitalization of Earnings Method
December 31, 2005
Benefit stream $
Capitalization rate
Value of the business before non-operating assets
Non-operating assets
Value of the business
Shares outstanding
Per share value
Discount – First discount or premium:
Lack of control discount percentage %
Lack of control discount
Adjusted per share value
Discount – Second discount or premium:
Lack of marketability discount percentage %
Lack of marketability discount
Adjusted per share value
Number of shares valued
Value of 46% equity (on a non-marketable basis) $
Assumptions:
1 Sale of 46% equity interest
2 Minority interest discount of 20%
3 Marketability discount of 28%
4 Type of benefit stream – unweighted average of net cash flows to equity
5 Total shares outstanding are 100,000
6 Capitalization rate use 14.02% – see capital asset pricing model – Chapter Five
7 Long-term sustainable growth rate of 3%
8 Non-operating assets are $600,000
VALUATION METHODS BV: Income and Asset Approaches
8 – Chapter Six © 1995–2015 by National Association of Certified Valuators and Analysts (NACVA). All rights reserved. 2015.v1 Used by Institute of Business Appraisers with permission of NACVA for limited purpose of collaborative training.
III. DISCOUNTED EARNINGS METHOD
The Discounted Earnings Method is sometimes referred to as the Discounted Cash Flow Method2,
which suggests the only type of earnings to be valued, using this method, would be some definition
of cash flow, such as operating cash flow, after-tax cash flow, or discretionary cash flow. The
Discounted Earnings Method is more general in its definition as to the earnings that can be used.
The Discounted Earnings Method allows several possible definitions of earnings. It does not limit
the definition of earnings only to cash flows. The Discounted Earnings Method is an income-
oriented approach. It is based on the theory that the business’s total value is the present value of its
projected future earnings plus the present value of the terminal value. This method requires a
terminal value assumption be made. The amounts of projected earnings and the terminal value are
discounted to the present using an appropriate discount rate rather than a capitalization rate.
A. DESCRIPTION
The Discounted Earnings Method of valuing a closely held business utilizes the following four
steps:
1. Determine the estimated future earnings of the business. In this example, we have
projected for five years and have assumed no growth beyond this period.
2. A terminal, or residual value, is often determined at the end of the fifth year. The often
used terminal value is the fifth-year earnings projected into perpetuity.
3. The determined discount rate incorporates an appropriate safe rate of return, adjusted to
reflect the perceived level of risk for the business being valued.
4. The estimated future earnings and the terminal value are discounted to the present using the
discount rate determined in Step 3 and summed. The resulting figure is the total value of
the business using this method.
2 BVM Pro provides this income method. BVM Pro is available from NACVA (800-677-2009) and ValuSource (800-825-8763).
BV: Income and Asset Approaches VALUATION METHODS
© 1995–2015 by National Association of Certified Valuators and Analysts (NACVA). All rights reserved. Chapter Six – 9 Used by Institute of Business Appraisers with permission of NACVA for limited purpose of collaborative training. 2015.v1
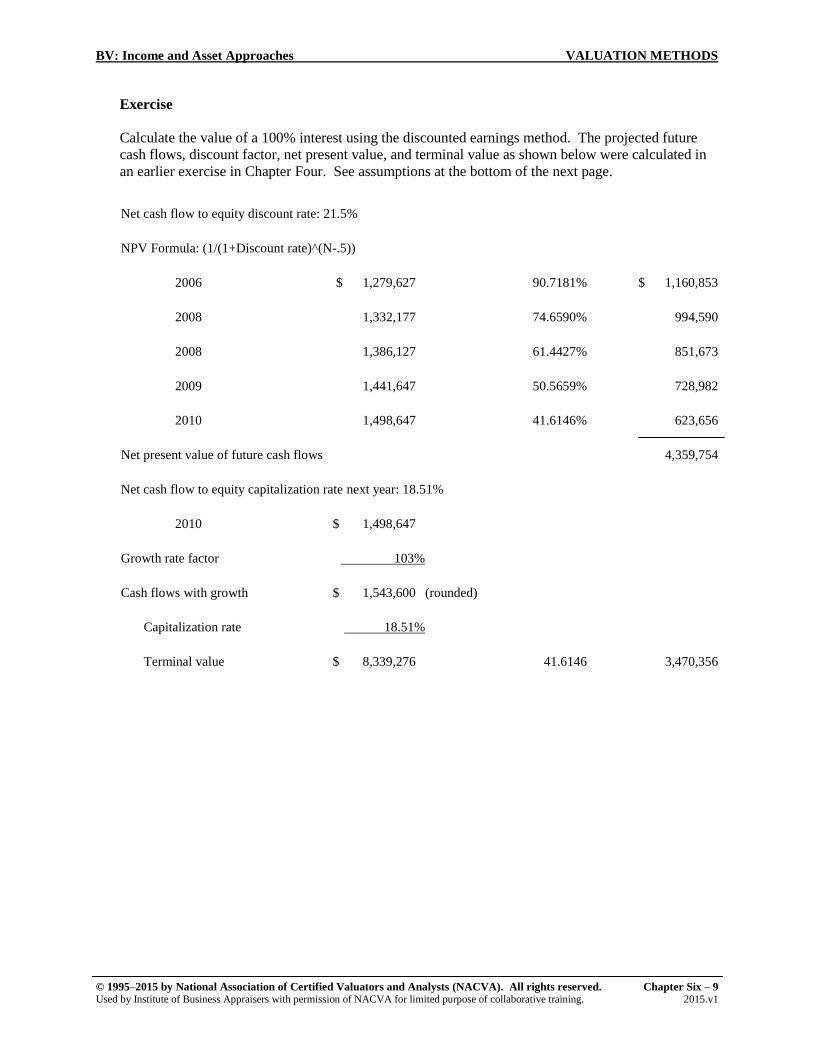
Exercise
Calculate the value of a 100% interest using the discounted earnings method. The projected future
cash flows, discount factor, net present value, and terminal value as shown below were calculated in
an earlier exercise in Chapter Four. See assumptions at the bottom of the next page.
Net cash flow to equity discount rate: 21.5%
NPV Formula: (1/(1+Discount rate)^(N-.5))
2006 $ 1,279,627 90.7181% $ 1,160,853
2008 1,332,177 74.6590% 994,590
2008 1,386,127 61.4427% 851,673
2009 1,441,647 50.5659% 728,982
2010 1,498,647 41.6146% 623,656
Net present value of future cash flows 4,359,754
Net cash flow to equity capitalization rate next year: 18.51%
2010 $ 1,498,647
Growth rate factor 103%
Cash flows with growth $ 1,543,600 (rounded)
Capitalization rate 18.51%
Terminal value $ 8,339,276 41.6146 3,470,356
VALUATION METHODS BV: Income and Asset Approaches
10 – Chapter Six © 1995–2015 by National Association of Certified Valuators and Analysts (NACVA). All rights reserved. 2015.v1 Used by Institute of Business Appraisers with permission of NACVA for limited purpose of collaborative training.
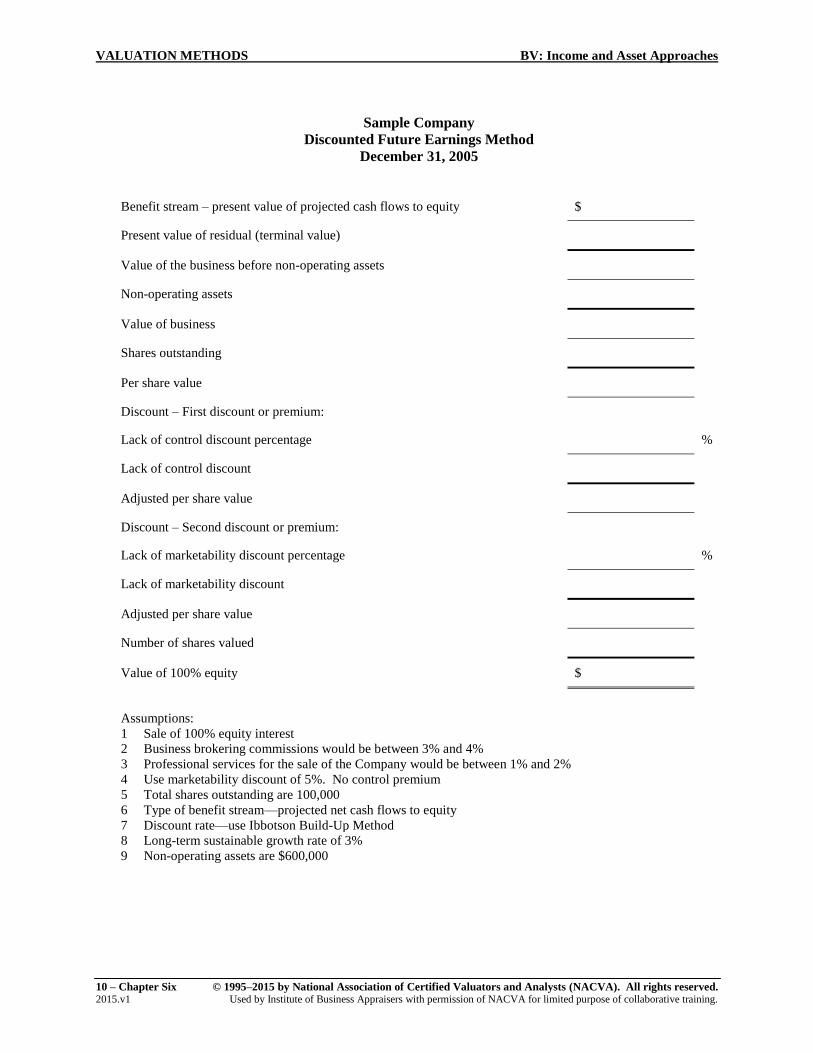
Sample Company
Discounted Future Earnings Method
December 31, 2005
Benefit stream – present value of projected cash flows to equity $
Present value of residual (terminal value)
Value of the business before non-operating assets
Non-operating assets
Value of business
Shares outstanding
Per share value
Discount – First discount or premium:
Lack of control discount percentage %
Lack of control discount
Adjusted per share value
Discount – Second discount or premium:
Lack of marketability discount percentage %
Lack of marketability discount
Adjusted per share value
Number of shares valued
Value of 100% equity $
Assumptions:
1 Sale of 100% equity interest
2 Business brokering commissions would be between 3% and 4%
3 Professional services for the sale of the Company would be between 1% and 2%
4 Use marketability discount of 5%. No control premium
5 Total shares outstanding are 100,000
6 Type of benefit stream—projected net cash flows to equity
7 Discount rate—use Ibbotson Build-Up Method
8 Long-term sustainable growth rate of 3%
9 Non-operating assets are $600,000
BV: Income and Asset Approaches VALUATION METHODS
© 1995–2015 by National Association of Certified Valuators and Analysts (NACVA). All rights reserved. Chapter Six – 11 Used by Institute of Business Appraisers with permission of NACVA for limited purpose of collaborative training. 2015.v1
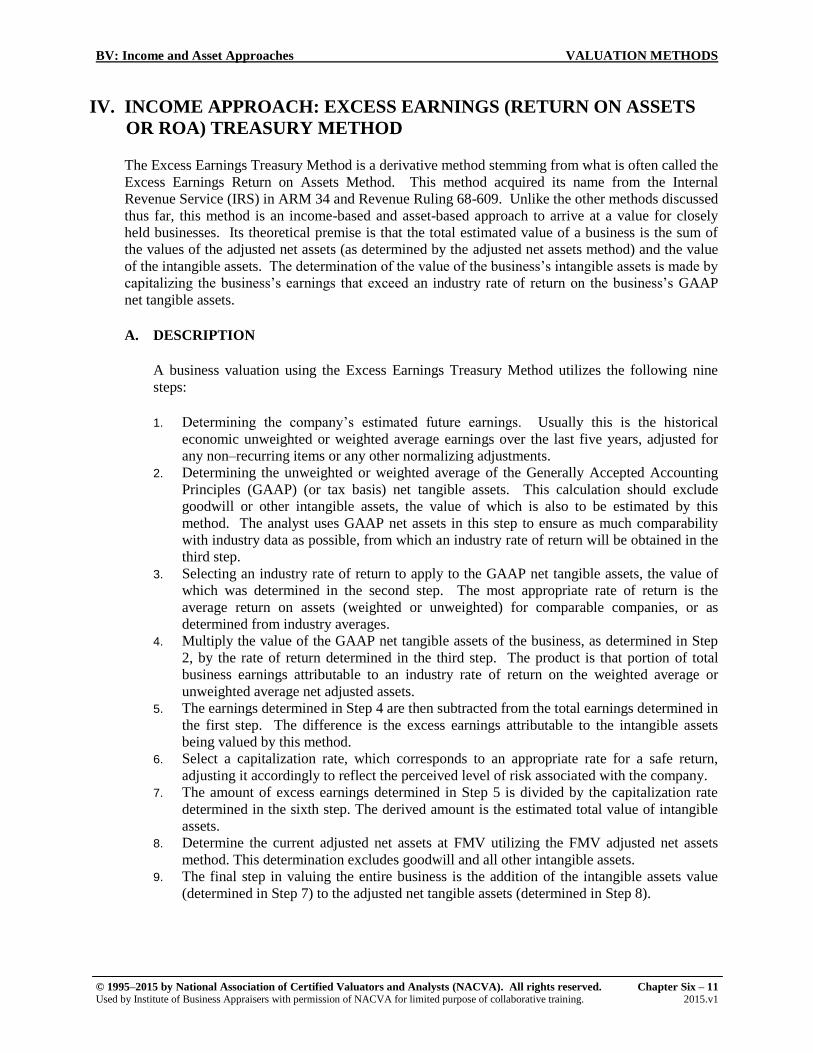
IV. INCOME APPROACH: EXCESS EARNINGS (RETURN ON ASSETS
OR ROA) TREASURY METHOD
The Excess Earnings Treasury Method is a derivative method stemming from what is often called the
Excess Earnings Return on Assets Method. This method acquired its name from the Internal
Revenue Service (IRS) in ARM 34 and Revenue Ruling 68-609. Unlike the other methods discussed
thus far, this method is an income-based and asset-based approach to arrive at a value for closely
held businesses. Its theoretical premise is that the total estimated value of a business is the sum of
the values of the adjusted net assets (as determined by the adjusted net assets method) and the value
of the intangible assets. The determination of the value of the business’s intangible assets is made by
capitalizing the business’s earnings that exceed an industry rate of return on the business’s GAAP
net tangible assets.
A. DESCRIPTION
A business valuation using the Excess Earnings Treasury Method utilizes the following nine
steps:
1. Determining the company’s estimated future earnings. Usually this is the historical
economic unweighted or weighted average earnings over the last five years, adjusted for
any non–recurring items or any other normalizing adjustments.
2. Determining the unweighted or weighted average of the Generally Accepted Accounting
Principles (GAAP) (or tax basis) net tangible assets. This calculation should exclude
goodwill or other intangible assets, the value of which is also to be estimated by this
method. The analyst uses GAAP net assets in this step to ensure as much comparability
with industry data as possible, from which an industry rate of return will be obtained in the
third step.
3. Selecting an industry rate of return to apply to the GAAP net tangible assets, the value of
which was determined in the second step. The most appropriate rate of return is the
average return on assets (weighted or unweighted) for comparable companies, or as
determined from industry averages.
4. Multiply the value of the GAAP net tangible assets of the business, as determined in Step
2, by the rate of return determined in the third step. The product is that portion of total
business earnings attributable to an industry rate of return on the weighted average or
unweighted average net adjusted assets.
5. The earnings determined in Step 4 are then subtracted from the total earnings determined in
the first step. The difference is the excess earnings attributable to the intangible assets
being valued by this method.
6. Select a capitalization rate, which corresponds to an appropriate rate for a safe return,
adjusting it accordingly to reflect the perceived level of risk associated with the company.
7. The amount of excess earnings determined in Step 5 is divided by the capitalization rate
determined in the sixth step. The derived amount is the estimated total value of intangible
assets.
8. Determine the current adjusted net assets at FMV utilizing the FMV adjusted net assets
method. This determination excludes goodwill and all other intangible assets.
9. The final step in valuing the entire business is the addition of the intangible assets value
(determined in Step 7) to the adjusted net tangible assets (determined in Step 8).
VALUATION METHODS BV: Income and Asset Approaches
12 – Chapter Six © 1995–2015 by National Association of Certified Valuators and Analysts (NACVA). All rights reserved. 2015.v1 Used by Institute of Business Appraisers with permission of NACVA for limited purpose of collaborative training.
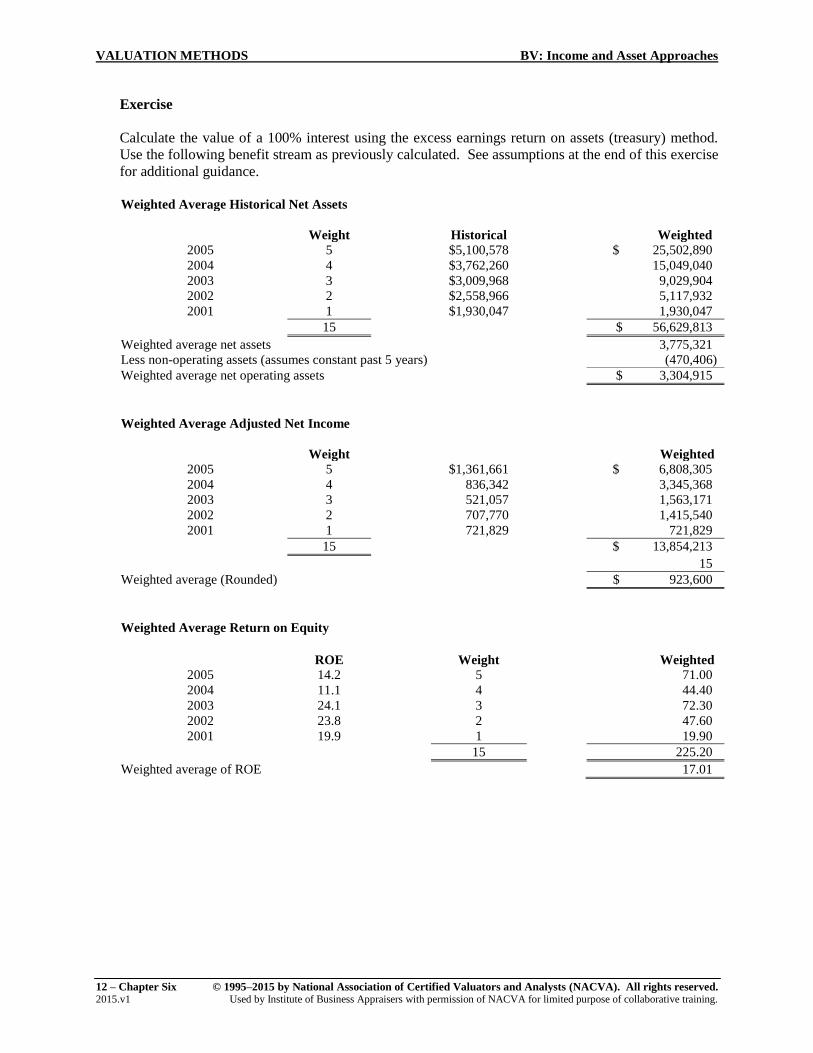
Exercise
Calculate the value of a 100% interest using the excess earnings return on assets (treasury) method.
Use the following benefit stream as previously calculated. See assumptions at the end of this exercise
for additional guidance.
Weighted Average Historical Net Assets
Weight Historical Weighted
2005 5 $5,100,578 $ 25,502,890
2004 4 $3,762,260 15,049,040
2003 3 $3,009,968 9,029,904
2002 2 $2,558,966 5,117,932
2001 1 $1,930,047 1,930,047
15 $ 56,629,813
Weighted average net assets 3,775,321
Less non-operating assets (assumes constant past 5 years) (470,406)
Weighted average net operating assets $ 3,304,915
Weighted Average Adjusted Net Income
Weight Weighted
2005 5 $1,361,661 $ 6,808,305
2004 4 836,342 3,345,368
2003 3 521,057 1,563,171
2002 2 707,770 1,415,540
2001 1 721,829 721,829
15 $ 13,854,213
15
Weighted average (Rounded) $ 923,600
Weighted Average Return on Equity
ROE Weight Weighted
2005 14.2 5 71.00
2004 11.1 4 44.40
2003 24.1 3 72.30
2002 23.8 2 47.60
2001 19.9 1 19.90
15 225.20
Weighted average of ROE 17.01
BV: Income and Asset Approaches VALUATION METHODS
© 1995–2015 by National Association of Certified Valuators and Analysts (NACVA). All rights reserved. Chapter Six – 13 Used by Institute of Business Appraisers with permission of NACVA for limited purpose of collaborative training. 2015.v1
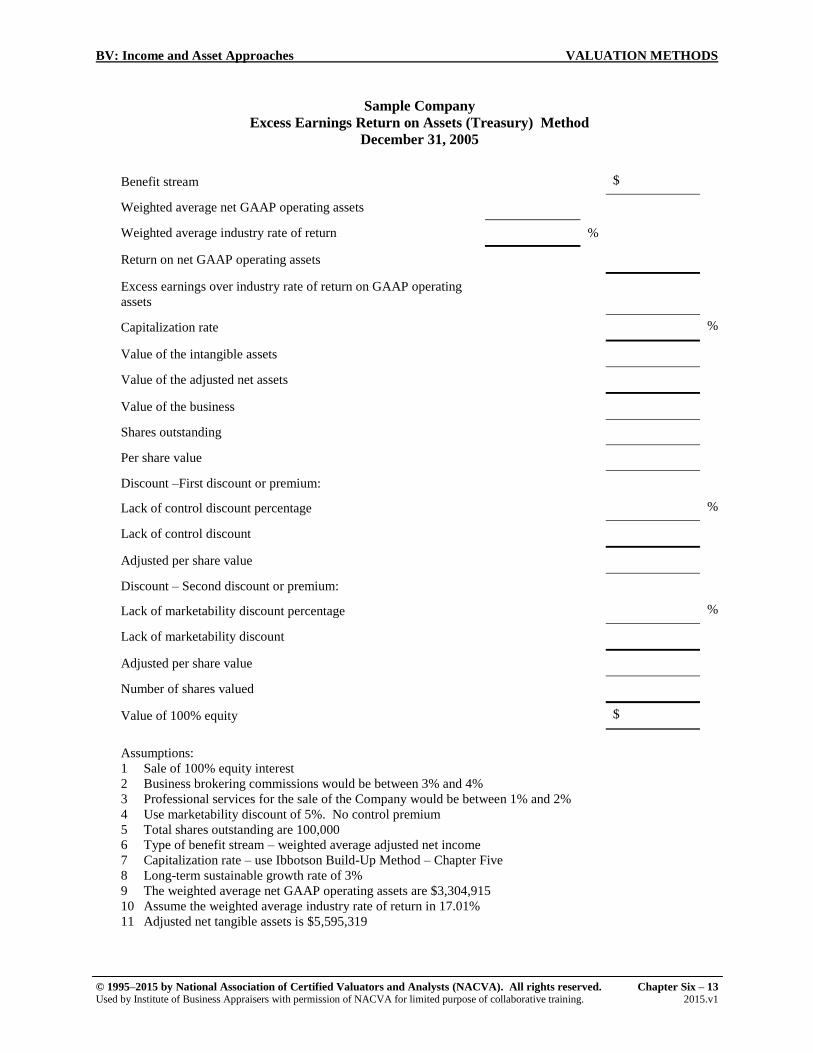
Sample Company
Excess Earnings Return on Assets (Treasury) Method
December 31, 2005
Benefit stream $
Weighted average net GAAP operating assets
Weighted average industry rate of return %
Return on net GAAP operating assets
Excess earnings over industry rate of return on GAAP operating
assets
Capitalization rate %
Value of the intangible assets
Value of the adjusted net assets
Value of the business
Shares outstanding
Per share value
Discount –First discount or premium:
Lack of control discount percentage %
Lack of control discount
Adjusted per share value
Discount – Second discount or premium:
Lack of marketability discount percentage %
Lack of marketability discount
Adjusted per share value
Number of shares valued
Value of 100% equity $
Assumptions:
1 Sale of 100% equity interest
2 Business brokering commissions would be between 3% and 4%
3 Professional services for the sale of the Company would be between 1% and 2%
4 Use marketability discount of 5%. No control premium
5 Total shares outstanding are 100,000
6 Type of benefit stream – weighted average adjusted net income
7 Capitalization rate – use Ibbotson Build-Up Method – Chapter Five
8 Long-term sustainable growth rate of 3%
9 The weighted average net GAAP operating assets are $3,304,915
10 Assume the weighted average industry rate of return in 17.01%
11 Adjusted net tangible assets is $5,595,319
VALUATION METHODS BV: Income and Asset Approaches
14 – Chapter Six © 1995–2015 by National Association of Certified Valuators and Analysts (NACVA). All rights reserved. 2015.v1 Used by Institute of Business Appraisers with permission of NACVA for limited purpose of collaborative training.
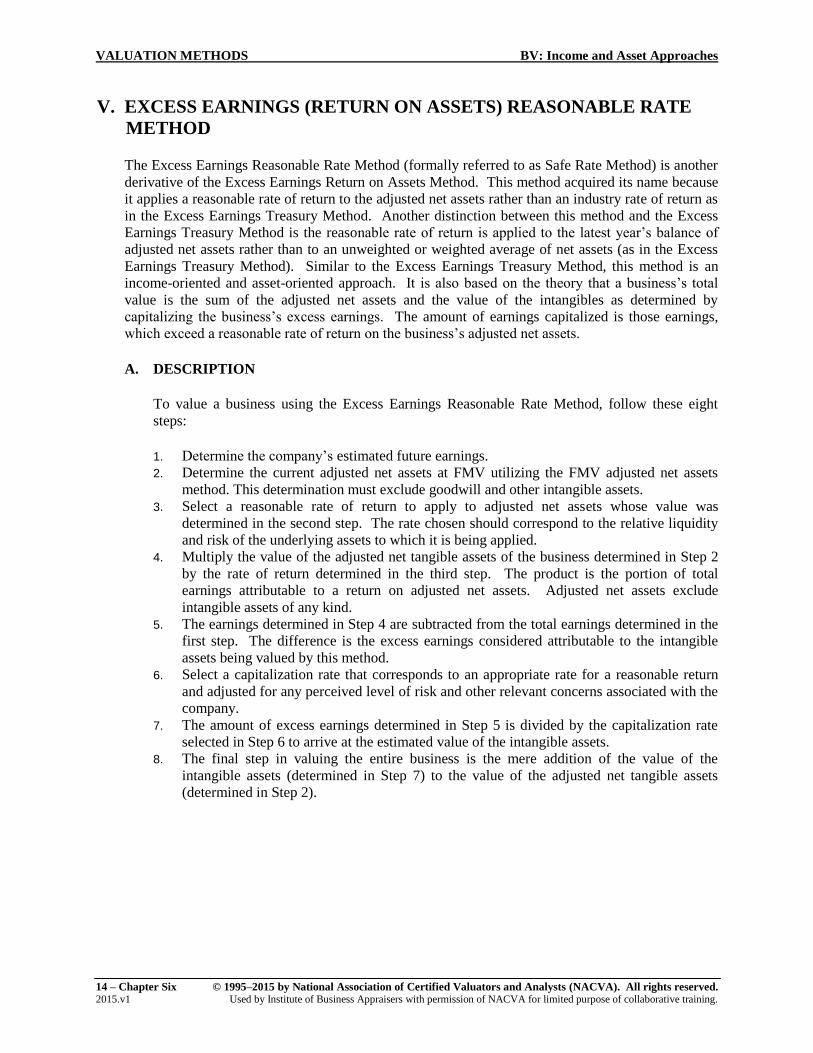
V. EXCESS EARNINGS (RETURN ON ASSETS) REASONABLE RATE
METHOD
The Excess Earnings Reasonable Rate Method (formally referred to as Safe Rate Method) is another
derivative of the Excess Earnings Return on Assets Method. This method acquired its name because
it applies a reasonable rate of return to the adjusted net assets rather than an industry rate of return as
in the Excess Earnings Treasury Method. Another distinction between this method and the Excess
Earnings Treasury Method is the reasonable rate of return is applied to the latest year’s balance of
adjusted net assets rather than to an unweighted or weighted average of net assets (as in the Excess
Earnings Treasury Method). Similar to the Excess Earnings Treasury Method, this method is an
income-oriented and asset-oriented approach. It is also based on the theory that a business’s total
value is the sum of the adjusted net assets and the value of the intangibles as determined by
capitalizing the business’s excess earnings. The amount of earnings capitalized is those earnings,
which exceed a reasonable rate of return on the business’s adjusted net assets.
A. DESCRIPTION
To value a business using the Excess Earnings Reasonable Rate Method, follow these eight
steps:
1. Determine the company’s estimated future earnings.
2. Determine the current adjusted net assets at FMV utilizing the FMV adjusted net assets
method. This determination must exclude goodwill and other intangible assets.
3. Select a reasonable rate of return to apply to adjusted net assets whose value was
determined in the second step. The rate chosen should correspond to the relative liquidity
and risk of the underlying assets to which it is being applied.
4. Multiply the value of the adjusted net tangible assets of the business determined in Step 2
by the rate of return determined in the third step. The product is the portion of total
earnings attributable to a return on adjusted net assets. Adjusted net assets exclude
intangible assets of any kind.
5. The earnings determined in Step 4 are subtracted from the total earnings determined in the
first step. The difference is the excess earnings considered attributable to the intangible
assets being valued by this method.
6. Select a capitalization rate that corresponds to an appropriate rate for a reasonable return
and adjusted for any perceived level of risk and other relevant concerns associated with the
company.
7. The amount of excess earnings determined in Step 5 is divided by the capitalization rate
selected in Step 6 to arrive at the estimated value of the intangible assets.
8. The final step in valuing the entire business is the mere addition of the value of the
intangible assets (determined in Step 7) to the value of the adjusted net tangible assets
(determined in Step 2).
BV: Income and Asset Approaches VALUATION METHODS
© 1995–2015 by National Association of Certified Valuators and Analysts (NACVA). All rights reserved. Chapter Six – 15 Used by Institute of Business Appraisers with permission of NACVA for limited purpose of collaborative training. 2015.v1
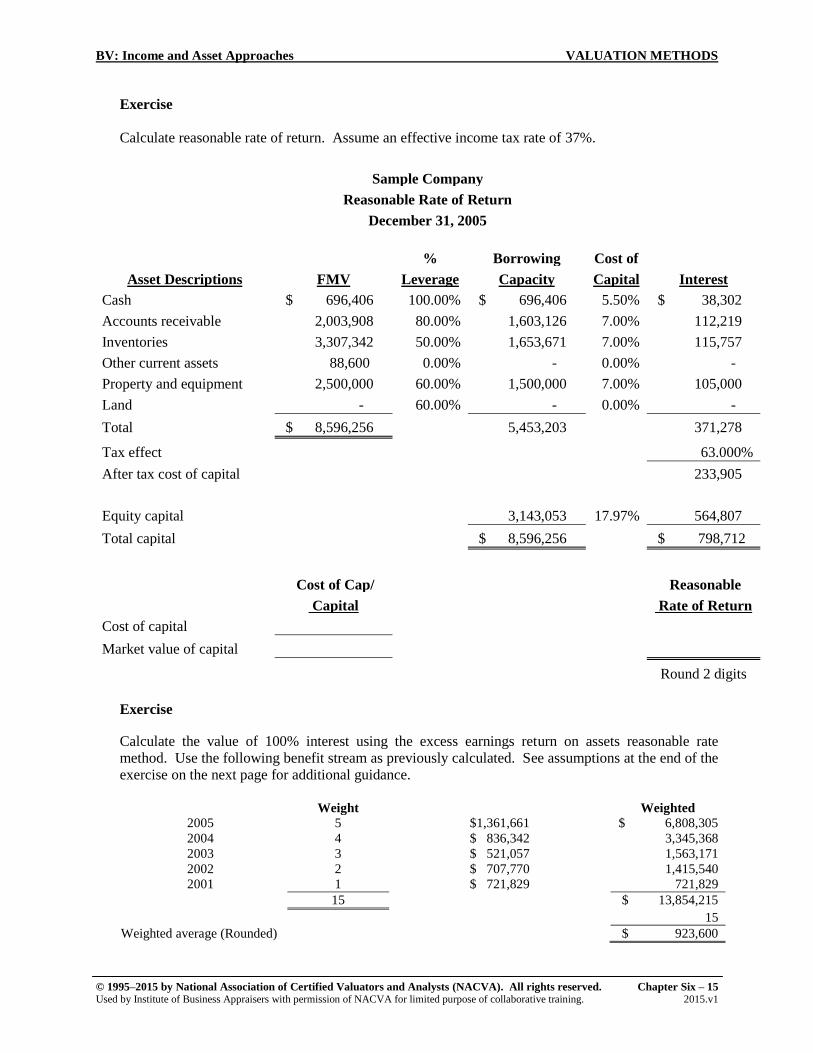
Exercise
Calculate reasonable rate of return. Assume an effective income tax rate of 37%.
Sample Company
Reasonable Rate of Return
December 31, 2005
% Borrowing Cost of
Asset Descriptions FMV Leverage Capacity Capital Interest
Cash $ 696,406 100.00% $ 696,406 5.50% $ 38,302
Accounts receivable 2,003,908 80.00% 1,603,126 7.00% 112,219
Inventories 3,307,342 50.00% 1,653,671 7.00% 115,757
Other current assets 88,600 0.00% - 0.00% -
Property and equipment 2,500,000 60.00% 1,500,000 7.00% 105,000
Land - 60.00% - 0.00% -
Total $ 8,596,256 5,453,203 371,278
Tax effect 63.000%
After tax cost of capital 233,905
Equity capital 3,143,053 17.97% 564,807
Total capital $ 8,596,256 $ 798,712
Cost of Cap/ Reasonable
Capital Rate of Return
Cost of capital
Market value of capital
Round 2 digits
Exercise
Calculate the value of 100% interest using the excess earnings return on assets reasonable rate
method. Use the following benefit stream as previously calculated. See assumptions at the end of the
exercise on the next page for additional guidance.
Weight Weighted
2005 5 $1,361,661 $ 6,808,305
2004 4 $ 836,342 3,345,368
2003 3 $ 521,057 1,563,171
2002 2 $ 707,770 1,415,540
2001 1 $ 721,829 721,829
15 $ 13,854,215
15
Weighted average (Rounded) $ 923,600
VALUATION METHODS BV: Income and Asset Approaches
16 – Chapter Six © 1995–2015 by National Association of Certified Valuators and Analysts (NACVA). All rights reserved. 2015.v1 Used by Institute of Business Appraisers with permission of NACVA for limited purpose of collaborative training.
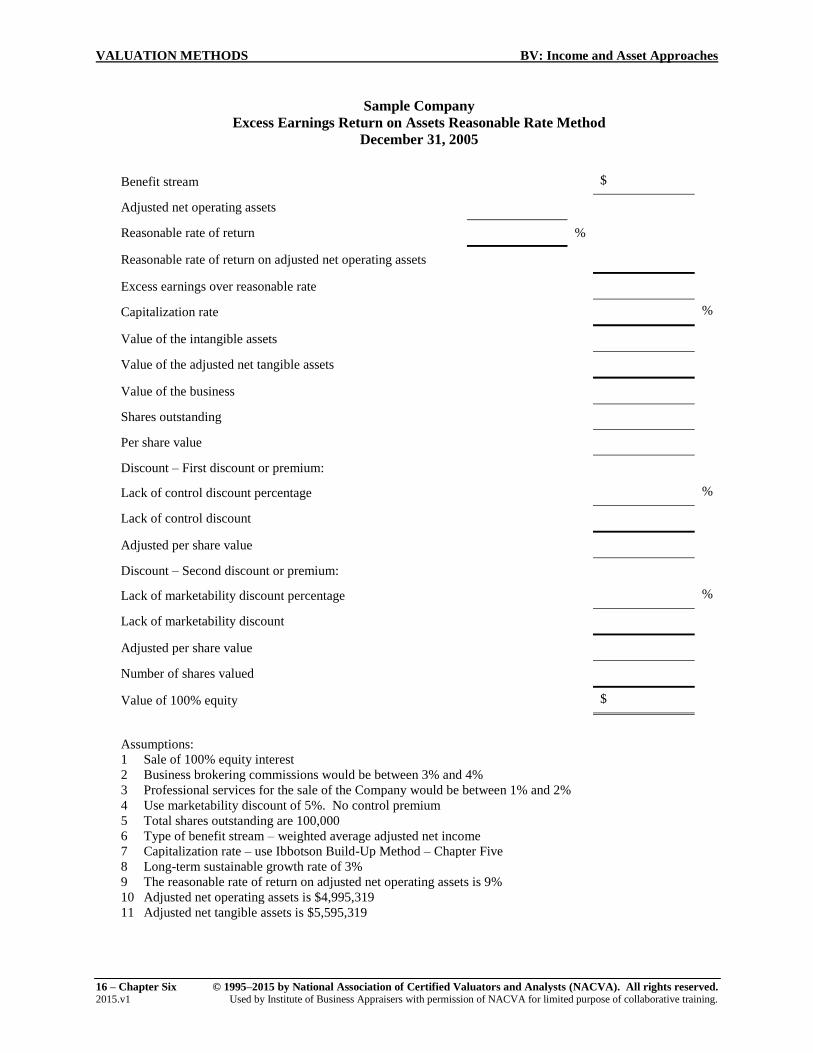
Sample Company
Excess Earnings Return on Assets Reasonable Rate Method
December 31, 2005
Benefit stream $
Adjusted net operating assets
Reasonable rate of return %
Reasonable rate of return on adjusted net operating assets
Excess earnings over reasonable rate
Capitalization rate %
Value of the intangible assets
Value of the adjusted net tangible assets
Value of the business
Shares outstanding
Per share value
Discount – First discount or premium:
Lack of control discount percentage %
Lack of control discount
Adjusted per share value
Discount – Second discount or premium:
Lack of marketability discount percentage %
Lack of marketability discount
Adjusted per share value
Number of shares valued
Value of 100% equity $
Assumptions:
1 Sale of 100% equity interest
2 Business brokering commissions would be between 3% and 4%
3 Professional services for the sale of the Company would be between 1% and 2%
4 Use marketability discount of 5%. No control premium
5 Total shares outstanding are 100,000
6 Type of benefit stream – weighted average adjusted net income
7 Capitalization rate – use Ibbotson Build-Up Method – Chapter Five
8 Long-term sustainable growth rate of 3%
9 The reasonable rate of return on adjusted net operating assets is 9%
10 Adjusted net operating assets is $4,995,319
11 Adjusted net tangible assets is $5,595,319
BV: Income and Asset Approaches VALUATION METHODS
© 1995–2015 by National Association of Certified Valuators and Analysts (NACVA). All rights reserved. Chapter Six – 17 Used by Institute of Business Appraisers with permission of NACVA for limited purpose of collaborative training. 2015.v1
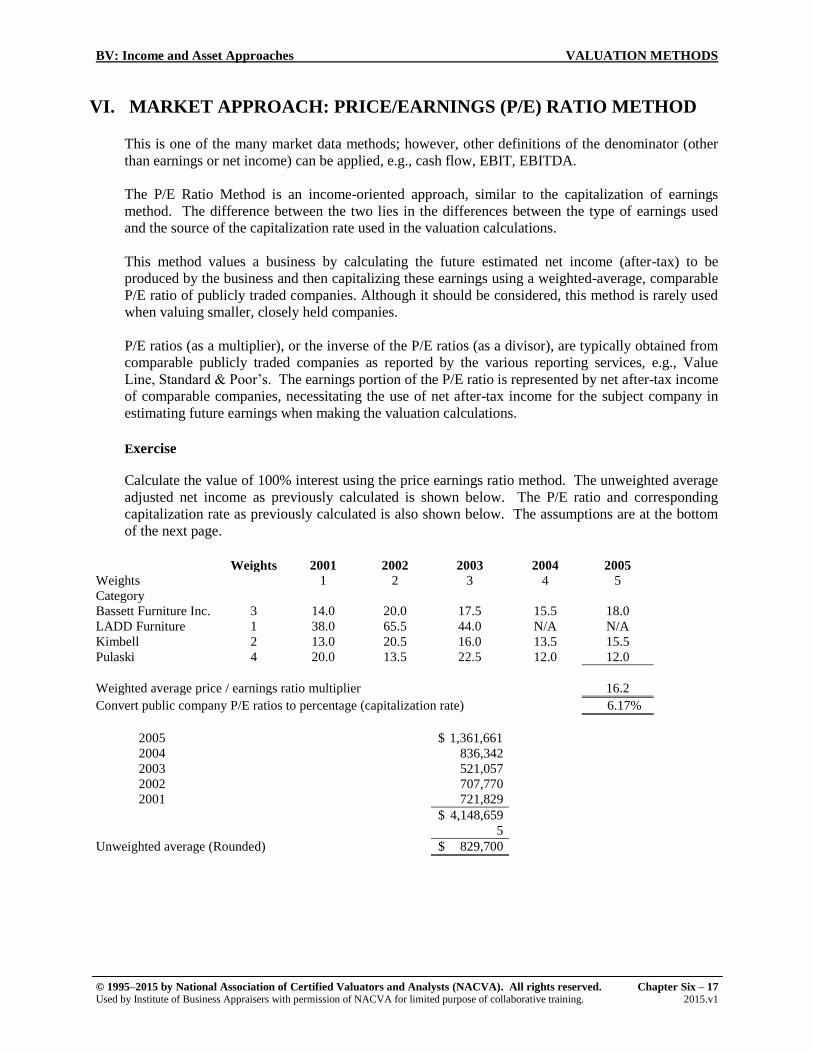
VI. MARKET APPROACH: PRICE/EARNINGS (P/E) RATIO METHOD
This is one of the many market data methods; however, other definitions of the denominator (other
than earnings or net income) can be applied, e.g., cash flow, EBIT, EBITDA.
The P/E Ratio Method is an income-oriented approach, similar to the capitalization of earnings
method. The difference between the two lies in the differences between the type of earnings used
and the source of the capitalization rate used in the valuation calculations.
This method values a business by calculating the future estimated net income (after-tax) to be
produced by the business and then capitalizing these earnings using a weighted-average, comparable
P/E ratio of publicly traded companies. Although it should be considered, this method is rarely used
when valuing smaller, closely held companies.
P/E ratios (as a multiplier), or the inverse of the P/E ratios (as a divisor), are typically obtained from
comparable publicly traded companies as reported by the various reporting services, e.g., Value
Line, Standard & Poor’s. The earnings portion of the P/E ratio is represented by net after-tax income
of comparable companies, necessitating the use of net after-tax income for the subject company in
estimating future earnings when making the valuation calculations.
Exercise
Calculate the value of 100% interest using the price earnings ratio method. The unweighted average
adjusted net income as previously calculated is shown below. The P/E ratio and corresponding
capitalization rate as previously calculated is also shown below. The assumptions are at the bottom
of the next page.
Weights 2001 2002 2003 2004 2005
Weights 1 2 3 4 5
Category
Bassett Furniture Inc. 3 14.0 20.0 17.5 15.5 18.0
LADD Furniture 1 38.0 65.5 44.0 N/A N/A
Kimbell 2 13.0 20.5 16.0 13.5 15.5
Pulaski 4 20.0 13.5 22.5 12.0 12.0
Weighted average price / earnings ratio multiplier 16.2
Convert public company P/E ratios to percentage (capitalization rate) 6.17%
2005 $ 1,361,661
2004 836,342
2003 521,057
2002 707,770
2001 721,829
$ 4,148,659
5
Unweighted average (Rounded) $ 829,700
VALUATION METHODS BV: Income and Asset Approaches
18 – Chapter Six © 1995–2015 by National Association of Certified Valuators and Analysts (NACVA). All rights reserved. 2015.v1 Used by Institute of Business Appraisers with permission of NACVA for limited purpose of collaborative training.
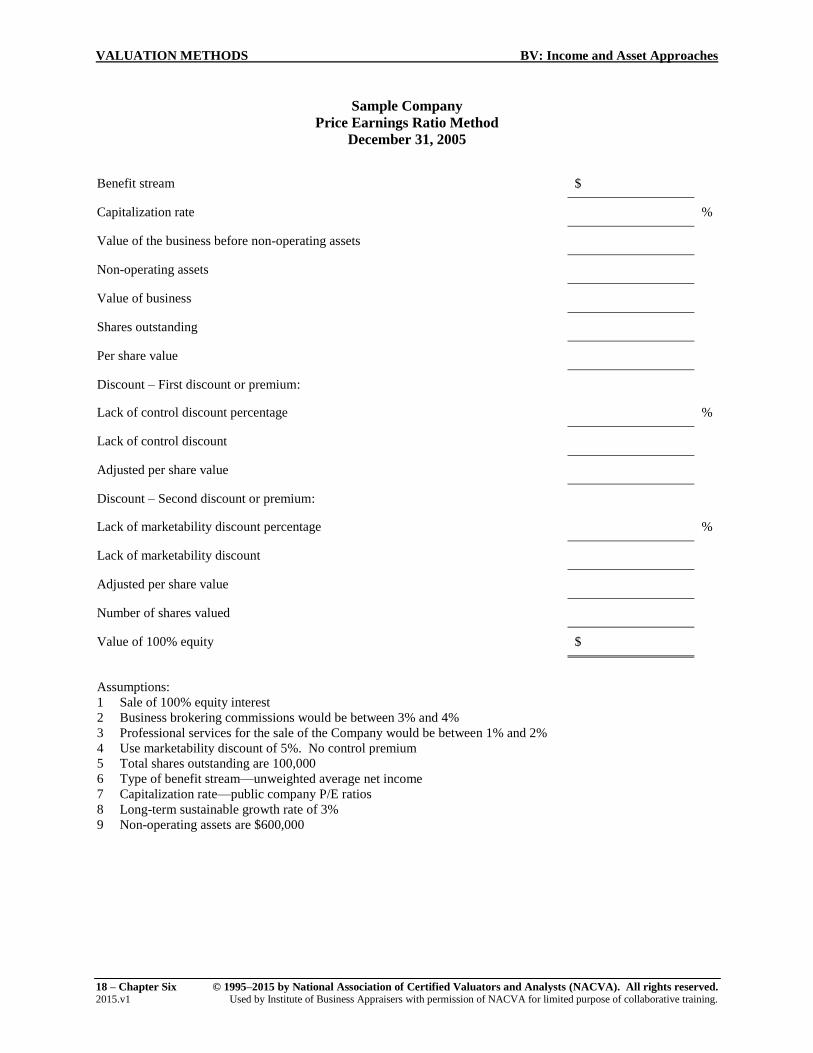
Sample Company
Price Earnings Ratio Method
December 31, 2005
Benefit stream $
Capitalization rate %
Value of the business before non-operating assets
Non-operating assets
Value of business
Shares outstanding
Per share value
Discount – First discount or premium:
Lack of control discount percentage %
Lack of control discount
Adjusted per share value
Discount – Second discount or premium:
Lack of marketability discount percentage %
Lack of marketability discount
Adjusted per share value
Number of shares valued
Value of 100% equity $
Assumptions:
1 Sale of 100% equity interest
2 Business brokering commissions would be between 3% and 4%
3 Professional services for the sale of the Company would be between 1% and 2%
4 Use marketability discount of 5%. No control premium
5 Total shares outstanding are 100,000
6 Type of benefit stream—unweighted average net income
7 Capitalization rate—public company P/E ratios
8 Long-term sustainable growth rate of 3%
9 Non-operating assets are $600,000
BV: Income and Asset Approaches VALUATION METHODS
© 1995–2015 by National Association of Certified Valuators and Analysts (NACVA). All rights reserved. Chapter Six – 19 Used by Institute of Business Appraisers with permission of NACVA for limited purpose of collaborative training. 2015.v1
VII. MARKET APPROACH: DIVIDEND PAYING CAPACITY METHOD
The Dividend Paying Capacity Method, sometimes referred to as the Dividend Payout Method, is
another income-oriented approach based on market data, similar to the Capitalization of Earnings
Method. The difference between this method and the Capitalization of Earnings Method lies in the
difference in the type of earnings used in the calculations and the source of the capitalization rate.
This valuation method is based on the future estimated dividends to be paid out or the capacity to
pay out. It capitalizes these dividends with a five-year weighted average of dividend yields of five
comparable companies. This method must be considered for estate and gift tax purposes per
Revenue Ruling 59-60.
A. DESCRIPTION
This method expresses a relationship among the following:
1. Estimated future amount of dividends to be paid out or the capacity to pay out
2. Weighted average comparable company dividend yields of comparable companies, further
weighted by degree of comparability each year utilizing a sufficient number of comparable
companies (generally more than three)
3. Estimated business value
This method is useful for estimating the value of businesses that are large and that have had a
history of paying dividends to shareholders. It is highly regarded because it utilizes market
comparisons.
Similar to the P/E Ratio Method, this method may not be appropriate for valuing most small
businesses because they do not have comparable counterparts in the publicly traded arena.
Another problem with this method is that most closely held businesses avoid paying dividends.
For tax reasons, compensation is usually the preferred method of disbursing funds.
In determining dividend-paying ability, liquidity is an important consideration. A relatively
profitable company may be illiquid as funds are needed for fixed assets and working capital.
VALUATION METHODS BV: Income and Asset Approaches
20 – Chapter Six © 1995–2015 by National Association of Certified Valuators and Analysts (NACVA). All rights reserved. 2015.v1 Used by Institute of Business Appraisers with permission of NACVA for limited purpose of collaborative training.
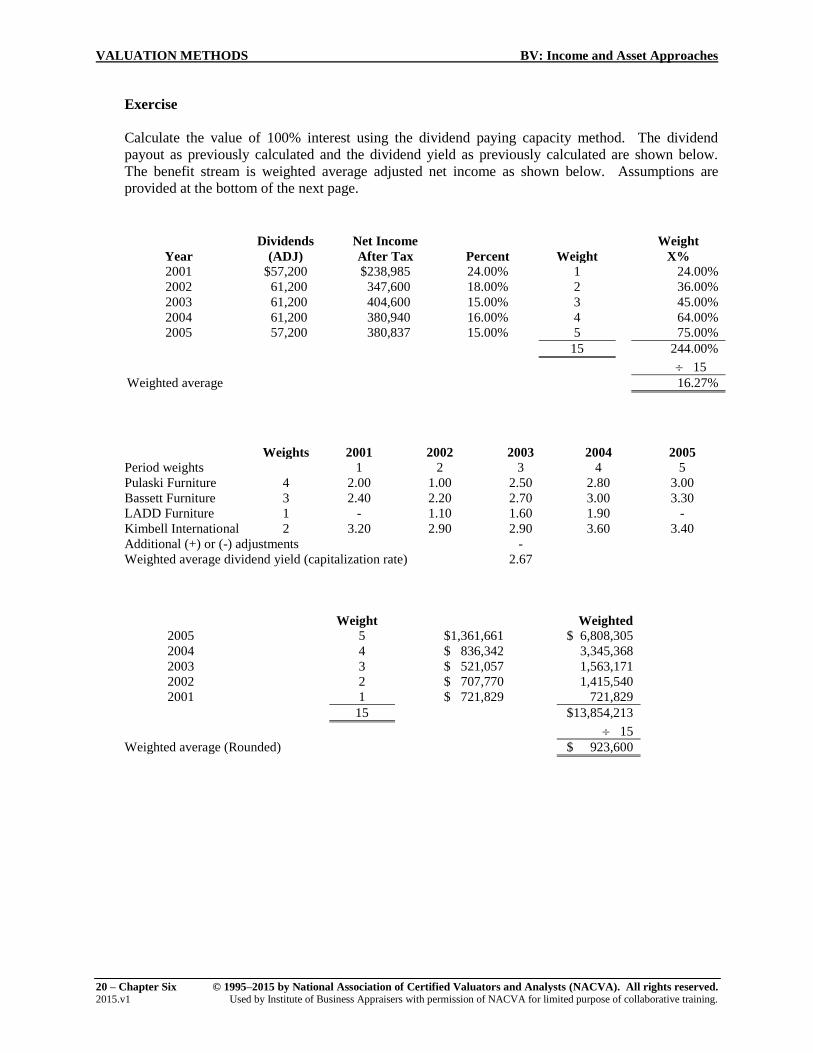
Exercise
Calculate the value of 100% interest using the dividend paying capacity method. The dividend
payout as previously calculated and the dividend yield as previously calculated are shown below.
The benefit stream is weighted average adjusted net income as shown below. Assumptions are
provided at the bottom of the next page.
Year
Dividends
(ADJ)
Net Income
After Tax
Percent
Weight
Weight
X%
2001 $57,200 $238,985 24.00% 1 24.00%
2002 61,200 347,600 18.00% 2 36.00%
2003 61,200 404,600 15.00% 3 45.00%
2004 61,200 380,940 16.00% 4 64.00%
2005 57,200 380,837 15.00% 5 75.00%
15 244.00%
15
Weighted average 16.27%
Weights 2001 2002 2003 2004 2005
Period weights 1 2 3 4 5
Pulaski Furniture 4 2.00 1.00 2.50 2.80 3.00
Bassett Furniture 3 2.40 2.20 2.70 3.00 3.30
LADD Furniture 1 - 1.10 1.60 1.90 -
Kimbell International 2 3.20 2.90 2.90 3.60 3.40
Additional (+) or (-) adjustments -
Weighted average dividend yield (capitalization rate) 2.67
Weight Weighted
2005 5 $1,361,661 $ 6,808,305
2004 4 $ 836,342 3,345,368
2003 3 $ 521,057 1,563,171
2002 2 $ 707,770 1,415,540
2001 1 $ 721,829 721,829
15 $13,854,213
15
Weighted average (Rounded) $ 923,600
BV: Income and Asset Approaches VALUATION METHODS
© 1995–2015 by National Association of Certified Valuators and Analysts (NACVA). All rights reserved. Chapter Six – 21 Used by Institute of Business Appraisers with permission of NACVA for limited purpose of collaborative training. 2015.v1
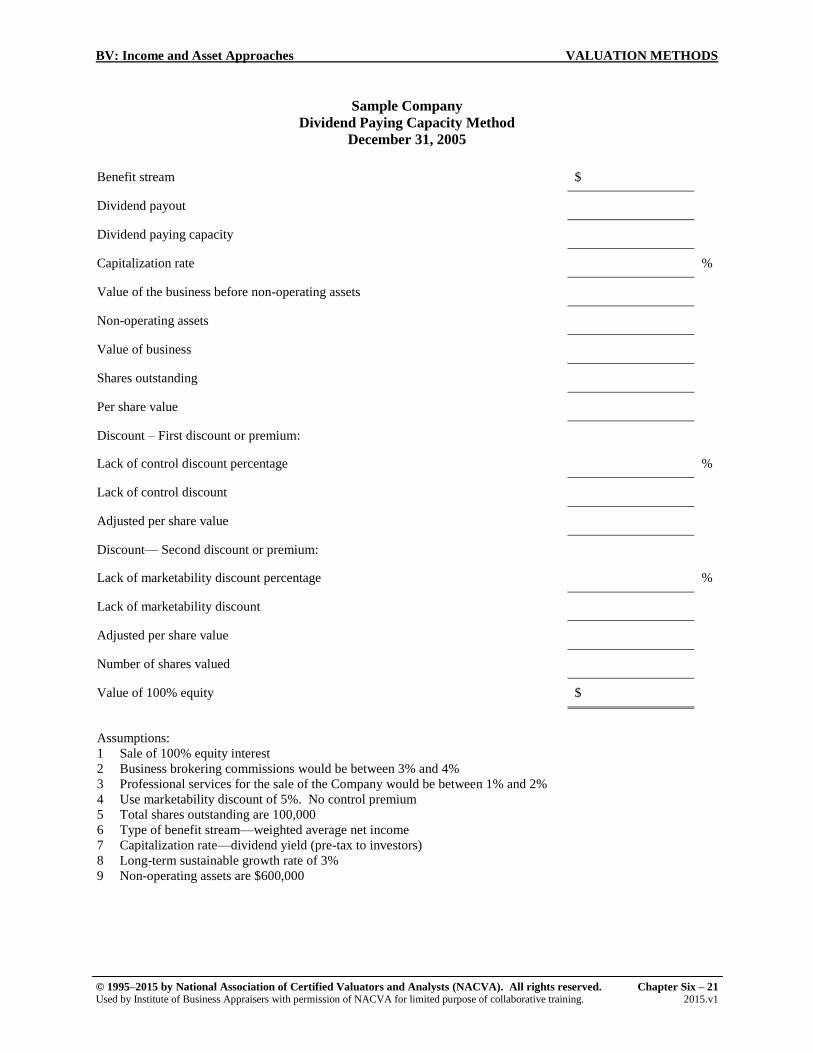
Sample Company
Dividend Paying Capacity Method
December 31, 2005
Benefit stream $
Dividend payout
Dividend paying capacity
Capitalization rate %
Value of the business before non-operating assets
Non-operating assets
Value of business
Shares outstanding
Per share value
Discount – First discount or premium:
Lack of control discount percentage %
Lack of control discount
Adjusted per share value
Discount— Second discount or premium:
Lack of marketability discount percentage %
Lack of marketability discount
Adjusted per share value
Number of shares valued
Value of 100% equity $
Assumptions:
1 Sale of 100% equity interest
2 Business brokering commissions would be between 3% and 4%
3 Professional services for the sale of the Company would be between 1% and 2%
4 Use marketability discount of 5%. No control premium
5 Total shares outstanding are 100,000
6 Type of benefit stream—weighted average net income
7 Capitalization rate—dividend yield (pre-tax to investors)
8 Long-term sustainable growth rate of 3%
9 Non-operating assets are $600,000
VALUATION METHODS BV: Income and Asset Approaches
22 – Chapter Six © 1995–2015 by National Association of Certified Valuators and Analysts (NACVA). All rights reserved. 2015.v1 Used by Institute of Business Appraisers with permission of NACVA for limited purpose of collaborative training.
VIII. TAX AFFECTING PASS-THROUGH ENTITIES
Four theories will be presented in the sections that follow: those of Chris D. Treharne, ASA, MCBA;
Daniel Van Vleet, ASA, CBA; Z. Christopher Mercer, ASA, CFA; and Roger J. Grabowski, ASA.
Each of these noncontrolling theories for valuing pass-through entities has gained recognition in the
valuation community. Each handles these issues somewhat differently, yet largely agree on key
issues. In addition, a “summary approach” that combines the key findings of the controlling interest
studies with the common themes of the minority theories can be found later in this chapter.
No matter which model the analyst uses, if any, the key is to think through the foundation for the
valuation model and carefully select the valuation inputs in order to reach a logical conclusion that a
buyer and seller would be likely to agree upon.
A. TREHARNE MODEL
Treharne’s model begins with the value of an equivalent C corporation after reinvestment of all
necessary cash flows. To this value determination, one makes adjustments to the equivalent C
corporation value depending on:
1. Distributions to the noncontrolling owner
2. Tax rate differentials
3. Basis build-up, if relevant
Using Treharne’s model, value distinctions are made for each level of distribution.
B. VAN VLEET MODEL
Van Vleet’s model begins with the economic benefits of a C corporation equity interest, fully
burdened with income tax at the corporate level, as well as dividend tax on distributions and
capital gains tax on retained earnings. That benefit is compared to the S corporation economic
benefit that bears only one layer of income tax. The mathematical formula that results from this
difference becomes the SEAM adjustment.
The SEAM assumes that shareholders of publicly traded companies are indifferent between
distributions and capital gains. This is generally true because both forms of investment return
are equally liquid to the public company shareholder. Therefore, the SEAM inherently assumes
that the subject S corporation is paying 100 percent of its earnings in distributions, as this is the
only way that an investment return on a privately held security can be completely liquid. Van
Vleet’s model recognizes that the level of distributions for the subject company can impact
value and recognizes it through the extent of the discount for lack of marketability.
C. MERCER MODEL
Mercer’s model begins with the value of identical C and S corporations at the marketable
minority level, which he determines to be of equivalent value, regardless of the level of
distributions. He calculates the S corporation premium or discount at the shareholder level by
reference to C corporation equivalent yields on distributions and employs the Quantitative
Marketability Discount Model (QMDM) to determine the values. Such analysis can lead to a
positive or negative value differential between the S and the C corporation, depending on the
facts and circumstances. The issues to consider include:
BV: Income and Asset Approaches VALUATION METHODS
© 1995–2015 by National Association of Certified Valuators and Analysts (NACVA). All rights reserved. Chapter Six – 23 Used by Institute of Business Appraisers with permission of NACVA for limited purpose of collaborative training. 2015.v1
1. The length of the holding period that the S shareholder may continue to enjoy the benefits
of the S election
2. The extent of the expected distributions
3. The risk of loss of benefits. Such loss may come about by changes in law, a disqualifying
event, a change in the distribution policy of the firm, or any number of reasons that cause
the S election benefits to diminish or cease.
Mercer estimates the differing relative values to retained earnings resulting from tax-sheltered
dividends and expected distribution policies.
D. GRABOWSKI MODEL
Grabowski’s modified traditional method begins with the value of a C corporation interest, fully
burdened with income tax at the corporate level, adding back the savings gained by virtue of
being an S corporation, and making adjustments for tax differentials on pass-through income.
The model recognizes that the distributions for the subject company can impact value. One may
either alter the net cash flow available to distribute by increasing retention for reinvestment in
the cash flows themselves or recognize the difference between available cash and distributions
through the minority interest and/or lack of marketability discounts.
The model assumes that a willing buyer of stock in an S corporation estimates his or her
expected holding period and takes into consideration the build-up of basis from retained net
income over distributed cash flow. And where circumstances dictate, the model considers the
effect of a possible asset or stock sale with 338(h)(10) election on a sale of the business in year
X.
IX. SUMMARY: NON-CONTROLLING INTEREST IN PASS-THROUGH
ENTITY THEORY
Four models for the valuation of noncontrolling interests in pass-through entities have been
presented. Each of these theories has foundation in the logical issues that a noncontrolling buyer and
seller would consider upon a transaction of their interest. However, to quote Daniel Van Vleet, none
of these models is a black box, into which data can be thrown and meaningful results can be
expected.
The analyst should carefully consider the inputs in order to get a meaningful valuation conclusion.
While each of the theories treats these issues somewhat differently, if the analyst is diligent in the
understanding and/or application of the model, carefully considering the inputs and output, he or she
should get a logical valuation conclusion.
VALUATION METHODS BV: Income and Asset Approaches
24 – Chapter Six © 1995–2015 by National Association of Certified Valuators and Analysts (NACVA). All rights reserved. 2015.v1 Used by Institute of Business Appraisers with permission of NACVA for limited purpose of collaborative training.
A review of the issues follows:
Amount and Timing of Distributions
Retained Net Income (Build-up Basis of Stock)
Holding Period
Tax Rates—Personal Versus Corporate and Capital Gains
Further Effect of Minority of Marketability Discounts
Possible Ability to Participate in Step-up-of-Basis Transaction