Embed Size (px)
Citation preview
1
I-93 Transit Investment Study
TECHNICAL ADVISORY COMMITTEE
June 12, 2008New Hampshire Department
of Transportation
Massachusetts Executive Office
of Transportation
2
Agenda
• Ridership • Key Findings• Action Steps
3
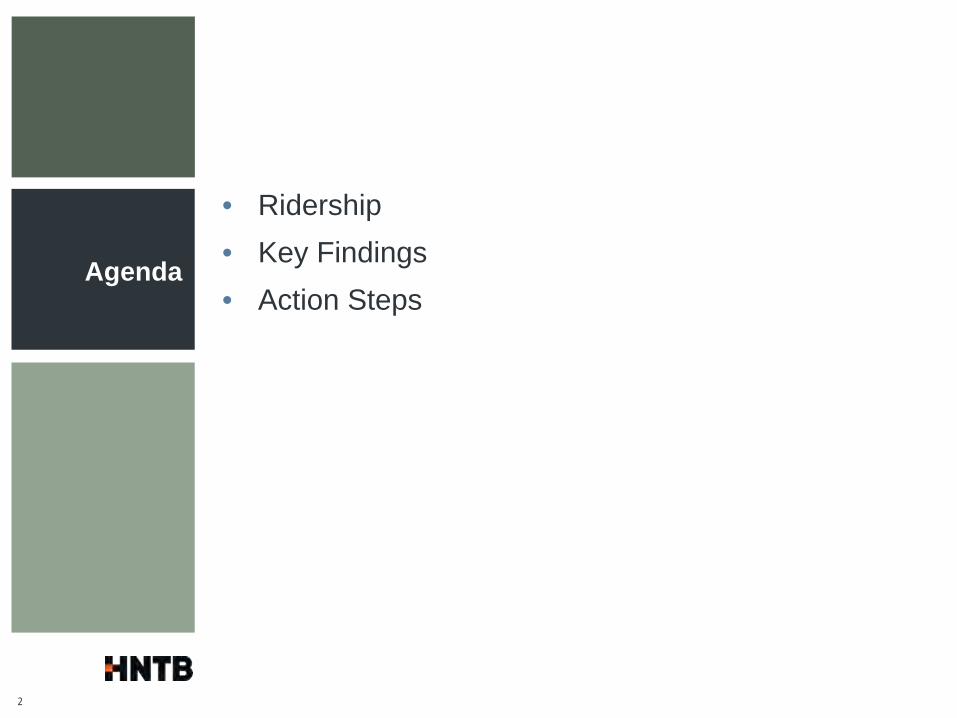
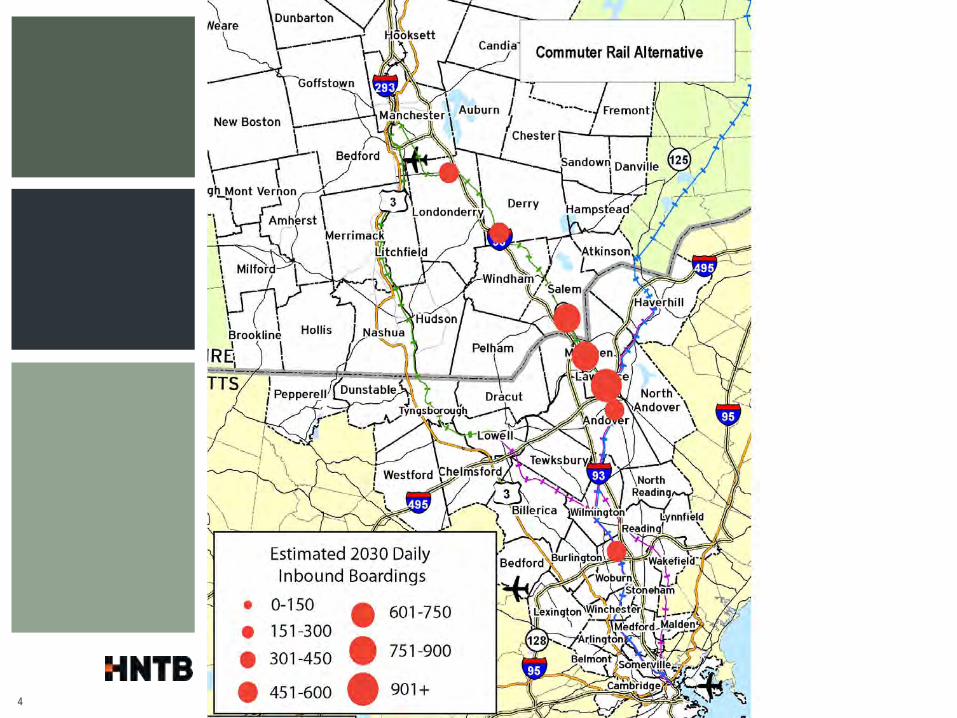
Estimated Average Daily Inbound Boardings (2030)
Alternative
New Hampshire Stations Massachusetts Stations
Total
Manchester
Exit 5/ Londonderry
Exit 4/ Derry
Exit 3/ Windham
Exit 2/ Salem
Methuen
Lawrence
Andover
Anderson / Woburn
Boston Alightings(%
)
Commuter Rail on M&L N/A1 475-525 485-540 N/A 830-910 760-840
1,310 –
1,450550- 610 460-500 94%
4,870 to 5,375
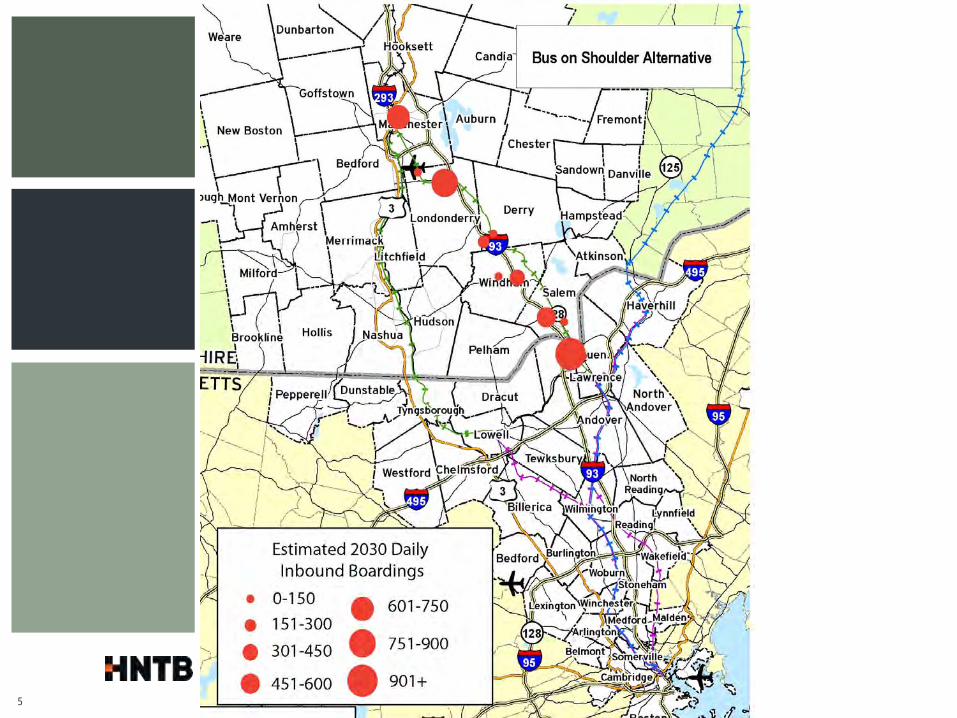
Bus On Shoulder2 650-725865-965 260-315 360-410 560-620 2,250-2,510
N/A N/A N/A 100%4,945 to 5,54555-
65810- 900
50- 55
210- 260
10- 20
350- 390 0 560-
620100 - 120 2,150-
2,390
No Build 380-420 530-590 120-140 120-140 530-590 N/A N/A N/A N/A N/A1,680 to 1,880
Notes: 1 – Concord Trailways service from Manchester (operating as it does today) is estimated to have 700 daily inbound
boardings2 – Ridership for specific bus stops are included. Number to left is “town center” (or Airport) stop, number to right is
Park and Ride stop.
4
5
6
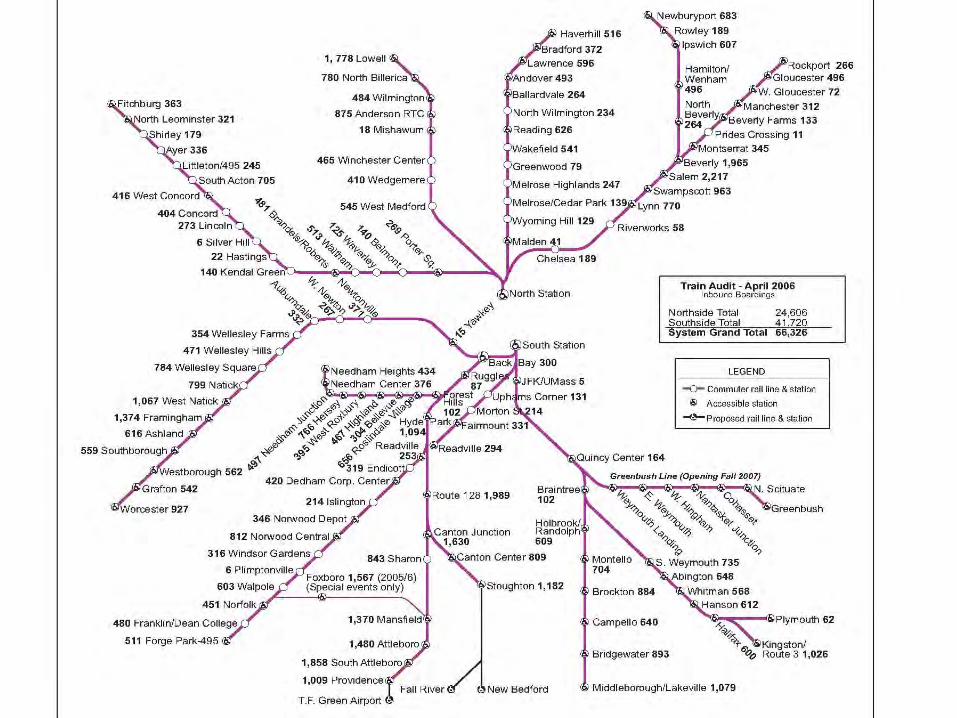
MBTA Daily
Ridership
7
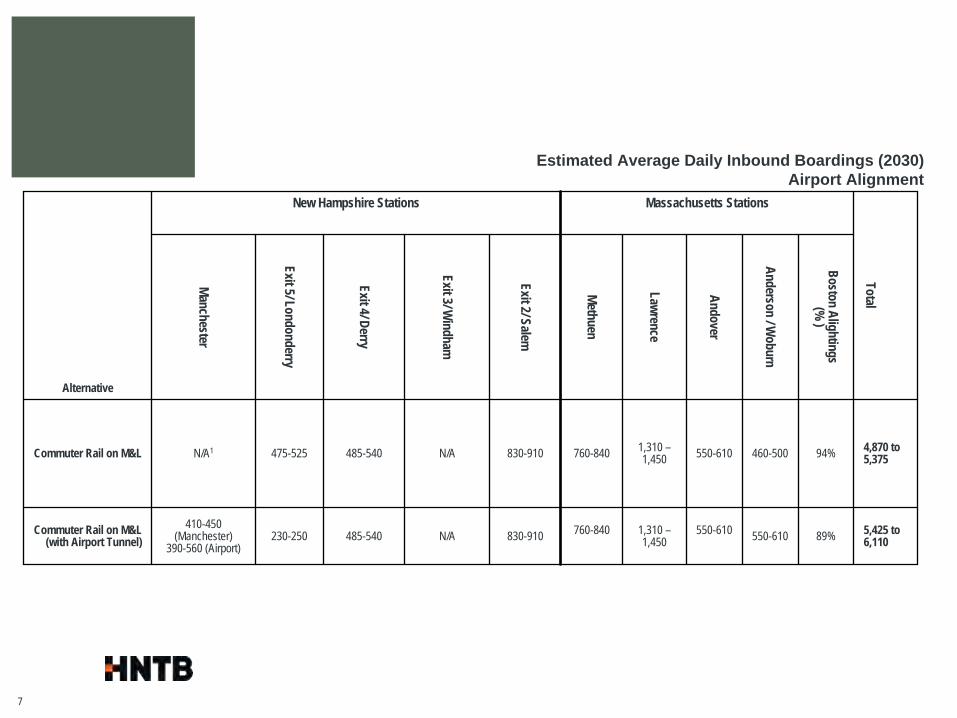
Estimated Average Daily Inbound Boardings (2030) Airport Alignment
Alternative
New Hampshire Stations Massachusetts Stations
Total
Manchester
Exit 5/ Londonderry
Exit 4/ Derry
Exit 3/ Windham
Exit 2/ Salem
Methuen
Lawrence
Andover
Anderson / Woburn
Boston Alightings(%
)
Commuter Rail on M&L N/A1 475-525 485-540 N/A 830-910 760-840 1,310 – 1,450 550-610 460-500 94% 4,870 to
5,375
Commuter Rail on M&L(with Airport Tunnel)
410-450 (Manchester)
390-560 (Airport)230-250 485-540 N/A 830-910 760-840 1,310 –
1,450550-610 550-610 89% 5,425 to
6,110

8
Gas Price Sensitivity
Analysis Background
Long-Range Projection of Fuel Prices
0
50
100
150
200
250
300
350
2005
2007
2009
2011
2013
2015
2017
2019
2021
2023
2025
2027
2029
Year
Cen
ts p
er G
allo
n (2
006
dolla
rs)
Motor Gasoline Price
Note: Sales weighted-average price for all grades. Includes Federal, State, and local taxes.
Source: Energy Information Administration, Annual Energy Outlook 2008
9
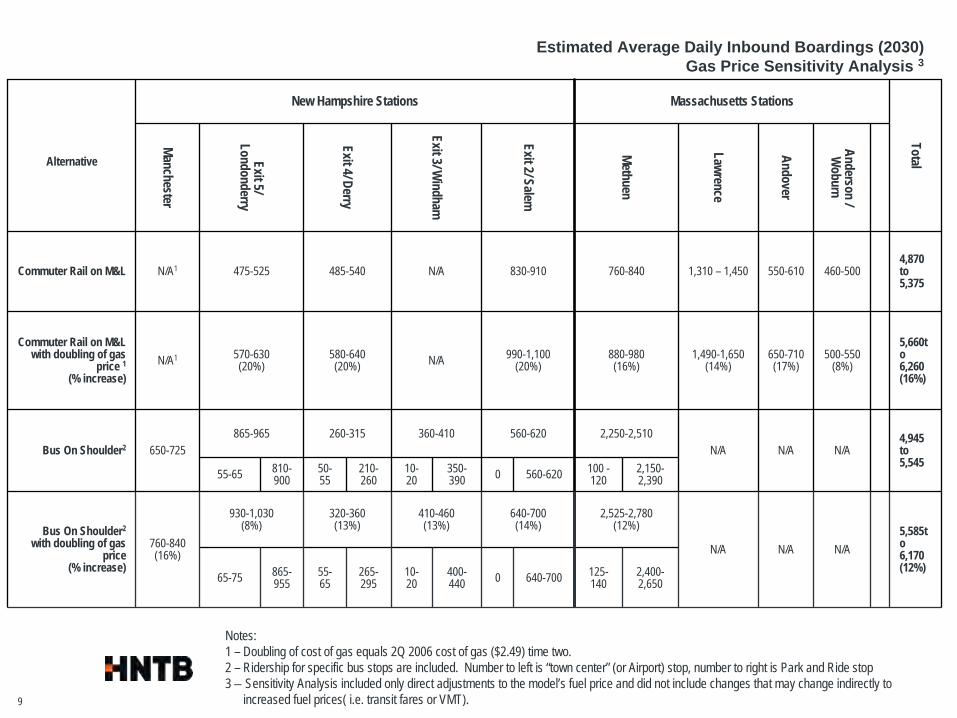
Estimated Average Daily Inbound Boardings (2030) Gas Price Sensitivity Analysis 3
Notes: 1 – Doubling of cost of gas equals 2Q 2006 cost of gas ($2.49) time two.2 – Ridership for specific bus stops are included. Number to left is “town center” (or Airport) stop, number to right is Park and Ride stop3 – Sensitivity Analysis included only direct adjustments to the model’s fuel price and did not include changes that may change indirectly to
increased fuel prices( i.e. transit fares or VMT).
Alternative
New Hampshire Stations Massachusetts Stations
Total
Manchester
Exit 5/ Londonderry
Exit 4/ Derry
Exit 3/ Windham
Exit 2/ Salem
Methuen
Lawrence
Andover
Anderson / W
oburn
Commuter Rail on M&L N/A1 475-525 485-540 N/A 830-910 760-840 1,310 – 1,450 550-610 460-5004,870 to 5,375
Commuter Rail on M&L with doubling of gas
price 1
(% increase)N/A1 570-630
(20%)580-640(20%) N/A 990-1,100
(20%)880-980(16%)
1,490-1,650(14%)
650-710(17%)
500-550(8%)
5,660t o6,260(16%)
Bus On Shoulder2 650-725865-965 260-315 360-410 560-620 2,250-2,510
N/A N/A N/A4,945 to 5,545
55-65 810- 900
50- 55
210- 260
10- 20
350- 390 0 560-620 100 -
1202,150- 2,390
Bus On Shoulder2
with doubling of gas price
(% increase)
760-840(16%)
930-1,030(8%)
320-360(13%)
410-460(13%)
640-700(14%)
2,525-2,780(12%)
N/A N/A N/A5,585t o 6,170(12%)
65-75 865- 955
55- 65
265- 295
10- 20
400- 440 0 640-700 125-
1402,400- 2,650

10

11
12
13
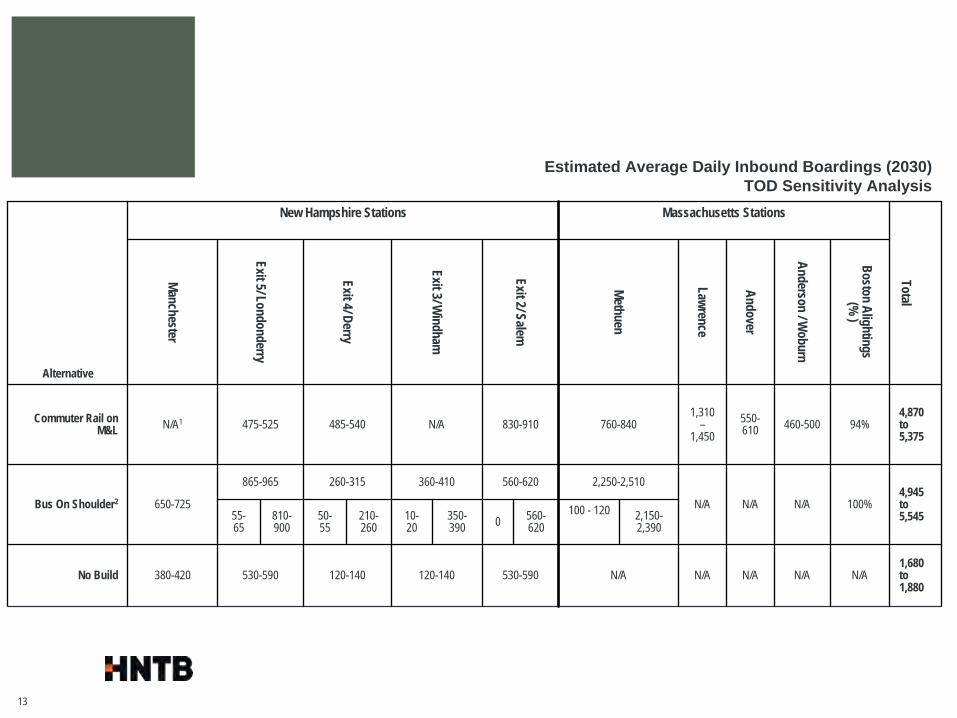
Estimated Average Daily Inbound Boardings (2030)TOD Sensitivity Analysis
Alternative
New Hampshire Stations Massachusetts Stations
Total
Manchester
Exit 5/ Londonderry
Exit 4/ Derry
Exit 3/ Windham
Exit 2/ Salem
Methuen
Lawrence
Andover
Anderson / Woburn
Boston Alightings(%
)
Commuter Rail on M&L N/A1 475-525 485-540 N/A 830-910 760-840
1,310 –
1,450550- 610 460-500 94%
4,870 to 5,375
Bus On Shoulder2 650-725
865-965 260-315 360-410 560-620 2,250-2,510
N/A N/A N/A 100%4,945 to 5,54555-
65810- 900
50- 55
210- 260
10- 20
350- 390 0 560-
620100 - 120 2,150-
2,390
No Build 380-420 530-590 120-140 120-140 530-590 N/A N/A N/A N/A N/A1,680 to 1,880
14
I-93 Transit Investment
Study
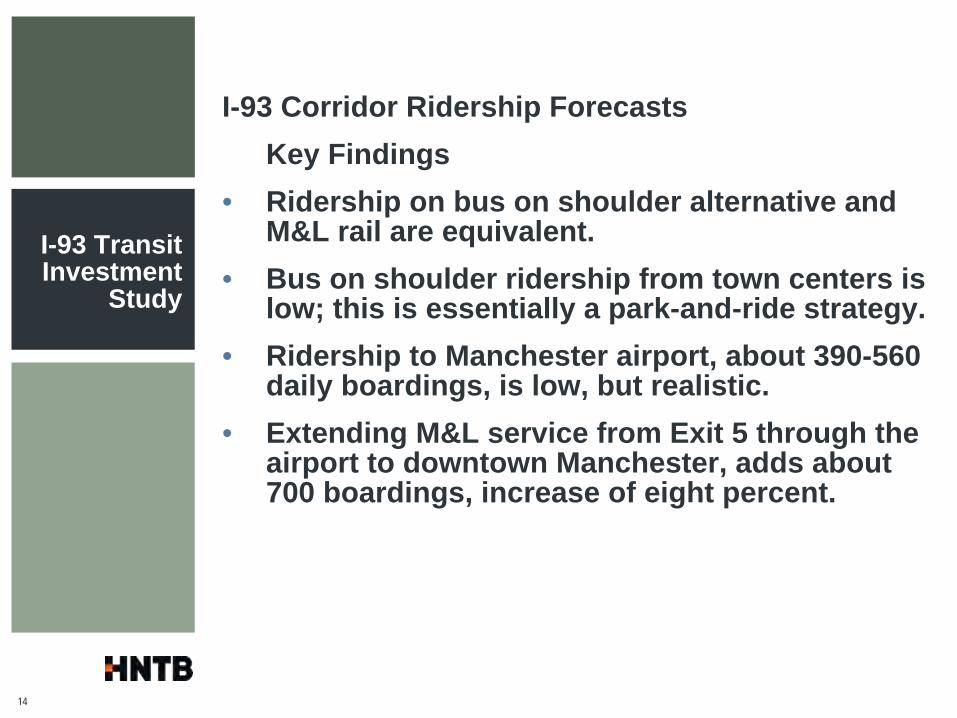
I-93 Corridor Ridership ForecastsKey Findings
• Ridership on bus on shoulder alternative and M&L rail are equivalent.
• Bus on shoulder ridership from town centers is low; this is essentially a park-and-ride strategy.
• Ridership to Manchester airport, about 390-560 daily boardings, is low, but realistic.
• Extending M&L service from Exit 5 through the airport to downtown Manchester, adds about 700 boardings, increase of eight percent.
15
I-93 Transit Investment
Study
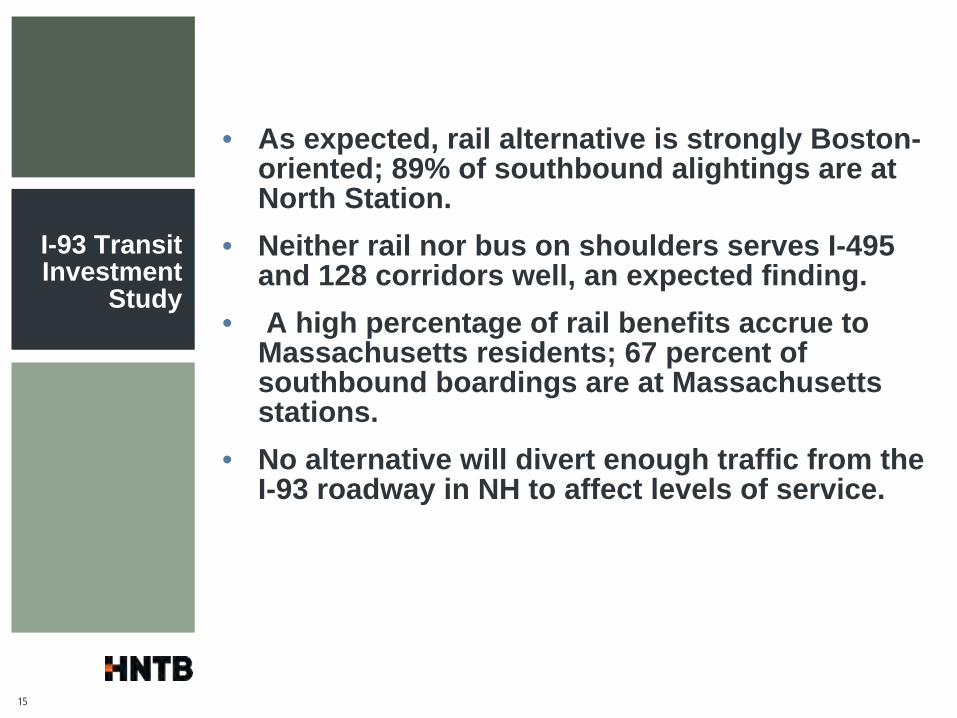
• As expected, rail alternative is strongly Boston- oriented; 89% of southbound alightings are at North Station.
• Neither rail nor bus on shoulders serves I-495 and 128 corridors well, an expected finding.
• A high percentage of rail benefits accrue to Massachusetts residents; 67 percent of southbound boardings are at Massachusetts stations.
• No alternative will divert enough traffic from the I-93 roadway in NH to affect levels of service.
16
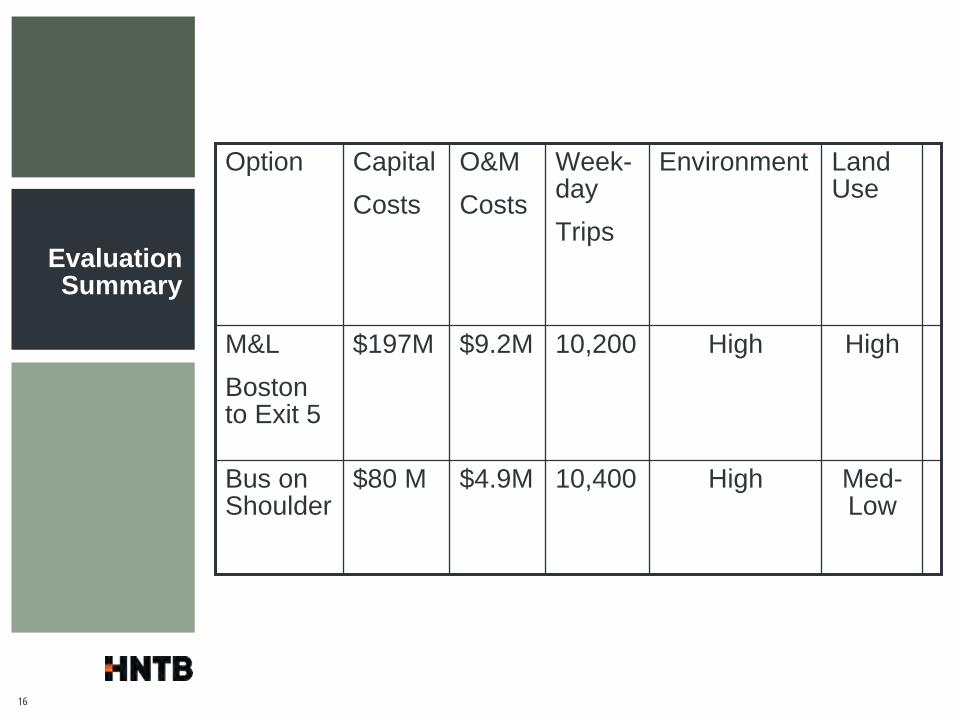
Evaluation Summary
Option Capital Costs
O&MCosts
Week- day Trips
Environment Land Use
M&LBoston to Exit 5
$197M $9.2M 10,200 High High
Bus on Shoulder
$80 M $4.9M 10,400 High Med- Low

17
Annual Non-Federal RequirementsBus on shoulder
M&L
Total capital $80M $197M
Federal share $40M $98.5M
Annual non-federal
$2.5M $5.9M
Annual O&M $4.9M $9.2M
Total annualnon-federal
$7.4M $15.1 M
18
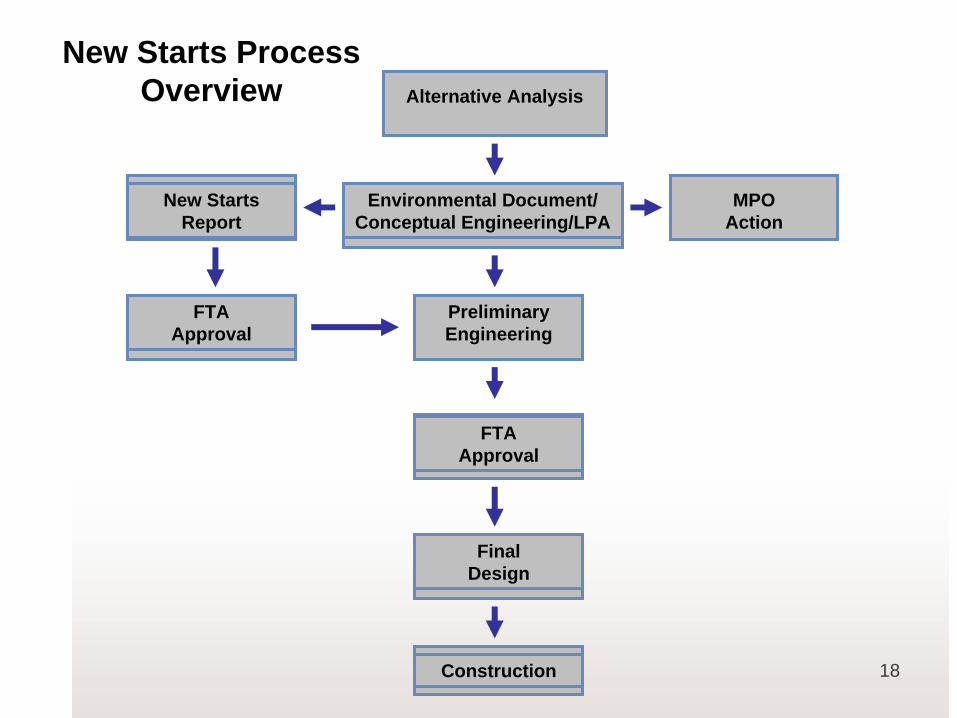
New Starts Process Overview Alternative Analysis
Environmental Document/ Conceptual Engineering/LPA
New Starts Report
MPO Action
FTA Approval
Preliminary Engineering
FTA Approval
Final Design
Construction

19
Figure I-1 New Starts Evaluation Process
20
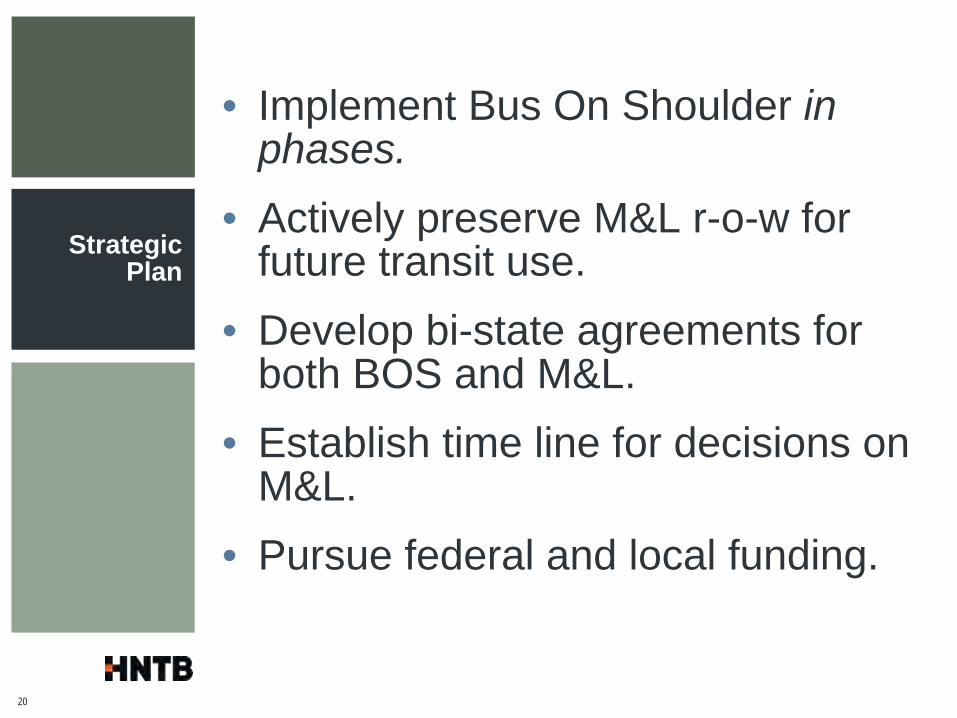
Strategic Plan
• Implement Bus On Shoulder in phases.
• Actively preserve M&L r-o-w for future transit use.
• Develop bi-state agreements for both BOS and M&L.
• Establish time line for decisions on M&L.
• Pursue federal and local funding.