Embed Size (px)
Citation preview

....I
/------

-~
-
ALASKA POWER AUTHORITY
SUSITNA HYRDROELECTRIC PROJECT
ARLISAlaska Resources
Library & InfonnatlOn ServtcesAnchorage. Alaska
Subtask 7.10
AQUATIC STUDieS PROCEDURES t-1ANUAL
P~ASE II - final Draft
-by-Alaska Department of Fish and GameSusitna Hydro Aquatic Studies2207 Spenard RoadAnchorage, Alaska 99503
-for-Acres American IncorporatedLiberty Bank Building, Main at CourtBuffalo, New York 14202
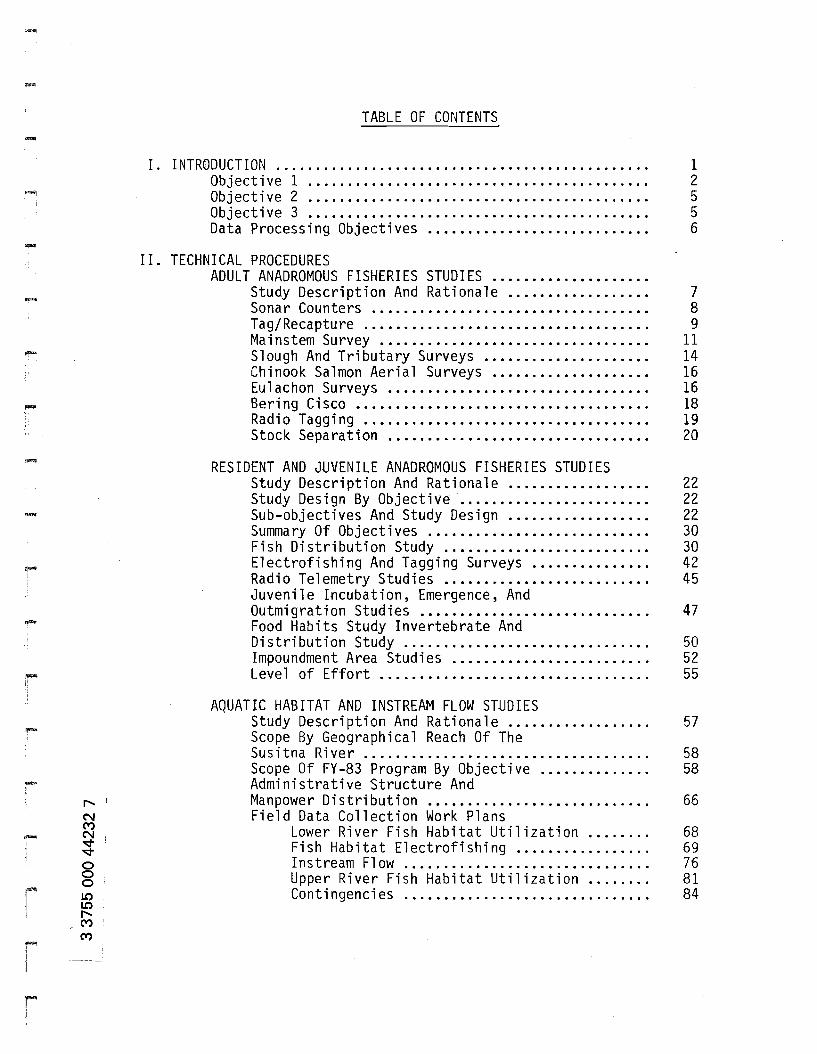
-TABLE OF CONTENTS
I. INTRODUCTION 1Objective 1 2Objective 2 5Objective 3 5Data Processing Objectives 6
.....
-
-
r
r-N 'MNVVoooLOLOr--
.MM
II. TECHNICAL PROCEDURESADULT ANADROMOUS FISHERI ES STUDI ES ......•.............
Study Description And Rationale .Sonar Counters .Tag/Recapture .Mainstem Survey .Slough And Tributary Surveys .Chinook Salmon Aerial Surveys .Eul achon Surveys .Bering Cisco .Radio Tagging ..•.................................Stock Separation .
RESIDENT AND JUVENILE ANADROMOUS FISHERIES STUDIESStudy Description And Rationale .Study Design By Objective .Su b-object ives And Study Des i gn .Summary Of Objectives ..Fish Distribution Study ..Electrofishing And Tagging Surveys .Radio Telemetry Studies .Juvenile Incubation, Emergence, AndOutmigration Studies .Food Habits Study Invertebrate AndDistribution Study .Impoundment Area Studies .Leve1 of Effort .
AQUATIC ~ABITAT AND INSTREAM FLOW STUDIESStudy Desc ri pt ion And Ra tiona1e .Scope By Geographical Reach Of TheSus i tna Ri ver .Scope Of FY-83 Program By Objective .Administrative Structure AndManpower Distribution .Field Data Collection Work Plans
Lower River Fish Habitat Utilization .Fish Habitat Electrofishing .Instream Flow .Upper River Fish Habitat Utilization .Contingencies .
789
11141616181920
22222230304245
47
505255
57
5858
66
6869768184

-DATA PROCESSING
Work Pl an .Data Base Management .
8596
.....
-
III. DATA PROCEDURESA. ADULT ANADROMOUS FISHERIES STUDIES
Side Scan Sonar Operations 103Tag/Recapture Operations 110Mainstem Survey Operations 115Slough And Tributary Surveys 115Mainstem Set Netting .........................•... 115Bering Cisco Monitoring 116Eulachon Survey Operation 116
B. RESIDENT AND JUVENILE ANADROMOUS FISHERIES STUDIESData Forms 127Specific Data To Be Collected.................... 140Report Format 141
C. AQUATIC HABITAT AND INSTREAM FLOW STUDIESData Forms 143Data Transfer .................•.................. 153
IV. QUALITY CONTROLAdult Anadromous Fisheries Studies.................... 154Resident And Juvenile Anadromous Fisheries Studies 154Aquatic Habitat And Instream Flow Studies 155Data Routing.......................................... 156
V. REPORT SCHEDULE 157
VI. PERSONNEL 161
.r!
VII. LITERATURE CITED
APPENDICES
I. Sonar Installation And Operation ManualII. Oscilloscope Operation
III. Fishwheel OperationIV. Fish Tagging
V. Electro-Shocking (Addended)VI. Habitat Site Locations
VII. RJ Sampling TechniquesVIII. AH Instruction Manuals
XI. FY-83 Data Form Coding And Instructions
164
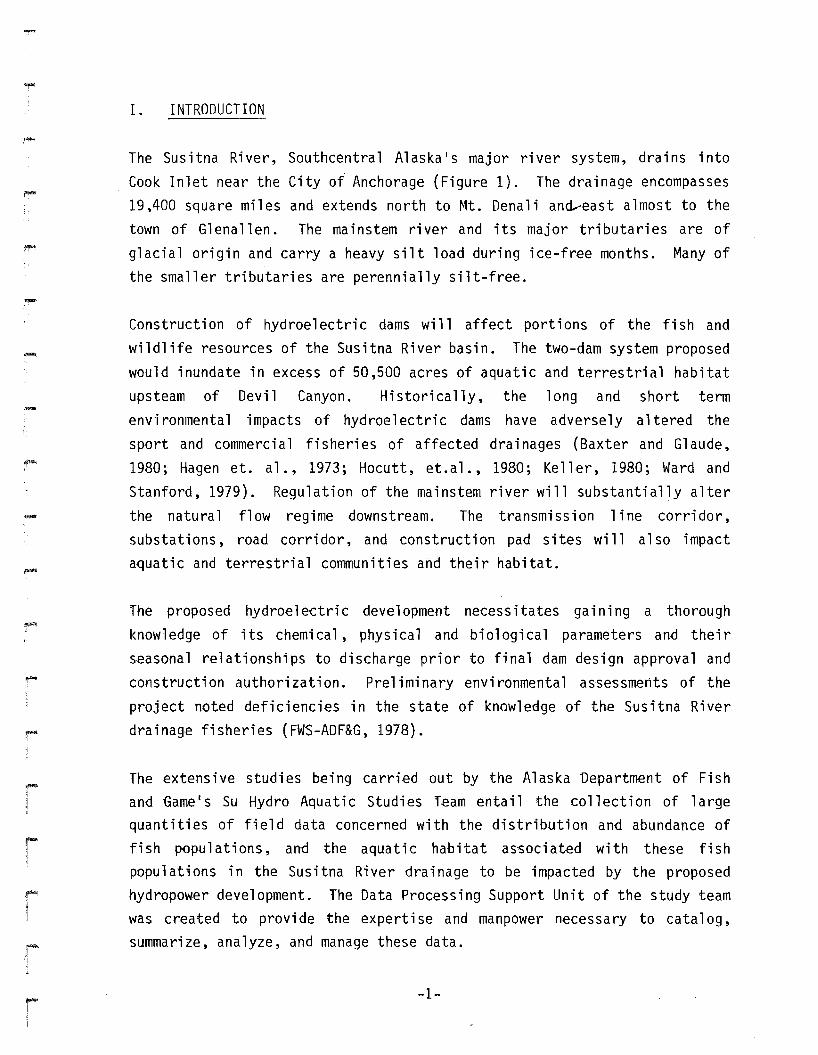
I. INTRODUCTION
The Susitna River, Southcentral Alaska's major river system, drains into
Cook Inlet near the City of Anchorage (Figure I). The drainage encompasses
19,400 square miles and extends north to Mt. Denali an~east almost to the
town of Glenallen. The mainstem river and its major tributaries are of
glacial origin and carry a heavy silt load during ice-free months. Many of
the smaller tributaries are perennially silt-free.
Construction of hydroelectric dams will affect portions of the fish and
wildlife resources of the Susitna River basin. The two-dam system proposed
would inundate in excess of 50,500 acres of aquatic and terrestrial habitat
ups team of Devil Canyon. Hi storica11y, the long and short term
env'ironmental 'impacts of hydroelectric dams have adversely altered the
sport and commercial fisheries of affected drainages (Baxter and Glaude,
1980; Hagen et. al., 1973; Hocutt, et.al., 1980; Keller, 1980; Ward and
Stanford, 1979). Regulation of the mainstem river will substantially alter
the natural flow regime downstream. The transmission line corridor,
substations, road corridor, and constructi on pad sites wi 11 also impact
aquatic and terrestrial communities and their habitat.
The proposed hydroelectric development necessitates galnlng a thorough
knowledge of its chemical, physical and biological parameters and their
seasonal relationships to discharge prior to final dam design approval and
construction authorization. Prel'iminary environmental assessments of the
project noted defi ci enci.es in the state of knowl edge of the Sus itna Ri ver
drainage fisheries (FWS-ADF&fJ, 1978).
The extensive studies being carri.ed out by the Alaska Department of Fish
and fJame's Su Hydro Aquatic Studies ream entail the collection of large
quantities of field data concerned with the distribution and abundance of
fish populations, and the aquatic habitat as-sociat.ed with these fish
populations in the Susitna River drainage to be impacted by the proposed
hydropower development. The Data Processing Support Unit of the study team
was created to provide the expertise and manpower necessary to catalog,
summarize, analyze, and manage these data.
-1-
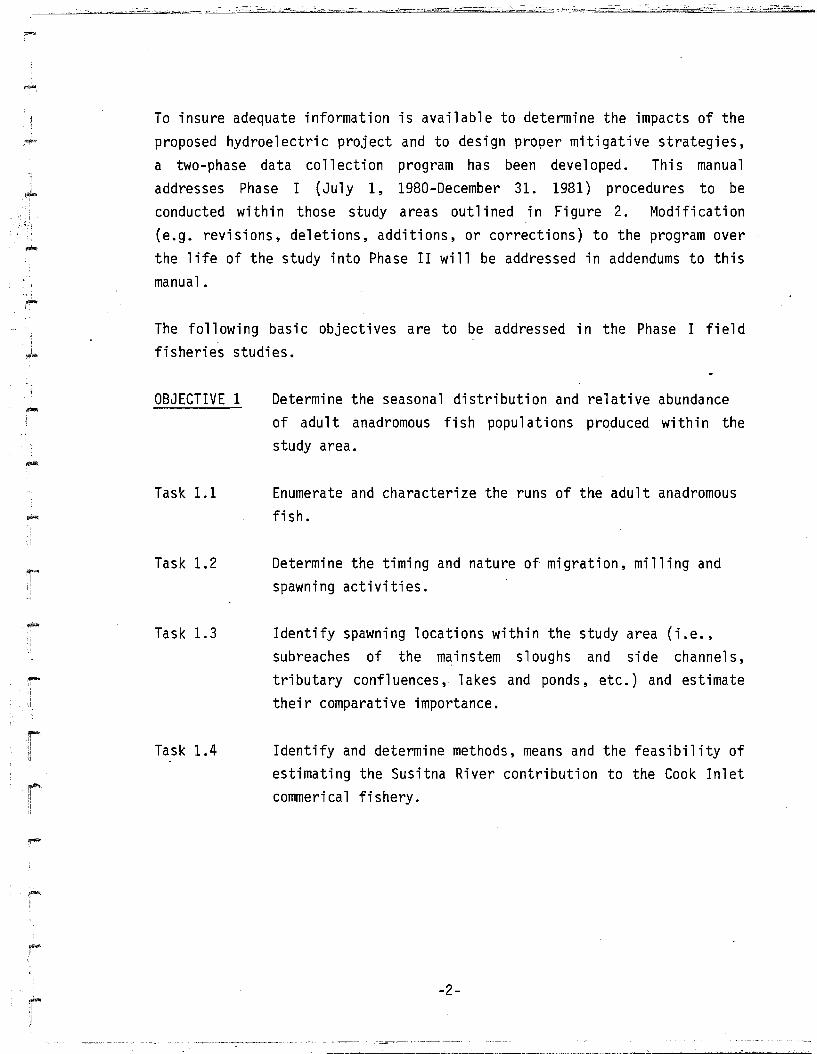
To insure adequate information is available to determine the impacts of theproposed hydroelectric project and to design proper mitigative strategies,a two-phase data collection program has been developed. This manualaddresses Phase I (July 1, 1980-December 31. 1981) procedures to beconducted within those study areas outlined in Figure 2. Modification(e.g. revisions, deletions, additions, or corrections) to the program overthe life of the study into Phase II will be addressed in addendums to thismanual.
The following basic objectives are to be addressed in the Phase I fieldfisheries studies.
OBJECTIVE 1
Task 1.1
Task 1. 2
Task 1.3
Task 1.4
Determine the seasonal distribution and relative abundanceof adult anadromous fi sh popul ati ons produced within thestudy area.
Enumerate and characterize the runs of the adult anadromousfish.
Determine the timing and nature of migration, milling andspawning activities.
Identify spawning locations within the study area (i.e.,subreaches of the mainstem sloughs and side channels,tributary confluences, lakes and ponds, etc.) and estimatetheir comparative importance.
Identify and determine methods, means and the feasibility ofestimating the Susitna River contribution to the Cook Inletcommerical fishery.
-2-

-
---~I II I!... __ J
Drainage Boundary
\.\.
\.\.
"" ... ........-- - .......... ,\.
\\,111
IIIII,II
II
/
'"",-......... _--_ .....
,IIII
II
'"..",-
J',J1I1I
I/
//
"./....
Fi qu rp. 1. Susitna River Aasin (approximate scale 1:2,200,000)
-3-
-
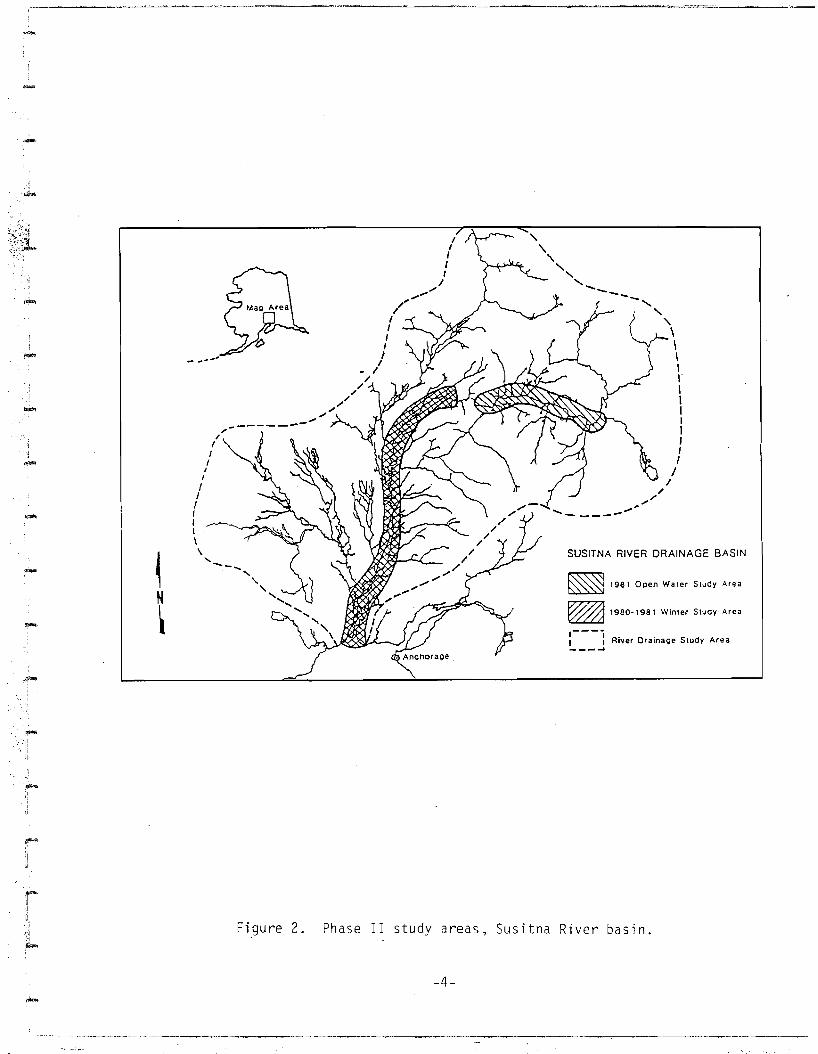
~ 1981 Open Waler Study Area
~ 1980-1981 Winter Study Area
,---jI I River Drainage Study Area----'
SUSITNA RIVER DRAINAGE BASIN
'\\
'\"-""-------- ...... ,
"-'\
\\\II"I1II1III
/I
'"... '"---_ ... .".,."'"
I/III
I.........../'
IIII,
II
• I,-'"'"",'"...
"
- .."
-
Fi gu re 2. Phase II study areas, Susitna River basin.
-4-

..-
OBJECTIVE 2
Task 2.1
Task 2.2
OBJECTIVE 3
Task 3.1
Task 3.2
Determine the seasonal distribution and relative abundanceof selected resident and juvenile anadromous fishpopulations within the study area.
Identify spawning and rearing locations of the residentspecies and the rearing locations of juvenile anadromousspecies to estimate their comparative importance.
Record descriptive information on captured fish (species,location of capture site, age class), and discuss seasonalmigration patterns of selected adult resident species.
Characterize the seasonal habitat requirements of selectedanadromous and resident species within the study area andtheir relationship with the mainstem.river discharge.
Identify the physical and chemical conditions which appearto be influencing the suitability of various habitat typesfor the species and life history stages of interest .
Characterize the physical and chemical parameters of thevarious seasonal habitat types found in the study area asthey relate to mainstem discharge.
..-
To meet the above objectives, the study program is separated into threesections; Adult Anadromous Fisheries, Resident and Juvenile AnadromousFisheries, and Aquatic Habitat and Instream Flow Studies. The operationsof the Anadromous Adult and Resident and Juvenile Anadromous fieldinvestigations will be interrelated and conducted in cooperation withAquati c Habi tat and Instream Flow studi es. The specifi c procedures forcompletion of each section of the program are describ~d in this manual .
-5-

The objectives of the Data Processing Support Unit of the ADF&G Su HydroAquatic Studies Team remain seperate from the field study program. Theobjectivies of this unit are:
OBJECTIVE I
Task 1.1
Task 1.2
Task 1.3
Task 1.4
Task 1.5
Task 1.6
Task 1. 7
Provide data processing and data base systems managementsupport to the field program elements. The tasks under thisobjective are:
Computerization of all data collected in the field studies,this computerization into retrievable data base systemsallows for easy and accurate retrieval of data for analysisand summarization.
Development and mainteance of a computer-based data basemanagement system.
Production of summary report tables and computer plottedgraphics, with simple univariate statistics (e.g. minimums,maximums, means, and confidence intervals).
Programming and execution of programs to provide computerquality execution of statistical analyses.
Provide nunerical and statistical analyses of scientificand technical data collected by the field program elements.
Provide advice on experimental sampling design of thefield study programs, to ensure that the field studies willyield the type and quantity of data needed to meet theirobjectives.
Provide biometric evaluation of the study team1sscientific reports, to ensure that all conclusions arefounded upon sound stati sti ca1 ana lyses and i nterpretati onof the collected field data.
-6-
1
------- -_._-------_.--_._--_._._--~._-----_._.._---
II. TECHNICAL PROCEDURES
A. ADULT ANADROMOUS FISHERIES STUDIES
Study Description and Rationale
Three principal methods will be used to ascertain distribution, abundance,timing and migrational activity of adult anadromous salmon in the studyarea (Tasks 1.1 and 1.2). They are: (1) side scan sonar (SSS) counters,(2) tag and recapture with fishwheels and (3) aerial surveys. The SSS areexpected to accurately monitor sockeye and pink salmon escapement, and bereasonably effective on chum and coho salmon. Tag and recapture operationsusing fishwheels should effectively establish timing and escapement ofchinook, sockeye, pink, chum and coho salmon. Aerial surveys will alsoprovide, escapement data and distribution information on chinook salmon.
Electroshocking and other various sampling gear will be used on the SusitnaRiver mainstem and subreaches (sloughs, side channels and tributaryconfluences) along with ground and waterbourne surveys to define the extentof anadromous fish spawning activity (Task L3). Radio tagging will alsobe conducted to gather specific information on the migrational behavior,timing and spawning locations of chinook, coho and chum salmon in the upperSusitna River, principally between Talkeetna and Devil Canyon (Tasks 1.2and 1.3).
For the Bering cisco, fishwheels and electrofishing equipment will be usedto define migrational abundance, timing and spawning activity (Tasks 1.1 1.3). Eulachon will be monitored for relative abundance, timing andmigrational characteristics by the use of set nets and electrofishing gear(Tasks 1.1,- 1.3).
Lastly, standard scale pattern analysis techniques will be used to definethe separatabil ity of Susitna River spawning sockeye salmon stocks north- ofTalkeetna from two major sockeye salmon stocks in the Talkeetna andChulitna rivers (Task 1.1).
-7-
j1-
Sonar Counters
Operation Periods:
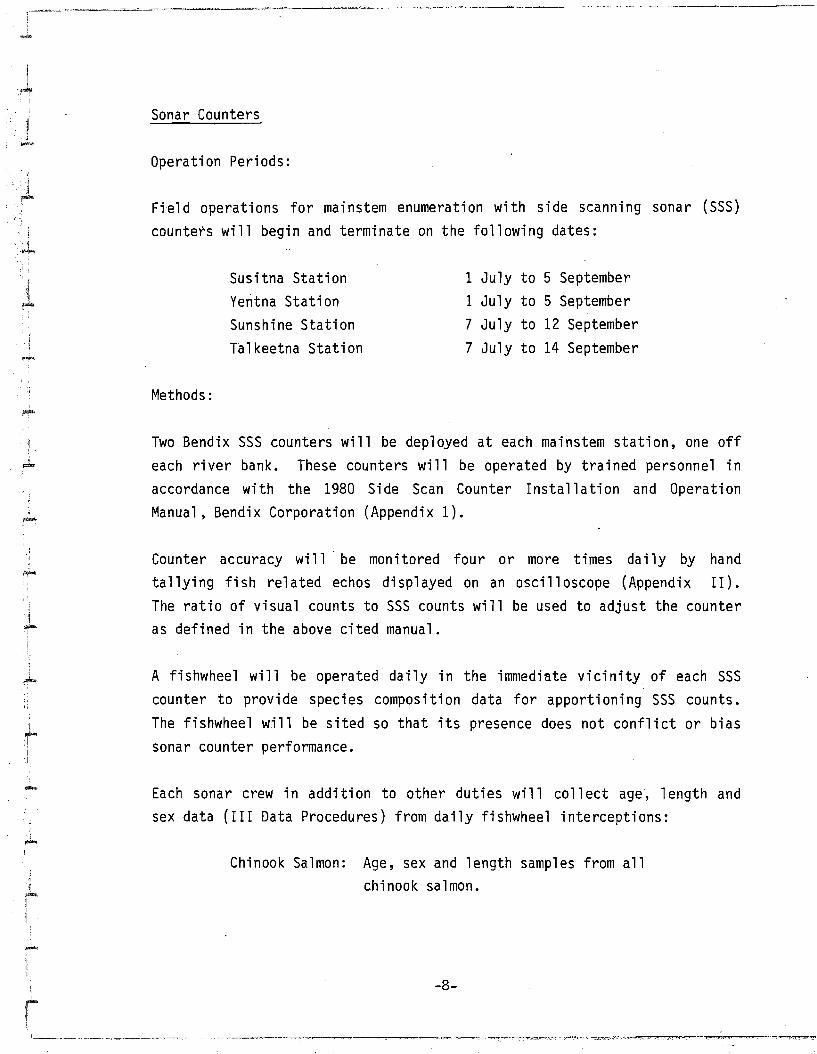
Fiel d operations for mainstem enumeration with si de scanni ng sonar (SSS)counters will begin and terminate on the following dates:
Methods:
Susitna StationYentna StationSunshine StationTalkeetna Station
1 July to 5 September1 July to 5 September7 July to 12 September7 July to 14 September
1I'~
Two Bendix SSS counters will be deployed at each mainstem station, one offeach river bank. These counters will be operated by trained personnel inaccordance with the 1980 Side Scan Counter Installation and OperationManual, Bendix Corporation (Appendix 1).
Counter accuracy wi 11 . be monitored four or more times daily by handtallying fish related echos displayed on an oscilloscope (Appendix II).The ratio of visual counts to SSS counts will be used to adjust the counteras defined in the above cited manual.
A fishwheel will be operated daily in the immediate vicinity of each SSScounter to provide species composition data for apportioning SSS counts.The fishwheel will be sited so that its presence does not conflict or biassonar counter performance.
Each sonar crew in addition to other duties will collect age, length andsex data (III Data Procedures) from daily fishwheel interceptions:
Chinook Salmon: Age, sex and length samples from allchinook salmon.
-8-
i,..,..
l
I~
1
.l.
. ::<,j.1,.....
Ii,~
Sockeye Salmon: Age, length and sex samples from 40 fisn daily,except that at Talkeetna Station where allsockeye salmon will be sampled for age, lengthand sex data.
Pink Salmon: Length and sex samples from 40 fish daily.
Chum Salmon: Age, length and sex samples from 20 fish daily.Coho Salmon: Age, length and sex samples from 20 fish daily.
The number of fish sampled for age, sex and length data is adequate todefine escapement characteristics and variabil ity based on previous ADF&GSusitna River investigations. Age samples will not be collected from pinksalmon due to there being only one age class apparent in the adult return.
Sonar counts and attendant data will be forwarded to the Anchorage officeevery two weeks.
Tag/Recapture
Operation Periods:
Field operations for tag/recapture projects will begin and end on thefollowing dates:
Sunshine StationTalkeetna StationCurry Station
7 June to 12 September7 June to 14 September10 June to 18 September
Methods:
Fishwheels will be operated continously, 24 hours per day, at each samplingstation. Two fishwheels will be deployed on each side of the Susitna Riverat Sunshine and Talkeetna stations. At Curry Station, a single fishwheelwill be operated off each bank. Fishwheel design is described in the PhaseI ADF&G/Su Hydro Adult Anadromous Report (1981) and operation is described
-9-
,-I
""'"
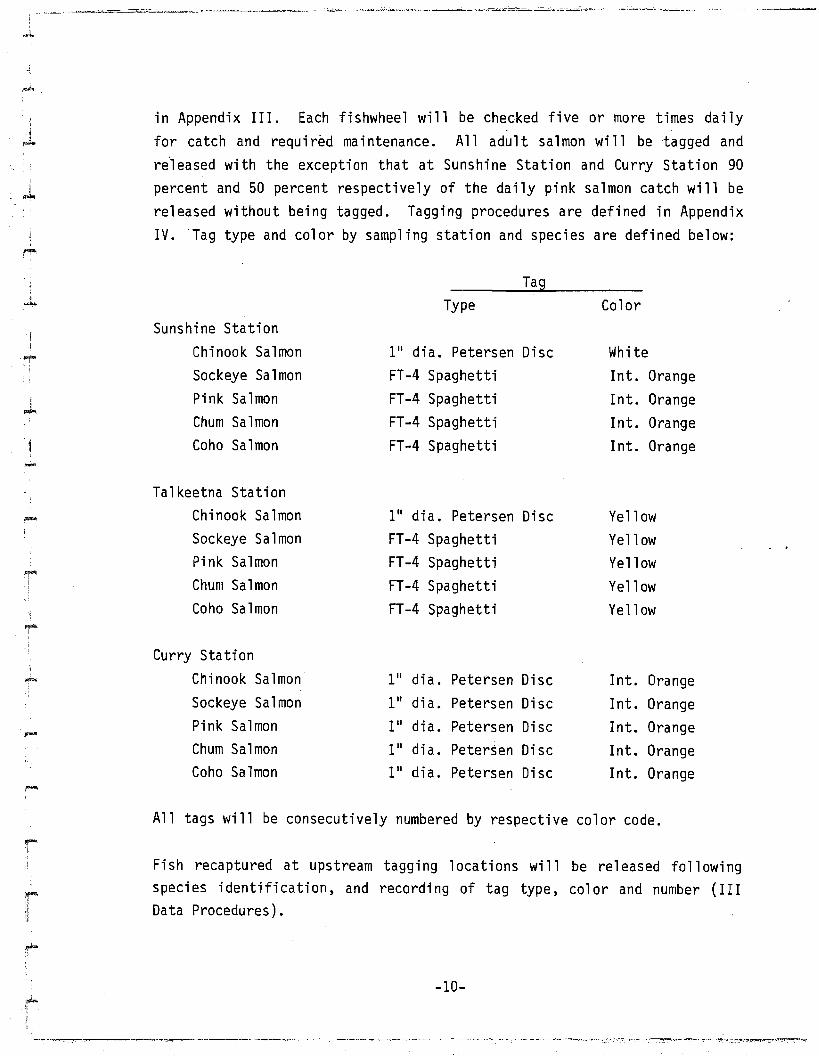
in Appendix III. Each fishwheel will be checked five or more times dailyfor catch and required maintenance. All adult salmon will be tagged andre'leased with the exception that at Sunshine Station and Curry Station 90percent and 50 percent respectively of the daily pink salmon catch will bereleased without being tagged. Tagging procedures are defined in AppendixIV. Tag type and color by sampling station and species are defined below:
Sunshine StationChinook SalmonSockeye SalmonPink SalmonChum SalmonCoho Salmon
TagType Color
1" dia. Petersen Disc WhiteFT -4 Spaghetti Int. OrangeFT-4 Spaghetti- Int. OrangeFT-4 Spaghetti Int. OrangeFT-4 Spaghetti Int. Orange
Talkeetna StationChinook SalmonSockeye SalmonPink SalmonChum SalmonCoho Salmon
1" dia. Petersen DiscFT-4 SpaghettiFT-4 SpaghettiFT-4 SpaghettiFT-4 Spaghetti
Yell owYell owYellowYell owYell ow
Curry StationChinook SalmonSockeye SalmonPink SalmonChum SalmonCoho Salmon
1" dia. Petersen Disc Int. Orange111 dia. Petersen Disc Int. Orange1" dia. Petersen Disc Int. Orange1" dia. Petersen Disc Int. Orange1" dia. Petersen Disc Int. Orange
All tags will be consecutively numbered by respective color code.
Fish recaptured at upstream tagging 1ocati ons wi 11 be rel eased foll owi ngspecies identification, and recording of tag type, color and number (IIIData Procedures).
-10-

The taggi ng crew at Curry Stati on wi 11 also collect age, 1ength and sexdata (III Data Procedures) for each species as follows:
Chinook Salmon: All chinook salmon will be sampled for age, sex andlength.
Sockeye Salmon: All sockeye salmon will be sampled for age, sex andlength.
Chum Salmon: Age, length and sex samples from 20 fish daily.
Coho Salmon: Age, length and sex samples from 20 fish daily.
Pink Salmon: Length and sex samples from 40 fish daily.
The Sunshine and Talkeetna Station tagging crews will be responsible forcollecting adult salmon age, length and sex samples as defined in themethods section under sonar monitoring until such time as the ~onar
installations are operating.
All non-adult salmon interceptions in the fishwheels will be identified byspecies and recorded in the Daily Fishwheel Catch Log form (III DataProcedures).
Tag and recapture data will be forwarded to the Anchorage offi ce every twoweeks.
Mainstem Surveys
Operation Period and Survey Reach:
Field operations for identifying Susitna River mainstem spawning areas willbegin and end on the following dates:
Susitna Station Survey crewSunshine Survey crew
-11-
1 August to 1 October1 August to 7 October
--------~----- ----- ----------------~--------------------------- -------------~------------~---.......,---
~---~ ------ ._-----~-_._-~---------_.--'~"-"~~~'-"~'-----
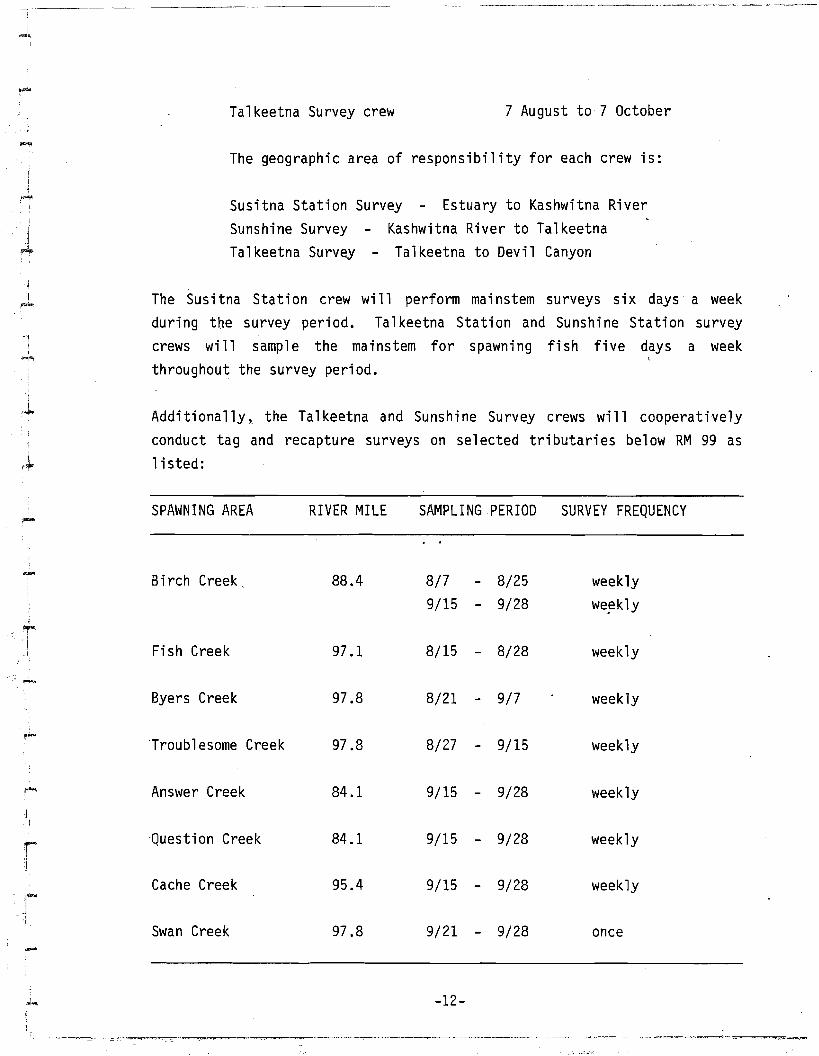
Talkeetna Survey crew 7 August to 7 October
""'"
1
The geographic area of responsibility for each crew is:
Susitna Station Survey - Estuary to Kashwitna RiverSunshine Survey - Kashwitna River to TalkeetnaTalkeetna Survey - Talkeetna to Devil Canyon
The Susitna Station crew will perform mainstem surveys six days a weekduring the survey period. Talkeetna Station and Sunshi ne Stati on surveycrews will sample the mainstem for spawning fish five days a weekthroughout the survey period.
Additionally, the Talkeetna and Sunshine Survey crews will cooperativelyconduct tag and recapture surveys on selected tributaries below RM 99 aslisted:
SPAWNING AREA RIVER MILE SAMPLING PERIOD SURVEY FREQUENCY
- Birch Creek 88.4 8/7 8/25 weekly-9/15 - 9/28 we~kly
Fish Creek 97.1 8/15 - 8/28 weekly
Byers Creek 97.8 8/21 9/7 weekly
Troublesome Creek 97.8 8/27 - 9/15 weekly
Answer Creek 84.1 9/15 - 9/28 weekly
Question Creek 84.1 9/15 - 9/28 weekly
Cache Creek 95.4 9/15 - 9/28 weekly
Swan Creek 97.8 9/21 - 9/28 once
-12-
------------.----

1...L
,.,..
"""'
.~
,1.
Methods:
The following gear will be used to determine the presence of mainstem
spawning:
1. Electroshockers2. Drift gillnets3. Egg deposition pump
Each mainstem survey crew will be assigned a 20 foot river boat powered bya 75 h.p. engine with a jet unit.
Mainstem survey crews will assess mainstem spawning in the three sectionsof river primarily using electroshocking equipment. The variabil ity of
habitat to be sampled both between and within the three sectionsnecessitates the use of two electrode systems. A mobile electrode systemwill be used when electroshocking in areas of restricted boatmaneuverabi 1ity, and a stationary or boom electrode system, with a largershocking fiel.d,. will be used in areas of unrestricted boat maneuverability.Specifi c operational and safety procedures are outl ined in Appendix V.Catch data will be recorded on the appropriate forms (III Data Procedures).Salmon caught by electroshocking wil) not be assumed spawning at the catchlocation unless all of the following criteria are met:
1. Fish exhibits spawning maturation colors and morphology.
2. Fish expells eggs or milt when slight pressure isexerted on the abdomen.
3. Fish is in vigorous condition, with 25 percent or moreof the eggs or milt remaining in the body cavity .
4. Additional electroshocking effort produces fish meetingcriteria 1 through 3 above.
-13-
;.~
..-
All adult non-anadromous species caught, will be identified, sampled forlength and sex, and tagged. Tagging methods are outlined in the Residentand Juvenile methods section of this Procedures Manual.
Drift gillnets will be used as contingency gear in the event of anelectrical malfunction to the electroshocking units. If used, driftgillnets will be fished in the mainstem by extending the net outperpendicular to the river channel, with the outside end of the float- lineattached to a buoy and the other fixed to the boat. Mainstem areas fishedby this method should be substantially free of surface and subsurfacedebris and shallow enough to allow the net to reach within a foot (or less)of the bottom. The same criteria outlined under electroshocking will beused to ascertain whether gillnet captured fish are spawning at the catchlocation. Catch data will be recorded on the appropriate sampling form(III Data Procedures).
Where water depth allows, suspected mainstem spawning areas will be sampledfor egg deposition. A backpack mounted water pump and two circularstanding screen cod end nets 18 inches in diameter will be used to samplethe river bed. Equipment operating procedures will be demonstrated in thefield. Results will be recorded on the appropriate sampling form (III DataProcedu res) . .
Mainstem survey crews will be comprised of one member from each project(Adult Anadromous (AA), Resident and Juvenile (RJ) and Aquatic Habitat(AH)) .. In addition to AA assessment of mainstem spawning, survey crewswill be addressing RJ and AH project objectives. These objectives areoutlined in the RJ and AH technical procedures .
Slough and Tributary Surveys
Operation Period and Survey Reach:
-14-
-~-~---'~'---- _.- - .•. ---~--- ..•".-'~-------.~- ..._--.------'" ---.- -- -~---------. _. -~. -.--,---,.-....,,------- '--t"_

;
I.....
. 'I:.1,.,,;,.,.
A crew will survey weekly all known and suspected anadromous fish spawningsloughs and tdbutaries between RM 99 and Devil Canyon from 3 August to 7October. The crew will base their operation from Gold Creek Station.
Sloughs w·ill be surveyed in their entirety and tributary streams will besurveyed from their confluence with the Susitna River mainstem to surveydistance outlined in the following chart:
TRIBUTARY STREAM RIVER MILE SURVEY DISTANCES (MILES)I
!"F--
Whiskers Creek 101.4 0.5Chase Creek 106.4 0.75
j Gash Creek 111.6 0.75.!
Lane Creek 113.6 0.5~Pll
Lower McKenzie Creek 116.2 0.5McKenzi e Creek 116.7 0.5Dead Horse Creek 120.9 0.55th July Creek 123.7 0.25Skull Creek 124.7 0.25Sherman Creek 130.8 0.25
.J,.. 4th July Creek 131.0 0.25Gold Creek 136.7 0.25Indian River 138.6 1.0Jack Long Creek 144.5 0.25Portage Creek 148.9 0.25
Once weekly from 7 August to 7 September, the Gold Creek survey crew willfish a set gill net for two hours off each bank of the Susitna Riverbetween a point one mile upstream of Portage Creek and Devil Canyon.
Methods:
-15-
I....
Sloughs (spring fed) and tributary streams listed in the preceding sectionwill be surveyed on foot in their entirety except as indicated. Streamsurveyors will wear polarized glasses and use hand-held tally counters torecord 1ive tagged and untagged adult salmon and carcasses. Survey datawill be recorded on the appropriate forms (III Data Procedures) andforwarded to the Anchorage office every two weeks.
Set nets used to sample the river reach between Devil Canyon and a pointone mile upstream of Portage Creek w·ill be uniform and will be fishedperpendi cu1ar to the ri ver channe1 from the shore. Each net wi 11 be 50feet long, 5 feet deep, and have a stretched mesh size of 5.2 inch. Setnet locations are shown in Appendix III. Catch information will berecorded on the appropriate form (III Data Procedures).
Chinook Salmon Aerial Surveys
Operation Period And Survey Reach:
Chinook salmon escapement surveys will be conducted on known and suspectedspawning tributaries between Talkeetna and Devil Canyon between 21 July and7 August by the Adult Anadromous Project Leader or his assistant.Additionally, surveys will be conducted drainage wide if survey datanormally collected by Region II ADF&G Sport Fish Division and shared withthe Su Hydro project is not collected.
Methods:
Chinook salmon surveys will be conducted via helicopter. The observer willwear polarized glasses and use tally counters to enumerate live and deadchinook salmon. Survey data will be recorded on the appropriate form (IIIData Procedures).
Eulachon Survey
Operation Period and Survey Reach:
-16-
Field activities willapproximately) and willapproximately) .
begin immediately following ice-out (15 May,terminate at the completion of spawning (10 June,
....
;-i
;~
Survey reach will extend from the intertidal estuary to the upper spawninglimits (Kashwitna River confluence, approximately)
Methods:
A standard set gill net (1.5 inch stretch mesh, 25 ft long,S feet deep)will be fished at two field selected sites in the Susitna River estuaryevery th i rd high tide for the fi rst seven days and thereafter, every fi fthhigh tide except when the fifth high tide occurs during non-day light hourswherein the preceding high tide will be considered the frequency end andwill be fished accordingly.
Fishing time will be monitored to the nearest minutemand shall extend tothirty minutes on each set except when observation indicates a 300 pluseu1achon catch at which time fishing will be discontinued until the nextscheduled fishing tide.
The two field selected set net sites will be fished independently andrepetitively in the same order. Fishing time at the first slte will begin45 minutes prior to high tide and at the second site, 15 minutes followinghigh tide. Daily high tides in the Susitna River estuary will bedetermined by applying a minus 36 minute correction factor to the 1982 hightide table for the Anchorage District (U.S. Coast Guard, 1982).
An e1ectroshocking boat will be operated on the Susitna River from theestuary (RM 6) to the upper limit of migration (RM 60, approximately) todefine spawning areas. This boat will be operated daily when the samplingcrew is not involved in set net related duties in the estuary. Specificoperation and safety procedures on the e1ectroshocking gear are outlined inAppendix V. Eulachon intercepted by e1ectroshocking gear wi 11 not beassumed spawning at a catch location unless all of the following criteriaare met:
-17-
----,:...::._---

j l. Fish are freely expelling eggs or milt.,
,.\.,
2. Fish are in vigorous free-swimming condition..' ~
I
3. Twenty or more fish are caught in the initial or subsequentsite sampling effort which meet criteria 1 through 2 above.
1.J...
One hundred eulachon will be sampled daily from the electroshockingcatchto determine sex ratio. Morphological characteristics (and if necessaryinternal examination) will be used to determine sex. Ten age (two otolithsper fish), weight (0.1g) and length (snout to fork of tail) samples per sexwill aJso be collected daily. Otolith collection procedures will bedemonstrated in the field by the AA Project Leader or his assistant.
Set netting, AWL and electroshocking data will be recorded as defined onthe appropriate forms (III Data Procedures) and transferred to theAnchorage office every two weeks.
Bering Cisco
Operation Period:
Investigations will be conducted at Susitna, Yentna and Sunshine stationsin conjuction with scheduled adult salmon sampling activities.Additionally at Sunshine Station, the lower east bank fishwheel will beoperated to 26 September; 14 days beyond the close of the sonar and taggingoperation.
Timing of mainstem spawning surveys on Bering Cisco will be identical tothat defined in the previous section titled: Mainstem Surveys
Methods:
Mainstem sampling stations will use fishwheels to intercept adult upstreammi grant Beri ng Ci sco. Catches wi 11 be recorded on the Daily Fi shwhee1
Catch Log form (III Data Procedures). Twenty age (scale) and length
-18-

(tip-of-snout to fork-of-tail) samples will be collected daily at eachmainstem station.
Mainstem spawning areas will be surveyed by the three survey crews outlinedin the previous section under Mainstem Surveys in this Procedures Manual .These crews will identify mainstem Bering Cisco spawning areas by thecri teri a and methodology used for adult salmon in the above' referencedsection of this manual.
Radio Tagging
Operation Dates and Survey Reach:
Field investigations will beginapproximately. Attention will ,focus(RM 98) and Devil Canyon (RM 150).
16 June and terminate 1 October,in the river reach between Talkeetna
Methods:
Project personnel will radio tag approximately 48 adult salmon (16 chlnook,16 coho, and 16 chum salmon) and monitor their migrational movement tocompletion of spawning. Radio tagging will be conducted at both Talkeetnaand Curry stations with equal emphasis on each location. Fish will beintercepted by fishwheels operating at these as defined below:
Species Number TaggedTalkeetna Station Curry Station
TaggingPeriod
ChinookChumCoho
8
8
8
-19-
8
8
8
15 June - 15 July15 July - 7 Sept.15 July - 7 Sept.

~~-~-~-~.~ ..~.--_.
1
IJ
~
I
. j.~
..
All tags used will be low frequency (40 MHz) and will have a lifeexpectency of 90 days or more, with a reception distance of not less thanone mile.
There will be no attempt to bias selection of radio fish other than no fishwill be tagged with a transmitter that has been tagged previously witheither Floy or Petersen disc tag or is' lethargic or shows any externallnJury. Once a fish has been selected it will be transferred to a watertight box containing a fish anesthetic. The fish will be ready to tagwithin about two minutes .
The cigar-shaped radio transmitter to be used is next tested for signalreception in water. Then, it is coated with water soluble glycerin, andwith the help of plexiglass tubes, is slid through the mouth and esophagusinto the stomach. Prior to release of the fish, the transmitter is testedagain. The salmon is gently transferred to the river near shore, where itis held until it forcefully swims away. Preliminary tracking will commencefrom a boat.
When several fish have been tagged and released, periodic boat trips andflights will commence to document their new locations. In this study, boattracking will occur at least three times weekly. Two tracking flights willalso be made per week (weather permitting), with fixed wing aircraft and/orhelicopters. Both manual and scanning radio receivers will be used. Fromthe radio tracking equipped boat, fish will be pinpointed to ±20 feet oftheir actual locations.
Data will be recorded on the appropriate froms (III Data Procedures) andwill be forwarded to the Anchorage office every two weeks.
Stock Separation
Operation Dates:
-20-

Field operations will begin 1 July and terminate 7 September. Scalereading data analysis performed by the Department's Stock SeparationSection will begin 1 October and finish 1 December, approximately.
Methods:
Forty sockeye salmon will be sampled for age, length and sex daily atF.R.E.D. Division weirs at Byers (Chulitna River) and Larson (Talkeetna)lakes for a targeted sample size of 500 per weir site (III DataProcedures). Age sampl ing will entail removal of two scales from theJlpreferred zonel/ of each fi sh; 1ength measurements wi 11 be taken from mi deye to fork-of-ta"il; sex determination will be ascertained by morphologicalevaluation.
As previously outlined in this Procedures Manual, Talkeetna and Currystations staff will collect an age, length and sex sample from all sockeyesalmon intercepted by the fishwheels operating at these sites.
Samples collected at Larson Lake, Byers Lake, Talkeetna Station, and CurryStations will be analyzed by the Department's Stock Separation Sectionusing standard separability techniques.
-21-

B. RESIDENT AND JUVENILE ANADROMOUS FISHERIES STUDIES
-
I~
-~
Study Description and Rationale
The proposed work plan for the 1982-83 fiscal year provided a basic outlineof the field components proposed for the upcoming field season. Much ofthis work is a continuation of the program implemented in 1981 and iscurrently continuing through the 1982 season. This section will furtherdescribe the purpose of these studies and the rationale behind the approachproposed for this coming field season.
Study Design by Objective
The overall scope of the studies relative to the major objectives for theResident and Juvenile addended program are:
1. Define the seasonal distribution and relative abundance ofresident and juvenile anadromous fish and estimate thecomparative value of the habitats utilized by each group.
2. Characterize the seasonal habitat requirements of selectedjuvenile anadromous and resident species within the study area.
The following section addresses sub-objectives and the experimental designcomponent necessary to comprete the general objectives outlined. Inaddition, the field study is outlined along with the analytical approach tobe used in the preparation of reports.
Sub-objectives and Study Design
The reach of river between the Chulitna confluence and Devil Canyon and thereach between the Chulitna confluence and Cook Inlet estuary willexperi ence seasonal di scharge, water qual ity, and temperature changes todifferent degrees as the hydro-electric project is developed. However, indetermining the baseline resources of these lower reaches of the river the
-22-

,.....
'F""I
same basic approach for the distribution and abundance surveys will be usedas similar questions are being addre~sed.
The objectives identified are broken down into specific sub-objectives. Incases where parti cul ar questi ons are bei ng addressed, the studysub-objective is further broken down into questions. In those instanceswhen the primary goal is to collect basel ine data to determine the resourcebase that may be impacted by the project, the study can be i dentifi edtotally within the sub-objective. Each of the sub-objectives areidentified and discussed by number.
1. Quantify the relative use of the different major habitat typesover a seasonal basis in the reaches of river below Devil Canyonand the Chulitna confluence.
2. Determine, and estimate their relative importance of the factorswhich influence the use of these habitat locations and thedistribution of fish within these habitats.
Within the framework of sub-objectives 1 and 2, the following questionswill be addressed:
Is the distribution and abundance of the selected fish speciesaffected by natural occurring variations in the hydraulic
• conditions within each of these habitats?
Are factors other than hydraulics dominating the distribution andabundance of fish at these sites?
To address these questions the following study plan will be employed.
Each of the habitat locations that are associated with a slough ortributary can be divided into several hydraulic zones. These zones can beidentified by direct observation into the following categories:
-23-
•

11. Areas that have. direct flow from tributaries, ground water, or
rna i nstem overt"l ow, with no i nfl uence of backwater from themainstem Susitna.
2. Areas that are backwater conditions created by elevated stages ofthe mainstem Susitna. At certain tributary mouths and during lowdi scharges of the Susitna, these areas wi 11 be very 1imited ornon-existent.
The relative value of each of these zones will be measured by collection offield data that will provide estimates of relative populations of juvenileor resident fish within' these zones over a limited time period. Theexperimental design includes the following assumptions; one, thatpopulations of resident and juvenile fish using these habitats aretransient populations over a seasonal period but remain .co,nstant for theduration of a single sampling period; and two, that the sampling methodsemployed are equally effective among the zones and refl ect the rel ativeabundance of the species within the zones.
3. Areas that are characterized astributary/slough where surface velocityby the mainstem flow.
mixing zones of theis principally influenced
-
To test if the fish distribution and abundance are affected by hydraul icconditions rather than other variables of the habitat, other measurementswill be recorded at each site and the observations and opinions of thefield biologists will be used to determine the validity of the experimentaldesign. Other variables to be recorded include temperature, turbidity,substrate, cover, dissolved oxygen, and conductivity. The techniques to beemployed in the sampling procedure are outlined in the field samplingsections for the distribution study, and the electrofishing study.
If differences in abundance of the sel ected speci es are measured betweenthese zones and it appears that other variables are not the factorsinfluencing this distribution, data collected in cooperation with AquaticHabitat personnel can relate the changes in surface area of the different
-24-
I1
""'"
iI-I
J.,
--
zones to changes in the discharges of the mainstem Susitna. The surfa~e
area changes will be mapped on high resolution aerial photographs duringeach sampling period. In addition, staff gages at the upper hydraulic zonewill provide an indication of the discharge in the slough or tributary atdifferent mainstem flows. Finally, readings from a staff gauge at themouth of the slough or tributary can be correlated to mainstem discharge toprovide information as to the relative depth at this location.
Analysls of the data will include a narrative description of the factorsthat appear to i nfl uence the di stri buti on and abundance of juvenil e andresident fish during different seasonal periods at each of the habitatlocations. Within a sampling location, the relative catch per unit effort(CPUE) can be evaluated statistically to determine if significantdifferences occur between the sampling zones, at any given time period.The data will be converted to relative terms, rather than absolute numbers,to compare the relative values of the different zones during differentsampling periods. Finally, the comparative value of the different sitescan be evaluated on a seasonal basis by evaluation of the overall CPUErates for each site. The surface a~e~ of the different habitat componentsat each location will be mapped and can be used to weight the CPUE data todetermine the overall importance of each of the sites. Deta i 1s of dataanalysis will be included in the data analysis section.
.-3 • Examine a wider range of habitats, not previously studied in both
the upper river (Above the Chulitna confluence) and in the lowerriver.
.....The distribution and abundance of resident and juvenile fish on the SusitnaRiver has had only one year of intensive investigation (1981). In order toinsure that an important component of the fisheries population has not beenoverlooked, a portion of the field program will look at habitats notpreviously sampled to determine if they contain significant populations offish. Emphasis will be placed on examining those areas that can beaffected by relatively small changes in streamflow rates and levels,temperatures, or water quality parameters and that have, in the opinion ofthe field biologist, potential for significant fisheries populations or
-25-

I-
1
!
JpJo;.
-
habitat. Areas identified as having significant biological potential andhave the potential for being affected by changes in hydrology, temperatureor water qual ity, will be identified for further detailed investigations.Sampling these components will involve the use of opportunistic gear by thedistribution study team and the use of the boat electroshocker.
All of the crews will record observations made while completing theassigned activities and provide both narrative and quantitative data wherepossible to support observations as to the relative importance of certainareas and the sensitivity of these areas to environmental changes.
4. Determine the rate of development of eggs during incubation, andthe timing of emergence and outmigration of juvenile salmon andresident species as a function of environmental conditions.
Thi s program is desi gned to provi de a data base that can be used toevaluate the effect of changes in the environment after the project comeson line, to these stages in the life cycle of the salmon.
After egg deposition, the relative survival rate of juvenile salmon isdetermined by the habitat conditions, such as temperature and water qualitythat are maintained in the redd. Cha~ges in these conditions may increasemortal ity or alter the time of emergence so that juvenile salmon willexperience hostile conditions upon emergence and have significantly lowerrates of survival.
The rate of development of juvenile salmon under ambient conditions will bestudi ed in situ, whil e monitori ng simultaneously the envi ronmenta1conditions of these redds through the winter until emergence.
The outmigration timing of the juvenile salmon species in addition to thedownstream migration timing of resident juvenile species will be made byuse of a smolt trap operated above the Chulitna confluence. The smolt trapwill provide basic biological data to determine the relative condition andstage of development of the species collected.
-26-

·:
r~
The program outlined will provide answers to the following question:
What are the baseline conditions with regard to timing andcondition of outmigrating juvenile salmon and what are thebasel ine rates of development and emergence times of the earlylife stages of Susitna River salmon?
In conjunction with temperature data acquisition efforts and field studiesof the Aquatic Habitat program, the following question can be addressed:
How do these development rates, emergence times, and outmigrationcorrelate with the natural changes in environmental conditionsmeasured?
The subsequent analysis of this data should provide some insight as to thevariability of the biological development and outmigrant behavior among thedifferent species and within a given species.
•
-
.--
This data base can subsequently be used to evaluate changes in developmentthat the various species and life stages may display as a result of changesin the thermal conditions associated with the dam.
5. Determine the di stri bution and abundance of fisheri es resourceswithin the boundaries of the proposed impoundments.
The flooding of clearwater stream reaches, the mainstem Susitna, and nearbylakes will dramatically alter the aquatic environment that presentlysupports populations of resident fish. In order to assess the potentialloss of this resource and to determine the mitigation activities necessary,the resource to be affected requires documentation to determine the natureand extent of these populations and their dependence on particular habitatconditions.
An active tag and recapture program was initiated during the 1981 fieldseason to provide an inventory of flsh populations within the impoundmentzone. This coming field season will provide an opportunity to more
-27-

-::_,_~ i-----~·----=-,'=""--~:;;,.-"~-c,~~--:~...;...;;..:.~-;==.,;,.~
,J,.
accurately estimate these popul ations, and to examine in further detail,the very large potential habitat within the impoundment zone that did notreceive extensive study last year. The lower section of the clear watertributaries will be sampled again for tag recovery. The mainstem Susitnawhich was not sampled during the previous year, and at least one lake thatwi 11 be inundated by the impoundment, (1 ocally named Sally Lake) wi 11 be'sampled in more detail with the goal of obtaining a population estimate.Sampl i ng by use of gi 11 nets or Fyke nets to provi de adequate sampl es fortag and recapture estimates, or by the use of sonar equipment for surveycounts will be employed.
In general, tag recoveries should provide an estimate of intra-systemmigration for the Arctic grayling tagged last year and some suggestion asto the constancy of the populations involved in the clear water tributaryareas previously sampled.
To determine whether the reach of tributary immediately above theimpoundment zone will contain habitat similar to the habitat at the mouthsof the clear water tributaries, under present conditions, joint RJ and AHpersonnel will provide brief surveys of this reach of the tributaries toestimate relative abundance of fish present and to make compartiveevaluations of the habitat that will be present after the impoundment isformed. The presence of barriers to fish passage or the inundation ofexisting barri~rs will be noted.
--...,.
During the winter season, the distribution and migration of grayling willbe monitored by use of radio telemetry. Previous efforts at overwintersampling have produced very limited results because of difficult samplingconditions. Fish tagged during the fall will be monitored through thewinter season in order to determi ne overwi nteri ng areas, and tosubsequently follow spring migration and to identify spawning areas.Current. i nformati on suggests that the fi sh spawn during ice out in thespring necessitating such techniques to identify key spawning areas.
This informatfon should provide an indication of the dependency of thegrayling populations on the mainstem Susitna for overwintering, and provide
-28-
an indication of how critical this habitat is for the spawning and survivalof the tributary populations.
Data analysis w"ill consist of estimation of populations in the tributaryreaches, and evaluation of intrasystem movements using recaptured and radiotagged fish. Spawning areas will be identified and the basic biologicaldata for all species collected will be summarized. New components of thebiological community or finding different from the 1981 studies will beidentified •
. i~ 6. Determine the relative distribution of the invertebrate
populations and the fish food preference for selected species.
-
.--
Populations of juvenile chinook, coho, sockeye and chum salmon have beensampled in various slough habitats in the Susitna River. Because of thepotential for dewatering these habitats and restricting the rearing habitatfor these species, a preliminary study will be conducted to determine therelative distribution of the invertebrate communities and to determinewhich components of these communities are important for juvenile fish.
Of particular interest is the community occupying slow moving waters in theslough habitats in the spring that provide a food base for chum salmonduring their short fresh water rearing cycle. The invertebrate populationsthat exist during the open water season that provide a food base for theother salmon juveniles will also be studied. Because changes in the localhydraulic conditions of these habitats may eliminate the food source, orthe fish may emerge earlier from the gravel because of elevated winterwater temperatures, the avaiTability and the relative importance of thefood source for these species will provide insight into the survival of thespecies under post project conditions. In addition, examination ofmainstem and tributary habitat should provide some information with regardto the overall distribution of these invertebrate species and an improvedunderstanding of the poss"ible distribution of invertebrates of the mainstemunder post project conditions.
-29-

The major goals of this study are to provide an initial preliminaryexamination of the food base, its relative distribution, and theselectivity of chinook, coho, and chum salmon juveniles with regard tofeeding habits. Depending upon the results of this initial investigation,the study will be directed during the 1983 field season to determinequantitive estimates of in the food base used by these species and toexamine if the flow regimes and water quality under post·project conditionswill provide an alternative food supply or possible enhancement of therearing potential of the system.
The study will be concentrated in the river reach above the Chul itnaconfluence with invertebrate samples taken from representative sloughswhich have populations of rearing fish. Tributaries and mainstem siteswill also be sampled to provide a comparative base for understanding thedistribution of these populations.
The data will be analyzed by examination of the array of food itemsavailable versus those consumed as determined by stomach content analysis.This will be performed for each of the general habitat types. In additionto the invertebrate populations, three of the different habitat types willbe compared.
Summary of Objectives
The previous discussion has outlined selected sub-objectives that theResident and Juvenile Anadromous studies will be addressing. In additionto the activities listed, support will be provided to the Aquatic Habitatand Instream Flow programs and the Adult Anadromous programs. As much ofthe data coll ected from all three programs is necessary for each programsegment to address the objectives established, both exchange of informationand assistance on the various overlapping components of the study will beconducted throughout the summer and during preparation of the reports. Thedetails of the analytical components will be addressed in the data analysissection of this procedure manual.
Fish Distribution Study
-30-

,""=--=~_""""'~"_"',,,,"''.6'''~''''''''""~,===~~~=zi "-",,,,--'~
,'j
... '.;~
'!"'"
iI
r
Methods:
The methods described reflect a change in emphasis from the 1981-82sampling program from collection of broad based distribution and biologicaldata of resident and juvenile anadromous fisheries, to providing a moredetailed study of the populations and factors effecting their distributionat a limited number of sites.
Critical habitat examined in the upper and lower river areas for juvenileand resident fisheries include the mouths of selected tributaries, sideslough areas, and limited mainstem sites. Most frequently, these sites areclassified rather arbitrarily as there· is often a slough associated withthe mouth of a clear water tributary with the mainstem Susitna present atthe mouth of the sloughs. At higher water levels the slough often hasmainstem Susitna water flowing through the upper end and the sloughresembles a side channel of the mainstem Susitna.
Because of the transient nature of many of the populations of resident andjuvenile fish in the Susitna river, catch rates at many of these sitesreflect migratory behavior of the population present at any point in time.In certain areas however, the population may have recently emerged fromspawning beds near the sites and are rearing near their natal areas.
In order to evaluate the relative importance of the sites, the hydraulicconditions present at a sampling site have been classified into zones. Thezones reflect areas of different surface velocity or orgination of watersource in the case of tributaries. The zones are then sampledindependently so that comparisions can be made in the utilization andimportance of each of the zones as well as to cha racteri ze the phys i ca1
changes in surface area, velocity, substrate, and other water qualityparameters of each of the zones over time. These changes can subsequentlybe compared to the changes in discharge, water temperature, and waterquality of the mainstem Susitna.
Each of the sites have been classified into separate zones that areillustrated in figure 1 as a typical example. The two separate
-31-
-
,.:.:
illustrations depict a theoretical change in the spatial distribution of
the zones over time, and can be correlated with corresponding changes in
discharge, of the mainstem Susitna, tributary discharge, or ground water
discharge to the sites. The number of zones will vary at each site,
depending on the complexitity of the hydraul ic conditions that occur at
each site.
-32-

-'"=_"'-e·~='''=.=o:::...;..;.-·
i-P,-~~
FLOW
ZONE II • BACKWATER AREA
ZONE I • FREE FLOWING WATER
ZONE III • MIXING AREA
~ - DIRECTION OF FLOW
II
1,I I
11
11
I1
I1
1I
1,1
LOW FLOW
~ II
!'l""
I!
T1
r.1
11"'"II
JFigure 1. Hypothetical map of hydraul ic zones of a typical 5usitna River
slough at high and low mainstem river discharge.
-33-

i
~
Fisheries Data Collection Techniques:
Set gear to be used at each of the sites include the following:
1. Trotline2~ Five to 10 minnow traps.
The specific methods used in deploying this gear, are outlined in thetechnical appendix.
Additional opportunistic gear will be employed on a site by site basis.These will include beach seines, back pack electrofishing gear, set anddrift gill nets, fish traps, and hook and line sampling. The deployment ofthis gear is also outlined in the technical appendix.
The use of the opportunistic gear will depend upon site conditions and willbe deployed to make observations as to the relative distribution of speciesand age classes of fish not collected by the two methods.
;"/
r
:'i"II
Standard biological measurements of the species will be made includingscale samples from representative subsamples of the collected species. Alladult resident species will be tagged and released, when possible, andrecaptured tagged fish will be recorded. Details of the data to berecorded and field methods are included in the Data Procedures and thetechnical appendix.
Physical Habitat Measurements:
At each site, the surface area of each of the hydraul ic zones will bedelineated with the date and time noted. Delineations will be on highresolution aerial photographs or maps of the area. Time and date data willbe used later to determine the discharge of the mainstem of the reach ofriver influencing the hydraulic conditions at the respective site.
Staff gages installed at each site will be recorded during each visit.Details on staff gage installation and data analysis are addressed in the
-34-

~I
I
r
r
r;1
rI
.....Ii
Aquatic Habitat procedures manual. These data will ultimately reflect the
distribution of velocities of the water column in each zone.
Also the velocities of each zone that represent the areas fished by the
minnow traps are estimated by a series of point measurements of velocities
with a vel oc ity meter. The areas be i ng fi shed by the traps are
occas iona llyexami ned by fl uorescene dye placed in the traps todetermi ne
the dispersion of the scent of the bait in the traps. A single
representative velocity is recorded for all of the replicate samples with
in each zone. Velocity measurements are recorded in a·ccordance within the
procedures outlined in the Aquatic Habitat procedures manual.
The dominant substrate within each zone that is associated with the area
fi shed by the minnow traps is recorded. If the substrate is compactly
embedded in finer material ,it is noted on the data form. Other comments on
substrate are included in the field data.
The turbidity is also measured in the area being fished by the minnow
traps. Other water qual ity parameters that are recorded for each zone
include dissolved oxygen, pH, conductivity, air and water temperature.
Details of these techniques are outlined in the Aquatic Habitat procedures
manual.
The zones are also characterized as to the relative amount of cover present
and type. The micro-habitat within the zones is to be sampled similarly
among the di fferent zones. When thi sis not poss i b1e he<:ause of the
presence or absence of different types of micro-habitat, such as cover, the
differences between the zones are noted in the fi e1d notes.
Field Notes:
Because of the wi de di versity in characteri sti cs between the different
habitat locations being sampled, much of the interpretation of the data and
important information is not subject to standardized data collection
procedures. Therefore, the observations of the biologists and the
formul ati on of hypothes i s as to the factors i nfl uenci ng the di stri bution
-35-
Detailed daily field notes to be kept will address at a minimum, thefo 11 owi ng items:
and abundance of the important fish species in these areas will beperformed by the field biologists conducting the surveys.
'j
,~
J.II
I.j
.~I
, ,I
!,
tI
rr
1.
2.
3.
Hydraulic conditions.
This will include preparation of a narrative that describes thedifferent zones and factors that affect the hydraulic conditionsand their distribution within each site. Changes betweensampling periods and other phenomena such as changes in channelmorphology caused by high water, or icing conditions will also berecorded. A description as to how the changes in discharge ofthe mainstem have affected the hydraulics of a site will also benoted in general terms. Problems with the data base recorded orkeys to assist in its interpertation will also be noted.
Temperature, turbidity, and miscellaneous physical data.
This section will discuss any needed information in interpretingthe temperature data, turbi dity data, and cover or substratedescriptions un the data sheets. Factors such as observedupwell ing of ground water, unusual readings or other conditionsthat depart from the expected and hypotheses as to the cause ofthe anomalies will be described. Any other unusual physicalconditions that may affect the distribution and abundance of thefisheries in the area will be included.
Biology.
This section will include any observations that are pertinent tothe objectives of this study with regard to the fisheries.Observed fish, that were not collected and their distributionwithin the zones and any additional intereptation required forthe collected specimens will be included. The narrative should
-36-

---"'-e-""·--··C --
:.,..-;
TI
'i'
I
r'rI
also include departures in distribution from previous samplingperiods and new phemomena observed that are of particularinterest to the objectives of the study. Hypothesis as to thefactors that are, in the opinion of the field biologist,
influencing the abundance and distribution of the fisherieswithin the area will be described.
The notes will be recorded so a continual journal of the events occuring ata site through the open water season can be fall owed from one sampl i ngperiod to another. The response of thefi sheri es and of the physicalconditi on withi n each site can be followed over time and can then bedescribed with regard to hydraulic changes that differ from sampling periodto sampling period.
Any other field notes that will assist in the interpetation of the data may
also be recorded during the sampling periods. These field notes willprovide the basis for preparation of the final reports on the fisheries ofthese areas and the response of the fisheries to changes in habitat thatoccur during the course of the field season.
Study Locations:
Tentative locations of the 1982/83 field season sampling program during theopen water period are outlined on the following map of the Susitna river.(Figures 2 - 4). These sites have been chosen to reflect the followingconditions.
1. Areas that will be affected by changes in discharge of themainstem Susitna.
r
2. Sites identified from previous studies to have significantpopulations of resident and juvenile anadromous species.
-37-

r
5C.AlE
" 0 5 ...tl~SE3E:C=:JE33CEt=:L:==r=========:::J1
KEY
+ Fleh DleUlbution Sit.
N
t
Figure 2. Susitna River Resident and ,Juvenile Anadromous fish sampling
sites (Deshka River to Sunshine Creek), 1982.
-38-

r
!"""I
I
r[
N
t
KEY
+ Fhh Olalrlbullon Site
SC ALE
5 0 5 Htl(SF··=r:~-r':~"""1..C:=:.====::.=.=:....:.::.--,:J
Figure 3. Susitna River Resident and Juvenile Anadromous fish sampling
sites (Birch Creek Slough to Gold Creek), 1982.
-39-

KEY
+ Floh OIo',lbullon Sile
"F'
SCA.LE1 5 0 5 HIL.E5I E3 F3 E3 I
c!
'r-
IFigure 4. Susitna River Resident and Juvenile Anadromous fish sampling
sites (Sherman to Portage Creek), 1982
-40-

rI
r.1
rr,
3. Access to areas will not create severe logistic problems andlimit the overall scope of the studies.
4. Sites selected represent a cross section of critical habitatavailable to resident and juvenile anadromous fish of the SusitnaRiver.
During the course of the field season, sites that have been selected may bealtered or new ones added if such action will help in meeting the overallobjectives of this investigation.
During the winter season, fish distrib~tion patterns change significantly.The study sites planned for the coming winter will be more restrictive innumber with more intensive investigations conducted as to absolutepopulations using certain areas. These sites will be based on observationsof the distribution this fall and upon. evaluation of previous years winterdata. These sites will also meet the previously listed criteria.
Schedule of Activities and Frequency of Sampling:
Each of the habitat locations being sampled will be revisted on twice amonth schedule, commencing during the first week in June, up untilfreeze-up. This will provide about eight to 10 sampling periods for eachsite. During the ice covered period, the sampling program will be limitedto a smaller number of sites and a once per month schedule employed.Intensive sampling with the use of a variety of techniques will be employedduring this period.
Processing of data will be an ong0ing activity during the sampling periodwith data analysis, summarization, and report preparation commencingimmediately after freeze-up. Field trip reports will be completedimmediately after each sampling trip and will be limited to highlightingthe findings of each sampling trip. Data forms will be reviewed andsubmitted to the data processing unit immediately upon completion of eachsampl ing trip for entry into the project computer data base. The draftreport will be completed by the 30th of January 1983.
-41-

[-_...
Contingencies or Alternatives:
During the course of the summer field program, alternative methods forsampling or changes in study sites will be employed when it has beendetermined that the overall objectives of the fish distribution study canbe best met through modifi cati ons of the exi sti ng program. On occasion,limited, one time experiments will be performed to test the limitations ofsampling methods, or hypotheses as to the validity of assumptions regardingthe importance of selected factors affecting the distribution and abundanceof species. In addition, examination of additional selected sites will beperformed on a limited basis when answers to specific questions regardinghow important a s.ite is for a species or other information regarding theoverall objectives can be obtained with minimal additional effort.
Examples of such alternative studies include determination of, the catchrate of minnow traps over a 24 hour set period; examination of thedistribution of rearing coho or sockeye in the Gash Creek - Lake area, andnoting and mapping the wetted area and dewatering of habitat locationsbeyond those included in the sampling program. Such incidental studieswill be used to provide additional information for addressing the overallobjectives of the planned investigation.
Electrofishing and Tagging Surveys
Three electrofishing boats will be utilized to conduct electrofishing onthe Susitna River, between Cook Inlet and Devil Canyon from ice out tofreeze-up, 1982.
During cooperative studies among the various project segments, theelectrofishing boats will each be assigned to a defined reach of the river.Two or three Aquatic Hab,tat, Resident Juvenile and Adult Anadromousbiologists will be assigned to each electrofishing crew, with possibleexchanging of personnel. Field stations will be located at Yentna,Sunshine, Talkeetna, and Gold Creek.
-42-

.,
.F'f\l
I
"
"""III
r
Electrofishing will also be used to collect adult resident fish in thelower Susitna River during August and September for implantation of radiotags in conjunction with the Radio Telemetry Study .
Methods:
Using the boat mounted electroshocker, adult resident fish and juvenirefish will be systematically collected. Each specimen will be identified,measured for fork length, (or total length for juvenile salmon), tagged andthen released. The sex will be recorded and a scale sample will also becollected, for adult specimens.
Scales will be taken from a subsample of each species of resident andjuveni 1e anadromous fi sh caught duri ng each sampl i ng day. The subsampl ewill consist of the first 20 fish of eac~ species and 10 percent of thosefish of each species thereafter.
Field notes will be recorded daily to document factors which influence thedistribution and abundance of these species.
During 1981,1,550 adult resident fish were tagged with Floy anchor anddisk dangler tags between Cook Inlet and Devil Canyon. In addition, 713Bering cisco were also tagged with Floy anchor tags.
During 1982 emphasis will be placed on tagging more fish than was tagged in1981. This will be accomplished primarily by the addition, of three crewsusing electrofishing boats to capture more fish and put out a greaternumber of tags.
Tagging of adult resident fish will be accomplished by the following means:
1. Resident and Juvenile Anadromous fish distribution studies.2. Study team using electroshocking boats.3. Catches by fishwheel operations.
-43-
I"'"l~ ..~, o~~·~"""~_"...~==
Two types of tags will be utilized, Floy anchor and disk dangler. Residentadult speci es to be Floy anchor tagged are humpback and round whitefi sh,longnose suckers, rainbow trout, Arctic grayling, and Dolly Varden. Burbotwill be disk dangler or Floy anchor tagged.
All adult resident fish that appear to have successfully recovered from theeffects of capture and are longer than a minimum-' size will be tagged.Minimum fork length for adult resident fish to be Floy tagged will be150 mm. The m-inimull1 total length of burbot to be disk dangler or Floytagged will be 225 mm.
Floy anchor tags wi 11 be inserted by a Floy taggi ng gun into the adultresident fish between the lateral line and the posterior ray of the dorsalfin. Tagging of burbot will be accomplished with a disk dangler type tagus i ng methods descri bed by Mauney, (1965) and Rounsefe11 , (1963).Insertion of the disk dangler tag will be between the dorsal fin and thelateral line in the posterior 20 percent of the burbot. Abbreviatedinstructions for the attaching the disc dangler are in the Appendix IV .
•Recovery of tags placed on adult resident fish will be accomplished by thefo 11 owi ng means:
1. Resident and Juvenile Anadromous distribution studies.2. Electrofishing boats.3. The angling public will be requested to return recovered tags or
report the tag number to Fish and Game with information regardingcatch date, location, and if the fish was released. The publicwill be informed of the tagging program by: 1) news released tothe media. 2) RJ Susitna Hydro staff. 3) posters placed inlocations frequented by anglers.
4. Adult Anadromous fishwheel operations.
Study Locations:
-44-

....
-
-
Areas to be electrofished will be field selected in the mainstem SusitnaRiver and its side channels and sloughs between Cook Inlet to Devil Canyonwhen the conductivity is sufficient.
In addition to the selected sites sampled, specific locations will besampled once every two weeks by the Resident Juvenile and Aquatic Habitat,electrofishing crews. During August 1 to September 15, all three crewswill electrofish at these sites which include the designated habitatlocations of the fish distribution studies. Sampling effort at each of thehabitat location should not exceed one hour total time including handlingof catch and data recording.
Schedule of Activities and Frequency of Sampling:
. The field season will be broken into three time periods during which- various project priorities such as resident fish or adult anadromous fish
will be addressed. These three time periods will be ice out to July 31,August 1 to September 15, and September 16 to freeze up. During both theice out to July 31 and September 16 to freeze up time periods, theindividual project boats will be operated at the discretion of each oftheir respective project's leaders. From August 1 to September 15 allthree boats and their crews will conduct slough and mainstem Susitna Riveranadromous spawning distribution studies.
Radio Telemetry Studies
Five rainbow trout and five burbot were each internally implanted with amodel 4500L Smith Root low frequency radio transmitter in October, 1981 foran experimental radio telemetry program on the Susitna River.
The purpose of the program was to determi ne if resi dent fi sh coul d besuccessfully radi 0 tagged i nterna lly and monitored on the Sus itna Ri verover the winter of 1981-82. The results from the data of this programprovided a basis for determining the feasibility of expanding the programin 1982-83.
-45-
,
r,I
rIl
,The data from this experimental radio telemetry program suggests expansionof the radio telemetry program in 1982-83 will be valuable to observeintersystem movement and establish overwintering habitat.
Methods:
During 1982-83, 80 radio tags will be deployed. Forty radio tags will beimplanted in Arctic grayling, rainbow trout, and burbot between Talkeetnaand Devil Canyon, and 40 in Arctic grayling captured in the proposedimpoundment area. Implantation of the 80 radio tags will utilize the sametechniques and procedures that were used in 1981.
Study Locations:
The study sites will be between the Chulitna confluence and Devil Canyon orthe reach of river above the Devil Canyon dam site or tributaries withinthese areas.
Tagging crews will radio tag healthy adult resident species collected fromwithin the mainstem or tributaries. Actual selection of tagging sites willbe based on the other distributional data collected dur'ing 1981 and 1982field seasons.
Schedule of Activities and Frequency of Sampling:
The fish in the Susitna River below Devil Canyon will be captured byelectrofishing during August and September and implanted with model 4500LSmith Root radio tags.
The 40 Arctic grayling to be radio tagged in the impoundment will becaptured by hook and line during August and September. The radio tags tobe implanted in these fish will have a tag life expenctancy of nine months.
Monitoring of the radio tagged fish to establish movement patterns will beconducted every ten to 30 days by boat, airpiane or snowmobile, until thetag batteries are discharged.
-46-
.._--_.~---'---~~--

Contingencies and Alternatives:
Beginning in January, attempts will be made to recapture the radio taggedfish with gill nets and trotlines. This will be done in order to helplocate overwintering habitats of resident fish and to observe and definethese habitats.
Experimental use of hoop nets will be employed to determine if they can beused to collect adult re~idents during the winter and summer periods.
Juvenile Incubation, Emergence, and Outmigration Studies
Methods:
The methods described outline the techniques to be used for the smolt trapand winter incubation and emergence studies only. Data collected from thefish distribution study and electrofishing surveys pertinent to thisobjective will be incorporated into the final reports.
The studies will address all juvenile anadromous species and selectjuvenile resident species occurring in the reach of river above theChulitna confluence, with the main emphasis on the anadromous salmonspecies and resident species that spawn in habitats associated with themainstem.
The study will be divided into two components; the outmigrant study duringthe open water period, and the incubation and emergence study which will beconducted during the winter season of 1982/83. Separate reports will beprepared which address these two elements.
Outmigration will be sampled by a 4.5 foot wide inclined plane mobile smolttrap, located in the mainstem Susitna near river mile 103. The trap willbe begin operation on the 18th of June and will continue operation untilfreeze up or river ice conditions prevent further operation. Operationwill resume in the spring of 1983 upon breakup. The trap is designed tooperate at variable depths up to a maximum of four feet. Depth will be set
-47-
. .~ .

rI
by field experimentation. Placemen~ -in current and fishing position willalso be determined by field experiment. Schedule for time fished while inoperation will depend upon maintenance requirements.
Data collected at the traps will include species number, lengths, distancefrom shore, depth fished, fate of captured fish, representative ageclassification by scale samples, and time fished. Variables that will beused to measure outmigrant capture rates will include Gold Creek discharge,temperature, diurnal timing, turbidity, seasonal timing, horizontal andvertical distribution in the water column, and weather conditions. Datanot collected at the smolt trap will be obtained from the Aquatic Habitatprogram or other Su Hydro study group responsible for collection of theparticular data elements (R&M, USGS, etc.). Data will be analyzedprimarily by species and age class.
Incubation and emergence studies will be conducted in the upper riverhabitat locations that have had redd locations identified or spawningdetermined to occur by resident species. The study will involve obtaininglimited samples of developing eggs by redd pumping or excavation at .sttesbeing monitored for intragravel temperature by the Aquatic Habitat studygroup. Electrofishing gear will be used to sample emerging alevins in thespring. Thermal data and development information will be transferred tothe group conducting a laboratory incubation study with the intragraveltemperatures being transferred to this organization on a weekly basis if
• such a study is funded by the Alaska Power Authority.
Species to be included in the development will include sockeye, chum, andpink salmon if sufficient redds are located for a complete sampling programfor each species in areas that may be affected by the mainstem ortemperature changes. Data recorded will include numbers and percentages ofeggs or juveniles at various stages of development at each sampling site,for each species.
Habitat data will be collected in accordance with the proceduresestablished in the Aquatic Habitat procedures section. Data will includewater quality, surface and intragravel water temperatures, air
-48-

1-
""", ',I
temperatures, redd substrate compositi on, and surface vel ociti es at theredd locations.
Field trip reports will be prepared on a regular schedule and will be thebasis for data transfer from the field. Monthly summaries of significantfindings will be prepared from these reports. The draft of the finalreport wi 11 be prepared by January 30th, 1983 and wi 11 be 1imited to the
.open water sampling period. A final report on the incubation and emergencestudies will be submitted by June 30th, 1983, which will cover the winterfield sampling period.
Study Locations:
The study sites for the incubation and emergence study will be confined tothe reach of river above Talkeetna pending final information on the thermalregime below the Chulitna confluence area. The outmigrants moving throughthe mainstem will be sampled with the smolt trap placed in the lower areaof river near the Talkeetna Adult Anadromous sonar site(RM 103). A secondtrap may be installed in the spring of 1983, depepding upon the success ofthe trap during the 1982 field season.
Incubation and emergence studies will be conducted during the fall. andwinter of 1982 through the spring of 1983 at selected study sites in theupper river above the outmigrant trap site. These sites will be selectedbased upon observations of adult spawners during the summer of 1982.Tentative sites include sloughs 21, 11, 9, and 8A. Additional "sites willbe included as determined by adult usage.
Schedule of Activities:
The smolt trap will be installed by June 18, 1982 and will continue fishinguntil freeze ·up. It will again be in place immediately after breakup inthe spring of 1983 and continue through the 1983 field season. The trapwill be operated on a continuous schedule with intermediate down periodsfor personnel time schedules and for maintenance.
-49-

, ,,
-The incubati on and emergence survey wi 11 commence immedi ately after thespawning season and will continue through the winter of 1982/83. Samplingintervals of twice a month will be employed during the late winter period.
Contingencies and Alternatives:
Depending on the success of the smolt trap the alternatives that may beemployed, include, mid channel trawling for juvenile, Fyke netting at themouth of selected sloughs or tributaries, small smolt traps on the mouthsof tributaries, or modifications and improvements to the existing trap.Further, a juvenile mark recapture experimental program, designed to markpopulations from selected slough habitats for later recapture may also beinvestigated as to its feasibility. This would be designed to obtainestimates of local populations of fry as well as information on the overallsurvival and contribution of these habitats to the overall stock of theSusitna River.
Food Habits Study Invertebrate and Distribution Study
Methods:
Juvenile chum, coho, chinook and sockeye salmon wjll be collected by minnowtraps, beach seines, or electrofishing gear at selected sampling sites.These specimens will preserved in 10 percent formalin solution for furtheranalysis in the laboratory. Data to be collected include species, date ofcollection, length, and site location of collection. The stomachs will beremoved and contents analyzed for i nvertebra te taxa. Taxonomi cleve1 ofidentification will be generally to the family level but will be reducedfurther when possible.
Invertebrates will be collected by three methods. A drift net set will beoperated at each site for a time period which will be dependent on debrisloads and catch rates of drift invertebrates. Preferably, a set will bemade for 24 hours. Set locations will be in the approximate area ofjuvenile collection sites. Additionally, a "kick" screen sample ofinvertebrates will be collected at each site. These samples will cover a
-50-

i1....
!
-
sufficient segment of riffle habitat conditions to provide a representativemakeup of the available taxa and sufficient numbers to describe frequencyof numbers. Finally, a plankton tow net will be used to collectzooplankton at sites with low velocity water and that have rearing juvenilechum or sockeye salmon . All samples wi 11 be preserved with a 10 percentformalin solution.
Invertebrates will generally be identified to genus with the familyChironomidae grouped at the family level only. All of the samplescollected by different methods will be analyzed separately, obtainingfrequency for each taxa with respect to the overall invertebrate communitycomposition.
\
Study Locations:
Six study sites will be used for collection that represent three differentgeneral habitat types. These include clear water tributary sites, sloughsites, and mainstem sites.
Tentative site selection include sites only above the Chulitna confluence.Indian River, Fourth of July Creek, Slough 11, Slough 20, and mainstemsites in side channels near Slough 11 and Slough 20 are the preliminerysampling sites.
Schedule of Activities and Frequency of Sampling:
The sampling program will commence in mid-June for chum salmon and will beconcentrated in July and August for the other species. Sampling periodswill be scheduled twice each month beginning in July through September fora total of six sampling periods. It is anticipated that the number ofspecies collected will be sufficient for detailed analysis of coho andchinook juveniles only. Chum data will be from collection periods in Juneonly during the 1982 field season. During 1983, collection of chumjuveniles will begin at breakup and be on a we~kly interval until July 1,1983.
-51-

Sockeye and chum samples will be supplemented for analysis by collectionfrom the smolt trap installed in the lower river. These w"ill be used forcomparati ve purposes with site specifi c co11 ecti ons only. Twenty-fivejuveniles per sampling site per period will be collected during the July September time frame, for Chinook and coho juven"iles only. Fifty chums andup to 25 preserved sockeye juveniles per site will have their stomachcontents analyzed.
Contingencies and Alternatives:
Depending on the timing of sockeye and chum salmon emergence, these speciesmay not be included in the 1982 open water analysis and will be intensivelysampled only during the 1983 season. Plankton net tows will bediscontinued if not proven effective.
Depending on information on the distribution and abundance of juvenilesdetermined by the distribution study program, alternative sites may beselected, or changes in sampling frequency implemented. Limitedcollections during the winter season of juvenile coho and chinook may alsobe made for stomach content analysis if it is determined this will provideuseful information. If preliminary sampling during the winter periodindic~tes active feeding, the proposed study will extend through the wintermonths.
Obtaining sufficient coho and chinook juveniles to obtain the 25 persampling period may not be possible. If insufficent numbers are notcoll ected that may be di rectly comparable to the invertebrate sampl es,additional stomachs will be obtained from the outmigrant trap. These willbe evaluated separately from the samples collected near the sites of theinvertebrate collections and will be used for comparative purposes.
Impoundment Area Studies
The impoundment surveys during the ice free months (May to September) 1982will be conducted primarily on foot utilizing helicopter, river boat, andraft support. The impoundment crew will consist of two Resident Juvenile
-52-

biologists and two Aquatic Habitat biologists operatingcamp located at the mouth of Watana Creek (R.M. 194.1).sampling will be conducted on the mainstem Susitna assummer 1981 level of effort.
from fi xed baseRelatively more
compa red to the
Methods:
At the eight major tributary study locations, all sampling above theconfluence will be conducted by hook and line. At tributary mouths,mainstem sites, and lakes, gear fished will potentially include thefollowing; minnow traps, trout lines, variable mesh gillnets, seines,electroshockers, and hook and line. Set gear will be fished for 24 to 48hours. The "habitat location ll wi II incl ude the reach of each tributarystream studied from the area of the major clearwater influence with theSusitna River upstream to the point at the proposed impoundment elevation.
This "habitat location" will be divided into three distinct types based ontheir physical characteristics:
1. The confluence habitat encompasses that area of the Susitna Riverbelow the mouth of the tributary which is influenced by thetributary stream flow, the mixing area, and that area of thetributary which is influenced by the rise/fall of the SusitnaRiver.
2. The pool habitat is comprised of the large pools between thetributary mouth and the proposed impoundment elevation where thebulk of the resident fish have been observed to reside.
3. The riffle habitat will include those stretches of each tributarylocated between the major pool areas in the reach between thetributary mouth and the impoundment elevation. These areas arecomprised of smaller pools, rock eddies, riffles, and whitewater.
The mouth area is self explanatory. The pool areas will be designated bythe biologists in the field, permanently marked, recorded, and described.
-53-

I
I1
"""I
I
-
.....
The riffle areas will then be the stretches of stream between thedesignated pools.
Aerial photography of the entire habitat location correlated with mapcontours and elevations will then allow tributary river miles for each areato be calculated, and a scaled map to be drawn.
Pool habitat sites will be calculated on the basis of the total numberidentified. Riffles will be calculated as the total length of stream milesin which they are located.
Sampl i ng wi II be conducted (for populati on estimate purposes) on a setpercentage of pool and riffle areas, to be determined during the June trip.Succeeding trips will sample the same areas. The mouth area will besampled in its entirety.
A population estimate will be conducted on Sally Lake for designatedresident species in addition to collecting basic water quality data. Anyother small lakes in the proposed impoundment area will be test netted todetermine speci es present. Random sampl ing of the Cl arence Lake systemwill be conducted to determine if there is any movement of grayling betweenthe lake and lower Kosina Creek.
Study Locations:
The study 1ocati ons for the summer 1982 impoundment surveys incl ude: theeight major tributary streams (upstream) from their confluence with theSusitna River to the proposed level of impoundment; five mainstem siteslocated between the mouth of Deadman Creek (R.M. 186.7) and the mouth ofJay Creek (R.M. 208.5); and Sally Lake. As time permits, additional lakesboth inside and outside the proposed impoundment boundary will be assessed.
Schedule of Activities and Frequency of Sampling:
Surveys of the proposed impoundment area will be conducted in May, June,July, August and September 1982.
-54-
....~_ _ - _ - -- , .. ' -,--
-~...............~,-",-~--=-
---"- .~,~-.-- ..~~~~"~'-_=-= ,-'-c --
Sampl i ng wi 11 be conducted once a month at each of the study 1ocati ons.Sampling trips are scheduled for 15 days per month.
Contigencies or Alternatives:
An alternative method of sampling the tributary mouths and mainstemlocations utilizing a boat-mounted electroshocker is proposed for month ofJuly or August.
An alternative method of gathering the required data necessary for a viablepopulation estimate in the lakes utilizing a boat-mounted sonar device isalso being considered.
Based on the relative lack of success encountered utilizing standardsampling procedures during winter 1980-81 and 1981-82 studies, and the highdegree of success attained with winter 1981-82 radio telemetry studies,this program will be implemented in the impoundment area. Arctic graylingwill be the target species. Radio transmitter implantation will beconducted in September before freeze-up and radio tracking at periodicintervals will continue through May 1983. Details of radio telemetryprocedures are described in the radio telemetry section.
Level of Effort
A schemati c of the admi ni strative structure and manpower di stribution ofResident Juvenile personnel for fiscal 1983 is given in Figure 5. Thestaff of Resident Juvenile currently includes one Fisheries Biologist III,six Fisheries Biologist II's, and five Fisheries Biologist lIs. Threeadditional Fisheries Biologist I's are scheduled to be hired in July withfiscal 1983 funds. Personnel will be assigned as needed between thevarious sub-projects.
-55-

· i
Project LeaderPCN 4194
FBIlI, 12rrvn
Data Processing CoordinatorPCN 4204FBIl, 12II1II
Fish Distribution Food HabitsStudy Study
.....
rElectroshocking &Radio TelemetryStudy
PCN 4201FB II, 12rrvn
PCN 4197FBI. 12mm
Incubation,Emergant, &Outmigrant Study
PCN 4200FBII, 12m
PCN 4212FBI. 911111
ImpoundmentStudy
PCN 4205FBIl, 12mm
PCN 4202FBI, 12m
PCN 4206FBIl, 12rrvn
peN 4198FBI, 12m
PCN 4203FBI, 12m
PCN 4199FB I, 9l11T1
PCN fne6')FB , m
PCN 4184FBIl, 12rrvn
PCN 4216FBI, 611111
Figure 5. Phase II Resident and Juvenile Anadromous Fisheries Project,Adminsitrative Structure and Manpower Distribution F.Y. '83,
July 1, 1983 to June 30,1983.
-56-

-
C. AQUATIC HABITAT AND INSTREAM FLOW STUDIES
Study Description and Rationale
During FY 82 Aquatic Habitat and Instream Flow (AH) investigations wereinitiated to begin the process of identifying:
1. Fish habitats in the study area
2. Seasonal relationships between mainstem discharge of the SusitnaRiver and the physical and chemical characteristics of these fishhabitats.
3. Seasonal relationships between mainstem discharge of the SusitnaRiver and fish distribution and abundance.
The FY 83 RSA provides a basic outline of the field studies proposed forthe upcoming year. Much of this work is a continuation of that begunduring the FY 82 ADF&G Aquatic Studies program, and is expected to continuethrough FY 84. This section of the procedures manual will further describethe purpose of the FY 83 AH component of these studies and the rationalebehind the approach proposed for this field season. Methods describedreflect only those changes from procedures established in FY 82.
AH data collected in FY 83 ~ill be categorized as Fishery HabitatUtilization or Instream Flow data, the difference being in the applicationof the data. Physical and chemical data which will be related to fish willbe defined as Fish Habitat Utilization Data. Physical and chemical· datawhich are related to other physical and chemical data (e.g discharge vs.turbidity or stage vs. discharge) will be defined as Instream Flow Data.Fish Habitat Utilization studies are addressed in Objective 2 andsub-objectives 1 through 4 below. Instream flow studies are addressed inobjective 3 and sub-objectives 5 and 6 below.
-57-

-Scope by Geographical Reach of the Susitna River
The project study area includes those portions of the mainstem SusitnaRiver that may be directly affected by the construction and operation of
Watana and Devi 1 Canyon Dams. For purposes of the FY 83 ADF&G Aquati c
Studies program, the project study area is sub-divided into three principal
geographical areas. These are the reaches of the Susitna River from CookInlet estuary to the ChulitnajSusitna River confluence, theChulitnajSusitna River confluence to Devil Canyon, and Devil Canyon to the
Tyone River. The first two are also referred to as lower river study areasand the third, the upper river or impoundment study area. All study sitesreferred to in this narrative will be designated on a map in the final
draft of this addendum.
Scope of FY 83 Program by Objective
The overall scope of the Aquatic Habitat and Instream Flow studies remainsunchanged from the FY 82 studies. The principal objectives of the AH component of the Aquatic Studies program are to:
1. Characterize the seasonal spawning, incubation, rearing, andpassage habitats of selected anadromous and resident specieswithin the study area (Fish Habitat Utilization Studies)*.
2. Identify the physical and chemical conditions associated withchanges in mainstem discharge of the Susitna River which appear
to be influencing the suitabil ity of various habitat types for
the species and life history stages of interest (Fish HabitatUtilization Studies)*.
3. Characterizedischarge andhabitat types
the relationships between changes in Illainstemthe physical and chemical parameters of the variousfound in the study area (Instream Flow Studies).
l"'"
!11
* Refer also to RJ and AA Procedures Manual Sections and addendums.
-58-

The foll owi ng secti on outl i nes sub-objectives and fi e1d studi es necessaryto continue working towards meeting these general objectives in FY 83.Specific techniques to be employed in the sampling procedure are outlinedin the FY 82 draft of this procedure manual and this addendum. It isanticipated that the following sub-objectives can be accomplished during FY83 through an integrated ADF&G, R&M, and AEIDC program. Thesesub-objectives are:
1. Quantify the degree 'of influence various mainstem streamflowshave on selected spawning habitats downstream of Talkeetna duringthe open water and ice covered seasons.
2. Quantify the degree of influence various mainstem streamflowshave on the availability of spawning, incubation, rearing, andpassage habitat in selected side slough habitats in the Talkeetnato Devil Canyon reach of the Susitna River.
3. Monitor the thermal regimes of the mainstem river, side channelsand sloughs upstream of Talkeetna to determine whether or not..there is a direct relationship between mainstem surface andintragravel water temperatures, or between mainstem surface watertemperatures and the surface or intergravel water temperatures inthe side channels and slough areas;
4. Identify the ranges of point specific hydraulic and water qualityparameters of spawning habitats used by adult anadro111ous fishpopulations.
5. Identify and characterize the seasonal habitats ut"j 1ized by thefisheries resources within the boundaries of the proposedimpoundments.
6. Provide technical support to RJ habitat related studies.
-59-
-
,-
Sub-ObJective 1
The AH spawning habitat evaluations that will be undertaken on the SusitnaRiver during the FY 83 open water season between Cook Inl et and theChulitnajSusitna River confluence will principally focus on the riversegment between Kashwitna landing and Talkeetna.
Studies in this reach of river will be focused on identifying whetherseasonal changes in the mainstem discharge of the Susitna River havesignificant influences on physical and chemical habitat characteristics ata maximum of five mainstem spawning locations.
Relationships will be determined between seasonal streamflows and varioushydraul i c attri butes of the fi sh habi tat 1ocati ons refered to in the RJsection. These relationships, in conjunction with other information, canbe used by the AEIDC impact evaluation team for assessing whether or notanticipated postproject streamflows are likely to positively or negativelyaffect spawning, rearing and access downstream of Talkeetna during the openwater season. They will not provide .sufficient information for definingthe actual response of mainstem habitat to incremental changes instreamflow. If it is determined that this sort of analysis is justified,it can be completed in FY 84.
The relationship between mainstem discharge at The Parks Highway bridge andselected hydraulic characteristics of fish habitat at mainstem spawningareas will be evaluated by AH personnel at the AA mainstem locations.Study sites will be selected from the five mainstem spawning sitesidentified by AA staff during the FY 82 AA studies and new sites which areidentified during the FY 83 AA field investigations prior toAugust 15, 1982.
Four to six transects will be located at each study site by ADF&G personnelto characterize pertinent habitat related hydraulic (e.g. water quality,etc.) characteristics of the area. The II mainstem ll study sites will existon side channels and between islands and large exposed gravel bars betweenthe braided segments of the river. In general, each study site is expected
-60-
..."
to be approximately 100 to 300 feet wide, and 1500 feet in length.
Headpins will be installed by ADF&G and stream bed profiles surveyed along
each transect by R&M consultants to describe the general shape and gradient
of the channel. All elevations at a particular study site will be
referenced to a local TBM which has been. assigned an assumed elevation
estimated from topographic maps. Staff gages will be located at each site
to develop stage/discharge curves.
AOF&G personnel will periodically obtain depth and velocity measurements at
fixed intervals along these transects in accordance with standard field
procedures; these data will be reviewed shortly after collection and
converted to the proper format for computer processing. Data analysis will
be performed after the close of the fi el d season by a joi nt ADF&G/AEIDC
team as per procedures contained in the Data procedures section of the
Procedure Manual.
Sub-Objective 2
FY 82 investigation indicated that the availabil ity of fish habitat and
access to and from sloughs in this reach of river were related to mainstem
discharge.
Therefore, the FY 83 AH field studies which will be undertaken in the
Tal keetna toOevi 1 Canyon reach of the Sus itna Ri ver duri ng the FY 83 open
water season will principally focus on the side slough habitats.
Relationships will be determined between seasonal mainstem discharges at
'Gold Creek and the quantity and qual ity of fish habitat available to and
occupied by adult spawners and juvenileanadromous fish in the side
s~oU'ghs. These relationships, when examined in conjunction with other
information, will provide the basis for an incremental evaluation of
project effects on side slough habitat.
Six side sloughs (8A, 9, 11, 16B, 19, and 21) will be intensively studied
to determine the effects of changes in mainstem discharge on physiochemical
attributes of fish habitat. Each slough will be sub-divided into three
habitat zones based upon prevalent hydraulic characteristics. These zones
can be identified by direct observation into the following three basiccategories:
-61-

r
-
!1"'"
'iI
1. Areas that convey flow from tributaries, ground water, or
mainstem overflow with no appreciable influence of backwater from
the water surface elevation of the mainstem.
2. Areas that are periodically influenced by backwater conditions
attributable to changes in water surface elevations of the
mainstem Susitna. At certain tributary mouths and during periods
of low flow in the mainstem Susitna these areas will be very
limited or non-existent.
3. Areas at slough and tributary mouths that are mlxlng zones.
Local velocity patterns in these areas are principally influenced
by the mainstem flow.
Transects will be reestabl ished or added at each study site by personnel to
characterize pertinent habitat and hydraulic characteristics of the area.
Headpins will be installed by ADF&G and streambed profiles surveyed along
each transect to describe the general shape and gradient of the slough
channel. All elevations at a particular study site will be referenced to
the project datum established by R&M Consultants.
ADf&G personnel will obtain frequent depth and velocity measurements at
fixed intervals along these transects in accordance with standard field
procedures. These data will be reviewed shortly after collection and
converted to the proper formatfor computer processing. Data analysis will
be performed after the close of the field season by a joint ADf&G/AEIDC
team as per procedures contained in the Data Procedures section.
Substrate composition and spawning redds will be visually evaluated and
denoted on field maps. During late September, foot surveys will be
conducted to identify areas of groundwater upwelling. This information
wi 11 be used in conjunction wi th hydraul ic measurements (stage, di scharge,
depth, and velocity) to determine the relationslrip between mainstem
discharge and the availability of suitable spawning and rearing areas in
these sloughs. The analytical methodology and techniques are presented in
the Data Procedures section of the Procedures Manual.
-62-
"""
-
(J /c t >
Sub-Objective 3
Evaluation of FY 82 surface and intragravel water temperature data
indicated the importance of collecting additional data on a year-round
basis. These data are required to evaluate the ability of computer models
to calculate preproject surface water temperature conditions and insure the
models are properly calibrated. Eventually, the model will be important to
the AEIOC impact ana lys is team for predi cti ng post-project temperature
impacts.
The temperature of the mai nstem Susitna Ri ver and its major tri butari es
wi 11 be monitored through October at several 1ocati ons usi ng Ryan model
J-90 thermographs. These data will principally be collected upstream of
the Parks Highway bridge with special emphasis given to the impoundment·
zone and confluence area. These data will describe the thermal regime of
the mainstem itself.
In addition, continuous surface and intragravel water temperature data will
be obtained from several known spawning areas throughout the winter of
1982-83 and into FY 84. Temperatures will be monitored using Omnidata
DP2301 recorders and calibrated thermister probes. Thermograph sites will
be selected to meet the data needs of the ADF&G, Acres and R&M. Data w"ill
be transferred to the Data Processing Support Unit for analysis.
Sub-Objective 4
Point specific physical and chemical data will be evaluated to determine
the types and ranges of habitat characteri stics which are uti 1ized by adult
anadromous spawners; these data will be required by the AEIOC for
predicti ng the irnpacts of various flow regimes on fi sh habitat suitabil ity.
P.oint specific data will be collected from the Cook Inlet estuary to the
Devil Canyon reach of the Susitna River at the slough and spawning
locations previously discussed in sub-objectives one and two. Sampl ing
methods will be employed which permit fish to be observed in the habitat. !
they are occupying. Further detail on field techniques is provided in the
FY 82 Procedures Manual and this addendum.
-63-

i
""'"
;~
-
Sub-Objective 5
FY 83 studies are designed to assess the potential loss of this loticenvironment. This requires documentation to determine the nature andextent of fish populations in this area, their dependence on particularhabitat conditions and whether there are alternate habitats to support themadjacent to the impoundment area.
An active tag recapture and habitat evaluation program was initiated duringthe 1981 field season to provide an inventory of fish populations andhabitat characteristics within the impoundment zone. Continuation of thesestudies into FY 83 will provide an opportunity to more accurately estimatethese populations. FY -83 studies will also enable project personnel toexamine in further detail, other potential habitats within the impoundmentzone that did not receive extensive study in FY 82. Sampling of the lowersection of the clear water tributaries for tag recovery will be continued.The mainstem Susitna (which was not sampled during the previous year) willalso be sampled during FY 83. At least one lake within the proposedimpoundment and referred to as Sally Lake, will be sampled in more detailin FY 83 with the goal of obtaining a population estimate.
Joint AH and RJ crews will also conduct studies to determine whether thereach of tributary immediately above the impoundment zone will containhabitat similar to the habitat at the mouths of the clear water tributariesif the dams are built. To accomplish this task these reaches will besurveyed to estimate the relative abundance of fish and evaluate theexisting habitat characteristics. The presence of barriers of fish passageor inundation of existing barriers will be noted.
During the winter season, the distribution and migration of grayling willbe monitored by use of radi 0 tel emetry. Previous efforts at overwi ntersampling have produced very limited results because of difficult samplingconditions. Fish radio tagged during the fall will be monitored throughthe wi nter season in order to determi ne overwi nteri ng habitat, and tosubsequently follow spring migration and identify spawning habitats.Current information suggests that the fish spawn during a period closely
-64-

,~
,/ ..~ .... " ....
( 'L/\~.,-_.
associated with breakup necessitating such techniques to locate keyspawning areas.
This information should provide an indication of the dependency of thegrayling populations on the mainstem Susitna for overwintering, and providean indication of how important this habitat is for the spawning andsurvival of the tributary populations.
Data analysis will consist of population estimations in the tributaryreaches, and evaluation of intrasystem movements using recaptured and radiotagged fish. Any spawning areas located will be identified and the habitatcharacteristics evaluated. Basic biological data for all species collectedwill also be summarized. Any new components of the biological community ordifferent findings from the 1981 studies will be identified.
Sub-Objective 6
AH personnel will provide technical support to RJ habitat related studies(e.g. fish distribution, invertebrate, and incubation) by:
1. Training RJ staff to maintain and operate habitat data collectioninstruments.
2. Calibrating habitat instruments for RJ staff.
3. Installing and maintaining staff gages at all RJ fishdistribution locations.
4. Measuri ng discharges at fi sh distribution locati ons to developstage/discharge curves.
5. Working with RJ staff to develop plans for collecting habitatoriented data for the incubation and invertebrate studies.
The AH section will also cooperate with RJand AA staff and othercontractors to insure the timely exchange of information when working onoverlapping
-65-

activities. All efforts will be made to coordinate these activities toinsure maximum results are derived from this year of study.
Administrative Structure and Manpower Distribution
The administrative structure and manpower distribution of AH personnel forfiscal 1983 is illustrated in Figure '6. The FY 83 AH staff includes oneFisheries Biologist III, five Fisheries Biologist II's, and thirteenFisheries Biologist I's. Personnel will be assigned as needed between thevarious sub-projects.
The following section contains a description of the work plans forachieving the preceding objectives and sub-objectives. Four work plans arepresented:
1. Lower River Fish Habitat Utilization Data
2. Lower River Fish Habitat Utilization Electrofishing Data
3. Instream Flow Data
4. Upper River Fish Habitat Utilization Data
-66-
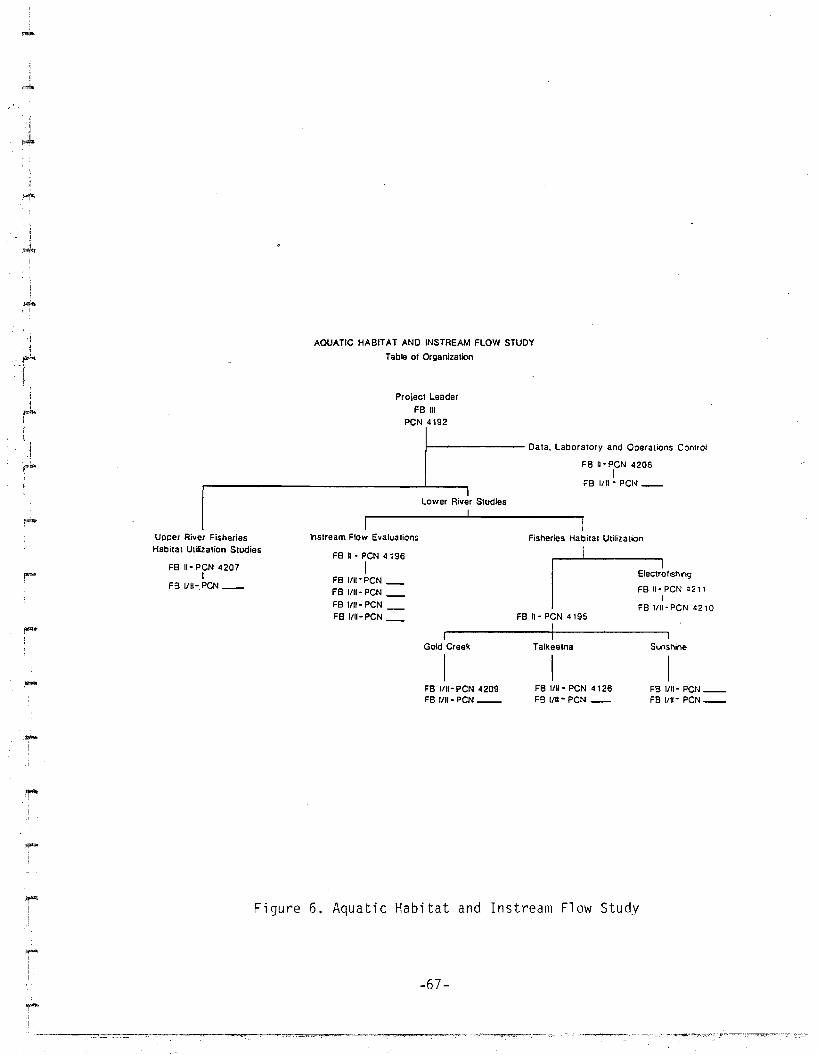
AQUATIC HABITAT AND INSTREAM FLOW STUDY
Table of Organizalion
Project Leader
FB IIIPCN 4192
f-------- Data, Laboralorv and ODerations COnlrol
FB II-PCN 4208I
FB 1/11 - PCI~ __
Lower River SludiesI
UDDer River FisheriesHabitat Utilization Studies
FB II-PCN 4207I
FB IIH-PCN __
Inslream Flow Evaluations
FBII-PCN4196
IFB 1/11- PCN __
FB 1I11-PCN_FB 1111- PCNFB I/II-PCN_
Fisheries Habitat Ulilization
Electrofishing
FBII-PCN4211I
FB 1/11- PCN 42' 0FB II - PCN 4 195
Ir-------Ir-------IGold Creek Talkeetna Sunshine
I IFB 1/11- PCN 4209FB 1111- peN __
FB 1111- PCN 4126FB 1/11- PCN __
FB 1/11- PCN __FB 1/11- PCN __
Figure 6. Aquatic Habitat and Instream Flow Study
-67-

(~,
!rr,
!
Field Data Collection Work Plans
Lower River Fish Habitat Utilization
During the 1982 open water field season the Fishery Habitat Utilization(FHU) section of Aquatic Habitat will concentrate on the characterizationof adult salmon spawning preferences in relation to hydraulic and physicalconditions of their habitat (Objectives 1 and 2; Sub-objectives 1, 2 and3). In addition, the study of juvenile rearing preference will beconducted to a 1esser extent in order to determi ne the best approach toevaluating preference.
Emphasis will be placed on studies of rearing fish in the winter 82-83 andspring 83 field seasons.
Study Site:
FHU data will be collected at two different types of sites: the sloughsites and the electrofishing sites (see electrofishing section). Sixsloughs from Curry to Portage and one slough below Talkeetna have beenselected to conduct extensive habitat study. These are sloughs 8A, 9, 11,16B, 19 and 21 above Talkeetna and Birch Creek slough below Talkeetna.These sloughs were selected on the basis of' studies conducted in FY 82.The electrofishing sites will be determined in the field by the AHelectrofishing crew. Determination of mainstem spawning sites arediscussed in the electrofishing_ section of this procedures manual.Additional sites may be added to this list if it is determined thatsufficient manpower is available.
Methods:
Upon arriving at a slough study site, an overall familiarization will bemade of the entire slough in order to obtain information necessary formapping and to determine where spawning activity is occurring. The wettedarea, upwelling, staff gage and water quality sites will be recorded on onecopy of the R&M blue line aerial photos; and substrate on a second copy. A
-68-

third copy will be used to mark sites where specific redds are located.These same maps will be updated during subsequent visits using differentsymbols or colors and recording the date in order to differentiate visits.Stage will be recorded from staff gages installed by Instream Flow or R&Mstaff and di scharge wi 11 be measured if necessary. Water qual ity data wi 11be collected, using insttuments and procedures described in the 1981 ADF&GProcedure Manual, in as many locations as are necessary to describe thewater quality characteristics present.
Fish observation techniques for determining spawning sites in clear watersystems are discussed in the 1981 Procedure Manual. When these sites aredetermined they will be marked by a painted rock or surveying flag forsubsequent measuring. After all sites are located, depth, velocity, andsubstrate data will be collected and the marker removed. A total of 10flags marking redds will be left in each slough for later reference forincubation studies. Depth and velocity will be measured at the upstreamend of the redds, with velocity being measured at .6 or .2/.8 depthdepending on the total water depth.
Level of Effort and Frequency of Sampling:
Two crews will be deployed in the river between Talkeetna and Portage andone crew below Talkeetna. Each two person crew will work seven days in thefield, three days in the office, with four days off. Slough sites will besampled once per week.
Fish Habitat Electrofishing
One of the lower river AH Fish Habitat Utilization crews will be assignedto an el ectrofi shi ng boat on a full time basi s. Thei r multi -purpose dutiesare discussed below.
Methods:
A standard mounted electrofishing boat for each of the three projects (RJ,AAand AH) will be utilized to conduct electrofishing on the Susitna River
-69-

;
-1I,-
ii-
between Cook Inlet and Devil Canyon from ice out to freeze-up, 1982. Thefield season will be broken into three time periods during which variousproject (RJ, AA and AH) priorities will be addressed. These three timeperiods will consist of ice out to July 31, August 1 to September 15, andSeptember 16 to freeze up. During both the ice out to July 31 andSeptember 16 to freeze-up time periods, the individual project boats willbe operated at the discretion of each of their respective project leaders.From August 1 to September 15, all three boats and their crews will conductAdult Anadromous slough and mainstem Susitna River salmon spawningdistribution studies under the supervision of the AA project leader.During cooperative studies among the various projects, the electrofishingboats will each be assigned to a defined reach of the river.
Two or three AH, RJ and AA biologists will be assigned to each electrofishing crew, with possible interswitching of project personnel duringcooperative studies among the various projects. Field stations will belocated at Yentna, Sunshine, Talkeetna, and Gold Creek.
Areas to be electrofished will be field selected in the mainstem SusitnaRiver and its side channels and sloughs, between Cook Inlet and DevilCanyon where and when the physical parameters allow electrofishing to beconducted. In addition to the selected sites sampled, 27 specific habitatevaluation study locations will be sampled by the RJ and AH electrofishingcrews once every two weeks when the physical parameters allow electrofishing to be conducted. During August 1 to September 15, all threeelectrofishing crews (AA, AH and RJ) will electrofish at these 27 siteswhich are the designated habitat evaluation study locations of the RJ FishDistribution Studies. Sampling effort at each of the 27 habitat locationsshould not exceed one hour total time, including handling of catch and datarecording.
A 20 foot by 5-1/2 foot flat bottom, aluminum riverboat powered by a 90 hpoutboard jet and 18 hp outboard auxiliary engine will be modified forelectrofishing operations on the lower river. The power source for theelectrofishing apparatus (and possible supplemental lighting equipment fornight shocking) will be a four cycle, 3.5 kilowatt, 120/240 volt, 60 Hz
-70-

A.C. Homelite Voltamatic generator. Voltage and amperage regulation from
the power source to the water will be through a Coffelt Variable Voltage
Pulsator model VVP-15 (AH) and two Coffelt models VVP-3E (RJ and AA). Both
models are designed to supply A.C., D.C., or pulse output voltages. The
output voltages from the VVP-15 can be varied continuously from 0 to 600
volts for all outputs (A.C., D.C., Pulsed D.C. and 0 referenced A.C.
Pul sed). For the VVP-3E the output voltages can be varied from 0 to 300
volts for all outputs (A.C., D.C~ and, Pulsed D.C., and Pulsed A.C.). The
VVP-15 incorporates a 20 to 80 percent adjustable DC pulse width. The
proper current type, voltage, amperage and electrode arrangement for
effi ci ent capture of fi sh wi 11 vary for different speci es of fi sh and
according to water qual ity parameters such as water temperature,
conductivity, depth and turbidity.
Electric current will be applied to the water through either single and
dual anode systems, with the cathode comprising the boat surface in contact
with the water. When a single anode is used, a single dip netting pole
will be used both as the anode and a dip net. The single anode design will
be utilized when probing in deep pools and confined areas and in searching
for specific species. Under situations when a dual anode system will be
utilized, each anode will be suspended into the water using a standard
electrofishing boom design. A standard dip net will be used to capture
stunned fish.
Due to the high voltages and potential hazards associated with electro
fishing, several safety features will be designed into each electrofishing
boat. Each boat will be fitted with a 36 to 40 11 high non-conductive coated
railing enclosing a non-skid platform. Electrical units will be placed in
covered boxes designed to prevent water from entering the unit and thereby
preventi ng short-ci rcuiting. In addition, a safety ci rcuit i ncorporati ng
foot pedals and kill switches will be included in the circuitry. All
individuals working on the electrofish boat will wear hip boots, life
preservers and rubber gloves and be trained in cardiopulminary
resuscitation (C.P.R.) and basic first aid techniques (Appendix V).
-71-

j""....
·1
F
Specific sampling procedures for each of the three projects are stated in
each respective project's section of the Procedures Manual.
Level of Effort and Frequency of Sampling:
Electrofishing, using the standard boat mounted electrofishing unitpreviously described, will be conducted on the Susitna River from ~1ay 20,
to freeze-up, 1982. Various electrofishing objectives incooperation witheach study section (AH, RJ and AA) will be addressed during this timeperiod as shown in Figure 7 and discussed below. Two to three AH
biologists will be assigned to the AH electrofishing crew, with possiblei nterswitchi ng of project personnel duri ng cooperative studi es among the
various projects. Field stations will be located and jointly shared by theRJ electrofishing crews at Sunshine, Talkeetna and Gold Creek.
-I8eri ...'" C.i~",
:Sf",Y
FI~l<er..e~ H«I.;+... ~f-i'''ea.f,'_ Sfvd;~$
eesi'~l'Spec .. es Ca. JD.;_~(_, ~" ..."",c. .....+-,,_ OVI
-ra. ,'" .$i"vd.i~' H l.,'f-... f- I..J,CAf,'trV't, .5-f-vd"~5
Il) to Il) Il) Il) Il)Il) Il)
>- <lJ >- 01 - 0III c: - ::::I
~ - >::::I ::::I <lJ 0 0 l1)
:::E "").., « en 0 z 0
Fi gu re 7. Electrofishing objectives.
-72-
.....
Eulachon Study in conjunction with AA (May 19-June 15, 1982).
Objectives:
1. Determine the extent of the spawning run in the Susitna Riverbasin of eulachon [Thaleichthys pacificus Richardson].
2. Determine the general habitat requirements for eulachon spawning.
Methods:
The first objective will be studied by methods outlined in the AA plan ofstudy. Habitat characteristics that will be studied in assessing thegeneral habitat requirements for spawning of eulachon will include thephysiochemical parameters comprising water and air temperature, pH,specific conductance, dissolved oxygen and turbidity; substrate; waterdepth; and, mean water column velocity. At specific spawning sites, a mapwill be drawn of the spawning site and surrounding area. Specific methodsfor the collection of the above parameters are given in the FisheriesHabitat Utilization portion of the AH procedures manual. Sampling designused in the collection of the above data at known spawning sites will bemodeled after Bovee and Cochnauer (1977).
Resident species categorization, enumeration and tagging studies .
Objectives:
1. Categorize, enumerate and tag adult resident species.
2. When possible, collect data concerning the general habitatrequirements of resident fish.
~~ethods:
Using the basic mounted electroshocker previously described, resident adultspecies will be systematically collected, identified, measured, age
-73-

'.'~
-
,~
sampled, sex determined (when poss'ible), tagged and then released. Habitatcharacteristics that will be studied, when possible, to characterize thegeneral habitat requirements of these resident fish include thephysiochemical parameters comprlslng air and water (surface andintragravel) temperature, pH, specific conductance, dissolved oxygen andturbi dity; substrate; water depth; and, mean water col umn velocity. Atsignificant study sites, a map may be drawn of the site and immediatesurrounding area. Specific methods for the collection of the aboveparameters are given in the Fisheries Habitat Utilization portion of the AHProcedures Manual.
Adult salmon spawning site evaluations (June 15 - Aug. 30, 1982).
Objective:
1. Locate and tharacterize the general habitat characteristics ofthe spawning and milling sites of adult anadromous salmon(chinook, coho, chum, pink and sockeye salmon) runs in theSusitna River.
Methods:
Using the basic boat mounted electroshocker previously described, the adultanadromous salmon species will be systematically studied by methodsoutlined in the AA portion of the procedures manual by the threeelectrofishing crews (RJ, AA and AH) from the period June 15 - August 30,1982. If spawning or milling fish are found, the general habitatcharacteristics of the site will be assessed (see Resident speciescategorization, enumeration and tagging studies presented earlier formethods and section 1.1). Both mainstem and slough sites will beinvestigated. All studies will be coordinated by the AA Project Leader,with the AH electrofishing crew coordinating the collection of the generalhabitat data by both the RJ and AA electrofishing crews.
-74-

Fisheries Habitat Utilization Studies
Objectivs:
1. Work with the AH fisheries habitat utilization study crews todetermine the objectives outlined in that section's plan of
F' study.!
""'"'",I
Methods:
Using the basic boat mounted electrofishing unit previously described,adult anadromous and resident fish will be located for study by the AHfisheries habitat utilization study crews. The AH electrofishing crew willaid the fisheries habitat utilization crews in the collection of fisherleshabitat data and will process all collected fish as previously described inthe adult salmon spawning site evaluations section.
Radio Telemetry Studies (Sept. 1 - Nov. 15, 1982)
Objectives:
1. Collect resident species for radio telemetry studies and aidin the tracking of tagged fish.
2. Characterize the habitat utilized by radio tagged fish.
Methods:
Using the basic boat mounted electroshocker previously described, residentadult fish will be collected in conjunction with the RJ electrofishing crewfor implantation of radio tags. Tracking of these tagged fish will be donein conjunction with the RJ project by boat and aircraft. Spawning ormilling areas identified for these fish will be studied for their generalhabitat characteristics as discussed previously in the resident speciescategorization, enumeratAon and tagging studies section.
-75-

Bering Cisco Study
Objectives:
1. Aid the AA project in meeting the objectives set forth intheir plan of study.
2. Characterize the general habitat characteristics of spawning andmilling sites of the Bering cisco.
Methods:
The first objective will be studied by methods outlined in the AA plan ofstudy. Habitat characteristics that will be studied in assessing thegeneral habitat requirements for spawning and milling Bering cisco willcomprise the parameters previously mentioned by methods outlined ineulachon study in conjunction with AA section.
Instream Flow
Instream flow data will be collected during the open water and ice coveredfield season (Objective"3; Sub-objectives 5 and 6). Data collected willinclude: stage, discharge surface and intragravel water temperatures, DO,pH, conductivity and water surface elevations.
Study Site:
Stage discharge and water quality measurements will be collected at each RJFish Distribution study site location, at selected mainstem anadromoussalmon spawning sites and FHU slough sites. Stage data will also becollected at each AA sonar fishwheel site. Surface water temperature datawill be collected on a continuous basis by Model J-90 Ryan thermographs atselected mainstem, tributary and slough sites to determine the thermalcharacteristics of these sites.
-76-
In addition to surface water temperatures, intragravel temperatures wi 11al so be continuously monitored by Omnidata DP 2301 recorders tocharacterize the relationships between surface and ground watertemperatures at six selected spawning sites.
Methods:
Staff gage placement at the RJ Fish Distribution Study (FDS), AA mainstem,and FHU slough sites will be determined on a site use basis. The gages atthe FDS and FHU sites will be located to monitor the accessibility of thestudy site from the mainstem for passage of both resident and anadromousadults and juvenile fish. Gages will be placed within the study locationto develop discharge rating curves in an effort to determine totaldischarge through the study area. Gages will also be installed at the headport'ion that are adjacent to the mainstem and within the mainstem toevaluate the influence of flow into the study area from the mainstem andthe mainstem discharge required for breaching of these head portions.
Staff gages will be located on transects in selected mainstem anadromoussalmon spawning sites to develop discharge rating curves at these sites.
Staff gages will be installed at each fishwheel/sonar reach to monitorchanges in mainstem water surface elevation and related to mainstemdischarge.
A cross section profile will be made perpendicular to the stream at eachgage site except those located within the mainstem. Each gage will benumbered (refer to staff gage numbering procedures Table 1 and Figure (8)),on the back and a painted float will be attached which will also includethe gage number. Each, gage site wi 11 cons i st of a set of gages (1-5)tiered to insure that the entire range of flows will be monitored at eachsite (refer to AH FY 82 Procedures Manual for staff gage installationinstructions). The top of each gage and the water surface will be surveyedto a temporary bench mark (TBM). A compass reading on magnetic north tothe TBM from each gag'e wi 11 be determi ned as \liill the di stance from thegage to the TBM. FDS gages will be monitored at least twice monthly; the
-77-

Table 1. Staff gage numbering procedures.
Staff gages will be numbered with a four part, seven place alpha-numeric
code.
EXAMPLE: Mainstem gage at River Mile 101.2, second gage from shore,set number one
River Mile (first four places of code) - to be determined to the nearesttenth mile from the bluelines in the Instream Flow Evalu~tion office.
Rivermile1 a 1 2 M
:Placement:Code
1
Set#
·B
Gage
Placement Code (fifth place) - indicates whether a gage is placed in aslough (S), at the head of a slough (H), in a tributary (T), in themainstem (M), at an R&M cross-section (X), or Wfor mouth of slough.
SET (sixth place) - a single digit which identifies a group of staff gageswithin a site which were set to measure the full range of stagefluctuations at a given point.
GAGE (seventh pl ace) - a 1etter i denti fying a gage wi thin a set. Letterswill be assigned alphabetically, beginning with the gage nearest shore.
-78-

"'1 -Tnwmw·"
STAFF GAGE NUMBERING FORMA T
RIVER MILE
II,
hAce'·MENTTYPE
,,--,SET' GAGE
\
PLACEMENT TYPE CODE
Mainstem = MSlough = SSlough Mouth = WSlough Head" HTributary = TR&M Cross Seellon X
Example B: ~C/.
Maln.tem Gage ~,...'Site 101.5M3/\ ~
Example 0:Slough Gage100.5StC
Example C: Slough Hev:a.:d:..;S:,:I::,t,:e:.-_--::l101.0H2C'J
.. Gaoe leUe.s 85sioned hom shale outward.
k Rtver mUe C·RM) _will be detormi"od from the bll.leUnes to the nearesl 0.1 mile.
(For trlbut.ary sHes, lilier mile wllf b_e for the oolnl ot mainsfem/1r1but411fY con-ffl.lence).
Figure 8. Summarizes the staff gage numbering procedure.
-79-

F"!
fishwheel/sonar site gages will be read daily and the FHU six slough andfive mainstem site staff gages will be read once per week.
A staff gage form (AH-82-0) will be used for the gage data and includes thedate, time, gage number, gage reading, actual depth and a comment section,(refer to form AH-82-0 and instructions in FY 83 addendum). Total depth isdetermined by placing a staff gage or wading rod adjacent to the installedgage and reading the water surface. The total depth minus the gage readingdetermines any substrate change (i.e. silting), influencing the gagereading. A gage site description (i.e. Slough 19 head) will be includedunder the comments section as will any pertinent information at theparticular gage site. At gage sites with all dewatered or SUbmerged gages,the furthest gage from shore will be recorded on the staff gage form undergage reading, "DRY" when dewatered or "SUBM" when submerged. Suppl ementa1
gages will be installed as soon as possible to ensure that the watersurface is being monitored. The exception is when the entire channel isdewatered.
Discharges will be obtained on a transect to be surveyed by R&M Consultantspri or to obta ini ng a di scharge. A staff gage wi 11 be i nsta11 ed at eachdischarge site and read before and after collecting the discharge data.R&M Consultants wi 11 i niti ate the di scharge measurements at each site byobtaining the first of at least three discharge measurements to be used todevelop stage/discharge rating curves. ADF&G will collect furtherdischarge data at specified study sites to ensure that rating curves willbe developed. These sites will be determined and set when possible by R&Mto also estimate reach specific streamflows. Mainstem dischargeinformation will be obtained from the closest USGS gaging station as acontrol. Refer to the Aquatic Habitat and Instream Flow Phase I ProceduresManual for discharge measurement procedures.
Daily discharge information from Gold Creek and Sunshine USGS stations willbroadcast to all field camps to familiarize field staff with the flowlevels they are observing.
Water quality will also be recorded at each discharge site on transect atintervals necessary to characterize the water quality present.
-80-

--
Surface water temperatures will be recorded in selected mainstem sites andmajor tributaries using Ryan J-90 continuously monitoring thermographs(refer to AH FY 82 Procedures Manual). Intragravel and surface watertemperatures will be monitored at six selected sloughs and spawning sitesby Omnidata DP 2301 recorders. Procedures for the Omnidata recorders willbe standardized by the Dryden and LaRue company area representatives forOnmidata.
At each surface water monitoring temperature station instantaneous watertemperature measurements will be made at 1.5 feet beneath the water surfaceat approximately 100 foot intervals along a transect once per month throughOctober. Instructions for placement of thermographs are included in thePhase 1 AH Procedures Manual.
Level of Effort and Frequency of Sampling:
Two crews of two people will be deployed from the Yentna River to PortageCreek. One crew will concentrate on the RJ Fish Distribution sites fromthe Yentna River to Lane Creek and the other crew will be assigned to thesites located from Lane Creek to Portage Creek. Both crews will also sharethose areas between the Yentna River and Portage Creek when their effortsare necessary. The standard schedule will consist of seven days of fieldduty, three days in the offi ce and four days off. Each site wi 11 beinspected two times per month.
Upper River Fish Habitat Utilization (Impoundment Study)
The flooding of clearwater stream reaches, the mainstem Susitna, and nearbylakes will alter the aquatic environment that presently supportspopulations of resident fish. To assess the potential loss of thesehabitats and to determine the mitigation activities necessary, theresources to be affected require documentation to determine the nature andextent of these popul ations and thei r dependence of parti cul ar habitatconditions. A more detailed background description of these studies ispresented in the sub-objectives section (Sub-objective 4).
-81-

Study Site:
The study 1ocat ions for the summer FY83 impoundment surveys wi 11 i ncl ude:
the eight major tributary streams [Fog Creek (RM 176.7), Tsusena Creek (RM
181.3), Deadman Creek (RM 186.7), Watana Creek (RM 194.1), Kosina Creek (RM
206.8), Jay Creek (RM 208.5), Goose Creek (RM 231.3) and Oshetna River (RM
233.4)] upstream from their confluence with the Susitna River to the
proposed level of impoundment; the first mile of each of these streams
immediately above the Proposed Impoundment Elevation (PIE); five mainstem
sites located between the mouth of Deadman Creek and Jay Creek; and Sally
Lake. As time permits, additional lakes both inside and . outside the
proposed impoundment boundary will be assessed. Various sloUghs and side
channels of the main Susitna River may also be added.
Methods:
Water quality data (dissolved oxygen, pH, conductivity, water temperature
and turbidity) will be collected near the mouth of each study tributary
upstream of any influence from the main Susitna. These data will also be
collected in the area of the first mile of stream above the PIE, all
mainstem sampl ing sites and representative areas of major lakes under
study.
Additional water temperature data on tributary streams will be collected by
placement of thermographs near the mouth of Tsusena, Watana, Kosina and
Goose creeks and the Oshetna River.
The "habitat location" of each of the major study tributaries will include
that portion of the stream from the major clearwater influence with the
Susitna River, upstream to the PIE. This area will be divided into three
distinct habitat types based on their physical characteristics. These are:
1. The confluence habitat encompasses that area of the Susitna River
below the mouth of the tri buta ry wh i ch is i .ofl uenced by thetributary stream flow, the mixing area, and that area of thetributary which is influenced by the rise/fall of the Susitna
River.
-82-
~------,.,-----------------~---

!!~
2. The pool habitat is comprised of the large pools within thetributaries between the mouth and the proposed impoundmentelevation where the majority of the resident fish have beenobserved to reside.
3. The riffle habitat will include those stretches of each tributarylocated between the major pool areas in the reach between themouth of the tributary and the impoundment elevation. Theseareas are comprised of smaller pools, rock eddies, riffles, andwhitewater.
The mouth area is self explanatory. The pool areas will be designated bythe biologists in the field, permanently marked, recorded, and described.The riffle areas will then be the stretches of stream between thedesignated pools.
Aerial photographs of the entire habitat location correlated with mapcontours and elevations will then allow tributary river miles for each areato be calculated, and a scaled map to be drawn.
Pool habitat sites will be calculated on the basis of the total numberidentified. Riffles will be calculated as the total length of stream milesin which they are located.
Any documented spawning areas of Arctic grayling or other selected specieswithin these study areas will be identified and the basic physiochemicaland hydrological characteristics will be assessed. This will includevelocity, depth and substrate data in addition to basic water quality.
Level of Effort:
The impoundment crew wi 11 consi st of two AH bi 01 ogi sts and two RJbiologists operating out of a fixed-base camp located at the mouth ofWatana Creek (RM 194.1). Surveys of the main Susitna River and selectedtributaries will be conducted primarily on foot utilizing helicopter andriver boat support. Lake studies wi 11 be conducted by rafts or on footwith helicopter support to and from the study area.
-83-

-
. 1.~
-
Schedule of Activities and Frequency of Sampling:
Surveys will be conducted in May, June, July, August and September 1982.
Sampling will be conducted once a month at each of the study locations.Sampling trips are scheduled for 15 days per month.
Based on the relative lack of success encountered utilizing standardsampling procedures during the winter 1981-82 studies, and the high degreeof success attained with winter 1981-82 radio telemetry studies, this typeof program will be implemented in the impoundment area; Arctic graylingwill be the target species. Radio transmitter implantation will beconducted in September before freeze-up and radio tracking at periodicintervals will continue through May 1983. During this period overwinteringhabitats of Arcti c grayl ing wi 11 be identifi ed and the general habitatcharacteristics (water quality, velocity, depth, etc.) will be assessed.
Contingencies
During the course of the summer field program, alternative methods forsampling or changes in study sites will be employed when it has beendetermined that the overall objectives of these studies can be best metthrough modifications of the existing program. On occasion, limited, onetime experiments wi 11 be performed to test the 1imitations of sampl i ngmethods, or test some hypotheses as to the validity of some of theassumptions as to the importance of selected factors affecting thedistribution and abundance of species. In addition, examination ofadditional selected sites will be performed on a limited basis when aspecifi c questi on as to the importance of a site as a habitat or for aspecies or other information regarding the overall objectives can beobtained with minimal additional effort. Additions to appendix 8, theinstrument instruction,will be made as new equipment is obtained.
-84-

~ II....
D. DATA PROCESSING
Workplan
The work plan for meeting the data processing and data base managementobjective of the data processing support unit is based primarily on theprocedures developed during fiscal year (FY) 1982. During this timeperiod, data collected from the winter of 1980 through the spring of 1982was cataloged, summarized, and analyzed. Data base management consists ofa four step process which can be summarized as:
1
Il.....
1. Data entry, including coding and keying.
i!
.t-l
2. Data verification, i.e. checking keyed data for accuracy andvalidity.
1I
\-3. Error correction.
Data Entry:
Step two and three above are generally implemented in a recursive manneruntil all mistakes are "caught" and corrected.
Entry of data into the computer was primarily accomplished during FY 1982through a three step process:
into a computer data base managementretrieval, reformatting and report
Load; ng of corrected datasystem, for slJbs-equentproduction.
4.
1. Hand coding of data from field data forms onto computer key punchforms.
2. Keypunching of data from keypunch forms to computer punch cards.
-85-

,....
3. Loading of data from cards to computer disk storage and
eventually onto computer tapes.
The procedure of coding, keypunching, and loading of the data was necessary
due to -vast quantities of data which needed to be processed in a short
period of time, and the availabil ity of only one microcomputer during FY
1982. The addition of two microcomputers and additional staff to the data
processing support unit will allow for direct entry of data from field data
forms into the microcomputer during FY 1983. A software package called
DATASTAR (Micropro 1980a) is used for entry of data via a customized
computer data IIform ll•
Data entry via the software package DATASTAR is generally in the same
format as the field data form upon which the data is recorded. Design of
computer based forms for use in DATASTAR is via the companion software
package called FORMGEN (procedures to be used during form design are
detailed in the next section). The major exception to data entry via
DATASTAR is in the case of wordy comments or notes, which have lel1gths
(i.e. number of characters) which can not be anticipated or controlled.
Notes or comments of thi s type wi 11 be coded, keyed, and punched in the
same manner as the data was in FY 1982, except that keypunching will take
place directly with the microcomputer's full screen editor (SCOPE, Vector
Graphic 1981). Keypunch coding form design is detailed in the Coding Form
Design section.
DATASTAR Form Design:
Computer-based forms for data entry via DATASTAR are designed via the
companion software program called FORMGEN (MicroPro 1980a). Specific
deta il s of the operati on of FORMGEN and DATASTAR are presented in the
DATASTAR User1s Guide (MicroPro 1980a). General principles to be used
during form design is included in the following text.
Computer-based forms are designed to recreate as much as possible the
arrangement and appearance of the field data form. FORMGEN is used to
-86-

r-,
....
create forms for the CRT (cathode-ray tube) screen of the mi crocomputerwhich have two major components:
1. Background text, that is text which is usually printed onto thefield form and is not actual data.
2. Data fields, that is areas where data can be entered during thedata entry stage via DATASTAR.
Background text can be formatted in any manner using all the "printable"characters of the CRT screen (except the underline), but is generallydesigned to duplicate the format of the field data form.
Data fields are positioned and created (by underl ine characters) in thesame positions as those of the field data form. The number of charactersfor each data field is determined either directly from the field form or byconsultation with field biologists, who know the scale and accuracy ofmeasurements to be recorded in each data field. Additional characteristics(besides scale and accuracy) are associated with each data field. Thesecharacteristics include:
1. Order (order in which data entry will occur).
2. Padding (e.g. pad field with blanks or zeros) .
3. Verification (verify data during data entry).
4. Edit mask:
a. Entry control mask (e.g. enter or leave blank, constantvalue, constant decimal point).
b. Content control mask (e.g. allowable characters, that isnumbers or alphabetics, or both, etc.).
-87-

,il~
-
-
,,..
-
These data field characteristics are chosen to maximize ease, efficiency,and accuracy of data entry via OATASTAR. Note that all fields should bepadded with either blanks, or zeros and these edit characters should beIIrecordedll .
An additi ona1 IIdata fi el dll is incorporated in each computer form. Thi sfield is not a data item on the original field data form. This item istermed Observation 10 (OBSIO). The OBSIO serves three purposes:
1. A unique identifier for each individual page of a particularfield data form.
2. A sorting and identifing variable for use by OATASTAR (i.e. a keyfield).
3. As a case identifier for the hierarchical data base system usedon the Boeing mainframe computer system (this data base systemutilizes a software package called Scientific InformationRetrieval (SIR 1979), and is detailed in a later section).
Assignment of OBSIO numbers is a sequential series of "numbers (e.g. 1, 2,3, etc), each series of numbers being unique to a particular field dataform •.
Forms created via FORMGEN can generally be designed to recreate the fielddata form on the CRT screen. However, in some cases, the number of data
fields of the form exceeds the maximum number of fields (245) allowed byFORMGEN. In these cases the field data form is IIdivided ll into two (ormore) different computer based forms. Background text and data field itemswhich are necessary for identification of a particular page (e.g. OBSIO) ofdata is repeated in both computer-based forms.
Coding Form Design:
As previously mentioned notes and comments recorded on field data formswi 11 not be entered into the computer vi a OATASTAR. These notes and
-88-

-
comments will be coded on keypunch coding forms. for later entry via the
microcomputer's editing system (SCOPE). The principles for design of forms
for coding notes and comments are essentially the same as those principles
used duri ng FY 1982 for des i gn of all keypunch codi ng forms. Each form
consist of a legal-sized (8 1/2" X 14") piece of paper with 80 columns and
20 rows (Figure 9). The first 21 columns of every coding form is of a
standard format. The first column is labeled card type and takes on a
value of 1-9 and is used in cases where more than one type of card is
needed to code data from field data forms (e.g. whole page comments on card
type 1 and individual 1ine notes on card type 2) (Note card type is
equivalent to record type in SIR data base schema definition). The next
eight columns (2-9) are for coding of four possible ·sort identifier
variables (S.I.D. #I S 1-4) of two columns each, which can take on a value
of 00 to 99. S.I.D. variables can be used for a variety of reasons, but
are generally used to match up individual card images (80 column records)
with each other. For example, S.LD. #l is always coded as 00 if the
information to be coded in the data fields (columns 22-80) is of a whole
page nature (that is heading information). If the information to be
recorded in the data fields is related to a specific Illine ll of the field
data form, then S.I.D. #1 is coded as the particular line number (e.g. 02
for line #2). Accordingly, S.I.D. #1 is used to match up information
between information coded on more than one card type or individual card
image (i.e. a continuation card). Note that S. LD. #1 is always coded.
S.I.D. #2 is usually used to code a card image's continuation order. That
is S.I.D. #2 is coded as 01 if it is the first in a series of card images
which refer to a unique combination of OBSID (page number) and SID #1
(whole page, 00, or line number). SID #2 need not be coded if only one
card image is needed to code for a particular type of information.
S.I.D. #3 and #4 are generally not used and are accordingly available for
exceptional cases. One case in which S.LD. #3 and #4 was used during
FY 1982 is in the case of correlating data coded on different types of
forms (e.g. point specific data with catch data). In this instance S.I.D.
#3 and #4 are combined into one variable called catalog number. Catalog
numbers are then used to relate the fish catch of a particular. piece of
-89-
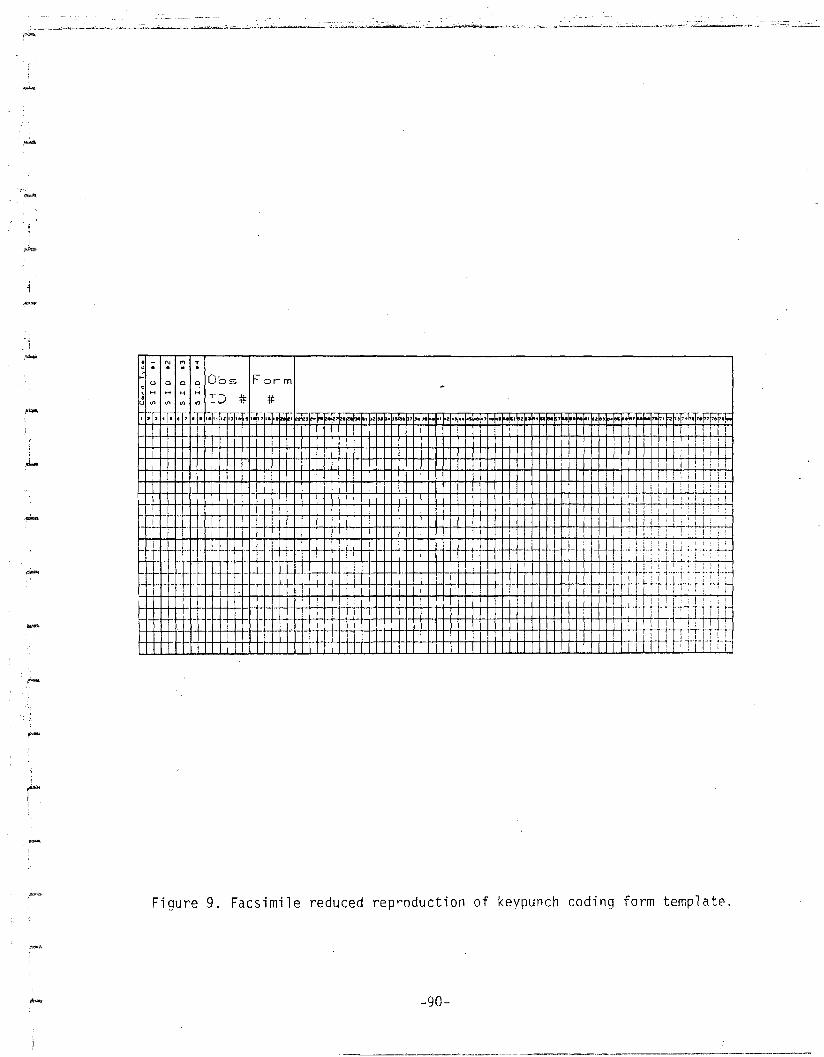
#
• - N l"l ~Q. .. • •, ~
... a a a a Obs For m~
j: tn VJ Ul ID *12 • ;l~;' ~ ; ; ";, ,~,;;;,,~,-;,-;,;~;~ ~ 2~U"'~'2'~'~'" 1~2n ~.~I.24H • • !<e., ••• UI 2~'50 .,.:57"""1'''2 .~.~,;. , ..' .'.. ~Ir~ :;'f·r;,r.FF-F~~
I I I I: !: I !I : !;, T: iT, I I I ! I I II 11 I I ,T i iT
-ffi 1- ',,' . >-.." - -f- - f- _. -+-1+++++ -i-~-+-~I-I--~-+-+4- +-++-+-+-+-I-+-+-+++-Hf-+~- . +H+H j +H;·'H,'~ .~-:- - H-l--'I·+-H-+++I--+-I-t+-+-+-t-I-t-H-+-+++-t--'H-+-+++-H,...f-H-++-H-l-H-++++-+-I,...f-++++-H-+-t-.-,+-+++.........4 -t .....~ : : : " ~
~ l- - . >.-' >-. ' .~ - - - - .,. - - - 1- ; +1·"t++-HJJH :';- H· H->- ->-. - - 1-+-++++-+-+-1-- ,.. -f- -rr I I ! : ! l-tt:'Tr~-+T
H-+-~+~+4-1·· - .
Figure 9. Facsimile reduced reproduction of keypunch coding form template.
-90-
,-. -~. ;---'-. ---'-'---'"",
--
gear with the water depth and velocity (and other pertinent data)associated with the habitat in which the gear was set. Catalog numbers arealso used to relate biological data (e.g. length, age, and sex) of fishcollected with point specific habitat data. Note that catalog numbers willbe coded during FY 1983 via DATASTAR and not directly onto coding forms.
The next six columns (l0-15) of the cod"ing form is used to code OBSID,which as previously explained uniquely identifies a particular page of aparticular field data form. This number is consecutively assigned by DataProcessing and can take a value of 000001-999999. The next six columns(and optionally a 7th column) (columns 16-21 (22)) is used to code the formnumber which corresponds to the form number of the field data form (e.g.AH8206) .
The final 59 columns (22-80) of each card image is used to code data, thatis notes and comments. If a note or comment associated with a whole pageor a particular line of the field data form can not be coded in 59 columns,then the data is continued in the next card image and SID #2 is used toorder which card image is first, second, etc.
Data Entry via DATASTAR:
Procedures for data entry into the microcomputer via the software packageDATASTAR onto computer-based forms generated via FORMGEN is detailed in theDATASTAR User's Guide (MicroPro 1980a). In addition to the proceduresoutlined in the user's guide, the software of DATASTAR provides IIHelpScreens ll whi ch allow for immedi ate access whil e on the mi crocomputer toinstructions and explanations to the data entry (and modification)procedures of DATASTAR.
Coding of Notes and Comm~nts:
Notes and comments recorded on fi el d data forms need to be coded ontokeypunch codi ng forms pri or to data entry into the mi crocomputer. Thereare two basic types of notes or comments:
-91-

. -- - - ~ .- - ,.
--_._-"'~~-'-'._...
--
--
-
1. Whole page that is information recorded relates to the entirepage of data
2. Individual line, that is information relates to an individualline of data on the page.
The coding procedure for both types of data is identical except for "thecoding of S.I.D. #1. The procedure to be followed for coding 5.1.0. #1 isdetailed in the Coding Form Design section. Coding of additional S.1.D.variables along with OBSID and other identifying information is alsodetailed in the Coding Form Design section. Coding of the note or commentinformation is generally exactly as it appears on the field data form ontocolumns 22-80 of the coding form for as many continuation cards as areneeded (if continuation cards are used S.1.D. #2 needs to be coded toindicate order of the card images). Standard and well-recognizedabbreviations can be used but should be avoided if at all possible. Whencontinuing information from one card to the next care must be taken toallow for the proper separation of words. If the last character in a wordis coded in column 80 of one card image then column 22 of the continuingcard image should be left blank in order to separate the last word from thenext. Conversely, if· a word needs to be separately coded onto two cardimages columns 80 of the first and column 22 of the next card image shouldnot be blank. Note dash (-) characters should not be used to indicatesplitting of a word.
Data Entry of Coded Forms VIA SCOPE:
The microcomputers which Data Processing uses come installed with VectorGraphic's full screen editing software package called SCOPE. Specificdetails of the operation of SCOPE is included in the SCOPE Reference Manual(Vector Graphic 1981). SCOPE also provides on-line help screens which canbe used when simple problems arise during data entry.
Data Verification:
-92-
_____ ' ,,~_~_r.~.
_,.~.~-_•• _"-,_"_-"'__'c,="~__,,_ ~-"'~~~'="":"-"-~~__C----"'~"":::.-=.-6~",~,..:._'. __,.~:.c-
Verification of data entered into the microcomputer entails checking foraccuracy of data entered into the computer in comparison to data recordedon original field data forms. The verification process occurs in threedistinct steps.
Initial or automatic verification, this is verification whichoccurs during the data entry phase; and entails checking datafields which uniquely identify a page (DATASTAR) or a card image(SCOPE) (e.g. 08SIO, data S.I.O. #1 and #2, etc.).
Secondary verification, which entails checking of all keyed datafields from standardized computer printouts against field dataforms.
I
L
~
~ 2.
-3. Computerized data checking via customized computer programs,
these programs are written to check for.
a. Valid values using reference computer files (e.g. speciescodes).
b. Valid ranges (minimum and maximum values).
,~
4. "Final" check, which entails production of summary computerprintouts with minimum and maximum values of keyed-in variables,which are then checked against field data forms and checked for"biological" validity.
The 1ast three verifi cati on steps are impl emented iteratively after theerror correction procedure. Steps 2 and 3 above are sometimes followed inthe reverse order. Step 4 above may require input from field biologists tocomplete.
Error Correction:
Correction of keying errors discovered during the verification processoutlined above is accomplished in a similar manner as data entry. However,
-93-

L
:1.. !
I"'"
,~
-
only those data fields requlrlng correction need to be reentered. Whenusing OATASTAR the particular page (as indentified by OBSIO) is brought tothe screen by scanning the data file by "key mode", making the appropriatecorrection and then filing that particular page (Note specific details ofthis procedure are included in the OATASTAR User's Guide (r~icroPro 1980a).After all corrections are made in a OATASTAR file the IlFile Maintenance ll
procedure of OATASTAR should be followed.
When using SCOPE the particular card image line in the data file in whichan error occurs, must be brought up to the screen (by scrolling or jumping)(note the line number is ascertained from the printout). The OBSIO, andS.1.0 #IS should be compared to ensure that the correct line has beenfound. The error should then be corrected in the same manner as duringdata entry. Finally when all corrections are made to the file needed, theeditor should be commanded to exit and file the corrected data file (seethe SCOPE Reference Manual (Vector Graphic 1981) for more details).
OATASTAR to SIR Data File Format:
The microcomputer data files produced by OATASTAR are not in a format whichcan be used in the hierarchical data base system of SIR, which is used onthe mainframe computer system (see Data Base Management section). Thefiles produced by OATASTAR are fixed length records with carriagereturn-line feeds ending each lIrecord". The record length is determined bythe number of positions in all the data fields of one page of· data plus onecomma to separate each data field. Each OATASTAR record containsinformation which is usually represented in multiple card image types forinput to the SIR data base system. Accordingly, the data in one DATASTARrecord needs to be reformatted into the appropriate SIR data card imagetypes. The number and format of the new card images to be produced fromeach OATASTAR record is determined by referral to the appropriate SIR database Schema defination (see Data Base Management Section). Data in eachOATASTAR record is reformatted into card images which have a set format forthe first 21 (22) columns. These first 21 columns are formatted exactlythe same as was described in the Coding Form Design Section (i.e. card typein column 1, S.1.0." #IS 1-4 in coulmns 2-9, OBSIO is columns 10-15, and
-94-

-
,--
-l.
-,"""
-.
-
Form number in columns 16-21). Each DATASTAR record contains data whichdescribes information, which pertains to the whole page and data whichpertains only to an individual line of data.
Whole page information is reformatted into card image files which haveS.LO. #1 (columns 2-3) coded as 00. For one particular card type of wholepage i~formation (e.g. geographic location, i.e. geographic code, SusitnaRiver mile, tributary river mile, and sampling location) one card image isproduced from each individual DATASTAR record. However, more than one cardimage type may be needed to code all the whole page information due tothere only being 59 columns on each card for data coding.
Information contained on an individual line of the original field form andin the OATASTAR record is reformatted into as many card image types asnecessary (note only 59 columns available for data in each card image). Inall cases S.I.O. #1 is coded as the particular line number corresponding tothe original field data form.
When more than one OATASTAR form is required to code one field data form(see DATASTAR Form Design Section) information from all the types ofDATASTAR forms needs to be combined. Whole page information only needs tobe reformatted from one of the DATASTAR forms. However, whole pageinformation from the other forms should be compared to the reformattedversion to ensure accuracy. Individual line information is reformattedfrom all OATASTAR files and then combi'ned according to card type. Note,that in these cases care must be taken that S.I.D. #1 is coded according tothe line number of the original field data form not the line number of eachindividual DATASTAR form.
Reformatting of DATASTAR files to card image files is accomplished byexecution of customized microcomputer programs written in one of thehigh-level programming languages generally PL/I-80 (Digital Research 1980)is used as it is a language ideally suited for reformatting and operatesqui ckly and effi ci ently on the mi crocomputer. Reformatting programs needto be indivi dually written for each DATASTAR form type. Accordi ngly,specific procedures to follow in creating the appropriate programs is
-95-

..-
-
,.....
-
determined by the particular DATASTAR form type and the appropriate SIRdata file format. When executing these reformatting programs the operatorshould confirm that DATASTARls IIFile Maintenance ll procedure has beenfollowed .
Data Base Management
Data base management includes two major tasks:
1. Management of data storage media (e.g. field data forms andmagnetic computer disks and tapes).
2. Management of the data itself (e.g. records or observations,variables, etc.).
The above tasks can be subdivided further by the two different computersystems utilized by the data processing support unit:
1. The microcomputer system with its associated computer diskettes.
2. The mainframe Boeing Computer Services EKSI-CDC 6000 computerwith its on-line disk storage and off-line tape storage.
Microcomputer Data Storage Management:
Data is stored in four formats associated with the inhouse microcomputersystem:
1. Original field data forms.
2. On-line hard magnetic disk files.
3. Off-line floppy magnetic disk files.
4. Paper computer printouts of data.
-96-

-Management of original field data forms primarily consist of filing formsaccording to:
1. Project orlgln (i.e. AA-adult anadromous, AH-aquatic habitat, andRJ-resident and juvenile).
--
-
--
2. Form type (e.g. AH 8206-thermograph data).
3. Observation identification number (OBSID, see sections onDATASTAR and coding form design).
Computer di sk fil es (both on and off 1ine) are Ilmanaged" primarily byon-line software provided ~ith the microcomputer or written inhouse.Specific details of operating the software are provided in variousoperating manuals. G.eneral utility programs along with their purpose andassociated operating manuals are listed in Table 2.
-97-

-~~_,_"_~_~."__=_~,~.~_..._.'~~.~.. ,_..~ "c.,~~~~,,~-~."'~""__~~_~ "_" __ ' ,---------- -,-----. . "---,,._... ---,,- .... .,,_. ,,__..-.- ~__"
Table 2. General microcomputer utility programs used for data basemanagement.
-Program
Name PurposeManual
Reference
-.
-
ERA erase fil es Vector Graphic (1979a)DIR list files Vector Graphic (1979a)REN rename files Vector Graphic (1979a)TYPE type files on CRT Vector Graphic (1979a)
screenSTAT list status of files, Vector Graphic (1979a)
disks, systemPIP copy files between Vector Graphic (l979a,b)
disk/user areaSC data entry Vector Graphic (1981)SUBMIT/XSUB operate in IIbatch ll mode Vector Graphic (1979a,b)SUPSORT sort/merge data within MicroPro (l980b)
and between filesCATALOG catalog disk files SRX Systems (1981)DATASTAR/FORMGEN data entry MicroPro (1980a)
-98-
1-·I
r,1- ..!

_.~__~~,~.~ "",-_._~_--.....=~" _'0. <__.• ~__• __"_--- ..,.-,-_.-~- ....---'.-------,-------.•_-_~_,- -
Data files are entered into the microcomputer via DATASTAR or SCOPE (SC)usually onto on-line hard disk files. During the data entry, verification,and error correcti on phase, these on-l i ne fil es shoul d be copi ed ontoback-up off-line floppy disks on a daily basis.
An individual floppy disk is assigned to each data file type (i.e. DATASTARfiles and SCOPE files associated with one field data form, e.g. AH8206).Each floppy disk in turn is also duplicated onto a back-up disk (this isdue to the fragile nature of floppy disks).
Each data floppy disk is cataloged via the on-line CATALOG command.Specific details of operating CATALOG are listed in the CATALOG operatingmanual (SRX Systems 1981).
After daily backup to floppy disks, the catalog is updated. for eachindividual cataloged disk with the associated date/time that the backupprocedure occured.
I~
-
After all data entry, verifications, and error correction has occurred thefi na1 version of each data fil e is copi ed onto the appropri ate floppydisks, the catalog is updated. to reflect the final nature of the datafiles, and the on-line hard disk versions are erased (ERA). Erasures ofany files (on hard or floppy disks) should be approved by the DP unit'sSystems Analyst or Biometrician. Approval to erase is not necessary forcertain files which are automatically generated by the system(e.g. *.BAK files).
In addition to copying data files to off-line floppy diskette storage, anycustomized programs used to verify, list, correct, or produce reports foreach type of data form should also be filed on the appropriate floppy disk(note that the catalog should reflect the purpose of each program).
Computer printout listings of data and source programs are filed separatelyaccording to field data form type (e.g. AA8214) in computer printoutbinders. Each listing should have the date and time of production listedon the first sheet of the printout.
-99-
~
ioI'
-
-
--.....
.-
-
Microcomputer Data Base Management:
Management of data (i.e. observations and variables) via the microcomputersystem is essentially equivalent to data storage management outlined above.Essentially, most IItrue ll data base management occurs on the mainframecomputer system, as outlined in a later section. However, variousprocedures are carried out on the microcomputer system which is in supportof the mainframe data base management system.
These procedures include:
1. Reformatting data files from DATASTAR format to SIR card-typefiles.
2. Creation and editing of IIprogramll files to be used on the BoeingComputer system.
3. Transmitting and receiving files to and from the mainframecomputer system.
Reformatting data is accomplished via customized computer programs usuallywritten in PL/I-80 (Digital Research 1980). Program files arecreated/edited on the microcomputer's fullscreen editing system (SCOPE,Vector Graphic 1981).
Transmitting and receiving data, program, and printer files between themicrocomputer system and the Boeing Computer System is via the softwarepackages of BSTMS (Byrom Software 1980) and SEND (written inhouse).
Mainframe Computer Data Storage Management:
Data storage medium associated with the Boeing mainframe computer system isin two different formats:
1. On-line magnetic disk.
-100-

.....
.....
· . ~_ ...-
2. Off-line magnetic tapes (located in Bellevue, Washington).
Transfer of data to the on-line disk storage is via BSTMS/SEND as outlinedin the previous section. Data and program files stored on-line should bebacked up to tape on a daily basis, if they are modified in any manner. Inaddition any file which is not consistently used (or accessed) should bepurged from on-line storage in order to reduce computer charges. Purgingof files s~ould only occur after the backup procedure to tape has occurredand only with permission of the Systems Analyst or Biometrician.
Transfer fi 1es between di sk and tape storage formats is vi a the softwarepackages of UDUMPIT/ULOADIT. Details of operating the Boeing ComputerSystems on-line utility procedures are listed in the appropriate manuals.
Mainframe Computer Data Base Management:
Data manipulation, retrieval, listing, and reporting operations, on themainframe computer will be managed via the software package ofSIR(Scientific Information Retrieval, SIR 1979) .
SIR is a hi erarchi ca1 record-ori ented data base management system (DBMS) ..Accordingly, information stored for a particular data base can be"tree-structured". For example, only one record/observation needs to bestored for information describing a whole page of data, while multiplerecords/observations are stored for information describing the individuallines of data on the. original field data form. SIR has keys which allowfor easy access to the appropriate whole-page type of data associated witheach individual line of data. The majority of data bases created via SIR
~
by the Data Processi ng Support Unit wi 11 be structured accordi ng to theformat and nature of the field data form on which the data was originallyrecorded. However, some of the data bases will consist of combinations ofseparate data bases (e.g. catch of fish and aquatic habitat'associated withthe catch).
Specific details of data base creation, loading, updating, maintenance, andreport production is included in the SIR User's Manual .(SIR 1979).
-101-

"""
....
-....
Interfacing of SIR to the statistical software of SPSS (SPSS 1970) and BMDP(Dixon and Brown 1979) is also outlined in the SIR User's Manual.
In addition to using SIR's built-in reporting procedures along with thestatistical packages of SPSS and BMDP, customized reporting programs can bewritten in CDC FORTRAN (CDC 1980b) or CDC COBOL (CDC 1980a). Data files tobe used in these programs can be ori gi na1 fi 1es as recei ved from themi crocomputer or fi 1es reformatted, combi ned, or sorted by SIR or CDCSort/Merge (CDC 1980c).
Data listing and report printer files can be printed on the high-speed lineprinter located at Boeing1s Remote Job Entry (RJE) site in Anchorage,However, letter quality printing can be accomplished by the microcomputer'sprinter via the following procedures:
1. IISave ll printer output from various programs (e.g. SIR) in fileformat.
2. Wrap the file, i.e. run the FORTRAN program WRAP which formatesthe printer file for sending to the microcomputer.
3. Send the file to the mi~rocomputer (via BSTMS).
4. Unwrap received file, i.e. run PL/I-80 UNWRAP program onmicrocomputer.
5. Print file with PL/I-80 PRINTCC command.
,..... -102-

..-
,-~-
.....
111. DATA PROCEDURES
A. ADULT ANADROMOUS FISHERIES STUDIES
Side Scan Sonar Operations
1. PRINTER TAPE STAMP: Each day I s printer tape wi 11 be stamped
(Figure 1) at the beginning and end of the tape as well as
anytime during the day that control settings are changed. Each
morning the tape is to be removed from the counter, stamped on
both sides of the tear and filled with the same information on
each stamp •
2. DAILY LOG FOR SIDE SCAN SONAR COUNTER FORM: This is a summary of
changes in controls which will be up,dated daily (Table 1). The
information is necessary when interpreting sonar counts and
calibration factor data.
3. SIDE SCANNER COUNTER LOG FORM: Details the mechanics of
operation of the counter, substrate and related equipment (Table
2). Any apparent malfunctions should be recorded with
description, frequency, and consistency noted. Also, changes in
sensitivity, spare card changes, raising or moving of substrate,
anticipated problems, and needed repairs on equipment. This is
the place where suggestions on improving operations, notes on
river conditions which might have an effect on the equ~pment, and
general comments should be noted.
4. DAILY SONAR COUNTS FORM: Sonar counts from printer tapes are
entered by hour and sector (Table 3). Counts which register
debris or are skipped in printing should be noted with a "d" or
" S " in the appropriate hour-sector box. Enter "0" if there areno counts. To tabul ate data: An average of the hour on each
side of a skip will be used to interpolate for the debris or skipblock. Counts should be totalled for each sector and each hour.
The grand total is the total of all sectors or all hours (they
-103-

should be equal). This is known as the "daily raw count". Aftereach day·s counts are tabulated and reported, printer tapes andSSS count forms are to be pl aced in notebooks and sent to themain office every two weeks.
,....
---
I
5. SIDE SCAN SONAR COUNTER FIELD COUNTER CALIBRATION LOG FORM: Rawcounts will be calibrated in season by visual monitoring of thecounters with an oscilliscope. Counters will be calibrated aminimum of four times daily. All calibration counts are to berecorded on the Side Scanning Sonar Counter Field Calibration Logform (Table 4).
\
-104-

-,.,..
Location:
~ Date: Time:
Beam Angle:
Velocity:
Dead Range:'"'"'
Live Range:
Observer:
Remarks:
~
-
l~
Figure 1. Printer tape stamp.
-105-
~.,
f·:
._--_._--_._-----
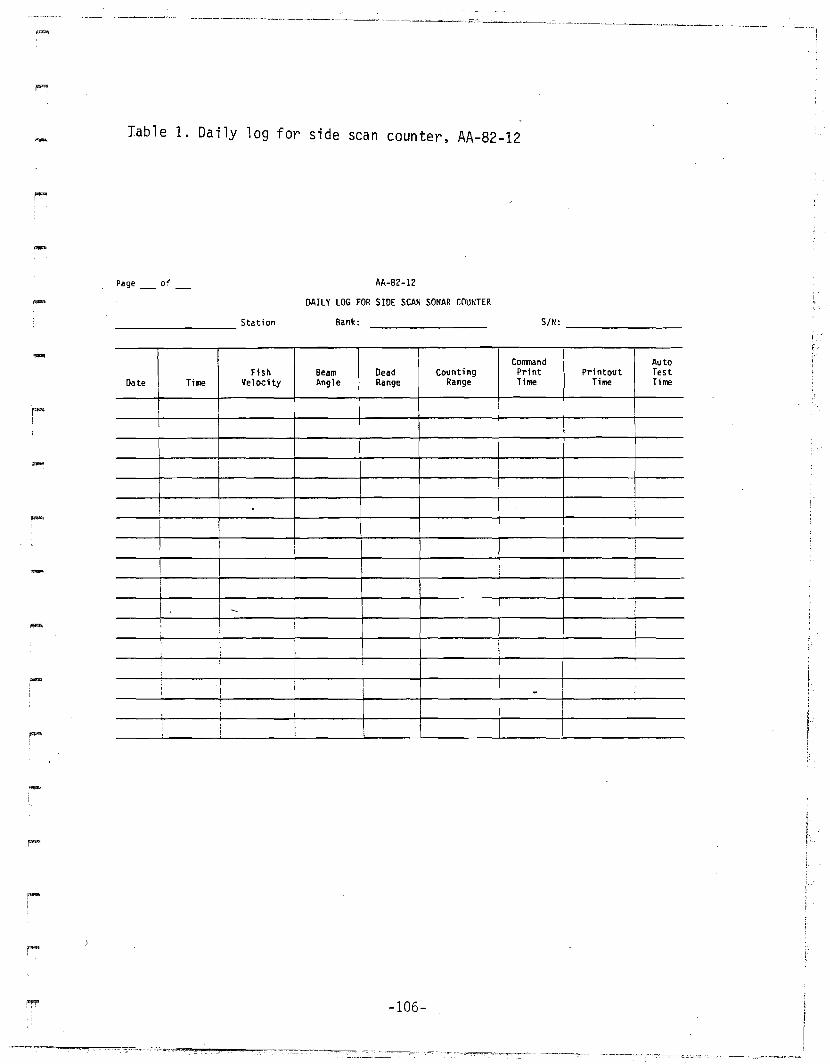
:'~Iable 1. Daily log for side scan counter, AA-82-12
Page of AA-82-12
DAILY LOG FOR SIDE SCAN SONAR COUNTER
_________ Station BanI:: SIN: _
-
Corrmand AutoFish Beam Dead Counting Print Printout Test
Date Time Velocity Angle Range Range Time Time Time
i
i
!I- ,,iI,
, .,,,1I
-106-
ii·r
'~---"""""""''''''''''''''.""_= .. __~'c,"'_..: ...............-.,...-...-,--c=::--c:-:---,-,_~. _._.__.----

.-,
Table 2. Side scanner counter log~ AA-82-13
Page of AA-82-13
Side Scanner Counter Log
....
_________ Station
Bank: _
I
Date Time Remarks (Le. Substrate lifted. any controls reset. etc.)
!
.
-107-

-Table 3. Daily sonar counts, AA-82-09
- Page of
M-82-09
Daily Sonar Counts
Bank: -----------Station:
Date:
Time 1 2Sector
3 4 5 6 Total 7 8Sector
g 10 11 12 Total
.....
01000200 I
0300 I04000500 I060007000800 I
0900 !
1000 I
11001200
13001400
1500 t
16001700 !
1800 i1900 I2000 I ! ,
2100 I i
2200 i
2300 I2400 J
Total
(Total raw counts)------ (Total debris counts)______ (Total good counts)
(debris blocks)'"'T':'"ot::-:a....l--:"go:"":o:-:ar-:::'"co""'u=nt s x 144Total good blocks _
Adjusted Raw Count(Sectors 1-6) _
{rota1 raw counts)------ (Total debris counts)
(Total good counts)------ (debris blocks)Total good counts x 144Total good blocks ------Adjusted Raw Count(Sectors 1-6) _
I·
i" 5.',
TOTAL DAILY ESCAPEMENT (Adjusted raw count sectors 1-6 + 7-12) = _Cor1~'ENTS ON BACK
-108-

-
Table 4. Side scan sonar counter filed calibration log, AA-82-10
AA-B2-IO
SIDE SCAN SONAR COUNTER FIELD CALIBRATION LOG
SIN:Bank:Station.observerl Percent Beam Fish IDate Time Sonar Agree- Width Velocity Sensi- CommentsScope
(Sec/H) tivity,
Count Count ment Al t •• ,! """"Start stop0) (2) 0+2)100 2". 4",,
II ,
:i,,
I
<••
.
I
...,.
.I
-
....
"F"I
i
-109-

.-
Tag/Recapture Operations
Daily Procedures:
-
-
1. Daily fishwheel catches will be reported on the Daily FishwheelCatch Log form (Table 5 or Table 6). Each time a fishwheel ischecked, the catch will be recorded along with the correspondingtime in military hours. Following the last daily check, thecatches will be summarized and entered in the appropriate space.
2. Fish tagged at each sampling station will be recorded on the TagDeployment Log fo-rm (Table 7). This form may be used betweenfishwheels. Information recorded on each fish tagged shallinclude: date, tag number, fishwheel location, species and sex.A summary of the tagging data by species shall be entered in thespace provided on the bottom of the form.
3. Tag recaptures from other sampling stations will be logged on theTag Recapture Record form (Table 8). Recorded information shallinclude: fishwheel location; tag number, color and type; andspecies. A summary of recapture data by species shall be enteredin the space indicated on the form. Fish recaptured at thesampling station where they were tagged will be released and willnot be recorded on the Fi shwhee1 Da i 1y Catch Record form or theTag Recapture Record form.
-110-

-
-
r
Table 5. Daily fishwheel catch log, AA-82~OlA
Page ofDate TYVIMM/DDY: / /_____.StatTOri - --
Daily Fishwheel Catch Log
,Fishwheel Salmon Whitefish lli sc. Total
CatchHours
\ sockeyeHump- eenng
Location Operated chinook pink chum coho' Round back Cisco Species No.
IIEast~ank I II
Upper II j
I
I
Eastbank ilower !, I
iI !
EASTBAIlKITOTAL;
,Westbank IUpper i
1Westbanklower i,
I
WESTBANKTOTAL
DAllY TOTALEAST AND
i I iWEST BANKi
COlTlllents:
-111-
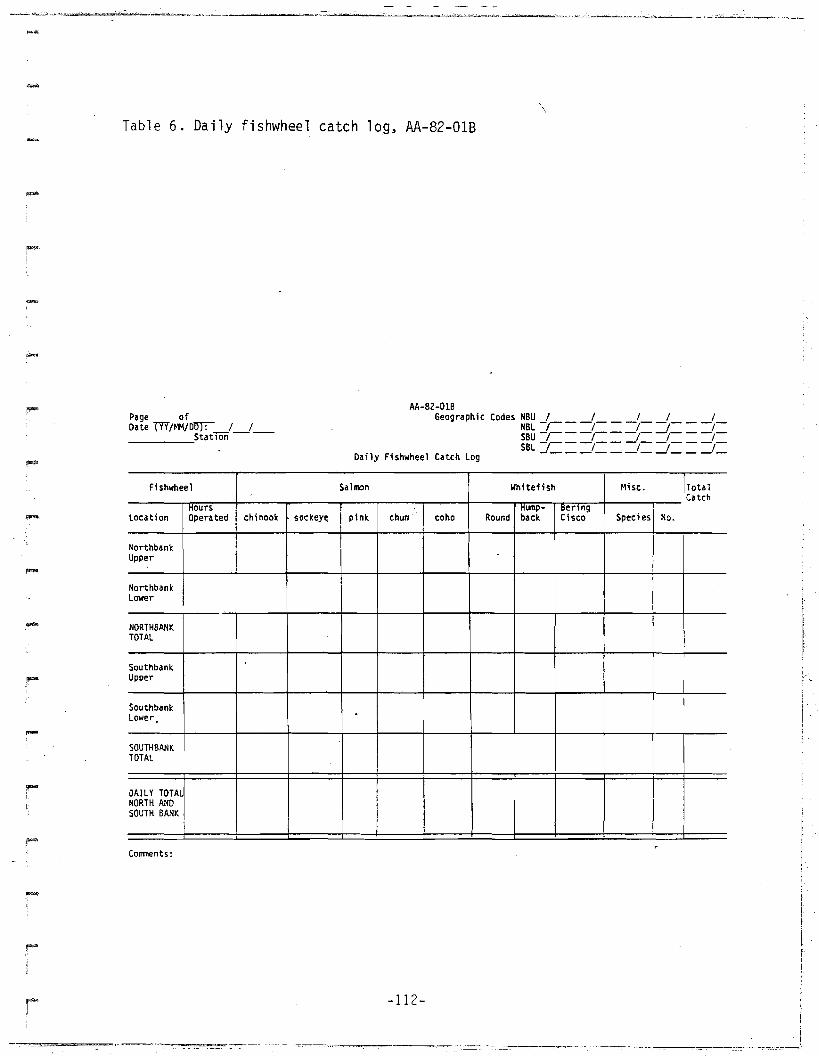
....
-
,.,.,,
-
Tab1e 6. Da i ly fi shwhee1 catch 109, AA-82-01B
Page ofDate TYV/~lM/Dtn: I I____...;Stat1Or1- --
Daily Fishwheel Catch log
\
-
-
-
Fishwheel Salmon Whitefish Misc. TotalCatch
Hours ! Hump- tserlnglocation Operated chinook sockeYE: I pink chum coho Round back Cisco Species No.
lIorthbankUpper
Northbanklower
NORTHBANKTOTAL
SouthbankUpper
Southbanklower,
SOUTHBANKTOTAL
CAll Y TOTALNORTH ANDSOUTH BANK
Comments:
-112-
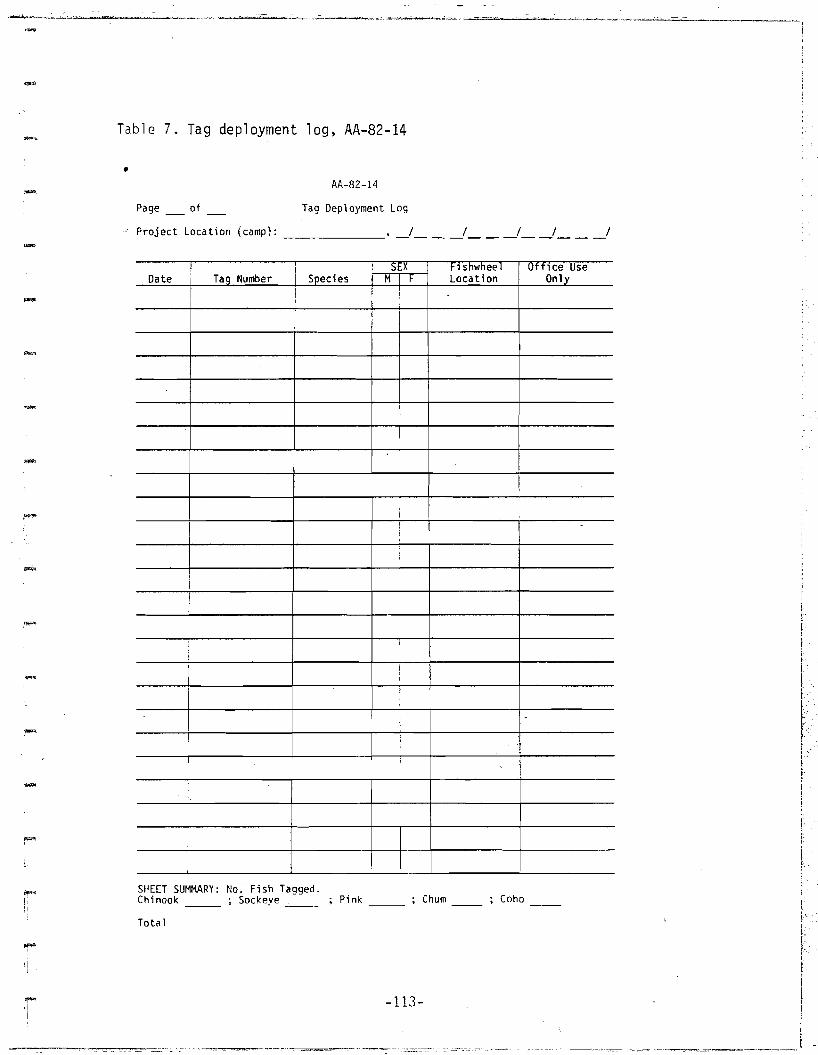
Table 7. Tag deployment log~ AA-82-14
•AA-82-1~
Project Location (camp):-Page of Tag Deployment Log
"...
-
---
! II SEX flshwheel Ufflce Use
Date : Taq Number Species M f Location OnlyI I
1
II
III,,
II
1
-113-
,~
'!"'",Ii
SIJEET SUMMARY: No. Fish Tagged.Chinook Sockeye
Total
Pink Chum Coho

Table 8. Tag recaptured log, AA-82-19
AA-82-19
Page _ of TAG RECAPTURED RECORD
""'"
-
-
-
Project Location (camp): , -1_ _ -1 1_ -1 I
Fishwheel Taq Leave BankDate Location Species
~olorll IType31 (office use only)Number
,
I,I
:I,
!,
I
.,...I
SHEET SUM~lARY INo. Recaptures
ChinookSockeye --------PinkChum ---------Coho _
TOTAL:
11 Color: Int. Orange = 0Yellow = YWhite = W
21 Flay Spaghetti SPetersen Disc P
-114-
,-
.-
......
......
,
....,
Mainstem Survey Operations
The Electrofishing Catch Log form (Table 9) will be completed after eachsampl ing drift. The Electrofishing Data Record for Spawning Fish form(Table 10) will be used to record mainstem anadromous fish spawning sitesand the Adult Anadromous and Resident Spawning Site Map form (Table 11)will be used to map these spawning areas .
The Egg Deposition Log form (Table 12) will be used to record datacollected in egg deposition sampling on suspected mainstem spawning areas.Information recorded will include: date, site, location, and number ofeggs, live and dead, sampled .
Slough and Tributary Surveys
Foot surveys on streams and sloughs wi 11 be recorded on the EscapementSurvey Log form (Table 13). Data recorded on each survey will include,date, stream or slough name, survey conditions, distance surveyed, live anddead fish counted by species and number of live tagged fish by tag type andcolor. The II Remarks II column, in particular will include names of surveystaff and reference to any tag loss. Tags on carcasses will be removed asschedule permits and the information recorded on the back side of theEscapement Survey Log form.
Aerial escapement survey data on chinook salmon will be recorded on theChinook Salmon Survey Log form (Table 14). Information recorded willinclude: survey date, conditions, distance (or reach), and method; numberof live and dead chinook salmon counted; and surveyors name.
Mainstem Set Netting
Results of set netting by the Gol d Creek survey crew wi 11 be recorded onthe RM 150 Set Net Log form (Table 15). Information recorded will include:date, fishing time, location and catch.
-115-

-
-
-
-
-
Bering Cisco Monitoring
The Daily Fishwheel Catch Log form (Table 5) will be used to recordfishwheel interceptions of Bering Cisco. Age and length samples will becollected as defined in Appendix XI, Age and Length Sampling Operations Instructions and Coding except that lengths will be recorded to the nearestmillimeter and will be taken from the tip-of-snout to fork-of-tail.
Eulachon Survey Operations
Set netting resul t wi1l be recorded on the Eulachon -- Estuarine SetNetting Log form (Table 16). Recorded data will include site location,date, fishing time and catch by species.
The Eulachon Spawning Location Log form (Table 17). will be used to recordwhere spawning is found in the mainstem. Information recorded will includea legal description of the location, estimate of abundance and dates.
Sex composition samples will be recorded on the Eulachon Sex CompositionLog form (Table 18). Individual age (otoliths) samples will be stored inpre-labeled vials containing a 50 percent ethanol solution. Correspondingweight and length measurements, collectors name, date, and samplinglocation will be entered in the space provided on each vial label.
-116-
--~----------------_._-----_.-
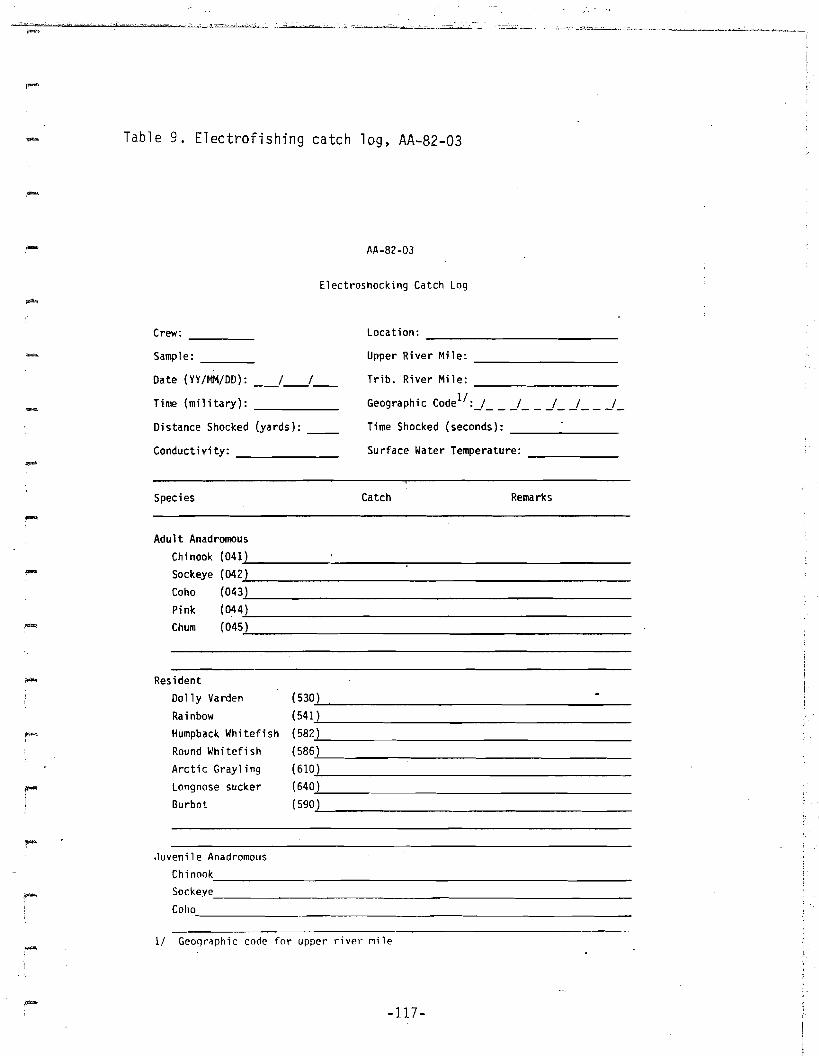
- Table 9. Electrofishing catch log, AA-82-03
AA-82-03
Electroshocking Catch Log
.....Crew: _
Sample: _
Date (YY/MM/DD): 1 1____
Time (military): _
Distance Shocked (yards): __
Conductivity: _
Location: _
Upper River Mile: _
Trib. River Mile: _
Geographic Code11 :j_ _ j _ _ j_...! j_
Time Shocked (seconds): _
Surface Water Temperature: _
-Species Catch Remarks
Adult AnadromousChinook (041../..) ..,....- _
Sockeye (042.../..) _
Coho (043../..) _
Pink (044../..) _
Chum (045../..) _
- Resident
Dolly Varden (530)
Rainbow (541)
r-- Humpback Whitefish (582)
Round Whitefi sh (586)
Arctic Grayl ing (610)
r Longnose sucker (640)
\ Burbot (590)
,Juveni 1e AnadromousChinook, -----,. _
Sockeye _
Coho _
t'
,..... 1/ Geoqr~phic code for upper river mile
-117-
l'.
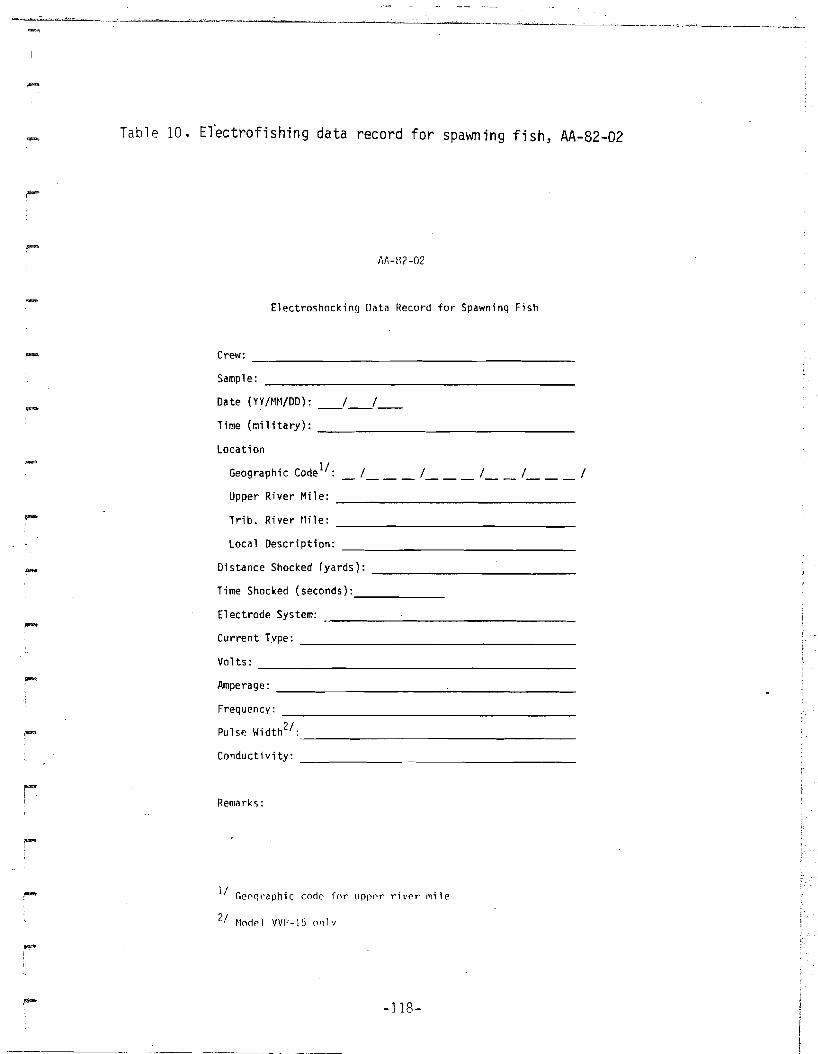
!j~-
......
--
Table 10. Erectrofishing data record for spawning fish, AA-82-02
M\-R?-02
Electroshocking Data Record for Spawning Fish
Crew: _
Sample: _
Date (YY/MM/DD): __1__1__
Time (military): _
location
Geographic COde l/ : _ 1 1 1_ _ 1 I
Upper River Mile: _
Trib. River tlile: _
local Description: _
Distance Shocked (yards): _
Time Shocked (seconds): _
Electrode System:
Current Type: _
Volts:
Amperage:
Frequency: _
Pul se \~idth21: -- _
Conduct i vity: _
Remarks:
II (;eNJI',Jphic code for upppr riv<>r ,.tile
?I Modrl VVP-15 onlv
-118-
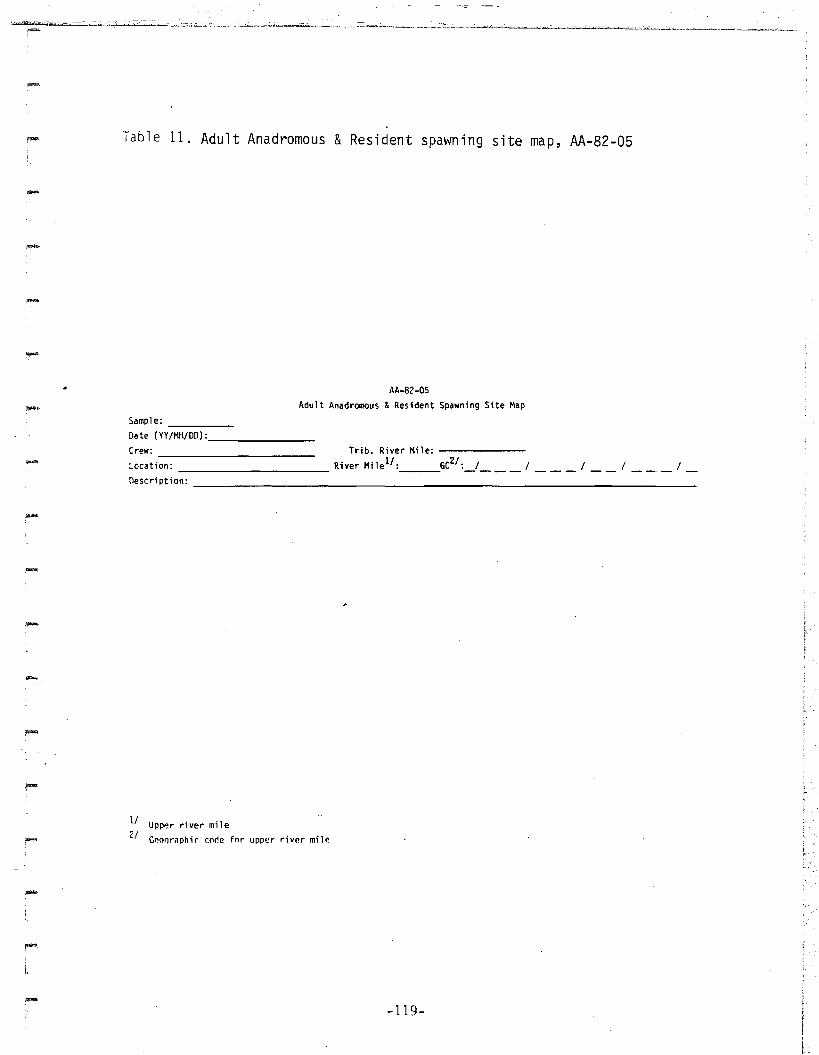
"""
--
-
-
-,
-
-
Table 11. Adult Anadromous &Resident spawning site map, AA-82-05
AA-82-05Adult Anadromous &Resident Spawning Site Map
Sample: _Date (VY/I1II/DO): _
Crew: Trib. River Mile: -----------
location: River Mile ll : GC2/ :_I I I __ / I __Description: _
II Upper river mile2/ G~oqraphif corle for upper river mile
-119-

i-;,;jpr.Qt,
Table 12. Egg deposition log, AA-82-17
- Page of AA-82-17
EGG DEPOSITION LOG
-
.-
--
Plot Number . NUMBER EGGS REMARKSZ/(SeQuential) LIVE DEAD IUIAL
,
•
--
-.
.-
I TOTALS
1/ (YY/MM/DD)
2/ Include names of survey staff and substrate description
-120-
i::' .
'-:-.
.- -,
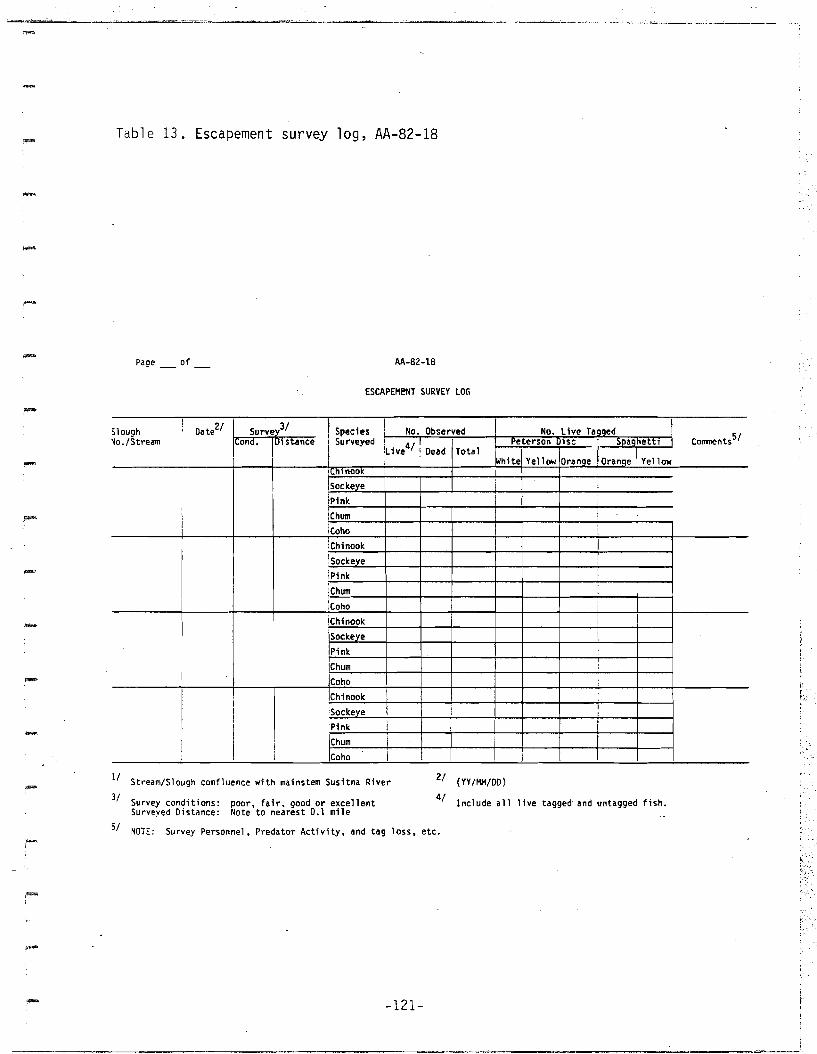
.-
Table 13. Escapement survey log, AA-82-18
"...
,~
of AA-B2-1B
ESCAPEMeNT SURVEY lOG
-
-
!Oate2/ Survey3/ ! No. live Taaaed
!Slough , Species No. Observed 1
ConmentsSI~o./Stream I.ono. Illl.stance Surveyed ! 4/' I'eterson lSC , :.paanettl
!live : Dead TotalWhitel Yellow Oranae IYellow, Oranae
;nlnOOk
i Sockeye i J
Pink l
Chum ICoho ! !Chinook 1 I,SocKeYe :Pink
lChum
Coho:
Chinook i ISockeye i
i
Pink
rChum :- Coho
IChinook:Sockeve
I Pink
I Chum i: Coho
;. - ~ .; .. -
5/ NOTE: Survey Personnel, Predator Activity, and tag loss, etc •.-
,~
11 Stream/Slough confluence with mainstem Susitna River
31 Survey conditions: poor, fair. good or excellentSurveyed Distance: Note to nearest 0.1 mile
2/ (YY/MH/OO)
4/ Include all 1ive tagged and untagged fish.
-121-
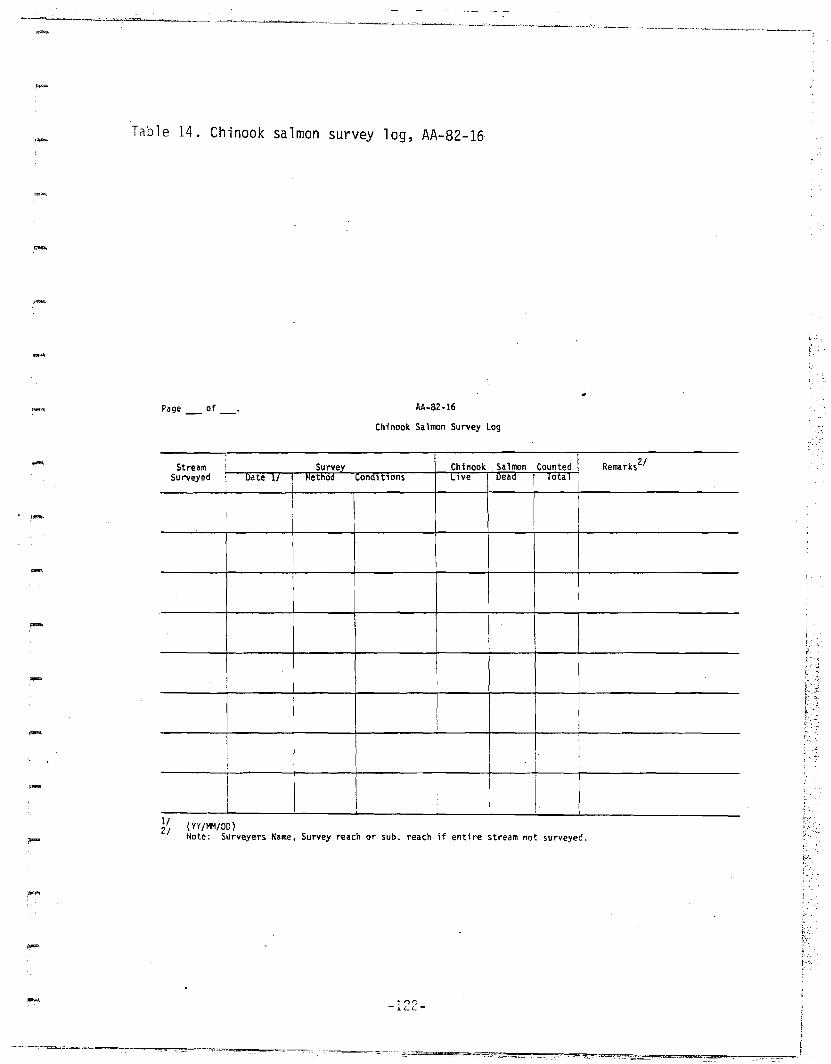
-Table 14. Chinook salmon survey log, AA-82-16
.....
---
Page _ of_. AA-82-16
. ~ -.~ ..
I I I
Chinook Salmon Survey Log
I I
(VY/MM/DD)Note: Surveyers Name, Survey reach or sub. reach if entire stream not surveyed.
Stream Survey Chinook Salmon Counted Remarks ZISurveyed uate 1/ ~letnoo onalt,ons LlVe Ileaa Iota I
f
I
I,I I
I iI
II,
112/
-
-
-
-122-

,~
-
Table 15. RM 150 set net log, AA-82-15
""'"'
-'Page _ of_.
AA-82-15
RM 150 Set Net logSite: No. 1,
No. 2,No. 3,No. - ,
RM 150.4RH 150.2RH 150.1RH
-.
ocatl0n , Nettlng lme2/ I (;atcDate ~lte Kwer Mlle 1 Segln j ~n<l ota I Hours I SockeYE Plnk (;hum (;ohO Uthe Remarh4/
No.I i II i I
i II
I
I ! III
I II
I IiI i II
I iI
1/ Refer to 1981 map defining set net locations.21 Military hours.3/ Note species composition in "Remarks" column.4/ Include names of set net staff, river flow conditions, fishing conditions, and development stage of
fish (i.e. pre-spawning, spawning or post spawning).
-123-,
= ~..."",="""''''''''=~='''''''''''...........~==...",,''''''''',....-~~''C7=c= =.---C=~'" _~.-~-~".J~~ - ....., -"?~,

-
Table 16. Eulachon -- Estuarine set netting log, AA-82-07
AA-82-07
Page _ of _ Si te 1Site 2Site
Eulachon -- Estuarine Set Netting Log
Datell Site No. Tide FishingNet
IN OUT
Time 2/Total(min. )
CatchEu\achon Other3!
Pre- Post;spawners spawners·
Comments
-
-
--- ~ ..J..!----'---....;"....---l-------!
II- yy IMM/DD21 Mil itary Time31 Identifv species in comment section
-124-

Table 17. Eulachon spawning location log, AA-82-06
AA-B2-06
ofEulachon Spawning location L09 1/
Spawning Location Habitat
Date2/ RlVer fl11eLimits (l1l0)
Lower Upper
MH1polnt(Geographic Code)
_/__/__/_/__/
-1_.__/__/_/__/
_/__/__/_/__/
Evaluated3/ iYes (1) iNo (2)
i
C0ll111ents5/
-1__/__/_/__/
_/__/__/_/__/
_/__1__/_/__/
1/ Complete form on those, sites where all of the following criteria are met: A) Fish are freely expelling eggs or milt.B) Fish are in vigorous free-swimming condition. C) Twenty or more fish are caught in the initial or subsequentsite samplin~ effort which meet criteria A through B.
2/ (VY/MrVDD) ·3/ Indicate by numerical code for yes or no.
r',
-
4/
5/
If habitat evaluated. assign a site identification number (e.g .• AH-I, AH-2)
Include subjective estimate of spawner abundance (Le .• low, moderate, high) and where possible an objective estimate.
-125-
f;
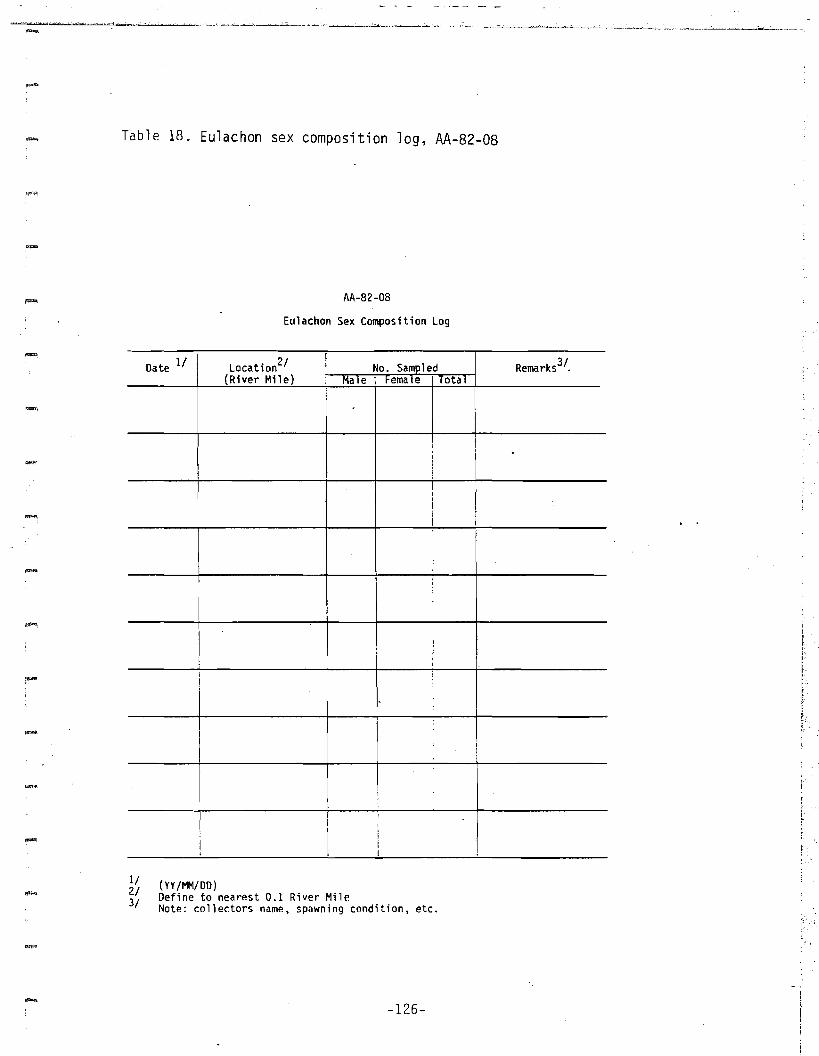
-
-
Table 18. Eulachon sex composition log, AA-82-08
IIA-B2-0B
Eulachon Sex Composition Log
Date 11 Location2/ No. Sampled Remarks3/.(River Mile) I Male Female Total
.
ii I
I .Ii
:!iI
1II
!
I :I
1
,,
!I
,I ,,I I
I II I
tfI,,..'I,.,:I,~ .' .,
~ .,i
,~
1/2/3/
(YY/MM/DD)Define to nearest 0.1 River MileNote: collectors name, spawning condition, etc.
-126-

.....
-
F'II
B. RESIDENT AND JUVENILE ANADROMOUS FISHERIES STUDIES
Data forms
Resident and Juvenile Anadromous Fisheries (RJ) study field data forms arepresented in Figure 2 through 12.
Table 20 presents a summary of the data forms that will be used by each ofthe Resident Juvenile sub-projects.
The Phase I data forms have been modified and revised based on input fromthe project biometrician and several new forms have-also been developed.,
The new biological data form (RJ 82-02) will be used whenever fish 'arecaptured. The Phase I catch form was divided into two seperate forms (RJ82-01) and (RJ 82-05). (RJ 82-01) will be used to record catches fromstandard gear (i.e. minnow traps, fish traps, and trotlines) which arefished at sampling sites on a regular basis. Catches from opportunisticgear (i.e. gill nets, hook and line, electroshockers, and beach seines)which are utilized less frequently or as time allows are recorded on (RJ82-05). These forms will be used primarily by the fish distribution studycrews on the lower river. In the impoundment, where hook and line samplingis the most used sampling technique, two different sampling forms (RJ82-06) and (RJ 82-07) will be used to record catch by gear type. Theelectrofishing crew will log their catch data on (AA 82-03). All crewstagging fish will use the new tag deployment (RJ 82-03) and tag recapture(RJ 82-04) forms which replace the single tagging form used last year. Twonew forms have been developed to record smolt trap catch data (RJ 82-08)and biological data (RJ 82-09). In addition a new form has been designedto record aquati c habitat data (AH 82-01) whi ch wi 11 be collected by RJfish distribution crews. This form contains information on water quality,staff gage measurements, and substrate data. El ectroshocki ng crews wi 11
record data on (AA 82-02), (AA 82-05), (AH 82-ES-01) whenever they discoverconcentrations of spawning fish or identifiable spawning sites. (AA 82-02)will be used to record electroshocking data for spawning fish. Spawning
-127-

File No. 03-82-7.10-2.11 ?aoe __of_-
Catch - Sp.c•••. Cod. NUMb.,
SUSITNA HYDRO STANDARD GEAR CATCH DATA RJ 82-01
FO/SFH I. I. L I.l.ocatlon RM/TRM GC - _ - - - - - - - - - -
O.te: Gear Set -:::J--/--_. Gear Pulled __ / __. _/__. Conector Initials ----------
TIM Ea• .., u ...COl" PIN s ..
Figure 2. Susitna Hydro standard gear catch data form, RJ 82-01.
-128-

File No. 03-82-7.10-2.7 2
susrTNA HYDRO BIOLOGICAL OAT A RJ 82-02
Pa08 __ 0' __
~~~:~~ft RM/TRM GC_L __ L __ L_L__0.'. collected --;;:-/-;;;:-1-;;;- Conectot Initial. _
SIne'" L.ft~U'l l.!.•..!- Ag. I •••• c.,.. 0 ..' ..aH .....".... T., NUMb.' !! " ...... 'IL ICod. elft"') u , H•• Cod, elft.)
1
2
:I
c
5
I
r !
• tI
• U10191/ Iul ~
13 ! I I
14. IU
II
17
16
II
20
Figure 3. Susitna Hydro biological data form, RJ 82.02.
-129-
~~~~-----~------~------"-,--,----_..,._--------

FU. NO. 03-82-1.10-2.73
SUSITNA HYDRO TAG DEPLOYMENT DATA RJ 82-03
0 ••• I i __ tu' UN.T •• Ny....'.' a,., I",et•• "1ft"" a••,I1'" Loell'oft ieocll. ". MO. eta, CO" (MM) ~
0
0
ol0
01o!01 , Io!01010
ot I0
010
0
0
0
0
0
Figure 4. Susitna Hydro tag deployment data form, RJ 82-03.
-130-

FUe NO. 0:)-82-7.10-2.74
SUSITNA HYDRO TAG RECAPTURE DATA RJ 82-04I
ij 0 ... t I •0 • ., Leftot" J ",., "'__"'b., al._H", Loc.U..- "1'4,., ...... j
l COd. r'. l1li0. d.y elM!) ,:
01
0
0
0 I0
0
0
0
0
0
0
0
10
1010
0
0
10
0
0
Figure 5. Susitna Hydro tag recapture data form, RJ 82-04.
-131-

File No. 03-82-7.10-2.75 PaOI __o'__
SUSITNA HYDRO OPPORTUNISTIC GEAR CATCH DATA RJ 82-05
FO/SFHLocation _ RM/TRM _ QC _1 L _ ~L _/_ - _Cate: Gear Set __. _/_.__/ a••rpuued __!__/__conector InIUII' _
T ... £
s.t Punter Tout... M • , ••
t 1 I 17.5' 1.0-
7.5' 1.S-
7.5' 2.0·
7.S' 2.5·
[ 1a I 1.5' 1.0-
7.5' t.5-
7.5' 2.0-
1.5' 2.5-
t J II1
CO"'Me",.:
~.--~8.1t Hook HookTyp, Sin TYIU
I 9 J---+-'-+0--+-----1 __~
12
Figure 6. Susitna Hydro opportunistic gear catch data form, RJ 82.05.
-132-

FUe ~~o. 03-82-1.10-2.75O,·"__ of__
SUSITNAHYDRO OP~ORTUNISTIC GEAR CATCH DATA RJ 82-05
FO/SFHLocation _
Olte: G." S.t _,__/-1 O••r PUlled __/_,__/ __ConeClor InfUall _
( 1 ~
t 1 • I t
I :3 I 1
1f I
T , ... E Clteh - Stncl.. Cod. Numb.'A. '" • , k •
a.1 Puhd Tohl .
--
A'-tel" "4l'~ -- ---
9 !~·1~~_U_"I_1_-_"'_'1l_._a_ftd_'_U_O'_lt_N_O_.__
BIt! 1'40.,," Hook .
~--
Figure 7. Sus;tna Hydro alternate opportunitic gear catch data form,
RJ 82-05.'
-133-

fete No. 03-82- T. '0-2.16 PaOO_OI _
SUSITNA HYDRO PRoposeo IMPOUNDMENT HOOK & LINE CATCH OA fARJ82-06
locaUon RM __. _ GC _L_-' L_L __Oa'. __L_L_ CoUecto,-. 'ft.Il.I. _
Reach TRM
0.0
0.1
0.2
0.3
0.4
0.5
0,,4
0.7
0.8
Tot ••Tim.
•~---+--+---~~---t----""_ ....._...
Comments
Figure 8. Susitna Hydro proposed impoundment hook and line catch data form,
RJ 82-06.
-134-
1
'I1
1
1
1
1
1

Paoe_o. __
SUSITNA HYDRO PROPOSED IMPOUNDMENT OTHER GEAR CoA. TCH DATARJ 62-07
lac,Uon RM/TnM GC _L __L __'-_L __O,te:Sel __'-_L_ Pulled __1__1__ Colleclor". InIU." _
Code L •.ftgth .-JI J
,..... Catch - Sp.c'•• Cod.R.mark,
...~.t ~u".di Toh' ~110 I
",H M....Stu
5
I I
Figure 9. Susitna Hydro proposed impoundmAnt other gear"' catch data form,
RlJ 82-07.
-135-

File t-~o. 03-82-7.10-2.1s Pa oe _of __
SUSlTNA HYDRO DOWNSTREAM MIGRANT TRAP CATCH DATA RJ 82-08
LOta"p_~~~~~~~~~~~~~~~~~~_RM~_.~_.~~L__L __L_L __LConeetor'. Inltlats _
Catch - Specie. CodeRema,k •
........--+0--..-'........-000+----4---:-- _ .. _ ..-+-......- ......----.------..-01
I
----t---+--+--+--+---+--+---+--+---+---l~_+_-_+_-t_-t
~ ... - . -- ~ --~tt--+---+--+--+--""'+--+----+---4~-+---+--t----r--+-......Il---------'-
~ - __ -.L. .-,-.i--.....li---L..--.......- ......-+o--+--+--+--+--o+---t--+---+-__!--.....f.------------.DIU, totlt
"'---
Comment!
Figure 10. Susitna Hydro downstream migrant trap catch data form, RJ 82-08.
-136'-

fUe No. 03-02-1.10-2.79 Paoe_Of__
CoUeeto,'s Initi"Is
SUSITNA HYDRO OOWNSTREAM MIGRANT TRAP OIOlOGICAl DATA. RJ 82-09
loc.tion RM _.. GC _' I I__L __'_
Dale CoUoetcd _ _ L_L _rt.·· MOft. de ..
SCat. Fate R••••tu.'td. No. Cood-
.--._ - -~-----r--.,..----,
SpecI.. LeftC"~ "'0 eC.de .....)
S••c'•• l.ft""C.de «_...1 led. 1fate
•••4..... C.d_fII_••".
I-;.-~- .--J2- - .i-~ ... r-r- ~ --
<II
- - '- .+--1-----4I.
I'18
I'
:to.,
I
•
tI
""20
2'
22
2'
2$
Comments
:tt
••II
.ra.II
.t
••.,.....,......10
Fi gu re 11. Susitna Hydro downstream migrant trap biological
RJ 82-09.
-137-
data form,
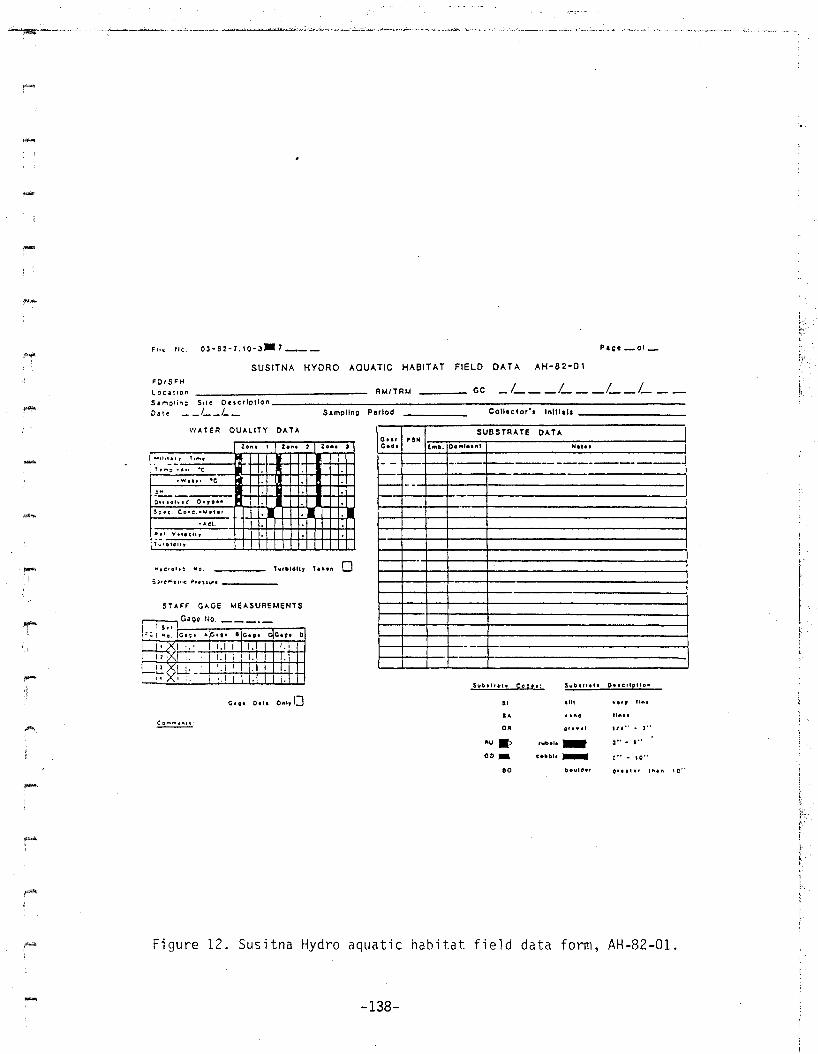
SUSITNAHYORO AOUATIC HABITAT FIELD DATA AH-S2-Q 1
Paoe_o t _
Collector-. Inltilis _
SUBSTRATE DATA
RM/TRM
Sampllng PerIod
WATEA QUALITY DATA
FO/SFH
locationS I molin; SHe De serlt)Ho" ------------_---- _Dare _ _ L_I__
10ft. , %0'" 2 J z.o~. ~a •., 'SN l--~--~r__------------------___lCod. £"'11. Do ","uftt
- ~_._-' -------------------~ ---t-~~--_i'-------------------l
$P'c. COl'lc.- ..... ., . 1 .1 ••lI.t, .....oCH,
i;,'tIt"'t,
~I---.-+---...---.......------------------~
STAFF GAGE MEASUREMENTS
Gaoe NO. ._
(i10' o.u oft"IJ
Svbll, ••• cog •• : $lolbtU." D. ,erlpllo"
SI In, ..,, I If'll
SA 1'''4 Uft"
OR 0' , •• t 'I'" ) ..""U II> tuba"- ," - I"CO _
cnbt•.-. ... - '0"
80 tlo"IOtf 0" ,'If ''''I'' , c"
Figure 12. Susitna Hydro aquatic habitat field data form, AH-82-01'.
-138-

Table 20. List of 1982 Su Hydro field data forms utilized by RJ
sub-projects.
Sub·project
Electroshocking andRadio Telemetry Study
Incubation, Emeregent.andOutmigrant Study
I Resident &Juvenile Anadromous Forms 1/I
-Lon Lon
(I) ,.... 0\<5 N C""'l ¢ <I.J \0 co0 0 0 0 0 "' 0 c:;> cr 0
I I . I I . c:: I .N N N N N N 1-N N N N0::> 0::> co co co co (I) co ~ o;:j CXl........, ..., "J ..., "J "J ..., ..., ..., ...,0::: 0::: 0::: 0: 0:: ex: to 0::: 0:: 0::: 0::
Ii!. I II " I 't.'lixlxt xII', X I
t Ii! !
I III! !xl1xjI I l !
Impoundment Study
Fish 0; stribution Study
Food Habits Study4/
IIX X X, I .
X'X1XlXtXI I
\ I , !1
!i I
112/314{
Sample forms and discussion of specific data collect on presentp.o nRJ Appen<'1ix.Sample forms and discussion of specific data collect on presented n AASamp1e forms and di scus sian of spec i fic da ta co11 cct on presr.ntp.o n AHForms for Fond Habits Study currently being drafted.
-139-

sites of adult anadromous and resident fish will be mapped on (A~ 82-05).(AH 82-ES-Ol) is designed for recording aquatic habitat data at spawningsites discovered by electroshocking crews.
Detailed instructions for coding the forms dicussed in the precedingparagraph are explained in Appendix IX to this manual.
Specific data to be collected
Biological Data:
Biological data collected from each species will be the same as in thePhase I studies with the following exceptions:
1. Otoliths will be collected from Dolly Varden mortalities for ageanalysis instead of scales. Scales collected last year were toosmall to be readable.
2. Heads of all "humpback" whitefish mortalities will be collectedin order to identify to species-by gill raker counts.
3. Cottids will also be identified to species by collecting anycottid not readily identified as a slimy sculpin.
4. The electrofishing crew will take scale samples from the first 20fish of each species captured and then 10 percent thereafter on adaily basis.
Catch and Effort Data:
Catch and effort data will be recorded for each species as it was in PhaseI studies to help determine relative abundance.
Tag and Recapture Data:
-140-
,
":,

....
,-
.-
_ ,1IIIfIi;it.
Tag and recapture efforts have been increased duri ng the 1982 ice-free
field season with the aid of an expanded electroshocking program.
Increased numbers of tagged and recaptured fi sh wi 11 generate a greater
understanding of fish distributions and movements in the Susitna River
drainage .
Aquatic Habitat Data:
Aquati c habitat parameters will be coll ected at all fi sh di stri buti on
sampling locations and suspected spawning sites. Water quality data such
as temperature, pH, dissolved oxygen, conductivity, and turbidity will be
recorded. In additi on stage changes of the river wi 11 be monitored vi a
staff gage measurements and general substrate and cover cha racteri sti cs
will also be recorded.
Report Format
The reports on the studies previously identified will be prepared upon
completion of the 1982 field 'season, although variOus levels of data
processing and reporting will occur during the field season. The field
data will be transferred to the Anchorage office and filed under
appropriate categories. In addition, a field trip prospectus and a field
trip report will be submitted by each crew upon returning from the field.
Deta i 1ed fi e1d notes will be also recorded by the fi e1d crew members and
sub-project leaders.
The reporting format for the draft and final 1982 field season resident and
juvenile reports will be altered somewhat from the previous years
investigations. The reports will address each of the following
sub-objectives:
A. The distribution and abundance of the resident and juvenile anadromous
fish of the Susitna River below Devil Canyon.
1. Factors influencing the distribution and abundance of each
species.
-141-
I '

.-
-
2. Basic biological data on the distribution and abundance ofSusitna River species.
B. The emergence and outmigration timing of salmon species occupying theriver above the Chulitna confluence .
Thi s report will encompass the outmi grati on work estab1i shed by thesmolt trap~ incorporate applicable results of the juveniledistribution studies~ and provide a report of the winter emergencedata collected in the spring of 1982.
C. The development of eggs and juvenile salmon in the river reach abovethe Chulitna River confluence.
This report is separated from the previous report because this studywill proceed throught the winter of 1982-83. The final report willnot be submitted until the early summer of 1983 because of the studycontinuing through the entire 1982-83 winter. The 1982 and 1983spring emergence data will be included in this report.
D. The distribution and abundance of fish within the boundaries of theproposed impoundment.
E. Food preference for selected species and invertebrate distribution inhabitats associated with the mainstem Susitna above the Chulitnaconfl uence.
In all of these reports~ data collected from the different crews outlinedin the field program will be integrated as necessary. This informationwill be used as appropriate to address the objectives outl ined for eachreport.
-142-
! -

--
C. AQUATIC HABITAT AND INSTREAM FLOW STUDIES
Data Forms
Processing of data will be an ongoing activity during the sampling periodwith data analysis, summarization, and report preparation commencingimmediately after freeze-up. Field trip reports will be completedimmediately after each sampling trip and will be limited to highlightingthe findings of each sampling trip. Data forms will be reviewed andsubmitted to the data processing unit immediately upon completion of eachsampl ing trip, for entry into the project computer data base. The draftreport will be completed by the 30th of January 1983.
FY 82 Forms:
Five forms were used during the 1981 open water field season (refer to theAH secti on of the 1981 Procedures Manual for descri pti ons andinstructions). A sixth form (AH-82-07) was developed for winter datacollection combining and adapting the General Habitat Evaluation (AH-81-01)and Point Specific Data (AH-81-02) forms for winter use and its descriptionand instruction are in the data form section (Table 21).
FY 83 Forms (Open Water Season):
Based on input from AH staff and the project biometrician, Phase I openwater data forms have been revised and three new open water forms have beendeveloped to accommodate changes in project sampling plans and to expeditetransfer of field data to the computer. The six data forms to be usedduring the Phase II open water field season are presented as Figures 13through 18 and explained as follows:
1. AH-82-01 - Aquatic Habitat Field DataNew form; to be used by RJ crews for collecting habitatdata. Instructions are included in the RJ section of thisprocedures manual addendum.
-143-
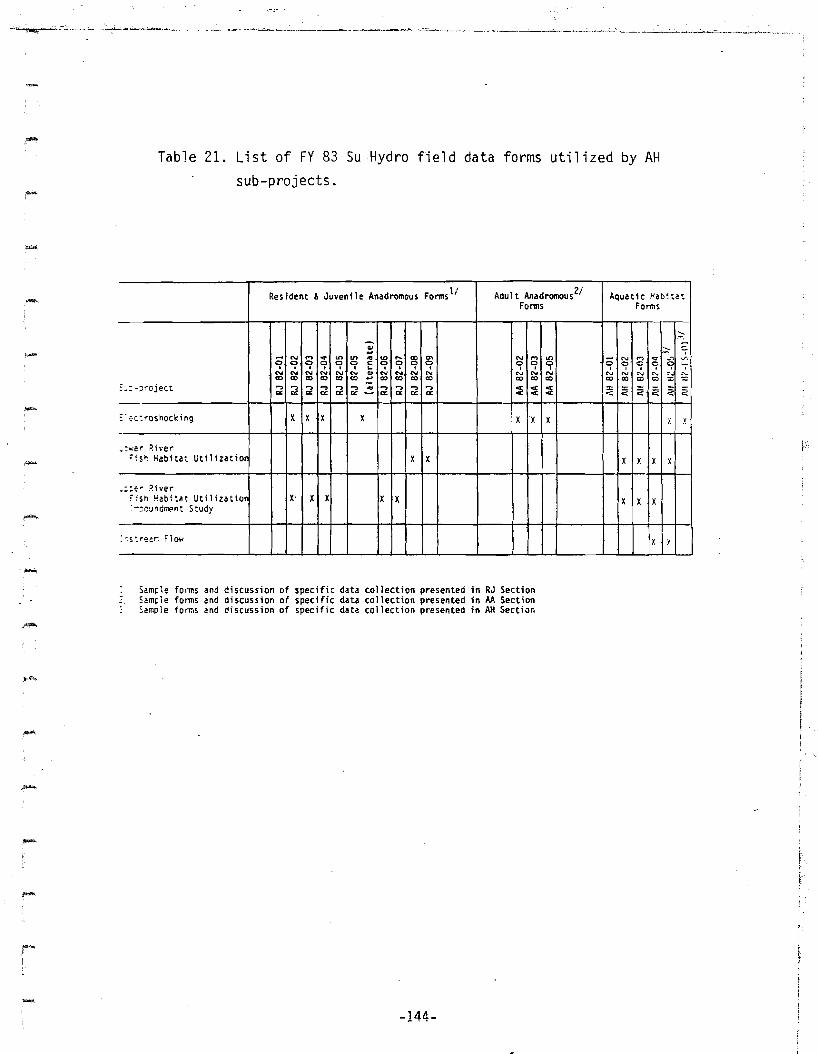
.....
-
...-
Table 21. List of FY 83 SuHydro field data forms utilized by AHsub-projects.
Res ident & Juvenile Anadromous Forms 1/ Adult Anadromous 2/ Aquatic Hab~t.!~
Forms Fonns
....- ,..-,.. ::::;... ,'"
.., ..,. '" U> .. '" .... <Xl '" '".., '" '"
..,~ '? oj.
'9 '9 '9 c '9 '9 c c <::> '9 '9 '9 '9 c <;' '9 '7 .... .. . . ."" "" "" "" "" '" .. '" "" "" N N "" '" N N N N ;:;CD <Xl <Xl <Xl <Xl <Xl ... <Xl <Xl <Xl CD CD <Xl <Xl CD <Xl co co :::;
S.: -;lroject .., .., .., .., .., .., .. .., .., .., ..,~
c( co: '" '" ;;: ;;: ;;: <-"" "" '" '" "" '" ~ '" '" '" '" c( c( <: <:-_.- ~c:roshockin9 X X X X X X X >: X
-_:·...'er- _h'er
:~sh Habitat Uti 1izatior X X X X X X
- ~ to r" River<;sh Habitat Uti] ;zatior X' X X X X X X X:-:;l~undrnElnt Study
-: ~s ·.ree.r. Flow X X
Sample fo,'ms and dscussion of specific data collection presented n RJ SectionSample fonns and dscussion of specific data collection presented n AA SectionSample forms and dscussion of specific data collection presented n AH Section
-144-

-Fii~ Nc. 03-82-7.10-3.• 7 __ Page_of_
SUSITNA HYDRO AQUATIC HABITAT FIELD DATA AH-82-01
SUBSTRATE DATA
___ GC _I L __I__L
Gu. paN 1.,...-"':':'"--:,--:-r---------::--:---------~Code Emb. Oominant Not••
._+---------------
---- -.. -: ._----- --~.~=---=-~ .~ - --11--1-----1--- . -._!
~-I~_4-_+----,..------------------
RMITRM
••••• 11
-WI'.' at
WUlltu)' Time
remg.-Air °c
!'~ -----:----..IIt-+H-II--HH-It-H~O'.lofve4 O.. ~o.n
Spec. Cond ....M.'.r-Adj.
fO/SfHlocationSampling Site Description -:--:-__:- _
Date _ _ L_L_ Sampling Period Collector's InlHals . _
WATER QUALITY OATA-TurbidIty
Turbldlly hhen 08arometric Pressure _
.suba'r." Cod•• : Subltra'. Des-crlpHon
SI alit ",ery fine
SA ••nd lin••
QR "",v.1 " ..... - 3"
RU • rubble _ 3" - $"
CO. cobble _ t U - 10"
BO boulder g-reB'.-r 'han 1'0"
Figure 13. Susitna hydro aquatic habitat field data, AH-82-01.
-145-
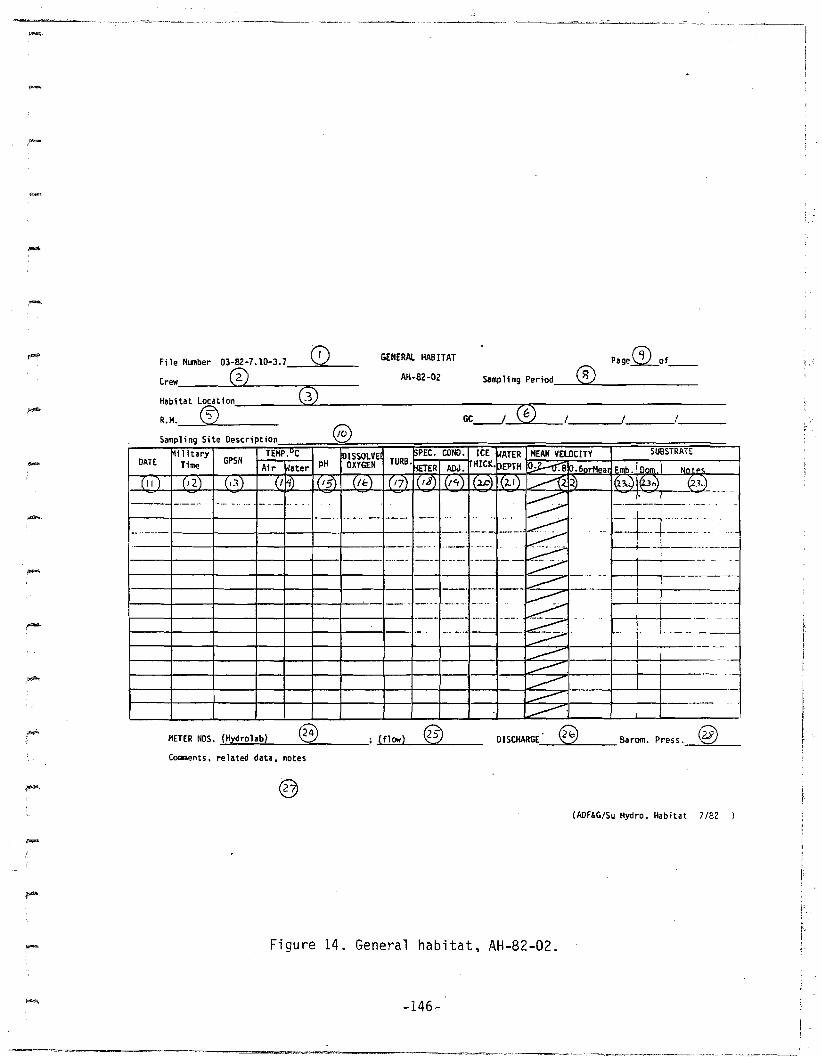
iMiliii.
-
"""""-" -_."~'".""_..._-._-~---_._.""-"---~--"--_."-
fj\Fi Ie NtI11ber 03-82-7.10-3. 7__V=-__Crew, --c....~...:- -",.=;-__
GENERAL HAB ITAT
AH-82-02
page~Of__
sampling period,_~<1[)~8~ __
Samphng Site Description
-
Habitat Locat lonl ~~ _ro;;;_-----------------If: GR.I1._~~""'"____ GC-l_......__, ---l' _
@I'li lltary TEMP."C DISSOLVE PEC. CONO. ICE ~ATER MEAN VELOCITY SUBSTRATE
DATE Time GPSN Air \Aater pH OXYGEN TURB'METER ADJ. HICK'PEPTH ~81o.6orMea IEmb. Dom INn....
-"- --- -- ""-- ." --. "t--- -"-"---" .
."--- ._.:~=---"-_._-_.-
1---------1--1----1--+-+---1--'- =~:=_~-~~~~~~u :=:=++;:=._=..-._._-_----
1--~!-____+-__+-_I___1__+---+~f__-I--I_-I-_l"' =---~I--- :---- -
----------
-
METER NOS • .>.:1H.><Y""dr",o..;,;la::.=b,,-> ....::@""4'-- _
Comments. related data, notes
(flow) DISCHARGE__@""2""1::: Barom • Press ._",:::@~__
(ADF&G/Sy Hydro. Habitat 7/82
Figure 14. General habitat, AH-82-02.
-146-

File No.
Date _
Crew
PLANIMETRIC MAPAH·81·03
rage __ or __
Gage I Height _
Description _.....,
-
Habitat Location Samp! ing SHe ....;River Hile GC I 1 __
{ADF&G/Su lIydro. Ilabltat 5/RI)
Figure 15. Planimetric map, AH-81-03.
-147-
f1I~
l!!
I

File No. _
Crew, _DISCHARGEAH-81 -04
Page__of__
Date _
Habitat Sampling River MeterLocation. --'Site ......;Mi le Type__Ho, _
Gage Humber Heigh~ _GC I I __ I ,_
D scriptioneDistance
from MeanHead Pin Ve.1. Stream Cbs. Revo- Ve1.ocit:y jps cOIn Cel.l. cOIn
( ftl Angle Depth bed Pepth lutions Time Mean MeanDepth !width ArB] new
LB RB Coef. (ft.) E1.Bv. % I. (sec) Poi-rot VeZ'tical Cel.l.(ft.) (ft. (ft:. J (ft3/s)
..
-
-
(ADF~G/Su ~vdro. Habi~at 5/81)
Figure 16. Discharge, AH-81-04.
-148-

01 PQ_O'STAGE OAT A - FIELD FORM
05CD W G) @ AH [.;f} - (~..., (7)
GAGE '"D....TE GlAEi£ ."f1:lT7\- .... ..
TIUE I " ....,;'1::1 I r...,,· .... ~ NOTESy' 010 day ~
..
I ADF&G/SU HYDRO CH8Z) FII. No. 03-82-7. '0-3.7 I
-
-
.-
,....
Figure 17. Stage data - field form, AH-82-05.
...... -149-

RM:,-
F\le'ln. 0Page 00fCrew: S-Date (VY/I1I1/00): %Time (mil itary): :>
IIH-82-£5-01
Sample • _--::r'\_bo<--_Aquatic Habitat Data Electroshocking Form • IQLocation ----:?"""';;-_----=0,..7..L- ""7''''' _
(8) Trib. River 1I1le 0..:.....9)"'- _
loeographicalCode _ / _ a 1 1 .:.... _ 1 1 _
IsaMPle~
Depth Velocity SubHrate £mbeddedness -..~ ~ ..... OJ
I >u U '" u~... . 'OE c E, , (ft) (fps) . ;-' ..- OJ-OJ_ U"u
i 01 U > -- -" ......... .. ... -c ... u '"
1)4: .. ~ "a. "" .. a. :> '" '- :> ;<0.2 0.8 ~~ .... E "'''' u"" _i
~ .. " .... 0:: "'>' .5:.35< ... -... ._ K
"'''' ... "'- 00 VlU_
I 0) @ @ G @ (0 (0 (0 0v C30 (2) iI
!
!I
1I
I
(-.
torrrllen t ')
®5/82
Figure 18. Aquatic habitat data electroshocking form, AH-82-ES-01.
-150-

page~Ofsampling period,__-:.®.....:... ~~_-_=
bGC-I_~",-- J/ _
AH-82-07File IIlJ11ber
Habitat Location, --:.....L ---:,.....,. _
oR.H.__....:'Q..~ _
Crew, --"'"'""-_---:,...,.. _
Sampling Site Description
..... I
Mil itary GPSN TEHP.uC DISSOLVE SPEC. CONDo ICE WATER MEAK VELOCITY SUBSTRATEDATE Time Air t-/ater pH OXYGEN TURa' METER ADJ. HICK. DEPTH /;;O~~.~:::.:,;8;;.li::;.;.6~o.:..rM-e-a t-_C-L-AS-~rl,,-••I'-I.-a~<-.I~-__ I'-I,-A~--I~~
---- f---- -----+----.1
-~---+--_t--f--I___t--_I_-_+_------ ----- -----------+----1---1---1---1----- -----.- ----- "-- - ---- -- - --- -.. --- ----- --.
----- -------- ------_. __...... -'-
t-----j----t----f--+-l--+---1--I--l--+--f---l------ ---. - ---
._------
_.------
1__--+--_+_--4--+---1~_1---_+--_+-------- .-._----.. -- - ------------.- .
t---t---+--t--+-+---+--+--+--f----.1f----f--}---+---l---l--------
I---I---I---I--I--I--I---f--l---l---i--f-- -.--- -- -- ,,--,,--- ... -- --t---+---+---+--f---1--+---+--+--+--+---l~__I_---I----_l_---,------- -- -
METER NOS. ~("'HY:..::d.:.;ro:..:;l::::ab'"'_)__e~2'""4::.....___ ...(-'-.fl""OW:::..)L-_@..:::2.:::;;> _
Comments, related data, notes
~,
o'-:J
(ADF&G/Su Hydro, Habitat 12/28/81)
-Figure 19. PHASE I Winter general habitat form, AH-82-07
-151-"I~rI
r~·

2.
3.
AH-82-02 - General HabitatNew form; revision of AH-82-07 (Winter form) for use byFisheries Habitat Utilization crews. Substrate section waschanged due to revised evaluation technique. This isexp1ai ned in the RJ data form sect i on of th i s addendum.Instructions follow in this section.
AH-82-03 - Planimetric MapSame as AH-81-03. Refer to the FY 82 procedures manual forinstructions.
4. AH-82-04 - DischargeSame as AH-81-04. Refer to the FY 82 procedures manual forinstructions.
5. AH-82-05 - Stage Data - Field FormReplaces AH-81-05. To be used for all stage data collectedby all project personnel. Instructions follow in AppendixIX.
6. AH-82-ES-01 - Aquatic Habitat Data Electroshocking FormNew form; for use by el ectroshocking crews. Instructi onsfollow in Appendix IX.
Phase II (Winter Season):
The General Habitat form (AH-82-02) will be used for recording FY 83 winterdata. This form. is basically the same as the Phase I winter form!AH-82-07! (Figure 19) which functioned quite well last season. This formand all other Phase II AH forms will be subject to revision if provenunworkable or as a result of changes in sampling procedures.
-152-
......
Data Transfer
AH Crews:
.....
-"...
Field crews are responsible for checking their data for completeness,accuracy and proper format (as established by AH staff in conjunction withData Processing (DP), staff). Miscellaneous data and notes recorded infield books should be entered on data sheets if they are to be incorporatedinto the regular data set. Raw field data (original forms) will then betransmitted to the appropriate crew leader for review. This will providethem the opportunity to monitor the development of data trends on a moreti.me ly bas is.
The AH data processing liaison receives the original data after it has beenreviewed by the crew leader. They will check for obvious errors and properformat, xerox and transmit copy to DP and then file the original.
DP will transmit a computer printout of data to the AH liaison who will inturn give it to the appropriate crew to check. All corrections to datafiles will be made through the AH liaison.
RJ Crews:
Habitat data co11 ected by RJ crews wi 11 be gi ven to the RJ da ta processingcoordinator who will then transmit it to the AH data processing liaison.Data will then be handled as AH data: reviewed, then transmitted to DP.computer printouts from DP will be transmitted to the AH data processing1iaison and then to the AHjFisheries Habitat Util ization Crew Leader andthe RJ data processing coordinator for review and editing. All correctionsare to be coordinated through the AH data processing liaison.
-153-
#
_.._.:_'.:~,' _,.: .:~--;=:~-,----::..:;;:;::;r"_.~';.""""-=."",,:,::,,,~ ..,;..:.. ._~~:':'._--"""~_~' .__. "'~ __.""""-_'

.-
--
.-
-
--
IV. QUALITY CONTROL
A. ADULT ANADROMOUS FISHERIES STUDIES
Field sampling techniques and data recording procedures will be monitoredof each crew weekly by the Adult Anadromous Project Leader or his appointeddesignee. This will insure consistency, accuracy and comformance withstandard sampling and data collection and recording methods.
Sampling gear and support equipment will be mainta"ined in good workingorder. It will be the responsibility of each crew leader to insure thatpreventive maintenance is conducted. on all equipment. Minor equipmentbreakdowns will be repaired in the field. Major equipment breakdownsand/or losses will be reported immediately to Anchorage headquarters.Replacement equipment or parts will be provided at first availableopportunity .
B. RESIDENT AND JUVENILE ANADROMOUS FISHERIES STUDIES
Fishing techniques utilized in the various sampling schemes have beenproven for effectiveness in earlier biological studies (Langler, 1956;Sundstrom, 1957; and McClane, 1965). Personnel will be instructed to useproven lures. Natural baits, when used, will be changed regularly insure"freshness" and ensure maximum scent transfer to the water.
Gillnets and seines will be kept mended or will be replaced if badlydamaged in operations. Equipment such as tagging guns, fishing tackle,firearms, and other tools used in day-to-day operations will be cleaned andoiled after each use to prevent rust.
Data forms will be filled out in a neat and legible manner and will besubject to periodic review by the project leader or his assistant.
-154-
....
,~
-
-
..,..
.....
i~
c. AQUATIC HABITAT AND INSTREAM FLOW STUDIES
A systematic approach for maintaining desired standards for the measurementof field parameters has been established for the instruments used in thisstudy. Thermometers are periodically compared to a National Bureau ofStandards (NBS) standard thermometer for the range of temperatures to beencountered. If present, variations are noted and correction factors arecalculated and taped onto each thermometer.
Thermographs are calibrated following the above procedures. Timingmechanisms are also evaluated for accuracy. Operational thermographs areperiodically inspected comparing the temperature and time on the chart withthe known time and temperature data. A mark is made on the chart at thatpoint.
Hydrolabs will be calibrated and checked after each field trip. Whenever aquestion arises concerning the quality data collected, the USGS, EPA, andmanufacturer of the data collection device will be consulted.
Literature is periodically reviewed to insure that state-of-the-art datacollection and analysis techniques are being observed. A hydraulic·engineer will be consulted to evaluate the accuracy of data collection andanalysis techniques. The USFWS is periodically consulted to evaluate theaccuracy of instream flow data collection and analysis techniques.
-The project biometrician is consulted to evaluate the accuracy andstatistical merit for collecting data .
State-of-the-art habitat data collection and analysis courses are attendedwhen it is determined attendance will improve the quality of the program.
The field data are reviewed periodically by the field biologist responsiblefor its collection. A brief narrative is prepared summarizing the habitatcharacteristics described by the. data set. Any abnormal or interveningfield conditions or sampling problems which might have biased the data setare also to be discussed in the narrative.
-155-
- ::....._.~~--~-- ._---

D. Data Routing
Raw data from the respective project secti ons wi 11Anchorage Su Hydro office for copying and filing.follow the path in figure 1.
be forwarded to theActual routing will
Field Crews - - - - Data Forms
Field Crew Leaders - - - - - - - - - - - - Data Folder
Project Leaders - - - - - - - - - - - - - - Data Folder
Su-Hydro Office - - - - - - - - - - - - - - Data Folder
..... Original File
Acres American, Inc.Alaska Power AuthorityAlaska Department of Fish &Game
Working File
Data Processing
Month 1y ReportSpecies/Subject
Report
Figure 1. Data Routing, Phase II, 1982.
-156-

V. SCHEDULE
Project scheduling is as outlined in Figures 1 and 2. By inspecting thefigures, it becomes evi dent that the Adult Anadromous Fi sheri es Projectwill conduct it's field program between June 15 and October 17 at the sitesindicated on Figure 1. The Resident and Juvenile Anadromous FisheriesProject will integrate itls field program with the Aquatic Habitat andInstrealll Flow Project along those river reaches indicated in Figure 2.These projects will operate year round from the estuary to Devil Canyon andfrom March 15 through October 15 upstream from Devil Canyon.
The schedule of planning and reporting events is as follows:
July 15, 1982
July 31, 1982
ADF&G .Draft Procedures Manual FY 83 FieldPrograms. This is a basic internal ADF&G planningand field guidance document.
Woodward-Clyde (Proposed) Draft MitigationOutline.
November 30, 1982 AEIDC (Proposed), Internal Working Document,conceptualizing and visualizing project impacts ona non-quantitive basis.
~,
January 31, 1982 ADF&G, Draft Basic Data Report. This is aninternal working document and also' provides fordata transmittal to AEIDC and Woodward-Clyde andothers as appropriate. It basically presents whatthe data is, how and where it was collected. Thereport would include winter 81/82 data and datafor the ice free season from May thruOctober 1983. This report does not includehabitat versus fisheries relationship informationfor the winter of 82/83 data or incubation studydata collected through the winter of 82/83.
-157-
,-
!

-
......
ESTUARY
TO
VENTNA
RIVER
VENTNA
RIVER
TO
TALKEETNA
TALKEETNA
TO
DEVIL
CANVON
Susttna Statton Sonar (6/15-9/17)
Yentna Sonar (6/15-9/7)
Susitna Survey (7/15-10/1)
Sunshine Sonar (6/15-9/15)
Sunshine Tag/Recapture (6/15-9/15)
Sunshine Survey (7/15-10/7)
Talkeetna Sonar {6/15-9/15)
Talkeetna Tag/Recapture (6Il5-91l5)
Curry Tag/Recapture (6/15-9/151
Gold Creek Survey (7/15-10/]5)
Radio ~aggtng (6/15-]0/1)
..-
] 5 2] 28 4
- JUNE11 18 25JULY
8 15 22 29 5AUGUST
12 19 26SEPTEMBER
3 ]0 17 24 31 7 ]4OCTOBER NOVEMBER
Figure 1. Adult anadromous project schedule, 1982.
-158-

ESTUARY
TO
DEVIL CANYON
L- Surveys of Resident and Juvenile populations (RJ)
I Surveys of Aquatic Habitat and Instream Flow Data Collection (AH)
DEVIL CANYON
- TO· Impoundment Investigations ofRes id n .
TYDNE RIVERAquatic Habitat Investigation (AH)
oNI---.....---.----.--+----;--_<---....'--+-I--t---.•---+----.---
J F M A ~ J J A S 0
MONTH
I
Figure 2. Activity schedule, 1982. Integrated Resident and Juvenile
Anadromous Fisheries and Aquatic habitat ~nd Instream
Flow Project.
-159-
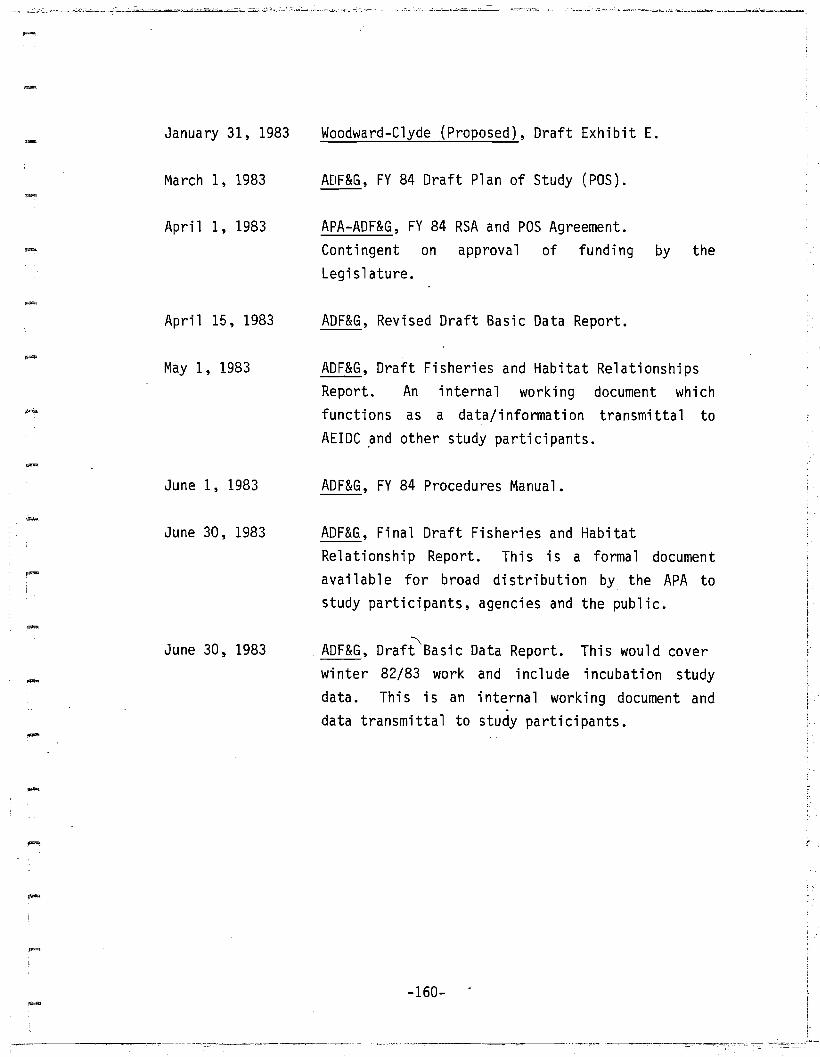
....
.-
January 31~ 1983
March 1~ 1983
April 1~ 1983
April 15 ~ 1983
May 1~ 1983
June 1~ 1983
June 30~ 1983
June 30~ 1983
Woodward-Clyde (Proposed)~ Draft Exhibit E.
ADF&G~ FY 84 Draft Plan of Study (POS).
APA-ADF&G~ FY 84 RSA and POS Agreement.Contingent on approval of funding by theLegislature.
ADF&G~ Revised Draft Basic Data Report.
ADF&G~ Draft Fisheries and Habitat RelationshipsReport. An internal working document whichfunctions as a data/infonnation transmittal toAEIDC and other study participants.
ADF&G~ FY 84 Procedures Manual.
ADF&G~ Final Draft Fisheries and HabitatRelationship Report. This is a formal documentavailable for broad distribution by the APA tostudy participants~ agencies and the public.
ADF&G~ Draft'Basic Data Report. This would coverwinter 82/83 work and include incubation studydata. This is an internal working document and·data transmittal to study participants.
[
- -160-

VI. PERSONNEL
Mr. Thomas W. Trent will supervise coordination of the Su Hydro AquaticStudies. Tom is a 1965 graduate of the University of North Dakota with adegree in biological and physical sciences. After graduation, he undertookextens ive post-baccalaureate and graduate studi es at Oregon StateUniversity in fisheries and water resources.
-
,l!I'JlIIIIl;
I
Tom acquired professional experience in fisheries science and waterpollution biology as a trainee for the Feder Water Quality Administrationand with the Oregon Game Commission Research Division before he joined theAlaska Department of Fish and Game in 1971. Since joining ADF&G, Tom hasheld positions with the Sport Fish Division in the Anchorage area and westside Susitna River sport fisheries management pr~grams, and with theHabitat Protecti~n Section dealing with development activities andenvironmental impact evaluation. In 1974, the Commissioner of Fish andGame delegated Tom the responsibility of developing and coordinating theDepartment1s positions and policies on the proposed Susitna Riverhydroelectric project.
Tom resigned from The Department of Fish and Game in early 1975 to accept aposition with the U.S Bureau of Land Management as the State FisheriesBiologist. He subsequently rejoined the Alaska Department of Fish and Gamein 1976 as supervisor of the Region II Habitat Protection Section. In thiscapacity, Tom was responsible for coordination of fish and wildliferesource planning and ·policy input to the DNR State Land Disposal program,management of the Title 16 regulatroy program for Southcentral Alaska, andcoordination of ADF&G Susitna River Hydro Project matters.
Mr. Bruce M. Barrett will supervise the Adult Anadromous Project. Bruceholds a Bachelor of Science degree in fisheries from the University ofAlaska in Fairbanks and completed on year of graduate study in fisheriesbefore joining the Alaska Department of Fish and Game in 1972.
-161-
....
..-
....
....
--
....
Bruce has held several key positions with the Department of Fish and Game
involving anadromous fish investigations in Cook Inlet and the Susitna
River system. In 1974 he conducted the fi rst ADF&G anadromous fi sh study
on the Susitna River between Devil Canyon and the village of Talkeetna .
Mr. Dana Schmidt Ph.D. replaced Mr. Kevin Delaney in April 1982 as Project
leader for the Resident and Juvenile Anadromous Fisheries Studies. Dr.
Schmidt holds a doctorate degree in Fisheries from Oregon State University
and from the Uni vers i ty of Utah. He has directed numerous envi ronmenta 1
impact studes in Montana and has past involvement with U.S. fish and
Wildlife Service radio telemetry studies in Alaska. He has worked as a
consultant to the Susitna River fisheries since 1981 .
Mr. Christopher Estes will lead the Aquatic Habitat and Instream Flow
studies. Chrsitopher holds a B.A. in Environmental Science from Prescott
College. Prescott. Arizona. Graduate course work at Washington State
University was directed toward instream flow and aquatic habitat evaluation
procedures .
Christopher conducted his first instream flow and aquatic habitat
evaluation study for the Montana Department of Fish. Wildlife. and Parks in
1975. He joined the ADF&G as a fishery research biologist in 1977 and has
been associated with the Su Hydro feasibil ity studies since that time. In
1979. he initiated the ADF&G Instream Flow Program. During the same year.
he was appointed Co-chairman of the Western Division of the American
fisheries Society Water Development and Streamflow Committee. a position he
continues to fill .
-162-

....
--
.-
-
Mr. Allen E. Bingham will supervise the Data Processing Support Unit.
Allen holds a B.S. in Zoology from the Ohio State University, Columbus,
Ohio and received a Master of Science Degree in Fisheries Biology from the
Ohio State University in 1977.
Graduate research and course work continued at the University of Idaho.
Allen1s research at U of I was directed at reduced stream flow effects on
juvenile steelhead trout while course work emphasized Fisheries Biology
with a minor in Applied Statistics.
Allen joined the ADF&G in 1981 as a Biometrician II with the Su Hydro
Aquatic Studies team •
-163-

"'"
-VII. LITERATURE CITED
ADF&G. 1978. Prel imi nary envi ronmenta1 assessment of hydroel ectri cdevelopment on the Susitna River: Prepared for the U.S. Fish and WildlifeService by the. Alaska Department of Fish and Game. Anchorage, AK. 51pp.
Anonymous. 1966. (Cited in ADF&G manual on fish tagging. nd. Ak.Department of Fish and Game. Anchorage, AK.)
AEIDC. 1980. An assessment of environmental effects of construction andoperation of the proposed Terror Lake Hydroelectric Facility, Kodiak,Alaska. Instream Flow Studies: Arctic Environment Information DataCenter. Anchorage, AK. 197pp.
Anonymous. 1981. An assessment of environmental effects of constructionand operation of the proposed Terror Lake Hydroelectric Facility, Kodiak,Alaska. Instream Flow Studies Final Report: Arctic EnvironmentInforamtion Data Center. Anchorage, AK. 419pp.
Baldridge, J. 1981. Appendix 3; Development of habitat suitabilitycriteria, In: An assenssment of environmental effects of construction andoperation of the proposed Terror Lake Hydroelectric Facility, Kodiak,Al aska. Instream Flow Studi es Final Report. Arcti c Envi ronmentInformation Data Center. Anchorage, AK. pp. 391-94.
Baxter, R.M., and P. Glaude. 1980. Environmentalimpoundments in Canada: experience and prospects.Fisheries and Aquatic Sciences. Bulletin 205.
effects of dams andCanadian Bulletin of
Bovee, K.D. and R. Milhous. 1978. Hydraulic simulation in instream flowstudies: Theory and Techniques. Instream Flow information paper No.5.Cooperative Instream Flow Service Group. FWSjOBS-78j33. Ft. Collins, CO.131pp.
-164-

-......
Buchanan, T.J. and W.P. Somers. 1973. Discharge measurements at gagingstations. Techniques of Water Resources Investigations of the UnitedStates Geological Survey. Arlington, VA. Book 3, Chapter A8. 65pp.
Byrom Software. 1980. Byrom software termi na1 mon i tor sys tern opera tor IS
manual. Byrom Software, Vernal, Utah .
CDC. 1980a. COBOL version 4 reference manual. Control Data Corporation,Sunnyvale, California
- CDC. 1980b. FORTRAN versi on 5 reference manual. Control Data
-.~
Corporation, Sunnyvale, California.
CDC. 1980c. Sort/Merge versions 4 and 1 reference manual. Control DataCorporation, Sunnyvale, California.
Digital Research. 1980. PL/I-80 language manual. Digital Research,Pacific Grove, California.
\.
Dixon, W.J. and M.B. Brown. 1979. Biomedical computer programs P-series.University of California Press, Berkeley, California.
Estes. C., K. Hepler, and A. Hoffmann. 1981. Willow and Deception CreeksInstream Flow Demonstration Study. ADF&G. Habitat Protection Section andSport Fish Division. Anchorage, AK. 78pp.
Fulton, T.W. 1983. (Cited in ADF&G Manual on Fish Tagging. nd. Ak.Dept. of Fish and Game, Anchorage, AK.)
substrate dataR&M Consultants.
Griffith, L. 1981.collection techniques.Anchorage, Ak.
Discussion(Persona1
of R&M ConsultantsCommunication.)
-165-

Hagen, R.t~. et. al.diversion projects.Goldman, C.R. et. al.
1973. Ecological impacts of water storageEnvi ronmenta1 quality and water development.W.H. Freeman Co. San Francisco, CA.
andEd.
Hocutt, C.H., J.R. Stauffer, J.E. Edinger, L.W. Hall, and R.P. Morgan.1980. Powerplants - effects on fish and shellfish behavior. AcademicPress. New York, New York.
Keller, E.A. 1980. Environmental Geology. 2nd ed. Chas. E. Merrill Pub.Co. Columbus, OH. 548pp.
Kellerhals, R. and 0.1. Bray. 1970. Sampling procedures for coarsefluvial sediments. ASCE Hydraulics Division. Specialty Conference,University of Minnesota, Minneapolis, MN. August 19-21, 1970.
Lagler, K.F.Dubuque, IA.
1959. Freswater Fishery Biology.421pp.
2nd ed. Wm. C. Brown Co.
- Mauney, J.L. 1965. A study of the channel catfish, (Ictalurus punctatus),in the Crowan River system. Raleigh, NC.; NC. State Univ. Thesis. 87pp.
McClane, A.J. (ed.) 1965. McClanes· Standard Fishing Encyclopedia andInternational Angling Guide. Holt, Rinehart and Winston, Inc. New York,NY. 1057pp.-MicroPro. 1980a. DataStar user's guide.Corporation, San Rafael, California.
MicroPro International
.....
F
I
Mi croPro. 1980b. Super-sort 1. 5 operator I s handbook and programmersguide. MicroPro International, San Rafael, California.
Parsons, M. 1980. Stream Assessment Procedures and Guidelines. SuislawNational Forrest U.S. Forest Service, U.S.D.G. Pacific Northwest Region.Portland, OR. 17p .
-166-
~ ,.-.

Petersen, CGJ. 1894.Dept. of Fish and Game .
(Cited in ADF&G Manual on Fish Tagging. nd. AK.Anchorage, AK.).
.-
-
Richardson, E.V., et. al. 1975. Highways in the river environment;hydraulic and environmental design considerations. U.S. Dept. ofTransportation. Wash., D.C. np.
Rounsefell, G.A. 1963. Marking fish and invertebrates. Fishery Leaflet549. U.S. Dept. of Interior. Wash., D.C. 12pp.
Shirazi, ~.A. and W.K. Sein. 1979. A stream system evaluation. Anemphasis on spawning habitat for salmonids. US Environmental ProtectionAgency. Corvalis, OR, EPA-600/3-79-109/ 39pp.
SIR. 1979. Scientific information retrieval user1s manual.Incorporated, Evanston, Illinois.
SIR
....
.-
Smoot, G.F. and C.E. Novak. 1977. Calibration and maintenance ofvertical-axis type current meters. Techniques of Water ResourcesInvestigations of the United States Geological Survey. Book 8. ChapterB2. Instrumentation. Arlington, VA. 15pp.
SPSS. 1970. Statistical package for the social sciences. McGraw-Hill,New York .
SRX Systems 1981. CATALOG. SRX Systems, San Jose, California .
Stalnaker, C.B. and J.L. Arnette (eds). 1976. Methodologies for thedetermination of stream resource flow requirements: an assessment.USFWS/OBS, and Utah State University, Logan, UT. 199pp.
Sundstrom, G.T. 1957. Commercial fishing vessels and gear. U.S. Fish andWildlife Service. Cir. 48. 48pp.
-167-

--
-
.....
--
Trihey, W.E. and D.L. Wegner. 1981. Field data collection procedures foruse with the physical habitat simulation system of the Instream Flow Group.USFWS, Cooperative Instream Flow Service Group. Ft. Collins, CO. 151pp.
USFWS. 1976. Southcentral rail belt area - Susitna River basin. Fish andWildlife studies related to the U.S. Army Corp. of Engineers DevilCanyon-Watana hydroelectric project. USGWS/ADF&G. Anchorage, AK. 15pp.
USFS. 1981. ASGS/ ADF&G - Su Hydro 1981 Cooperative agreement. USGS.Anchorage, AK. np.
Vector Graphic. 1979a. An introduction to CP/M fratures and facilities.Vector Graphic Incorporated, Thousand Oaks, California.
Vector Graphic. 1979b. CP/M user's guide for CP/M 1.4 owners. VectorGraphic Incorporated, Thousand Oaks, California.
Vector Graphi c.reference manual.
1981. SCOPE-screen oriented program editor for CP/M,Vector Graphic Incorporated, Thousand Oaks, California.
....
~-
Ward, J.V. and J.A. Stanford. 1979. The ecology of regulated streams.Plenum Press. New York, New York.
William, F.T. 1976. Upper Susitna River Investigations. Alaska Dept. ofFish and Game. Anchorage, AK. np. Unpublished .
-168-
f-·,
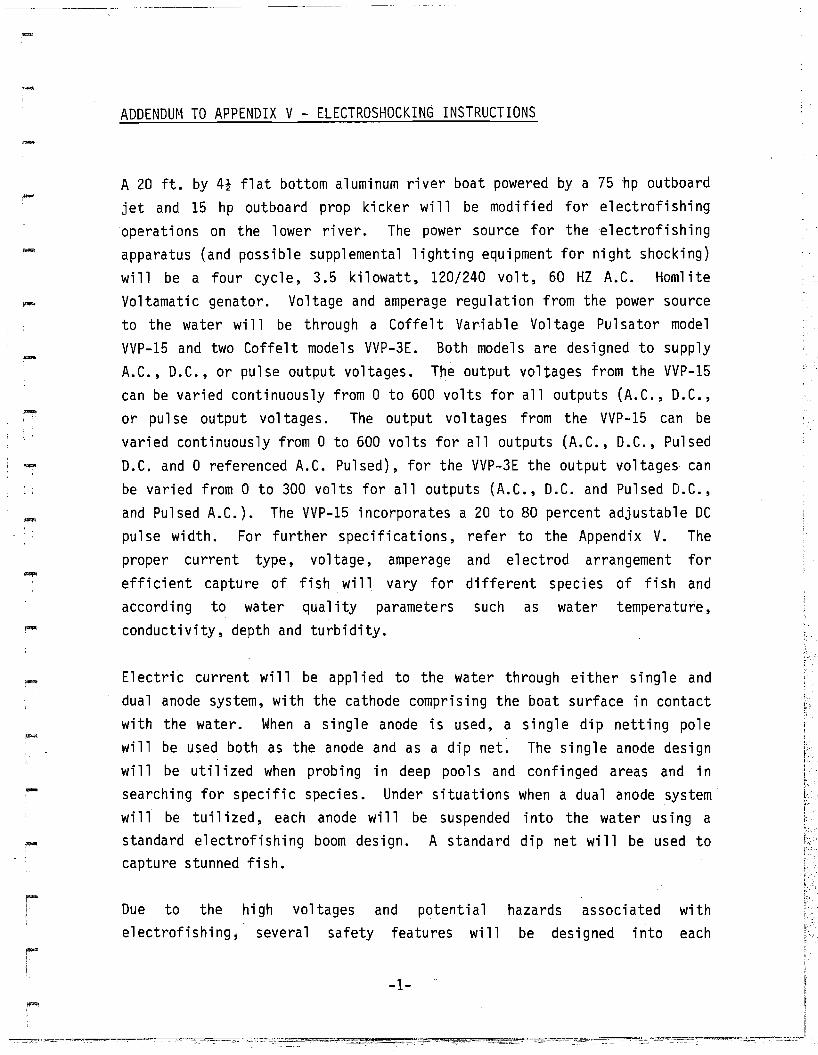
-
-
---"------------ -
ADDENDUM TO APPENDIX V - ELECTROSHOCKING INSTRUCTIONS
A 20 ft. by 41 flat bottom aluminum river boat powered by a 75 hp outboardjet and 15 hp outboard prop kicker will be modified for electrofishingoperations on the lower river. The power source for the electrofishingapparatus (and possible supplemental lighting equipment for night shocking)will be a four cycle, 3.5 kilowatt, 120/240 volt, 60 HZ A.C. HomliteVoltamatic genator. Voltage and amperage regulation from the power sourceto the water will be through a Coffelt Variable Voltage Pulsator modelVVP-15 and two Coffelt models VVP-3E. Both models are designed to supplyA.C., D.C., or pulse output voltages. The output voltages from the VVP-15can be varied continuously from a to 600 volts for all outputs (A.C., D.C.,or pu 1se output voltages. The output voltages from the VVP-15 can bevaried continuously from a to 600 volts for all outputs (A.C., D.C., PulsedD.C. and a referenced A.C. Pulsed), for the VVP-3E the output voltages canbe varied from 0 to 300 volts for all outputs (A.C., D.C. and Pulsed D.C.,and Pulsed A.C.). The VVP-15 incorporates a 20 to 80 percent adjustable DCpulse width. For further specifications, refer to the Appendix V. Theproper current type, voltage, amperage and electrod arrangement forefficient capture of fish will vary for different species of fish andaccording to water quality parameters such as water temperature,conductivity, depth and turbidity.
Electric current will be applied to the water through either single anddual anode system, with the cathode comprising the boat surface in contactwith the water. When a single anode is used, a single dip netting polewill be used both as the anode and as a dip net. The single anode designwill be utilized when probing in deep pools and confinged areas and insearching for specific species. Under situations when a dual anode systemwill be tuilized, each anode will be suspended into the water using astandard electrofishing boom design. A standard dip net will be used tocapture stunned fish.
.-
Due to theelectrofishing;
high voltages and potentialseveral safety features wi 11
-1-
hazards associatedbe designed into
witheach

.-
-
-,..,.
el ectrofi shi ng boat. Each boat wi 11 be fitted wi th 36-40" hi gh
non-conductive coated railing enclosing a non-skid platform. Electrical
units will be placed in covered boxes designed to prevent water from
entering the unit and thereby preventi ng shour-curcuti ng. In additi on, a
safety ci rcu it i ncorporati ng foot feda 1s and falloff switches wi 11 be
included in the circuitry. All individuals working on the electrofish boat
will wear hip boots, life preserver and rubber gloves and be trained in
C.P.R. and basis first aid techniques.
Operational Procedures
1. The power source for electrofishing will be supplied by a 3.5.
kilowatt Homelite Voltmatic generator. The four-cycle engine
uses regular unmixed gasoline. The crank case reservoir oil (30
wt. automotive) must be checked daily and should be changed after
the initial 10 hour break-in period and every 25 hours
thereafter.
2. For optimum electrofising success, a Coffelt electroshocker
(model VVP-15) wi 11 be used to regul ate the output .amperage,
voltage, frequency and current type. A basic knowledge of
electrical terms and uses as they relate to electrofishing will
result in better understand i ng of the effects that occur wi th
adjustment of the power output. The basic unit of electric
charge is the coulomb and the rate at which this charge moves
through a circuit is the amperage. The volt or potential
difference generates the energy (joules) needed to move an
electric charge through the circuit. The amount of voltage
required to move X amount of current through a circuit will vary
with water temperature, water conductivity, and the circuit
resistance. The current types available as output are
alternating current (A.C.), direct current (D.C.) and pulsed A.C.
and D.C. The literature suggests that pulsed D.C. has the best
effective capture range with the least amount of physiological
harm to the fish. Fish that enter a D.C. field exhibit forced
swimming towards the anode-electrode.
-2-
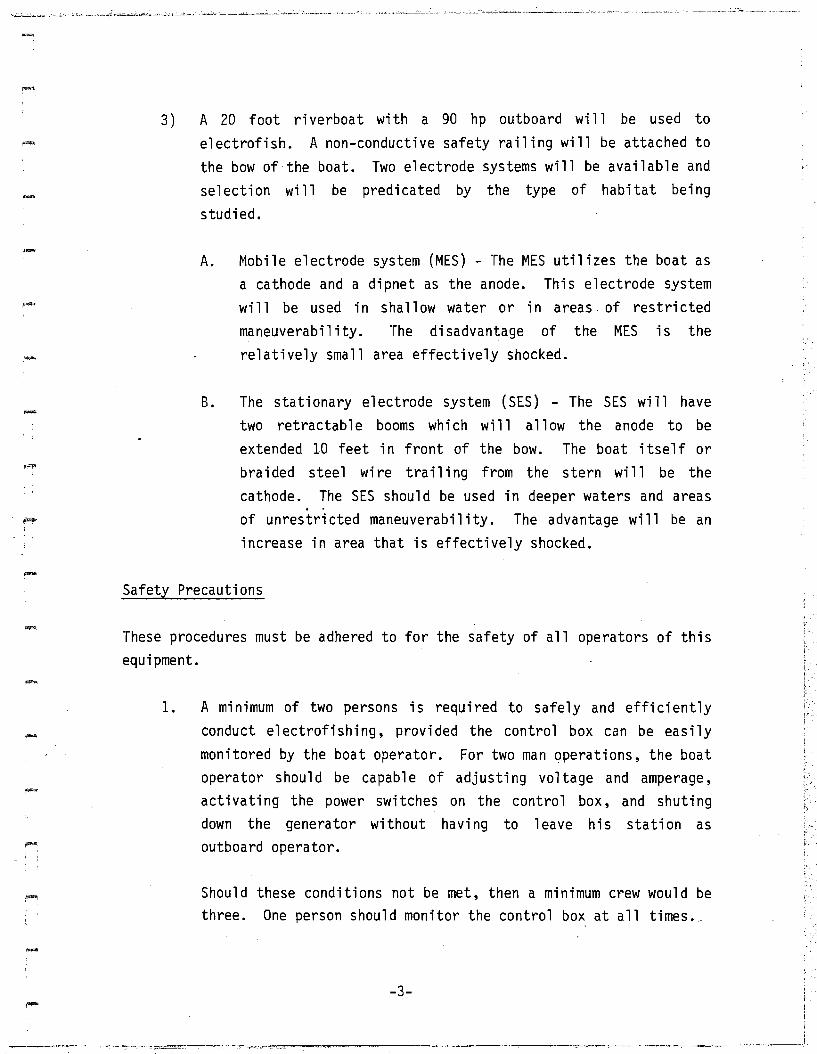
-,~
3) A 20 foot riverboat with a 90 hp outboard will be used toelectrofish. A non-conductive safety railing will be attached tothe bow of the boat. Two electrode systems will be available andselection will be predicated by the type of habitat beingstudied.
A. Mobile electrode system (MES) - The MES utilizes the boat asa cathode and a dipnet as the anode. This electrode systemwill be used in shallow water or in areas, of restrictedmaneuverabil ity. The disadvantage of the MES is therelatively small area effectively shocked.
B. The stationary electrode system (SES) - The SES will havetwo retractable booms which will allow the anode to beextended 10 feet in front of the bow. The boat i tse1f orbraided steel wire trailing from the stern will be thecathode. The SES should be used in deeper waters and areasof unrestri cted maneuverabi 1ity. The advantage wi 11 be anincrease in area that is effectively shocked.
Safety Precautions
These procedures must be adhered to for the safety of all operators of thisequipment.
1. A mi nimum of two persons is requi red to safely and effi ci entlyconduct electrofishing, provided the control box can be easilymonitored by the boat operator. For two man operations, the boatoperator should be capable of adjusting voltage and amperage,activating the power switches on the control box, and shutingdown the generator without having to leave his station asoutboard operator.
Should these conditions not be met, then a minimum crew would bethree. One person should monitor the control box at all times.~
-3-
~' '

- 2. All personnel should be thoroughly familiar with the equipmentand its operation. Personnel should be briefed as to emergencyprocedures should the situation arise.
4. Only dip nets with fully insulated handles will be used.
,....
---
3.
5.
All equipment, connections and wiring should be checked beforeeach day's operation. Particular attention should be payed tothe platform railing and safety foot switch. The railing shouldbe strong and secure enough to support a man I s weight. Thesafety switch must be free of rust and corrosion. The metalrailing should be insulated with foam pipe insulation or plasticelectrical tape. Wiring should be left exposed to facilitateinspection of the insulation.
Personnel will wear only hip boots or chest waders that are completely leak proof. The platform surface should be of a non-skidtype. Rubber gloves are to be worn as an added safety measure.
-
,.,..
6. All personnel will wear life jackets or other adequate floatationdevices.
7. Never start the generator until all connections for theparticular mode of operation are complete. While travelingbetween points of operation, the electrodes should bedisconnected from the electrical source if the generator is to beleft running, i.e., for night operations. ..,
9. When disconnections are made or lines left disconnected, allswitches on the control box should remain in the noffn positionto preclude any load on the wiring.
8. Never change the position of the boom or handle the electrodesunless the leads are disconnected and all switches on the controlbox are in the noffn position.
-4-

10. All personnel should be familiar with first aid treatment forshock victims a~d be trained in artificial respiration. At leastone member of the crew should have completed a recognized firstaid course.
.....
i~
11. The equ i pment sha 11 not be operated in such a manner so as toendanger the public. The current shall be turned off anytime thepublic is in the immediate proximity of the aparatus, be it onshore, in the water, or in a boat.
In an emergency, the electrical current into the water may be brokenin three ways:
1. By releasing the foot pedal switch which is located on theplatform and controlled by the dip net operator.
2. By turning off all switches on the control box. One man must beoperating the control box at all times.
3. By actuating the grounding switch effectively killing thegenerator. If possible, switches should be located both on thedipping platform and near the motor operator and wired so thatactivation of either switch will kill the generator.
Should anyone fall overboard or receive an electrical shock, the unit willbe immediately shut off. Rescue the victim from the water or free him fromthe electrical circuit as quickly as possible. Quick action will increasethe chance of resuscitation. Do not endanger yourself attempting to rescuesomeone with the power on.
If the victim is not breathing, begin artificial resuscitation at once.Mouth-to-mouth is recommended. Continue resuscitation until you arecertai n breathi ng is restored. Frequently, after a temporary recovery, avictim will stop breathing again. If natural breathing stops, resumeartificial resuscitation at once.
-5-
I.,"
, .
!.r,.
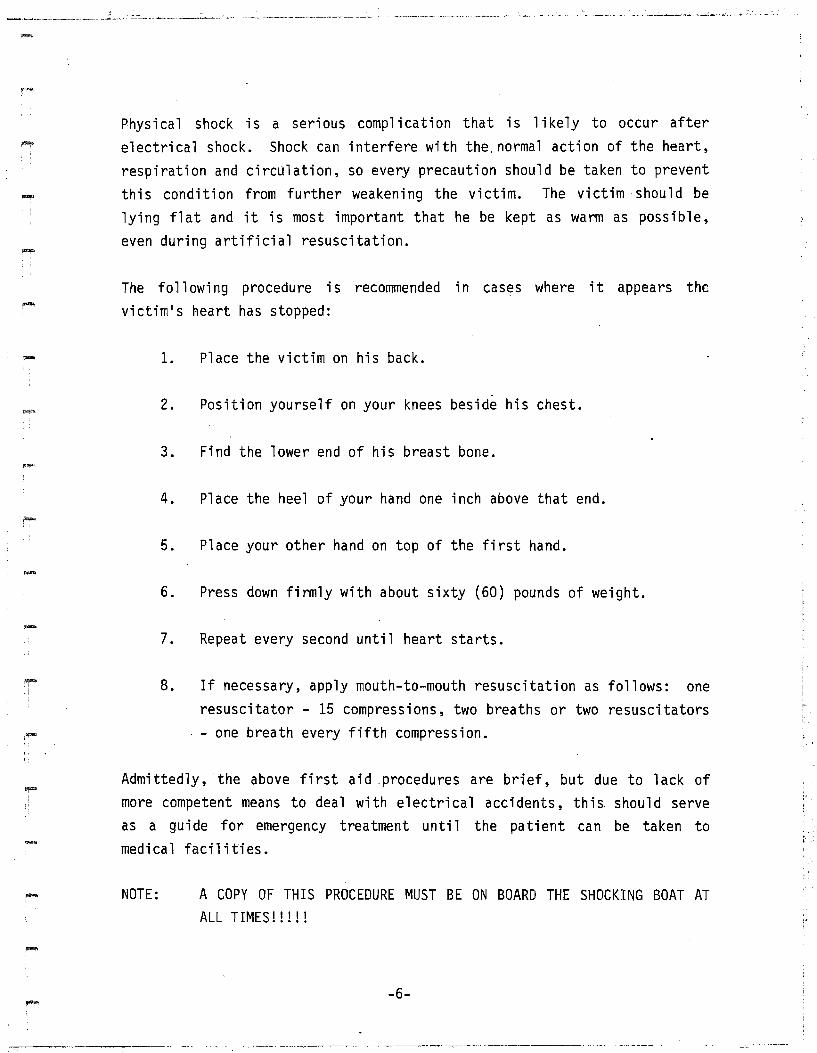
Physical shock is a serious complication that is likely to occur afterelectrical shock. Shock can interfere with the. normal action of the heart,respiration and circulation, so every precaution should be taken to preventthis condition from further weakening the victim. The victim· should belying flat and it is most important that he be kept as warm as possible,even during artificial resuscitation.
- The following procedure is recommended in cases where it appears thevictim's heart has stopped:
1. Place the victim on his back.
2. Position yourself on your knees beside his chest.
3. Find the lower end of his breast bone.
4. Place the heel of your hand one inch above that end.
5. Place your other hand on top of the first hand.
6. Press down firmly with about sixty (60) pounds of weight.
7. Repeat every second until heart starts.
8. If necessary, apply mouth-to-mouth resuscitati on as foll ows: oneresuscitator - 15 compressions, two breaths or two resuscitators
one breath every fifth compression.
Admittedly, the above first aid procedures are brief, but due to lack ofmore competent means to deal wi th e1ectri ca1 acci dents, th i s shoul d serveas a guide for emergency treatment until the patient can be taken tomedical facilities.
,~
NOTE: A COpy OF THIS PROCEDURE MUST BE ON BOARD THE SHOCKING BOAT ATALL TIMES!!!!!
-6-

-
APPENDIX IX - FY-83 DATA CODING AND INSTRUCTIONS
1982 Addendum To The ADF&G Su HydroPhase I Procedures Manual
'" --

-ADULT ANADROMOUS FISHERIES STUDIES
Age and Length Sampling Operations - All stations
The follow"ing sampling procedures will be used to collect age andlength data from fishwheel interceptions at Susitna, Yentna, Sunshine,Tal keetna and Curry Stati ons. These procedures wi 11. be foll owed forsockeye salmon stock separation sampling except that two (2) scaleswill be collected from the "preferred area ll instead of only (1) scale.
Fish Sampling Procedures:
1. Check species of each intended sample (see Pacific Fishes ofCanada, Fisheries Research Board of Canada, Bulletin 180, Ottawa1973).
2. A scale should only be taken from the left side of the fish (seeFigure 1).
3. The "preferred scale" is located two (2) rows above lateral lineon the diagonal from the posterior insertion of the dorsal fin tothe anterior insertion of the anal fin.
4. If the preferred scale is missing take a scale, again on the leftside of the fish, within the area behind the dorsal fin butforward of the ventral fin, and no more than four rows above thelateral line.
5. If no scales are present in this area, discard the fish.
6. If the scale is stuck or dried, moisten and pull toward the headof the fish gently rather than straight back.
7. Clean all slime, grit, skin and silver pigmentmoistening and rubbing it between the fingers.be completely clean and transparent.
-1-
from the scale- byThe scale should

8. Mount on gum card after moistening. Scales are mounted on thegum card number which corresponds to Age Weight Length (AWL) formnumber containing the length, weight and sex information for thatfish. Place it directly over the number on the gum card with theanterior edge facing the bottom of the card (Figure 1). Theridged side of the scale must be facing upward or no impressionwill be made in the acetate card. This is the same side that isexposed on the salmon.
9. Cover completed gum cards with wax paper after drying, ifpossible.
.-
--.-
,~
,.,..
10. Length measurements should be taken from mid-eye to fork of tailand recorded to nearest five millimeters on all adult salmonexcept chinook salmon for which lengths are to be recorded to thenearest 10 millimeters .
-2-

-
LEFT SID£
Take the P"ifecred scale thelef~ .iCe of the fish.t>ooCO:oos"i""'e the .l"~te<" Hne ano an tile~~ U::' behinD tile b&a of
'r..t U''t'ed Scal.
OF" OC~SA.L FIN
AllOV£
LA.n:.!u!- 'L;H!:
FIN
Laceral Lla.
Do no~ turn scales over whent<atl&fe<i"9 f<CIIll fbh to 9.... carl!.
~I
-
L_------~
~.~-~...Place ocales c!.I.<ecUy over namt>e< on
.$9'" CoI.l:Q.
10 8 8 5 • :I :I. 1
20 19 18 17 16 1.5 l' 1.3 1.2 II
50 29 28 'i:1 26 Z :I.' Jl.' Z! :J.
40 39 3S J1 :18 :IS j;i JJ J:I. 31
Figure 1. Scale sampling procedures for one scale per fish.
-3-
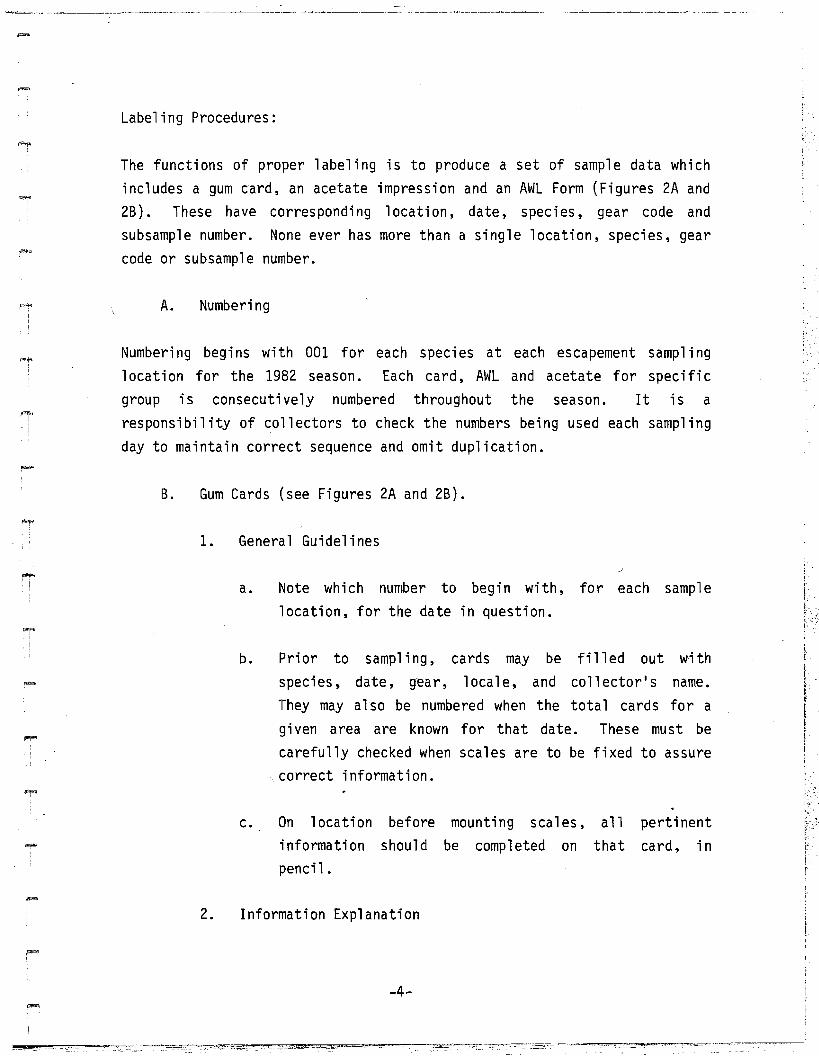
Labeling Procedures:
The functions of proper labeling is to produce a set of sample data whichincludes a gum card, an acetate impression and an AWL Form (Figures 2A and28). These have corresponding location, date, species, gear code andsubsample number. None ever has more than a single location, species, gearcode or subsample number.
A. Numbering
Numbering begins with 001 for each species at each escapement sampl inglocation for the 1982 season. Each card, AWL and acetate for specificgroup is consecuti ve ly numbered throughout the season. It is aresponsibility of collectors to check the numbers being used each samplingday to maintain correct sequence and omit duplication.
B. Gum Cards (see Figures 2A and 26).
1. General Guidelines
a. Note which number to begin with, for each samplelocation, for the date in question.
b. Prior to sampling, cards may be filled out withspecies, date, gear, locale, and collector's name.They may also be numbered when the total cards for agiven area are known for that date. These must becarefully checked when scales are to be fixed to assurecorrect information.
c. On location before mounting scales, allinformation should be completed on thatpencil.
pertinentcard, in
--
2. Information Explanation
-4-

I~I
I
Item
I Prohe.." ~l_l~...~:"-_"';.,t~'...l:--!+':"-_-.j.!-_-.;.';'t::::J..I:-_-~. t " r I I
A Ager error code lII Testfish drift number 3C Testfish station number 3
I0 Undefined 1E Preferred scale not taken 1
IF Ager initials 3C Tag number 5 ;R Undefined } I
I Undefined10 Max
I JS , ,
, ?
L ? :rr • 'f,,.
'" ~
'I • ;!rT >- I~ J 7'S" J of~ I '"S ~
~sw-. .:J<
I<Jf}<
'"}CIf' ." ,J{
)(
)(
lr.JfXl<
x
"")(
JC
" ~
I<
-'X
'"~Xl<
~
XII'
..If'
""
.....
::: :: -~ i i
i"'"' ;: ;: ;:
Figure 2A. Labeling of gum cards and AWL forms when sampling one scale per
salmons.
-5-
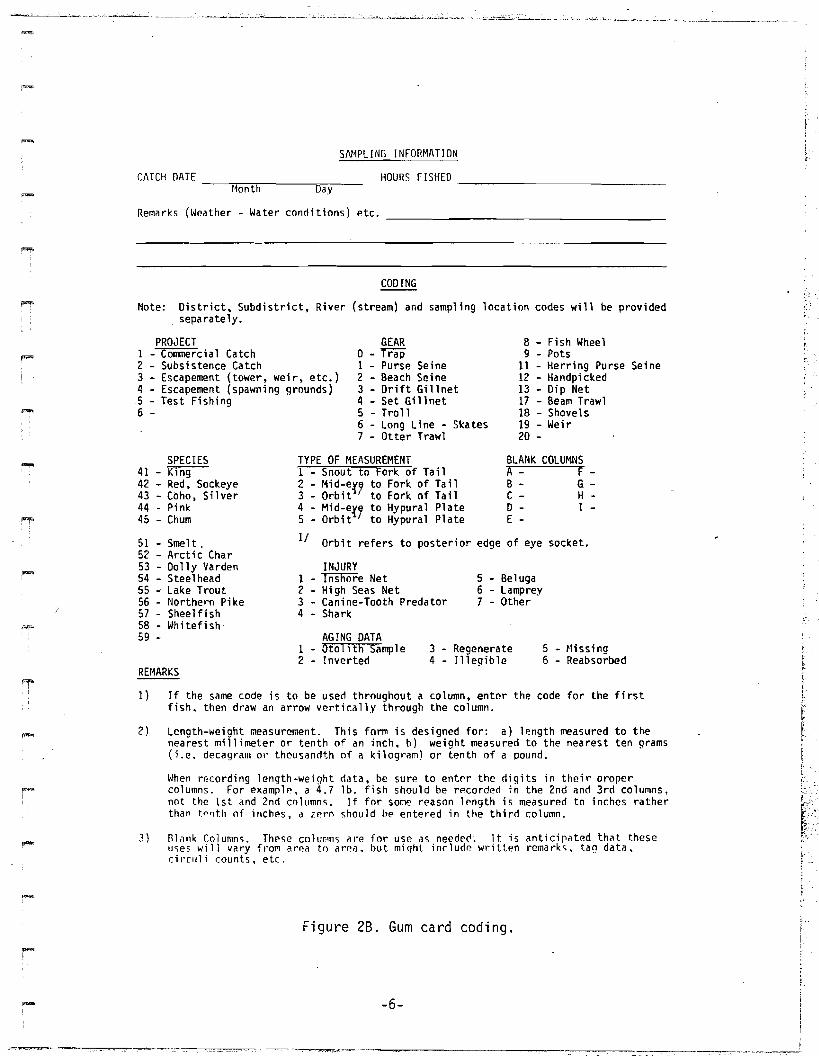
CATCH [lATE ------;rr::-::-.:L""-----..-=-,,---t10nth Day
SAMPLING INFORMATION
HOURS FISHED ~_~~ _
Remarks (Weather - Water conditions) etc.
CODING
Note: District. Subdistrict, River (stream) and sampling location codes will be providedseparately.
~.
PROJECT1 - Commercial Catch2 - Subsistence Catch3 - Escapement (tower, weir. etc.)4 - Escapement (spawning grounds)5 - Test Fishing6 -
GEARo - Trap1 - Purse Seine2 - Beach Seine3 - Drift Gillnet4 - Set Gil1net5 - Troll6 - Long Line - Skates7 - Otter Trawl
8 - Fish Wheel9 - Pots
11 - Herring Purse Seine12 - Handpicked13 - Dip Net17 - Beam Trawl18 - Shovels19 - Wei r20 -
TYPE OF MEASUREMENT BLANK COLUMNS1 - Snout to Fork of Tail A- F -2 - Mid-e~7 to Fork of Tail B - G -3 - Orbit to fork of Tail C - H -4 - Mid-en to Hypural Plate 0 - I -5 - Orbit to Hypural Plate E -
11 Orbit refers to posterior edge of eye socket.
3 - Regenerate4 - Ille!lible
SPECIES41 - Kl n942 - Red, Sockeye43 - COho, Silver44 - Pink45 - Chum
51 Smelt.52 - Arctic Char53 - Dolly Varden54 - Steel head55 ~ Lake Trout56 - Northern Pike57 Shee1fi sh58 - Whitefish59 -
REf-1ARKS
INJURY1 - Tii5li""iire Net2 - High Seas Net3 - Canine-Tooth Predator4 Shark
AGING DATA1 - Otol1th Sample2 - Inverted
5 - Beluga6 - Lamprey7 - Other
5 - NissinQ6 - ReabsoY-bed
1) If the same code is to be used throughout a column, enter the code for the firstfish. then draw an arrow vertically through the column.
2) Length-weight measurement. This form is designed for: a) length measured to thenearest millimeter or tenth of an inch, b) weight measured to the nearest ten !lrams(i.e. decagram or thousandth of a kilogram) or tenth of a pound.
When recording length-weight data, be sure to entpr the digits in their propercolumns. For examplf'. a 4.7 lb. fish should be rpcorded in the 2nd ilnd 3rd columns,not the 1st and 2nd columns. If for some reason length is measured to inches ratherthan tp~th of inches, a zero should be entered in the third column.
.....I
3) Rlank Columns. Thpse columns al"e for use as needecl'. It is anticirated thilt theseuses wi 11 vary froT'l i1rf'a to "rCd. but miCjht include wI"itten remat"ks. tag data.cit"rilli counts. etr.
Figure 2B. Gum card coding.
-6-

a. Species: ~ nerka or Reds) Scientific or commonname of sample.
b. Card No.: Consecutive for this area and species (seeA. Number'i ng) .
c. Locality: Name of beach, river or area and may includecannery or site name. Use the COOK INLET SAMPLELOCATION CODES. (Table 19)
..... d. Scow/Gear: Gear number code is listed on reverse ofAWL for appropriate type used.
e. Samp]oing date: month/day/year that the scales weretaken. Omit if the same as period date.
f. Period date: month/day/year fish actually caught.
g. Collector: last name(s) of person(s) collecting scalesand data.
h. Remarks: Include anything unusual about weather, thesample or anything else considered pertinent by
.co11 ectors.
C. Age Weight Length (AWL) Form (see Figures 3A and 38)
1. General Guidelines
a. Information on the back of the gum card should be thesame as that on the corresponding AWL Form.
b. Each finished scale card should be attached to thecorresponding AWL form with a paper clip.
c. Always use No.2 or softer pencil.
-7-
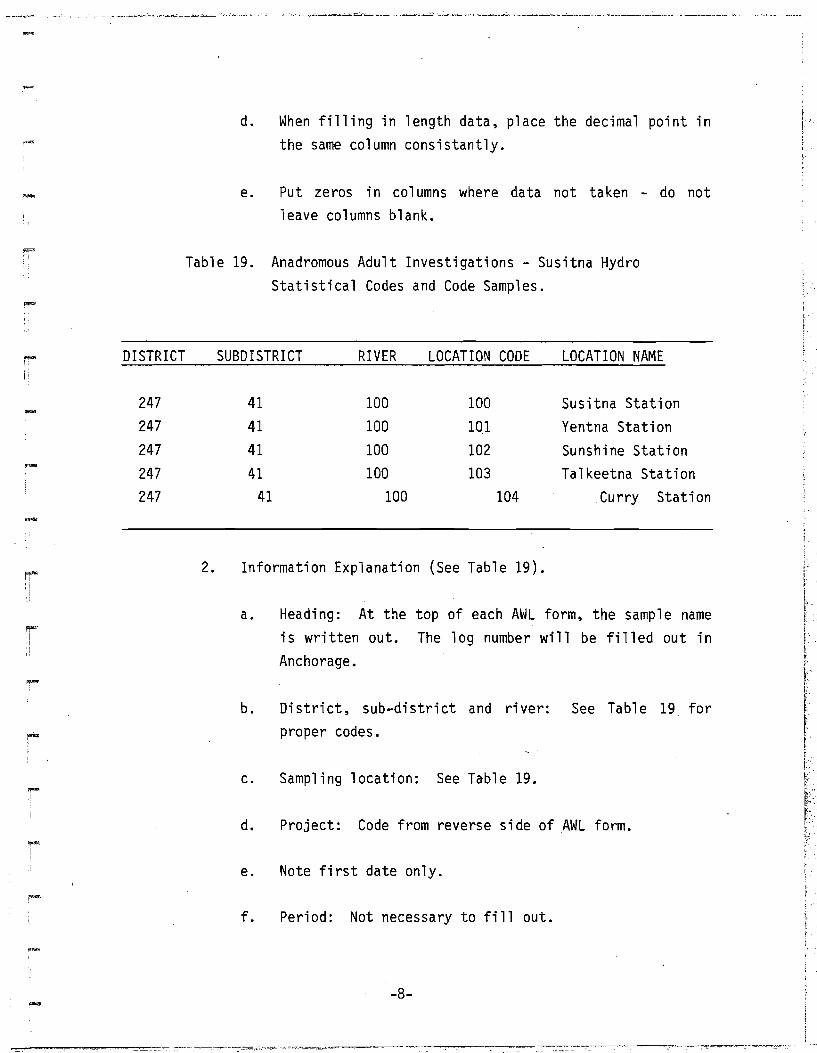
d. When filling in length data, place the decimal point inthe same column consistant1y.
e. Put zeros in col umns where data not taken - do notleave columns blank.
Table 19. Anadromous Adult Investigations - Susitna HydroStatistical Codes and Code Samples.
DISTRICT SUBDISTRICT RIVER LOCATION CODE LOCATION NAME
247 41 100 100 Susitna Station247 41 100 101 Yentna Station247 41 100 102 Sunshine Station247 41 100 103 Talkeetna Station247 41 100 104 Curry Station
2. Information Explanation (See Table 19).
d. Project: Code from reverse side of AWL form.
c. Sampling location: See Table 19.
~.., .
Note first date only.
b. District, sub-district and river: See Table 19 forproper codes.
a. Heading: At the top of each AWL form, the sample nameis written out. The log number will be filled out inAnchorage.
e.~.
f. Period: Not necessary to fill out.
-8-

g. Gear: Code for type used to catch the fish. Obtainedfrom the reverse side of the AWL form.
h. Mesh size: Remains blank.
.-
.-
i .
j.
Sample number: Sequential number which matches anappropriate gum card (see A. Numbering).
Spec.: Code for each species (see reverse of AWLform) .
k. Sex: Check male or female appropriately. Use 1 formale, 2 for female.
1. Length: Recorded in mi 11 imeters from mi d-eye to forkof tail.
m. Weight: Recorded to nearest one-tenth kilogram.
n. Age class: Completed by biologists after viewing scaleimpressions.
o. Column A and I: Used by Stock Identification - do notuse.
p. Column B: River bank designation.
q. Column C: Injury code (see reverse of AWL form.Figure 3B) •
r. Columns D-H: Remarks.
-9-

RESIDENT AND JUVENILE ANADROMOUS FISHERIES STUDIES
FY-83 Field Data Forms:
~,
FORM No.
RJ 82-01RJ 82-02RJ 82-03RJ 82-04RJ 82-05RJ 82-05
(alternate)RJ 82-06
RJ 82-07
RJ 82-08RJ 82-09
AH 82-01AH 82-051/AH 82-ES-Ol1/
AA-82-021/AA-82-031/AA-82-051/
TITLE
Susitna Hydro Standard Gear Catch DataSusitna Hydro Biological DataSusitna Hydro Tag Deployment DataSusitna Hydro Tag Recapture DataSusitna Hydro Opportunistic Gear Catch DataSusitna Hydro Opportunistic Gear Catch Data
Susitna Hydro Proposed Impoundment Hook &LineCatch DataSusitna Hydro Proposed Impoundment Other GearCatch DataSusitna Hydro Downstream Migrant Trap Catch DataSusitna Hydro Downstream Migrant Biological Data
Susitna Hydro Aquatic Habitat Field Data·Stage Data Field FormAquatic Habitat Data Electroshocking Form
Electroshocking Data Record for Spawning FishElectroshocking Catch FormAdult Anadromous and Resident Spawning Site Map
1/ Use of these forms will be discussed in the AA &AH sections of theprocedure manual respectively.
. ~
1!'liiiiGll
Data codes to be presented in filling out the above forms are presented inFigure 3.
-10-

Form Headings:
t~any of the headings on the RJ data forms are similar and the followingcomments refer to these heading in general.
-
Page of ___
FD/SFHLocation
Example (1) - If you fished Indian River for one 3 hr.sampling period with 15 minnow traps andyou caught 20 ch i nook sa1mon age 0+.
You would use the following pagenumbers.
Standard Gear Form - Page 1.. of 1..Bio. Form - Page 1 of 1..
Example (2) - If you fished Indian River for one 3 hr.sampling period with 30 minnow traps andyou caught 41 chinook salmon age 0+.You would use the following pagenumbers.
Standard Gear Form - Page 1.. of ~
and - Page ~ of ~
- Page 1.. of lBio. Form - Page ~ of l
and - Page l of l
FD = Fish DistributionSFH = Selected Fish Habitat
Circle FD or SFH depending on what typeof location is being sampled and writethe locations name in the space
-11-

-STA~OARD GEAR CODES
5 "innow trap5a fish trap10 trctline
OPPORTUNISTIC GEAR CODES
BAIT CODE
1 artificial2 fish3 egg4 other5 bacon
SI) HYDRO DATA CODES, 1982
RESIDENT SPECIES CODES
162 Slimy sculpin500 NOt-thern pi ke530 Dollv Varden541 Rainbow trout550 Lake trout5B2 Humpback whitefish
586 Rouno whitefi'h590 Burbot610 Arctic grayling64D Longnose sucker66D Threespine sticklehack661 Ninespine sticklehack
00 Floy Tag-- - - (000000 to 009999 series)
01 Floy Tag- - - - (010000 to 019999 series)
0004 Flay Tag(0004000 series with 7digits-I50 ta9s deployedin impoundment durina 19B1
-season) -Cd Danaler Tag
- - - - r:lOO to 3DOO series)
-
1 set 9illnetla drift aillnet2 e1ectroshoc,<3 beach sei ne9 hook & 1i neC other (specify)
,AG CODES
FATE CODES
o marta 1itv1 released2 tagged3 tagged - hooked in mouth4 tagged - swallowed hook5 escaped6 preserved
RECAPTURE CODES
Su Hydro staff2 ADF&G (other)3 Sport Fishermen
(speci fy name.address, andphone no. incOlm1ents)
JUVEHILE ANADROHOUS CODES
41D Chinook 0+ 430 Cohn 0+411 Chinook 1+ 431 Coho 1+412 Chinook juvenile 432 Coho 2+415 Chinook smolt 0+ 433 Coho juvenile416 Chinook smolt 1+ 435 Coho smolt 0+417 Chinook smolt 436 Coho smolt 1+
437 Coho smolt 2+420 Sockeye 0+ 438 Coho smolt421 Sockeye 1+422 Sockeye juvenile 44D Pink 0+425 Sockeye smolt 0+426 Sockeye smolt 1+ 450 Chum 0+427 Soc keye Sma lt
ADULT ANADROMOUS CODES
041 Chinook 511 Smelt, Eulachon042 Sockeye 585 Bering Cisco L043 Coho 600 Pacific lamprev044 Pink 601 Arct i c 1amprey045 Chum "-r:<
,.-
f.
Ie- '
Figure 3. RJ Data Form Coding, FY-83.
-12-

-
~-
~I
~J
.....
RM/TRM
GC
Date: Gear SetGear Pulled
Collectors Initials
Remarks
provided. Be sure to record the name ofthe 1ocati on exactly the same way eachtime you return.
RM = River MileTRI'1 = Tri buta ry Ri ver Mi 1e
Circle RM or TRM~ depending on which isre1evant and record the mi 1eage to thenearest tenth of a mile.
GC = Geographic Code
File in: meridian - (i.e.) S or F(Seward/Fairbanks)
township - (i.e.) 32Nrange - (i.e.) OlEsection - (i.e.) 04grid - (i.e.) BAB
82 / 06 / 01. year month day
Note - the computer requi res you toenter a 2-digit number for the year~
month~ and day as shown above.
The first letter of each samplersfirst and last name is sufficient.
Use this space for line item comments.If more then one line is needed tocomp1ete the rema rk ~ precede it with asub-heading indicating which piece of
-13-
~ .

......
gear and/or location the remark pertainsto.
(Le.) 5/3-2 Observed a school of 20sockeye 0+ swimming in theshallows near this trap.Approximate lengths 20 mm.
..,..,
Comments The blank space at the bottom of eachsampling form is intended for whole pagecomments.
(i.e.) Sport fishermen questioned atthis location indicated thatduri ng the current peri od oflow water, rainbow troutcatches have diminished.
SUSITNA HYDRO STANDARD GEAR CATCH DATA RJ 82-01
Designed for record"ing fishing times and catch by species for 15 minnowtraps, 1 fish trap, and 3 trotlines.
The PSN space on this formcode. The first digit willwithin a sampling location.following criteria:
is designed to accommodate a 3 digit locationindicate a hydraulic zone or sub-sampling area
Initially zones were determined based on the
-
ZONE CODES
1
HYDRAULIC DESCRIPTION
Free flowing reach of tributary, slough, or sidechannel, not influenced by back water or eddies.
Notes: this code will not be used at mainstemsites.
-14-
___.,---,.,....",,,,-;;:-.,..c,='_~-.~-.-_"_•. ~_.,..__ ~ ..~~-,...------'--~--~--

2
3
At tributary and slough mouth~ this code willrepresent backwater areas created by the mainstem.In mainstem sites, this zone will represent slackwater areas with no appreciable velocity.
Notes: if a mainstem, tributary, or slough sitedoes not have any slack water zone, thenthis code will not be used.
Represents the zone where the tributary or sloughmouth water mixes with the mainstem. At mainstemsites it will represent areas with a significantsurface current.
""!'"'i
'!
To insure proper coding, a description of each zone should be provided inthe fi e1d notes along with the zone code number that was ass i gned. Anotation in the remarks column concerning the zone number on the data form(I.E. upper/slough - with current) should also be provided for proper crosschecking of code numbers. Currently the zone codes and their correspondinghydraulic description are being revised. A listing of the new zone codeswill be included in the updated version of this text. The last 2-digits inthe PSN space represent the gear number (i.e. 01-99). Each piece of gearwill reflect a replicate of each hydraulic zone but in all cases will berecorded individually.
Time set, time pulled, and total time will be recorded in hours andminutes, and recorded as military time (0000 to 2400 hours).
With regards to· the data codes needed to complete the reminder of thisform, refer to the Su Hydro Data Code sheet and note the followingadditi ons:
-Bait Code - since bacon was established as a standard bait, it now has
its own code no. - (5).
-15-
r,oJ·
,.~=_.~.~~----~~,.~~.~',--~._,,,,,-.-~-.,,.,...,,..~~-~~._.. ',......

- --- -- - ----- - -------- ----------
-
Species Code - Note that the code changes from last year on slimy sculpin(162), longnose suckers (640), and Bering cisco (585).
The code list for juvenile anadromous fishes has beenexpanded to differentiate juveniles from smolts. Henceforththe age classes of all juvenile salmon and smolts will bedetermined after the field season utilizing the computer.Consequently, field personnel will only have to assign ajuvenile or smolt code to each juvenile anadromous speciesthat is captured.
(i.e.) All juvenile chinook are assigned the code (412)and all chinook smolts should be coded as (417).
SUSITNAHYDRO BIOLOGICAL DATA RJ 82-02
Species Codes - refer to the Su Hydro Data Code sheet
Length - measure all lengths to the nearest millimeters. Recordfork lengths or total lengths for the species being sampledas prescribed in the 1981 procedures manual.
Sex - male or female, check one if the data is available.
Age - recorded in the office.
Scale Card No. - use pre-numbered cards (0001 - 9999). These cardsare designed primarily to reference scales and otolithsfor aging, however they can also be dropped in specimenbottles and used to identify preserved specimens.
Gear Code - See Su Hydro Data Code Sheet
PSN - 3 digit location code, refer to earlier discussion.
-16-
~ .
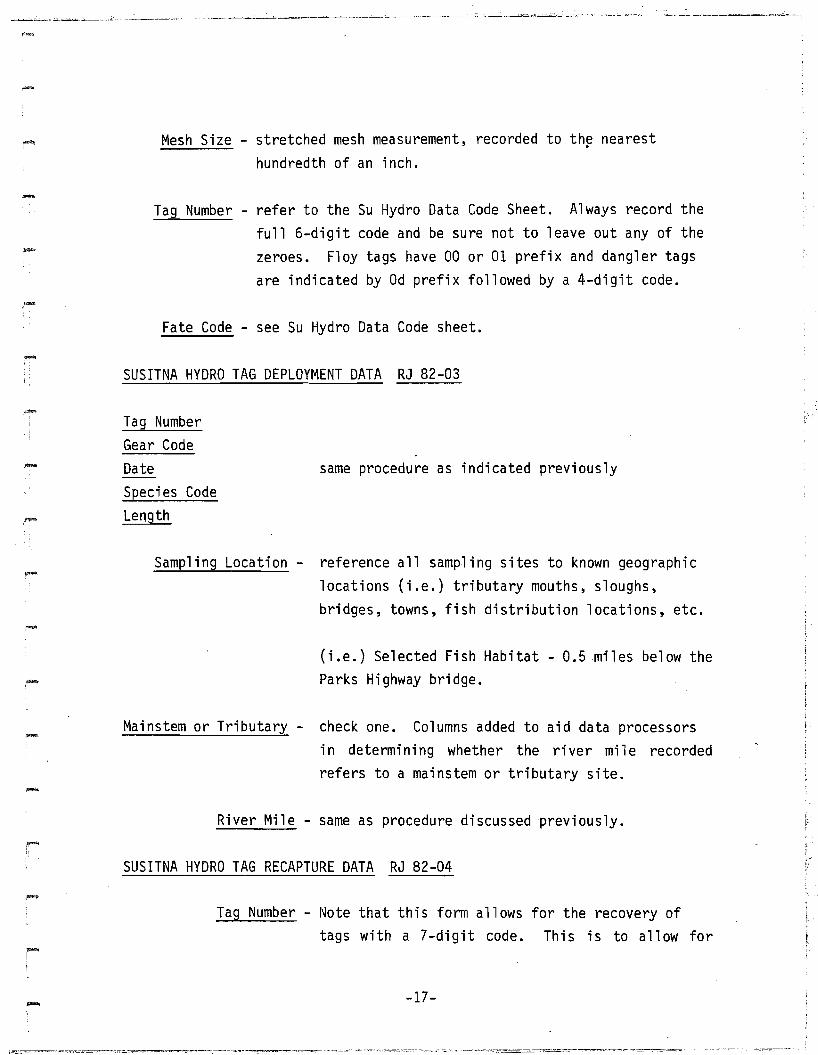
--
.,..
Mesh Size - stretched mesh measurement, recorded to th~ nearesthundredth of an inch.
Tag Number - refer to the Su Hydro Data Code Sheet. Always record thefull 6-digit code and be sure not to leave out any of thezeroes. Floy tags have 00 or 01 prefix and dangler tagsare indicated by Od prefix followed by a 4-digit code.
Fate Code - see Su Hydro Data Code sheet .
SUSITNA HYDRO TAG DEPLOYMENT DATA RJ 82-03
Tag NumberGear CodeDateSpecies CodeLength
same procedure as indicated previously
-
. Sampling Location - reference all sampling sites to known geographiclocations (i.e.) tributary mouths, sloughs,bridges, towns, fish distribution locations, etc.
(i.e.) Selected Fish Habitat - O.Smiles below theParks Highway bridge.
Mainstem or Tributary - check one. Columns added to aid data processorsin determining whether the river mile recordedrefers to a mainstem or tributary site.
River Mile - same as procedure discussed previously.
SUSITNA HYDRO TAG RECAPTURE DATA RJ 82-04
Tag Number - Note that this form allows for the recovery oftags with a 7-digit code. This is to allow for
-17-
i

the recovery of 150 7-digit tags used inimpoundment last season. For all 6-digit tagsrecovered. record the number to the right of theexisting zero in the second column and leave thefirst column blank.
Recapture Code - refer to Su Hydro Code sheet
All other items on this form discussed previously
SUSITNA HYDRO OPPORTUNISTIC GEAR CATCH DATA RJ 82-05
~,...
,fI1If*4
-
Designed for use with gear that for one reason or another can not beutilized on a regular basis. Set and drift gill nets. beach seines. hookand line. and electrofishing gear are considered to be opportunistic gear.When the field biologist believes such gear deployment is required. aminimum of two different conditions should be sampled during each samplingperiod. The different conditions being sampled and the rationale for whysuch sampling is being performed are to be recorded in the field notebook.Also record this information in the remarks column on the date forms.
An alternate version of Form RJ 82-05 with no net lengths or mesh sizeslisted for gill nets is available upon request.
Conductivity - record hydrolab reading in umhosjcm
...-i
VoltsAmps
record settings on shocker
-
Hook Type - inhouse evaluation of the effectiveness of different hooktypes
(i.e.) Mepps spinner. No.2Royal Coachman. dry fly
-18-

SUSITNA HYDRO PROPOSED IMPOUNDMENT HOOK &LINE CATCH DATA RJ 82-06
This form will be utilized to record hook and line catch data from theproposed impoundment area above Devil Canyon.
--
r
rI
'I •
r
Code
M
P
R
Reach - two letter location code which designate the followingthree types of habitat locations based on their physicalcharacteristics:
Description
The confluence habitat encompasses that area ofthe Susitna River below the mouth of the tributarywhich is influenced by the tributary stream flow,the mixing area, and that area of the tributarywhich is influenced by the rise/fall of theSusitna River.
The pool habitat is comprised of the large poolswithin the tributaries between the mouth and theproposed impoundment elevation where the bulk ofthe resident fish have been observed to reside.
The riffle habitat will include those stretches ofeach tributary located; between the major poolareas in the reach between the mouth of thetributary and the impoundment elevation. Theseareas are comprised of smaller pools, rock eddies,riffles, and whitewater.
The second 1etter of the 1ocati on code wi 11 be composed of lower caseletters from a to z. Sampling locations at or near the confluence will allbe designated by the letter - a (i.e.Ma, Pa, Ra). Sampling locationsabove these sites will be assigned letters in sequence thereafter. (i .e.Pb, Rb, Pc, Rc ... ).
-19-

-!
TRM - tributary river mile in tenths of miles.
Total Time - hours and hundreths of hours, rounded off to the nearestquarter hour.
Catch - Species - catches are record by species. Species codes arelisted on the Su Hydro Code sheet.
SUSITNA HYDRO PROPOSED IMPOUNDMENT OTHER GEAR CATCH DATA RJ 82-07
This form is designated for use at sampl ing locations in the mainstemSusitna River, tributary mouths, and lakes in the proposed impoundment areaabove Devil Canyon.
Spec; es CodePSNNet LengthMesh SizeHook SizeBait TypeTime (Set, Pulled, and Total)Catch - Species Code
same procedure as indicated previously
rI
SUSITNA HYDRO DOWNSTREAM MIGRANT TRAP BIOLOGICAL DATA RJ 82-09
r,I .
Species Code.LengthAge
same procedure as indicated previously
IF""I
Scale Slide No. - scale are mounted on glass microscope slides for agingand these slides are numbered from 0001 to 9999.
Fate Code - discussed previously, see Su Hydro Code sheet.
SUSITNA HYDRO DOWNSTREAM MIGRANT TRAP CATCH DATA RJ 02-08
-20-
;'C:./

Time - SetCheckTotalDaily Total
mil itary time
hours, expressed to the nearest tenth of an hour
-Trap Depth - feet, expressed to the nearest tenth of a foot
Velocity - feet per second, expressed to the nearest tenth ofa foot
Catch - Species Code - same procedure as indicated previously
Remarks - this space will include two addition pieces of data.·The distance the trap was set from shore will berecorded to the nearest foot and the total number offish that were found as mortalities in the live boxwill also be recorded.
SUSITNA HYDRO AQUATIC HABITAT FIELD DATA AH-82-01
Water Quality Data:
Mil tary TimeTemp. - Air
- ~Jater
degrees Centigrade expressed to the nearest tenthof a degree
,~
~ - expressed to the nearest tenth
Dissolved Oxygen expressed to the nearest tenth
Spec. Condo - Meter - conductivity meter reading, expressed to the nearesttenth
- Adj - adjusted reading based on correction factor calulatedfor each meter
-21-
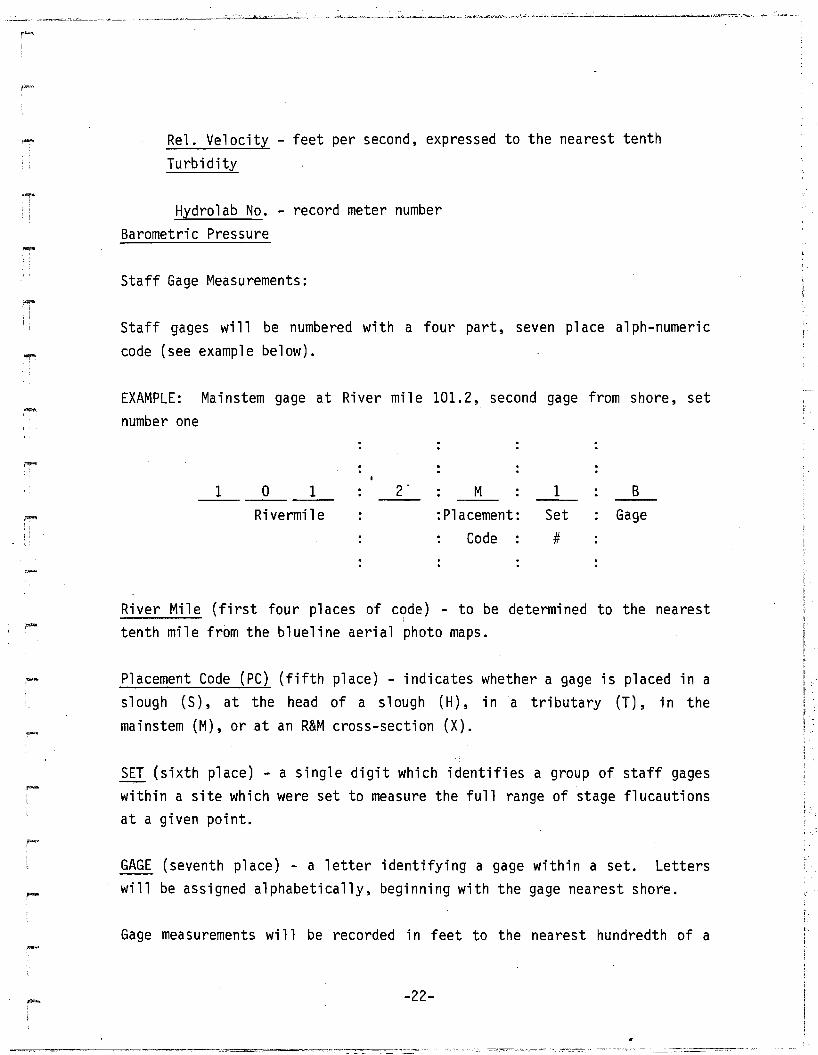
Rel. Velocity - feet per second, expressed to the nearest tenthTurbi dity
Hydrolab No. - record meter numberBarometric Pressure
Staff Gage Measurements:
Staff gages will be numbered with a four part, seven place alph-numericcode (see example below).
EXAMPLE: Mainstem gage at River mile 101.2, second gage from shore, setnumber one
1 o 1 M 1 B
Rivermil e :Placement: SetCode #
Gage
River Mile (first four places of code) - to be determined to the nearesttenth mile from the blueline aerial photo maps.
Placement Code (PC) (fifth place) - indicates whether a gage is placed in aslough (S), at the head of a slough (H), ina tributary (T), in themainstem (M), or at an R&M cross-section (X).
SET (sixth place) - a single digit which identifies a group of staff gageswithin a site which were set to measure the full range of stage flucautionsat a given point.
GAGE (seventh place) - a letter identifying a gage within a set. Letterswill be assigned alphabetically, beginning with the gage nearest shore.
Gage measurements will be recorded in feet to the nearest hundredth of a
-22-
;,, .
-..,
foot
Substrate Date:
General substrate data will be collected for each hydraulic zone that is
sampled at a fish distribution or selected fish habitat location.
Gear Code leave this space blank
,"/""',
I •.
PSN - this space will be utilized to specify the hydraulic zone codewhich is being sampled
Emb - determine embeddedness of the substrate by inspection. If the
embeddedness is sufficient to hinder fish activity (i.e.spawning, rearing) enter a (Y), if not enter a (N) in thisspace.
Dominant - enter the dominant substrate found in that hydraulic zone.Substrate codes are listed on the form as follows:
Substrate Codes: Substrate Description
SI silt very fineSA sand finesGR gravel 1/4" - 3"
RU rubble" 3" - 5"CO cobble 5" - 10"80 boulder greater than 10"
Notes - describe breakdown of substrate types if ~ecessary. Also notecover characteristics. ~.
-23-
-AQUATIC HABITAT AND INSTREAM FLOW STUDIES
New Data Form Instructions
Form AH-82-07 was developed for the winter sampling session to moreefficiently record winter data. This was necessary due to the differenttypes of data and procedures being used.
1-10. Refer to general instructions in 1981 procedures manual (steps 4and 7 are not on this form).
11. Date: Enter date measurements are being taken.
12. Military Time: Enter time using the 24 hour system (i.e. for1:00 p.m. enter 13:00).
13. GPSN: enter gear placement site number (described in 1981procedures manual).
14. Temperature (Temp) °C: Enter air and water temperature.
15. pH: Enter value as measured using the procedure described in themethods section.
16. Dissolved Oxygen (D.O., mg/l): Enter value as measured followingthe procedure in the methods section.
17. Turbidity (NTU): Indicate with a check ( ) on left side ofblank that a turbidity sample was taken, enter turbidity valueafter analysis.
18. Specific Conductance; Meter: enter the value for spec. condo asdisplayed on the meter.
19. Specific Conductance; Adjusted: Upon return from the field enter

-
--
.-
the adjusted value obtained from the calibration curve.
20. Ice thickness: measure the distance from the bottom of the iceto the top.
21. Water Depth: enter the distance from the surface of the water tothe substrate. (Notes will be made in the "note" section of theform if sl ush ice is present or if the water surface and icesurface are more than .5 foot different).
22. Mean Velocity: enter the mean velocity measured at .6 depthunder the 0.6 or mean column. If.2 and .8 depth is used enterthe .2 above the slash and .8 below the slash in the 0.2/0.8column. Enter the mean velocity (calculated by averaging the .2and .8 measurement) in the .6 or mean column.
23. Substrate: Estimate the three major substrate types within thesampling site and enter their respective percentages.
24. Meter Numbers (Hydrolab): Enter the serial number of thehydrolab used.
25. Meter Number (Flow): Enter the type and seri a1 number of theflow meter used.
26. Discharge: Record total discharge if measured.
27. Comments, related data, notes: Enter any comments pertinent tothe data collected (i.e. deviation from techniques, otherinformation available, adverse conditions, etc.).
General Habitat (AH-82-02)
Thi s form was adapted from the wi nter form {AH-82-07 above. Theinstructions are the same as those described above with the following
-25-

-
exceptions.
23. Substrate:· In thi s new form substrate is recorded as descri bedin the RJ data form section for Embeddedness (23a) domi nantsubstrate type (23b) and notes (23c).
28. Barometric Pressure: Record barometric pressure.
Aquatic Habitat Data Electroshocking Form (AH-82-ES-01)
This form is used to record the habitat data collected in associationwith electroshocking.
1. File Number: Record appropriate file number.
2. Page: Indicate the page number and total number of pages.
3. Crew: List the names or initials of personnel makingmeasurements and entering data on form.
4. Date: Enter date in digit format in the order: year, month,day.
5. Time: Enter military time.
6. Samp1e #: Enter the as's i gned sample number determi ned by RJ orAA crew member. System to be developed.
7. Location: Enter descriptive location name.
8. RM: Enter river mile of the site or tributary mouth obtainedfrom R&M blue line maps.
9. Tributary River Mile: Enter the river mile of the tributarysampled if applicable.
-26-

...I
.....i
10. Geographical Code: Enter the 12 digit code identifying the
sample location.
11. Sample #: Enter number to identify specific data collectionlocation within the site.
12. Depth: Record depth that measurement was taken.
13. Velocity: Enter the mean velocity measured at 0.6 under theX/0.6 column. If 0.2 and 0.8 depths are used enter the velocityunder the appropriate column and the mean under X/0.6.
14. Substrate: Record substrate type dominant in the site usingcodes explained in the RJ da.ta form section of this addendum.
15. Embeddedness: Record embeddedness as descri bed in the RJ dataform section of this addendum.
16. Air Temperature: Enter air temperature in °C .
17. Intragravel Temperature: Enter intergravel temperature °C.
18. Surface Water Temperature: Enter surface water temperature in
°C.
19. pH: Enter pH .
20. Dissolved Oxygen: Enter dissolved oxygen in I11g/1.
21. Specific Conductance: Enter specific conductance in umhos/cm.
22. Comments: Enter any comments in this section.
Stage Date - Field Form Instructions
-27-

,.....
--
1. Includes the river mile, placement code, set number, gage; referto staff gage numbering procedure and format in FY 83 proceduresmanual addendum.
2. Year, month, day (eg. 820704).
3. Military time (e.g. 14:06 hrs.).
4. Actual gage reading in feet, tenths of feet and hundreds of feet.
5. Total depth is the height nf a gage or wading rod placed upon thesubstrate next to the installed gage and read at the watersurface. Read also in feet, tens of feet and hundreds of feet.
6. Sampler's initials.
7. Include in the comments section the location of the gage (i.e.head of Slough 19, mouth of Slough 8A, etc.). Also include anypertinent information concerning the gage site or sampling sitein general concerning the stage.
8. The number of pages in data set.
-28- !~L


![VSP steelhead telemetry PAR 2012 data (2 of 2) [Read-Only] Review... · 2013-03-13 · Upper Yak Steelhead: Arrival below Roza Dam Yakima Mainstem & Wenas Cr Roza Dam Yakima Mainstem](https://img.pdfslide.us/doc/110x75/5e5d9870aeed9a3aa361aebb/vsp-steelhead-telemetry-par-2012-data-2-of-2-read-only-review-2013-03-13.jpg)