Embed Size (px)
Citation preview
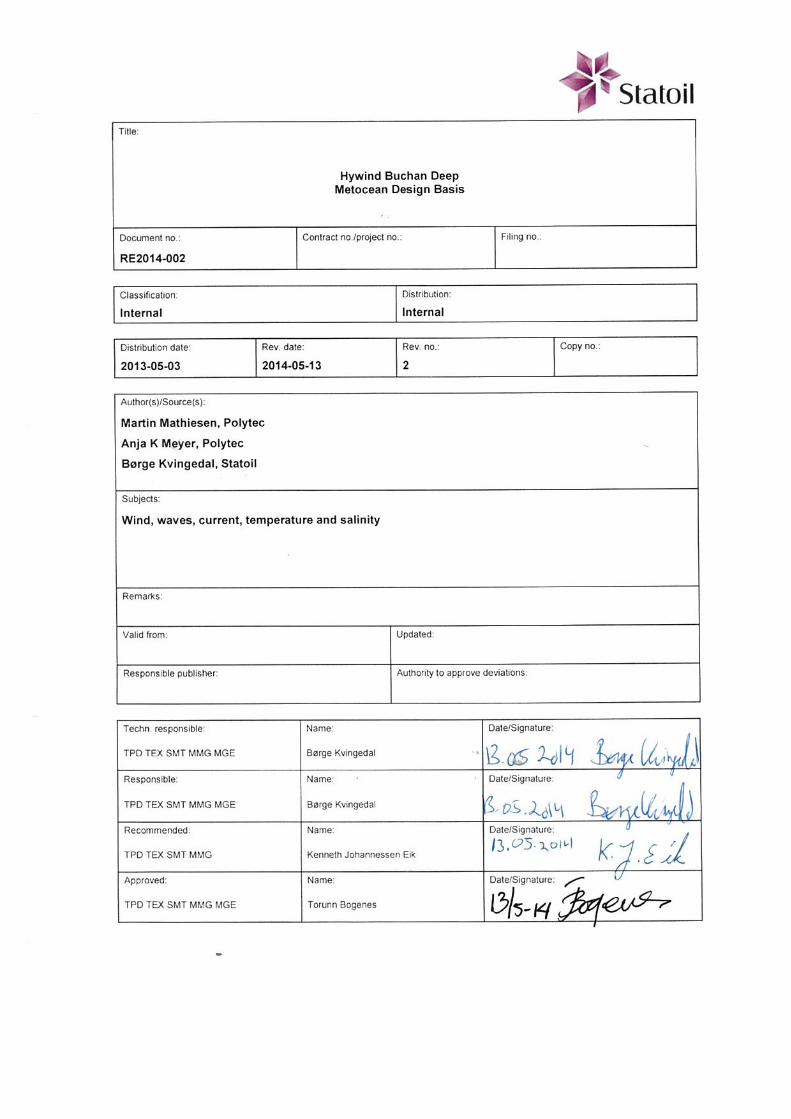
Hywind Buchan Deep
Metocean Design Basis RE2014-002
Hywind Buchan Deep Metocean Design Basis
Doc. no. RE2014-002 Date Rev. no. 2014-05-13 2
Table of contents Revisions ................................................................................................................................................................ 5 Revision 2 ............................................................................................................................................................... 5 1 Introduction ........................................................................................................................................... 6 1.1 Hywind Buchan Deep ............................................................................................................................. 6 1.2 Codes, regulations and design premises .................................................................................................. 7 1.3 Conventions and definitions .................................................................................................................... 7 1.3.1 Units ........................................................................................................................................................ 7 1.3.2 Directions ................................................................................................................................................ 7 1.3.3 Seasons .................................................................................................................................................... 8 1.3.4 Extremes.................................................................................................................................................. 8 1.3.5 Use of extreme values ............................................................................................................................. 8 1.4 Climate change ........................................................................................................................................ 9 1.5 Methods of analysis ................................................................................................................................ 9 2 Wind ..................................................................................................................................................... 10 2.1 Winds10 m above sea level ................................................................................................................... 10 2.2 Winds 100 m above sea level ................................................................................................................ 19 2.3 Long-term wind statistics – 10 m above sea level ................................................................................ 22 2.4 Wind profile and gust ............................................................................................................................ 26 2.5 Turbulence intensity .............................................................................................................................. 30 2.6 Wind spectra ......................................................................................................................................... 31 2.7 Operational data – 10 m above sea level ............................................................................................... 33 3 Waves ................................................................................................................................................... 37 3.1 Wave data .............................................................................................................................................. 37 3.2 Wave data analysis ................................................................................................................................ 37 3.3 Long-term wave statistics ..................................................................................................................... 40 3.4 Short-term sea states ............................................................................................................................. 51 3.4.1 Wave spectra ......................................................................................................................................... 51 3.4.2 Directional wave spectra ....................................................................................................................... 54 3.4.3 Wave-induced bottom currents ............................................................................................................. 54 3.5 Individual waves ................................................................................................................................... 56 3.5.1 Wave heights ......................................................................................................................................... 56 3.5.2 Crest heights .......................................................................................................................................... 61 3.6 Operational data .................................................................................................................................... 63 4 Currents ............................................................................................................................................... 68 4.1 Tidal currents ........................................................................................................................................ 68 4.2 Storm surge currents ............................................................................................................................. 69 4.3 Current data ........................................................................................................................................... 70 4.4 Current data analysis ............................................................................................................................. 71 4.5 Long-term current statistics................................................................................................................... 77 5 Water Levels ........................................................................................................................................ 86 5.1 Tidal elevations ..................................................................................................................................... 86
Hywind Buchan Deep Metocean Design Basis
Doc. no. RE2014-002 Date Rev. no. 2014-05-13 2
5.2 Storm surge ........................................................................................................................................... 86 5.3 Total water level .................................................................................................................................... 87 5.4 Sea level rise ......................................................................................................................................... 87 6 Marine growth ..................................................................................................................................... 88 7 Snow and icing ..................................................................................................................................... 89 7.1 General requirements ............................................................................................................................ 89 7.2 Snow ..................................................................................................................................................... 89 7.3 Icing ...................................................................................................................................................... 89 8 Temperatures ...................................................................................................................................... 90 8.1 Sea temperature profiles ........................................................................................................................ 90 8.2 Air temperature ..................................................................................................................................... 92 9 Salinity ................................................................................................................................................. 94 10 Wind and waves .................................................................................................................................. 96 10.1 Wind and wave data .............................................................................................................................. 96 10.2 Wind speed and wave height................................................................................................................. 96 10.3 Wind and wave direction .................................................................................................................... 101 10.3.1 Summary ............................................................................................................................................. 101 10.3.2 Data sorted by wind speed at 10 m above MSL .................................................................................. 102 10.3.3 Data sorted by wind speed at 100 m above MSL ................................................................................ 109 10.3.4 Wind speed at 10 m above MSL, Data sorted by significant wave height.......................................... 116 10.3.5 Wind speed at 100 m above MSL, Data sorted by significant wave height ........................................ 122 11 References .......................................................................................................................................... 128
Hywind Buchan Deep Metocean Design Basis
Doc. no. RE2014-002 Date Rev. no. 2014-05-13 2
Page 5 of 129
Revisions
Revision 2
Chapter 2.2 Wind data at 87 m above sea level are replaced by wind data at 100 m above sea level. Chapter 2.5 A chapter on turbulence intensity is inserted. Chapter 4 Hindcast current data are replaced by current data from measurements at Buchan Deep. Chapter 10 A chapter describing the relationship (correlation) between significant wave height and wind speed is inserted. Wind wave direction joint probability tables for use in computations of wind wave direction misalignment effects are included.
Hywind Buchan Deep Metocean Design Basis
Doc. no. RE2014-002 Date Rev. no. 2014-05-13 2
Page 6 of 129
1 Introduction
1.1 Hywind Buchan Deep
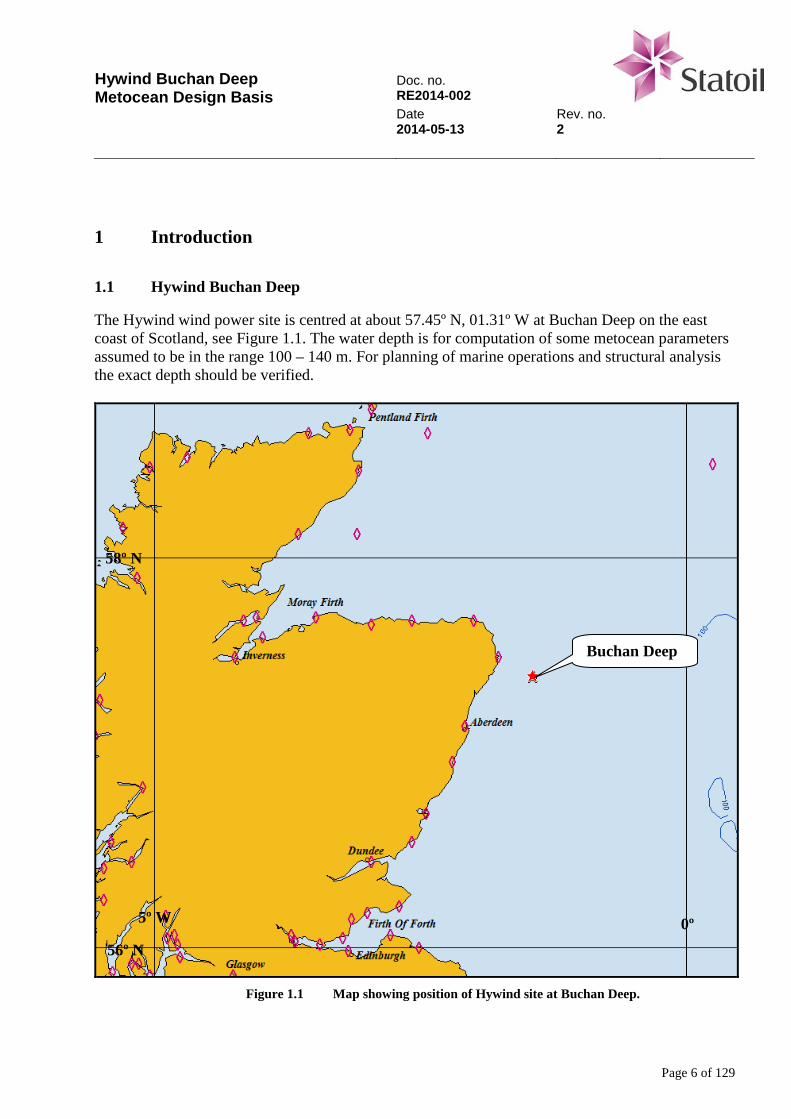
The Hywind wind power site is centred at about 57.45º N, 01.31º W at Buchan Deep on the east coast of Scotland, see Figure 1.1. The water depth is for computation of some metocean parameters assumed to be in the range 100 – 140 m. For planning of marine operations and structural analysis the exact depth should be verified.
Figure 1.1 Map showing position of Hywind site at Buchan Deep.
Buchan Deep
58º N
0º 56º N
5º W
Hywind Buchan Deep Metocean Design Basis
Doc. no. RE2014-002 Date Rev. no. 2014-05-13 2
Page 7 of 129
1.2 Codes, regulations and design premises
International Electrotechnical Commission (IEC) Standard 61400-3 [1] outlines minimum design requirements for offshore wind turbines. DNV Offshore Standard DNV-OS-J101 Design of offshore wind turbine structures [3] provides principles, technical requirements and guidance for design, construction and in-service inspection of offshore wind turbine structures British Standard BS 6349-1:2000 [5] gives guidance and recommendations on general criteria relevant to the planning, design, construction and maintenance of structures set in the maritime environment. Offshore Technology Report 2001/010, Environmental considerations [6], issued by the UK Health & Safety Executive (HSE), provides technical information on metocean parameters for Offshore Installations in UK waters. Chapter 2 of Scotland’s Marine Atlas [27] gives a general description of the metocean conditions in Scottish waters.
1.3 Conventions and definitions
1.3.1 Units
Parameters and data values are (with some exceptions) given in the International System of Units (SI). Current, wind and wave directions are given in degrees (º) measured clockwise from north.
1.3.2 Directions
Current The current direction, measured in degrees clockwise from north, is the direction towards which the current is flowing. Currents of direction 90º are towards the east. Wind The wind direction, measured in degrees clockwise from north, is the direction from which the wind is blowing. Winds of direction 90º are coming from the east. Waves The wave direction, measured in degrees clockwise from north, is the direction from which the waves are coming. Waves of direction 90º are coming from the east.
Hywind Buchan Deep Metocean Design Basis
Doc. no. RE2014-002 Date Rev. no. 2014-05-13 2
Page 8 of 129
1.3.3 Seasons
Seasonal variations are given by month.
1.3.4 Extremes
Extreme values are, in NORSOK Standard N-003 [7], defined through their annual probabilities of exceedance here referred to as q - probability values. A q - probability value is the value corresponding to an annual probability of exceedance of q. The relationship between annual probability of exceedance, q, and return period, R, is given by:
−−=
RTq exp1 T = 1 year (1.1)
It is seen that q = 0.63 for R = 1 year and that q is approximately 10-1 and 10-2 for R = 10 and 100 years, respectively.
1.3.5 Use of extreme values
When using monthly or directional extremes, robustness against uncertainties in the predicted extremes for the target month or direction sector shall be ensured by consider the estimated extremes for the two neighbouring months or direction sectors as accidental weather estimates. (This means that for the target sector operations and design are controlled against environmental loads using standard safety factors, while when using environmental loads obtained using environmental conditions for neighbouring sectors safety factors are set equal to 1.0.) Exceptions to this can be cases where there are topographical reasons for not considering a neighbouring sector representative for the target sector. When predicting extreme structural response for design control purposes (design of structures or design of operations) using directional weather extremes, it shall be verified that the obtained extreme response is in agreement with overall requirements regarding annual exceedance probabilities, see e.g. NORSOK Standard N-006 [8]. For design of mooring lines utilizing directional wave extremes, the designer shall ensure that effects on the expected line tension from neighboring sectors are properly accounted for. The directional extreme values (for wind and waves) corresponding to an exceedance probability of q given the sector will generally not result in an extreme response corresponding to an annual exceedance probability of q even if the sector considered is the worst sector for the response under consideration. The marginal exceedance probability may well exceed q. The correct approach would be to calculate the marginal exceedance probability of a given response level as a weighted sum of the exceedance probabilities for the various direction sectors. The
Hywind Buchan Deep Metocean Design Basis
Doc. no. RE2014-002 Date Rev. no. 2014-05-13 2
Page 9 of 129
weights are the probabilities for the various directions. If a long term analysis is not done, corrected directional environmental extremes (individual wave height or significant wave height) shall be established in agreement with the recommendation given in NORSOK Standard N-006 Chapter 6.6 [8]. This procedure will basically result in increasing directional weather extremes, individual wave heights and significant wave height by about 10 % for 10-2 – annual probability (100-year values). The percentage correction yields reasonable values for 10-2 annual probability. Using the same approach for q = 0.63 per year (annual extreme values) will most probably give un-conservative results, while it is expected to give conservative results for q = 10-4. The corrected values shall not be taken larger than the omni-directional extreme values. Background information for the recommended corrections can be found in NORSOK Standard N-006 [8].
1.4 Climate change
Sea level rise due to climatic effects, e.g. thermal expansion of the oceans and melting of glaciers, is estimated to be in the range 0.2 – 0.6 m by the year 2100; IPCC Table SPM.1 [22].
1.5 Methods of analysis
The Statoil recommended practice for the analysis of extreme environmental conditions affecting marine structures is given in the report “Extreme environmental conditions, Recommended practice” [10].
Hywind Buchan Deep Metocean Design Basis
Doc. no. RE2014-002 Date Rev. no. 2014-05-13 2
Page 10 of 129
2 Wind
2.1 Winds10 m above sea level
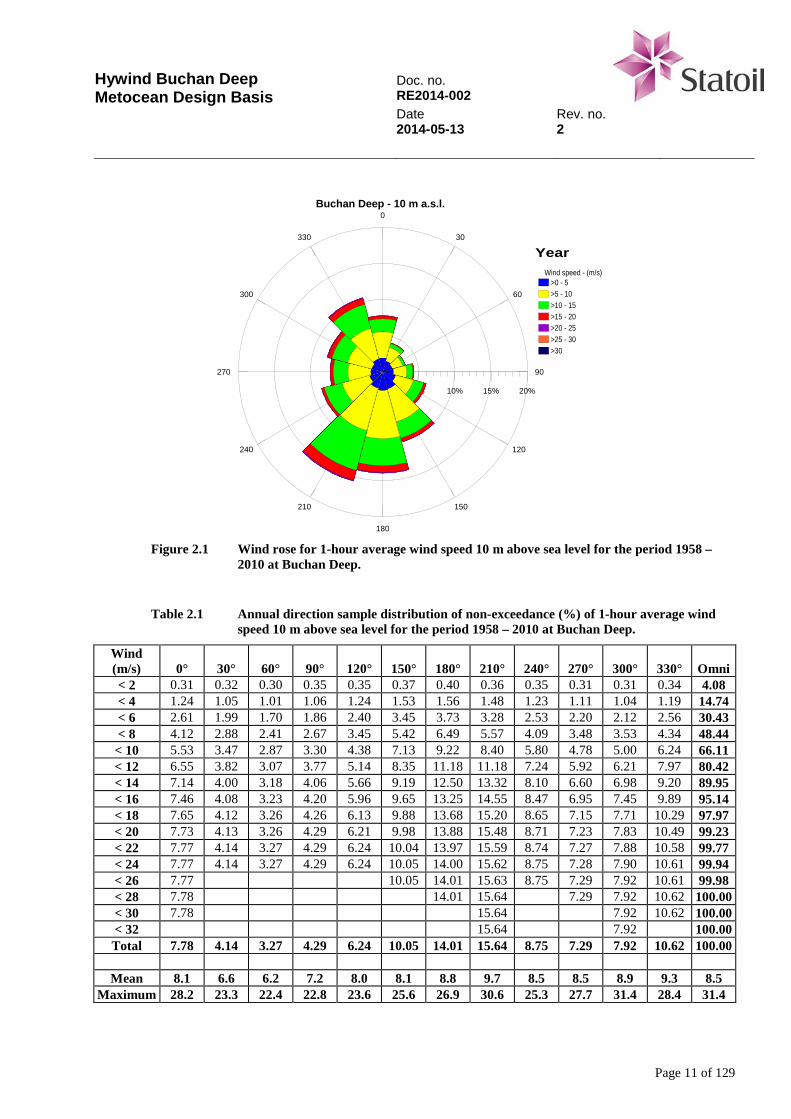
Wind data are available from the Nora10 hindcast model operated by the Norwegian Meteoro-logical Institute [26]. The data are from the grid point at 57.40º N, 01.28º W. The wind data cover the period 1958 – 2010 (53 years). The sample interval is 3 hours. The Nora10 model has a spatial resolution of 10 km. The computed wind speed is considered to represent the 1-hour mean wind speed. The Nora10 wind data are found to be of good quality for wind speeds up to about 15 m/s. Wind speeds higher than this are underestimated [16]. Consequently, wind speeds higher than 15 m/s have been adjusted (corrected) prior to analysis. The corrected wind speed, UCor, is computed from [23]:
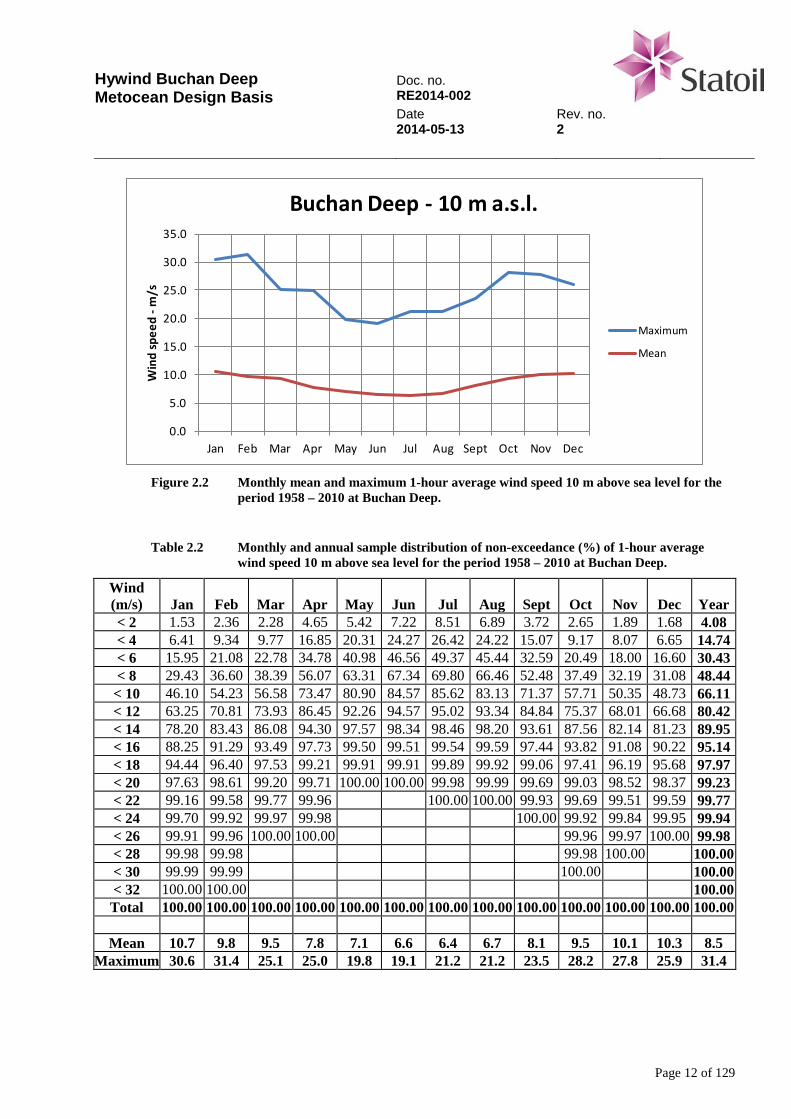
)( MinCor UUpUU −+= for MinUU ≥ (2.1) where U is the (Nora10) wind speed, p = 0.20 and UMin = 15.0 m/s. Figure 2.1 shows the (all-year) wind rose at Buchan Deep. Table 2.1 shows the corresponding annual sample distribution of non-exceedance of 1-hour average wind speed Figure 2.2 shows the mean and maximum monthly 1-hour average wind speed. Table 2.2 shows the monthly sample distribution of non-exceedance- Figure 2.3 - Figure 2.8 show wind roses for each month separately. Table 2.3 - Table 2.8 show monthly sample distributions of non-exceedance of wind speed.
Hywind Buchan Deep Metocean Design Basis
Doc. no. RE2014-002 Date Rev. no. 2014-05-13 2
Page 11 of 129
0
30
60
90
120
150
180
210
240
270
300
330
0% 5% 10% 15% 20%
Wind speed - (m/s)>0 - 5>5 - 10>10 - 15>15 - 20>20 - 25>25 - 30>30
Buchan Deep - 10 m a.s.l.
Year
Figure 2.1 Wind rose for 1-hour average wind speed 10 m above sea level for the period 1958 –
2010 at Buchan Deep.
Table 2.1 Annual direction sample distribution of non-exceedance (%) of 1-hour average wind
speed 10 m above sea level for the period 1958 – 2010 at Buchan Deep.
Wind (m/s)
0°
30°
60°
90°
120°
150°
180°
210°
240°
270°
300°
330°
Omni
< 2 0.31 0.32 0.30 0.35 0.35 0.37 0.40 0.36 0.35 0.31 0.31 0.34 4.08 < 4 1.24 1.05 1.01 1.06 1.24 1.53 1.56 1.48 1.23 1.11 1.04 1.19 14.74 < 6 2.61 1.99 1.70 1.86 2.40 3.45 3.73 3.28 2.53 2.20 2.12 2.56 30.43 < 8 4.12 2.88 2.41 2.67 3.45 5.42 6.49 5.57 4.09 3.48 3.53 4.34 48.44
< 10 5.53 3.47 2.87 3.30 4.38 7.13 9.22 8.40 5.80 4.78 5.00 6.24 66.11 < 12 6.55 3.82 3.07 3.77 5.14 8.35 11.18 11.18 7.24 5.92 6.21 7.97 80.42 < 14 7.14 4.00 3.18 4.06 5.66 9.19 12.50 13.32 8.10 6.60 6.98 9.20 89.95 < 16 7.46 4.08 3.23 4.20 5.96 9.65 13.25 14.55 8.47 6.95 7.45 9.89 95.14 < 18 7.65 4.12 3.26 4.26 6.13 9.88 13.68 15.20 8.65 7.15 7.71 10.29 97.97 < 20 7.73 4.13 3.26 4.29 6.21 9.98 13.88 15.48 8.71 7.23 7.83 10.49 99.23 < 22 7.77 4.14 3.27 4.29 6.24 10.04 13.97 15.59 8.74 7.27 7.88 10.58 99.77 < 24 7.77 4.14 3.27 4.29 6.24 10.05 14.00 15.62 8.75 7.28 7.90 10.61 99.94 < 26 7.77 10.05 14.01 15.63 8.75 7.29 7.92 10.61 99.98 < 28 7.78 14.01 15.64 7.29 7.92 10.62 100.00 < 30 7.78 15.64 7.92 10.62 100.00 < 32 15.64 7.92 100.00 Total 7.78 4.14 3.27 4.29 6.24 10.05 14.01 15.64 8.75 7.29 7.92 10.62 100.00
Mean 8.1 6.6 6.2 7.2 8.0 8.1 8.8 9.7 8.5 8.5 8.9 9.3 8.5
Maximum 28.2 23.3 22.4 22.8 23.6 25.6 26.9 30.6 25.3 27.7 31.4 28.4 31.4
Hywind Buchan Deep Metocean Design Basis
Doc. no. RE2014-002 Date Rev. no. 2014-05-13 2
Page 12 of 129
0.0
5.0
10.0
15.0
20.0
25.0
30.0
35.0
Jan Feb Mar Apr May Jun Jul Aug Sept Oct Nov Dec
Win
d sp
eed
-m/s
Buchan Deep - 10 m a.s.l.
Maximum
Mean
Figure 2.2 Monthly mean and maximum 1-hour average wind speed 10 m above sea level for the
period 1958 – 2010 at Buchan Deep.
Table 2.2 Monthly and annual sample distribution of non-exceedance (%) of 1-hour average
wind speed 10 m above sea level for the period 1958 – 2010 at Buchan Deep.
Wind (m/s) Jan Feb Mar Apr May Jun Jul Aug Sept Oct Nov Dec Year < 2 1.53 2.36 2.28 4.65 5.42 7.22 8.51 6.89 3.72 2.65 1.89 1.68 4.08 < 4 6.41 9.34 9.77 16.85 20.31 24.27 26.42 24.22 15.07 9.17 8.07 6.65 14.74 < 6 15.95 21.08 22.78 34.78 40.98 46.56 49.37 45.44 32.59 20.49 18.00 16.60 30.43 < 8 29.43 36.60 38.39 56.07 63.31 67.34 69.80 66.46 52.48 37.49 32.19 31.08 48.44
< 10 46.10 54.23 56.58 73.47 80.90 84.57 85.62 83.13 71.37 57.71 50.35 48.73 66.11 < 12 63.25 70.81 73.93 86.45 92.26 94.57 95.02 93.34 84.84 75.37 68.01 66.68 80.42 < 14 78.20 83.43 86.08 94.30 97.57 98.34 98.46 98.20 93.61 87.56 82.14 81.23 89.95 < 16 88.25 91.29 93.49 97.73 99.50 99.51 99.54 99.59 97.44 93.82 91.08 90.22 95.14 < 18 94.44 96.40 97.53 99.21 99.91 99.91 99.89 99.92 99.06 97.41 96.19 95.68 97.97 < 20 97.63 98.61 99.20 99.71 100.00 100.00 99.98 99.99 99.69 99.03 98.52 98.37 99.23 < 22 99.16 99.58 99.77 99.96 100.00 100.00 99.93 99.69 99.51 99.59 99.77 < 24 99.70 99.92 99.97 99.98 100.00 99.92 99.84 99.95 99.94 < 26 99.91 99.96 100.00 100.00 99.96 99.97 100.00 99.98 < 28 99.98 99.98 99.98 100.00 100.00 < 30 99.99 99.99 100.00 100.00 < 32 100.00 100.00 100.00 Total 100.00 100.00 100.00 100.00 100.00 100.00 100.00 100.00 100.00 100.00 100.00 100.00 100.00
Mean 10.7 9.8 9.5 7.8 7.1 6.6 6.4 6.7 8.1 9.5 10.1 10.3 8.5
Maximum 30.6 31.4 25.1 25.0 19.8 19.1 21.2 21.2 23.5 28.2 27.8 25.9 31.4
Hywind Buchan Deep Metocean Design Basis
Doc. no. RE2014-002 Date Rev. no. 2014-05-13 2
Page 13 of 129
0
30
60
90
120
150
180
210
240
270
300
330
0% 5% 10% 15% 20%
Wind speed - (m/s)>0 - 5>5 - 10>10 - 15>15 - 20>20 - 25>25 - 30>30
Buchan Deep
January
0
30
60
90
120
150
180
210
240
270
300
330
0% 5% 10% 15% 20%
Wind speed - (m/s)>0 - 5>5 - 10>10 - 15>15 - 20>20 - 25>25 - 30>30
Buchan Deep
February
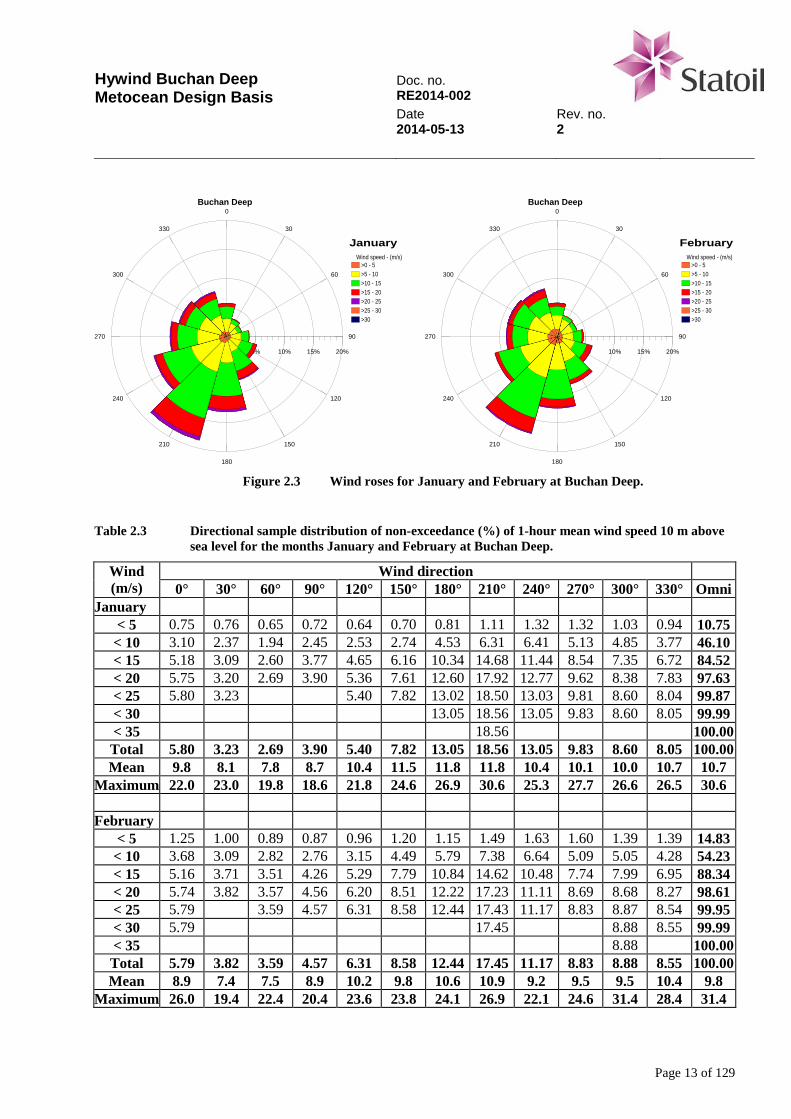
Figure 2.3 Wind roses for January and February at Buchan Deep.
Table 2.3 Directional sample distribution of non-exceedance (%) of 1-hour mean wind speed 10 m above
sea level for the months January and February at Buchan Deep.
Wind (m/s)
Wind direction 0° 30° 60° 90° 120° 150° 180° 210° 240° 270° 300° 330° Omni
January < 5 0.75 0.76 0.65 0.72 0.64 0.70 0.81 1.11 1.32 1.32 1.03 0.94 10.75
< 10 3.10 2.37 1.94 2.45 2.53 2.74 4.53 6.31 6.41 5.13 4.85 3.77 46.10 < 15 5.18 3.09 2.60 3.77 4.65 6.16 10.34 14.68 11.44 8.54 7.35 6.72 84.52 < 20 5.75 3.20 2.69 3.90 5.36 7.61 12.60 17.92 12.77 9.62 8.38 7.83 97.63 < 25 5.80 3.23 5.40 7.82 13.02 18.50 13.03 9.81 8.60 8.04 99.87 < 30 13.05 18.56 13.05 9.83 8.60 8.05 99.99 < 35 18.56 100.00 Total 5.80 3.23 2.69 3.90 5.40 7.82 13.05 18.56 13.05 9.83 8.60 8.05 100.00 Mean 9.8 8.1 7.8 8.7 10.4 11.5 11.8 11.8 10.4 10.1 10.0 10.7 10.7
Maximum 22.0 23.0 19.8 18.6 21.8 24.6 26.9 30.6 25.3 27.7 26.6 26.5 30.6 February
< 5 1.25 1.00 0.89 0.87 0.96 1.20 1.15 1.49 1.63 1.60 1.39 1.39 14.83 < 10 3.68 3.09 2.82 2.76 3.15 4.49 5.79 7.38 6.64 5.09 5.05 4.28 54.23 < 15 5.16 3.71 3.51 4.26 5.29 7.79 10.84 14.62 10.48 7.74 7.99 6.95 88.34 < 20 5.74 3.82 3.57 4.56 6.20 8.51 12.22 17.23 11.11 8.69 8.68 8.27 98.61 < 25 5.79 3.59 4.57 6.31 8.58 12.44 17.43 11.17 8.83 8.87 8.54 99.95 < 30 5.79 17.45 8.88 8.55 99.99 < 35 8.88 100.00 Total 5.79 3.82 3.59 4.57 6.31 8.58 12.44 17.45 11.17 8.83 8.88 8.55 100.00 Mean 8.9 7.4 7.5 8.9 10.2 9.8 10.6 10.9 9.2 9.5 9.5 10.4 9.8
Maximum 26.0 19.4 22.4 20.4 23.6 23.8 24.1 26.9 22.1 24.6 31.4 28.4 31.4
Hywind Buchan Deep Metocean Design Basis
Doc. no. RE2014-002 Date Rev. no. 2014-05-13 2
Page 14 of 129
0
30
60
90
120
150
180
210
240
270
300
330
0% 5% 10% 15% 20%
Wind speed - (m/s)>0 - 5>5 - 10>10 - 15>15 - 20>20 - 25>25 - 30>30
Buchan Deep
March
0
30
60
90
120
150
180
210
240
270
300
330
0% 5% 10% 15%
Wind speed - (m/s)>0 - 5>5 - 10>10 - 15>15 - 20>20 - 25>25 - 30>30
Buchan Deep
April
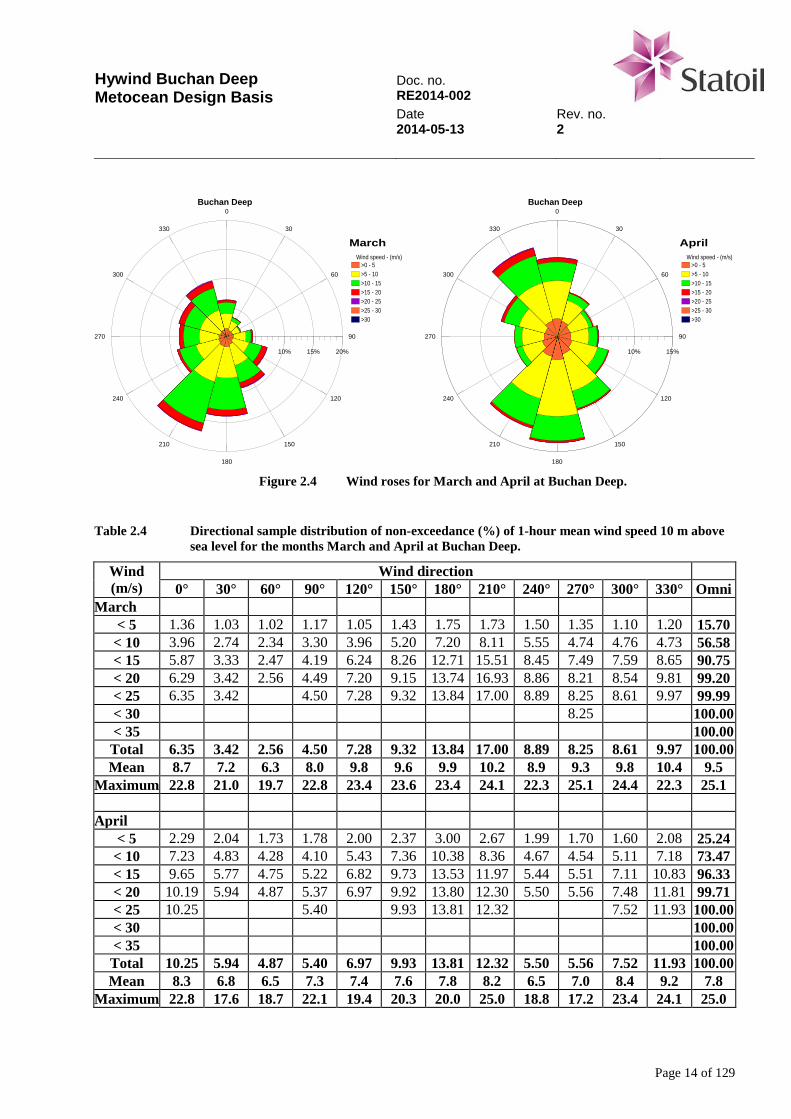
Figure 2.4 Wind roses for March and April at Buchan Deep.
Table 2.4 Directional sample distribution of non-exceedance (%) of 1-hour mean wind speed 10 m above
sea level for the months March and April at Buchan Deep.
Wind (m/s)
Wind direction 0° 30° 60° 90° 120° 150° 180° 210° 240° 270° 300° 330° Omni
March < 5 1.36 1.03 1.02 1.17 1.05 1.43 1.75 1.73 1.50 1.35 1.10 1.20 15.70
< 10 3.96 2.74 2.34 3.30 3.96 5.20 7.20 8.11 5.55 4.74 4.76 4.73 56.58 < 15 5.87 3.33 2.47 4.19 6.24 8.26 12.71 15.51 8.45 7.49 7.59 8.65 90.75 < 20 6.29 3.42 2.56 4.49 7.20 9.15 13.74 16.93 8.86 8.21 8.54 9.81 99.20 < 25 6.35 3.42 4.50 7.28 9.32 13.84 17.00 8.89 8.25 8.61 9.97 99.99 < 30 8.25 100.00 < 35 100.00 Total 6.35 3.42 2.56 4.50 7.28 9.32 13.84 17.00 8.89 8.25 8.61 9.97 100.00 Mean 8.7 7.2 6.3 8.0 9.8 9.6 9.9 10.2 8.9 9.3 9.8 10.4 9.5
Maximum 22.8 21.0 19.7 22.8 23.4 23.6 23.4 24.1 22.3 25.1 24.4 22.3 25.1 April
< 5 2.29 2.04 1.73 1.78 2.00 2.37 3.00 2.67 1.99 1.70 1.60 2.08 25.24 < 10 7.23 4.83 4.28 4.10 5.43 7.36 10.38 8.36 4.67 4.54 5.11 7.18 73.47 < 15 9.65 5.77 4.75 5.22 6.82 9.73 13.53 11.97 5.44 5.51 7.11 10.83 96.33 < 20 10.19 5.94 4.87 5.37 6.97 9.92 13.80 12.30 5.50 5.56 7.48 11.81 99.71 < 25 10.25 5.40 9.93 13.81 12.32 7.52 11.93 100.00 < 30 100.00 < 35 100.00 Total 10.25 5.94 4.87 5.40 6.97 9.93 13.81 12.32 5.50 5.56 7.52 11.93 100.00 Mean 8.3 6.8 6.5 7.3 7.4 7.6 7.8 8.2 6.5 7.0 8.4 9.2 7.8
Maximum 22.8 17.6 18.7 22.1 19.4 20.3 20.0 25.0 18.8 17.2 23.4 24.1 25.0
Hywind Buchan Deep Metocean Design Basis
Doc. no. RE2014-002 Date Rev. no. 2014-05-13 2
Page 15 of 129
0
30
60
90
120
150
180
210
240
270
300
330
0% 5% 10% 15%
Wind speed - (m/s)>0 - 5>5 - 10>10 - 15>15 - 20>20 - 25>25 - 30>30
Buchan Deep
May
0
30
60
90
120
150
180
210
240
270
300
330
0% 5% 10% 15% 20%
Wind speed - (m/s)>0 - 5>5 - 10>10 - 15>15 - 20>20 - 25>25 - 30>30
Buchan Deep
June
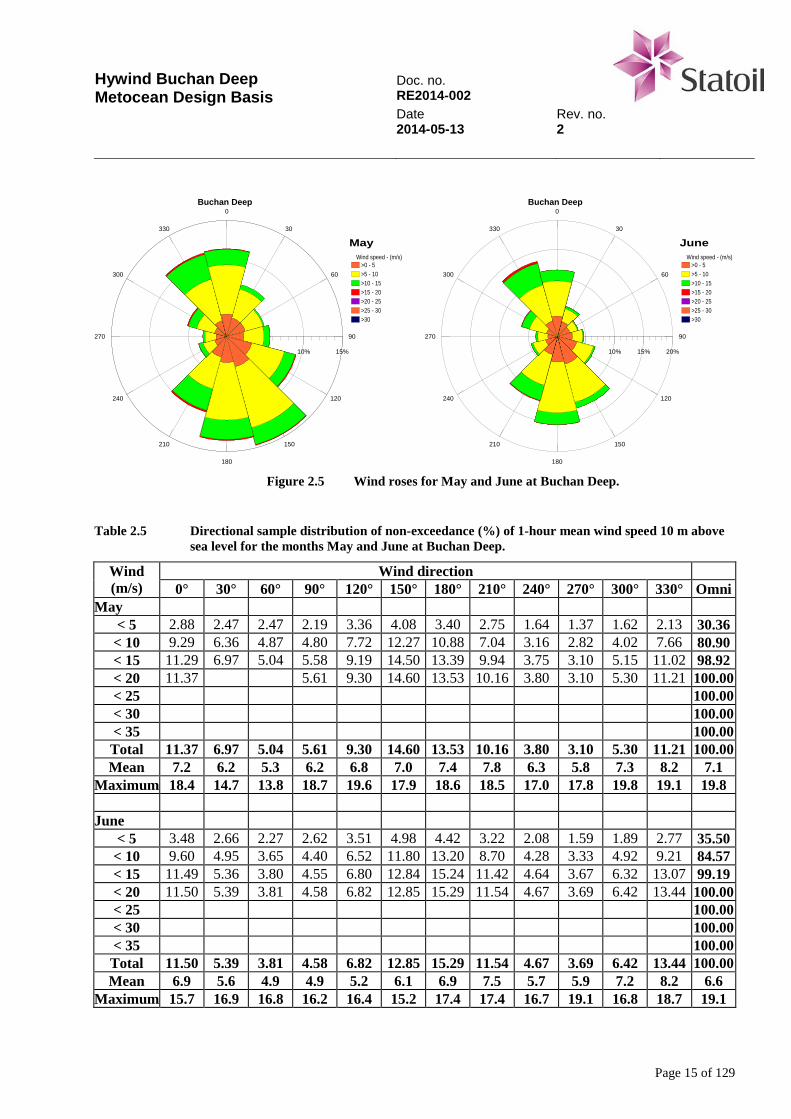
Figure 2.5 Wind roses for May and June at Buchan Deep.
Table 2.5 Directional sample distribution of non-exceedance (%) of 1-hour mean wind speed 10 m above
sea level for the months May and June at Buchan Deep.
Wind (m/s)
Wind direction 0° 30° 60° 90° 120° 150° 180° 210° 240° 270° 300° 330° Omni
May < 5 2.88 2.47 2.47 2.19 3.36 4.08 3.40 2.75 1.64 1.37 1.62 2.13 30.36
< 10 9.29 6.36 4.87 4.80 7.72 12.27 10.88 7.04 3.16 2.82 4.02 7.66 80.90 < 15 11.29 6.97 5.04 5.58 9.19 14.50 13.39 9.94 3.75 3.10 5.15 11.02 98.92 < 20 11.37 5.61 9.30 14.60 13.53 10.16 3.80 3.10 5.30 11.21 100.00 < 25 100.00 < 30 100.00 < 35 100.00 Total 11.37 6.97 5.04 5.61 9.30 14.60 13.53 10.16 3.80 3.10 5.30 11.21 100.00 Mean 7.2 6.2 5.3 6.2 6.8 7.0 7.4 7.8 6.3 5.8 7.3 8.2 7.1
Maximum 18.4 14.7 13.8 18.7 19.6 17.9 18.6 18.5 17.0 17.8 19.8 19.1 19.8 June
< 5 3.48 2.66 2.27 2.62 3.51 4.98 4.42 3.22 2.08 1.59 1.89 2.77 35.50 < 10 9.60 4.95 3.65 4.40 6.52 11.80 13.20 8.70 4.28 3.33 4.92 9.21 84.57 < 15 11.49 5.36 3.80 4.55 6.80 12.84 15.24 11.42 4.64 3.67 6.32 13.07 99.19 < 20 11.50 5.39 3.81 4.58 6.82 12.85 15.29 11.54 4.67 3.69 6.42 13.44 100.00 < 25 100.00 < 30 100.00 < 35 100.00 Total 11.50 5.39 3.81 4.58 6.82 12.85 15.29 11.54 4.67 3.69 6.42 13.44 100.00 Mean 6.9 5.6 4.9 4.9 5.2 6.1 6.9 7.5 5.7 5.9 7.2 8.2 6.6
Maximum 15.7 16.9 16.8 16.2 16.4 15.2 17.4 17.4 16.7 19.1 16.8 18.7 19.1
Hywind Buchan Deep Metocean Design Basis
Doc. no. RE2014-002 Date Rev. no. 2014-05-13 2
Page 16 of 129
0
30
60
90
120
150
180
210
240
270
300
330
0% 5% 10% 15% 20%
Wind speed - (m/s)>0 - 5>5 - 10>10 - 15>15 - 20>20 - 25>25 - 30>30
Buchan Deep
July
0
30
60
90
120
150
180
210
240
270
300
330
0% 5% 10% 15% 20%
Wind speed - (m/s)>0 - 5>5 - 10>10 - 15>15 - 20>20 - 25>25 - 30>30
Buchan Deep
August
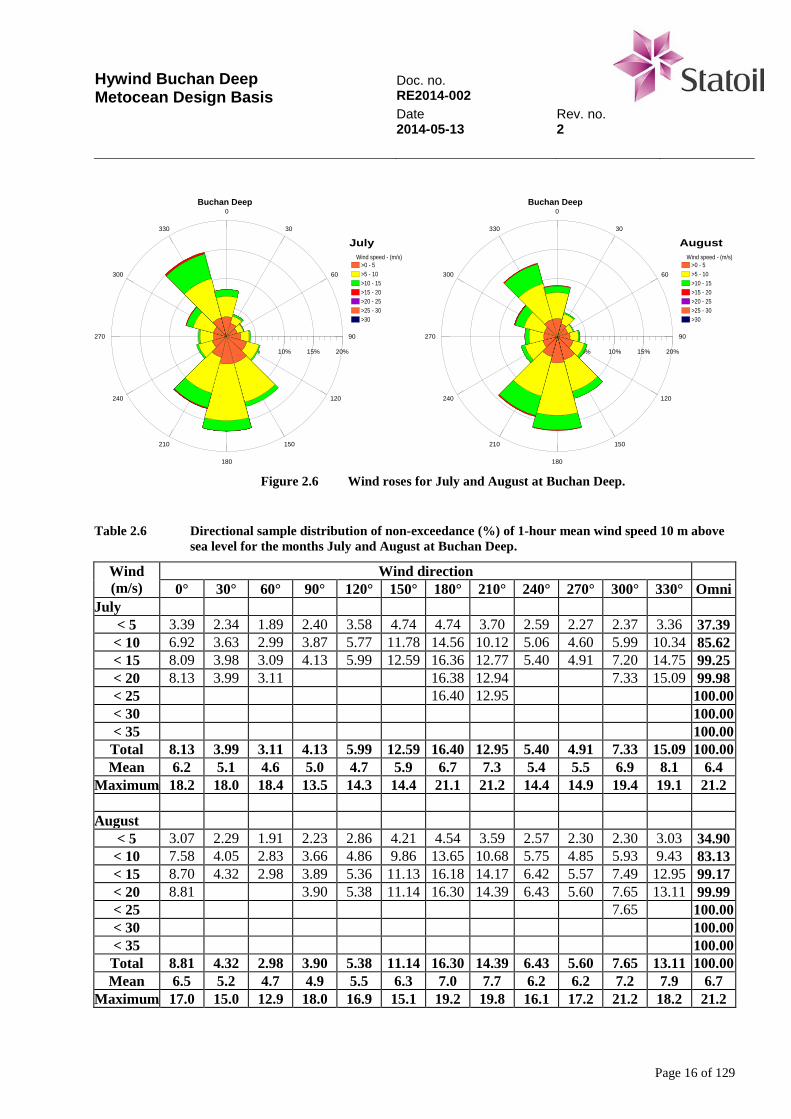
Figure 2.6 Wind roses for July and August at Buchan Deep.
Table 2.6 Directional sample distribution of non-exceedance (%) of 1-hour mean wind speed 10 m above
sea level for the months July and August at Buchan Deep.
Wind (m/s)
Wind direction 0° 30° 60° 90° 120° 150° 180° 210° 240° 270° 300° 330° Omni
July < 5 3.39 2.34 1.89 2.40 3.58 4.74 4.74 3.70 2.59 2.27 2.37 3.36 37.39
< 10 6.92 3.63 2.99 3.87 5.77 11.78 14.56 10.12 5.06 4.60 5.99 10.34 85.62 < 15 8.09 3.98 3.09 4.13 5.99 12.59 16.36 12.77 5.40 4.91 7.20 14.75 99.25 < 20 8.13 3.99 3.11 16.38 12.94 7.33 15.09 99.98 < 25 16.40 12.95 100.00 < 30 100.00 < 35 100.00 Total 8.13 3.99 3.11 4.13 5.99 12.59 16.40 12.95 5.40 4.91 7.33 15.09 100.00 Mean 6.2 5.1 4.6 5.0 4.7 5.9 6.7 7.3 5.4 5.5 6.9 8.1 6.4
Maximum 18.2 18.0 18.4 13.5 14.3 14.4 21.1 21.2 14.4 14.9 19.4 19.1 21.2 August
< 5 3.07 2.29 1.91 2.23 2.86 4.21 4.54 3.59 2.57 2.30 2.30 3.03 34.90 < 10 7.58 4.05 2.83 3.66 4.86 9.86 13.65 10.68 5.75 4.85 5.93 9.43 83.13 < 15 8.70 4.32 2.98 3.89 5.36 11.13 16.18 14.17 6.42 5.57 7.49 12.95 99.17 < 20 8.81 3.90 5.38 11.14 16.30 14.39 6.43 5.60 7.65 13.11 99.99 < 25 7.65 100.00 < 30 100.00 < 35 100.00 Total 8.81 4.32 2.98 3.90 5.38 11.14 16.30 14.39 6.43 5.60 7.65 13.11 100.00 Mean 6.5 5.2 4.7 4.9 5.5 6.3 7.0 7.7 6.2 6.2 7.2 7.9 6.7
Maximum 17.0 15.0 12.9 18.0 16.9 15.1 19.2 19.8 16.1 17.2 21.2 18.2 21.2
Hywind Buchan Deep Metocean Design Basis
Doc. no. RE2014-002 Date Rev. no. 2014-05-13 2
Page 17 of 129
0
30
60
90
120
150
180
210
240
270
300
330
0% 5% 10% 15% 20%
Wind speed - (m/s)>0 - 5>5 - 10>10 - 15>15 - 20>20 - 25>25 - 30>30
Buchan Deep
September
0
30
60
90
120
150
180
210
240
270
300
330
0% 5% 10% 15% 20%
Wind speed - (m/s)>0 - 5>5 - 10>10 - 15>15 - 20>20 - 25>25 - 30>30
Buchan Deep
October
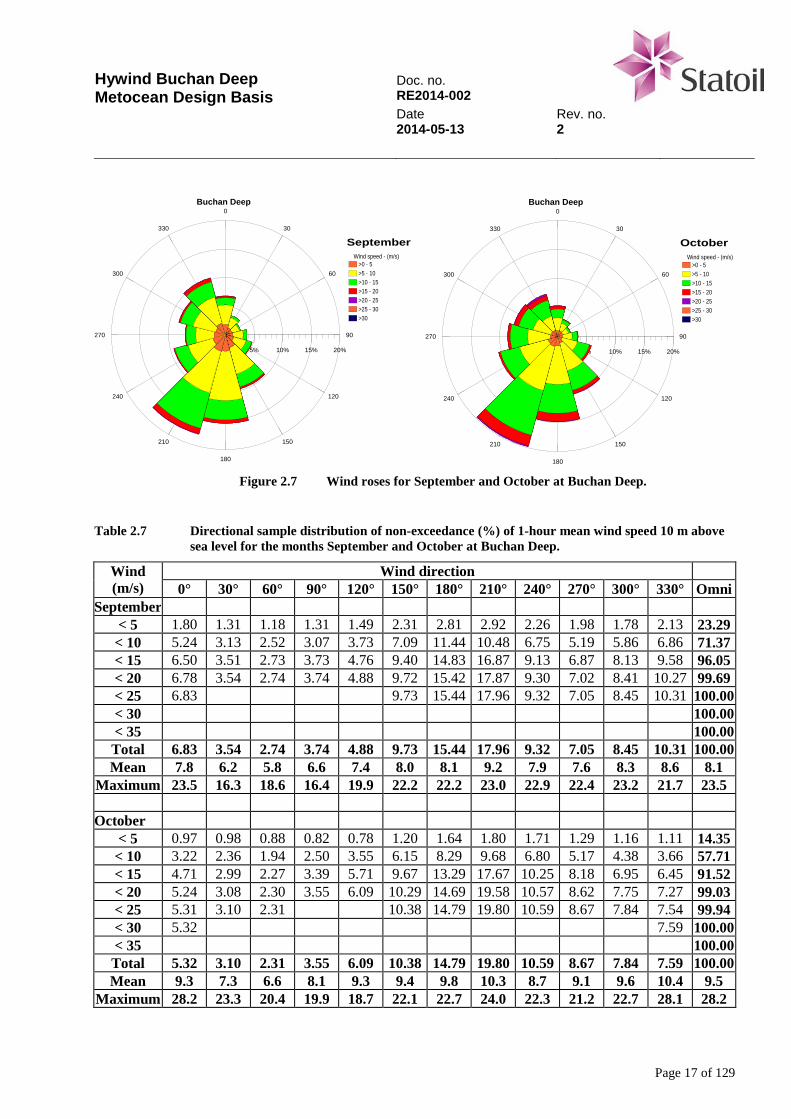
Figure 2.7 Wind roses for September and October at Buchan Deep.
Table 2.7 Directional sample distribution of non-exceedance (%) of 1-hour mean wind speed 10 m above
sea level for the months September and October at Buchan Deep.
Wind (m/s)
Wind direction 0° 30° 60° 90° 120° 150° 180° 210° 240° 270° 300° 330° Omni
September < 5 1.80 1.31 1.18 1.31 1.49 2.31 2.81 2.92 2.26 1.98 1.78 2.13 23.29 < 10 5.24 3.13 2.52 3.07 3.73 7.09 11.44 10.48 6.75 5.19 5.86 6.86 71.37 < 15 6.50 3.51 2.73 3.73 4.76 9.40 14.83 16.87 9.13 6.87 8.13 9.58 96.05 < 20 6.78 3.54 2.74 3.74 4.88 9.72 15.42 17.87 9.30 7.02 8.41 10.27 99.69 < 25 6.83 9.73 15.44 17.96 9.32 7.05 8.45 10.31 100.00 < 30 100.00 < 35 100.00 Total 6.83 3.54 2.74 3.74 4.88 9.73 15.44 17.96 9.32 7.05 8.45 10.31 100.00 Mean 7.8 6.2 5.8 6.6 7.4 8.0 8.1 9.2 7.9 7.6 8.3 8.6 8.1
Maximum 23.5 16.3 18.6 16.4 19.9 22.2 22.2 23.0 22.9 22.4 23.2 21.7 23.5 October
< 5 0.97 0.98 0.88 0.82 0.78 1.20 1.64 1.80 1.71 1.29 1.16 1.11 14.35 < 10 3.22 2.36 1.94 2.50 3.55 6.15 8.29 9.68 6.80 5.17 4.38 3.66 57.71 < 15 4.71 2.99 2.27 3.39 5.71 9.67 13.29 17.67 10.25 8.18 6.95 6.45 91.52 < 20 5.24 3.08 2.30 3.55 6.09 10.29 14.69 19.58 10.57 8.62 7.75 7.27 99.03 < 25 5.31 3.10 2.31 10.38 14.79 19.80 10.59 8.67 7.84 7.54 99.94 < 30 5.32 7.59 100.00 < 35 100.00 Total 5.32 3.10 2.31 3.55 6.09 10.38 14.79 19.80 10.59 8.67 7.84 7.59 100.00 Mean 9.3 7.3 6.6 8.1 9.3 9.4 9.8 10.3 8.7 9.1 9.6 10.4 9.5
Maximum 28.2 23.3 20.4 19.9 18.7 22.1 22.7 24.0 22.3 21.2 22.7 28.1 28.2
Hywind Buchan Deep Metocean Design Basis
Doc. no. RE2014-002 Date Rev. no. 2014-05-13 2
Page 18 of 129
0
30
60
90
120
150
180
210
240
270
300
330
0% 5% 10% 15% 20%
Wind speed - (m/s)>0 - 5>5 - 10>10 - 15>15 - 20>20 - 25>25 - 30>30
Buchan Deep
November
0
30
60
90
120
150
180
210
240
270
300
330
0% 5% 10% 15% 20%
Wind speed - (m/s)>0 - 5>5 - 10>10 - 15>15 - 20>20 - 25>25 - 30>30
Buchan Deep
December
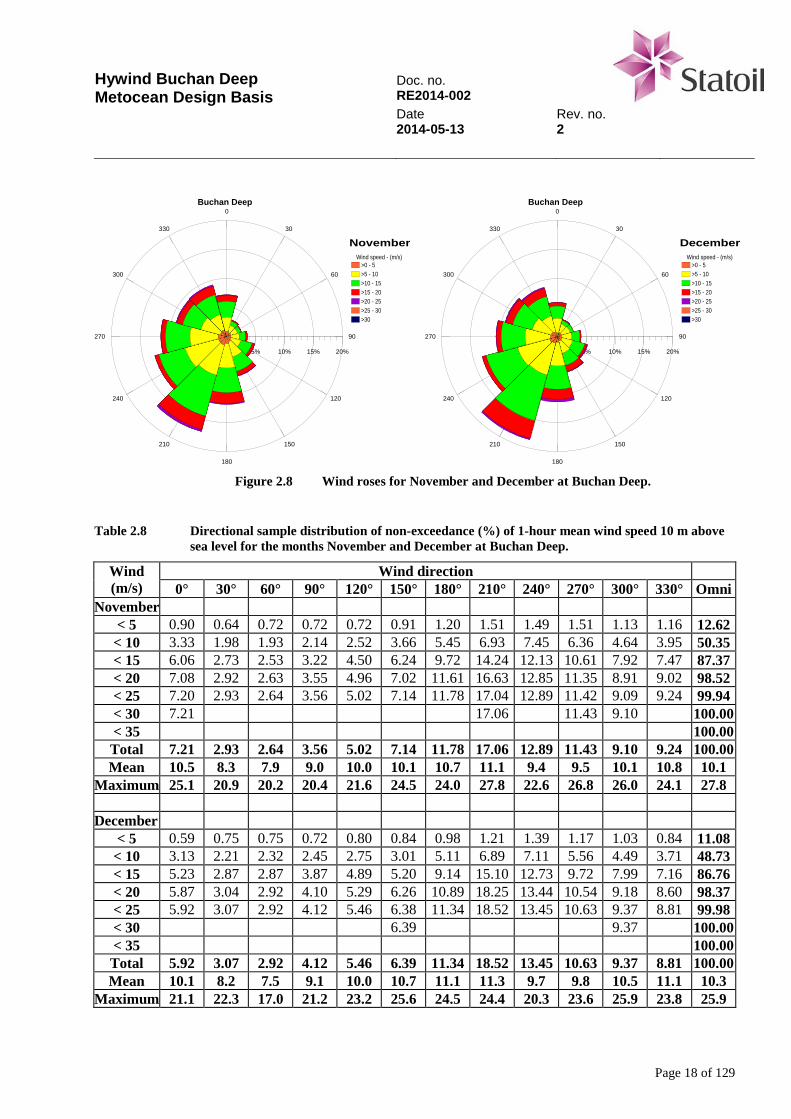
Figure 2.8 Wind roses for November and December at Buchan Deep.
Table 2.8 Directional sample distribution of non-exceedance (%) of 1-hour mean wind speed 10 m above
sea level for the months November and December at Buchan Deep.
Wind (m/s)
Wind direction 0° 30° 60° 90° 120° 150° 180° 210° 240° 270° 300° 330° Omni
November < 5 0.90 0.64 0.72 0.72 0.72 0.91 1.20 1.51 1.49 1.51 1.13 1.16 12.62
< 10 3.33 1.98 1.93 2.14 2.52 3.66 5.45 6.93 7.45 6.36 4.64 3.95 50.35 < 15 6.06 2.73 2.53 3.22 4.50 6.24 9.72 14.24 12.13 10.61 7.92 7.47 87.37 < 20 7.08 2.92 2.63 3.55 4.96 7.02 11.61 16.63 12.85 11.35 8.91 9.02 98.52 < 25 7.20 2.93 2.64 3.56 5.02 7.14 11.78 17.04 12.89 11.42 9.09 9.24 99.94 < 30 7.21 17.06 11.43 9.10 100.00 < 35 100.00 Total 7.21 2.93 2.64 3.56 5.02 7.14 11.78 17.06 12.89 11.43 9.10 9.24 100.00 Mean 10.5 8.3 7.9 9.0 10.0 10.1 10.7 11.1 9.4 9.5 10.1 10.8 10.1
Maximum 25.1 20.9 20.2 20.4 21.6 24.5 24.0 27.8 22.6 26.8 26.0 24.1 27.8 December
< 5 0.59 0.75 0.75 0.72 0.80 0.84 0.98 1.21 1.39 1.17 1.03 0.84 11.08 < 10 3.13 2.21 2.32 2.45 2.75 3.01 5.11 6.89 7.11 5.56 4.49 3.71 48.73 < 15 5.23 2.87 2.87 3.87 4.89 5.20 9.14 15.10 12.73 9.72 7.99 7.16 86.76 < 20 5.87 3.04 2.92 4.10 5.29 6.26 10.89 18.25 13.44 10.54 9.18 8.60 98.37 < 25 5.92 3.07 2.92 4.12 5.46 6.38 11.34 18.52 13.45 10.63 9.37 8.81 99.98 < 30 6.39 9.37 100.00 < 35 100.00 Total 5.92 3.07 2.92 4.12 5.46 6.39 11.34 18.52 13.45 10.63 9.37 8.81 100.00 Mean 10.1 8.2 7.5 9.1 10.0 10.7 11.1 11.3 9.7 9.8 10.5 11.1 10.3
Maximum 21.1 22.3 17.0 21.2 23.2 25.6 24.5 24.4 20.3 23.6 25.9 23.8 25.9
Hywind Buchan Deep Metocean Design Basis
Doc. no. RE2014-002 Date Rev. no. 2014-05-13 2
Page 19 of 129
2.2 Winds 100 m above sea level
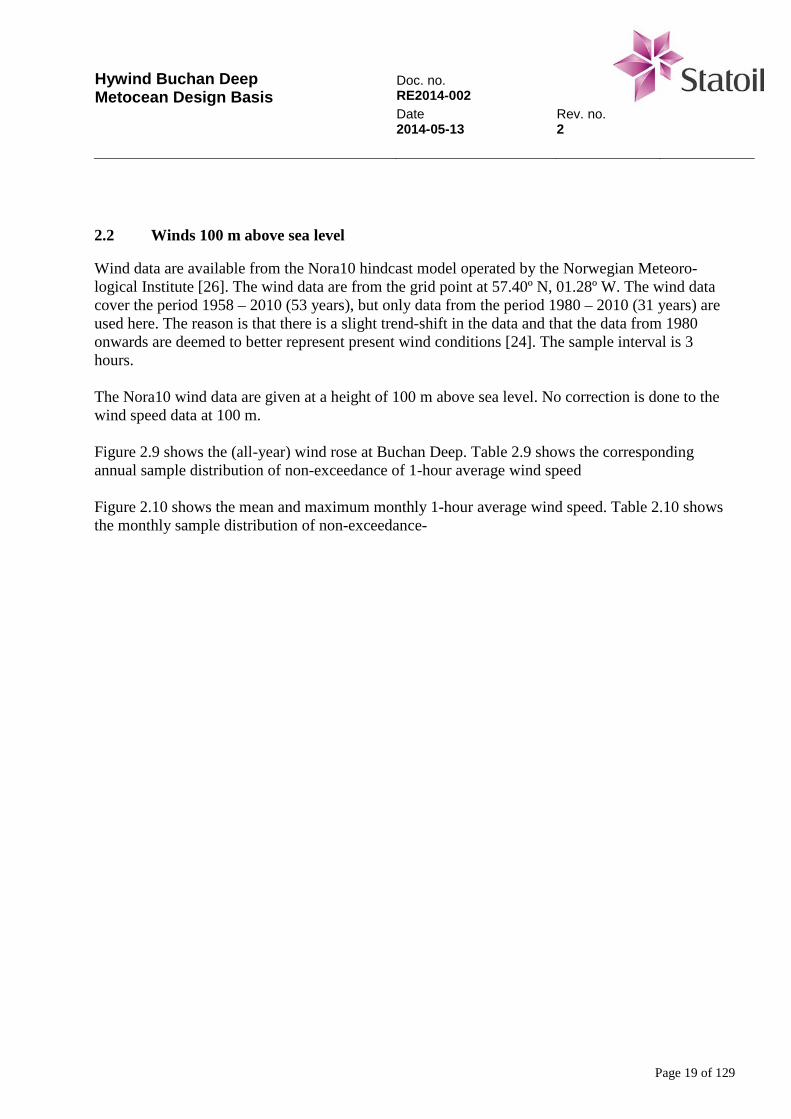
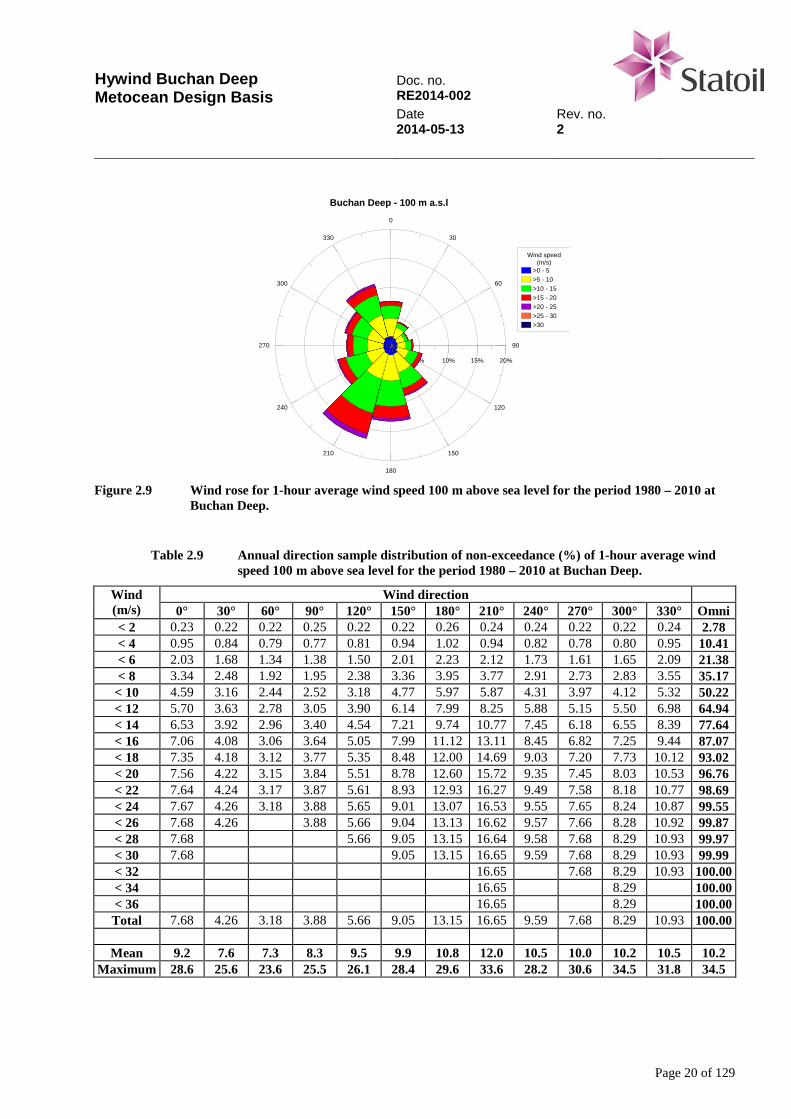
Wind data are available from the Nora10 hindcast model operated by the Norwegian Meteoro-logical Institute [26]. The wind data are from the grid point at 57.40º N, 01.28º W. The wind data cover the period 1958 – 2010 (53 years), but only data from the period 1980 – 2010 (31 years) are used here. The reason is that there is a slight trend-shift in the data and that the data from 1980 onwards are deemed to better represent present wind conditions [24]. The sample interval is 3 hours. The Nora10 wind data are given at a height of 100 m above sea level. No correction is done to the wind speed data at 100 m. Figure 2.9 shows the (all-year) wind rose at Buchan Deep. Table 2.9 shows the corresponding annual sample distribution of non-exceedance of 1-hour average wind speed Figure 2.10 shows the mean and maximum monthly 1-hour average wind speed. Table 2.10 shows the monthly sample distribution of non-exceedance-
Hywind Buchan Deep Metocean Design Basis
Doc. no. RE2014-002 Date Rev. no. 2014-05-13 2
Page 20 of 129
0
30
60
90
120
150
180
210
240
270
300
330
0% 5% 10% 15% 20%
Wind speed(m/s)
>0 - 5>5 - 10>10 - 15>15 - 20>20 - 25>25 - 30>30
Buchan Deep - 100 m a.s.l
Figure 2.9 Wind rose for 1-hour average wind speed 100 m above sea level for the period 1980 – 2010 at
Buchan Deep.
Table 2.9 Annual direction sample distribution of non-exceedance (%) of 1-hour average wind
speed 100 m above sea level for the period 1980 – 2010 at Buchan Deep.
Wind (m/s)
Wind direction 0° 30° 60° 90° 120° 150° 180° 210° 240° 270° 300° 330° Omni
< 2 0.23 0.22 0.22 0.25 0.22 0.22 0.26 0.24 0.24 0.22 0.22 0.24 2.78 < 4 0.95 0.84 0.79 0.77 0.81 0.94 1.02 0.94 0.82 0.78 0.80 0.95 10.41 < 6 2.03 1.68 1.34 1.38 1.50 2.01 2.23 2.12 1.73 1.61 1.65 2.09 21.38 < 8 3.34 2.48 1.92 1.95 2.38 3.36 3.95 3.77 2.91 2.73 2.83 3.55 35.17
< 10 4.59 3.16 2.44 2.52 3.18 4.77 5.97 5.87 4.31 3.97 4.12 5.32 50.22 < 12 5.70 3.63 2.78 3.05 3.90 6.14 7.99 8.25 5.88 5.15 5.50 6.98 64.94 < 14 6.53 3.92 2.96 3.40 4.54 7.21 9.74 10.77 7.45 6.18 6.55 8.39 77.64 < 16 7.06 4.08 3.06 3.64 5.05 7.99 11.12 13.11 8.45 6.82 7.25 9.44 87.07 < 18 7.35 4.18 3.12 3.77 5.35 8.48 12.00 14.69 9.03 7.20 7.73 10.12 93.02 < 20 7.56 4.22 3.15 3.84 5.51 8.78 12.60 15.72 9.35 7.45 8.03 10.53 96.76 < 22 7.64 4.24 3.17 3.87 5.61 8.93 12.93 16.27 9.49 7.58 8.18 10.77 98.69 < 24 7.67 4.26 3.18 3.88 5.65 9.01 13.07 16.53 9.55 7.65 8.24 10.87 99.55 < 26 7.68 4.26 3.88 5.66 9.04 13.13 16.62 9.57 7.66 8.28 10.92 99.87 < 28 7.68 5.66 9.05 13.15 16.64 9.58 7.68 8.29 10.93 99.97 < 30 7.68 9.05 13.15 16.65 9.59 7.68 8.29 10.93 99.99 < 32 16.65 7.68 8.29 10.93 100.00 < 34 16.65 8.29 100.00 < 36 16.65 8.29 100.00 Total 7.68 4.26 3.18 3.88 5.66 9.05 13.15 16.65 9.59 7.68 8.29 10.93 100.00
Mean 9.2 7.6 7.3 8.3 9.5 9.9 10.8 12.0 10.5 10.0 10.2 10.5 10.2
Maximum 28.6 25.6 23.6 25.5 26.1 28.4 29.6 33.6 28.2 30.6 34.5 31.8 34.5
Hywind Buchan Deep Metocean Design Basis
Doc. no. RE2014-002 Date Rev. no. 2014-05-13 2
Page 21 of 129
0.0
5.0
10.0
15.0
20.0
25.0
30.0
35.0
40.0
Jan Feb Mar Apr May Jun Jul Aug Sept Oct Nov Dec
Win
d sp
eed
-m/s
Buchan Deep - 100 m a.s.l.
Maximum
Mean
Figure 2.10 Monthly mean and maximum 1-hour average wind speed 100 m above sea level
for the period 1980 – 2010 at Buchan Deep.
Table 2.10 Monthly and annual sample distribution of non-exceedance (%) of 1-hour average
wind speed 100 m above sea level for the period 1980 – 2010 at Buchan Deep.
Wind (m/s)
Month Jan Feb Mar Apr May Jun Jul Aug Sept Oct Nov Dec Year
< 2 1.11 1.97 1.57 2.78 3.94 4.60 5.12 4.81 2.67 1.76 1.51 1.47 2.78 < 4 4.84 7.01 6.71 11.76 14.52 15.82 18.04 16.06 10.54 6.46 7.11 5.89 10.41 < 6 11.64 15.05 15.70 24.01 28.41 31.41 33.60 31.36 22.37 13.94 14.54 14.16 21.38 < 8 21.14 25.80 27.06 39.95 46.51 47.89 51.74 47.37 37.26 25.99 24.97 25.78 35.17
< 10 32.69 37.79 40.60 57.20 64.79 65.28 68.83 64.53 53.25 40.54 37.90 38.54 50.22 < 12 46.19 51.98 55.29 71.21 79.45 80.44 83.70 79.06 68.09 56.59 53.44 53.07 64.94 < 14 60.43 65.60 70.50 83.05 89.48 91.44 93.02 90.01 80.93 71.45 67.92 67.22 77.64 < 16 72.92 77.21 82.43 91.87 95.81 97.14 97.66 96.38 90.12 83.57 79.58 79.59 87.07 < 18 83.18 86.12 91.08 96.68 98.57 99.06 99.28 98.89 95.60 91.09 88.16 88.20 93.02 < 20 90.73 93.24 96.08 98.95 99.65 99.81 99.71 99.75 98.19 95.81 94.37 94.61 96.76 < 22 95.41 97.27 98.53 99.65 99.95 100.00 99.96 99.96 99.46 98.48 97.62 97.89 98.69 < 24 98.17 99.12 99.54 99.95 100.00 99.96 100.00 99.91 99.53 99.17 99.27 99.55 < 26 99.30 99.79 99.91 100.00 100.00 100.00 99.93 99.73 99.80 99.87 < 28 99.80 99.93 100.00 100.00 99.91 99.99 99.97 < 30 99.93 99.97 99.99 100.00 99.99 < 32 99.96 99.99 100.00 100.00 < 34 100.00 99.99 100.00 < 36 100.00 100.00 Total 100.00 100.00 100.00 100.00 100.00 100.00 100.00 100.00 100.00 100.00 100.00 100.00 100.00
Mean 12.6 11.8 11.3 9.4 8.5 8.3 7.9 8.4 9.8 11.2 11.6 11.6 10.2
Maximum 33.6 34.5 27.7 24.5 22.5 21.2 24.7 23.6 25.5 26.8 30.8 28.4 34.5
Hywind Buchan Deep Metocean Design Basis
Doc. no. RE2014-002 Date Rev. no. 2014-05-13 2
Page 22 of 129
2.3 Long-term wind statistics – 10 m above sea level
The long-term distribution of wind speed is modelled in terms of a Weibull distribution:
−
−−=γ
θεuuF exp1)( where );0max( ε≥u (2.1)
where:
u Wind speed, 1-hour mean ε Location parameter θ Scale parameter γ Shape parameter
When ε < 0, then F(0) > 0 means that a (significant) fraction of the data has the value u = 0. Extreme values, uR, corresponding to a return period, R, are obtained by inverting Equation (2.1) for a cumulative probability F = 1 – τ/pR, i.e.:
γτθε
/1
ln
−⋅+=
pRuR (2.2)
where
τ Duration of event (= 1 hour for mean wind speed) p Sector or monthly probability (=1/12 for monthly omni-directional distributions) R Return period
The annual probability of exceedance, q, is given by:
−−=
RTq exp1 T = 1 year (2.3)
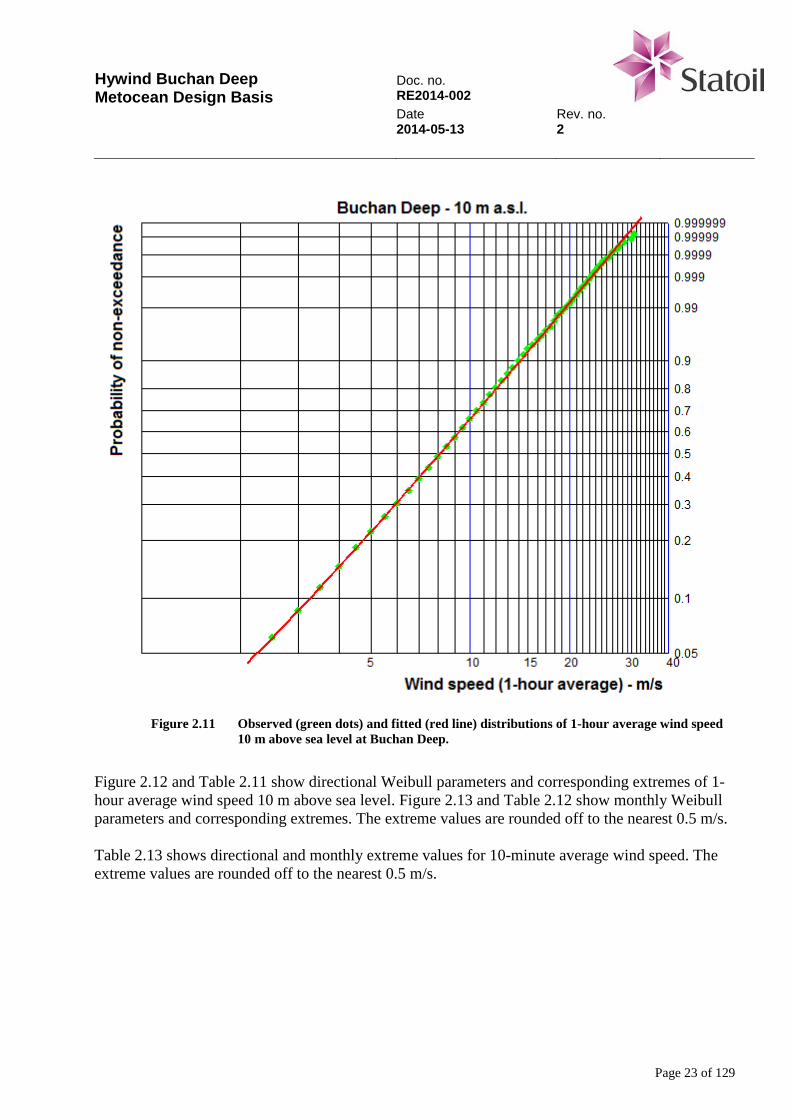
It is seen that q = 0.63 for R = 1 year and that q is approximately 10-1 and 10-2 for R = 10 and 100 years, respectively. Figure 2.11 shows the observed and fitted distributions of wind speed.
Hywind Buchan Deep Metocean Design Basis
Doc. no. RE2014-002 Date Rev. no. 2014-05-13 2
Page 23 of 129
Figure 2.11 Observed (green dots) and fitted (red line) distributions of 1-hour average wind speed
10 m above sea level at Buchan Deep.
Figure 2.12 and Table 2.11 show directional Weibull parameters and corresponding extremes of 1-hour average wind speed 10 m above sea level. Figure 2.13 and Table 2.12 show monthly Weibull parameters and corresponding extremes. The extreme values are rounded off to the nearest 0.5 m/s. Table 2.13 shows directional and monthly extreme values for 10-minute average wind speed. The extreme values are rounded off to the nearest 0.5 m/s.
Hywind Buchan Deep Metocean Design Basis
Doc. no. RE2014-002 Date Rev. no. 2014-05-13 2
Page 24 of 129
0
5
10
15
20
25
30
35
0º 30º 60º 90º 120º 150º 180º 210º 240º 270º 300º 330º
Win
d sp
eed
-m/s
Buchan Deep - 10 m a.s.l.
1 year
10 Years
50 years
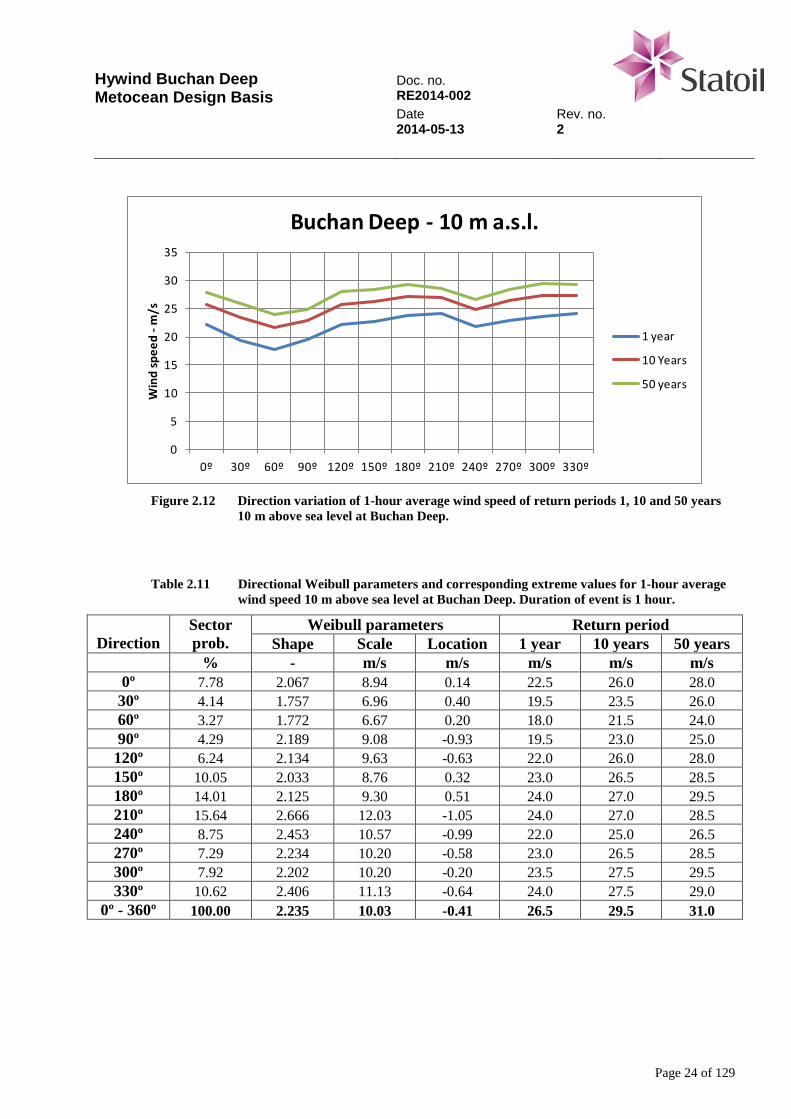
Figure 2.12 Direction variation of 1-hour average wind speed of return periods 1, 10 and 50 years
10 m above sea level at Buchan Deep.
Table 2.11 Directional Weibull parameters and corresponding extreme values for 1-hour average wind speed 10 m above sea level at Buchan Deep. Duration of event is 1 hour.
Direction
Sector prob.
Weibull parameters Return period Shape Scale Location 1 year 10 years 50 years
% - m/s m/s m/s m/s m/s 0º 7.78 2.067 8.94 0.14 22.5 26.0 28.0 30º 4.14 1.757 6.96 0.40 19.5 23.5 26.0 60º 3.27 1.772 6.67 0.20 18.0 21.5 24.0 90º 4.29 2.189 9.08 -0.93 19.5 23.0 25.0 120º 6.24 2.134 9.63 -0.63 22.0 26.0 28.0 150º 10.05 2.033 8.76 0.32 23.0 26.5 28.5 180º 14.01 2.125 9.30 0.51 24.0 27.0 29.5 210º 15.64 2.666 12.03 -1.05 24.0 27.0 28.5 240º 8.75 2.453 10.57 -0.99 22.0 25.0 26.5 270º 7.29 2.234 10.20 -0.58 23.0 26.5 28.5 300º 7.92 2.202 10.20 -0.20 23.5 27.5 29.5 330º 10.62 2.406 11.13 -0.64 24.0 27.5 29.0
0º - 360º 100.00 2.235 10.03 -0.41 26.5 29.5 31.0
Hywind Buchan Deep Metocean Design Basis
Doc. no. RE2014-002 Date Rev. no. 2014-05-13 2
Page 25 of 129
0
5
10
15
20
25
30
35
Jan Feb Mar Apr May Jun Jul Aug Sept Oct Nov Dec
Win
d sp
eed
-m/s
Buchan Deep - 10 m a.s.l.
1 year
10 Years
50 Years
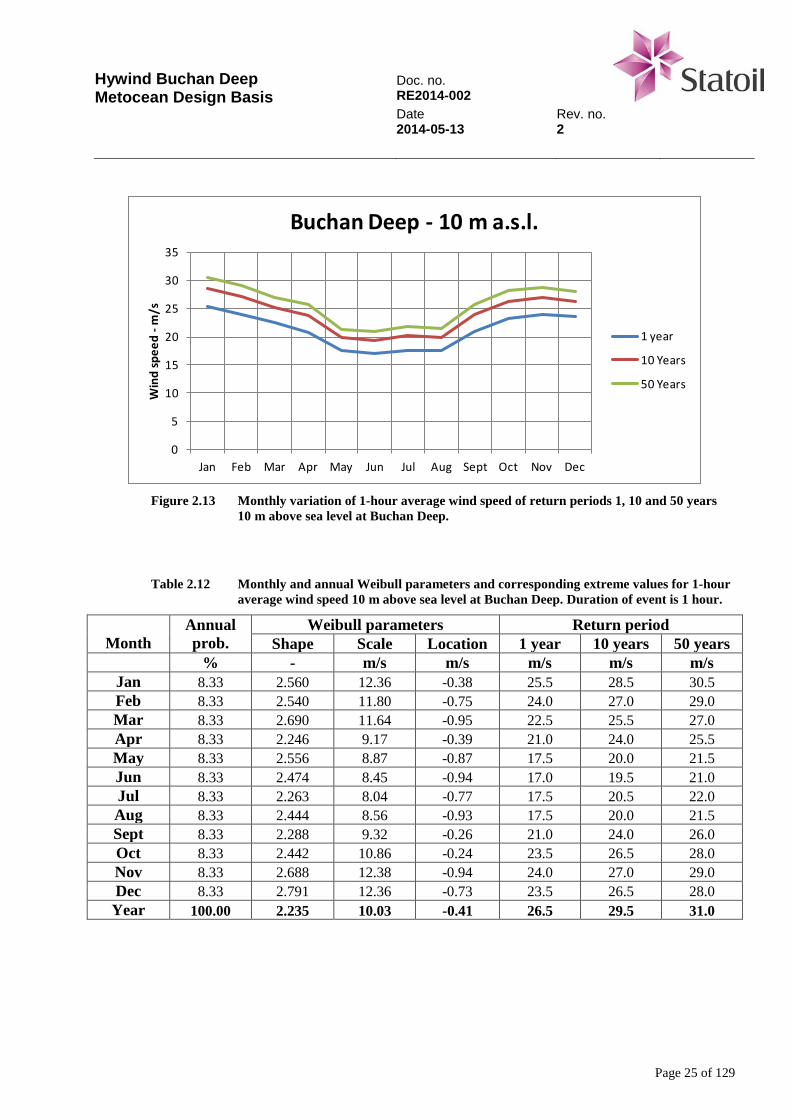
Figure 2.13 Monthly variation of 1-hour average wind speed of return periods 1, 10 and 50 years
10 m above sea level at Buchan Deep.
Table 2.12 Monthly and annual Weibull parameters and corresponding extreme values for 1-hour average wind speed 10 m above sea level at Buchan Deep. Duration of event is 1 hour.
Month
Annual prob.
Weibull parameters Return period Shape Scale Location 1 year 10 years 50 years
% - m/s m/s m/s m/s m/s Jan 8.33 2.560 12.36 -0.38 25.5 28.5 30.5 Feb 8.33 2.540 11.80 -0.75 24.0 27.0 29.0 Mar 8.33 2.690 11.64 -0.95 22.5 25.5 27.0 Apr 8.33 2.246 9.17 -0.39 21.0 24.0 25.5 May 8.33 2.556 8.87 -0.87 17.5 20.0 21.5 Jun 8.33 2.474 8.45 -0.94 17.0 19.5 21.0 Jul 8.33 2.263 8.04 -0.77 17.5 20.5 22.0 Aug 8.33 2.444 8.56 -0.93 17.5 20.0 21.5 Sept 8.33 2.288 9.32 -0.26 21.0 24.0 26.0 Oct 8.33 2.442 10.86 -0.24 23.5 26.5 28.0 Nov 8.33 2.688 12.38 -0.94 24.0 27.0 29.0 Dec 8.33 2.791 12.36 -0.73 23.5 26.5 28.0 Year 100.00 2.235 10.03 -0.41 26.5 29.5 31.0
Hywind Buchan Deep Metocean Design Basis
Doc. no. RE2014-002 Date Rev. no. 2014-05-13 2
Page 26 of 129
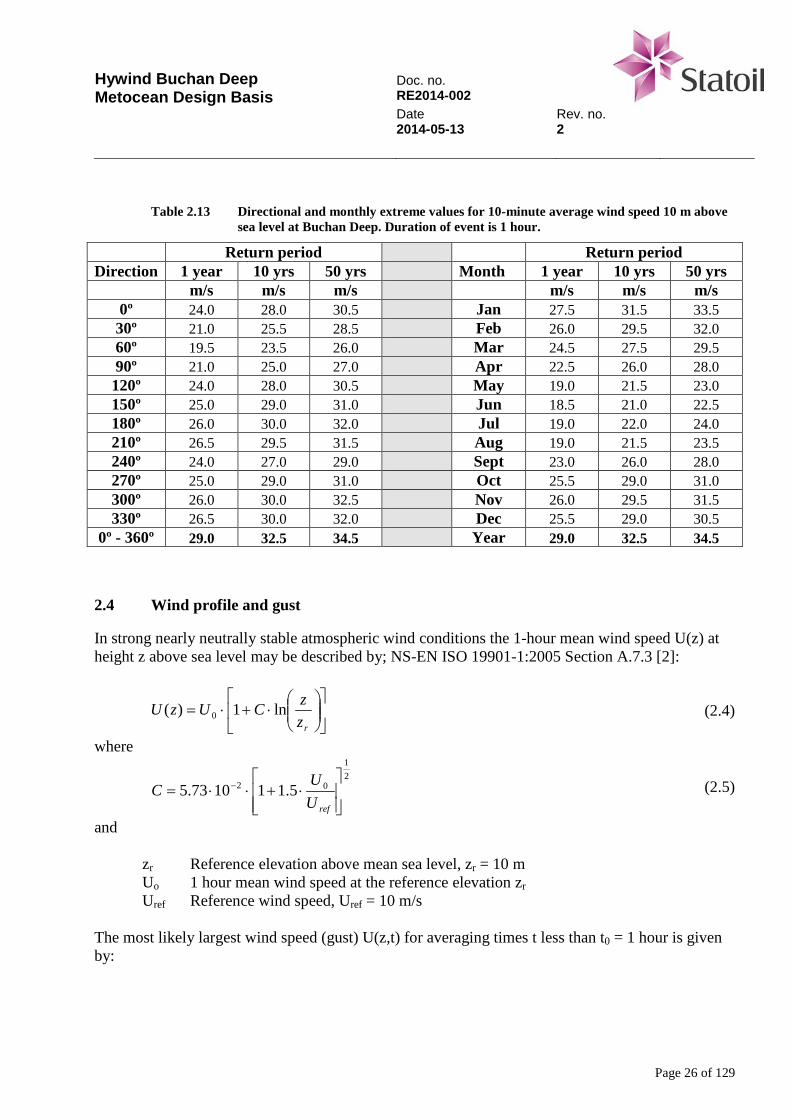
Table 2.13 Directional and monthly extreme values for 10-minute average wind speed 10 m above
sea level at Buchan Deep. Duration of event is 1 hour.
Return period Return period Direction 1 year 10 yrs 50 yrs Month 1 year 10 yrs 50 yrs m/s m/s m/s m/s m/s m/s
0º 24.0 28.0 30.5 Jan 27.5 31.5 33.5 30º 21.0 25.5 28.5 Feb 26.0 29.5 32.0 60º 19.5 23.5 26.0 Mar 24.5 27.5 29.5 90º 21.0 25.0 27.0 Apr 22.5 26.0 28.0 120º 24.0 28.0 30.5 May 19.0 21.5 23.0 150º 25.0 29.0 31.0 Jun 18.5 21.0 22.5 180º 26.0 30.0 32.0 Jul 19.0 22.0 24.0 210º 26.5 29.5 31.5 Aug 19.0 21.5 23.5 240º 24.0 27.0 29.0 Sept 23.0 26.0 28.0 270º 25.0 29.0 31.0 Oct 25.5 29.0 31.0 300º 26.0 30.0 32.5 Nov 26.0 29.5 31.5 330º 26.5 30.0 32.0 Dec 25.5 29.0 30.5
0º - 360º 29.0 32.5 34.5 Year 29.0 32.5 34.5
2.4 Wind profile and gust
In strong nearly neutrally stable atmospheric wind conditions the 1-hour mean wind speed U(z) at height z above sea level may be described by; NS-EN ISO 19901-1:2005 Section A.7.3 [2]:
⋅+⋅=
rzzCUzU ln1)( 0 (2.4)
where
21
02 5.111073.5
⋅+⋅⋅= −
refUU
C (2.5)
and
zr Reference elevation above mean sea level, zr = 10 m Uo 1 hour mean wind speed at the reference elevation zr Uref Reference wind speed, Uref = 10 m/s
The most likely largest wind speed (gust) U(z,t) for averaging times t less than t0 = 1 hour is given by:
Hywind Buchan Deep Metocean Design Basis
Doc. no. RE2014-002 Date Rev. no. 2014-05-13 2
Page 27 of 129
⋅⋅−⋅=
0
ln)(41.01)(),(ttzIzUtzU u (2.6)
where the turbulence intensity Iu(z) is given by:
22.0043.0106.0
−
⋅
⋅+⋅=
rrefu z
zUU
I for smU /0.120 > (2.7)
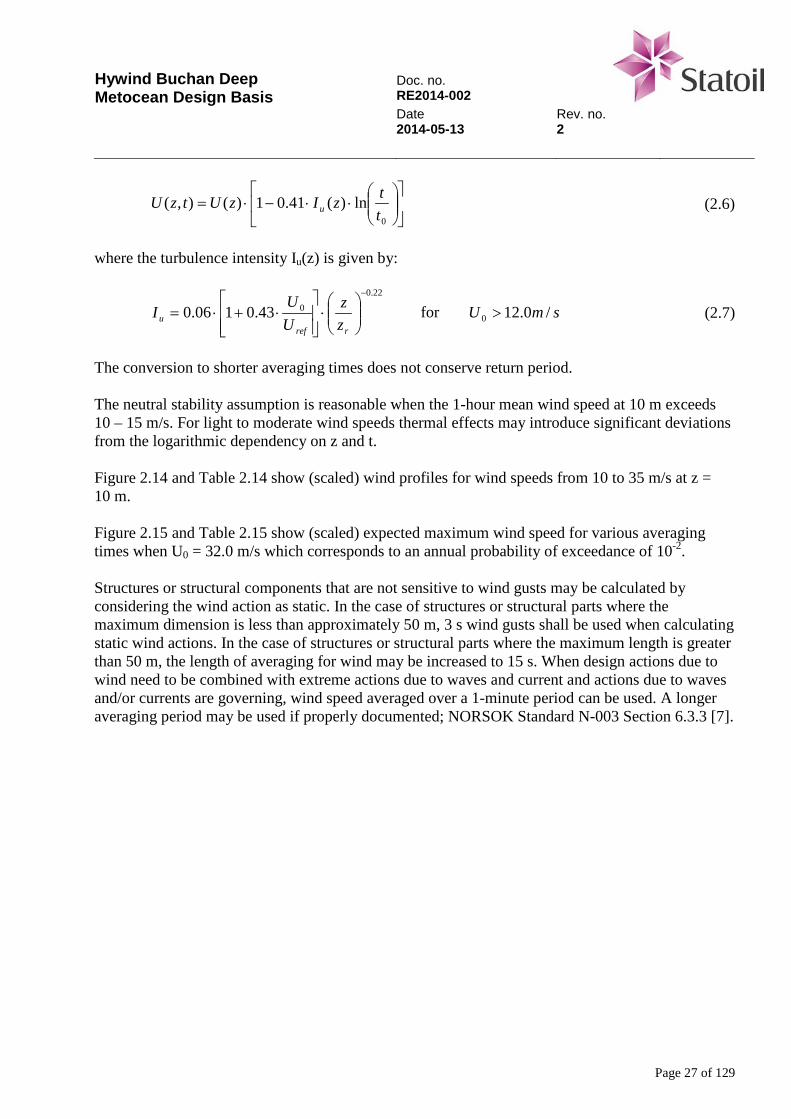
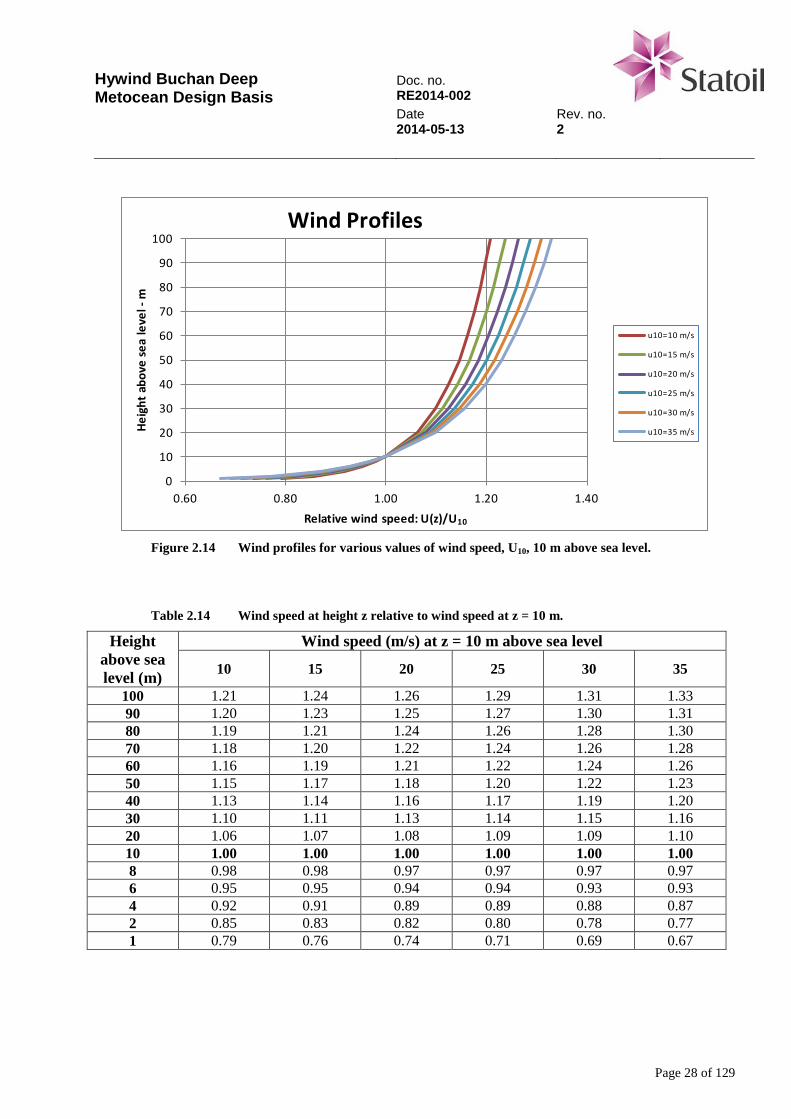
The conversion to shorter averaging times does not conserve return period. The neutral stability assumption is reasonable when the 1-hour mean wind speed at 10 m exceeds 10 – 15 m/s. For light to moderate wind speeds thermal effects may introduce significant deviations from the logarithmic dependency on z and t. Figure 2.14 and Table 2.14 show (scaled) wind profiles for wind speeds from 10 to 35 m/s at z = 10 m. Figure 2.15 and Table 2.15 show (scaled) expected maximum wind speed for various averaging times when U0 = 32.0 m/s which corresponds to an annual probability of exceedance of 10-2. Structures or structural components that are not sensitive to wind gusts may be calculated by considering the wind action as static. In the case of structures or structural parts where the maximum dimension is less than approximately 50 m, 3 s wind gusts shall be used when calculating static wind actions. In the case of structures or structural parts where the maximum length is greater than 50 m, the length of averaging for wind may be increased to 15 s. When design actions due to wind need to be combined with extreme actions due to waves and current and actions due to waves and/or currents are governing, wind speed averaged over a 1-minute period can be used. A longer averaging period may be used if properly documented; NORSOK Standard N-003 Section 6.3.3 [7].
Hywind Buchan Deep Metocean Design Basis
Doc. no. RE2014-002 Date Rev. no. 2014-05-13 2
Page 28 of 129
0
10
20
30
40
50
60
70
80
90
100
0.60 0.80 1.00 1.20 1.40
Heig
ht a
bove
sea
leve
l -m
Relative wind speed: U(z)/U10
Wind Profiles
u10=10 m/s
u10=15 m/s
u10=20 m/s
u10=25 m/s
u10=30 m/s
u10=35 m/s
Figure 2.14 Wind profiles for various values of wind speed, U10, 10 m above sea level.
Table 2.14 Wind speed at height z relative to wind speed at z = 10 m.
Height above sea level (m)
Wind speed (m/s) at z = 10 m above sea level
10 15 20 25 30 35
100 1.21 1.24 1.26 1.29 1.31 1.33 90 1.20 1.23 1.25 1.27 1.30 1.31 80 1.19 1.21 1.24 1.26 1.28 1.30 70 1.18 1.20 1.22 1.24 1.26 1.28 60 1.16 1.19 1.21 1.22 1.24 1.26 50 1.15 1.17 1.18 1.20 1.22 1.23 40 1.13 1.14 1.16 1.17 1.19 1.20 30 1.10 1.11 1.13 1.14 1.15 1.16 20 1.06 1.07 1.08 1.09 1.09 1.10 10 1.00 1.00 1.00 1.00 1.00 1.00 8 0.98 0.98 0.97 0.97 0.97 0.97 6 0.95 0.95 0.94 0.94 0.93 0.93 4 0.92 0.91 0.89 0.89 0.88 0.87 2 0.85 0.83 0.82 0.80 0.78 0.77 1 0.79 0.76 0.74 0.71 0.69 0.67
Hywind Buchan Deep Metocean Design Basis
Doc. no. RE2014-002 Date Rev. no. 2014-05-13 2
Page 29 of 129
0
10
20
30
40
50
60
70
80
90
100
0.80 0.90 1.00 1.10 1.20 1.30 1.40 1.50 1.60 1.70
Heig
ht a
bove
sea
leve
l -m
Relative wind speed: U(z)/U0
Wind profiles
1 hour
10 minutes
1 minute
15 seconds
3 seconds
Figure 2.15 Expected maximum wind speed for averaging time t during 1 hour at height z relative
to wind speed U0 when U0 = 32.0 m/s.
Table 2.15 Expected maximum wind speed for averaging time t during 1 hour at height z relative
to wind speed U0 when U0 = 32.0 m/s.
Height above sea level (m)
Averaging time: t 1 hour 10 minutes 1 minute 15 seconds 3 seconds
100 1.32 1.40 1.51 1.57 1.65 90 1.30 1.39 1.50 1.56 1.64 80 1.29 1.37 1.48 1.55 1.62 70 1.27 1.36 1.47 1.53 1.61 60 1.25 1.34 1.45 1.52 1.60 50 1.22 1.31 1.43 1.50 1.58 40 1.19 1.28 1.40 1.47 1.56 30 1.15 1.25 1.37 1.44 1.53 20 1.10 1.19 1.32 1.40 1.49 10 1.00 1.10 1.24 1.32 1.41 8 0.97 1.08 1.21 1.30 1.39 6 0.93 1.04 1.18 1.26 1.36 4 0.87 0.99 1.13 1.22 1.32 2 0.78 0.89 1.04 1.13 1.24 1 0.68 0.80 0.95 1.04 1.15
Hywind Buchan Deep Metocean Design Basis
Doc. no. RE2014-002 Date Rev. no. 2014-05-13 2
Page 30 of 129
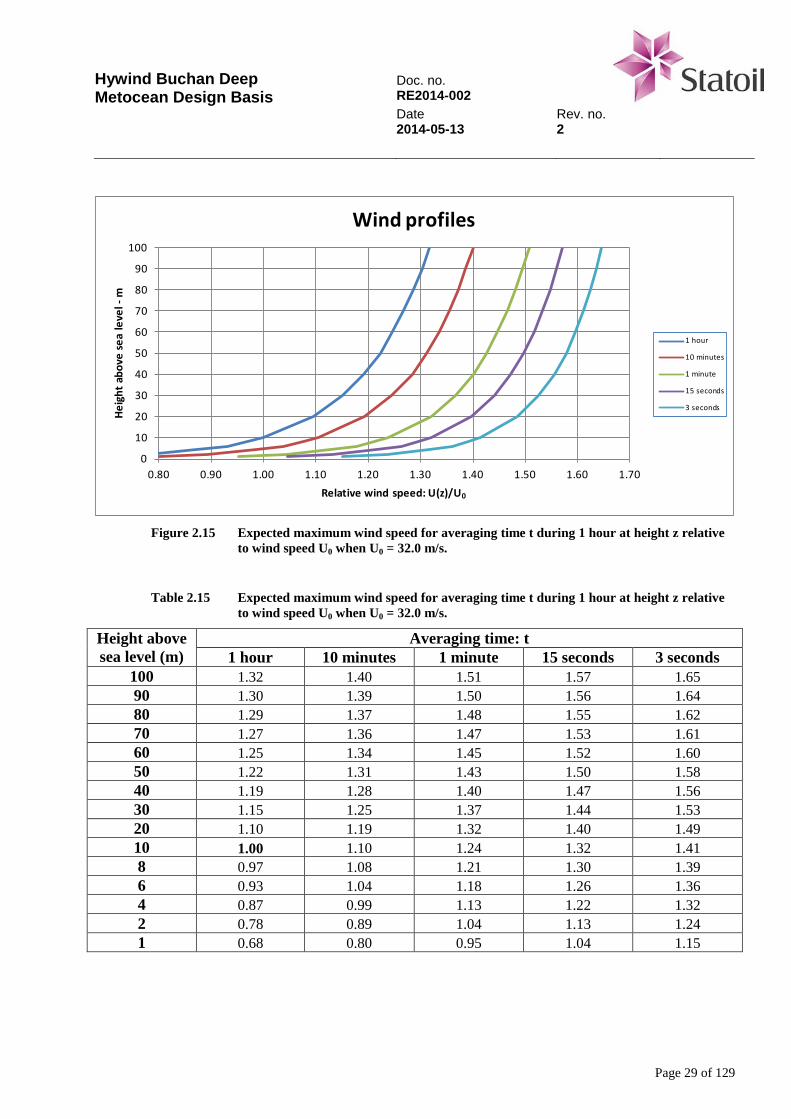
2.5 Turbulence intensity
The turbulence intensity given by Equation (2.7) is found to agree well with observed data for wind speeds U0 greater than about 12 m/s. For lower wind speeds the mean turbulence intensity is computed by:
[ ])(
)(09.0expzU
zUaIU⋅
= for smU /0.120 < (2.8)
where a is determined from:
[ ] )()(09.0exp zUzUIa U ⋅⋅−= for smU /0.120 = (2.9) where U(z) is computed from Equation (2.4) and IU from Equation (2.7) for U0 = 12.0 m/s. Figure 2.16 shows the computed turbulence intensity compared to the turbulence intensity determined from measurements at 100 m above mean sea level at Station FINO 3 in the German Bight.
0
0.05
0.1
0.15
0.2
0.25
0 10 20 30 40 50
Turb
ulen
ce in
tens
ity
Wind speed [m/s]
Turbulence intensity: 100 m a.s.l.
Measured
Computed
Figure 2.16 Computed turbulence intensity compared to turbulence intensity determined from
measurement at 100 m above sea level at FINO 3 (German Bight).
Hywind Buchan Deep Metocean Design Basis
Doc. no. RE2014-002 Date Rev. no. 2014-05-13 2
Page 31 of 129
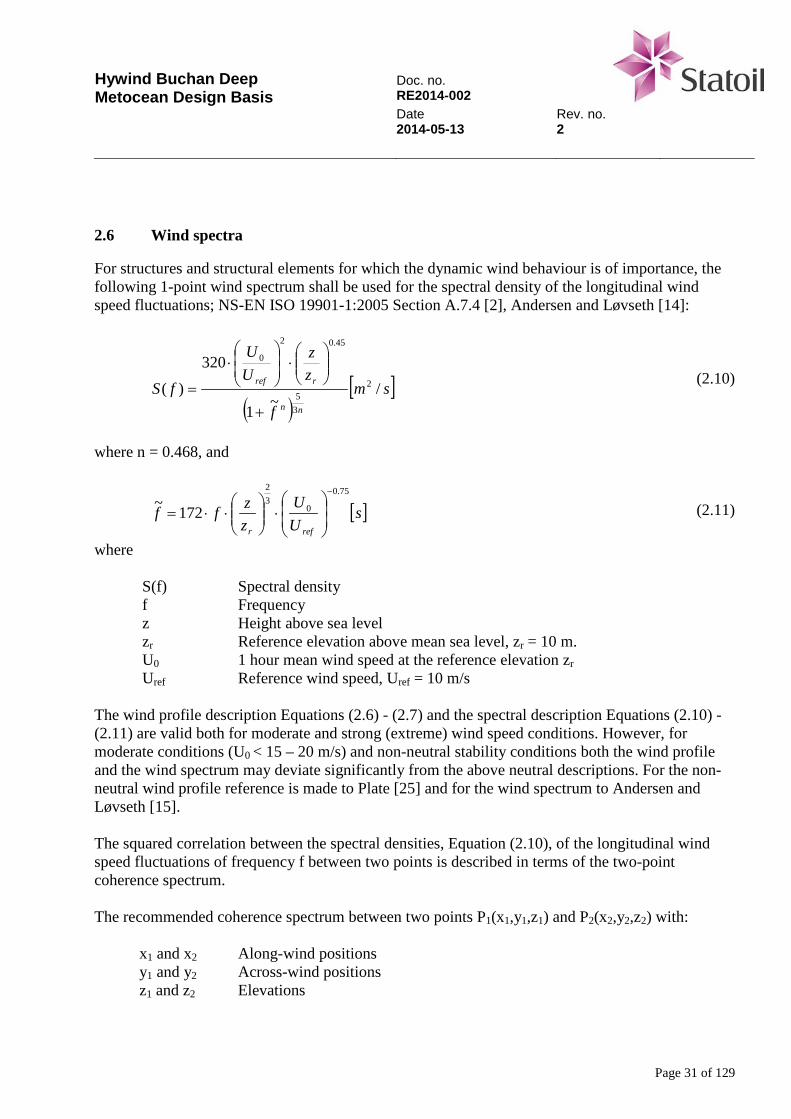
2.6 Wind spectra
For structures and structural elements for which the dynamic wind behaviour is of importance, the following 1-point wind spectrum shall be used for the spectral density of the longitudinal wind speed fluctuations; NS-EN ISO 19901-1:2005 Section A.7.4 [2], Andersen and Løvseth [14]:
( )[ ]sm
f
zz
UU
fSnn
rref /~1
320
)( 2
35
45.02
0
+
⋅
⋅
= (2.10)
where n = 0.468, and
[ ]sUU
zzff
refr
75.0
032
172~−
⋅
⋅⋅= (2.11)
where
S(f) Spectral density f Frequency z Height above sea level zr Reference elevation above mean sea level, zr = 10 m. U0 1 hour mean wind speed at the reference elevation zr Uref Reference wind speed, Uref = 10 m/s
The wind profile description Equations (2.6) - (2.7) and the spectral description Equations (2.10) - (2.11) are valid both for moderate and strong (extreme) wind speed conditions. However, for moderate conditions (U0 < 15 – 20 m/s) and non-neutral stability conditions both the wind profile and the wind spectrum may deviate significantly from the above neutral descriptions. For the non-neutral wind profile reference is made to Plate [25] and for the wind spectrum to Andersen and Løvseth [15]. The squared correlation between the spectral densities, Equation (2.10), of the longitudinal wind speed fluctuations of frequency f between two points is described in terms of the two-point coherence spectrum. The recommended coherence spectrum between two points P1(x1,y1,z1) and P2(x2,y2,z2) with:
x1 and x2 Along-wind positions y1 and y2 Across-wind positions z1 and z2 Elevations
Hywind Buchan Deep Metocean Design Basis
Doc. no. RE2014-002 Date Rev. no. 2014-05-13 2
Page 32 of 129
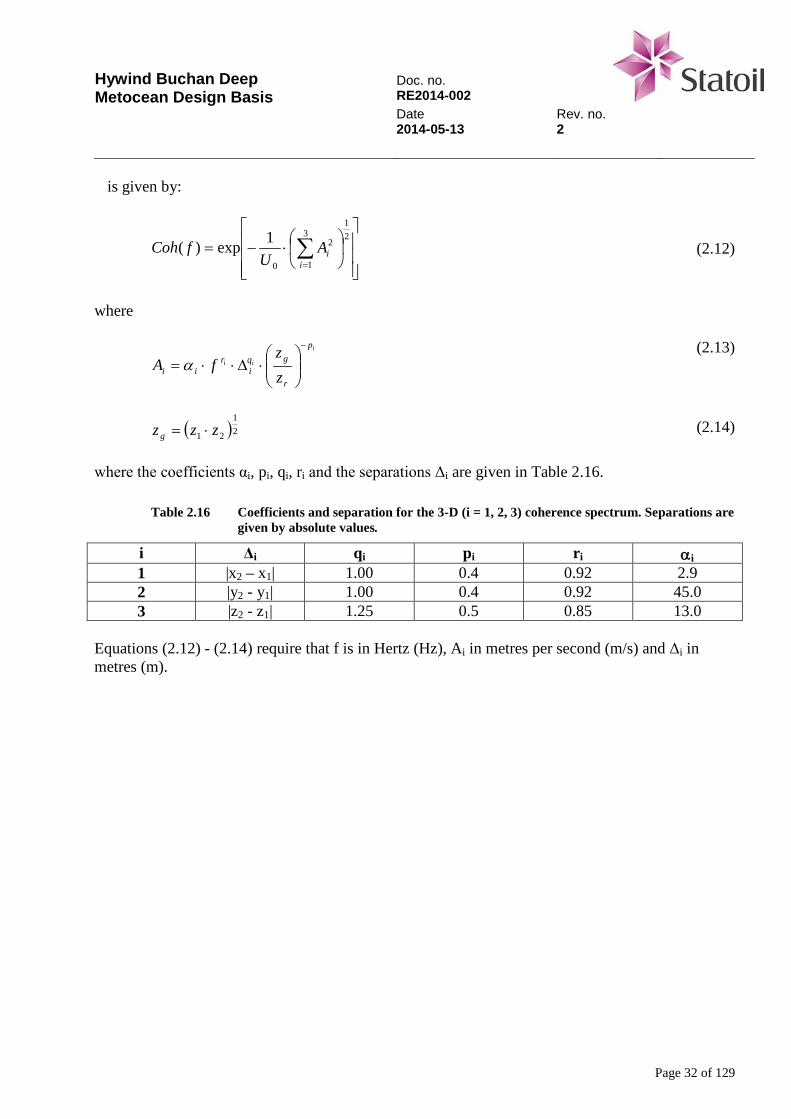
is given by:
⋅−= ∑
=
21
3
1
2
0
1exp)(i
iAU
fCoh (2.12)
where
i
ii
p
r
gqi
rii z
zfA
−
⋅∆⋅⋅= α
(2.13)
( )21
21 zzzg ⋅= (2.14)
where the coefficients αi, pi, qi, ri and the separations Δi are given in Table 2.16.
Table 2.16 Coefficients and separation for the 3-D (i = 1, 2, 3) coherence spectrum. Separations are given by absolute values.
i Δi qi pi ri αi 1 |x2 – x1| 1.00 0.4 0.92 2.9 2 |y2 - y1| 1.00 0.4 0.92 45.0 3 |z2 - z1| 1.25 0.5 0.85 13.0
Equations (2.12) - (2.14) require that f is in Hertz (Hz), Ai in metres per second (m/s) and Δi in metres (m).
Hywind Buchan Deep Metocean Design Basis
Doc. no. RE2014-002 Date Rev. no. 2014-05-13 2
Page 33 of 129
2.7 Operational data – 10 m above sea level
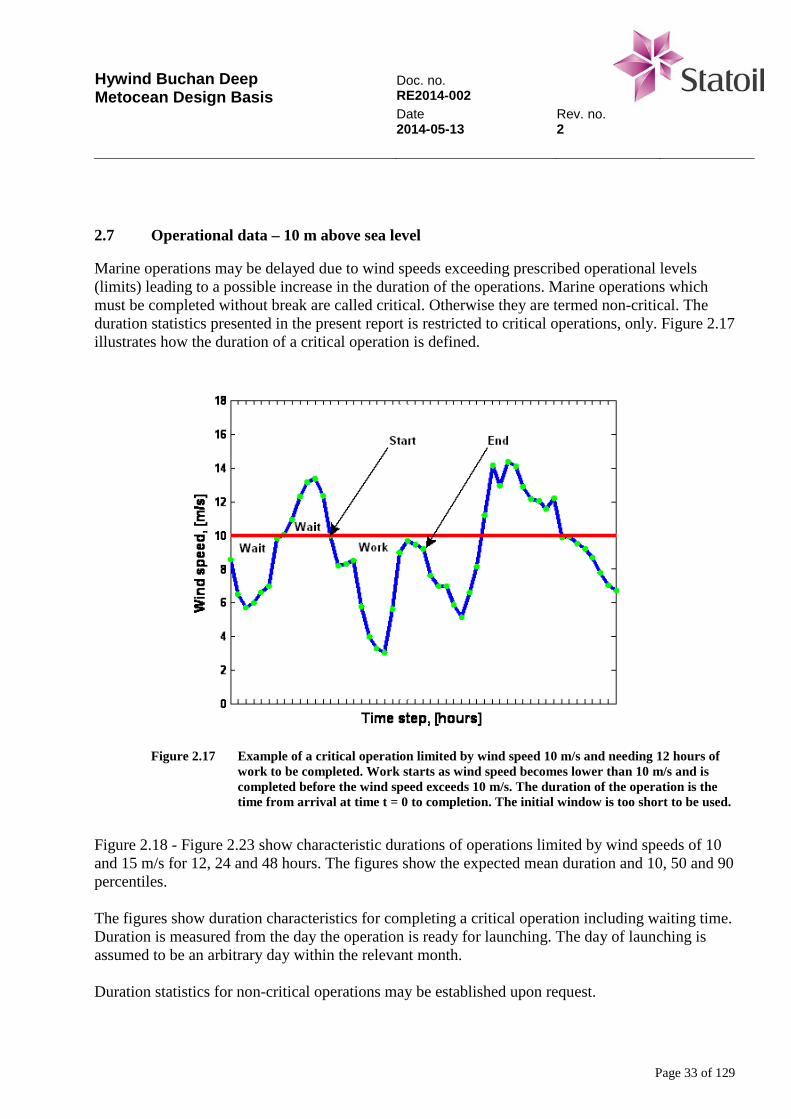
Marine operations may be delayed due to wind speeds exceeding prescribed operational levels (limits) leading to a possible increase in the duration of the operations. Marine operations which must be completed without break are called critical. Otherwise they are termed non-critical. The duration statistics presented in the present report is restricted to critical operations, only. Figure 2.17 illustrates how the duration of a critical operation is defined.
Figure 2.17 Example of a critical operation limited by wind speed 10 m/s and needing 12 hours of
work to be completed. Work starts as wind speed becomes lower than 10 m/s and is completed before the wind speed exceeds 10 m/s. The duration of the operation is the time from arrival at time t = 0 to completion. The initial window is too short to be used.
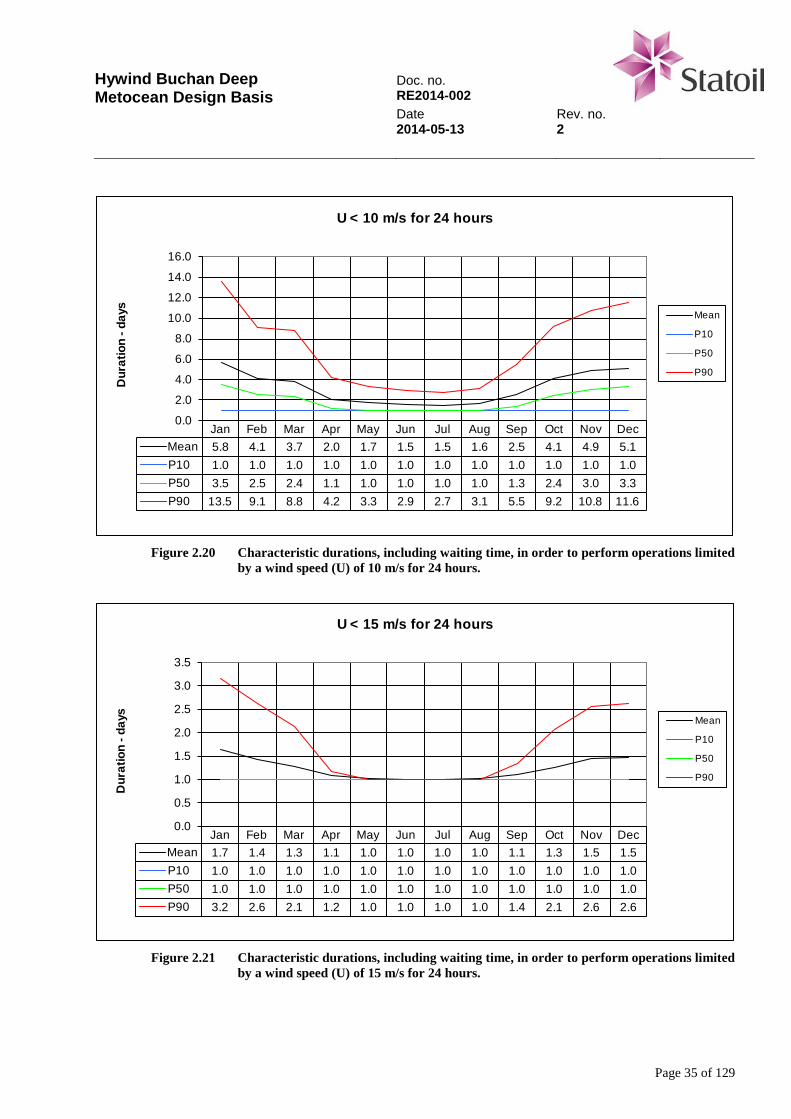
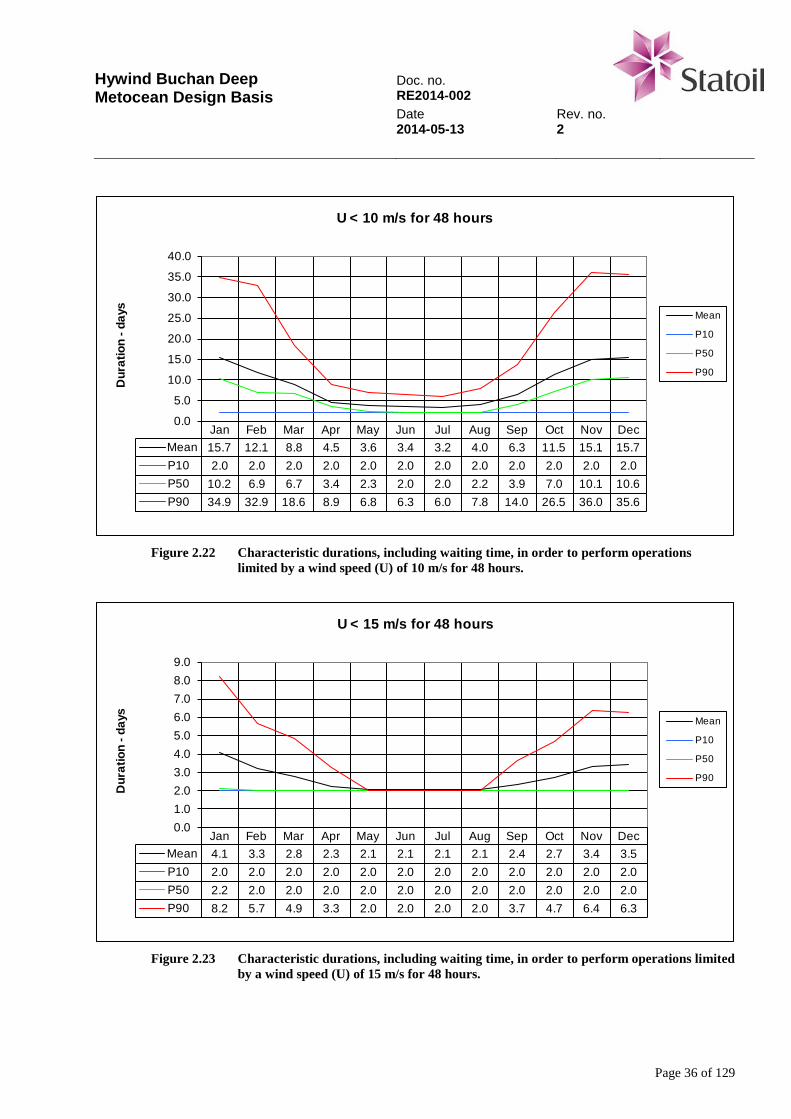
Figure 2.18 - Figure 2.23 show characteristic durations of operations limited by wind speeds of 10 and 15 m/s for 12, 24 and 48 hours. The figures show the expected mean duration and 10, 50 and 90 percentiles. The figures show duration characteristics for completing a critical operation including waiting time. Duration is measured from the day the operation is ready for launching. The day of launching is assumed to be an arbitrary day within the relevant month. Duration statistics for non-critical operations may be established upon request.
Hywind Buchan Deep Metocean Design Basis
Doc. no. RE2014-002 Date Rev. no. 2014-05-13 2
Page 34 of 129
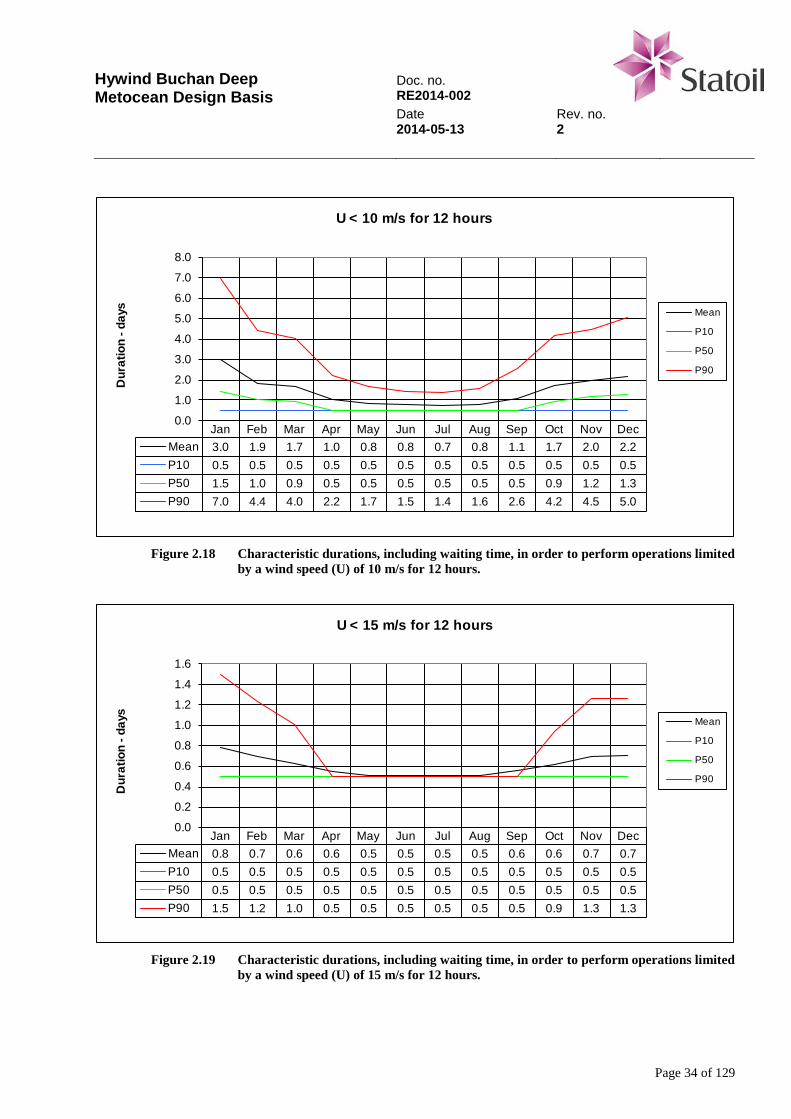
Jan Feb Mar Apr May Jun Jul Aug Sep Oct Nov DecMean 3.0 1.9 1.7 1.0 0.8 0.8 0.7 0.8 1.1 1.7 2.0 2.2P10 0.5 0.5 0.5 0.5 0.5 0.5 0.5 0.5 0.5 0.5 0.5 0.5P50 1.5 1.0 0.9 0.5 0.5 0.5 0.5 0.5 0.5 0.9 1.2 1.3P90 7.0 4.4 4.0 2.2 1.7 1.5 1.4 1.6 2.6 4.2 4.5 5.0
0.0
1.0
2.0
3.0
4.0
5.0
6.0
7.0
8.0
Dur
atio
n -d
ays
U < 10 m/s for 12 hours
Mean
P10
P50
P90
Figure 2.18 Characteristic durations, including waiting time, in order to perform operations limited
by a wind speed (U) of 10 m/s for 12 hours.
Jan Feb Mar Apr May Jun Jul Aug Sep Oct Nov DecMean 0.8 0.7 0.6 0.6 0.5 0.5 0.5 0.5 0.6 0.6 0.7 0.7P10 0.5 0.5 0.5 0.5 0.5 0.5 0.5 0.5 0.5 0.5 0.5 0.5P50 0.5 0.5 0.5 0.5 0.5 0.5 0.5 0.5 0.5 0.5 0.5 0.5P90 1.5 1.2 1.0 0.5 0.5 0.5 0.5 0.5 0.5 0.9 1.3 1.3
0.0
0.2
0.4
0.6
0.8
1.0
1.2
1.4
1.6
Dur
atio
n -d
ays
U < 15 m/s for 12 hours
Mean
P10
P50
P90
Figure 2.19 Characteristic durations, including waiting time, in order to perform operations limited
by a wind speed (U) of 15 m/s for 12 hours.
Hywind Buchan Deep Metocean Design Basis
Doc. no. RE2014-002 Date Rev. no. 2014-05-13 2
Page 35 of 129
Jan Feb Mar Apr May Jun Jul Aug Sep Oct Nov DecMean 5.8 4.1 3.7 2.0 1.7 1.5 1.5 1.6 2.5 4.1 4.9 5.1P10 1.0 1.0 1.0 1.0 1.0 1.0 1.0 1.0 1.0 1.0 1.0 1.0P50 3.5 2.5 2.4 1.1 1.0 1.0 1.0 1.0 1.3 2.4 3.0 3.3P90 13.5 9.1 8.8 4.2 3.3 2.9 2.7 3.1 5.5 9.2 10.8 11.6
0.0
2.0
4.0
6.0
8.0
10.0
12.0
14.0
16.0
Dur
atio
n -d
ays
U < 10 m/s for 24 hours
Mean
P10
P50
P90
Figure 2.20 Characteristic durations, including waiting time, in order to perform operations limited
by a wind speed (U) of 10 m/s for 24 hours.
Jan Feb Mar Apr May Jun Jul Aug Sep Oct Nov DecMean 1.7 1.4 1.3 1.1 1.0 1.0 1.0 1.0 1.1 1.3 1.5 1.5P10 1.0 1.0 1.0 1.0 1.0 1.0 1.0 1.0 1.0 1.0 1.0 1.0P50 1.0 1.0 1.0 1.0 1.0 1.0 1.0 1.0 1.0 1.0 1.0 1.0P90 3.2 2.6 2.1 1.2 1.0 1.0 1.0 1.0 1.4 2.1 2.6 2.6
0.0
0.5
1.0
1.5
2.0
2.5
3.0
3.5
Dur
atio
n -d
ays
U < 15 m/s for 24 hours
Mean
P10
P50
P90
Figure 2.21 Characteristic durations, including waiting time, in order to perform operations limited
by a wind speed (U) of 15 m/s for 24 hours.
Hywind Buchan Deep Metocean Design Basis
Doc. no. RE2014-002 Date Rev. no. 2014-05-13 2
Page 36 of 129
Jan Feb Mar Apr May Jun Jul Aug Sep Oct Nov DecMean 15.7 12.1 8.8 4.5 3.6 3.4 3.2 4.0 6.3 11.5 15.1 15.7P10 2.0 2.0 2.0 2.0 2.0 2.0 2.0 2.0 2.0 2.0 2.0 2.0P50 10.2 6.9 6.7 3.4 2.3 2.0 2.0 2.2 3.9 7.0 10.1 10.6P90 34.9 32.9 18.6 8.9 6.8 6.3 6.0 7.8 14.0 26.5 36.0 35.6
0.0
5.0
10.0
15.0
20.0
25.0
30.0
35.0
40.0
Dur
atio
n -d
ays
U < 10 m/s for 48 hours
Mean
P10
P50
P90
Figure 2.22 Characteristic durations, including waiting time, in order to perform operations
limited by a wind speed (U) of 10 m/s for 48 hours.
Jan Feb Mar Apr May Jun Jul Aug Sep Oct Nov DecMean 4.1 3.3 2.8 2.3 2.1 2.1 2.1 2.1 2.4 2.7 3.4 3.5P10 2.0 2.0 2.0 2.0 2.0 2.0 2.0 2.0 2.0 2.0 2.0 2.0P50 2.2 2.0 2.0 2.0 2.0 2.0 2.0 2.0 2.0 2.0 2.0 2.0P90 8.2 5.7 4.9 3.3 2.0 2.0 2.0 2.0 3.7 4.7 6.4 6.3
0.01.02.03.04.05.06.07.08.09.0
Dur
atio
n -d
ays
U < 15 m/s for 48 hours
Mean
P10
P50
P90
Figure 2.23 Characteristic durations, including waiting time, in order to perform operations limited
by a wind speed (U) of 15 m/s for 48 hours.
Hywind Buchan Deep Metocean Design Basis
Doc. no. RE2014-002 Date Rev. no. 2014-05-13 2
Page 37 of 129
3 Waves
3.1 Wave data
Wave data are available from the Nora10 hindcast model operated by the Norwegian Meteoro-logical Institute [26]. The data are from the grid point at 57.40º N, 01.28º W. The wave data cover the period 1958 – 2010 (53 years). The sample interval is 3 hours. The Nora10 wave height data are found to be of good quality [16]. Nora10 spectral peak periods are represented by discrete frequencies, fi, given by:
11)1.1(042.0 −−⋅= sf ii for 25,...,1=i (3.1)
The spectral peak periods are adjusted (non-discretized) prior to analysis [23]. Adjustment (“non-discretization”) is performed by recalculating the spectral peak frequencies with i’ for i:
xii +−= 5.0' (3.2) in the preceding formula for fi. The number x is drawn randomly from the uniform distribution on the interval [0, 1].
3.2 Wave data analysis
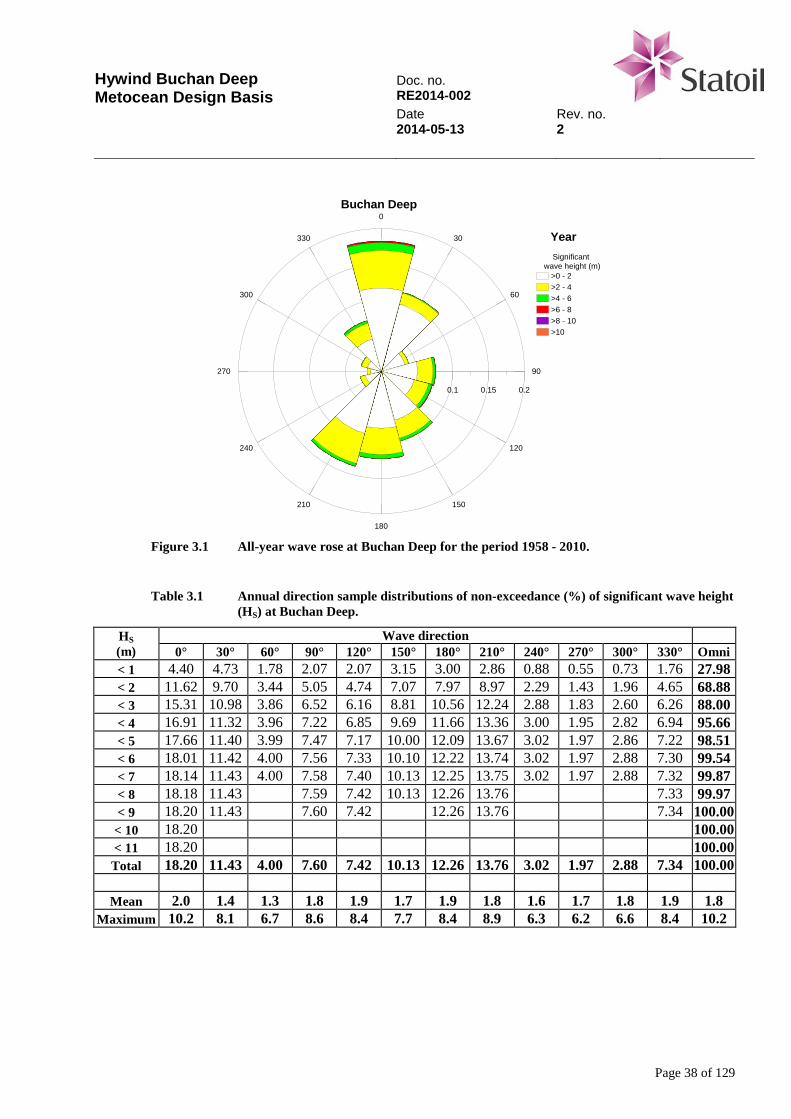
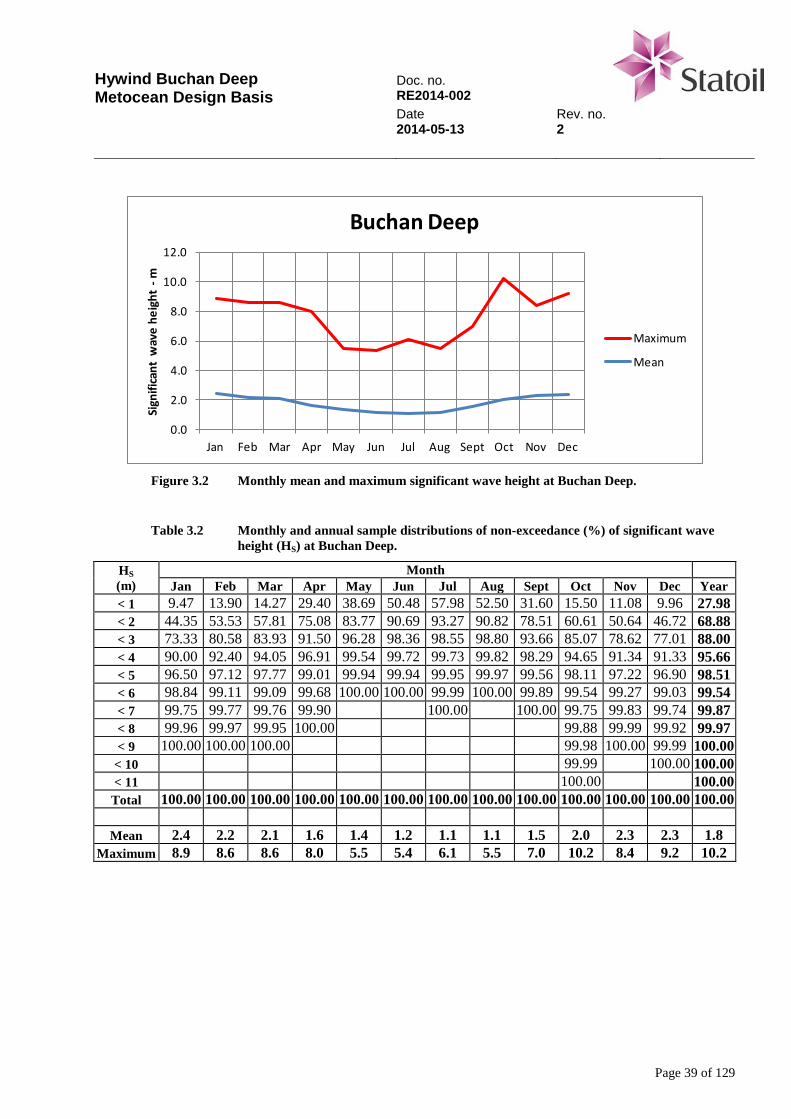
Figure 3.1 show the all-year wave rose, i.e. the sample direction distribution of significant wave height, at Buchan Deep. Table 3.1 shows the annual direction sample distribution of non-exceedance of significant wave height. Figure 3.2 shows monthly mean and maximum significant wave height. Table 3.2 shows the monthly sample distribution of non-exceedance of significant wave height.
Hywind Buchan Deep Metocean Design Basis
Doc. no. RE2014-002 Date Rev. no. 2014-05-13 2
Page 38 of 129
0
30
60
90
120
150
180
210
240
270
300
330
0 0.05 0.1 0.15 0.2
Significant wave height (m)
>0 - 2>2 - 4>4 - 6>6 - 8>8 - 10>10
Buchan Deep
Year
Figure 3.1 All-year wave rose at Buchan Deep for the period 1958 - 2010.
Table 3.1 Annual direction sample distributions of non-exceedance (%) of significant wave height
(HS) at Buchan Deep.
HS (m)
Wave direction 0° 30° 60° 90° 120° 150° 180° 210° 240° 270° 300° 330° Omni
< 1 4.40 4.73 1.78 2.07 2.07 3.15 3.00 2.86 0.88 0.55 0.73 1.76 27.98 < 2 11.62 9.70 3.44 5.05 4.74 7.07 7.97 8.97 2.29 1.43 1.96 4.65 68.88 < 3 15.31 10.98 3.86 6.52 6.16 8.81 10.56 12.24 2.88 1.83 2.60 6.26 88.00 < 4 16.91 11.32 3.96 7.22 6.85 9.69 11.66 13.36 3.00 1.95 2.82 6.94 95.66 < 5 17.66 11.40 3.99 7.47 7.17 10.00 12.09 13.67 3.02 1.97 2.86 7.22 98.51 < 6 18.01 11.42 4.00 7.56 7.33 10.10 12.22 13.74 3.02 1.97 2.88 7.30 99.54 < 7 18.14 11.43 4.00 7.58 7.40 10.13 12.25 13.75 3.02 1.97 2.88 7.32 99.87 < 8 18.18 11.43 7.59 7.42 10.13 12.26 13.76 7.33 99.97 < 9 18.20 11.43 7.60 7.42 12.26 13.76 7.34 100.00
< 10 18.20 100.00 < 11 18.20 100.00 Total 18.20 11.43 4.00 7.60 7.42 10.13 12.26 13.76 3.02 1.97 2.88 7.34 100.00
Mean 2.0 1.4 1.3 1.8 1.9 1.7 1.9 1.8 1.6 1.7 1.8 1.9 1.8
Maximum 10.2 8.1 6.7 8.6 8.4 7.7 8.4 8.9 6.3 6.2 6.6 8.4 10.2
Hywind Buchan Deep Metocean Design Basis
Doc. no. RE2014-002 Date Rev. no. 2014-05-13 2
Page 39 of 129
0.0
2.0
4.0
6.0
8.0
10.0
12.0
Jan Feb Mar Apr May Jun Jul Aug Sept Oct Nov Dec
Sign
ifica
nt w
ave
heig
ht -
m
Buchan Deep
Maximum
Mean
Figure 3.2 Monthly mean and maximum significant wave height at Buchan Deep.
Table 3.2 Monthly and annual sample distributions of non-exceedance (%) of significant wave
height (HS) at Buchan Deep.
HS (m)
Month Jan Feb Mar Apr May Jun Jul Aug Sept Oct Nov Dec Year
< 1 9.47 13.90 14.27 29.40 38.69 50.48 57.98 52.50 31.60 15.50 11.08 9.96 27.98 < 2 44.35 53.53 57.81 75.08 83.77 90.69 93.27 90.82 78.51 60.61 50.64 46.72 68.88 < 3 73.33 80.58 83.93 91.50 96.28 98.36 98.55 98.80 93.66 85.07 78.62 77.01 88.00 < 4 90.00 92.40 94.05 96.91 99.54 99.72 99.73 99.82 98.29 94.65 91.34 91.33 95.66 < 5 96.50 97.12 97.77 99.01 99.94 99.94 99.95 99.97 99.56 98.11 97.22 96.90 98.51 < 6 98.84 99.11 99.09 99.68 100.00 100.00 99.99 100.00 99.89 99.54 99.27 99.03 99.54 < 7 99.75 99.77 99.76 99.90 100.00 100.00 99.75 99.83 99.74 99.87 < 8 99.96 99.97 99.95 100.00 99.88 99.99 99.92 99.97 < 9 100.00 100.00 100.00 99.98 100.00 99.99 100.00
< 10 99.99 100.00 100.00 < 11 100.00 100.00 Total 100.00 100.00 100.00 100.00 100.00 100.00 100.00 100.00 100.00 100.00 100.00 100.00 100.00
Mean 2.4 2.2 2.1 1.6 1.4 1.2 1.1 1.1 1.5 2.0 2.3 2.3 1.8
Maximum 8.9 8.6 8.6 8.0 5.5 5.4 6.1 5.5 7.0 10.2 8.4 9.2 10.2
Hywind Buchan Deep Metocean Design Basis
Doc. no. RE2014-002 Date Rev. no. 2014-05-13 2
Page 40 of 129
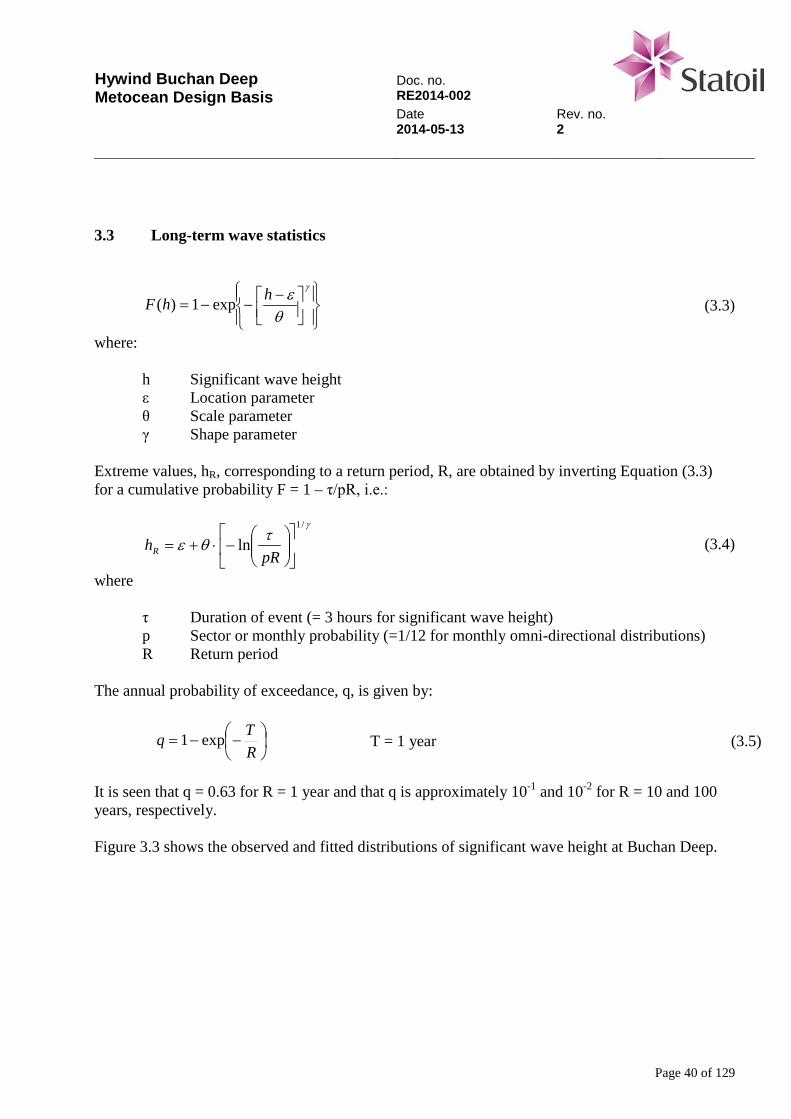
3.3 Long-term wave statistics
−
−−=γ
θεhhF exp1)( (3.3)
where:
h Significant wave height ε Location parameter θ Scale parameter γ Shape parameter
Extreme values, hR, corresponding to a return period, R, are obtained by inverting Equation (3.3) for a cumulative probability F = 1 – τ/pR, i.e.:
γτθε
/1
ln
−⋅+=
pRhR (3.4)
where
τ Duration of event (= 3 hours for significant wave height) p Sector or monthly probability (=1/12 for monthly omni-directional distributions) R Return period
The annual probability of exceedance, q, is given by:
−−=
RTq exp1 T = 1 year (3.5)
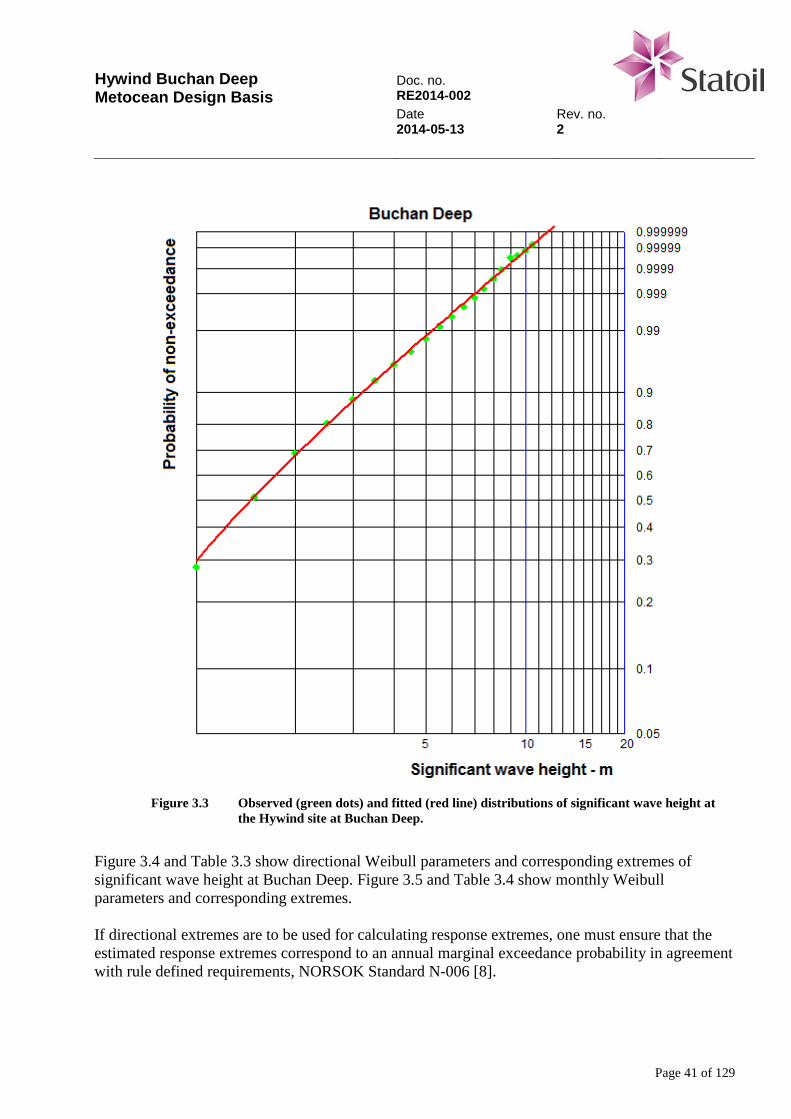
It is seen that q = 0.63 for R = 1 year and that q is approximately 10-1 and 10-2 for R = 10 and 100 years, respectively. Figure 3.3 shows the observed and fitted distributions of significant wave height at Buchan Deep.
Hywind Buchan Deep Metocean Design Basis
Doc. no. RE2014-002 Date Rev. no. 2014-05-13 2
Page 41 of 129
Figure 3.3 Observed (green dots) and fitted (red line) distributions of significant wave height at the Hywind site at Buchan Deep.
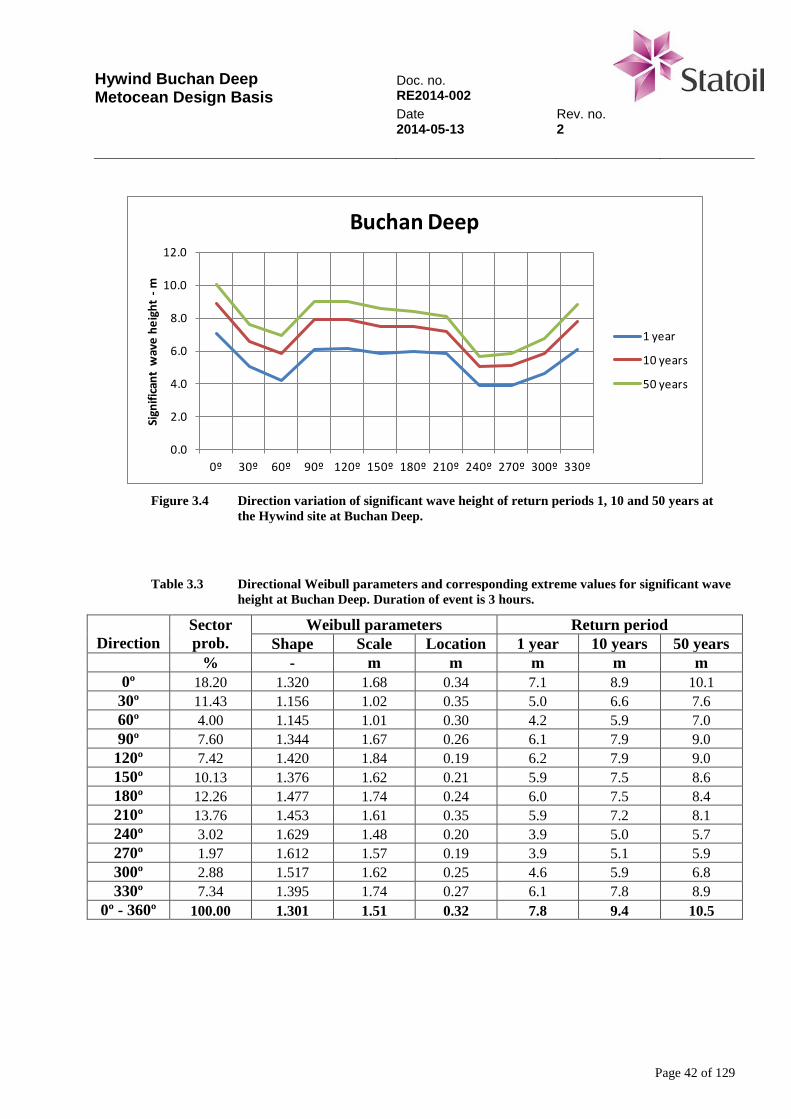
Figure 3.4 and Table 3.3 show directional Weibull parameters and corresponding extremes of significant wave height at Buchan Deep. Figure 3.5 and Table 3.4 show monthly Weibull parameters and corresponding extremes. If directional extremes are to be used for calculating response extremes, one must ensure that the estimated response extremes correspond to an annual marginal exceedance probability in agreement with rule defined requirements, NORSOK Standard N-006 [8].
Hywind Buchan Deep Metocean Design Basis
Doc. no. RE2014-002 Date Rev. no. 2014-05-13 2
Page 42 of 129
0.0
2.0
4.0
6.0
8.0
10.0
12.0
0º 30º 60º 90º 120º 150º 180º 210º 240º 270º 300º 330º
Sign
ifica
nt w
ave
heig
ht -
m
Buchan Deep
1 year
10 years
50 years
Figure 3.4 Direction variation of significant wave height of return periods 1, 10 and 50 years at
the Hywind site at Buchan Deep.
Table 3.3 Directional Weibull parameters and corresponding extreme values for significant wave height at Buchan Deep. Duration of event is 3 hours.
Direction
Sector prob.
Weibull parameters Return period Shape Scale Location 1 year 10 years 50 years
% - m m m m m 0º 18.20 1.320 1.68 0.34 7.1 8.9 10.1 30º 11.43 1.156 1.02 0.35 5.0 6.6 7.6 60º 4.00 1.145 1.01 0.30 4.2 5.9 7.0 90º 7.60 1.344 1.67 0.26 6.1 7.9 9.0 120º 7.42 1.420 1.84 0.19 6.2 7.9 9.0 150º 10.13 1.376 1.62 0.21 5.9 7.5 8.6 180º 12.26 1.477 1.74 0.24 6.0 7.5 8.4 210º 13.76 1.453 1.61 0.35 5.9 7.2 8.1 240º 3.02 1.629 1.48 0.20 3.9 5.0 5.7 270º 1.97 1.612 1.57 0.19 3.9 5.1 5.9 300º 2.88 1.517 1.62 0.25 4.6 5.9 6.8 330º 7.34 1.395 1.74 0.27 6.1 7.8 8.9
0º - 360º 100.00 1.301 1.51 0.32 7.8 9.4 10.5
Hywind Buchan Deep Metocean Design Basis
Doc. no. RE2014-002 Date Rev. no. 2014-05-13 2
Page 43 of 129
0.0
2.0
4.0
6.0
8.0
10.0
12.0
Jan Feb Mar Apr May Jun Jul Aug Sept Oct Nov Dec
Sign
ifica
nt w
ave
heig
ht -
m
Buchan Deep
1 year
10 years
50 years
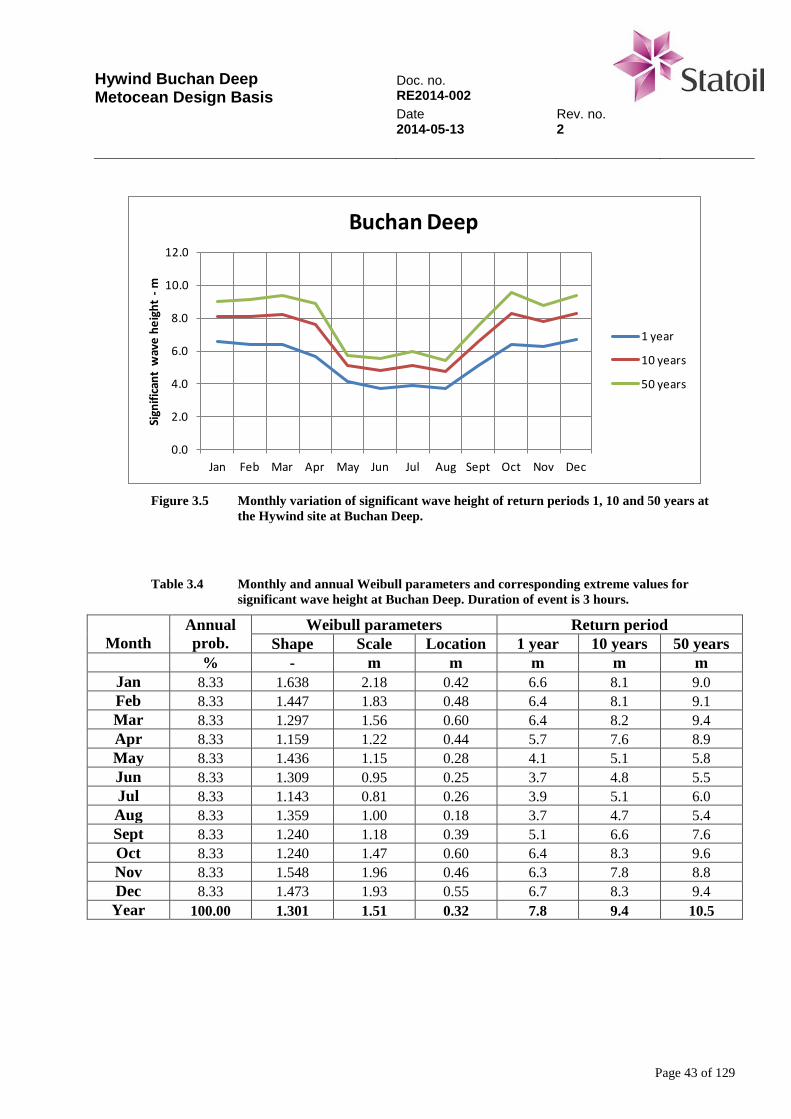
Figure 3.5 Monthly variation of significant wave height of return periods 1, 10 and 50 years at
the Hywind site at Buchan Deep.
Table 3.4 Monthly and annual Weibull parameters and corresponding extreme values for significant wave height at Buchan Deep. Duration of event is 3 hours.
Month
Annual prob.
Weibull parameters Return period Shape Scale Location 1 year 10 years 50 years
% - m m m m m Jan 8.33 1.638 2.18 0.42 6.6 8.1 9.0 Feb 8.33 1.447 1.83 0.48 6.4 8.1 9.1 Mar 8.33 1.297 1.56 0.60 6.4 8.2 9.4 Apr 8.33 1.159 1.22 0.44 5.7 7.6 8.9 May 8.33 1.436 1.15 0.28 4.1 5.1 5.8 Jun 8.33 1.309 0.95 0.25 3.7 4.8 5.5 Jul 8.33 1.143 0.81 0.26 3.9 5.1 6.0 Aug 8.33 1.359 1.00 0.18 3.7 4.7 5.4 Sept 8.33 1.240 1.18 0.39 5.1 6.6 7.6 Oct 8.33 1.240 1.47 0.60 6.4 8.3 9.6 Nov 8.33 1.548 1.96 0.46 6.3 7.8 8.8 Dec 8.33 1.473 1.93 0.55 6.7 8.3 9.4 Year 100.00 1.301 1.51 0.32 7.8 9.4 10.5
Hywind Buchan Deep Metocean Design Basis
Doc. no. RE2014-002 Date Rev. no. 2014-05-13 2
Page 44 of 129
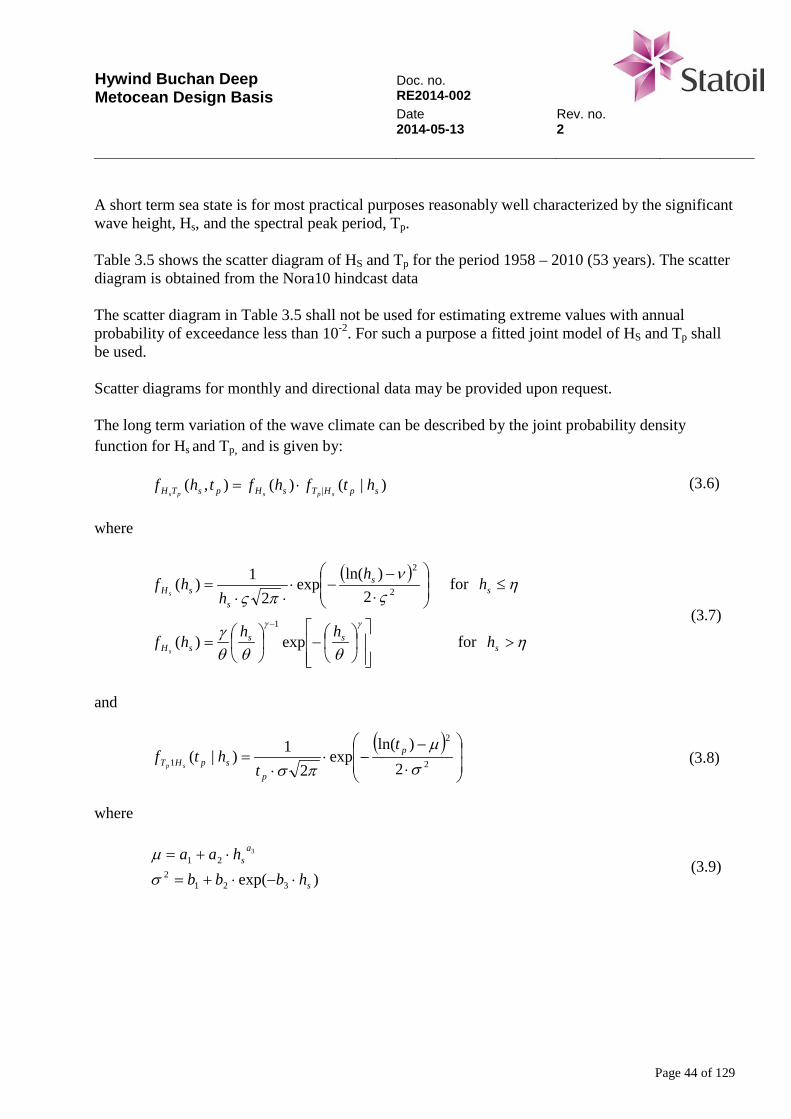
A short term sea state is for most practical purposes reasonably well characterized by the significant wave height, Hs, and the spectral peak period, Tp. Table 3.5 shows the scatter diagram of HS and Tp for the period 1958 – 2010 (53 years). The scatter diagram is obtained from the Nora10 hindcast data The scatter diagram in Table 3.5 shall not be used for estimating extreme values with annual probability of exceedance less than 10-2. For such a purpose a fitted joint model of HS and Tp shall be used. Scatter diagrams for monthly and directional data may be provided upon request. The long term variation of the wave climate can be described by the joint probability density function for Hs and Tp, and is given by:
)|()(),( | spHTsHpsTH htfhfthfspsps
⋅= (3.6)
where
( )
⋅−
−⋅⋅⋅
= 2
2
2)ln(
exp2
1)(ςν
πςs
ssH
hh
hfs
for η≤sh
(3.7)
−
=
− γγ
θθθγ ss
sHhh
hfs
exp)(1
for η>sh
and
( )
⋅
−−⋅
⋅= 2
2
1 2)ln(
exp2
1)|(σ
µ
πσp
pspHT
t
thtf
sp (3.8)
where
321
ashaa ⋅+=µ
(3.9) )exp( 321
2shbbb ⋅−⋅+=σ
Hywind Buchan Deep Metocean Design Basis
Doc. no. RE2014-002 Date Rev. no. 2014-05-13 2
Page 45 of 129
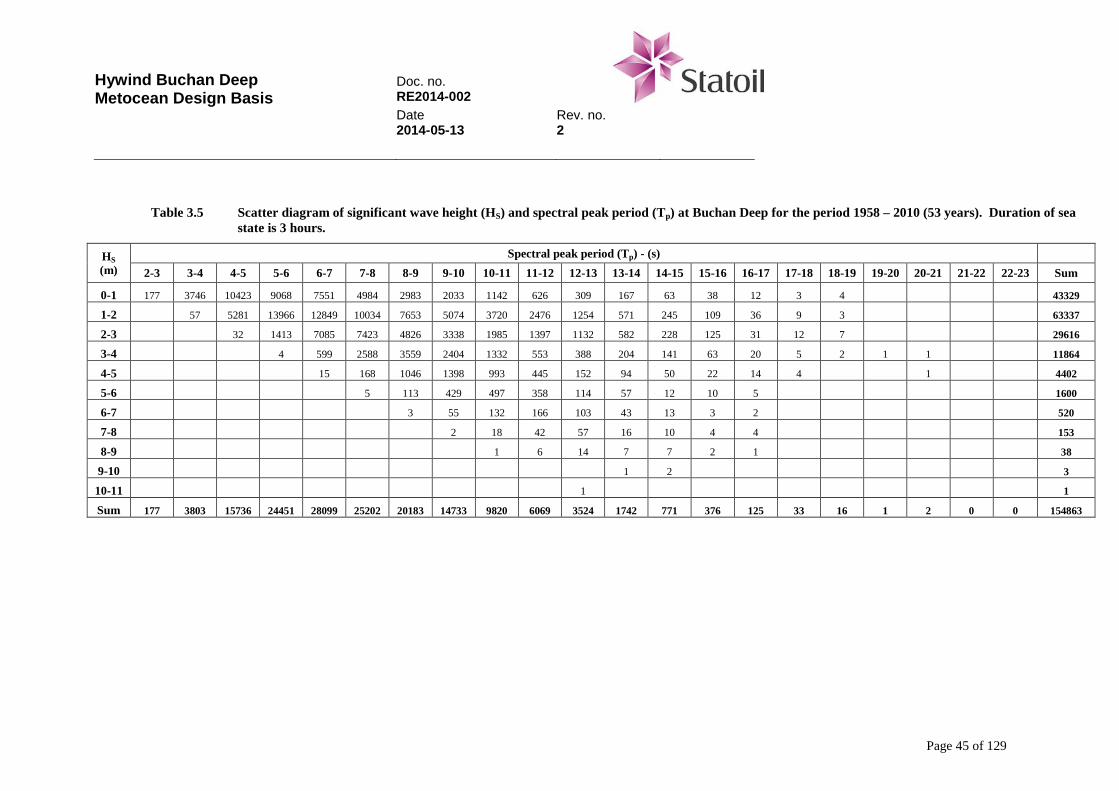
Table 3.5 Scatter diagram of significant wave height (HS) and spectral peak period (Tp) at Buchan Deep for the period 1958 – 2010 (53 years). Duration of sea
state is 3 hours.
HS (m)
Spectral peak period (Tp) - (s)
2-3 3-4 4-5 5-6 6-7 7-8 8-9 9-10 10-11 11-12 12-13 13-14 14-15 15-16 16-17 17-18 18-19 19-20 20-21 21-22 22-23 Sum
0-1 177 3746 10423 9068 7551 4984 2983 2033 1142 626 309 167 63 38 12 3 4 43329
1-2 57 5281 13966 12849 10034 7653 5074 3720 2476 1254 571 245 109 36 9 3 63337
2-3 32 1413 7085 7423 4826 3338 1985 1397 1132 582 228 125 31 12 7 29616
3-4 4 599 2588 3559 2404 1332 553 388 204 141 63 20 5 2 1 1 11864
4-5 15 168 1046 1398 993 445 152 94 50 22 14 4 1 4402
5-6 5 113 429 497 358 114 57 12 10 5 1600
6-7 3 55 132 166 103 43 13 3 2 520
7-8 2 18 42 57 16 10 4 4 153
8-9 1 6 14 7 7 2 1 38
9-10 1 2 3
10-11 1 1
Sum 177 3803 15736 24451 28099 25202 20183 14733 9820 6069 3524 1742 771 376 125 33 16 1 2 0 0 154863
Hywind Buchan Deep Metocean Design Basis
Doc. no. RE2014-002 Date Rev. no. 2014-05-13 2
Page 46 of 129
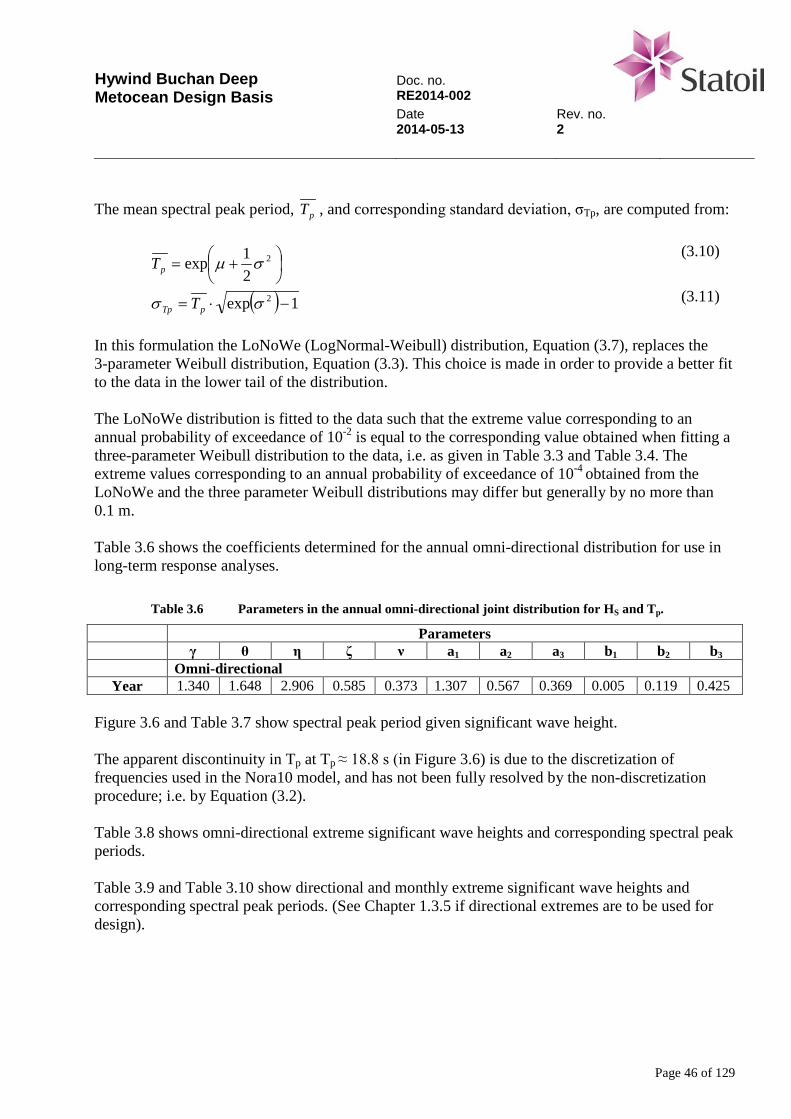
The mean spectral peak period, pT , and corresponding standard deviation, σTp, are computed from:
+= 2
21exp σµpT
(3.10)
( ) 1exp 2 −⋅= σσ pTp T (3.11)
In this formulation the LoNoWe (LogNormal-Weibull) distribution, Equation (3.7), replaces the 3-parameter Weibull distribution, Equation (3.3). This choice is made in order to provide a better fit to the data in the lower tail of the distribution. The LoNoWe distribution is fitted to the data such that the extreme value corresponding to an annual probability of exceedance of 10-2 is equal to the corresponding value obtained when fitting a three-parameter Weibull distribution to the data, i.e. as given in Table 3.3 and Table 3.4. The extreme values corresponding to an annual probability of exceedance of 10-4 obtained from the LoNoWe and the three parameter Weibull distributions may differ but generally by no more than 0.1 m. Table 3.6 shows the coefficients determined for the annual omni-directional distribution for use in long-term response analyses.
Table 3.6 Parameters in the annual omni-directional joint distribution for HS and Tp.
Parameters γ θ η ζ ν a1 a2 a3 b1 b2 b3 Omni-directional
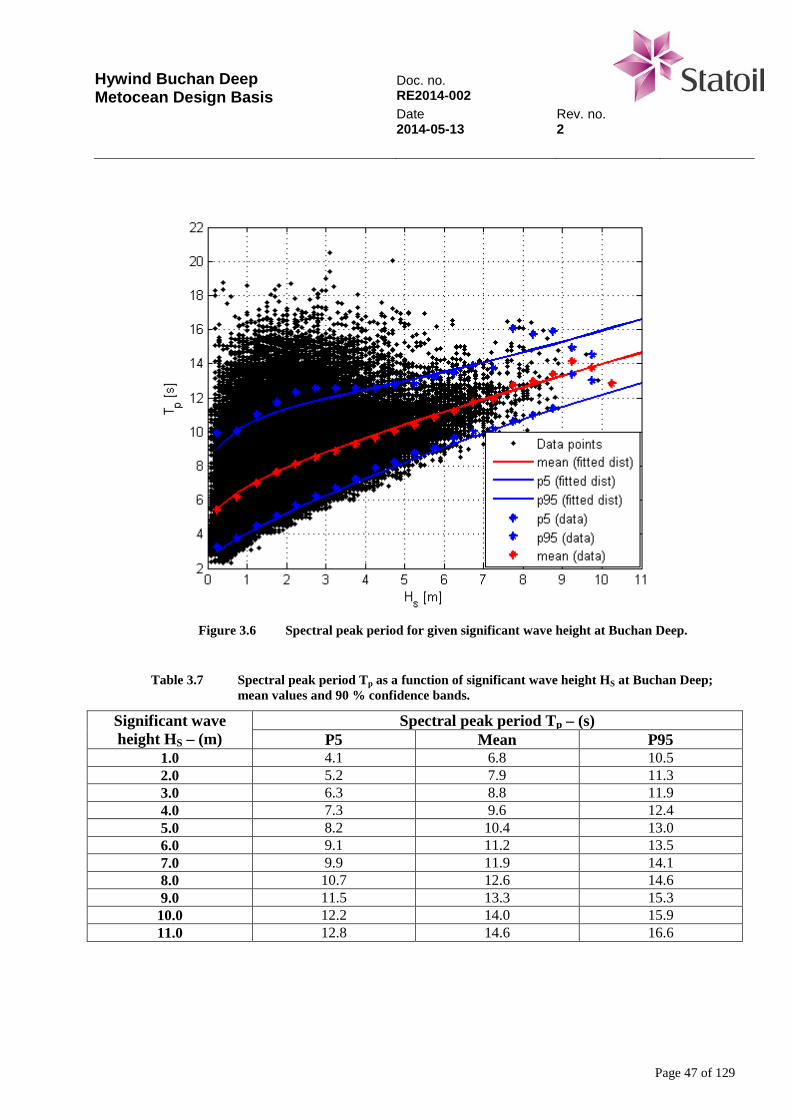
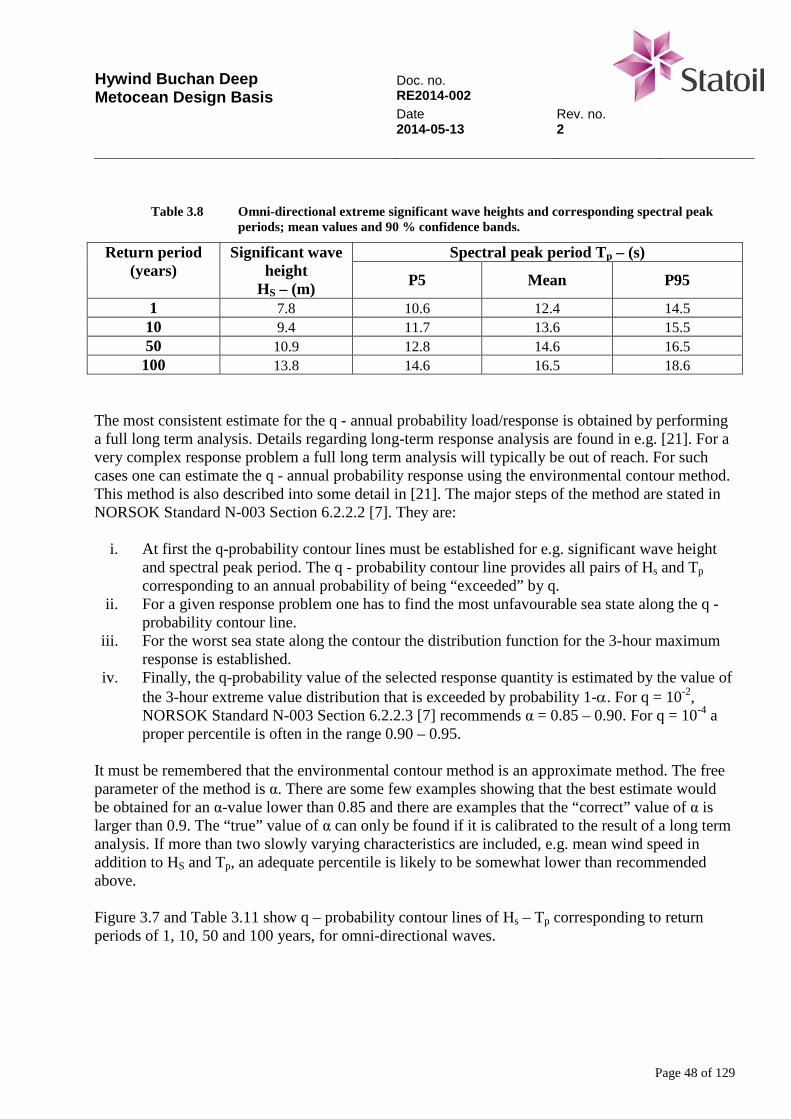
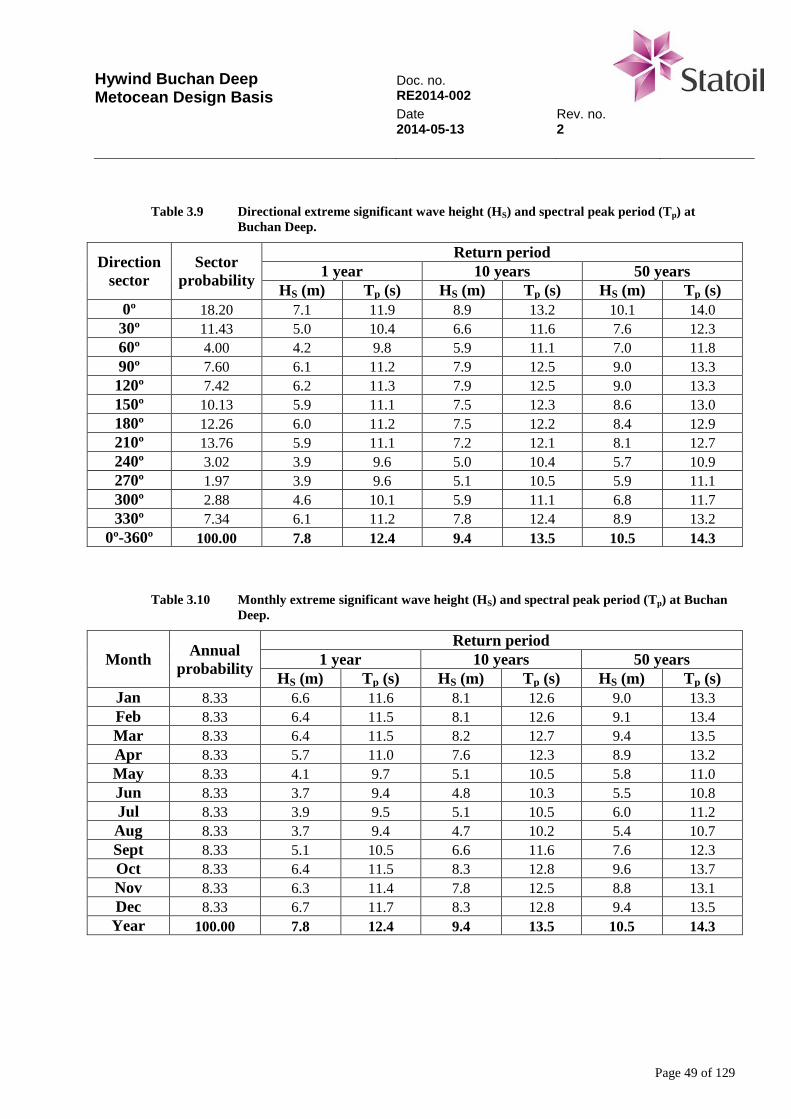
Year 1.340 1.648 2.906 0.585 0.373 1.307 0.567 0.369 0.005 0.119 0.425 Figure 3.6 and Table 3.7 show spectral peak period given significant wave height. The apparent discontinuity in Tp at Tp ≈ 18.8 s (in Figure 3.6) is due to the discretization of frequencies used in the Nora10 model, and has not been fully resolved by the non-discretization procedure; i.e. by Equation (3.2). Table 3.8 shows omni-directional extreme significant wave heights and corresponding spectral peak periods. Table 3.9 and Table 3.10 show directional and monthly extreme significant wave heights and corresponding spectral peak periods. (See Chapter 1.3.5 if directional extremes are to be used for design).
Hywind Buchan Deep Metocean Design Basis
Doc. no. RE2014-002 Date Rev. no. 2014-05-13 2
Page 47 of 129
Figure 3.6 Spectral peak period for given significant wave height at Buchan Deep.
Table 3.7 Spectral peak period Tp as a function of significant wave height HS at Buchan Deep;
mean values and 90 % confidence bands.
Significant wave height HS – (m)
Spectral peak period Tp – (s) P5 Mean P95
1.0 4.1 6.8 10.5 2.0 5.2 7.9 11.3 3.0 6.3 8.8 11.9 4.0 7.3 9.6 12.4 5.0 8.2 10.4 13.0 6.0 9.1 11.2 13.5 7.0 9.9 11.9 14.1 8.0 10.7 12.6 14.6 9.0 11.5 13.3 15.3 10.0 12.2 14.0 15.9 11.0 12.8 14.6 16.6
Hywind Buchan Deep Metocean Design Basis
Doc. no. RE2014-002 Date Rev. no. 2014-05-13 2
Page 48 of 129
Table 3.8 Omni-directional extreme significant wave heights and corresponding spectral peak periods; mean values and 90 % confidence bands.
Return period (years)
Significant wave height
HS – (m)
Spectral peak period Tp – (s)
P5 Mean P95
1 7.8 10.6 12.4 14.5 10 9.4 11.7 13.6 15.5 50 10.9 12.8 14.6 16.5 100 13.8 14.6 16.5 18.6
The most consistent estimate for the q - annual probability load/response is obtained by performing a full long term analysis. Details regarding long-term response analysis are found in e.g. [21]. For a very complex response problem a full long term analysis will typically be out of reach. For such cases one can estimate the q - annual probability response using the environmental contour method. This method is also described into some detail in [21]. The major steps of the method are stated in NORSOK Standard N-003 Section 6.2.2.2 [7]. They are:
i. At first the q-probability contour lines must be established for e.g. significant wave height and spectral peak period. The q - probability contour line provides all pairs of Hs and Tp corresponding to an annual probability of being “exceeded” by q.
ii. For a given response problem one has to find the most unfavourable sea state along the q - probability contour line.
iii. For the worst sea state along the contour the distribution function for the 3-hour maximum response is established.
iv. Finally, the q-probability value of the selected response quantity is estimated by the value of the 3-hour extreme value distribution that is exceeded by probability 1-α. For q = 10-2, NORSOK Standard N-003 Section 6.2.2.3 [7] recommends α = 0.85 – 0.90. For q = 10-4 a proper percentile is often in the range 0.90 – 0.95.
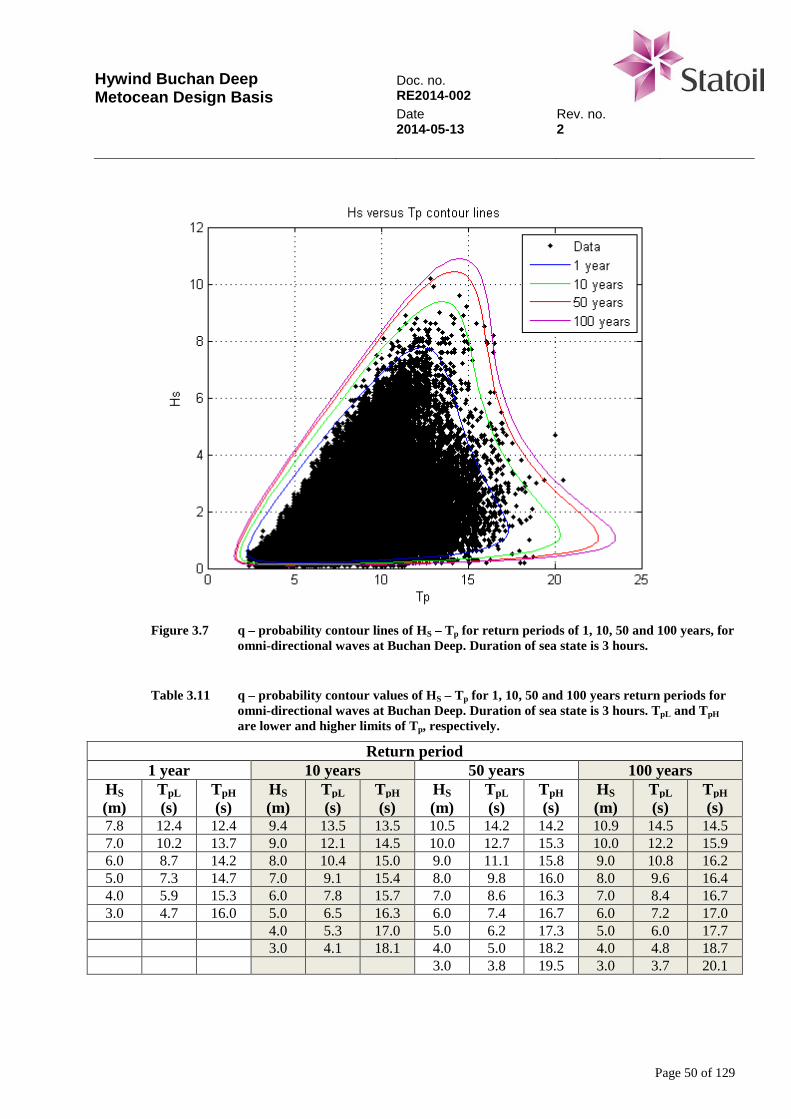
It must be remembered that the environmental contour method is an approximate method. The free parameter of the method is α. There are some few examples showing that the best estimate would be obtained for an α-value lower than 0.85 and there are examples that the “correct” value of α is larger than 0.9. The “true” value of α can only be found if it is calibrated to the result of a long term analysis. If more than two slowly varying characteristics are included, e.g. mean wind speed in addition to HS and Tp, an adequate percentile is likely to be somewhat lower than recommended above. Figure 3.7 and Table 3.11 show q – probability contour lines of Hs – Tp corresponding to return periods of 1, 10, 50 and 100 years, for omni-directional waves.
Hywind Buchan Deep Metocean Design Basis
Doc. no. RE2014-002 Date Rev. no. 2014-05-13 2
Page 49 of 129
Table 3.9 Directional extreme significant wave height (HS) and spectral peak period (Tp) at
Buchan Deep.
Direction sector
Sector probability
Return period 1 year 10 years 50 years
HS (m) Tp (s) HS (m) Tp (s) HS (m) Tp (s) 0º 18.20 7.1 11.9 8.9 13.2 10.1 14.0 30º 11.43 5.0 10.4 6.6 11.6 7.6 12.3 60º 4.00 4.2 9.8 5.9 11.1 7.0 11.8 90º 7.60 6.1 11.2 7.9 12.5 9.0 13.3 120º 7.42 6.2 11.3 7.9 12.5 9.0 13.3 150º 10.13 5.9 11.1 7.5 12.3 8.6 13.0 180º 12.26 6.0 11.2 7.5 12.2 8.4 12.9 210º 13.76 5.9 11.1 7.2 12.1 8.1 12.7 240º 3.02 3.9 9.6 5.0 10.4 5.7 10.9 270º 1.97 3.9 9.6 5.1 10.5 5.9 11.1 300º 2.88 4.6 10.1 5.9 11.1 6.8 11.7 330º 7.34 6.1 11.2 7.8 12.4 8.9 13.2
0º-360º 100.00 7.8 12.4 9.4 13.5 10.5 14.3
Table 3.10 Monthly extreme significant wave height (HS) and spectral peak period (Tp) at Buchan Deep.
Month Annual probability
Return period 1 year 10 years 50 years
HS (m) Tp (s) HS (m) Tp (s) HS (m) Tp (s) Jan 8.33 6.6 11.6 8.1 12.6 9.0 13.3 Feb 8.33 6.4 11.5 8.1 12.6 9.1 13.4 Mar 8.33 6.4 11.5 8.2 12.7 9.4 13.5 Apr 8.33 5.7 11.0 7.6 12.3 8.9 13.2 May 8.33 4.1 9.7 5.1 10.5 5.8 11.0 Jun 8.33 3.7 9.4 4.8 10.3 5.5 10.8 Jul 8.33 3.9 9.5 5.1 10.5 6.0 11.2 Aug 8.33 3.7 9.4 4.7 10.2 5.4 10.7 Sept 8.33 5.1 10.5 6.6 11.6 7.6 12.3 Oct 8.33 6.4 11.5 8.3 12.8 9.6 13.7 Nov 8.33 6.3 11.4 7.8 12.5 8.8 13.1 Dec 8.33 6.7 11.7 8.3 12.8 9.4 13.5 Year 100.00 7.8 12.4 9.4 13.5 10.5 14.3
Hywind Buchan Deep Metocean Design Basis
Doc. no. RE2014-002 Date Rev. no. 2014-05-13 2
Page 50 of 129
Figure 3.7 q – probability contour lines of HS – Tp for return periods of 1, 10, 50 and 100 years, for
omni-directional waves at Buchan Deep. Duration of sea state is 3 hours.
Table 3.11 q – probability contour values of HS – Tp for 1, 10, 50 and 100 years return periods for
omni-directional waves at Buchan Deep. Duration of sea state is 3 hours. TpL and TpH are lower and higher limits of Tp, respectively.
Return period 1 year 10 years 50 years 100 years
HS (m)
TpL (s)
TpH (s)
HS (m)
TpL (s)
TpH (s)
HS (m)
TpL (s)
TpH (s)
HS (m)
TpL (s)
TpH (s)
7.8 12.4 12.4 9.4 13.5 13.5 10.5 14.2 14.2 10.9 14.5 14.5 7.0 10.2 13.7 9.0 12.1 14.5 10.0 12.7 15.3 10.0 12.2 15.9 6.0 8.7 14.2 8.0 10.4 15.0 9.0 11.1 15.8 9.0 10.8 16.2 5.0 7.3 14.7 7.0 9.1 15.4 8.0 9.8 16.0 8.0 9.6 16.4 4.0 5.9 15.3 6.0 7.8 15.7 7.0 8.6 16.3 7.0 8.4 16.7 3.0 4.7 16.0 5.0 6.5 16.3 6.0 7.4 16.7 6.0 7.2 17.0
4.0 5.3 17.0 5.0 6.2 17.3 5.0 6.0 17.7 3.0 4.1 18.1 4.0 5.0 18.2 4.0 4.8 18.7 3.0 3.8 19.5 3.0 3.7 20.1
Hywind Buchan Deep Metocean Design Basis
Doc. no. RE2014-002 Date Rev. no. 2014-05-13 2
Page 51 of 129
3.4 Short-term sea states
3.4.1 Wave spectra
A sea state may be modelled in terms of a directional wave spectrum of the form, NS-EN ISO 19901-1:2005 Section A.8.6.1 [2]:
)()(),( θθ DfSfS = (3.12) where S(f) is the frequency spectrum and D(θ) is the direction distribution defined such that:
∫ =π
θθ2
0
1)( dD (3.13)
The NORSOK Standard N-003 Section 6.2.2.3 [7] advocates use of the Torsethaugen frequency spectrum [28]:
)()()( fSfSfS WindseaSwell += (3.14) where SSwell(f) and SWind sea(f) are modified JONSWAP spectra representing swell and wind seas contributions, respectively. The modification is primarily that the Torsethaugen spectrum decays according to f-4, while the JONSWAP model decays according to f-5. The dividing line (in the HS – Tp plane) between wind seas and swell is the limiting sea defined by:
3/1Sff HaT = sma f
3/16.6 −⋅= (3.15) where Tf is the spectral peak period of the limiting sea. When Tp ≤ Tf wind sea (spectral peak) dominates, whereas swell sea dominates when Tp > Tf. In principle af will be fetch dependent, [28], but for most offshore sites at the UK and Norwegian continental shelfes, af = 6.6 m-1/3s is a good approximation for storm conditions The JONSWAP spectrum may be used to describe pure wind seas. This spectrum can be defined in terms of three parameters: the significant wave height, HS, the spectral peak period, Tp, and the peak enhancement factor, γ:
( )
−−−−
⋅−
−
=
2
5.0exp45
2 )ln(287.0145exp
165)(
σγγ
p
p
fff
pppS f
fffTHfS (3.16)
where fp = 1/Tp is the spectral peak frequency.
Hywind Buchan Deep Metocean Design Basis
Doc. no. RE2014-002 Date Rev. no. 2014-05-13 2
Page 52 of 129
=09.007.0
σ for pff ≤ for pff >
(3.17)
The peak-enhancement factor γ can be computed from [28]:
=
7/6
2
22.42 ,0.1max
p
S
gTHπ
γ (3.18)
where g = 9.81 m/s2 is acceleration due to gravity. A comparison between the Torsethaugen and JONSWAP spectral models is shown in Figure 3.8. The adequacy of using the JONSWAP spectrum for a sea state characterized by Hs and Tp should be assessed in view of the particular application. As a first assumption it is assumed that if the important sea states are located within a ± 2 s band around the boundary given by Equation (3.15), the JONSWAP gives acceptable results. If for a given application, the JONSWAP spectrum within this range gives larger response than the Torsethaugen spectrum, it is recommended that the most unfavourable spectral model is used. In such cases one should carry out a sensitivity study regarding the peak-enhancement factor and ensure that recommendations are robust regarding uncertainties in this parameter. One shall be careful by using the JONSWAP spectrum for the whole HS – Tp scatter diagram. But if the JONSWAP spectrum is used for periods lower than the period band indicated above, a maximum value of γ = 5 should be introduced. For periods higher than those of the suggested JONSWAP band one may apply the γ - value of the upper boundary. An exception to this is if the JONSWAP spectrum is used for representing a pure swell sea. In such a case γ = 10 – 15 is recommended. Swell is (nearly) always present in the open sea. This is only partly reflected in the HS – Tp scatter diagram; see Table 3.5. For example, when the spectral peak period Tp is associated with wind sea it may well be that a swell system with markedly higher spectral peak period is present. Consequently, the information contained in the HS – Tp scatter diagram is not sufficient for the assessment of operability in the case when the presence of swell (with a critical period for the operation) restrict operations. Using the Torsethaugen spectrum the average partition of wind sea and swell is accounted for, but the direction of propagation is taken to be the same. A more accurate assessment of combined sea can be done by using long term time history of wind sea and swell given by the Nora10 data. This will also account for difference in direction of propagation. Based on these data, scatter diagrams for wind sea and for swell sea can be found. Information on swell height and period may be provided on request.
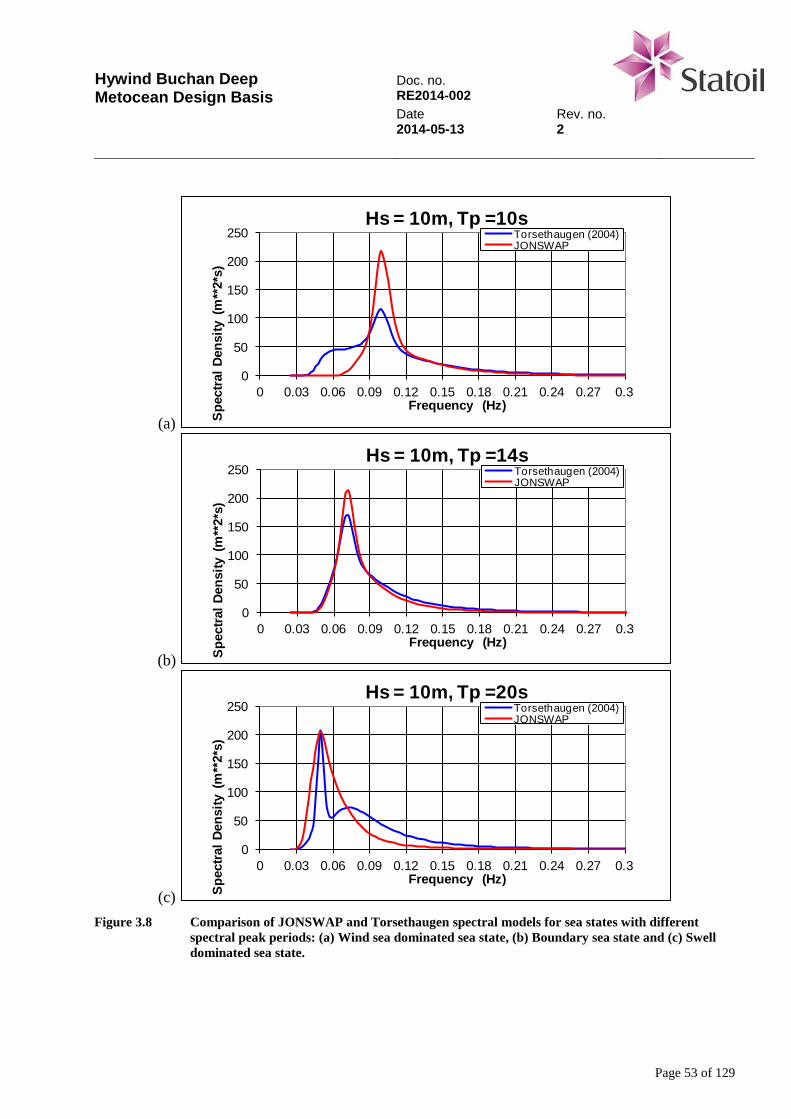
Hywind Buchan Deep Metocean Design Basis
Doc. no. RE2014-002 Date Rev. no. 2014-05-13 2
Page 53 of 129
(a)
0
50
100
150
200
250
0 0.03 0.06 0.09 0.12 0.15 0.18 0.21 0.24 0.27 0.3
Spec
tral D
ensi
ty (
m**
2*s)
Frequency (Hz)
Hs = 10m, Tp =10sTorsethaugen (2004)JONSWAP
(b)
0
50
100
150
200
250
0 0.03 0.06 0.09 0.12 0.15 0.18 0.21 0.24 0.27 0.3
Spec
tral D
ensi
ty (
m**
2*s)
Frequency (Hz)
Hs = 10m, Tp =14sTorsethaugen (2004)JONSWAP
(c)
0
50
100
150
200
250
0 0.03 0.06 0.09 0.12 0.15 0.18 0.21 0.24 0.27 0.3
Spec
tral D
ensi
ty (
m**
2*s)
Frequency (Hz)
Hs = 10m, Tp =20sTorsethaugen (2004)JONSWAP
Figure 3.8 Comparison of JONSWAP and Torsethaugen spectral models for sea states with different
spectral peak periods: (a) Wind sea dominated sea state, (b) Boundary sea state and (c) Swell dominated sea state.
Hywind Buchan Deep Metocean Design Basis
Doc. no. RE2014-002 Date Rev. no. 2014-05-13 2
Page 54 of 129
3.4.2 Directional wave spectra
The direction distribution can be modelled by; NS-EN ISO 19901-1:2005 Section A.8.7.1 [2]:
)(cos)( mn
WKD θθθ −= 22πθθπ
≤−≤− m (3.19)
where Kw is a scaling factor given by:
+Γ⋅
+Γ
=
21
2
12
n
n
KW
π (3.20)
and θm is the mean wave direction. Γ() denotes the Gamma function. The power factor n describes the degree of directional spreading of the waves. For wind seas n should be varied between 2 and 10 if short-crested sea is to be used. Swell seas shall be considered as being long-crested (n → ∞). Equation (3.19) may not be a very accurate model for the spreading at all frequencies, but it is expected to be of sufficient accuracy regarding response predictions. The underlying spreading function is likely to be bi-modal for high frequencies. It is for most cases conservative to use long crested sea for extreme value predictions. Ship rolling for a weather vaning ship will be an exception. For final design of a new installation it is recommended that long crested sea is used when it is a conservative approach. However, if short crested sea shall be used, n should be taken as the most conservative value in the range from 2 to 10 for the wind sea. When utilizing short crested sea, it shall as far as possible be verified that the modelling of short crested sea is representative for the wave events causing the governing design loads on the structure under consideration
3.4.3 Wave-induced bottom currents
How to determine wave-induced oscillatory currents at pipeline level (near sea bed) is described in DNV RP-F105 Sections 3.3.5-6 [4]. For most practical cases linear wave theory can be applied. Wave boundary layer effects can normally be neglected. The velocity spectrum Suu(f) at pipe level is given in term of the wave spectrum S(f):
)()()( 2 fSfGfSuu = (3.21)
Hywind Buchan Deep Metocean Design Basis
Doc. no. RE2014-002 Date Rev. no. 2014-05-13 2
Page 55 of 129
The transfer function G(f) is given by:
)sinh())(cosh(2)(
kheDkffG +
⋅= π (3.22)
where:
k Wave number D Outer pipeline diameter (including coating) e Gap between pipeline and sea bed h Water depth (to sea bottom)
Spectral moments Mn of order n are computed from:
∫∞
=0
)( dffSfM uun
n (3.23)
From the spectral moments the following parameters are computed: Significant horizontal flow velocity (orbital velocity amplitude) at pipe level:
02 MU S = (3.24)
and mean zero up-crossing period of oscillating flow at pipe level:
2
0
MM
Tu = (3.25)
The effect of wave directionality and wave spreading may be introduced in the form of a reduction factor RD on the significant flow velocity; DNV RP-F105 Section 3.4.3 [4]:
SDW URU = (3.26) The reduction factor RD depends on the wave direction relative to the pipeline normal and the directional spreading given in terms of the n-power in the directional wave spectrum, see Equation (3.19).
Hywind Buchan Deep Metocean Design Basis
Doc. no. RE2014-002 Date Rev. no. 2014-05-13 2
Page 56 of 129
3.5 Individual waves
3.5.1 Wave heights
The short term distribution of individual wave heights is modelled using the two parameter Weibull distribution, NS-EN ISO 19901-1:2005 Section A.8.5 [2], Forristall [18].
−−=
126.2
263.2exp1)(S
H hhhF (3.27)
where H and h are wave heights and hS is significant wave height. The long term distribution of individual wave heights is given by:
∫ ∫∞ ∞
+
+=
0 0|0
0
),(),|(),(1)( pspsTHpsTHHpsH dtdhthfthhFthhFpsps
νν
(3.28)
where ),(0 ps th+ν is the expected zero-up-crossing wave frequency for a given sea state and +
0ν is the long term average zero-up-crossing wave frequency given by:
∫ ∫∞ ∞
++ =0 0
00 ),(),( pspsTHps dtdhthfthps
νν (3.29)
Values corresponding to an annual exceedance probability of q are estimated by:
hqH n
qhF =− )(1 (3.30)
where nh ( 7105.0 ⋅≈ ) is the expected number of waves per year. Table 3.12 shows the computed design wave heights. The wave periods in Table 3.12 are the peak periods from the q-probability sea states given in Table 3.8 multiplied by 0.90. Design wave heights versus direction sectors are given in Table 3.13. These wave heights are determined from the significant wave heights given in Table 3.9 by assuming that Hmax/HS for each sector is equal to Hmax/HS for omni-directional seas and reflect the same relative severity as shown by that table. The wave periods, THmax, are computed from THmax = 0.90 Tp, were Tp is as given in
Hywind Buchan Deep Metocean Design Basis
Doc. no. RE2014-002 Date Rev. no. 2014-05-13 2
Page 57 of 129
Table 3.9 [20]. When using design wave method for predicting estimates for characteristic responses for design, the most unfavorable period within the 90% band shall be adopted. When using the design wave heights of Table 3.13 for obtaining characteristic response for design for the various directions, it must be verified that the finally selected design response corresponds to an annual exceedance probability being in agreement with governing rules and regulations, see Chapter 1.3.5. The design waves can serve as input to a simplified fatigue calculation. It is important to keep in mind that the heights should be associated with a Stokes 5th order profile, or a sinusoidal profile if that is expected to give results of sufficient accuracy. The latter assumption is a common approach for design of floaters, but the height and period combination used should be calibrated against long-term response analysis. In connection with verifying return period for drag dominated platform cases where Stokes 5th order design wave profile is used, it should be kept in mind that the Stokes 5th order profile defined by the q-probability wave height is likely to underestimate the q-probability quasi-static response since the crest height of this Stokes 5th order profile is less than the q-probability crest height, see Table 3.12. It is not obvious that selecting a more unfavorable wave period than the mean wave period will compensate sufficiently for this. Table 3.14 shows the expected scatter diagram of wave height and wave period for a period of 50 years. The short term distribution of wave heights is modelled by a Rayleigh distribution and the conditional short term distribution of wave periods by a normal distribution. This scatter diagram can be used for a simplified fatigue analysis if the variability of wave period is of importance regarding fatigue accumulation. This is under the condition that a simplified fatigue analysis is sufficiently accurate.
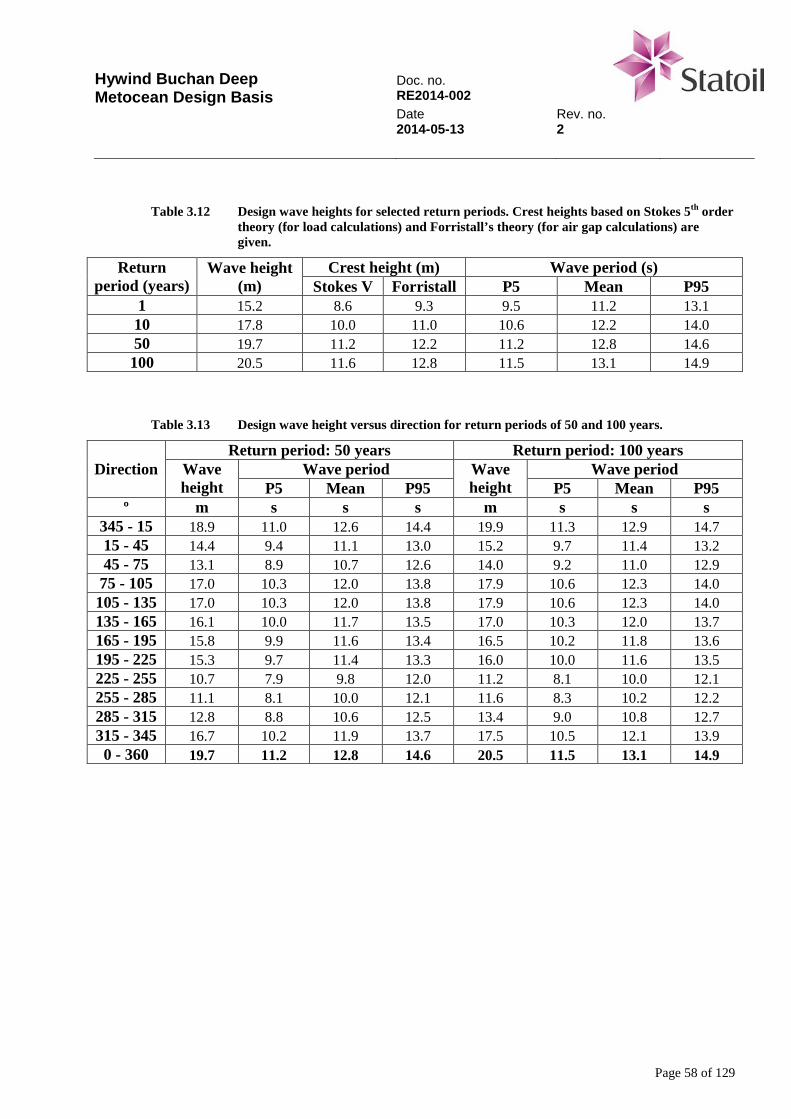
Hywind Buchan Deep Metocean Design Basis
Doc. no. RE2014-002 Date Rev. no. 2014-05-13 2
Page 58 of 129
Table 3.12 Design wave heights for selected return periods. Crest heights based on Stokes 5th order
theory (for load calculations) and Forristall’s theory (for air gap calculations) are given.
Return period (years)
Wave height (m)
Crest height (m) Wave period (s) Stokes V Forristall P5 Mean P95
1 15.2 8.6 9.3 9.5 11.2 13.1 10 17.8 10.0 11.0 10.6 12.2 14.0 50 19.7 11.2 12.2 11.2 12.8 14.6 100 20.5 11.6 12.8 11.5 13.1 14.9
Table 3.13 Design wave height versus direction for return periods of 50 and 100 years.
Direction Return period: 50 years Return period: 100 years
Wave height
Wave period Wave height
Wave period P5 Mean P95 P5 Mean P95
º m s s s m s s s 345 - 15 18.9 11.0 12.6 14.4 19.9 11.3 12.9 14.7 15 - 45 14.4 9.4 11.1 13.0 15.2 9.7 11.4 13.2 45 - 75 13.1 8.9 10.7 12.6 14.0 9.2 11.0 12.9 75 - 105 17.0 10.3 12.0 13.8 17.9 10.6 12.3 14.0 105 - 135 17.0 10.3 12.0 13.8 17.9 10.6 12.3 14.0 135 - 165 16.1 10.0 11.7 13.5 17.0 10.3 12.0 13.7 165 - 195 15.8 9.9 11.6 13.4 16.5 10.2 11.8 13.6 195 - 225 15.3 9.7 11.4 13.3 16.0 10.0 11.6 13.5 225 - 255 10.7 7.9 9.8 12.0 11.2 8.1 10.0 12.1 255 - 285 11.1 8.1 10.0 12.1 11.6 8.3 10.2 12.2 285 - 315 12.8 8.8 10.6 12.5 13.4 9.0 10.8 12.7 315 - 345 16.7 10.2 11.9 13.7 17.5 10.5 12.1 13.9 0 - 360 19.7 11.2 12.8 14.6 20.5 11.5 13.1 14.9
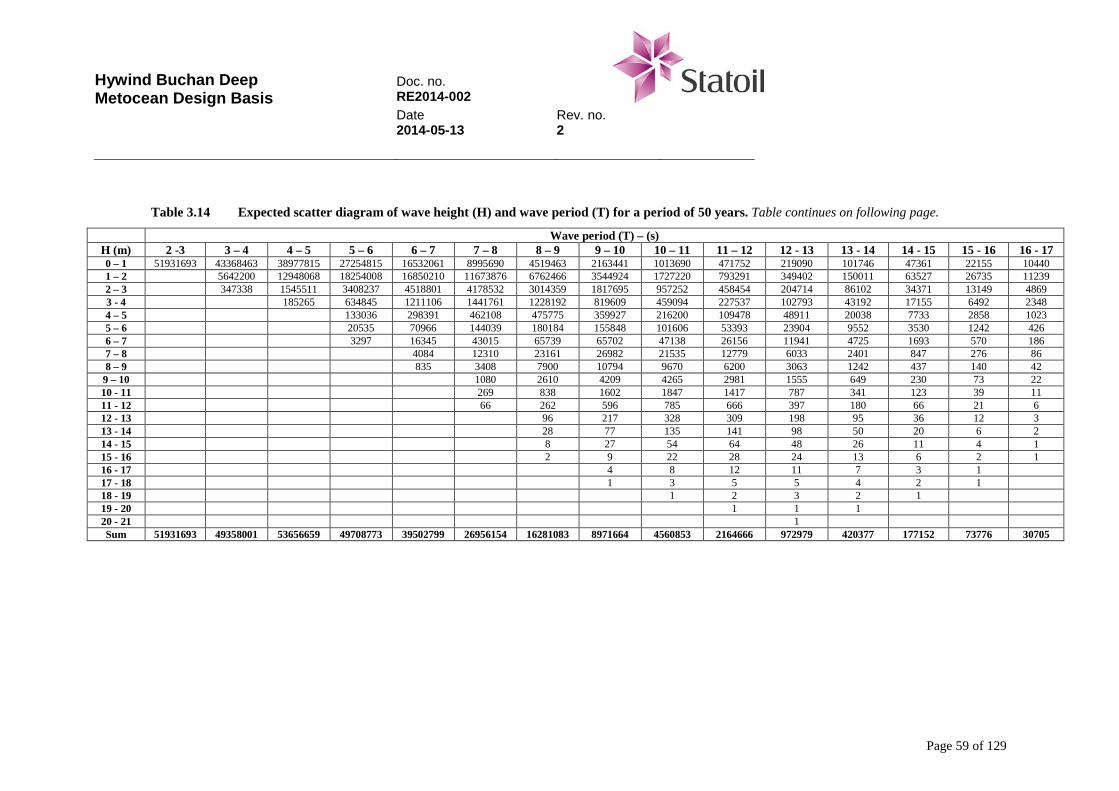
Hywind Buchan Deep Metocean Design Basis
Doc. no. RE2014-002 Date Rev. no. 2014-05-13 2
Page 59 of 129
Table 3.14 Expected scatter diagram of wave height (H) and wave period (T) for a period of 50 years. Table continues on following page.
Wave period (T) – (s) H (m) 2 -3 3 – 4 4 – 5 5 – 6 6 – 7 7 – 8 8 – 9 9 – 10 10 – 11 11 – 12 12 - 13 13 - 14 14 - 15 15 - 16 16 - 17 0 – 1 51931693 43368463 38977815 27254815 16532061 8995690 4519463 2163441 1013690 471752 219090 101746 47361 22155 10440 1 – 2 5642200 12948068 18254008 16850210 11673876 6762466 3544924 1727220 793291 349402 150011 63527 26735 11239 2 – 3 347338 1545511 3408237 4518801 4178532 3014359 1817695 957252 458454 204714 86102 34371 13149 4869 3 - 4 185265 634845 1211106 1441761 1228192 819609 459094 227537 102793 43192 17155 6492 2348 4 – 5 133036 298391 462108 475775 359927 216200 109478 48911 20038 7733 2858 1023 5 – 6 20535 70966 144039 180184 155848 101606 53393 23904 9552 3530 1242 426 6 – 7 3297 16345 43015 65739 65702 47138 26156 11941 4725 1693 570 186 7 – 8 4084 12310 23161 26982 21535 12779 6033 2401 847 276 86 8 – 9 835 3408 7900 10794 9670 6200 3063 1242 437 140 42
9 – 10 1080 2610 4209 4265 2981 1555 649 230 73 22 10 - 11 269 838 1602 1847 1417 787 341 123 39 11 11 - 12 66 262 596 785 666 397 180 66 21 6 12 - 13 96 217 328 309 198 95 36 12 3 13 - 14 28 77 135 141 98 50 20 6 2 14 - 15 8 27 54 64 48 26 11 4 1 15 - 16 2 9 22 28 24 13 6 2 1 16 - 17 4 8 12 11 7 3 1 17 - 18 1 3 5 5 4 2 1 18 - 19 1 2 3 2 1 19 - 20 1 1 1 20 - 21 1 Sum 51931693 49358001 53656659 49708773 39502799 26956154 16281083 8971664 4560853 2164666 972979 420377 177152 73776 30705
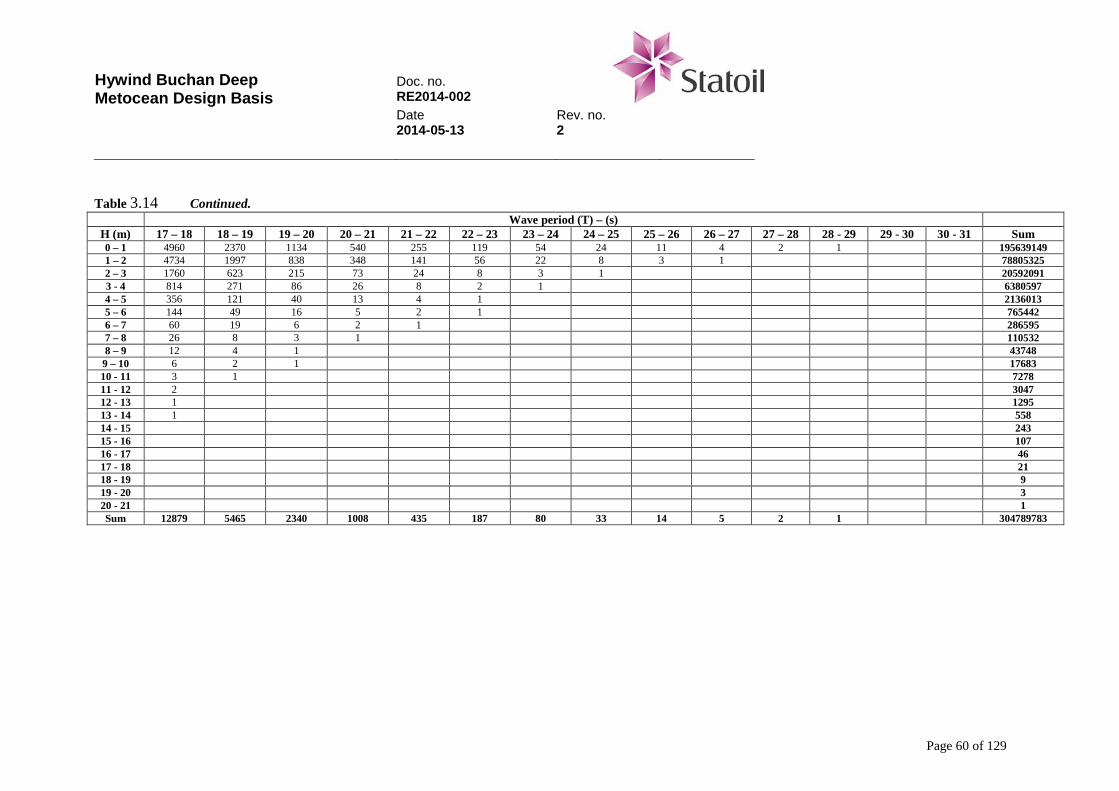
Hywind Buchan Deep Metocean Design Basis
Doc. no. RE2014-002 Date Rev. no. 2014-05-13 2
Page 60 of 129
Table 3.14 Continued.
Wave period (T) – (s) H (m) 17 – 18 18 – 19 19 – 20 20 – 21 21 – 22 22 – 23 23 – 24 24 – 25 25 – 26 26 – 27 27 – 28 28 - 29 29 - 30 30 - 31 Sum 0 – 1 4960 2370 1134 540 255 119 54 24 11 4 2 1 195639149 1 – 2 4734 1997 838 348 141 56 22 8 3 1 78805325 2 – 3 1760 623 215 73 24 8 3 1 20592091 3 - 4 814 271 86 26 8 2 1 6380597 4 – 5 356 121 40 13 4 1 2136013 5 – 6 144 49 16 5 2 1 765442 6 – 7 60 19 6 2 1 286595 7 – 8 26 8 3 1 110532 8 – 9 12 4 1 43748
9 – 10 6 2 1 17683 10 - 11 3 1 7278 11 - 12 2 3047 12 - 13 1 1295 13 - 14 1 558 14 - 15 243 15 - 16 107 16 - 17 46 17 - 18 21 18 - 19 9 19 - 20 3 20 - 21 1 Sum 12879 5465 2340 1008 435 187 80 33 14 5 2 1 304789783
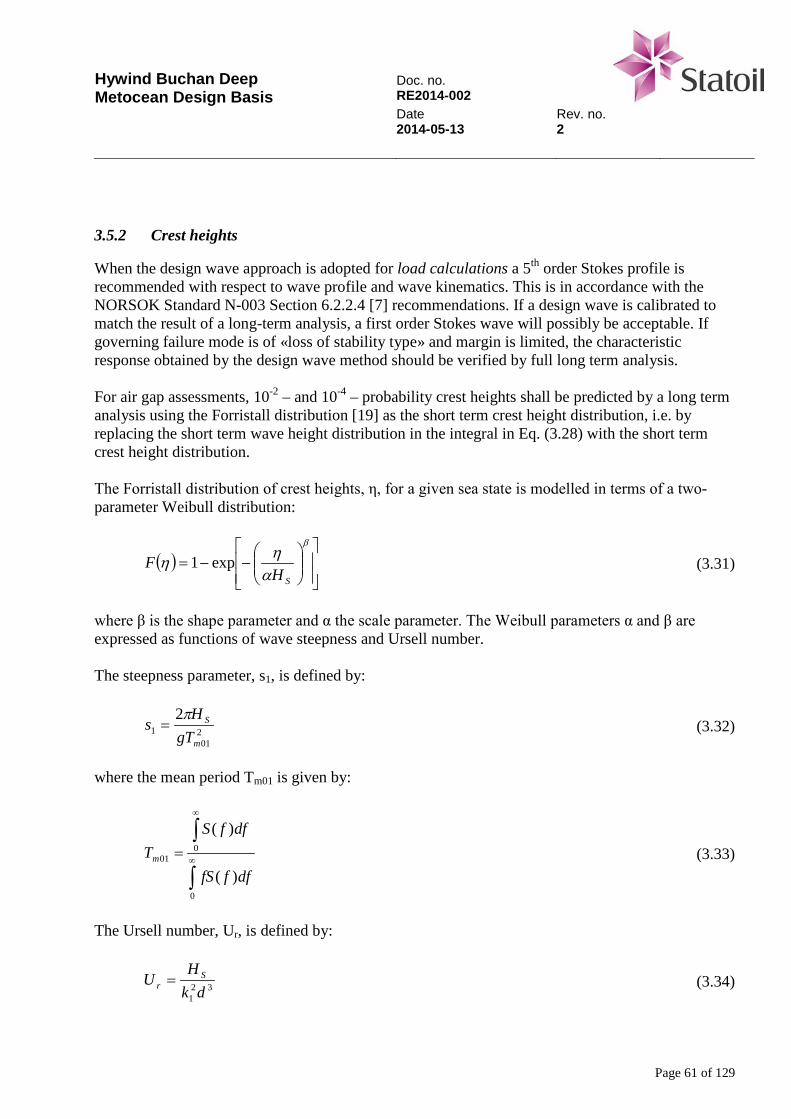
Hywind Buchan Deep Metocean Design Basis
Doc. no. RE2014-002 Date Rev. no. 2014-05-13 2
Page 61 of 129
3.5.2 Crest heights
When the design wave approach is adopted for load calculations a 5th order Stokes profile is recommended with respect to wave profile and wave kinematics. This is in accordance with the NORSOK Standard N-003 Section 6.2.2.4 [7] recommendations. If a design wave is calibrated to match the result of a long-term analysis, a first order Stokes wave will possibly be acceptable. If governing failure mode is of «loss of stability type» and margin is limited, the characteristic response obtained by the design wave method should be verified by full long term analysis. For air gap assessments, 10-2 – and 10-4 – probability crest heights shall be predicted by a long term analysis using the Forristall distribution [19] as the short term crest height distribution, i.e. by replacing the short term wave height distribution in the integral in Eq. (3.28) with the short term crest height distribution. The Forristall distribution of crest heights, η, for a given sea state is modelled in terms of a two-parameter Weibull distribution:
( )
−−=
β
αηη
SHF exp1 (3.31)
where β is the shape parameter and α the scale parameter. The Weibull parameters α and β are expressed as functions of wave steepness and Ursell number. The steepness parameter, s1, is defined by:
201
12
m
S
gTH
sπ
= (3.32)
where the mean period Tm01 is given by:
∫
∫∞
∞
=
0
001
)(
)(
dfffS
dffSTm (3.33)
The Ursell number, Ur, is defined by:
321 dkH
U Sr = (3.34)
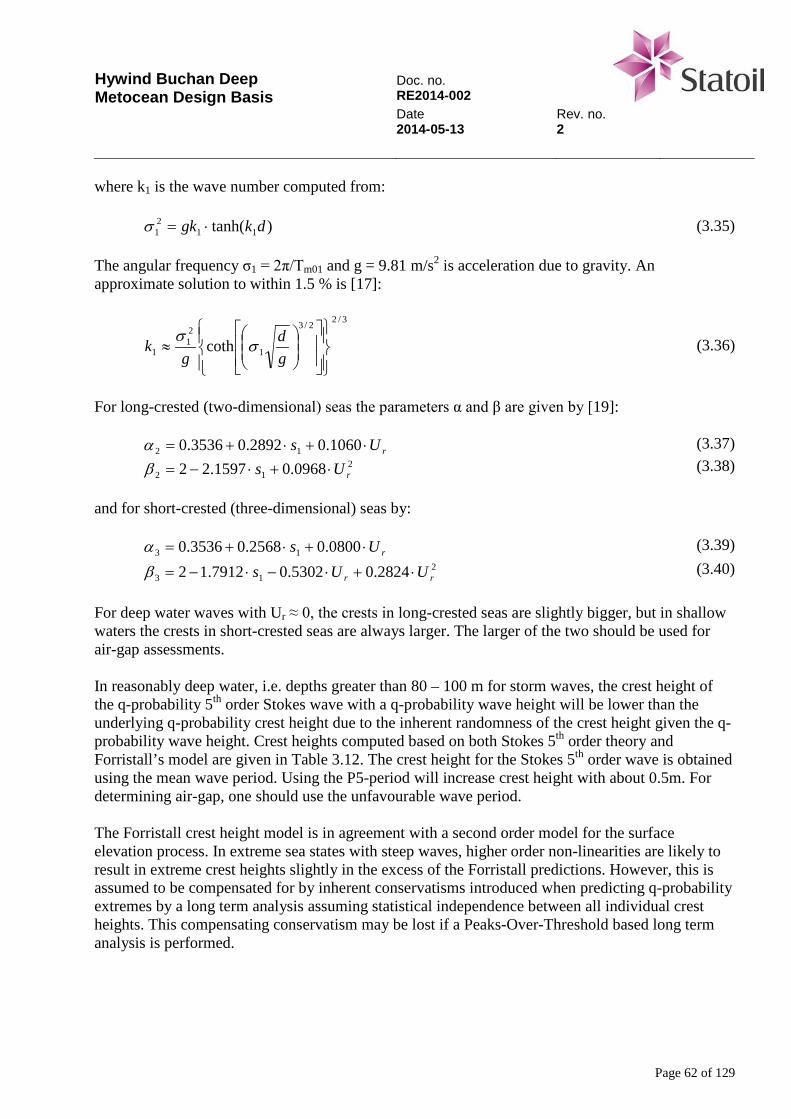
Hywind Buchan Deep Metocean Design Basis
Doc. no. RE2014-002 Date Rev. no. 2014-05-13 2
Page 62 of 129
where k1 is the wave number computed from:
)tanh( 1121 dkgk ⋅=σ (3.35)
The angular frequency σ1 = 2π/Tm01 and g = 9.81 m/s2 is acceleration due to gravity. An approximate solution to within 1.5 % is [17]:
3/22/3
1
21
1 coth
≈
gd
gk σ
σ (3.36)
For long-crested (two-dimensional) seas the parameters α and β are given by [19]:
rUs ⋅+⋅+= 1060.02892.03536.0 12α (3.37) 2
12 0968.01597.22 rUs ⋅+⋅−=β (3.38) and for short-crested (three-dimensional) seas by:
rUs ⋅+⋅+= 0800.02568.03536.0 13α (3.39) 2
13 2824.05302.07912.12 rr UUs ⋅+⋅−⋅−=β (3.40) For deep water waves with Ur ≈ 0, the crests in long-crested seas are slightly bigger, but in shallow waters the crests in short-crested seas are always larger. The larger of the two should be used for air-gap assessments. In reasonably deep water, i.e. depths greater than 80 – 100 m for storm waves, the crest height of the q-probability 5th order Stokes wave with a q-probability wave height will be lower than the underlying q-probability crest height due to the inherent randomness of the crest height given the q-probability wave height. Crest heights computed based on both Stokes 5th order theory and Forristall’s model are given in Table 3.12. The crest height for the Stokes 5th order wave is obtained using the mean wave period. Using the P5-period will increase crest height with about 0.5m. For determining air-gap, one should use the unfavourable wave period. The Forristall crest height model is in agreement with a second order model for the surface elevation process. In extreme sea states with steep waves, higher order non-linearities are likely to result in extreme crest heights slightly in the excess of the Forristall predictions. However, this is assumed to be compensated for by inherent conservatisms introduced when predicting q-probability extremes by a long term analysis assuming statistical independence between all individual crest heights. This compensating conservatism may be lost if a Peaks-Over-Threshold based long term analysis is performed.
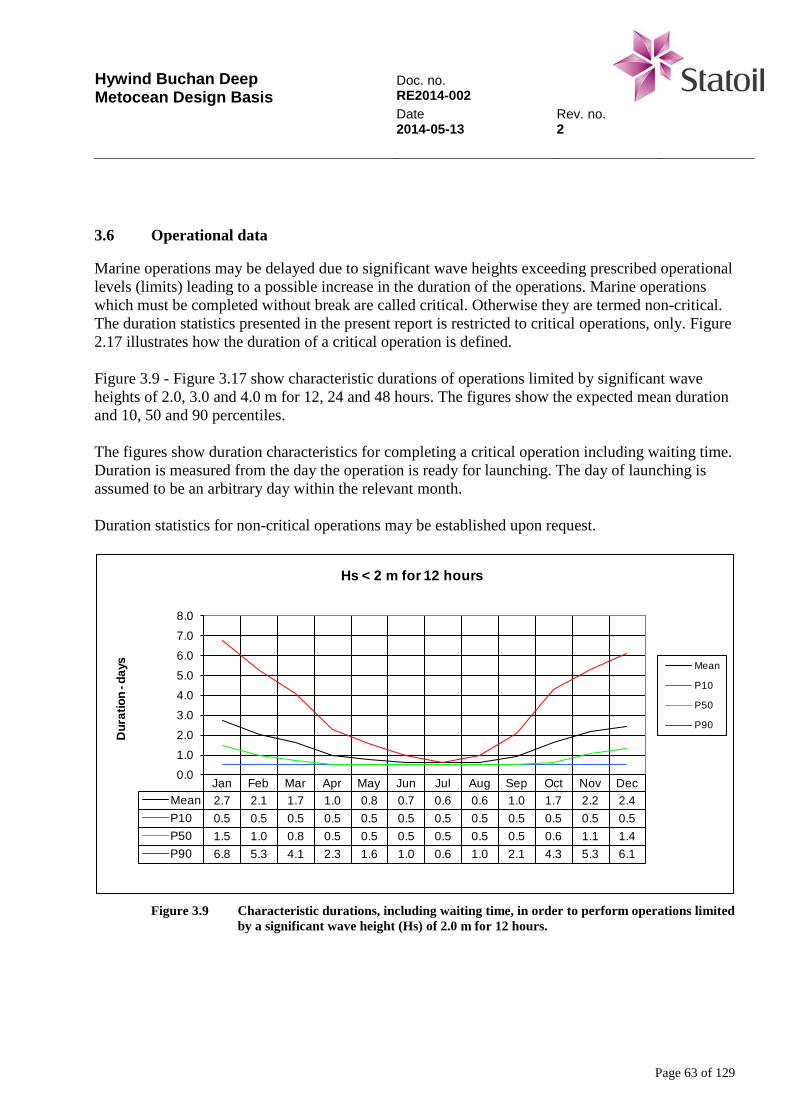
Hywind Buchan Deep Metocean Design Basis
Doc. no. RE2014-002 Date Rev. no. 2014-05-13 2
Page 63 of 129
3.6 Operational data
Marine operations may be delayed due to significant wave heights exceeding prescribed operational levels (limits) leading to a possible increase in the duration of the operations. Marine operations which must be completed without break are called critical. Otherwise they are termed non-critical. The duration statistics presented in the present report is restricted to critical operations, only. Figure 2.17 illustrates how the duration of a critical operation is defined. Figure 3.9 - Figure 3.17 show characteristic durations of operations limited by significant wave heights of 2.0, 3.0 and 4.0 m for 12, 24 and 48 hours. The figures show the expected mean duration and 10, 50 and 90 percentiles. The figures show duration characteristics for completing a critical operation including waiting time. Duration is measured from the day the operation is ready for launching. The day of launching is assumed to be an arbitrary day within the relevant month. Duration statistics for non-critical operations may be established upon request.
Jan Feb Mar Apr May Jun Jul Aug Sep Oct Nov DecMean 2.7 2.1 1.7 1.0 0.8 0.7 0.6 0.6 1.0 1.7 2.2 2.4P10 0.5 0.5 0.5 0.5 0.5 0.5 0.5 0.5 0.5 0.5 0.5 0.5P50 1.5 1.0 0.8 0.5 0.5 0.5 0.5 0.5 0.5 0.6 1.1 1.4P90 6.8 5.3 4.1 2.3 1.6 1.0 0.6 1.0 2.1 4.3 5.3 6.1
0.01.02.03.04.05.06.07.08.0
Dur
atio
n -d
ays
Hs < 2 m for 12 hours
Mean
P10
P50
P90
Figure 3.9 Characteristic durations, including waiting time, in order to perform operations limited
by a significant wave height (Hs) of 2.0 m for 12 hours.

Hywind Buchan Deep Metocean Design Basis
Doc. no. RE2014-002 Date Rev. no. 2014-05-13 2
Page 64 of 129
Jan Feb Mar Apr May Jun Jul Aug Sep Oct Nov DecMean 1.1 0.9 0.8 0.6 0.6 0.5 0.5 0.5 0.6 0.8 0.9 0.9P10 0.5 0.5 0.5 0.5 0.5 0.5 0.5 0.5 0.5 0.5 0.5 0.5P50 0.5 0.5 0.5 0.5 0.5 0.5 0.5 0.5 0.5 0.5 0.5 0.5P90 2.3 1.9 1.5 0.9 0.5 0.5 0.5 0.5 0.6 1.4 1.9 1.9
0.0
0.5
1.0
1.5
2.0
2.5
Dur
atio
n -d
ays
Hs < 3 m for 12 hours
Mean
P10
P50
P90
Figure 3.10 Characteristic durations, including waiting time, in order to perform operations limited
by a significant wave height (Hs) of 3.0 m for 12 hours.
Jan Feb Mar Apr May Jun Jul Aug Sep Oct Nov DecMean 0.6 0.6 0.6 0.5 0.5 0.5 0.5 0.5 0.5 0.6 0.6 0.6P10 0.5 0.5 0.5 0.5 0.5 0.5 0.5 0.5 0.5 0.5 0.5 0.5P50 0.5 0.5 0.5 0.5 0.5 0.5 0.5 0.5 0.5 0.5 0.5 0.5P90 1.1 0.8 0.5 0.5 0.5 0.5 0.5 0.5 0.5 0.5 0.9 1.0
0.0
0.2
0.4
0.6
0.8
1.0
1.2
Dur
atio
n -d
ays
Hs < 4 m for 12 hours
Mean
P10
P50
P90
Figure 3.11 Characteristic durations, including waiting time, in order to perform operations limited
by a significant wave height (Hs) of 4.0 m for 12 hours.
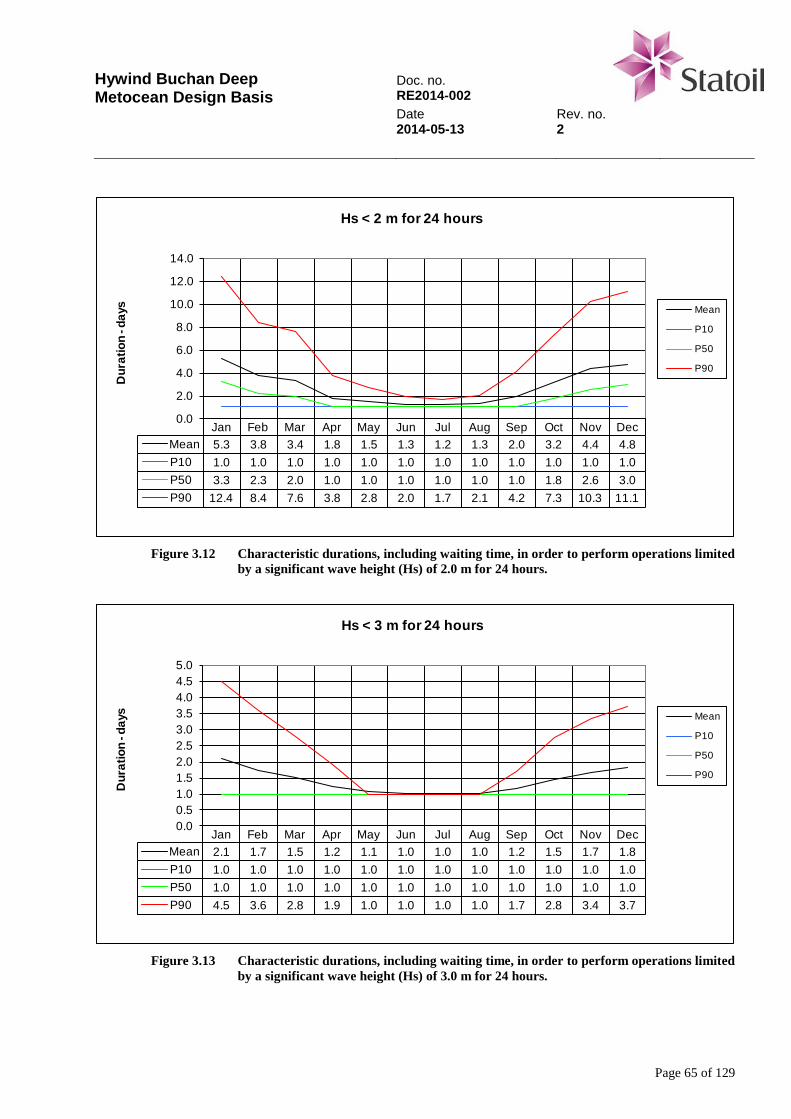
Hywind Buchan Deep Metocean Design Basis
Doc. no. RE2014-002 Date Rev. no. 2014-05-13 2
Page 65 of 129
Jan Feb Mar Apr May Jun Jul Aug Sep Oct Nov DecMean 5.3 3.8 3.4 1.8 1.5 1.3 1.2 1.3 2.0 3.2 4.4 4.8P10 1.0 1.0 1.0 1.0 1.0 1.0 1.0 1.0 1.0 1.0 1.0 1.0P50 3.3 2.3 2.0 1.0 1.0 1.0 1.0 1.0 1.0 1.8 2.6 3.0P90 12.4 8.4 7.6 3.8 2.8 2.0 1.7 2.1 4.2 7.3 10.3 11.1
0.0
2.0
4.0
6.0
8.0
10.0
12.0
14.0
Dur
atio
n -d
ays
Hs < 2 m for 24 hours
Mean
P10
P50
P90
Figure 3.12 Characteristic durations, including waiting time, in order to perform operations limited
by a significant wave height (Hs) of 2.0 m for 24 hours.
Jan Feb Mar Apr May Jun Jul Aug Sep Oct Nov DecMean 2.1 1.7 1.5 1.2 1.1 1.0 1.0 1.0 1.2 1.5 1.7 1.8P10 1.0 1.0 1.0 1.0 1.0 1.0 1.0 1.0 1.0 1.0 1.0 1.0P50 1.0 1.0 1.0 1.0 1.0 1.0 1.0 1.0 1.0 1.0 1.0 1.0P90 4.5 3.6 2.8 1.9 1.0 1.0 1.0 1.0 1.7 2.8 3.4 3.7
0.00.51.01.52.02.53.03.54.04.55.0
Dur
atio
n -d
ays
Hs < 3 m for 24 hours
Mean
P10
P50
P90
Figure 3.13 Characteristic durations, including waiting time, in order to perform operations limited
by a significant wave height (Hs) of 3.0 m for 24 hours.
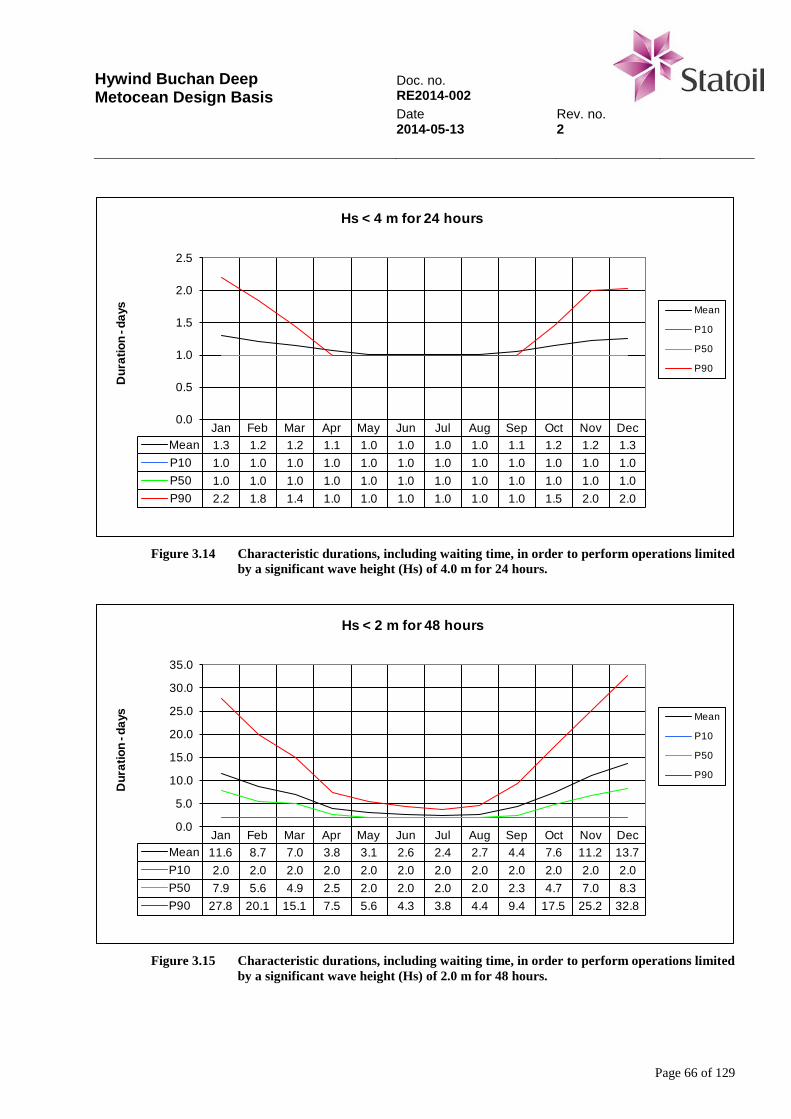
Hywind Buchan Deep Metocean Design Basis
Doc. no. RE2014-002 Date Rev. no. 2014-05-13 2
Page 66 of 129
Jan Feb Mar Apr May Jun Jul Aug Sep Oct Nov DecMean 1.3 1.2 1.2 1.1 1.0 1.0 1.0 1.0 1.1 1.2 1.2 1.3P10 1.0 1.0 1.0 1.0 1.0 1.0 1.0 1.0 1.0 1.0 1.0 1.0P50 1.0 1.0 1.0 1.0 1.0 1.0 1.0 1.0 1.0 1.0 1.0 1.0P90 2.2 1.8 1.4 1.0 1.0 1.0 1.0 1.0 1.0 1.5 2.0 2.0
0.0
0.5
1.0
1.5
2.0
2.5
Dur
atio
n -d
ays
Hs < 4 m for 24 hours
Mean
P10
P50
P90
Figure 3.14 Characteristic durations, including waiting time, in order to perform operations limited
by a significant wave height (Hs) of 4.0 m for 24 hours.
Jan Feb Mar Apr May Jun Jul Aug Sep Oct Nov DecMean 11.6 8.7 7.0 3.8 3.1 2.6 2.4 2.7 4.4 7.6 11.2 13.7P10 2.0 2.0 2.0 2.0 2.0 2.0 2.0 2.0 2.0 2.0 2.0 2.0P50 7.9 5.6 4.9 2.5 2.0 2.0 2.0 2.0 2.3 4.7 7.0 8.3P90 27.8 20.1 15.1 7.5 5.6 4.3 3.8 4.4 9.4 17.5 25.2 32.8
0.0
5.0
10.0
15.0
20.0
25.0
30.0
35.0
Dur
atio
n -d
ays
Hs < 2 m for 48 hours
Mean
P10
P50
P90
Figure 3.15 Characteristic durations, including waiting time, in order to perform operations limited
by a significant wave height (Hs) of 2.0 m for 48 hours.
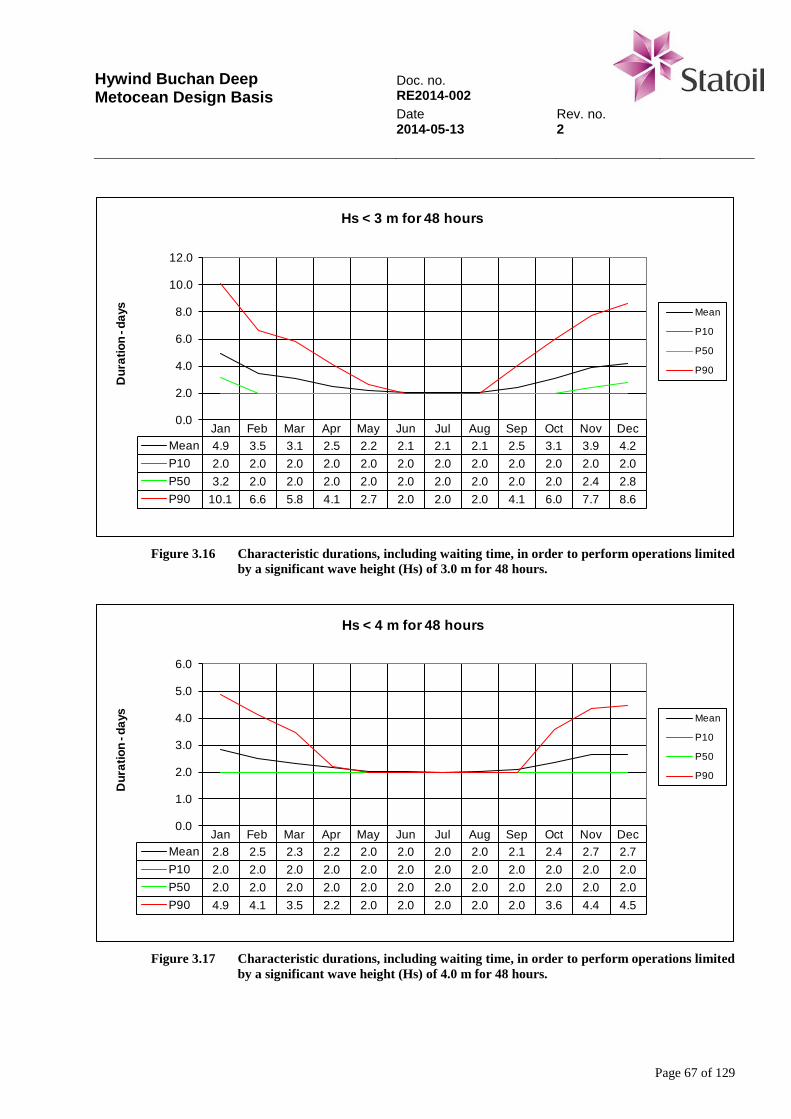
Hywind Buchan Deep Metocean Design Basis
Doc. no. RE2014-002 Date Rev. no. 2014-05-13 2
Page 67 of 129
Jan Feb Mar Apr May Jun Jul Aug Sep Oct Nov DecMean 4.9 3.5 3.1 2.5 2.2 2.1 2.1 2.1 2.5 3.1 3.9 4.2P10 2.0 2.0 2.0 2.0 2.0 2.0 2.0 2.0 2.0 2.0 2.0 2.0P50 3.2 2.0 2.0 2.0 2.0 2.0 2.0 2.0 2.0 2.0 2.4 2.8P90 10.1 6.6 5.8 4.1 2.7 2.0 2.0 2.0 4.1 6.0 7.7 8.6
0.0
2.0
4.0
6.0
8.0
10.0
12.0
Dur
atio
n - d
ays
Hs < 3 m for 48 hours
Mean
P10
P50
P90
Figure 3.16 Characteristic durations, including waiting time, in order to perform operations limited
by a significant wave height (Hs) of 3.0 m for 48 hours.
Jan Feb Mar Apr May Jun Jul Aug Sep Oct Nov DecMean 2.8 2.5 2.3 2.2 2.0 2.0 2.0 2.0 2.1 2.4 2.7 2.7P10 2.0 2.0 2.0 2.0 2.0 2.0 2.0 2.0 2.0 2.0 2.0 2.0P50 2.0 2.0 2.0 2.0 2.0 2.0 2.0 2.0 2.0 2.0 2.0 2.0P90 4.9 4.1 3.5 2.2 2.0 2.0 2.0 2.0 2.0 3.6 4.4 4.5
0.0
1.0
2.0
3.0
4.0
5.0
6.0
Dur
atio
n -d
ays
Hs < 4 m for 48 hours
Mean
P10
P50
P90
Figure 3.17 Characteristic durations, including waiting time, in order to perform operations limited
by a significant wave height (Hs) of 4.0 m for 48 hours.
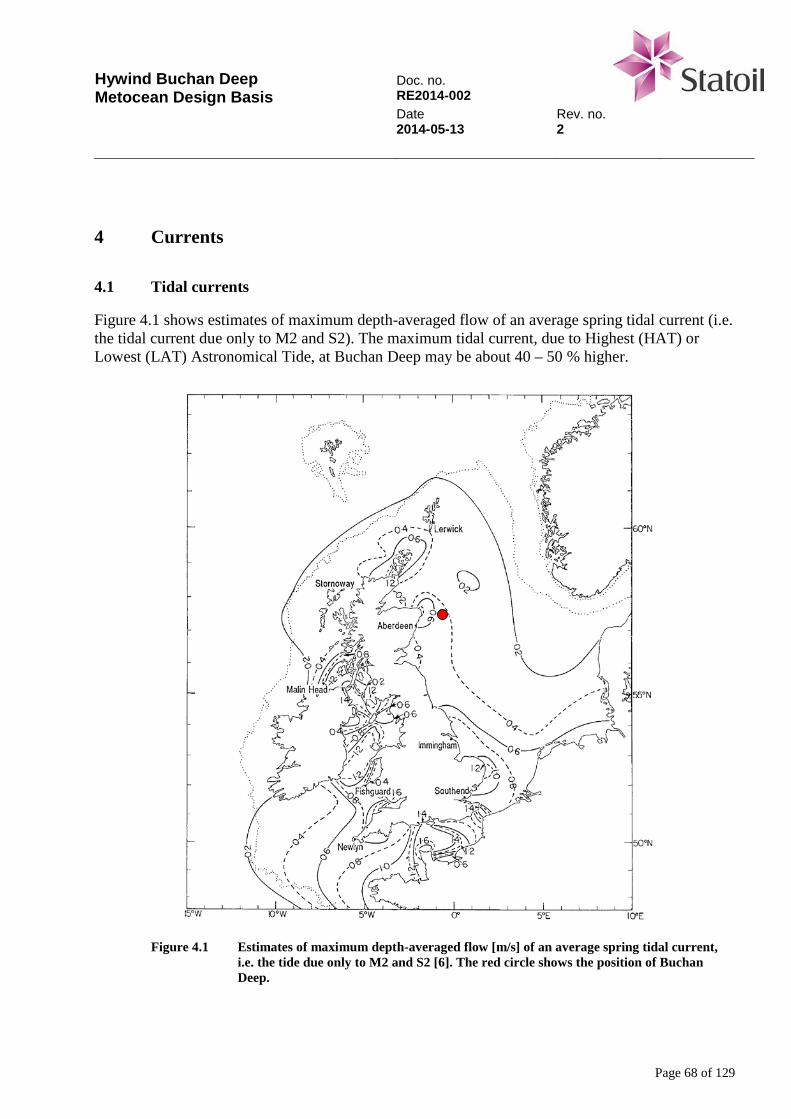
Hywind Buchan Deep Metocean Design Basis
Doc. no. RE2014-002 Date Rev. no. 2014-05-13 2
Page 68 of 129
4 Currents
4.1 Tidal currents
Figure 4.1 shows estimates of maximum depth-averaged flow of an average spring tidal current (i.e. the tidal current due only to M2 and S2). The maximum tidal current, due to Highest (HAT) or Lowest (LAT) Astronomical Tide, at Buchan Deep may be about 40 – 50 % higher.
Figure 4.1 Estimates of maximum depth-averaged flow [m/s] of an average spring tidal current,
i.e. the tide due only to M2 and S2 [6]. The red circle shows the position of Buchan Deep.
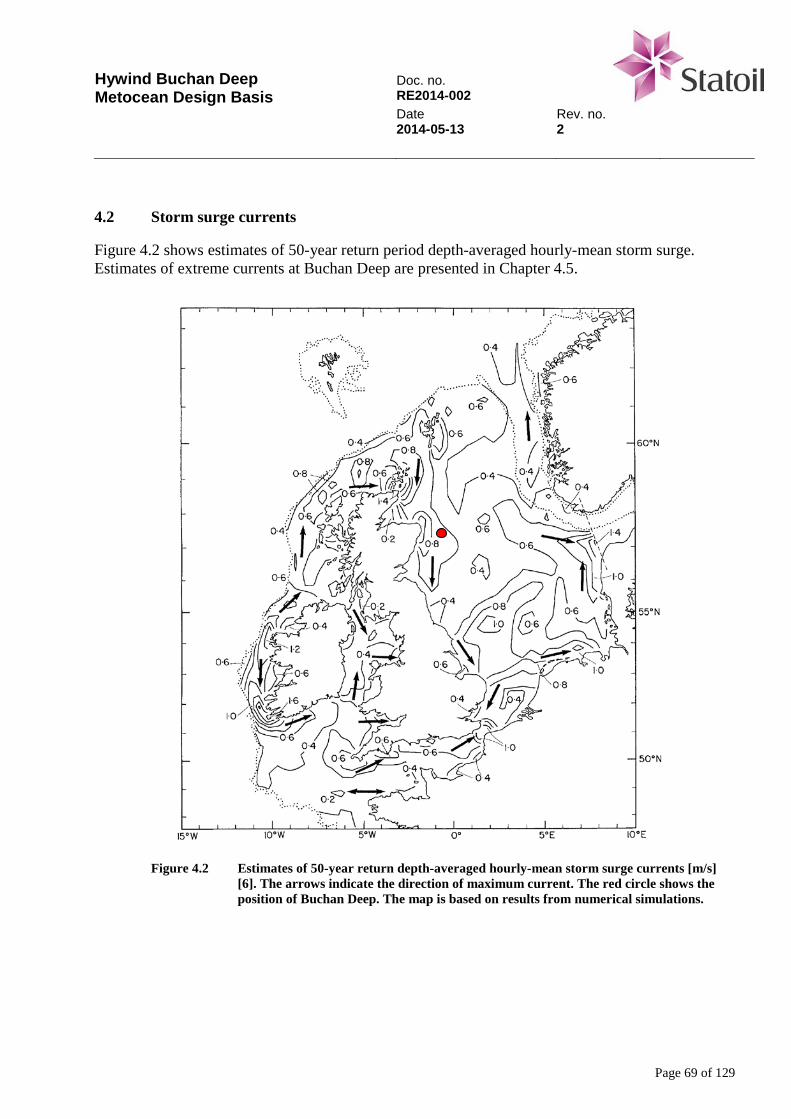
Hywind Buchan Deep Metocean Design Basis
Doc. no. RE2014-002 Date Rev. no. 2014-05-13 2
Page 69 of 129
4.2 Storm surge currents
Figure 4.2 shows estimates of 50-year return period depth-averaged hourly-mean storm surge. Estimates of extreme currents at Buchan Deep are presented in Chapter 4.5.
Figure 4.2 Estimates of 50-year return depth-averaged hourly-mean storm surge currents [m/s]
[6]. The arrows indicate the direction of maximum current. The red circle shows the position of Buchan Deep. The map is based on results from numerical simulations.
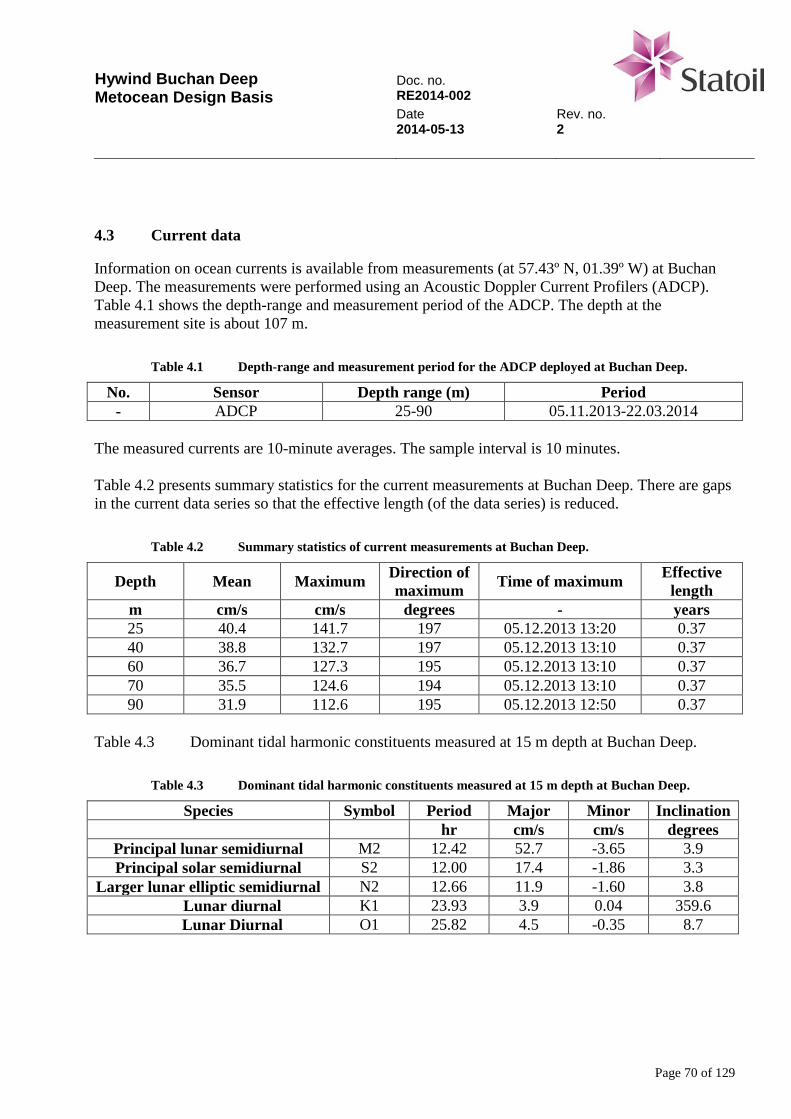
Hywind Buchan Deep Metocean Design Basis
Doc. no. RE2014-002 Date Rev. no. 2014-05-13 2
Page 70 of 129
4.3 Current data
Information on ocean currents is available from measurements (at 57.43º N, 01.39º W) at Buchan Deep. The measurements were performed using an Acoustic Doppler Current Profilers (ADCP). Table 4.1 shows the depth-range and measurement period of the ADCP. The depth at the measurement site is about 107 m.
Table 4.1 Depth-range and measurement period for the ADCP deployed at Buchan Deep.
No. Sensor Depth range (m) Period - ADCP 25-90 05.11.2013-22.03.2014
The measured currents are 10-minute averages. The sample interval is 10 minutes. Table 4.2 presents summary statistics for the current measurements at Buchan Deep. There are gaps in the current data series so that the effective length (of the data series) is reduced.
Table 4.2 Summary statistics of current measurements at Buchan Deep.
Depth Mean Maximum Direction of maximum Time of maximum Effective
length m cm/s cm/s degrees - years 25 40.4 141.7 197 05.12.2013 13:20 0.37 40 38.8 132.7 197 05.12.2013 13:10 0.37 60 36.7 127.3 195 05.12.2013 13:10 0.37 70 35.5 124.6 194 05.12.2013 13:10 0.37 90 31.9 112.6 195 05.12.2013 12:50 0.37
Table 4.3 Dominant tidal harmonic constituents measured at 15 m depth at Buchan Deep.
Table 4.3 Dominant tidal harmonic constituents measured at 15 m depth at Buchan Deep.
Species Symbol Period Major Minor Inclination hr cm/s cm/s degrees
Principal lunar semidiurnal M2 12.42 52.7 -3.65 3.9 Principal solar semidiurnal S2 12.00 17.4 -1.86 3.3
Larger lunar elliptic semidiurnal N2 12.66 11.9 -1.60 3.8 Lunar diurnal K1 23.93 3.9 0.04 359.6 Lunar Diurnal O1 25.82 4.5 -0.35 8.7
Hywind Buchan Deep Metocean Design Basis
Doc. no. RE2014-002 Date Rev. no. 2014-05-13 2
Page 71 of 129
The current measurement programme is ongoing and will continue until November 2014. Data from these measurements will be included in updates to this report. Tidal predictions can be generated on request. This should be done for all operations vulnerable for strong currents.
4.4 Current data analysis
Figure 4.3 - Figure 4.7 show current roses for the measurements at Buchan Deep. Table 4.4 - Table 4.8 show the corresponding distributions of non-exceedance of current speed.
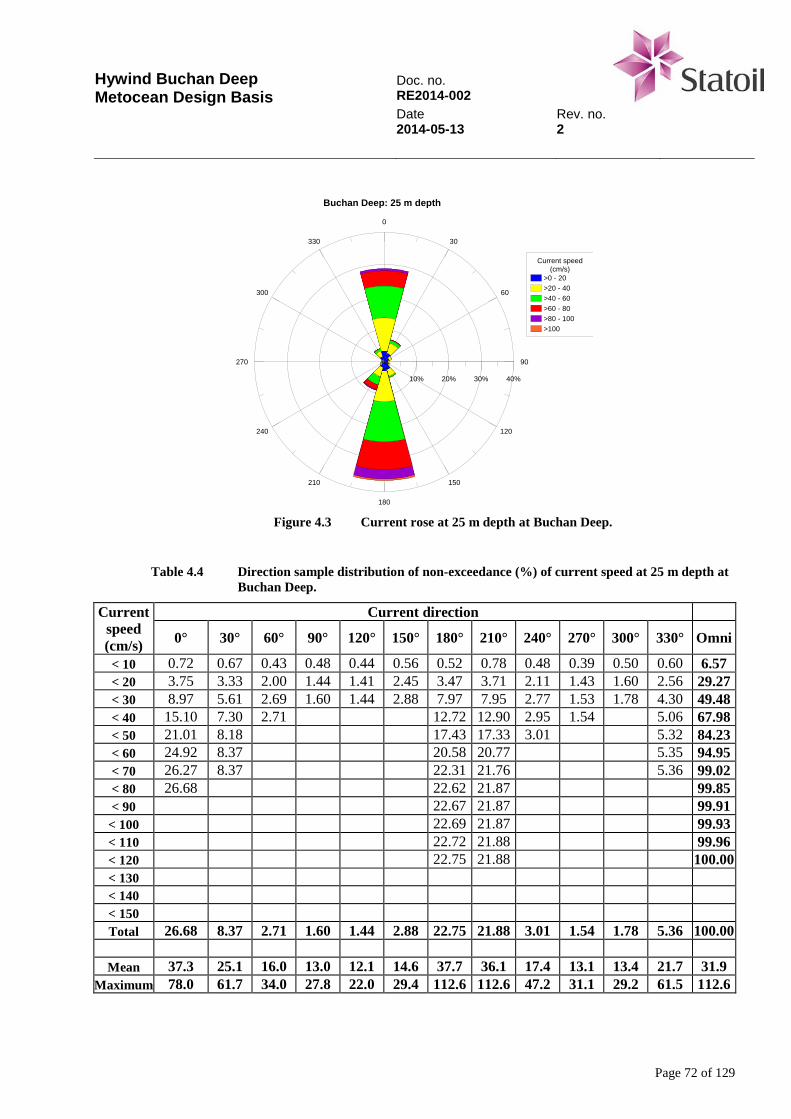
Hywind Buchan Deep Metocean Design Basis
Doc. no. RE2014-002 Date Rev. no. 2014-05-13 2
Page 72 of 129
0
30
60
90
120
150
180
210
240
270
300
330
0% 10% 20% 30% 40%
Current speed(cm/s)
>0 - 20>20 - 40>40 - 60>60 - 80>80 - 100>100
Buchan Deep: 25 m depth
Figure 4.3 Current rose at 25 m depth at Buchan Deep.
Table 4.4 Direction sample distribution of non-exceedance (%) of current speed at 25 m depth at
Buchan Deep.
Current speed (cm/s)
Current direction
0° 30° 60° 90° 120° 150° 180° 210° 240° 270° 300° 330° Omni
< 10 0.72 0.67 0.43 0.48 0.44 0.56 0.52 0.78 0.48 0.39 0.50 0.60 6.57 < 20 3.75 3.33 2.00 1.44 1.41 2.45 3.47 3.71 2.11 1.43 1.60 2.56 29.27 < 30 8.97 5.61 2.69 1.60 1.44 2.88 7.97 7.95 2.77 1.53 1.78 4.30 49.48 < 40 15.10 7.30 2.71 12.72 12.90 2.95 1.54 5.06 67.98 < 50 21.01 8.18 17.43 17.33 3.01 5.32 84.23 < 60 24.92 8.37 20.58 20.77 5.35 94.95 < 70 26.27 8.37 22.31 21.76 5.36 99.02 < 80 26.68 22.62 21.87 99.85 < 90 22.67 21.87 99.91
< 100 22.69 21.87 99.93 < 110 22.72 21.88 99.96 < 120 22.75 21.88 100.00 < 130 < 140 < 150 Total 26.68 8.37 2.71 1.60 1.44 2.88 22.75 21.88 3.01 1.54 1.78 5.36 100.00
Mean 37.3 25.1 16.0 13.0 12.1 14.6 37.7 36.1 17.4 13.1 13.4 21.7 31.9
Maximum 78.0 61.7 34.0 27.8 22.0 29.4 112.6 112.6 47.2 31.1 29.2 61.5 112.6
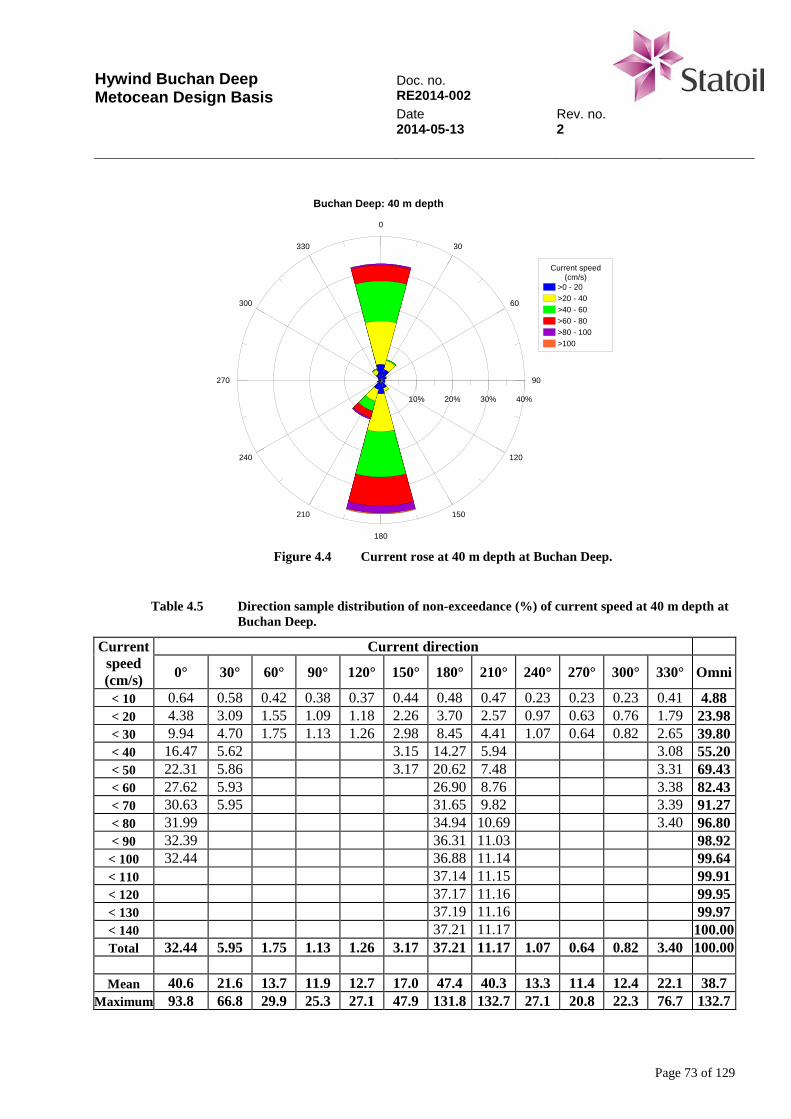
Hywind Buchan Deep Metocean Design Basis
Doc. no. RE2014-002 Date Rev. no. 2014-05-13 2
Page 73 of 129
0
30
60
90
120
150
180
210
240
270
300
330
0% 10% 20% 30% 40%
Current speed(cm/s)
>0 - 20>20 - 40>40 - 60>60 - 80>80 - 100>100
Buchan Deep: 40 m depth
Figure 4.4 Current rose at 40 m depth at Buchan Deep.
Table 4.5 Direction sample distribution of non-exceedance (%) of current speed at 40 m depth at
Buchan Deep.
Current speed (cm/s)
Current direction
0° 30° 60° 90° 120° 150° 180° 210° 240° 270° 300° 330° Omni
< 10 0.64 0.58 0.42 0.38 0.37 0.44 0.48 0.47 0.23 0.23 0.23 0.41 4.88 < 20 4.38 3.09 1.55 1.09 1.18 2.26 3.70 2.57 0.97 0.63 0.76 1.79 23.98 < 30 9.94 4.70 1.75 1.13 1.26 2.98 8.45 4.41 1.07 0.64 0.82 2.65 39.80 < 40 16.47 5.62 3.15 14.27 5.94 3.08 55.20 < 50 22.31 5.86 3.17 20.62 7.48 3.31 69.43 < 60 27.62 5.93 26.90 8.76 3.38 82.43 < 70 30.63 5.95 31.65 9.82 3.39 91.27 < 80 31.99 34.94 10.69 3.40 96.80 < 90 32.39 36.31 11.03 98.92
< 100 32.44 36.88 11.14 99.64 < 110 37.14 11.15 99.91 < 120 37.17 11.16 99.95 < 130 37.19 11.16 99.97 < 140 37.21 11.17 100.00 Total 32.44 5.95 1.75 1.13 1.26 3.17 37.21 11.17 1.07 0.64 0.82 3.40 100.00
Mean 40.6 21.6 13.7 11.9 12.7 17.0 47.4 40.3 13.3 11.4 12.4 22.1 38.7
Maximum 93.8 66.8 29.9 25.3 27.1 47.9 131.8 132.7 27.1 20.8 22.3 76.7 132.7
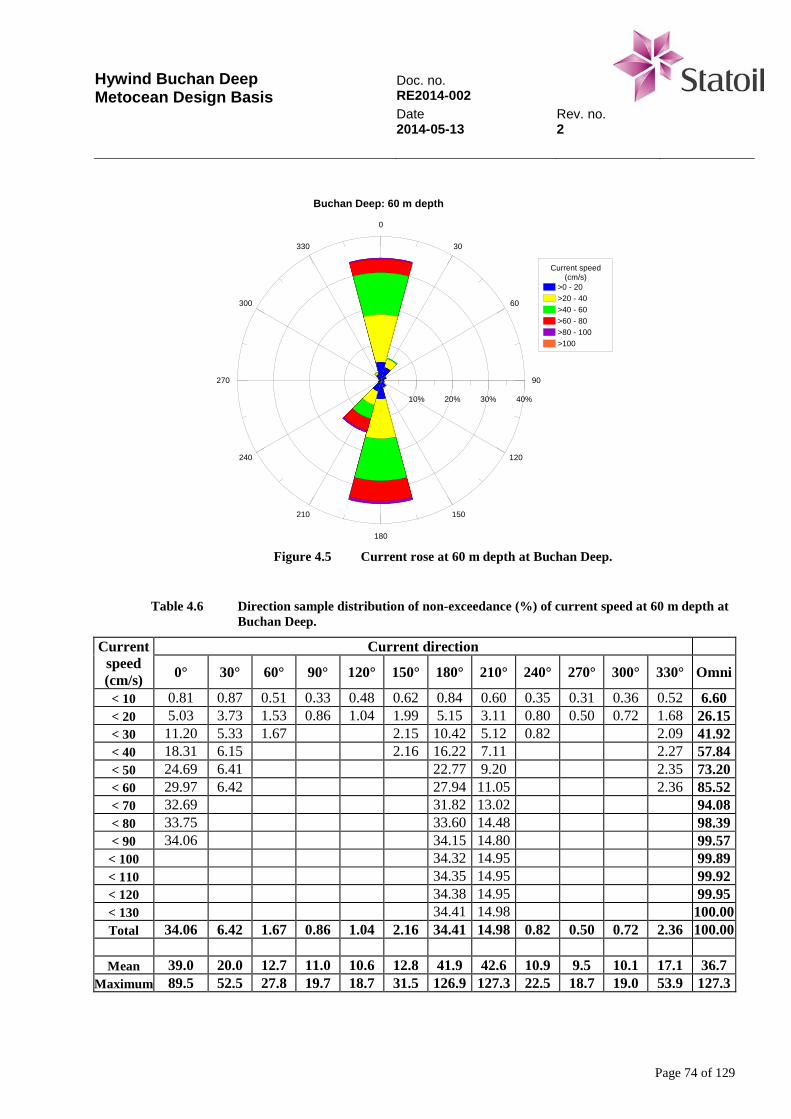
Hywind Buchan Deep Metocean Design Basis
Doc. no. RE2014-002 Date Rev. no. 2014-05-13 2
Page 74 of 129
0
30
60
90
120
150
180
210
240
270
300
330
0% 10% 20% 30% 40%
Current speed(cm/s)
>0 - 20>20 - 40>40 - 60>60 - 80>80 - 100>100
Buchan Deep: 60 m depth
Figure 4.5 Current rose at 60 m depth at Buchan Deep.
Table 4.6 Direction sample distribution of non-exceedance (%) of current speed at 60 m depth at
Buchan Deep.
Current speed (cm/s)
Current direction
0° 30° 60° 90° 120° 150° 180° 210° 240° 270° 300° 330° Omni
< 10 0.81 0.87 0.51 0.33 0.48 0.62 0.84 0.60 0.35 0.31 0.36 0.52 6.60 < 20 5.03 3.73 1.53 0.86 1.04 1.99 5.15 3.11 0.80 0.50 0.72 1.68 26.15 < 30 11.20 5.33 1.67 2.15 10.42 5.12 0.82 2.09 41.92 < 40 18.31 6.15 2.16 16.22 7.11 2.27 57.84 < 50 24.69 6.41 22.77 9.20 2.35 73.20 < 60 29.97 6.42 27.94 11.05 2.36 85.52 < 70 32.69 31.82 13.02 94.08 < 80 33.75 33.60 14.48 98.39 < 90 34.06 34.15 14.80 99.57
< 100 34.32 14.95 99.89 < 110 34.35 14.95 99.92 < 120 34.38 14.95 99.95 < 130 34.41 14.98 100.00 Total 34.06 6.42 1.67 0.86 1.04 2.16 34.41 14.98 0.82 0.50 0.72 2.36 100.00
Mean 39.0 20.0 12.7 11.0 10.6 12.8 41.9 42.6 10.9 9.5 10.1 17.1 36.7
Maximum 89.5 52.5 27.8 19.7 18.7 31.5 126.9 127.3 22.5 18.7 19.0 53.9 127.3
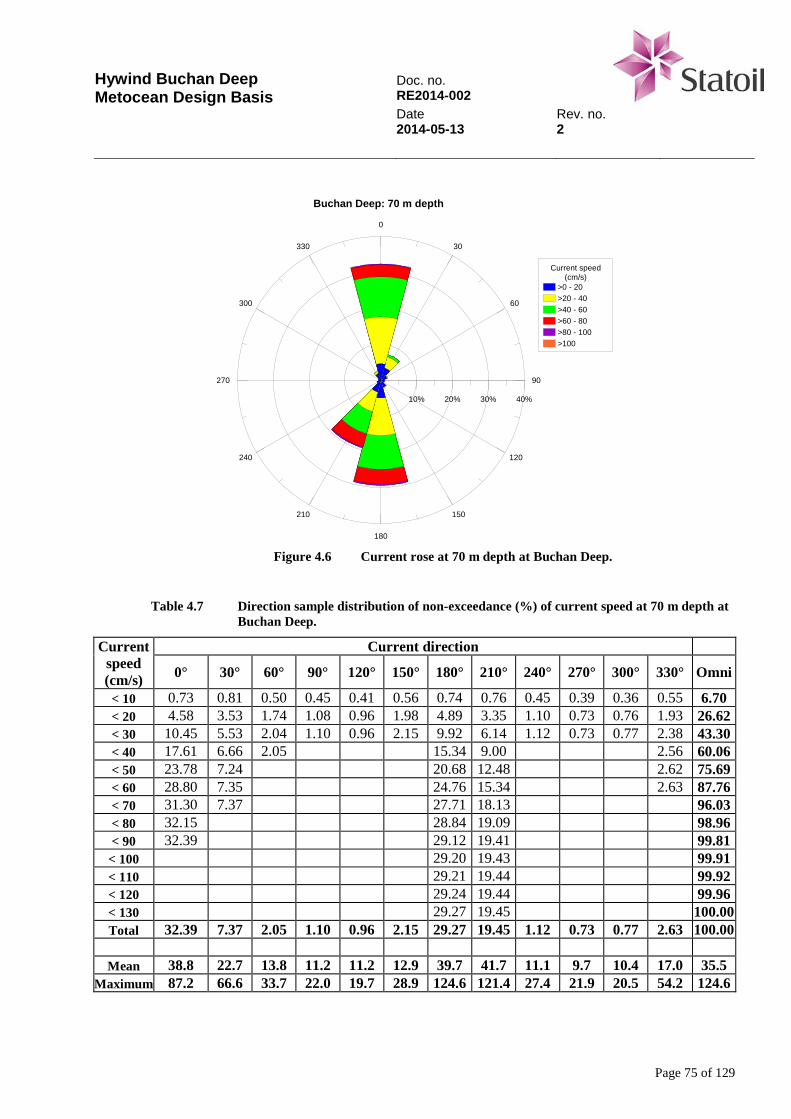
Hywind Buchan Deep Metocean Design Basis
Doc. no. RE2014-002 Date Rev. no. 2014-05-13 2
Page 75 of 129
0
30
60
90
120
150
180
210
240
270
300
330
0% 10% 20% 30% 40%
Current speed(cm/s)
>0 - 20>20 - 40>40 - 60>60 - 80>80 - 100>100
Buchan Deep: 70 m depth
Figure 4.6 Current rose at 70 m depth at Buchan Deep.
Table 4.7 Direction sample distribution of non-exceedance (%) of current speed at 70 m depth at
Buchan Deep.
Current speed (cm/s)
Current direction
0° 30° 60° 90° 120° 150° 180° 210° 240° 270° 300° 330° Omni
< 10 0.73 0.81 0.50 0.45 0.41 0.56 0.74 0.76 0.45 0.39 0.36 0.55 6.70 < 20 4.58 3.53 1.74 1.08 0.96 1.98 4.89 3.35 1.10 0.73 0.76 1.93 26.62 < 30 10.45 5.53 2.04 1.10 0.96 2.15 9.92 6.14 1.12 0.73 0.77 2.38 43.30 < 40 17.61 6.66 2.05 15.34 9.00 2.56 60.06 < 50 23.78 7.24 20.68 12.48 2.62 75.69 < 60 28.80 7.35 24.76 15.34 2.63 87.76 < 70 31.30 7.37 27.71 18.13 96.03 < 80 32.15 28.84 19.09 98.96 < 90 32.39 29.12 19.41 99.81
< 100 29.20 19.43 99.91 < 110 29.21 19.44 99.92 < 120 29.24 19.44 99.96 < 130 29.27 19.45 100.00 Total 32.39 7.37 2.05 1.10 0.96 2.15 29.27 19.45 1.12 0.73 0.77 2.63 100.00
Mean 38.8 22.7 13.8 11.2 11.2 12.9 39.7 41.7 11.1 9.7 10.4 17.0 35.5
Maximum 87.2 66.6 33.7 22.0 19.7 28.9 124.6 121.4 27.4 21.9 20.5 54.2 124.6
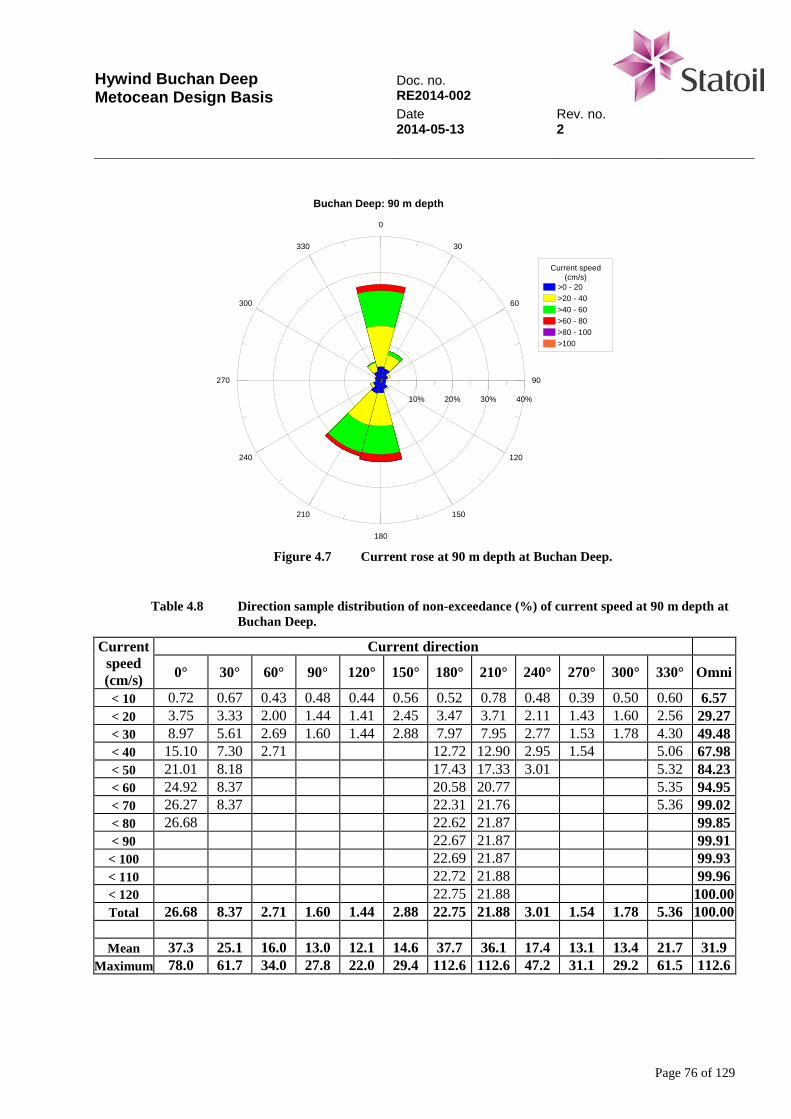
Hywind Buchan Deep Metocean Design Basis
Doc. no. RE2014-002 Date Rev. no. 2014-05-13 2
Page 76 of 129
0
30
60
90
120
150
180
210
240
270
300
330
0% 10% 20% 30% 40%
Current speed(cm/s)
>0 - 20>20 - 40>40 - 60>60 - 80>80 - 100>100
Buchan Deep: 90 m depth
Figure 4.7 Current rose at 90 m depth at Buchan Deep.
Table 4.8 Direction sample distribution of non-exceedance (%) of current speed at 90 m depth at
Buchan Deep.
Current speed (cm/s)
Current direction
0° 30° 60° 90° 120° 150° 180° 210° 240° 270° 300° 330° Omni
< 10 0.72 0.67 0.43 0.48 0.44 0.56 0.52 0.78 0.48 0.39 0.50 0.60 6.57 < 20 3.75 3.33 2.00 1.44 1.41 2.45 3.47 3.71 2.11 1.43 1.60 2.56 29.27 < 30 8.97 5.61 2.69 1.60 1.44 2.88 7.97 7.95 2.77 1.53 1.78 4.30 49.48 < 40 15.10 7.30 2.71 12.72 12.90 2.95 1.54 5.06 67.98 < 50 21.01 8.18 17.43 17.33 3.01 5.32 84.23 < 60 24.92 8.37 20.58 20.77 5.35 94.95 < 70 26.27 8.37 22.31 21.76 5.36 99.02 < 80 26.68 22.62 21.87 99.85 < 90 22.67 21.87 99.91
< 100 22.69 21.87 99.93 < 110 22.72 21.88 99.96 < 120 22.75 21.88 100.00 Total 26.68 8.37 2.71 1.60 1.44 2.88 22.75 21.88 3.01 1.54 1.78 5.36 100.00
Mean 37.3 25.1 16.0 13.0 12.1 14.6 37.7 36.1 17.4 13.1 13.4 21.7 31.9
Maximum 78.0 61.7 34.0 27.8 22.0 29.4 112.6 112.6 47.2 31.1 29.2 61.5 112.6
Hywind Buchan Deep Metocean Design Basis
Doc. no. RE2014-002 Date Rev. no. 2014-05-13 2
Page 77 of 129
4.5 Long-term current statistics
The long-term distribution of current speed peaks (i.e. local maxima) is modelled in terms of a Weibull distribution:
−
−−=γ
θεuuF exp1)( where );0max( ε≥u (4.1)
where:
u Current speed ε Location parameter θ Scale parameter γ Shape parameter
Extreme values, uR, corresponding to a return period, R, are obtained by inverting Equation (4.1) for a cumulative probability F = 1 – τ/pR, i.e.:
γτθε
/1
ln
−⋅+=
pRuR (4.2)
where
τ Average time between current speed peaks p Sector or monthly probability (=1/12 for monthly omni-directional distributions) R Return period
The annual probability of exceedance, q, is given by:
−−=
RTq exp1 T = 1 year (4.3)
It is seen that q = 0.63 for R = 1 year and that q is approximately 10-1 and 10-2 for R = 10 and 100 years, respectively. Figure 4.8 - Figure 4.14 and Table 4.9 - Table 4.15 show Weibull parameters and corresponding sector and omni-directional extremes for current speed. The surface current is set equal to the current at 25 m depth increased by 5 %. The current near the bottom is assumed to follow the power representative for tidal currents [6, Chapter 6.3]:
Hywind Buchan Deep Metocean Design Basis
Doc. no. RE2014-002 Date Rev. no. 2014-05-13 2
Page 78 of 129
tuh
zzu ⋅
⋅=
7/1
32.0)( for 0 < z < 0.5 h (4.4)
Where
u Height above sea bottom h Water depth u(z) Current speed at height z above sea bottom ut Depth-averaged current speed
By inserting for z = 3 m and z = 17 m in the above formula it is found that the current speed at 3m above sea bottom is equal to 0.78 x the current speed at 90 m depth. Consequently, the current at 3 m above sea bottom is set equal to the current speed at 90 m depth reduced by about 20 %. Uncertainties (in the estimated extremes) shall be accounted for by selecting the highest values from three neighbouring months or sectors. For example, extremes for May shall be taken as the highest extremes for April, May and June. Extremes for the 180º sector shall be taken as the highest extremes for the 150º, 180º and 210º sectors.
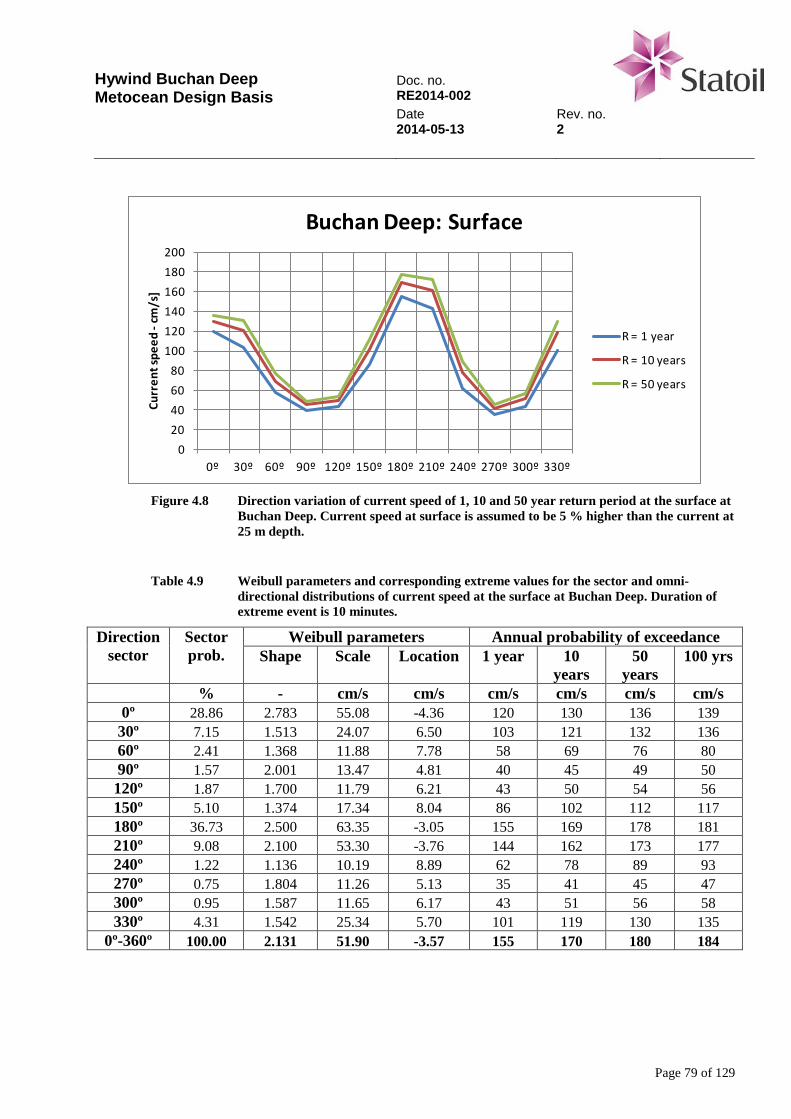
Hywind Buchan Deep Metocean Design Basis
Doc. no. RE2014-002 Date Rev. no. 2014-05-13 2
Page 79 of 129
020406080
100120140160180200
0º 30º 60º 90º 120º 150º 180º 210º 240º 270º 300º 330º
Curr
ent s
peed
-cm
/s]
Buchan Deep: Surface
R = 1 year
R = 10 years
R = 50 years
Figure 4.8 Direction variation of current speed of 1, 10 and 50 year return period at the surface at
Buchan Deep. Current speed at surface is assumed to be 5 % higher than the current at 25 m depth.
Table 4.9 Weibull parameters and corresponding extreme values for the sector and omni-
directional distributions of current speed at the surface at Buchan Deep. Duration of extreme event is 10 minutes.
Direction sector
Sector prob.
Weibull parameters Annual probability of exceedance Shape Scale Location 1 year 10
years 50
years 100 yrs
% - cm/s cm/s cm/s cm/s cm/s cm/s 0º 28.86 2.783 55.08 -4.36 120 130 136 139 30º 7.15 1.513 24.07 6.50 103 121 132 136 60º 2.41 1.368 11.88 7.78 58 69 76 80 90º 1.57 2.001 13.47 4.81 40 45 49 50 120º 1.87 1.700 11.79 6.21 43 50 54 56 150º 5.10 1.374 17.34 8.04 86 102 112 117 180º 36.73 2.500 63.35 -3.05 155 169 178 181 210º 9.08 2.100 53.30 -3.76 144 162 173 177 240º 1.22 1.136 10.19 8.89 62 78 89 93 270º 0.75 1.804 11.26 5.13 35 41 45 47 300º 0.95 1.587 11.65 6.17 43 51 56 58 330º 4.31 1.542 25.34 5.70 101 119 130 135
0º-360º 100.00 2.131 51.90 -3.57 155 170 180 184
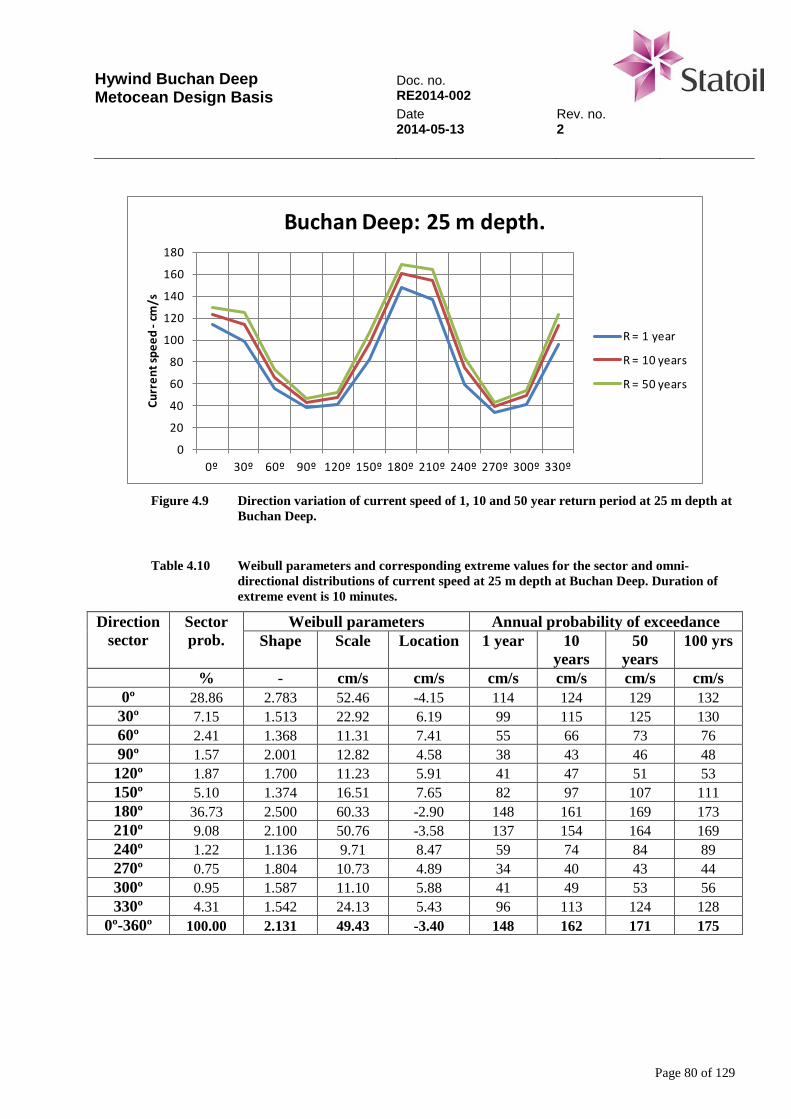
Hywind Buchan Deep Metocean Design Basis
Doc. no. RE2014-002 Date Rev. no. 2014-05-13 2
Page 80 of 129
0
20
40
60
80
100
120
140
160
180
0º 30º 60º 90º 120º 150º 180º 210º 240º 270º 300º 330º
Curr
ent s
peed
-cm
/s
Buchan Deep: 25 m depth.
R = 1 year
R = 10 years
R = 50 years
Figure 4.9 Direction variation of current speed of 1, 10 and 50 year return period at 25 m depth at
Buchan Deep.
Table 4.10 Weibull parameters and corresponding extreme values for the sector and omni-
directional distributions of current speed at 25 m depth at Buchan Deep. Duration of extreme event is 10 minutes.
Direction sector
Sector prob.
Weibull parameters Annual probability of exceedance Shape Scale Location 1 year 10
years 50
years 100 yrs
% - cm/s cm/s cm/s cm/s cm/s cm/s 0º 28.86 2.783 52.46 -4.15 114 124 129 132 30º 7.15 1.513 22.92 6.19 99 115 125 130 60º 2.41 1.368 11.31 7.41 55 66 73 76 90º 1.57 2.001 12.82 4.58 38 43 46 48 120º 1.87 1.700 11.23 5.91 41 47 51 53 150º 5.10 1.374 16.51 7.65 82 97 107 111 180º 36.73 2.500 60.33 -2.90 148 161 169 173 210º 9.08 2.100 50.76 -3.58 137 154 164 169 240º 1.22 1.136 9.71 8.47 59 74 84 89 270º 0.75 1.804 10.73 4.89 34 40 43 44 300º 0.95 1.587 11.10 5.88 41 49 53 56 330º 4.31 1.542 24.13 5.43 96 113 124 128
0º-360º 100.00 2.131 49.43 -3.40 148 162 171 175

Hywind Buchan Deep Metocean Design Basis
Doc. no. RE2014-002 Date Rev. no. 2014-05-13 2
Page 81 of 129
0
20
40
60
80
100
120
140
160
180
0º 30º 60º 90º 120º 150º 180º 210º 240º 270º 300º 330º
Curr
ent s
peed
-cm
/s
Buchan deep: 40 m depth
R = 1 year
R = 10 years
R = 50 years
Figure 4.10 Direction variation of current speed of 1, 10 and 50 year return period at 40 m depth at
Buchan Deep.
Table 4.11 Weibull parameters and corresponding extreme values for the sector and omni-
directional distributions of current speed at 40 m depth at Buchan Deep. Duration of extreme event is 10 minutes.
Direction sector
Sector prob.
Weibull parameters Annual probability of exceedance Shape Scale Location 1 year 10
years 50
years 100 yrs
% - cm/s cm/s cm/s cm/s cm/s cm/s 0º 32.44 2.767 50.85 -4.66 111 120 126 128 30º 5.95 1.636 18.60 4.92 72 83 90 92 60º 1.75 1.759 9.74 5.04 34 39 43 44 90º 1.13 2.066 8.80 4.09 26 29 31 32 120º 1.26 2.120 9.85 3.98 28 31 34 35 150º 3.17 1.593 12.47 5.80 50 58 63 65 180º 37.21 2.600 57.79 -3.92 136 147 154 157 210º 11.17 2.200 53.77 -7.27 136 153 163 167 240º 1.07 2.275 10.62 3.89 28 31 33 34 270º 0.64 3.091 11.47 1.19 22 24 25 26 300º 0.82 2.294 9.74 3.70 25 28 30 31 330º 3.40 1.551 19.72 4.34 77 90 99 102
0º-360º 100.00 2.224 50.36 -5.85 141 155 163 167
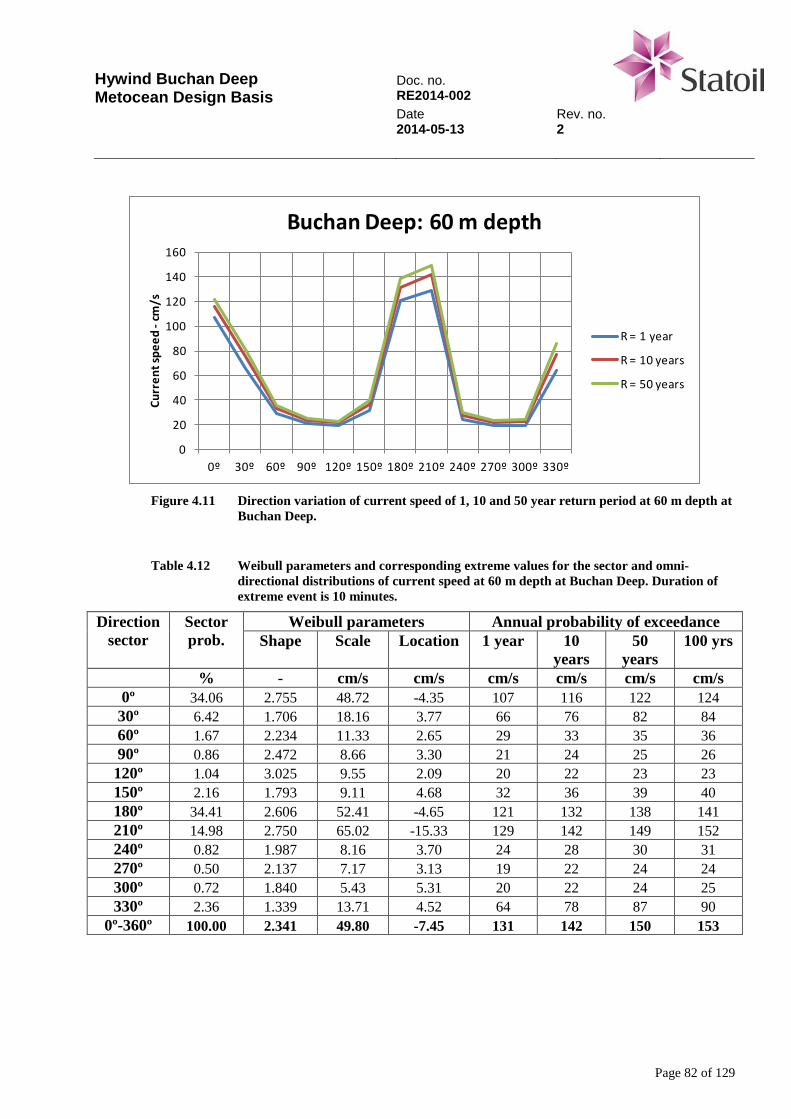
Hywind Buchan Deep Metocean Design Basis
Doc. no. RE2014-002 Date Rev. no. 2014-05-13 2
Page 82 of 129
0
20
40
60
80
100
120
140
160
0º 30º 60º 90º 120º 150º 180º 210º 240º 270º 300º 330º
Curr
ent s
peed
-cm
/s
Buchan Deep: 60 m depth
R = 1 year
R = 10 years
R = 50 years
Figure 4.11 Direction variation of current speed of 1, 10 and 50 year return period at 60 m depth at
Buchan Deep.
Table 4.12 Weibull parameters and corresponding extreme values for the sector and omni-
directional distributions of current speed at 60 m depth at Buchan Deep. Duration of extreme event is 10 minutes.
Direction sector
Sector prob.
Weibull parameters Annual probability of exceedance Shape Scale Location 1 year 10
years 50
years 100 yrs
% - cm/s cm/s cm/s cm/s cm/s cm/s 0º 34.06 2.755 48.72 -4.35 107 116 122 124 30º 6.42 1.706 18.16 3.77 66 76 82 84 60º 1.67 2.234 11.33 2.65 29 33 35 36 90º 0.86 2.472 8.66 3.30 21 24 25 26 120º 1.04 3.025 9.55 2.09 20 22 23 23 150º 2.16 1.793 9.11 4.68 32 36 39 40 180º 34.41 2.606 52.41 -4.65 121 132 138 141 210º 14.98 2.750 65.02 -15.33 129 142 149 152 240º 0.82 1.987 8.16 3.70 24 28 30 31 270º 0.50 2.137 7.17 3.13 19 22 24 24 300º 0.72 1.840 5.43 5.31 20 22 24 25 330º 2.36 1.339 13.71 4.52 64 78 87 90
0º-360º 100.00 2.341 49.80 -7.45 131 142 150 153
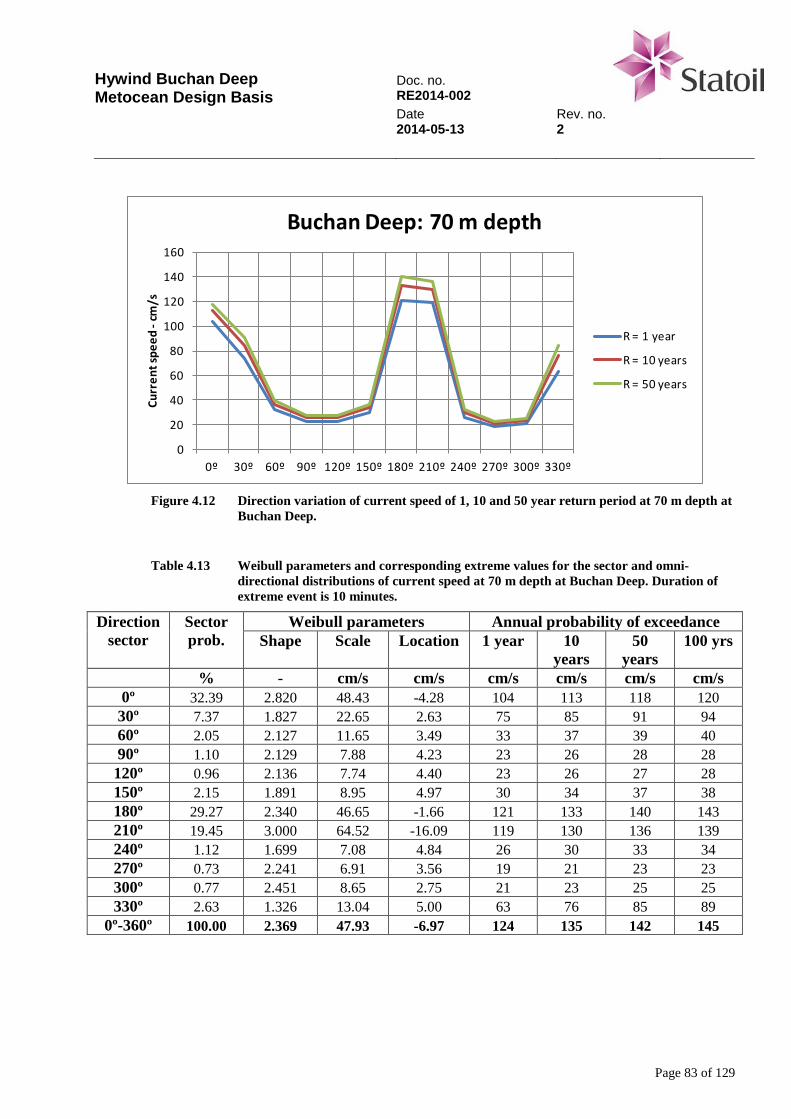
Hywind Buchan Deep Metocean Design Basis
Doc. no. RE2014-002 Date Rev. no. 2014-05-13 2
Page 83 of 129
0
20
40
60
80
100
120
140
160
0º 30º 60º 90º 120º 150º 180º 210º 240º 270º 300º 330º
Curr
ent s
peed
-cm
/s
Buchan Deep: 70 m depth
R = 1 year
R = 10 years
R = 50 years
Figure 4.12 Direction variation of current speed of 1, 10 and 50 year return period at 70 m depth at
Buchan Deep.
Table 4.13 Weibull parameters and corresponding extreme values for the sector and omni-
directional distributions of current speed at 70 m depth at Buchan Deep. Duration of extreme event is 10 minutes.
Direction sector
Sector prob.
Weibull parameters Annual probability of exceedance Shape Scale Location 1 year 10
years 50
years 100 yrs
% - cm/s cm/s cm/s cm/s cm/s cm/s 0º 32.39 2.820 48.43 -4.28 104 113 118 120 30º 7.37 1.827 22.65 2.63 75 85 91 94 60º 2.05 2.127 11.65 3.49 33 37 39 40 90º 1.10 2.129 7.88 4.23 23 26 28 28 120º 0.96 2.136 7.74 4.40 23 26 27 28 150º 2.15 1.891 8.95 4.97 30 34 37 38 180º 29.27 2.340 46.65 -1.66 121 133 140 143 210º 19.45 3.000 64.52 -16.09 119 130 136 139 240º 1.12 1.699 7.08 4.84 26 30 33 34 270º 0.73 2.241 6.91 3.56 19 21 23 23 300º 0.77 2.451 8.65 2.75 21 23 25 25 330º 2.63 1.326 13.04 5.00 63 76 85 89
0º-360º 100.00 2.369 47.93 -6.97 124 135 142 145
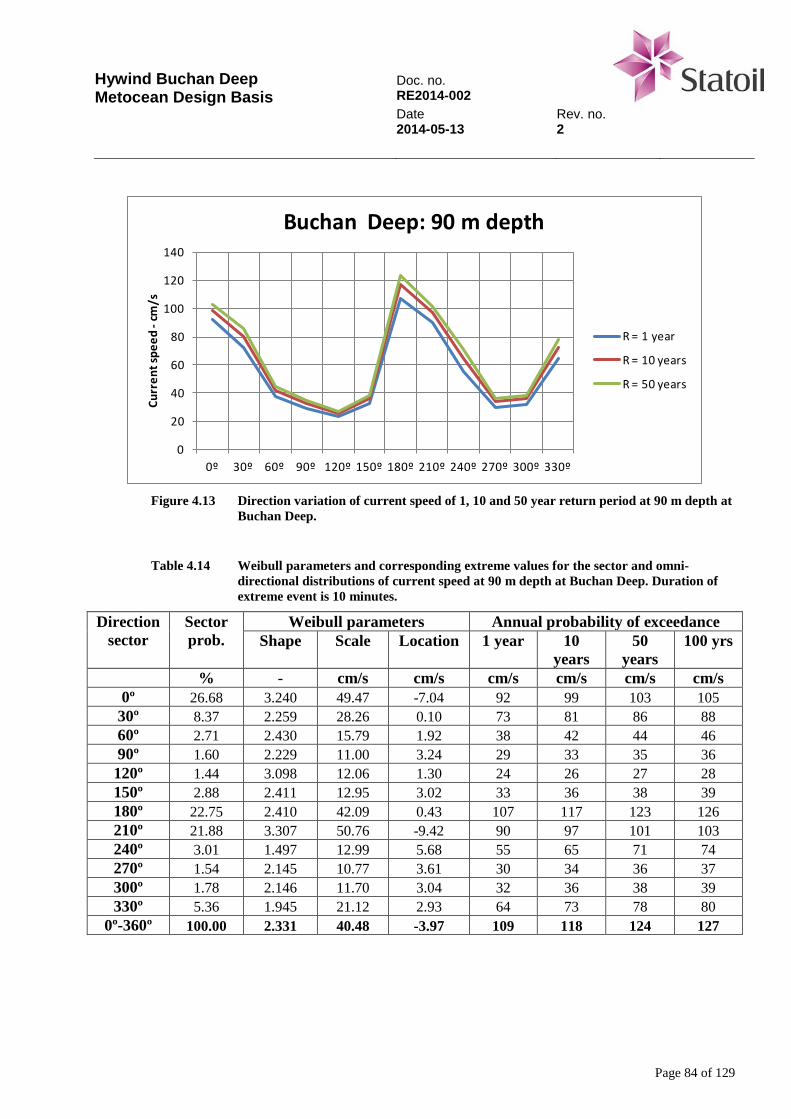
Hywind Buchan Deep Metocean Design Basis
Doc. no. RE2014-002 Date Rev. no. 2014-05-13 2
Page 84 of 129
0
20
40
60
80
100
120
140
0º 30º 60º 90º 120º 150º 180º 210º 240º 270º 300º 330º
Curr
ent s
peed
-cm
/s
Buchan Deep: 90 m depth
R = 1 year
R = 10 years
R = 50 years
Figure 4.13 Direction variation of current speed of 1, 10 and 50 year return period at 90 m depth at
Buchan Deep.
Table 4.14 Weibull parameters and corresponding extreme values for the sector and omni-
directional distributions of current speed at 90 m depth at Buchan Deep. Duration of extreme event is 10 minutes.
Direction sector
Sector prob.
Weibull parameters Annual probability of exceedance Shape Scale Location 1 year 10
years 50
years 100 yrs
% - cm/s cm/s cm/s cm/s cm/s cm/s 0º 26.68 3.240 49.47 -7.04 92 99 103 105 30º 8.37 2.259 28.26 0.10 73 81 86 88 60º 2.71 2.430 15.79 1.92 38 42 44 46 90º 1.60 2.229 11.00 3.24 29 33 35 36 120º 1.44 3.098 12.06 1.30 24 26 27 28 150º 2.88 2.411 12.95 3.02 33 36 38 39 180º 22.75 2.410 42.09 0.43 107 117 123 126 210º 21.88 3.307 50.76 -9.42 90 97 101 103 240º 3.01 1.497 12.99 5.68 55 65 71 74 270º 1.54 2.145 10.77 3.61 30 34 36 37 300º 1.78 2.146 11.70 3.04 32 36 38 39 330º 5.36 1.945 21.12 2.93 64 73 78 80
0º-360º 100.00 2.331 40.48 -3.97 109 118 124 127
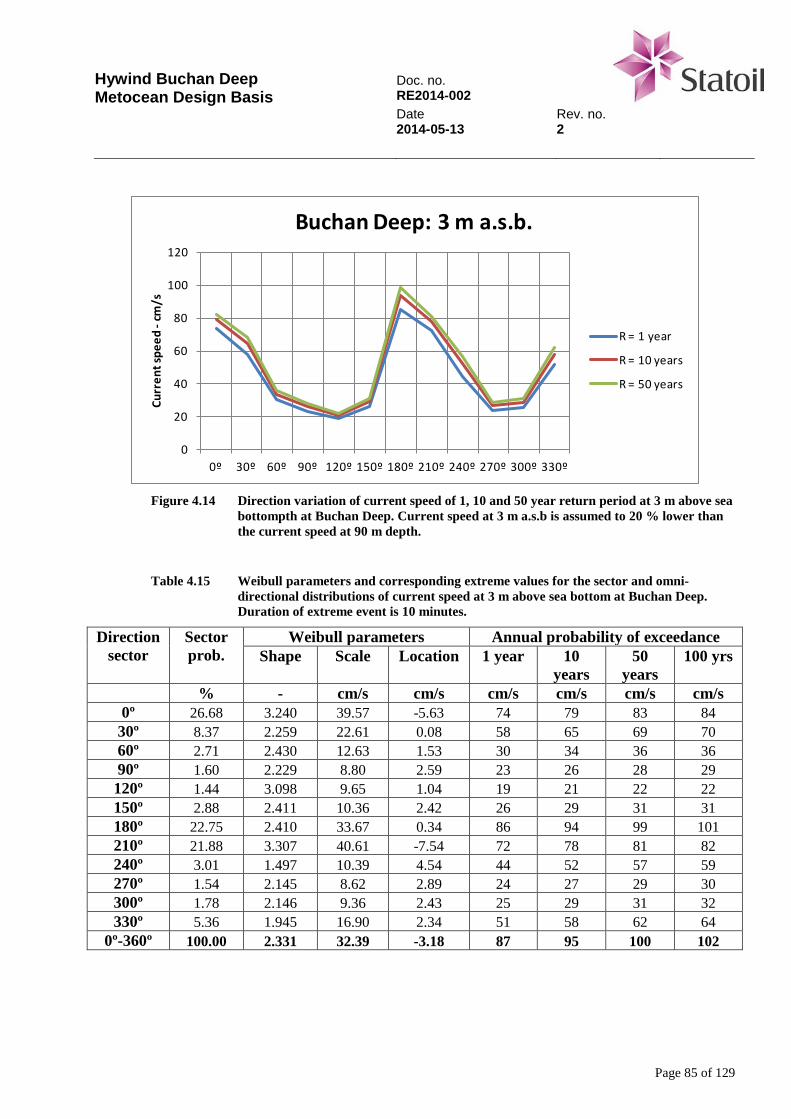
Hywind Buchan Deep Metocean Design Basis
Doc. no. RE2014-002 Date Rev. no. 2014-05-13 2
Page 85 of 129
0
20
40
60
80
100
120
0º 30º 60º 90º 120º 150º 180º 210º 240º 270º 300º 330º
Curr
ent s
peed
-cm
/s
Buchan Deep: 3 m a.s.b.
R = 1 year
R = 10 years
R = 50 years
Figure 4.14 Direction variation of current speed of 1, 10 and 50 year return period at 3 m above sea
bottompth at Buchan Deep. Current speed at 3 m a.s.b is assumed to 20 % lower than the current speed at 90 m depth.
Table 4.15 Weibull parameters and corresponding extreme values for the sector and omni-
directional distributions of current speed at 3 m above sea bottom at Buchan Deep. Duration of extreme event is 10 minutes.
Direction sector
Sector prob.
Weibull parameters Annual probability of exceedance Shape Scale Location 1 year 10
years 50
years 100 yrs
% - cm/s cm/s cm/s cm/s cm/s cm/s 0º 26.68 3.240 39.57 -5.63 74 79 83 84 30º 8.37 2.259 22.61 0.08 58 65 69 70 60º 2.71 2.430 12.63 1.53 30 34 36 36 90º 1.60 2.229 8.80 2.59 23 26 28 29 120º 1.44 3.098 9.65 1.04 19 21 22 22 150º 2.88 2.411 10.36 2.42 26 29 31 31 180º 22.75 2.410 33.67 0.34 86 94 99 101 210º 21.88 3.307 40.61 -7.54 72 78 81 82 240º 3.01 1.497 10.39 4.54 44 52 57 59 270º 1.54 2.145 8.62 2.89 24 27 29 30 300º 1.78 2.146 9.36 2.43 25 29 31 32 330º 5.36 1.945 16.90 2.34 51 58 62 64
0º-360º 100.00 2.331 32.39 -3.18 87 95 100 102
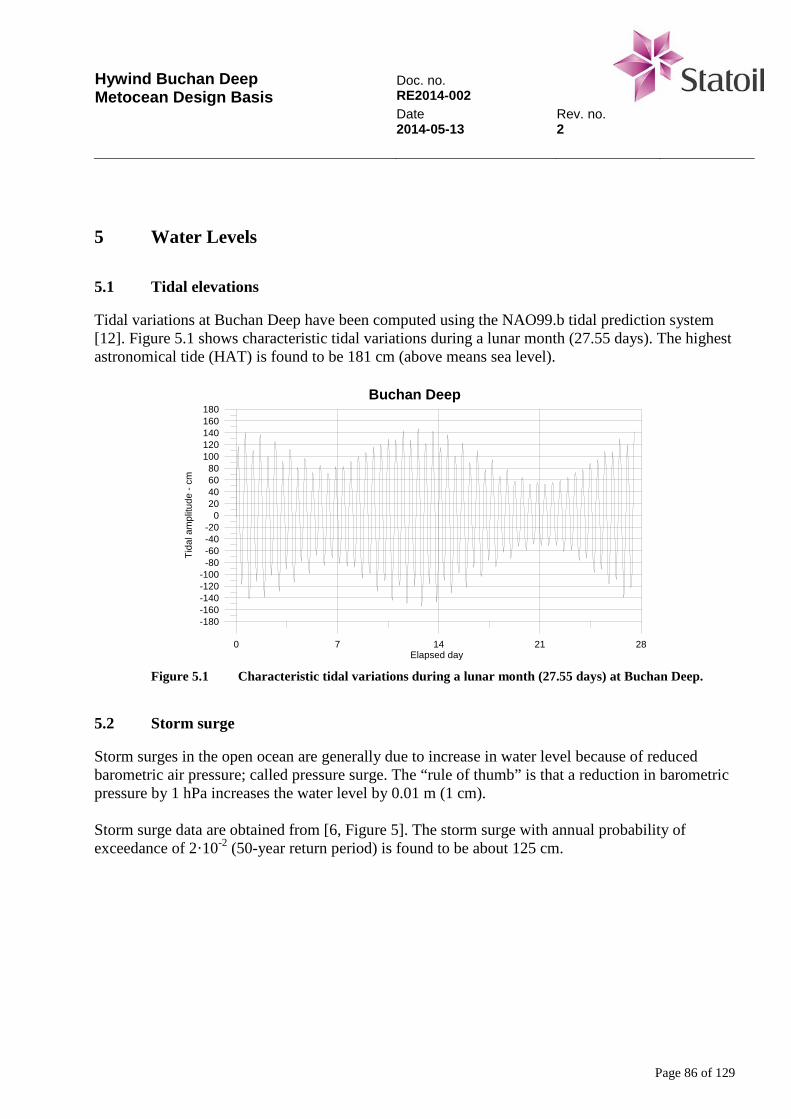
Hywind Buchan Deep Metocean Design Basis
Doc. no. RE2014-002 Date Rev. no. 2014-05-13 2
Page 86 of 129
5 Water Levels
5.1 Tidal elevations
Tidal variations at Buchan Deep have been computed using the NAO99.b tidal prediction system [12]. Figure 5.1 shows characteristic tidal variations during a lunar month (27.55 days). The highest astronomical tide (HAT) is found to be 181 cm (above means sea level).
0 7 14 21 28Elapsed day
-180-160-140-120-100
-80-60-40-20
020406080
100120140160180
Tida
l am
plitu
d e -
cm
Buchan Deep
Figure 5.1 Characteristic tidal variations during a lunar month (27.55 days) at Buchan Deep.
5.2 Storm surge
Storm surges in the open ocean are generally due to increase in water level because of reduced barometric air pressure; called pressure surge. The “rule of thumb” is that a reduction in barometric pressure by 1 hPa increases the water level by 0.01 m (1 cm). Storm surge data are obtained from [6, Figure 5]. The storm surge with annual probability of exceedance of 2·10-2 (50-year return period) is found to be about 125 cm.
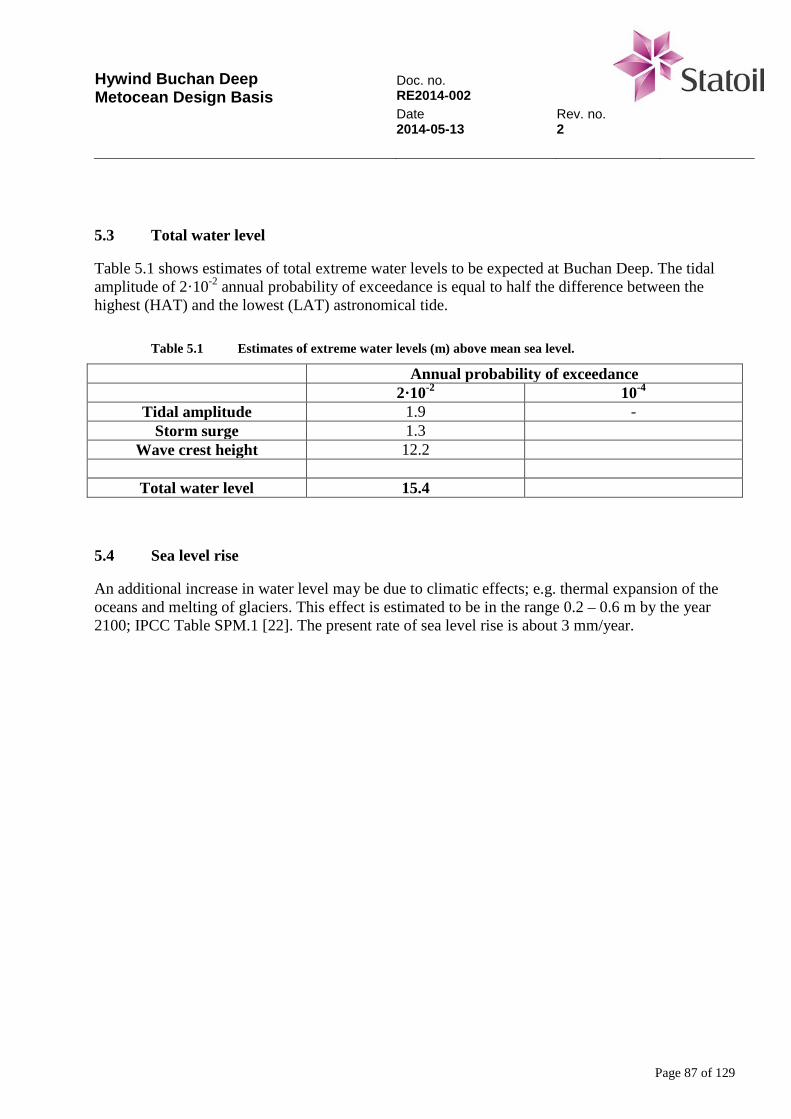
Hywind Buchan Deep Metocean Design Basis
Doc. no. RE2014-002 Date Rev. no. 2014-05-13 2
Page 87 of 129
5.3 Total water level
Table 5.1 shows estimates of total extreme water levels to be expected at Buchan Deep. The tidal amplitude of 2·10-2 annual probability of exceedance is equal to half the difference between the highest (HAT) and the lowest (LAT) astronomical tide.
Table 5.1 Estimates of extreme water levels (m) above mean sea level.
Annual probability of exceedance 2·10-2 10-4
Tidal amplitude 1.9 - Storm surge 1.3
Wave crest height 12.2
Total water level 15.4
5.4 Sea level rise
An additional increase in water level may be due to climatic effects; e.g. thermal expansion of the oceans and melting of glaciers. This effect is estimated to be in the range 0.2 – 0.6 m by the year 2100; IPCC Table SPM.1 [22]. The present rate of sea level rise is about 3 mm/year.
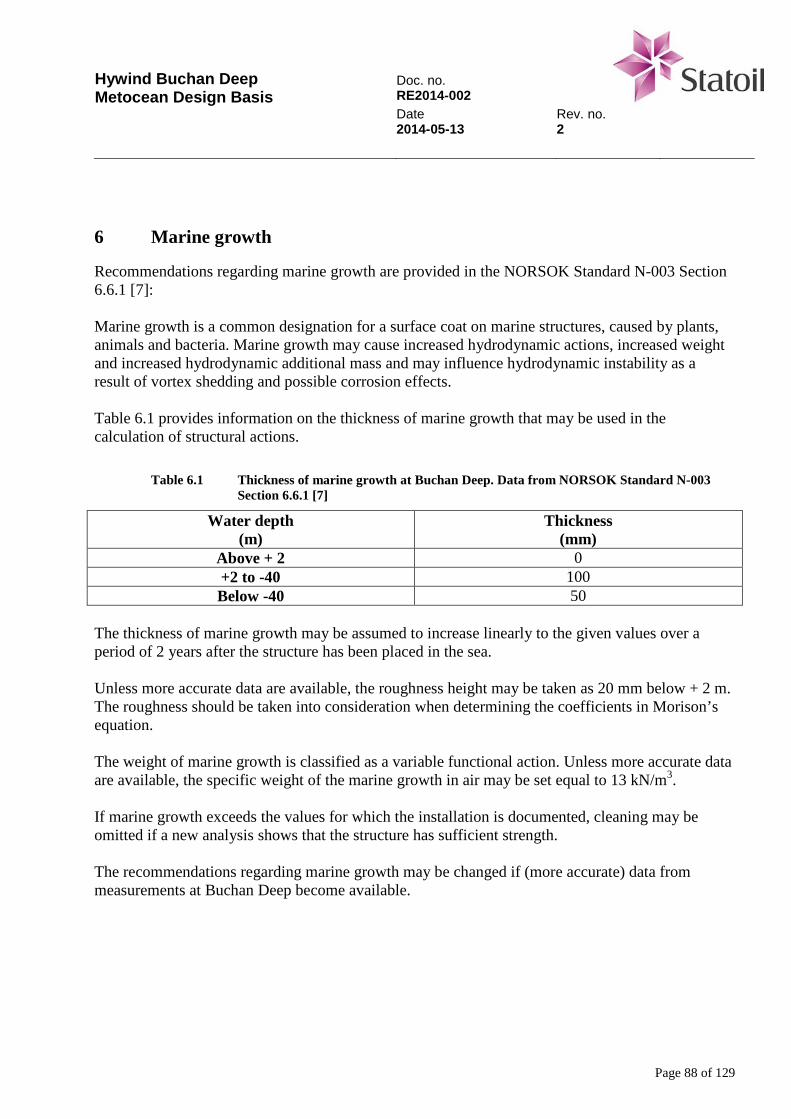
Hywind Buchan Deep Metocean Design Basis
Doc. no. RE2014-002 Date Rev. no. 2014-05-13 2
Page 88 of 129
6 Marine growth
Recommendations regarding marine growth are provided in the NORSOK Standard N-003 Section 6.6.1 [7]: Marine growth is a common designation for a surface coat on marine structures, caused by plants, animals and bacteria. Marine growth may cause increased hydrodynamic actions, increased weight and increased hydrodynamic additional mass and may influence hydrodynamic instability as a result of vortex shedding and possible corrosion effects. Table 6.1 provides information on the thickness of marine growth that may be used in the calculation of structural actions.
Table 6.1 Thickness of marine growth at Buchan Deep. Data from NORSOK Standard N-003 Section 6.6.1 [7]
Water depth (m)
Thickness (mm)
Above + 2 0 +2 to -40 100 Below -40 50
The thickness of marine growth may be assumed to increase linearly to the given values over a period of 2 years after the structure has been placed in the sea. Unless more accurate data are available, the roughness height may be taken as 20 mm below + 2 m. The roughness should be taken into consideration when determining the coefficients in Morison’s equation. The weight of marine growth is classified as a variable functional action. Unless more accurate data are available, the specific weight of the marine growth in air may be set equal to 13 kN/m3. If marine growth exceeds the values for which the installation is documented, cleaning may be omitted if a new analysis shows that the structure has sufficient strength. The recommendations regarding marine growth may be changed if (more accurate) data from measurements at Buchan Deep become available.
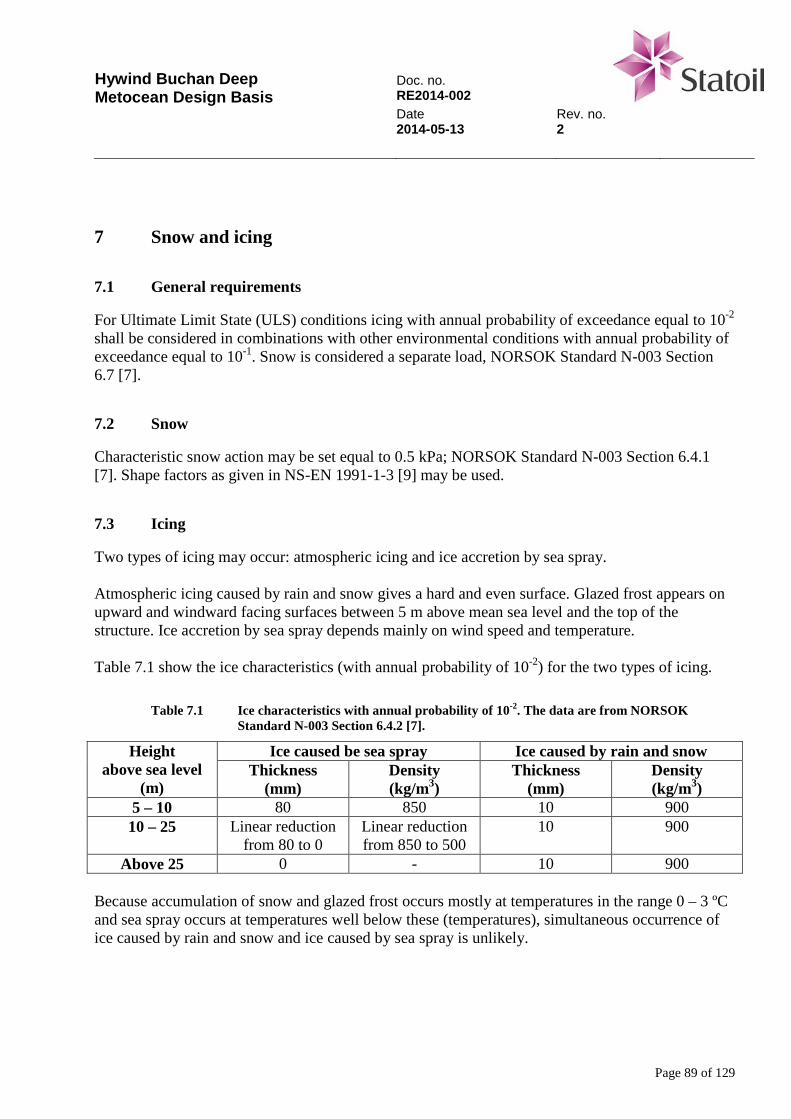
Hywind Buchan Deep Metocean Design Basis
Doc. no. RE2014-002 Date Rev. no. 2014-05-13 2
Page 89 of 129
7 Snow and icing
7.1 General requirements
For Ultimate Limit State (ULS) conditions icing with annual probability of exceedance equal to 10-2 shall be considered in combinations with other environmental conditions with annual probability of exceedance equal to 10-1. Snow is considered a separate load, NORSOK Standard N-003 Section 6.7 [7].
7.2 Snow
Characteristic snow action may be set equal to 0.5 kPa; NORSOK Standard N-003 Section 6.4.1 [7]. Shape factors as given in NS-EN 1991-1-3 [9] may be used.
7.3 Icing
Two types of icing may occur: atmospheric icing and ice accretion by sea spray. Atmospheric icing caused by rain and snow gives a hard and even surface. Glazed frost appears on upward and windward facing surfaces between 5 m above mean sea level and the top of the structure. Ice accretion by sea spray depends mainly on wind speed and temperature. Table 7.1 show the ice characteristics (with annual probability of 10-2) for the two types of icing.
Table 7.1 Ice characteristics with annual probability of 10-2. The data are from NORSOK Standard N-003 Section 6.4.2 [7].
Height above sea level
(m)
Ice caused be sea spray Ice caused by rain and snow Thickness
(mm) Density (kg/m3)
Thickness (mm)
Density (kg/m3)
5 – 10 80 850 10 900 10 – 25 Linear reduction
from 80 to 0 Linear reduction from 850 to 500
10 900
Above 25 0 - 10 900 Because accumulation of snow and glazed frost occurs mostly at temperatures in the range 0 – 3 ºC and sea spray occurs at temperatures well below these (temperatures), simultaneous occurrence of ice caused by rain and snow and ice caused by sea spray is unlikely.
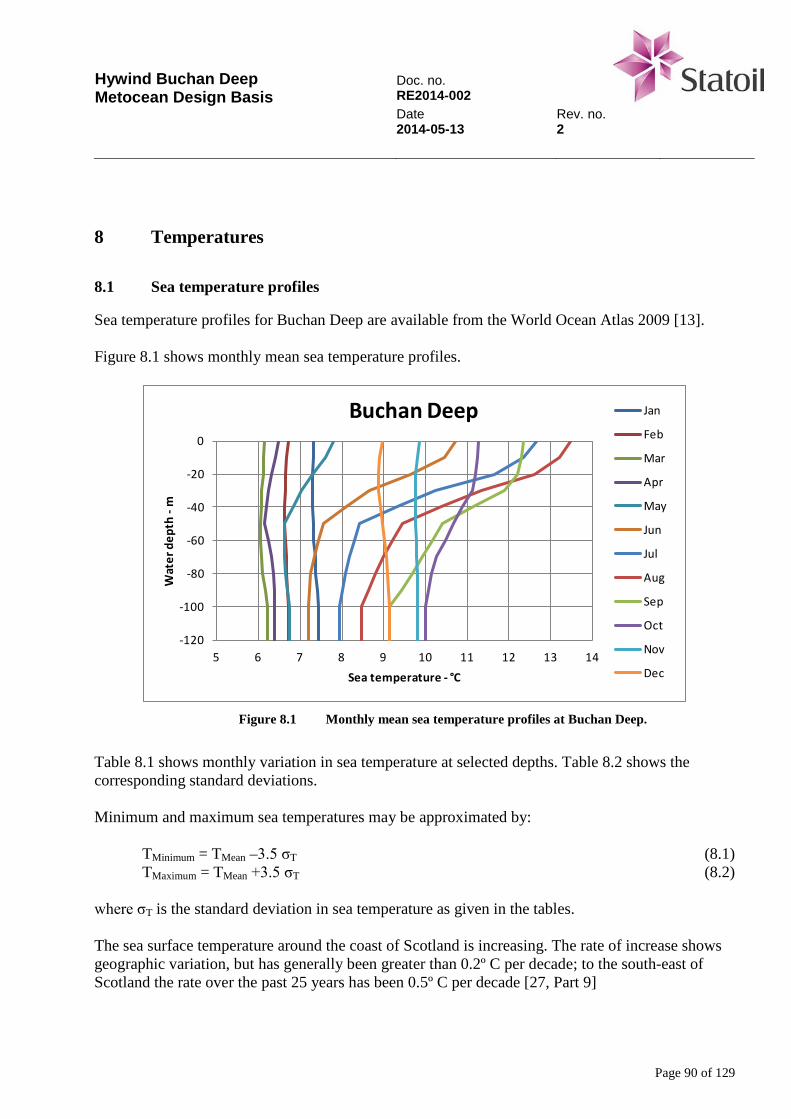
Hywind Buchan Deep Metocean Design Basis
Doc. no. RE2014-002 Date Rev. no. 2014-05-13 2
Page 90 of 129
8 Temperatures
8.1 Sea temperature profiles
Sea temperature profiles for Buchan Deep are available from the World Ocean Atlas 2009 [13]. Figure 8.1 shows monthly mean sea temperature profiles.
-120
-100
-80
-60
-40
-20
0
5 6 7 8 9 10 11 12 13 14
Wat
er d
epth
-m
Sea temperature - °C
Buchan Deep Jan
Feb
Mar
Apr
May
Jun
Jul
Aug
Sep
Oct
Nov
Dec
Figure 8.1 Monthly mean sea temperature profiles at Buchan Deep.
Table 8.1 shows monthly variation in sea temperature at selected depths. Table 8.2 shows the corresponding standard deviations. Minimum and maximum sea temperatures may be approximated by:
TMinimum = TMean –3.5 σT (8.1) TMaximum = TMean +3.5 σT (8.2)
where σT is the standard deviation in sea temperature as given in the tables. The sea surface temperature around the coast of Scotland is increasing. The rate of increase shows geographic variation, but has generally been greater than 0.2º C per decade; to the south-east of Scotland the rate over the past 25 years has been 0.5º C per decade [27, Part 9]
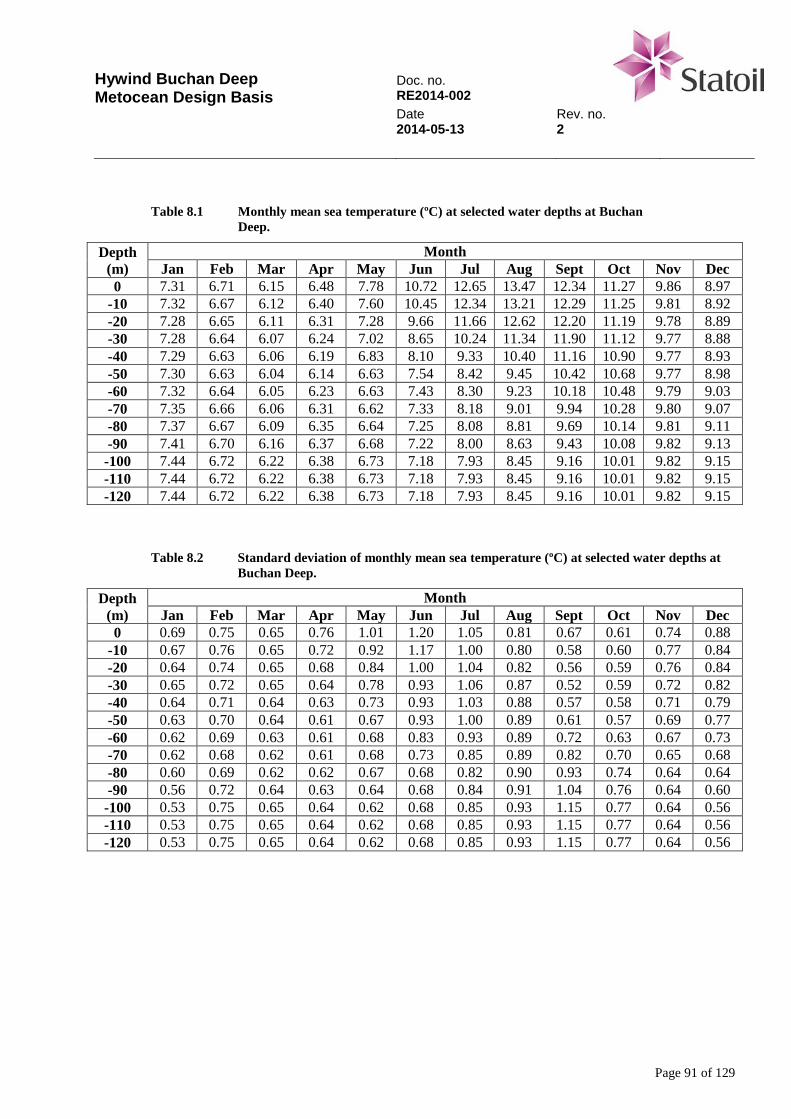
Hywind Buchan Deep Metocean Design Basis
Doc. no. RE2014-002 Date Rev. no. 2014-05-13 2
Page 91 of 129
Table 8.1 Monthly mean sea temperature (ºC) at selected water depths at Buchan Deep.
Depth (m)
Month Jan Feb Mar Apr May Jun Jul Aug Sept Oct Nov Dec
0 7.31 6.71 6.15 6.48 7.78 10.72 12.65 13.47 12.34 11.27 9.86 8.97 -10 7.32 6.67 6.12 6.40 7.60 10.45 12.34 13.21 12.29 11.25 9.81 8.92 -20 7.28 6.65 6.11 6.31 7.28 9.66 11.66 12.62 12.20 11.19 9.78 8.89 -30 7.28 6.64 6.07 6.24 7.02 8.65 10.24 11.34 11.90 11.12 9.77 8.88 -40 7.29 6.63 6.06 6.19 6.83 8.10 9.33 10.40 11.16 10.90 9.77 8.93 -50 7.30 6.63 6.04 6.14 6.63 7.54 8.42 9.45 10.42 10.68 9.77 8.98 -60 7.32 6.64 6.05 6.23 6.63 7.43 8.30 9.23 10.18 10.48 9.79 9.03 -70 7.35 6.66 6.06 6.31 6.62 7.33 8.18 9.01 9.94 10.28 9.80 9.07 -80 7.37 6.67 6.09 6.35 6.64 7.25 8.08 8.81 9.69 10.14 9.81 9.11 -90 7.41 6.70 6.16 6.37 6.68 7.22 8.00 8.63 9.43 10.08 9.82 9.13
-100 7.44 6.72 6.22 6.38 6.73 7.18 7.93 8.45 9.16 10.01 9.82 9.15 -110 7.44 6.72 6.22 6.38 6.73 7.18 7.93 8.45 9.16 10.01 9.82 9.15 -120 7.44 6.72 6.22 6.38 6.73 7.18 7.93 8.45 9.16 10.01 9.82 9.15
Table 8.2 Standard deviation of monthly mean sea temperature (ºC) at selected water depths at Buchan Deep.
Depth (m)
Month Jan Feb Mar Apr May Jun Jul Aug Sept Oct Nov Dec
0 0.69 0.75 0.65 0.76 1.01 1.20 1.05 0.81 0.67 0.61 0.74 0.88 -10 0.67 0.76 0.65 0.72 0.92 1.17 1.00 0.80 0.58 0.60 0.77 0.84 -20 0.64 0.74 0.65 0.68 0.84 1.00 1.04 0.82 0.56 0.59 0.76 0.84 -30 0.65 0.72 0.65 0.64 0.78 0.93 1.06 0.87 0.52 0.59 0.72 0.82 -40 0.64 0.71 0.64 0.63 0.73 0.93 1.03 0.88 0.57 0.58 0.71 0.79 -50 0.63 0.70 0.64 0.61 0.67 0.93 1.00 0.89 0.61 0.57 0.69 0.77 -60 0.62 0.69 0.63 0.61 0.68 0.83 0.93 0.89 0.72 0.63 0.67 0.73 -70 0.62 0.68 0.62 0.61 0.68 0.73 0.85 0.89 0.82 0.70 0.65 0.68 -80 0.60 0.69 0.62 0.62 0.67 0.68 0.82 0.90 0.93 0.74 0.64 0.64 -90 0.56 0.72 0.64 0.63 0.64 0.68 0.84 0.91 1.04 0.76 0.64 0.60
-100 0.53 0.75 0.65 0.64 0.62 0.68 0.85 0.93 1.15 0.77 0.64 0.56 -110 0.53 0.75 0.65 0.64 0.62 0.68 0.85 0.93 1.15 0.77 0.64 0.56 -120 0.53 0.75 0.65 0.64 0.62 0.68 0.85 0.93 1.15 0.77 0.64 0.56
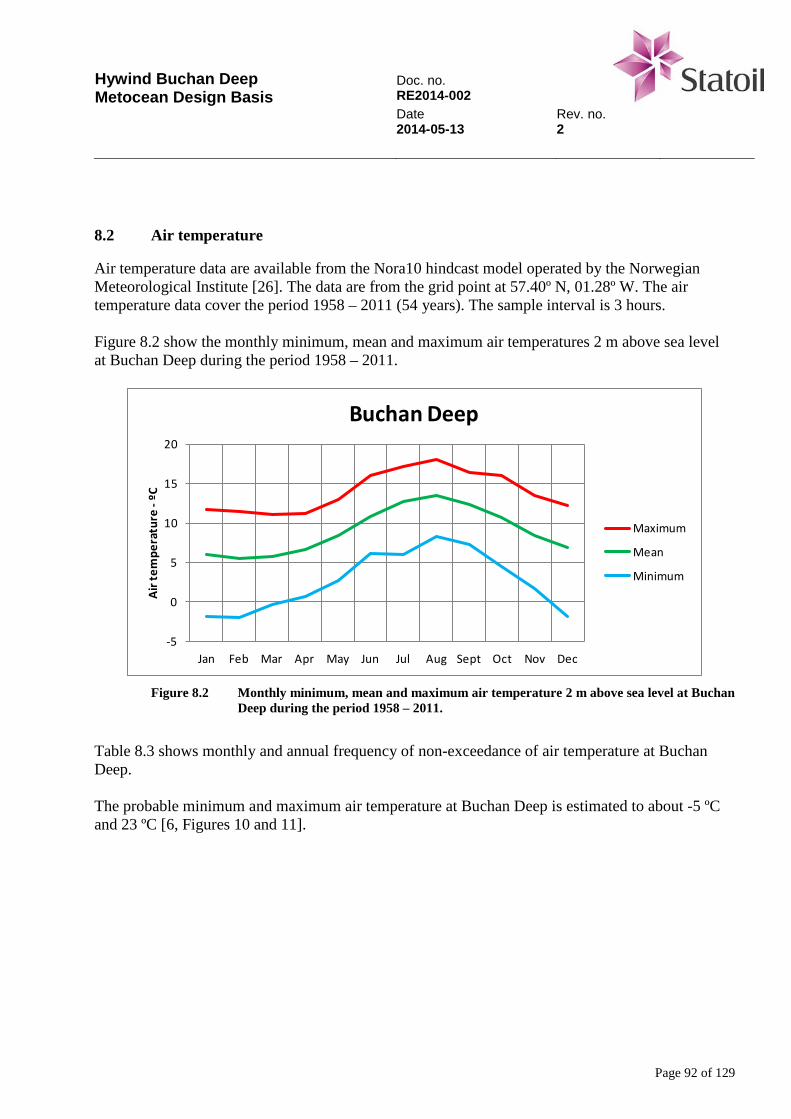
Hywind Buchan Deep Metocean Design Basis
Doc. no. RE2014-002 Date Rev. no. 2014-05-13 2
Page 92 of 129
8.2 Air temperature
Air temperature data are available from the Nora10 hindcast model operated by the Norwegian Meteorological Institute [26]. The data are from the grid point at 57.40º N, 01.28º W. The air temperature data cover the period 1958 – 2011 (54 years). The sample interval is 3 hours. Figure 8.2 show the monthly minimum, mean and maximum air temperatures 2 m above sea level at Buchan Deep during the period 1958 – 2011.
-5
0
5
10
15
20
Jan Feb Mar Apr May Jun Jul Aug Sept Oct Nov Dec
Air t
empe
ratu
re -
ºC
Buchan Deep
Maximum
Mean
Minimum
Figure 8.2 Monthly minimum, mean and maximum air temperature 2 m above sea level at Buchan
Deep during the period 1958 – 2011.
Table 8.3 shows monthly and annual frequency of non-exceedance of air temperature at Buchan Deep. The probable minimum and maximum air temperature at Buchan Deep is estimated to about -5 ºC and 23 ºC [6, Figures 10 and 11].
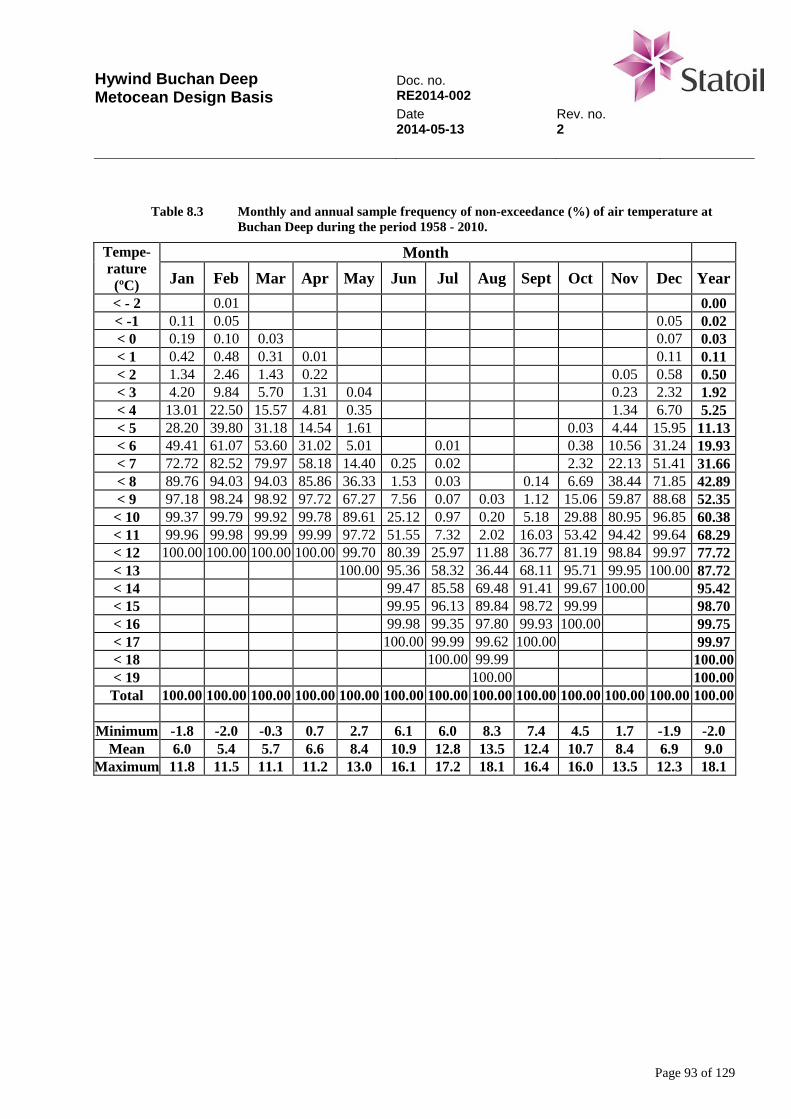
Hywind Buchan Deep Metocean Design Basis
Doc. no. RE2014-002 Date Rev. no. 2014-05-13 2
Page 93 of 129
Table 8.3 Monthly and annual sample frequency of non-exceedance (%) of air temperature at
Buchan Deep during the period 1958 - 2010.
Tempe- rature
(ºC)
Month Jan Feb Mar Apr May Jun Jul Aug Sept Oct Nov Dec Year
< - 2 0.01 0.00 < -1 0.11 0.05 0.05 0.02 < 0 0.19 0.10 0.03 0.07 0.03 < 1 0.42 0.48 0.31 0.01 0.11 0.11 < 2 1.34 2.46 1.43 0.22 0.05 0.58 0.50 < 3 4.20 9.84 5.70 1.31 0.04 0.23 2.32 1.92 < 4 13.01 22.50 15.57 4.81 0.35 1.34 6.70 5.25 < 5 28.20 39.80 31.18 14.54 1.61 0.03 4.44 15.95 11.13 < 6 49.41 61.07 53.60 31.02 5.01 0.01 0.38 10.56 31.24 19.93 < 7 72.72 82.52 79.97 58.18 14.40 0.25 0.02 2.32 22.13 51.41 31.66 < 8 89.76 94.03 94.03 85.86 36.33 1.53 0.03 0.14 6.69 38.44 71.85 42.89 < 9 97.18 98.24 98.92 97.72 67.27 7.56 0.07 0.03 1.12 15.06 59.87 88.68 52.35
< 10 99.37 99.79 99.92 99.78 89.61 25.12 0.97 0.20 5.18 29.88 80.95 96.85 60.38 < 11 99.96 99.98 99.99 99.99 97.72 51.55 7.32 2.02 16.03 53.42 94.42 99.64 68.29 < 12 100.00 100.00 100.00 100.00 99.70 80.39 25.97 11.88 36.77 81.19 98.84 99.97 77.72 < 13 100.00 95.36 58.32 36.44 68.11 95.71 99.95 100.00 87.72 < 14 99.47 85.58 69.48 91.41 99.67 100.00 95.42 < 15 99.95 96.13 89.84 98.72 99.99 98.70 < 16 99.98 99.35 97.80 99.93 100.00 99.75 < 17 100.00 99.99 99.62 100.00 99.97 < 18 100.00 99.99 100.00 < 19 100.00 100.00 Total 100.00 100.00 100.00 100.00 100.00 100.00 100.00 100.00 100.00 100.00 100.00 100.00 100.00
Minimum -1.8 -2.0 -0.3 0.7 2.7 6.1 6.0 8.3 7.4 4.5 1.7 -1.9 -2.0
Mean 6.0 5.4 5.7 6.6 8.4 10.9 12.8 13.5 12.4 10.7 8.4 6.9 9.0 Maximum 11.8 11.5 11.1 11.2 13.0 16.1 17.2 18.1 16.4 16.0 13.5 12.3 18.1
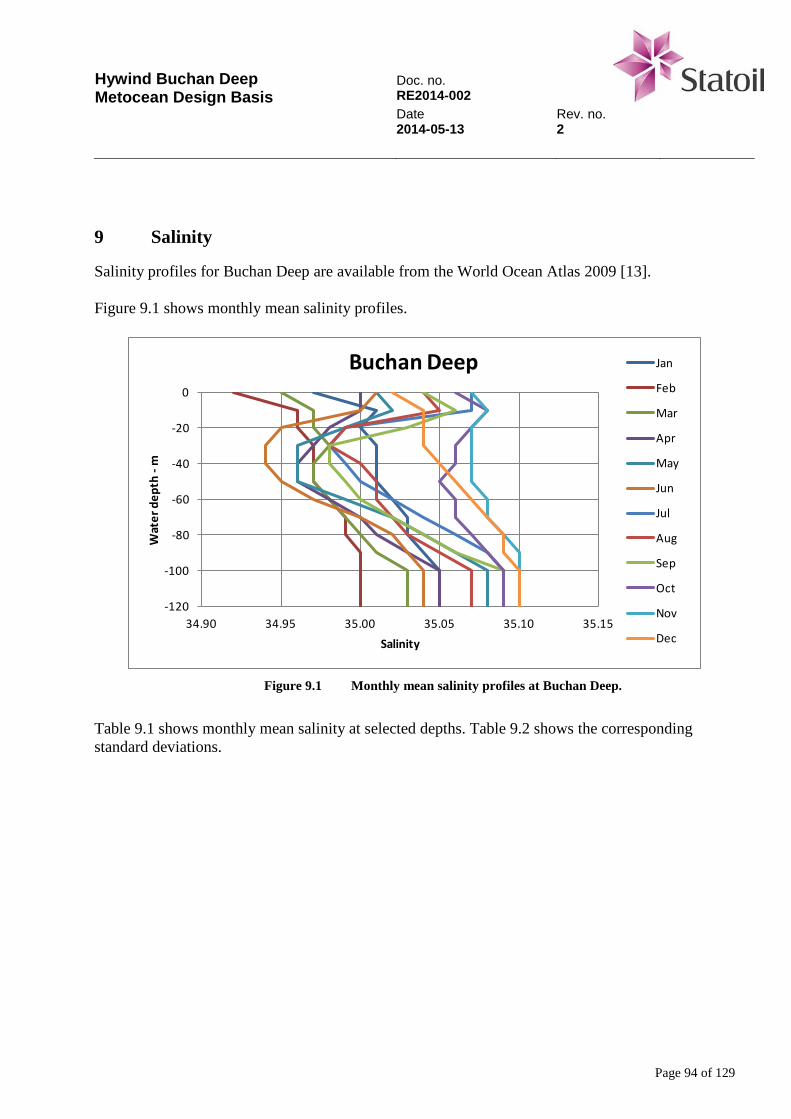
Hywind Buchan Deep Metocean Design Basis
Doc. no. RE2014-002 Date Rev. no. 2014-05-13 2
Page 94 of 129
9 Salinity
Salinity profiles for Buchan Deep are available from the World Ocean Atlas 2009 [13]. Figure 9.1 shows monthly mean salinity profiles.
-120
-100
-80
-60
-40
-20
0
34.90 34.95 35.00 35.05 35.10 35.15
Wat
er d
epth
-m
Salinity
Buchan Deep Jan
Feb
Mar
Apr
May
Jun
Jul
Aug
Sep
Oct
Nov
Dec
Figure 9.1 Monthly mean salinity profiles at Buchan Deep.
Table 9.1 shows monthly mean salinity at selected depths. Table 9.2 shows the corresponding standard deviations.
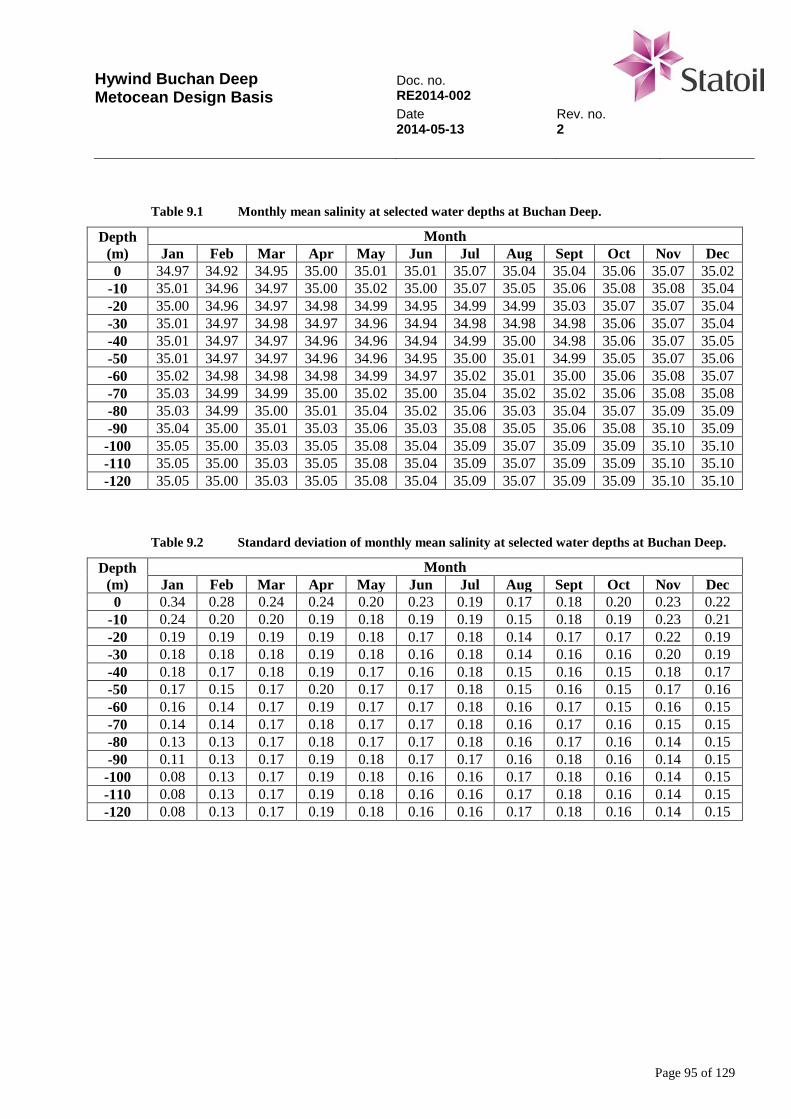
Hywind Buchan Deep Metocean Design Basis
Doc. no. RE2014-002 Date Rev. no. 2014-05-13 2
Page 95 of 129
Table 9.1 Monthly mean salinity at selected water depths at Buchan Deep.
Depth (m)
Month Jan Feb Mar Apr May Jun Jul Aug Sept Oct Nov Dec
0 34.97 34.92 34.95 35.00 35.01 35.01 35.07 35.04 35.04 35.06 35.07 35.02 -10 35.01 34.96 34.97 35.00 35.02 35.00 35.07 35.05 35.06 35.08 35.08 35.04 -20 35.00 34.96 34.97 34.98 34.99 34.95 34.99 34.99 35.03 35.07 35.07 35.04 -30 35.01 34.97 34.98 34.97 34.96 34.94 34.98 34.98 34.98 35.06 35.07 35.04 -40 35.01 34.97 34.97 34.96 34.96 34.94 34.99 35.00 34.98 35.06 35.07 35.05 -50 35.01 34.97 34.97 34.96 34.96 34.95 35.00 35.01 34.99 35.05 35.07 35.06 -60 35.02 34.98 34.98 34.98 34.99 34.97 35.02 35.01 35.00 35.06 35.08 35.07 -70 35.03 34.99 34.99 35.00 35.02 35.00 35.04 35.02 35.02 35.06 35.08 35.08 -80 35.03 34.99 35.00 35.01 35.04 35.02 35.06 35.03 35.04 35.07 35.09 35.09 -90 35.04 35.00 35.01 35.03 35.06 35.03 35.08 35.05 35.06 35.08 35.10 35.09
-100 35.05 35.00 35.03 35.05 35.08 35.04 35.09 35.07 35.09 35.09 35.10 35.10 -110 35.05 35.00 35.03 35.05 35.08 35.04 35.09 35.07 35.09 35.09 35.10 35.10 -120 35.05 35.00 35.03 35.05 35.08 35.04 35.09 35.07 35.09 35.09 35.10 35.10
Table 9.2 Standard deviation of monthly mean salinity at selected water depths at Buchan Deep.
Depth (m)
Month Jan Feb Mar Apr May Jun Jul Aug Sept Oct Nov Dec
0 0.34 0.28 0.24 0.24 0.20 0.23 0.19 0.17 0.18 0.20 0.23 0.22 -10 0.24 0.20 0.20 0.19 0.18 0.19 0.19 0.15 0.18 0.19 0.23 0.21 -20 0.19 0.19 0.19 0.19 0.18 0.17 0.18 0.14 0.17 0.17 0.22 0.19 -30 0.18 0.18 0.18 0.19 0.18 0.16 0.18 0.14 0.16 0.16 0.20 0.19 -40 0.18 0.17 0.18 0.19 0.17 0.16 0.18 0.15 0.16 0.15 0.18 0.17 -50 0.17 0.15 0.17 0.20 0.17 0.17 0.18 0.15 0.16 0.15 0.17 0.16 -60 0.16 0.14 0.17 0.19 0.17 0.17 0.18 0.16 0.17 0.15 0.16 0.15 -70 0.14 0.14 0.17 0.18 0.17 0.17 0.18 0.16 0.17 0.16 0.15 0.15 -80 0.13 0.13 0.17 0.18 0.17 0.17 0.18 0.16 0.17 0.16 0.14 0.15 -90 0.11 0.13 0.17 0.19 0.18 0.17 0.17 0.16 0.18 0.16 0.14 0.15
-100 0.08 0.13 0.17 0.19 0.18 0.16 0.16 0.17 0.18 0.16 0.14 0.15 -110 0.08 0.13 0.17 0.19 0.18 0.16 0.16 0.17 0.18 0.16 0.14 0.15 -120 0.08 0.13 0.17 0.19 0.18 0.16 0.16 0.17 0.18 0.16 0.14 0.15
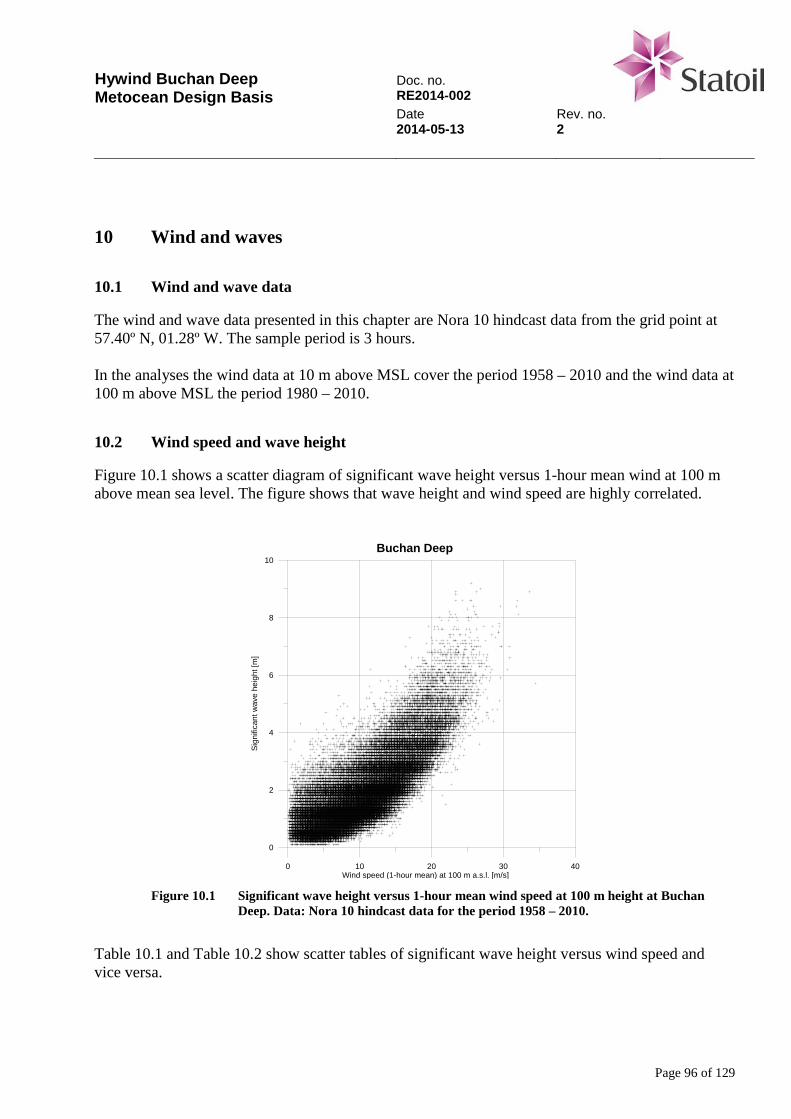
Hywind Buchan Deep Metocean Design Basis
Doc. no. RE2014-002 Date Rev. no. 2014-05-13 2
Page 96 of 129
10 Wind and waves
10.1 Wind and wave data
The wind and wave data presented in this chapter are Nora 10 hindcast data from the grid point at 57.40º N, 01.28º W. The sample period is 3 hours. In the analyses the wind data at 10 m above MSL cover the period 1958 – 2010 and the wind data at 100 m above MSL the period 1980 – 2010.
10.2 Wind speed and wave height
Figure 10.1 shows a scatter diagram of significant wave height versus 1-hour mean wind at 100 m above mean sea level. The figure shows that wave height and wind speed are highly correlated.
0 10 20 30 40Wind speed (1-hour mean) at 100 m a.s.l. [m/s]
0
2
4
6
8
10
Sig
nific
ant w
ave
heig
ht [m
]
Buchan Deep
Figure 10.1 Significant wave height versus 1-hour mean wind speed at 100 m height at Buchan
Deep. Data: Nora 10 hindcast data for the period 1958 – 2010.
Table 10.1 and Table 10.2 show scatter tables of significant wave height versus wind speed and vice versa.

Hywind Buchan Deep Metocean Design Basis
Doc. no. RE2014-002 Date Rev. no. 2014-05-13 2
Page 97 of 129
Figure 10.2 and Figure 10.3 show significant wave height as a function of 1-hour mean wind speed at 100 m above sea level and vice versa. The relationships obtain by fitting an exponential function and a power function to the data are:
( )UH S ⋅⋅= 0832.0exp719.0 (10.1)
5495.0873.7 SHU ⋅= (10.2) where HS is significant wave height and U is 1-hour mean wind speed at 100 m above sea level.
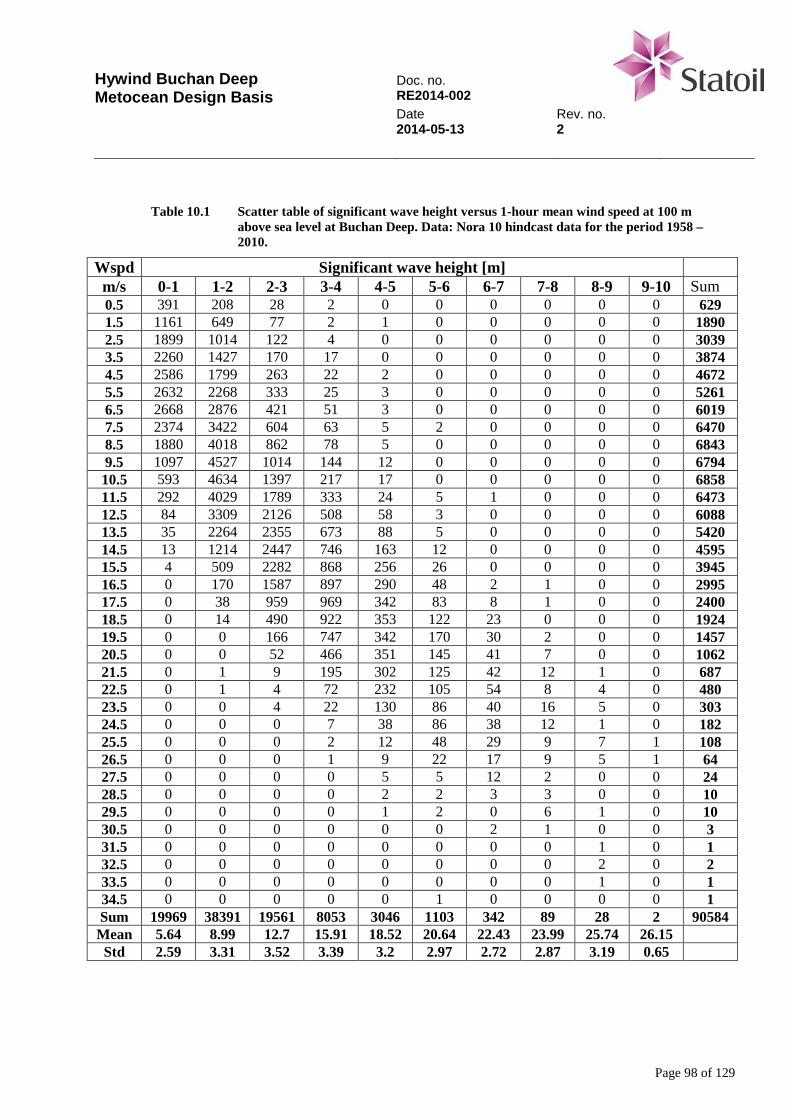
Hywind Buchan Deep Metocean Design Basis
Doc. no. RE2014-002 Date Rev. no. 2014-05-13 2
Page 98 of 129
Table 10.1 Scatter table of significant wave height versus 1-hour mean wind speed at 100 m
above sea level at Buchan Deep. Data: Nora 10 hindcast data for the period 1958 – 2010.
Wspd Significant wave height [m] m/s 0-1 1-2 2-3 3-4 4-5 5-6 6-7 7-8 8-9 9-10 Sum 0.5 391 208 28 2 0 0 0 0 0 0 629 1.5 1161 649 77 2 1 0 0 0 0 0 1890 2.5 1899 1014 122 4 0 0 0 0 0 0 3039 3.5 2260 1427 170 17 0 0 0 0 0 0 3874 4.5 2586 1799 263 22 2 0 0 0 0 0 4672 5.5 2632 2268 333 25 3 0 0 0 0 0 5261 6.5 2668 2876 421 51 3 0 0 0 0 0 6019 7.5 2374 3422 604 63 5 2 0 0 0 0 6470 8.5 1880 4018 862 78 5 0 0 0 0 0 6843 9.5 1097 4527 1014 144 12 0 0 0 0 0 6794 10.5 593 4634 1397 217 17 0 0 0 0 0 6858 11.5 292 4029 1789 333 24 5 1 0 0 0 6473 12.5 84 3309 2126 508 58 3 0 0 0 0 6088 13.5 35 2264 2355 673 88 5 0 0 0 0 5420 14.5 13 1214 2447 746 163 12 0 0 0 0 4595 15.5 4 509 2282 868 256 26 0 0 0 0 3945 16.5 0 170 1587 897 290 48 2 1 0 0 2995 17.5 0 38 959 969 342 83 8 1 0 0 2400 18.5 0 14 490 922 353 122 23 0 0 0 1924 19.5 0 0 166 747 342 170 30 2 0 0 1457 20.5 0 0 52 466 351 145 41 7 0 0 1062 21.5 0 1 9 195 302 125 42 12 1 0 687 22.5 0 1 4 72 232 105 54 8 4 0 480 23.5 0 0 4 22 130 86 40 16 5 0 303 24.5 0 0 0 7 38 86 38 12 1 0 182 25.5 0 0 0 2 12 48 29 9 7 1 108 26.5 0 0 0 1 9 22 17 9 5 1 64 27.5 0 0 0 0 5 5 12 2 0 0 24 28.5 0 0 0 0 2 2 3 3 0 0 10 29.5 0 0 0 0 1 2 0 6 1 0 10 30.5 0 0 0 0 0 0 2 1 0 0 3 31.5 0 0 0 0 0 0 0 0 1 0 1 32.5 0 0 0 0 0 0 0 0 2 0 2 33.5 0 0 0 0 0 0 0 0 1 0 1 34.5 0 0 0 0 0 1 0 0 0 0 1 Sum 19969 38391 19561 8053 3046 1103 342 89 28 2 90584 Mean 5.64 8.99 12.7 15.91 18.52 20.64 22.43 23.99 25.74 26.15 Std 2.59 3.31 3.52 3.39 3.2 2.97 2.72 2.87 3.19 0.65
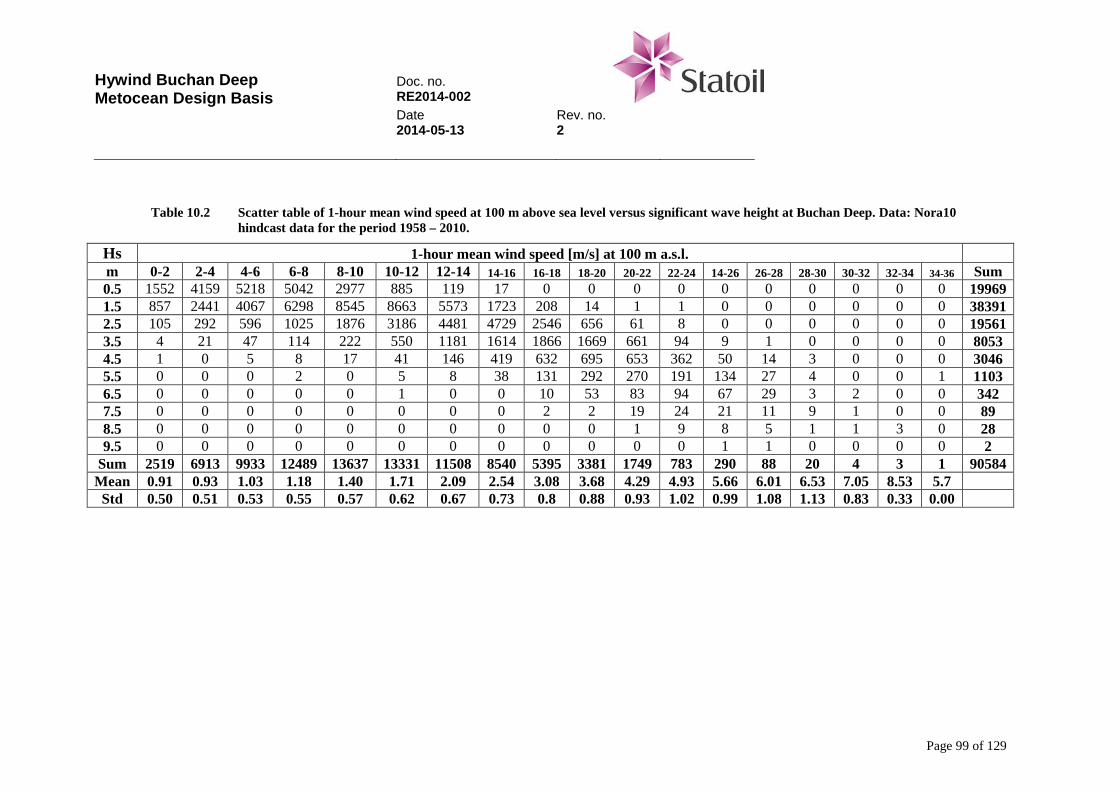
Hywind Buchan Deep Metocean Design Basis
Doc. no. RE2014-002 Date Rev. no. 2014-05-13 2
Page 99 of 129
Table 10.2 Scatter table of 1-hour mean wind speed at 100 m above sea level versus significant wave height at Buchan Deep. Data: Nora10 hindcast data for the period 1958 – 2010.
Hs 1-hour mean wind speed [m/s] at 100 m a.s.l. m 0-2 2-4 4-6 6-8 8-10 10-12 12-14 14-16 16-18 18-20 20-22 22-24 14-26 26-28 28-30 30-32 32-34 34-36 Sum 0.5 1552 4159 5218 5042 2977 885 119 17 0 0 0 0 0 0 0 0 0 0 19969 1.5 857 2441 4067 6298 8545 8663 5573 1723 208 14 1 1 0 0 0 0 0 0 38391 2.5 105 292 596 1025 1876 3186 4481 4729 2546 656 61 8 0 0 0 0 0 0 19561 3.5 4 21 47 114 222 550 1181 1614 1866 1669 661 94 9 1 0 0 0 0 8053 4.5 1 0 5 8 17 41 146 419 632 695 653 362 50 14 3 0 0 0 3046 5.5 0 0 0 2 0 5 8 38 131 292 270 191 134 27 4 0 0 1 1103 6.5 0 0 0 0 0 1 0 0 10 53 83 94 67 29 3 2 0 0 342 7.5 0 0 0 0 0 0 0 0 2 2 19 24 21 11 9 1 0 0 89 8.5 0 0 0 0 0 0 0 0 0 0 1 9 8 5 1 1 3 0 28 9.5 0 0 0 0 0 0 0 0 0 0 0 0 1 1 0 0 0 0 2
Sum 2519 6913 9933 12489 13637 13331 11508 8540 5395 3381 1749 783 290 88 20 4 3 1 90584 Mean 0.91 0.93 1.03 1.18 1.40 1.71 2.09 2.54 3.08 3.68 4.29 4.93 5.66 6.01 6.53 7.05 8.53 5.7
Std 0.50 0.51 0.53 0.55 0.57 0.62 0.67 0.73 0.8 0.88 0.93 1.02 0.99 1.08 1.13 0.83 0.33 0.00
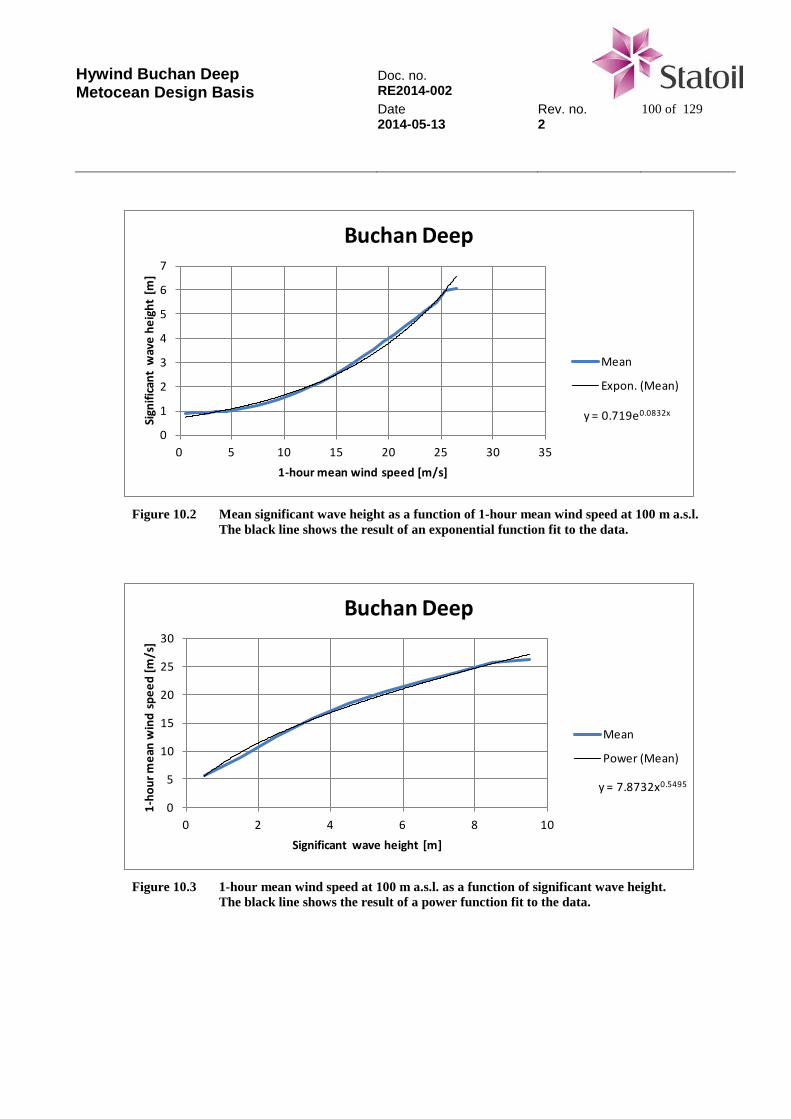
Hywind Buchan Deep Metocean Design Basis
Doc. no. RE2014-002 Date Rev. no. 100 of 129 2014-05-13 2
y = 0.719e0.0832x
0
1
2
3
4
5
6
7
0 5 10 15 20 25 30 35
Sign
ifica
nt w
ave
heig
ht [m
]
1-hour mean wind speed [m/s]
Buchan Deep
Mean
Expon. (Mean)
Figure 10.2 Mean significant wave height as a function of 1-hour mean wind speed at 100 m a.s.l. The black line shows the result of an exponential function fit to the data.
y = 7.8732x0.5495
0
5
10
15
20
25
30
0 2 4 6 8 10
1-ho
ur m
ean
win
d sp
eed
[m/s
]
Significant wave height [m]
Buchan Deep
Mean
Power (Mean)
Figure 10.3 1-hour mean wind speed at 100 m a.s.l. as a function of significant wave height. The black line shows the result of a power function fit to the data.
Hywind Buchan Deep Metocean Design Basis
Doc. no. RE2014-002 Date Rev. no. 101 of 129 2014-05-13 2
10.3 Wind and wave direction
10.3.1 Summary
Joint probability tables of wind and wave directions are presented for the following 4 cases of data selection:
1 Wave direction and wind direction at 10 m above MSL sorted by the wind speed intervals: 0 – 5, 5 – 8, 8 – 12, 12 – 15, 15 – 20, 20 – 25 and greater than 25 m/s.
2 Wave direction and wind direction at 100 m above MSL sorted by the wind speed intervals: 0 – 5, 5 – 8, 8 – 12, 12 – 15, 15 – 20, 20 – 25 and greater than 25 m/s.
3 Wave direction and wind direction at 10 m above MSL sorted by significant wave height intervals: 0 – 1, 1 – 3, 3 – 5, 5 – 7, 7 – 9 and 9 - 11 m.
4 Wave direction and wind direction at 100 m above MSL sorted by significant wave height intervals: 0 – 1, 1 – 3, 3 – 5, 5 – 7, 7 – 9 and 9 - 11 m.
The joint probability data are presented in tables as shown below:
o Class 1: Table 10.3 - Table 10.9 o Class 2: Table 10.10 - Table 10.16 o Class 3: Table 10.17 - Table 10.22 o Class 4: Table 10.23 - Table 10.28
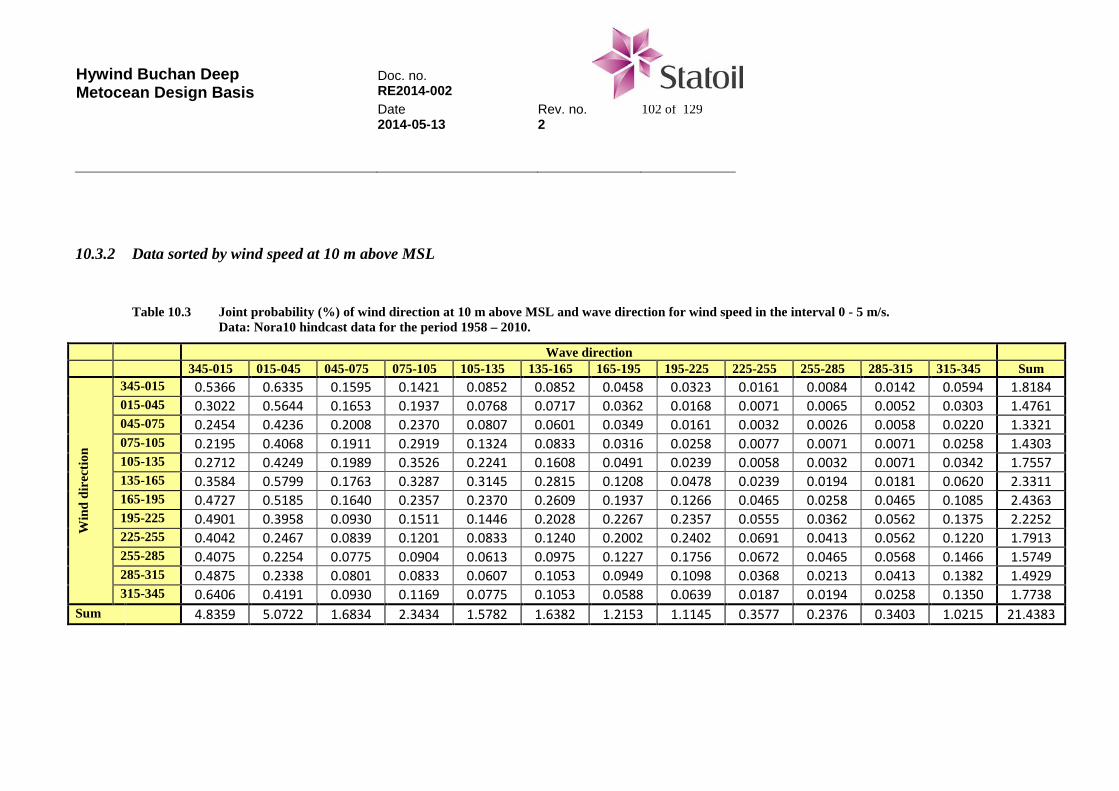
Hywind Buchan Deep Metocean Design Basis
Doc. no. RE2014-002 Date Rev. no. 102 of 129 2014-05-13 2
10.3.2 Data sorted by wind speed at 10 m above MSL
Table 10.3 Joint probability (%) of wind direction at 10 m above MSL and wave direction for wind speed in the interval 0 - 5 m/s.
Data: Nora10 hindcast data for the period 1958 – 2010.
Wave direction 345-015 015-045 045-075 075-105 105-135 135-165 165-195 195-225 225-255 255-285 285-315 315-345 Sum
Win
d di
rect
ion
345-015 0.5366 0.6335 0.1595 0.1421 0.0852 0.0852 0.0458 0.0323 0.0161 0.0084 0.0142 0.0594 1.8184 015-045 0.3022 0.5644 0.1653 0.1937 0.0768 0.0717 0.0362 0.0168 0.0071 0.0065 0.0052 0.0303 1.4761 045-075 0.2454 0.4236 0.2008 0.2370 0.0807 0.0601 0.0349 0.0161 0.0032 0.0026 0.0058 0.0220 1.3321 075-105 0.2195 0.4068 0.1911 0.2919 0.1324 0.0833 0.0316 0.0258 0.0077 0.0071 0.0071 0.0258 1.4303 105-135 0.2712 0.4249 0.1989 0.3526 0.2241 0.1608 0.0491 0.0239 0.0058 0.0032 0.0071 0.0342 1.7557 135-165 0.3584 0.5799 0.1763 0.3287 0.3145 0.2815 0.1208 0.0478 0.0239 0.0194 0.0181 0.0620 2.3311 165-195 0.4727 0.5185 0.1640 0.2357 0.2370 0.2609 0.1937 0.1266 0.0465 0.0258 0.0465 0.1085 2.4363 195-225 0.4901 0.3958 0.0930 0.1511 0.1446 0.2028 0.2267 0.2357 0.0555 0.0362 0.0562 0.1375 2.2252 225-255 0.4042 0.2467 0.0839 0.1201 0.0833 0.1240 0.2002 0.2402 0.0691 0.0413 0.0562 0.1220 1.7913 255-285 0.4075 0.2254 0.0775 0.0904 0.0613 0.0975 0.1227 0.1756 0.0672 0.0465 0.0568 0.1466 1.5749 285-315 0.4875 0.2338 0.0801 0.0833 0.0607 0.1053 0.0949 0.1098 0.0368 0.0213 0.0413 0.1382 1.4929 315-345 0.6406 0.4191 0.0930 0.1169 0.0775 0.1053 0.0588 0.0639 0.0187 0.0194 0.0258 0.1350 1.7738
Sum 4.8359 5.0722 1.6834 2.3434 1.5782 1.6382 1.2153 1.1145 0.3577 0.2376 0.3403 1.0215 21.4383
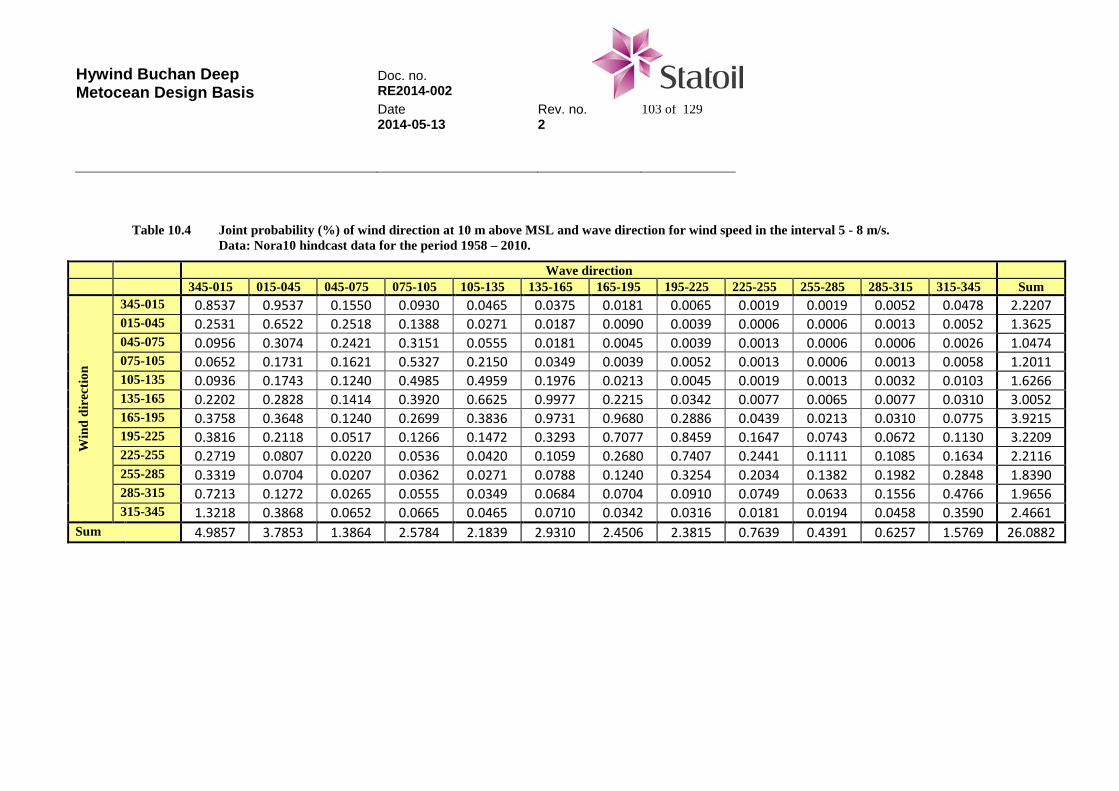
Hywind Buchan Deep Metocean Design Basis
Doc. no. RE2014-002 Date Rev. no. 103 of 129 2014-05-13 2
Table 10.4 Joint probability (%) of wind direction at 10 m above MSL and wave direction for wind speed in the interval 5 - 8 m/s. Data: Nora10 hindcast data for the period 1958 – 2010.
Wave direction 345-015 015-045 045-075 075-105 105-135 135-165 165-195 195-225 225-255 255-285 285-315 315-345 Sum
Win
d di
rect
ion
345-015 0.8537 0.9537 0.1550 0.0930 0.0465 0.0375 0.0181 0.0065 0.0019 0.0019 0.0052 0.0478 2.2207 015-045 0.2531 0.6522 0.2518 0.1388 0.0271 0.0187 0.0090 0.0039 0.0006 0.0006 0.0013 0.0052 1.3625 045-075 0.0956 0.3074 0.2421 0.3151 0.0555 0.0181 0.0045 0.0039 0.0013 0.0006 0.0006 0.0026 1.0474 075-105 0.0652 0.1731 0.1621 0.5327 0.2150 0.0349 0.0039 0.0052 0.0013 0.0006 0.0013 0.0058 1.2011 105-135 0.0936 0.1743 0.1240 0.4985 0.4959 0.1976 0.0213 0.0045 0.0019 0.0013 0.0032 0.0103 1.6266 135-165 0.2202 0.2828 0.1414 0.3920 0.6625 0.9977 0.2215 0.0342 0.0077 0.0065 0.0077 0.0310 3.0052 165-195 0.3758 0.3648 0.1240 0.2699 0.3836 0.9731 0.9680 0.2886 0.0439 0.0213 0.0310 0.0775 3.9215 195-225 0.3816 0.2118 0.0517 0.1266 0.1472 0.3293 0.7077 0.8459 0.1647 0.0743 0.0672 0.1130 3.2209 225-255 0.2719 0.0807 0.0220 0.0536 0.0420 0.1059 0.2680 0.7407 0.2441 0.1111 0.1085 0.1634 2.2116 255-285 0.3319 0.0704 0.0207 0.0362 0.0271 0.0788 0.1240 0.3254 0.2034 0.1382 0.1982 0.2848 1.8390 285-315 0.7213 0.1272 0.0265 0.0555 0.0349 0.0684 0.0704 0.0910 0.0749 0.0633 0.1556 0.4766 1.9656 315-345 1.3218 0.3868 0.0652 0.0665 0.0465 0.0710 0.0342 0.0316 0.0181 0.0194 0.0458 0.3590 2.4661
Sum 4.9857 3.7853 1.3864 2.5784 2.1839 2.9310 2.4506 2.3815 0.7639 0.4391 0.6257 1.5769 26.0882
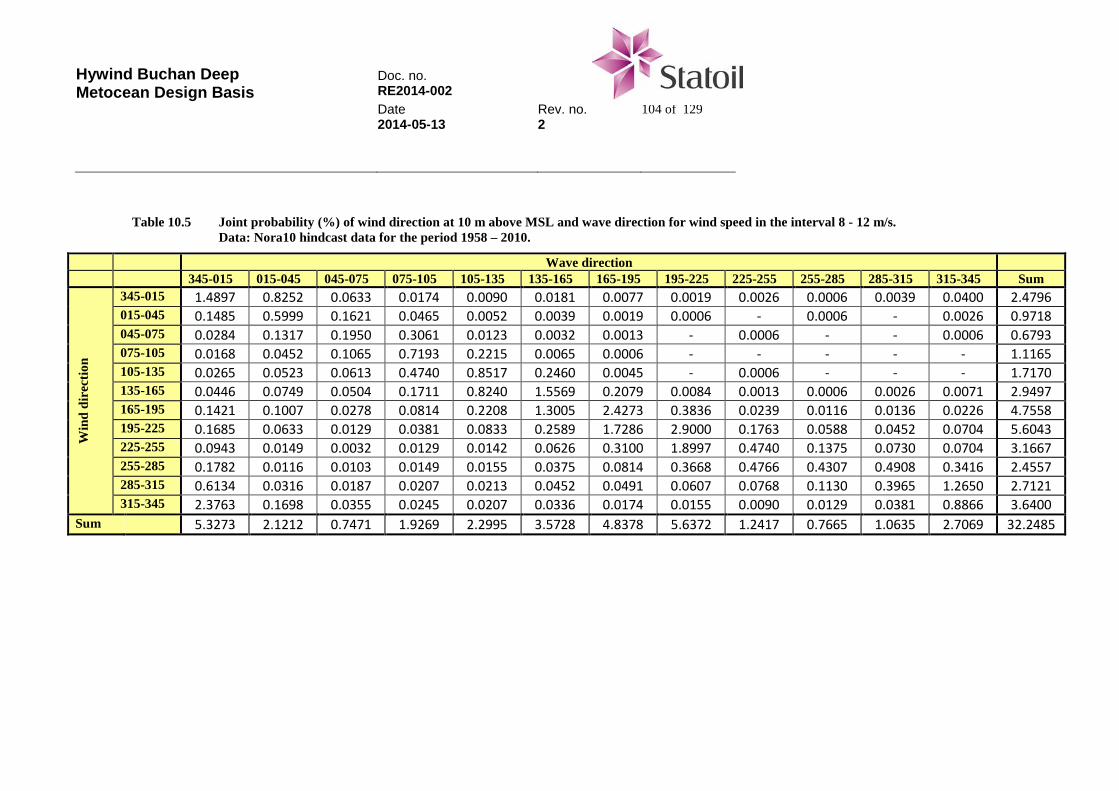
Hywind Buchan Deep Metocean Design Basis
Doc. no. RE2014-002 Date Rev. no. 104 of 129 2014-05-13 2
Table 10.5 Joint probability (%) of wind direction at 10 m above MSL and wave direction for wind speed in the interval 8 - 12 m/s. Data: Nora10 hindcast data for the period 1958 – 2010.
Wave direction 345-015 015-045 045-075 075-105 105-135 135-165 165-195 195-225 225-255 255-285 285-315 315-345 Sum
Win
d di
rect
ion
345-015 1.4897 0.8252 0.0633 0.0174 0.0090 0.0181 0.0077 0.0019 0.0026 0.0006 0.0039 0.0400 2.4796 015-045 0.1485 0.5999 0.1621 0.0465 0.0052 0.0039 0.0019 0.0006 - 0.0006 - 0.0026 0.9718 045-075 0.0284 0.1317 0.1950 0.3061 0.0123 0.0032 0.0013 - 0.0006 - - 0.0006 0.6793 075-105 0.0168 0.0452 0.1065 0.7193 0.2215 0.0065 0.0006 - - - - - 1.1165 105-135 0.0265 0.0523 0.0613 0.4740 0.8517 0.2460 0.0045 - 0.0006 - - - 1.7170 135-165 0.0446 0.0749 0.0504 0.1711 0.8240 1.5569 0.2079 0.0084 0.0013 0.0006 0.0026 0.0071 2.9497 165-195 0.1421 0.1007 0.0278 0.0814 0.2208 1.3005 2.4273 0.3836 0.0239 0.0116 0.0136 0.0226 4.7558 195-225 0.1685 0.0633 0.0129 0.0381 0.0833 0.2589 1.7286 2.9000 0.1763 0.0588 0.0452 0.0704 5.6043 225-255 0.0943 0.0149 0.0032 0.0129 0.0142 0.0626 0.3100 1.8997 0.4740 0.1375 0.0730 0.0704 3.1667 255-285 0.1782 0.0116 0.0103 0.0149 0.0155 0.0375 0.0814 0.3668 0.4766 0.4307 0.4908 0.3416 2.4557 285-315 0.6134 0.0316 0.0187 0.0207 0.0213 0.0452 0.0491 0.0607 0.0768 0.1130 0.3965 1.2650 2.7121 315-345 2.3763 0.1698 0.0355 0.0245 0.0207 0.0336 0.0174 0.0155 0.0090 0.0129 0.0381 0.8866 3.6400
Sum 5.3273 2.1212 0.7471 1.9269 2.2995 3.5728 4.8378 5.6372 1.2417 0.7665 1.0635 2.7069 32.2485
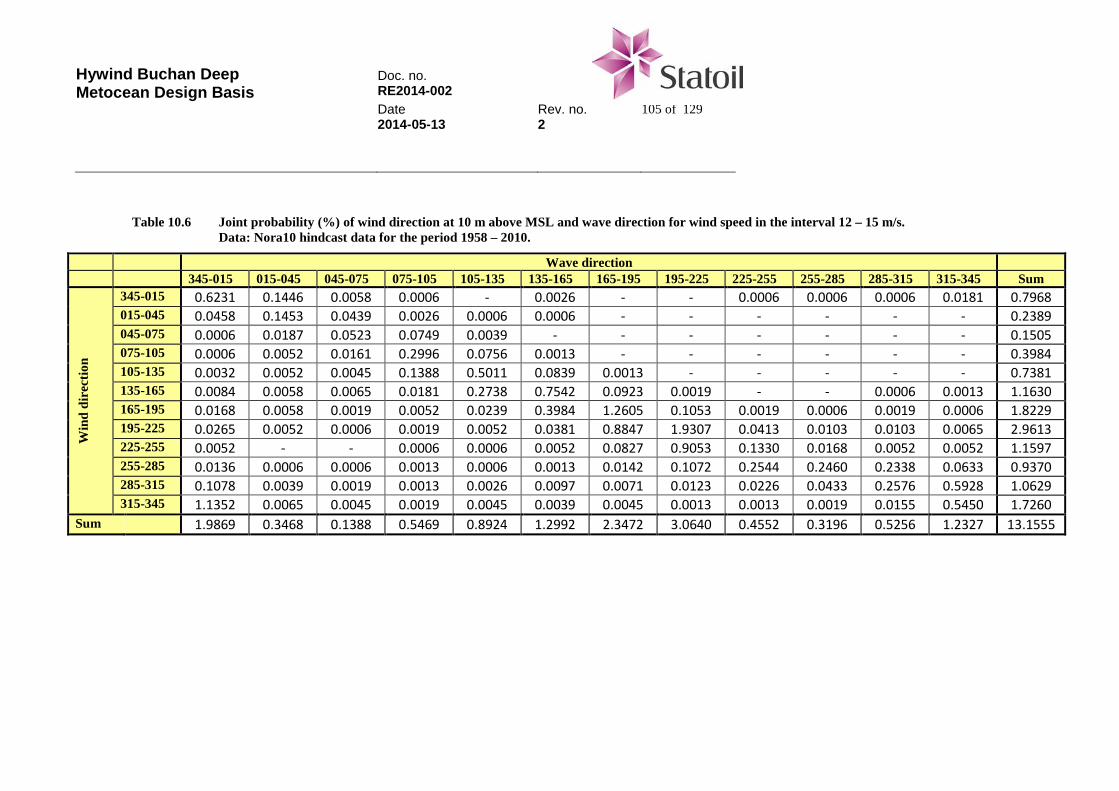
Hywind Buchan Deep Metocean Design Basis
Doc. no. RE2014-002 Date Rev. no. 105 of 129 2014-05-13 2
Table 10.6 Joint probability (%) of wind direction at 10 m above MSL and wave direction for wind speed in the interval 12 – 15 m/s. Data: Nora10 hindcast data for the period 1958 – 2010.
Wave direction 345-015 015-045 045-075 075-105 105-135 135-165 165-195 195-225 225-255 255-285 285-315 315-345 Sum
Win
d di
rect
ion
345-015 0.6231 0.1446 0.0058 0.0006 - 0.0026 - - 0.0006 0.0006 0.0006 0.0181 0.7968 015-045 0.0458 0.1453 0.0439 0.0026 0.0006 0.0006 - - - - - - 0.2389 045-075 0.0006 0.0187 0.0523 0.0749 0.0039 - - - - - - - 0.1505 075-105 0.0006 0.0052 0.0161 0.2996 0.0756 0.0013 - - - - - - 0.3984 105-135 0.0032 0.0052 0.0045 0.1388 0.5011 0.0839 0.0013 - - - - - 0.7381 135-165 0.0084 0.0058 0.0065 0.0181 0.2738 0.7542 0.0923 0.0019 - - 0.0006 0.0013 1.1630 165-195 0.0168 0.0058 0.0019 0.0052 0.0239 0.3984 1.2605 0.1053 0.0019 0.0006 0.0019 0.0006 1.8229 195-225 0.0265 0.0052 0.0006 0.0019 0.0052 0.0381 0.8847 1.9307 0.0413 0.0103 0.0103 0.0065 2.9613 225-255 0.0052 - - 0.0006 0.0006 0.0052 0.0827 0.9053 0.1330 0.0168 0.0052 0.0052 1.1597 255-285 0.0136 0.0006 0.0006 0.0013 0.0006 0.0013 0.0142 0.1072 0.2544 0.2460 0.2338 0.0633 0.9370 285-315 0.1078 0.0039 0.0019 0.0013 0.0026 0.0097 0.0071 0.0123 0.0226 0.0433 0.2576 0.5928 1.0629 315-345 1.1352 0.0065 0.0045 0.0019 0.0045 0.0039 0.0045 0.0013 0.0013 0.0019 0.0155 0.5450 1.7260
Sum 1.9869 0.3468 0.1388 0.5469 0.8924 1.2992 2.3472 3.0640 0.4552 0.3196 0.5256 1.2327 13.1555
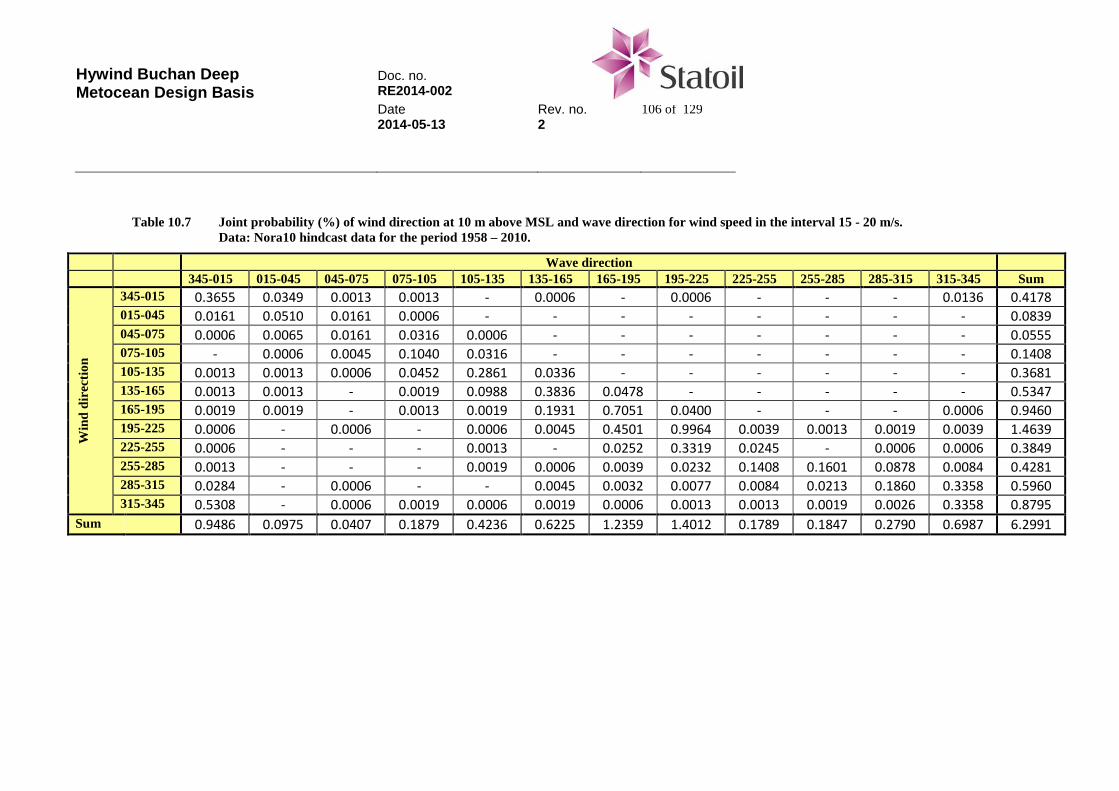
Hywind Buchan Deep Metocean Design Basis
Doc. no. RE2014-002 Date Rev. no. 106 of 129 2014-05-13 2
Table 10.7 Joint probability (%) of wind direction at 10 m above MSL and wave direction for wind speed in the interval 15 - 20 m/s. Data: Nora10 hindcast data for the period 1958 – 2010.
Wave direction 345-015 015-045 045-075 075-105 105-135 135-165 165-195 195-225 225-255 255-285 285-315 315-345 Sum
Win
d di
rect
ion
345-015 0.3655 0.0349 0.0013 0.0013 - 0.0006 - 0.0006 - - - 0.0136 0.4178 015-045 0.0161 0.0510 0.0161 0.0006 - - - - - - - - 0.0839 045-075 0.0006 0.0065 0.0161 0.0316 0.0006 - - - - - - - 0.0555 075-105 - 0.0006 0.0045 0.1040 0.0316 - - - - - - - 0.1408 105-135 0.0013 0.0013 0.0006 0.0452 0.2861 0.0336 - - - - - - 0.3681 135-165 0.0013 0.0013 - 0.0019 0.0988 0.3836 0.0478 - - - - - 0.5347 165-195 0.0019 0.0019 - 0.0013 0.0019 0.1931 0.7051 0.0400 - - - 0.0006 0.9460 195-225 0.0006 - 0.0006 - 0.0006 0.0045 0.4501 0.9964 0.0039 0.0013 0.0019 0.0039 1.4639 225-255 0.0006 - - - 0.0013 - 0.0252 0.3319 0.0245 - 0.0006 0.0006 0.3849 255-285 0.0013 - - - 0.0019 0.0006 0.0039 0.0232 0.1408 0.1601 0.0878 0.0084 0.4281 285-315 0.0284 - 0.0006 - - 0.0045 0.0032 0.0077 0.0084 0.0213 0.1860 0.3358 0.5960 315-345 0.5308 - 0.0006 0.0019 0.0006 0.0019 0.0006 0.0013 0.0013 0.0019 0.0026 0.3358 0.8795
Sum 0.9486 0.0975 0.0407 0.1879 0.4236 0.6225 1.2359 1.4012 0.1789 0.1847 0.2790 0.6987 6.2991
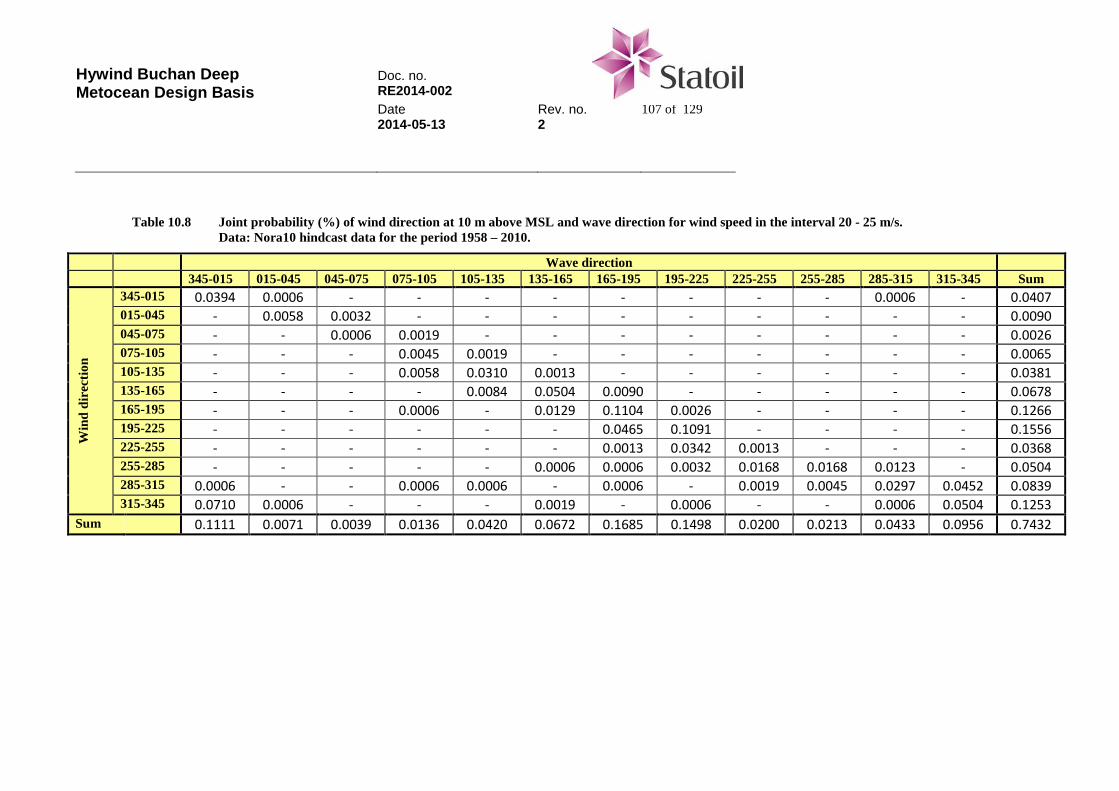
Hywind Buchan Deep Metocean Design Basis
Doc. no. RE2014-002 Date Rev. no. 107 of 129 2014-05-13 2
Table 10.8 Joint probability (%) of wind direction at 10 m above MSL and wave direction for wind speed in the interval 20 - 25 m/s. Data: Nora10 hindcast data for the period 1958 – 2010.
Wave direction 345-015 015-045 045-075 075-105 105-135 135-165 165-195 195-225 225-255 255-285 285-315 315-345 Sum
Win
d di
rect
ion
345-015 0.0394 0.0006 - - - - - - - - 0.0006 - 0.0407 015-045 - 0.0058 0.0032 - - - - - - - - - 0.0090 045-075 - - 0.0006 0.0019 - - - - - - - - 0.0026 075-105 - - - 0.0045 0.0019 - - - - - - - 0.0065 105-135 - - - 0.0058 0.0310 0.0013 - - - - - - 0.0381 135-165 - - - - 0.0084 0.0504 0.0090 - - - - - 0.0678 165-195 - - - 0.0006 - 0.0129 0.1104 0.0026 - - - - 0.1266 195-225 - - - - - - 0.0465 0.1091 - - - - 0.1556 225-255 - - - - - - 0.0013 0.0342 0.0013 - - - 0.0368 255-285 - - - - - 0.0006 0.0006 0.0032 0.0168 0.0168 0.0123 - 0.0504 285-315 0.0006 - - 0.0006 0.0006 - 0.0006 - 0.0019 0.0045 0.0297 0.0452 0.0839 315-345 0.0710 0.0006 - - - 0.0019 - 0.0006 - - 0.0006 0.0504 0.1253
Sum 0.1111 0.0071 0.0039 0.0136 0.0420 0.0672 0.1685 0.1498 0.0200 0.0213 0.0433 0.0956 0.7432
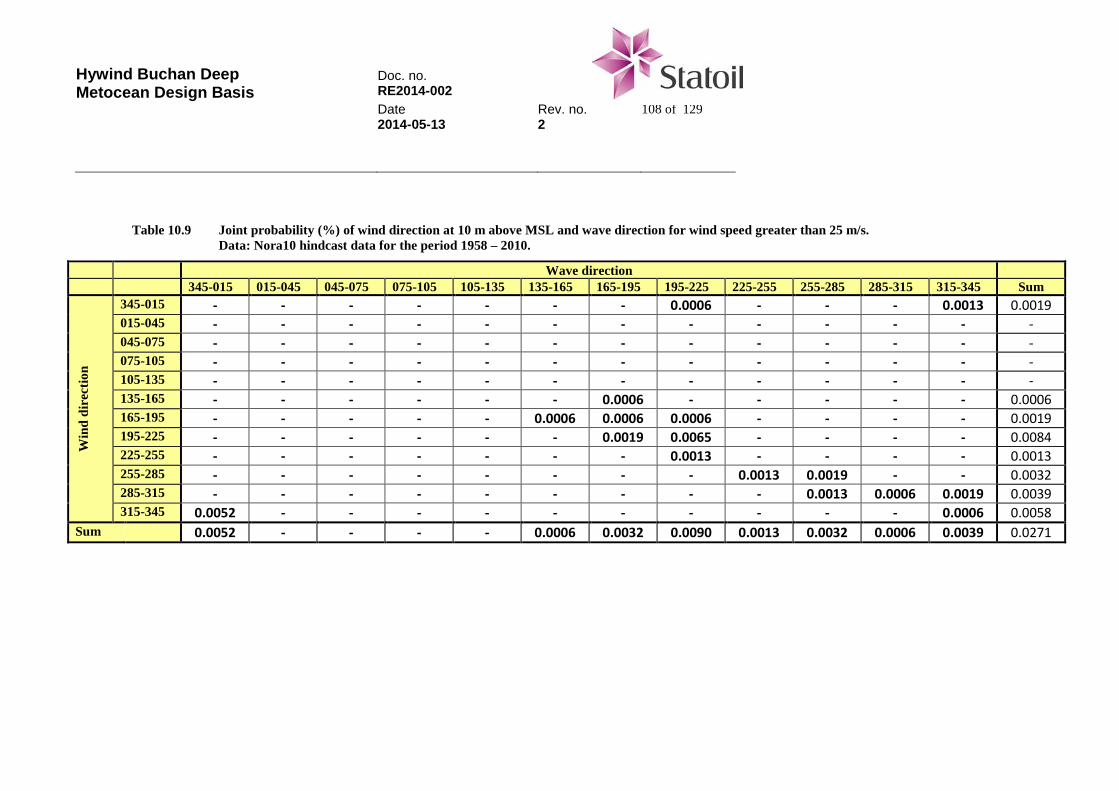
Hywind Buchan Deep Metocean Design Basis
Doc. no. RE2014-002 Date Rev. no. 108 of 129 2014-05-13 2
Table 10.9 Joint probability (%) of wind direction at 10 m above MSL and wave direction for wind speed greater than 25 m/s. Data: Nora10 hindcast data for the period 1958 – 2010.
Wave direction 345-015 015-045 045-075 075-105 105-135 135-165 165-195 195-225 225-255 255-285 285-315 315-345 Sum
Win
d di
rect
ion
345-015 - - - - - - - 0.0006 - - - 0.0013 0.0019 015-045 - - - - - - - - - - - - - 045-075 - - - - - - - - - - - - - 075-105 - - - - - - - - - - - - - 105-135 - - - - - - - - - - - - - 135-165 - - - - - - 0.0006 - - - - - 0.0006 165-195 - - - - - 0.0006 0.0006 0.0006 - - - - 0.0019 195-225 - - - - - - 0.0019 0.0065 - - - - 0.0084 225-255 - - - - - - - 0.0013 - - - - 0.0013 255-285 - - - - - - - - 0.0013 0.0019 - - 0.0032 285-315 - - - - - - - - - 0.0013 0.0006 0.0019 0.0039 315-345 0.0052 - - - - - - - - - - 0.0006 0.0058
Sum 0.0052 - - - - 0.0006 0.0032 0.0090 0.0013 0.0032 0.0006 0.0039 0.0271

Hywind Buchan Deep Metocean Design Basis
Doc. no. RE2014-002 Date Rev. no. 109 of 129 2014-05-13 2
10.3.3 Data sorted by wind speed at 100 m above MSL
Table 10.10 Joint probability (%) of wind direction at 100 m above MSL and wave direction for wind speed in the interval 0 - 5 m/s.
Data: Nora10 hindcast data for the period 1980 – 2010.
Wave direction 345-015 015-045 045-075 075-105 105-135 135-165 165-195 195-225 225-255 255-285 285-315 315-345 Sum
Win
d di
rect
ion
345-015 0.4670 0.4791 0.1027 0.1181 0.0707 0.0773 0.0386 0.0364 0.0132 0.0077 0.0077 0.0508 1.4694 015-045 0.2970 0.4659 0.1159 0.1325 0.0740 0.0695 0.0353 0.0199 0.0044 0.0088 0.0055 0.0210 1.2497 045-075 0.2274 0.3389 0.1214 0.1590 0.0607 0.0695 0.0287 0.0199 0.0066 0.0033 0.0055 0.0166 1.0576 075-105 0.2109 0.3168 0.1424 0.1844 0.0707 0.0508 0.0331 0.0166 0.0066 0.0044 0.0033 0.0287 1.0686 105-135 0.2285 0.3235 0.1270 0.1921 0.0883 0.0839 0.0265 0.0166 0.0044 0.0022 0.0055 0.0309 1.1293 135-165 0.2826 0.4195 0.1247 0.1965 0.1700 0.1137 0.0607 0.0309 0.0088 0.0144 0.0144 0.0375 1.4738 165-195 0.3466 0.4051 0.1203 0.1744 0.1667 0.1159 0.0872 0.0464 0.0144 0.0121 0.0287 0.0552 1.5731 195-225 0.3820 0.3201 0.0651 0.1104 0.0872 0.1336 0.0927 0.0883 0.0177 0.0155 0.0232 0.0883 1.4241 225-255 0.3168 0.2098 0.0695 0.1016 0.0640 0.1082 0.1225 0.1236 0.0364 0.0110 0.0408 0.0729 1.2773 255-285 0.3235 0.2053 0.0740 0.0707 0.0508 0.0850 0.1071 0.1071 0.0353 0.0188 0.0298 0.0773 1.1845 285-315 0.3941 0.2009 0.0729 0.0795 0.0519 0.0927 0.0707 0.0883 0.0243 0.0155 0.0265 0.0806 1.1978 315-345 0.5608 0.3643 0.0850 0.0828 0.0629 0.0872 0.0530 0.0530 0.0155 0.0144 0.0177 0.0684 1.4649
Sum 4.0371 4.0493 1.2210 1.6018 1.0178 1.0874 0.7562 0.6469 0.1877 0.1281 0.2086 0.6281 15.5701
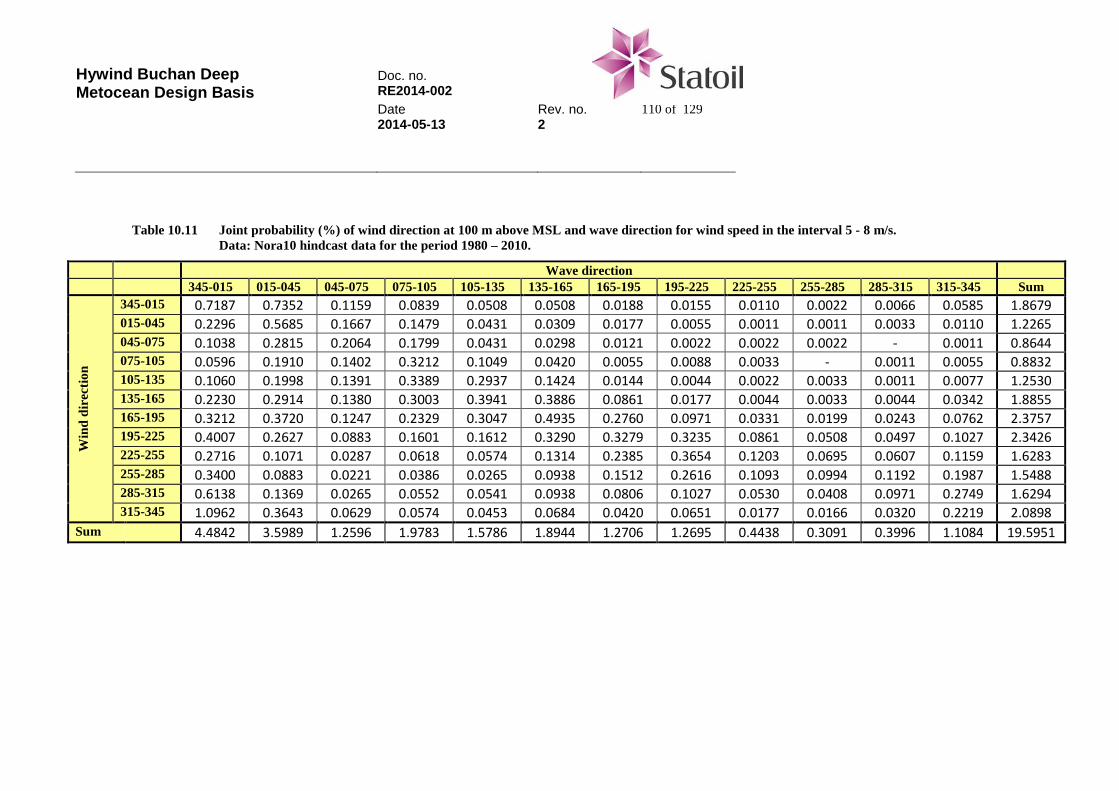
Hywind Buchan Deep Metocean Design Basis
Doc. no. RE2014-002 Date Rev. no. 110 of 129 2014-05-13 2
Table 10.11 Joint probability (%) of wind direction at 100 m above MSL and wave direction for wind speed in the interval 5 - 8 m/s. Data: Nora10 hindcast data for the period 1980 – 2010.
Wave direction 345-015 015-045 045-075 075-105 105-135 135-165 165-195 195-225 225-255 255-285 285-315 315-345 Sum
Win
d di
rect
ion
345-015 0.7187 0.7352 0.1159 0.0839 0.0508 0.0508 0.0188 0.0155 0.0110 0.0022 0.0066 0.0585 1.8679 015-045 0.2296 0.5685 0.1667 0.1479 0.0431 0.0309 0.0177 0.0055 0.0011 0.0011 0.0033 0.0110 1.2265 045-075 0.1038 0.2815 0.2064 0.1799 0.0431 0.0298 0.0121 0.0022 0.0022 0.0022 - 0.0011 0.8644 075-105 0.0596 0.1910 0.1402 0.3212 0.1049 0.0420 0.0055 0.0088 0.0033 - 0.0011 0.0055 0.8832 105-135 0.1060 0.1998 0.1391 0.3389 0.2937 0.1424 0.0144 0.0044 0.0022 0.0033 0.0011 0.0077 1.2530 135-165 0.2230 0.2914 0.1380 0.3003 0.3941 0.3886 0.0861 0.0177 0.0044 0.0033 0.0044 0.0342 1.8855 165-195 0.3212 0.3720 0.1247 0.2329 0.3047 0.4935 0.2760 0.0971 0.0331 0.0199 0.0243 0.0762 2.3757 195-225 0.4007 0.2627 0.0883 0.1601 0.1612 0.3290 0.3279 0.3235 0.0861 0.0508 0.0497 0.1027 2.3426 225-255 0.2716 0.1071 0.0287 0.0618 0.0574 0.1314 0.2385 0.3654 0.1203 0.0695 0.0607 0.1159 1.6283 255-285 0.3400 0.0883 0.0221 0.0386 0.0265 0.0938 0.1512 0.2616 0.1093 0.0994 0.1192 0.1987 1.5488 285-315 0.6138 0.1369 0.0265 0.0552 0.0541 0.0938 0.0806 0.1027 0.0530 0.0408 0.0971 0.2749 1.6294 315-345 1.0962 0.3643 0.0629 0.0574 0.0453 0.0684 0.0420 0.0651 0.0177 0.0166 0.0320 0.2219 2.0898
Sum 4.4842 3.5989 1.2596 1.9783 1.5786 1.8944 1.2706 1.2695 0.4438 0.3091 0.3996 1.1084 19.5951
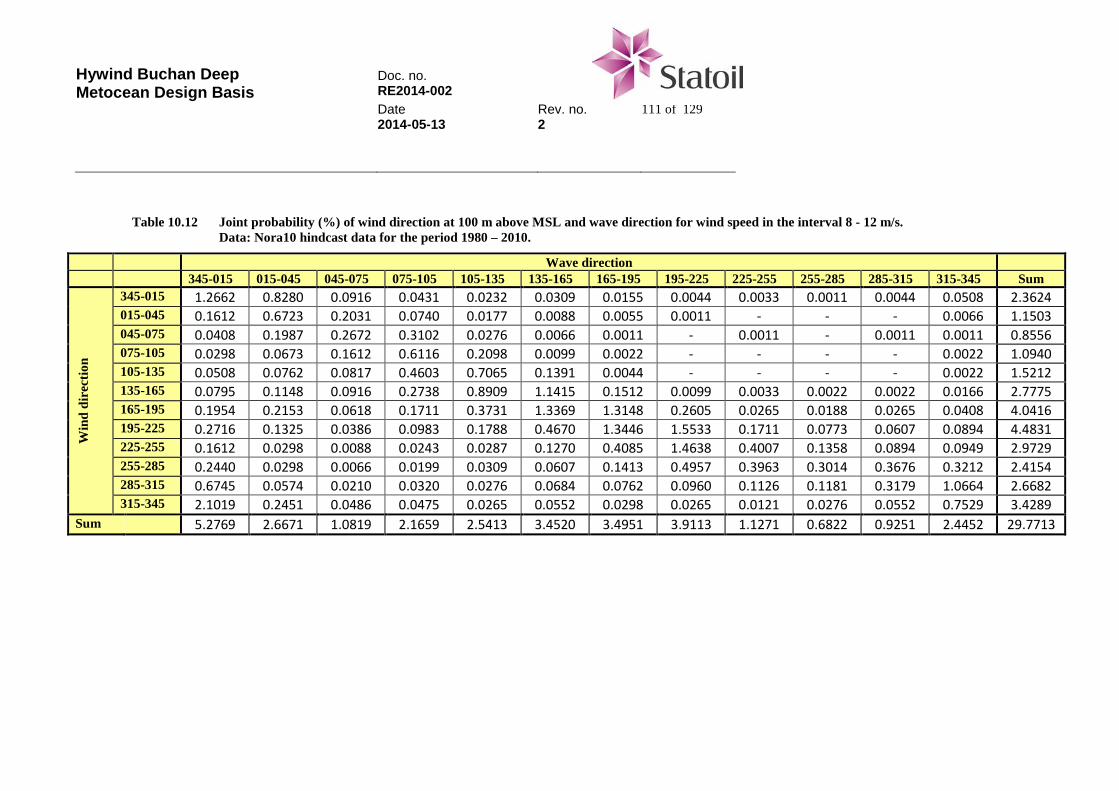
Hywind Buchan Deep Metocean Design Basis
Doc. no. RE2014-002 Date Rev. no. 111 of 129 2014-05-13 2
Table 10.12 Joint probability (%) of wind direction at 100 m above MSL and wave direction for wind speed in the interval 8 - 12 m/s. Data: Nora10 hindcast data for the period 1980 – 2010.
Wave direction 345-015 015-045 045-075 075-105 105-135 135-165 165-195 195-225 225-255 255-285 285-315 315-345 Sum
Win
d di
rect
ion
345-015 1.2662 0.8280 0.0916 0.0431 0.0232 0.0309 0.0155 0.0044 0.0033 0.0011 0.0044 0.0508 2.3624 015-045 0.1612 0.6723 0.2031 0.0740 0.0177 0.0088 0.0055 0.0011 - - - 0.0066 1.1503 045-075 0.0408 0.1987 0.2672 0.3102 0.0276 0.0066 0.0011 - 0.0011 - 0.0011 0.0011 0.8556 075-105 0.0298 0.0673 0.1612 0.6116 0.2098 0.0099 0.0022 - - - - 0.0022 1.0940 105-135 0.0508 0.0762 0.0817 0.4603 0.7065 0.1391 0.0044 - - - - 0.0022 1.5212 135-165 0.0795 0.1148 0.0916 0.2738 0.8909 1.1415 0.1512 0.0099 0.0033 0.0022 0.0022 0.0166 2.7775 165-195 0.1954 0.2153 0.0618 0.1711 0.3731 1.3369 1.3148 0.2605 0.0265 0.0188 0.0265 0.0408 4.0416 195-225 0.2716 0.1325 0.0386 0.0983 0.1788 0.4670 1.3446 1.5533 0.1711 0.0773 0.0607 0.0894 4.4831 225-255 0.1612 0.0298 0.0088 0.0243 0.0287 0.1270 0.4085 1.4638 0.4007 0.1358 0.0894 0.0949 2.9729 255-285 0.2440 0.0298 0.0066 0.0199 0.0309 0.0607 0.1413 0.4957 0.3963 0.3014 0.3676 0.3212 2.4154 285-315 0.6745 0.0574 0.0210 0.0320 0.0276 0.0684 0.0762 0.0960 0.1126 0.1181 0.3179 1.0664 2.6682 315-345 2.1019 0.2451 0.0486 0.0475 0.0265 0.0552 0.0298 0.0265 0.0121 0.0276 0.0552 0.7529 3.4289
Sum 5.2769 2.6671 1.0819 2.1659 2.5413 3.4520 3.4951 3.9113 1.1271 0.6822 0.9251 2.4452 29.7713
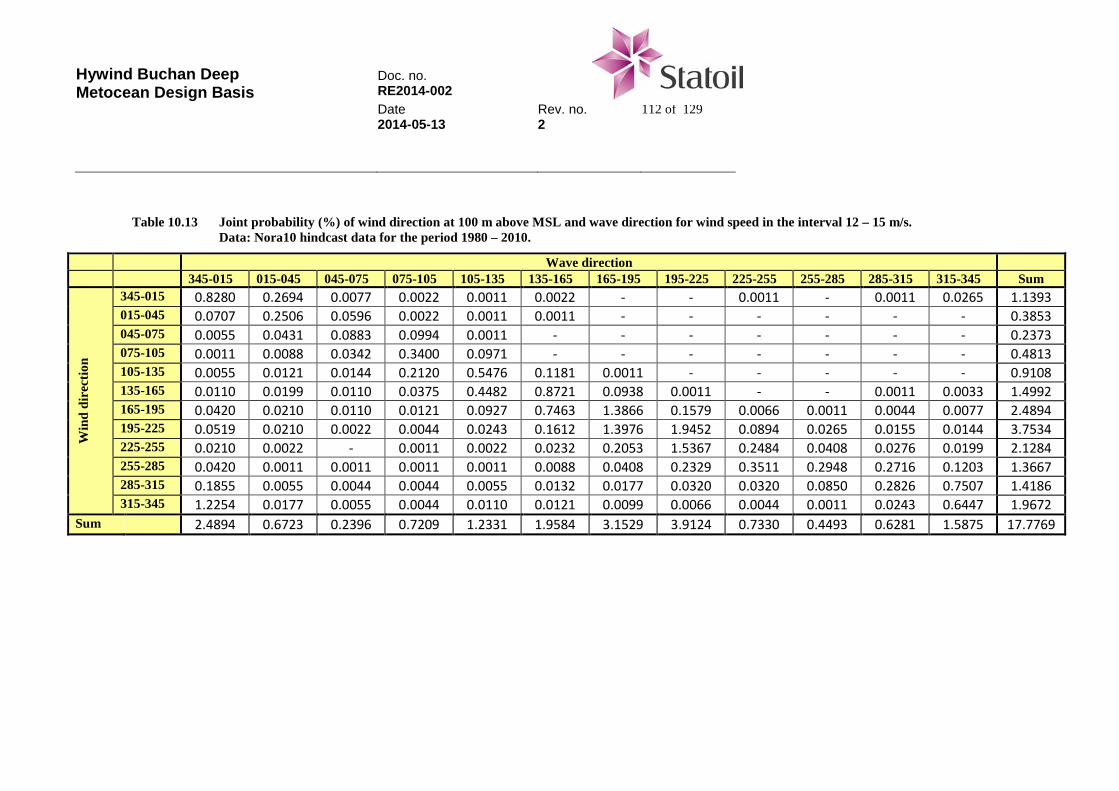
Hywind Buchan Deep Metocean Design Basis
Doc. no. RE2014-002 Date Rev. no. 112 of 129 2014-05-13 2
Table 10.13 Joint probability (%) of wind direction at 100 m above MSL and wave direction for wind speed in the interval 12 – 15 m/s. Data: Nora10 hindcast data for the period 1980 – 2010.
Wave direction 345-015 015-045 045-075 075-105 105-135 135-165 165-195 195-225 225-255 255-285 285-315 315-345 Sum
Win
d di
rect
ion
345-015 0.8280 0.2694 0.0077 0.0022 0.0011 0.0022 - - 0.0011 - 0.0011 0.0265 1.1393 015-045 0.0707 0.2506 0.0596 0.0022 0.0011 0.0011 - - - - - - 0.3853 045-075 0.0055 0.0431 0.0883 0.0994 0.0011 - - - - - - - 0.2373 075-105 0.0011 0.0088 0.0342 0.3400 0.0971 - - - - - - - 0.4813 105-135 0.0055 0.0121 0.0144 0.2120 0.5476 0.1181 0.0011 - - - - - 0.9108 135-165 0.0110 0.0199 0.0110 0.0375 0.4482 0.8721 0.0938 0.0011 - - 0.0011 0.0033 1.4992 165-195 0.0420 0.0210 0.0110 0.0121 0.0927 0.7463 1.3866 0.1579 0.0066 0.0011 0.0044 0.0077 2.4894 195-225 0.0519 0.0210 0.0022 0.0044 0.0243 0.1612 1.3976 1.9452 0.0894 0.0265 0.0155 0.0144 3.7534 225-255 0.0210 0.0022 - 0.0011 0.0022 0.0232 0.2053 1.5367 0.2484 0.0408 0.0276 0.0199 2.1284 255-285 0.0420 0.0011 0.0011 0.0011 0.0011 0.0088 0.0408 0.2329 0.3511 0.2948 0.2716 0.1203 1.3667 285-315 0.1855 0.0055 0.0044 0.0044 0.0055 0.0132 0.0177 0.0320 0.0320 0.0850 0.2826 0.7507 1.4186 315-345 1.2254 0.0177 0.0055 0.0044 0.0110 0.0121 0.0099 0.0066 0.0044 0.0011 0.0243 0.6447 1.9672
Sum 2.4894 0.6723 0.2396 0.7209 1.2331 1.9584 3.1529 3.9124 0.7330 0.4493 0.6281 1.5875 17.7769
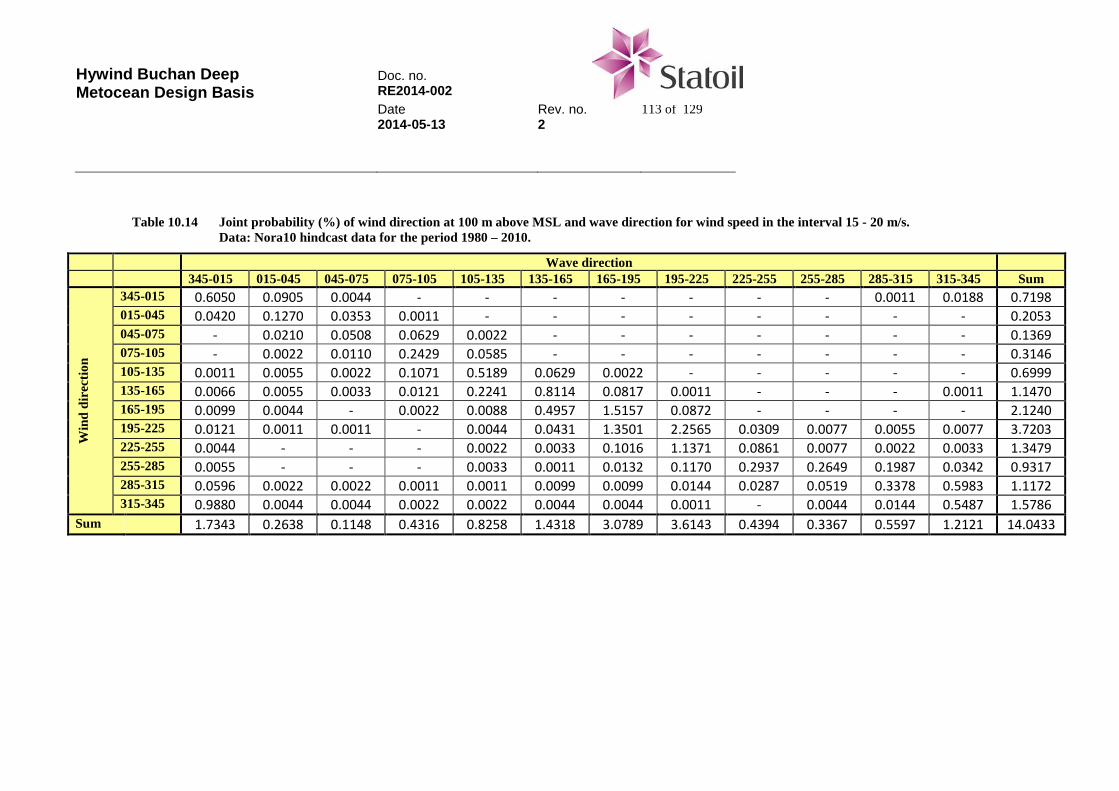
Hywind Buchan Deep Metocean Design Basis
Doc. no. RE2014-002 Date Rev. no. 113 of 129 2014-05-13 2
Table 10.14 Joint probability (%) of wind direction at 100 m above MSL and wave direction for wind speed in the interval 15 - 20 m/s. Data: Nora10 hindcast data for the period 1980 – 2010.
Wave direction 345-015 015-045 045-075 075-105 105-135 135-165 165-195 195-225 225-255 255-285 285-315 315-345 Sum
Win
d di
rect
ion
345-015 0.6050 0.0905 0.0044 - - - - - - - 0.0011 0.0188 0.7198 015-045 0.0420 0.1270 0.0353 0.0011 - - - - - - - - 0.2053 045-075 - 0.0210 0.0508 0.0629 0.0022 - - - - - - - 0.1369 075-105 - 0.0022 0.0110 0.2429 0.0585 - - - - - - - 0.3146 105-135 0.0011 0.0055 0.0022 0.1071 0.5189 0.0629 0.0022 - - - - - 0.6999 135-165 0.0066 0.0055 0.0033 0.0121 0.2241 0.8114 0.0817 0.0011 - - - 0.0011 1.1470 165-195 0.0099 0.0044 - 0.0022 0.0088 0.4957 1.5157 0.0872 - - - - 2.1240 195-225 0.0121 0.0011 0.0011 - 0.0044 0.0431 1.3501 2.2565 0.0309 0.0077 0.0055 0.0077 3.7203 225-255 0.0044 - - - 0.0022 0.0033 0.1016 1.1371 0.0861 0.0077 0.0022 0.0033 1.3479 255-285 0.0055 - - - 0.0033 0.0011 0.0132 0.1170 0.2937 0.2649 0.1987 0.0342 0.9317 285-315 0.0596 0.0022 0.0022 0.0011 0.0011 0.0099 0.0099 0.0144 0.0287 0.0519 0.3378 0.5983 1.1172 315-345 0.9880 0.0044 0.0044 0.0022 0.0022 0.0044 0.0044 0.0011 - 0.0044 0.0144 0.5487 1.5786
Sum 1.7343 0.2638 0.1148 0.4316 0.8258 1.4318 3.0789 3.6143 0.4394 0.3367 0.5597 1.2121 14.0433
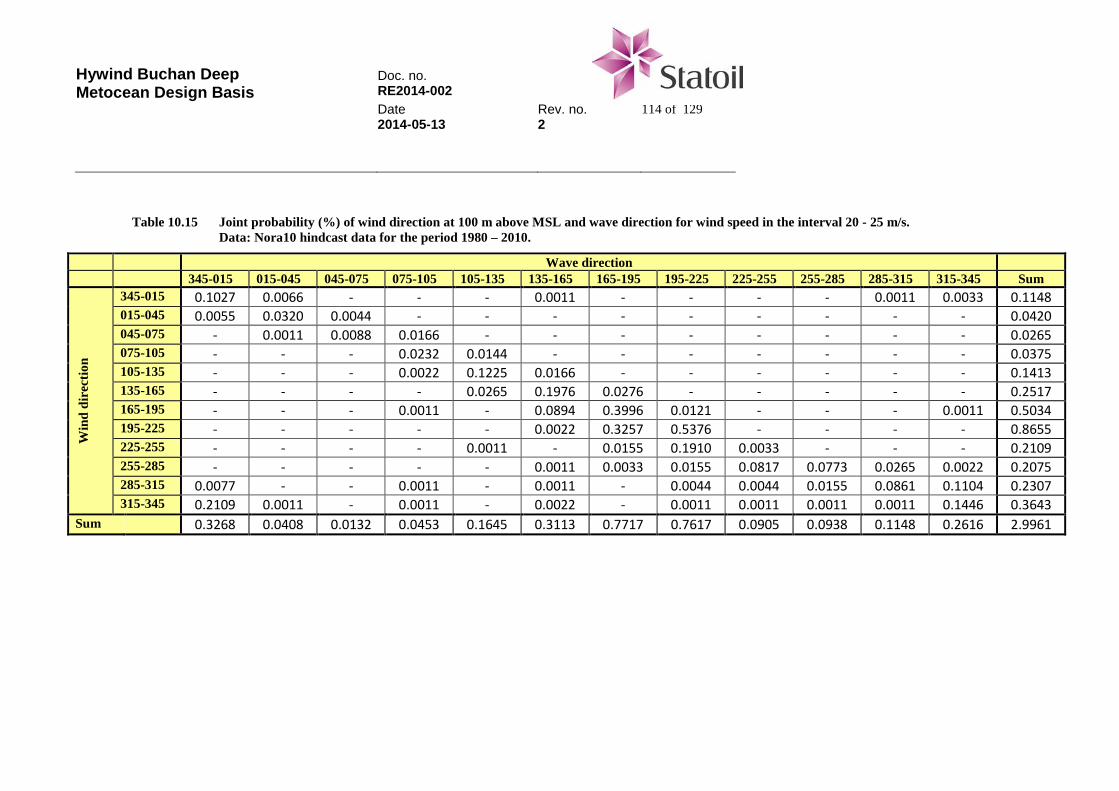
Hywind Buchan Deep Metocean Design Basis
Doc. no. RE2014-002 Date Rev. no. 114 of 129 2014-05-13 2
Table 10.15 Joint probability (%) of wind direction at 100 m above MSL and wave direction for wind speed in the interval 20 - 25 m/s. Data: Nora10 hindcast data for the period 1980 – 2010.
Wave direction 345-015 015-045 045-075 075-105 105-135 135-165 165-195 195-225 225-255 255-285 285-315 315-345 Sum
Win
d di
rect
ion
345-015 0.1027 0.0066 - - - 0.0011 - - - - 0.0011 0.0033 0.1148 015-045 0.0055 0.0320 0.0044 - - - - - - - - - 0.0420 045-075 - 0.0011 0.0088 0.0166 - - - - - - - - 0.0265 075-105 - - - 0.0232 0.0144 - - - - - - - 0.0375 105-135 - - - 0.0022 0.1225 0.0166 - - - - - - 0.1413 135-165 - - - - 0.0265 0.1976 0.0276 - - - - - 0.2517 165-195 - - - 0.0011 - 0.0894 0.3996 0.0121 - - - 0.0011 0.5034 195-225 - - - - - 0.0022 0.3257 0.5376 - - - - 0.8655 225-255 - - - - 0.0011 - 0.0155 0.1910 0.0033 - - - 0.2109 255-285 - - - - - 0.0011 0.0033 0.0155 0.0817 0.0773 0.0265 0.0022 0.2075 285-315 0.0077 - - 0.0011 - 0.0011 - 0.0044 0.0044 0.0155 0.0861 0.1104 0.2307 315-345 0.2109 0.0011 - 0.0011 - 0.0022 - 0.0011 0.0011 0.0011 0.0011 0.1446 0.3643
Sum 0.3268 0.0408 0.0132 0.0453 0.1645 0.3113 0.7717 0.7617 0.0905 0.0938 0.1148 0.2616 2.9961
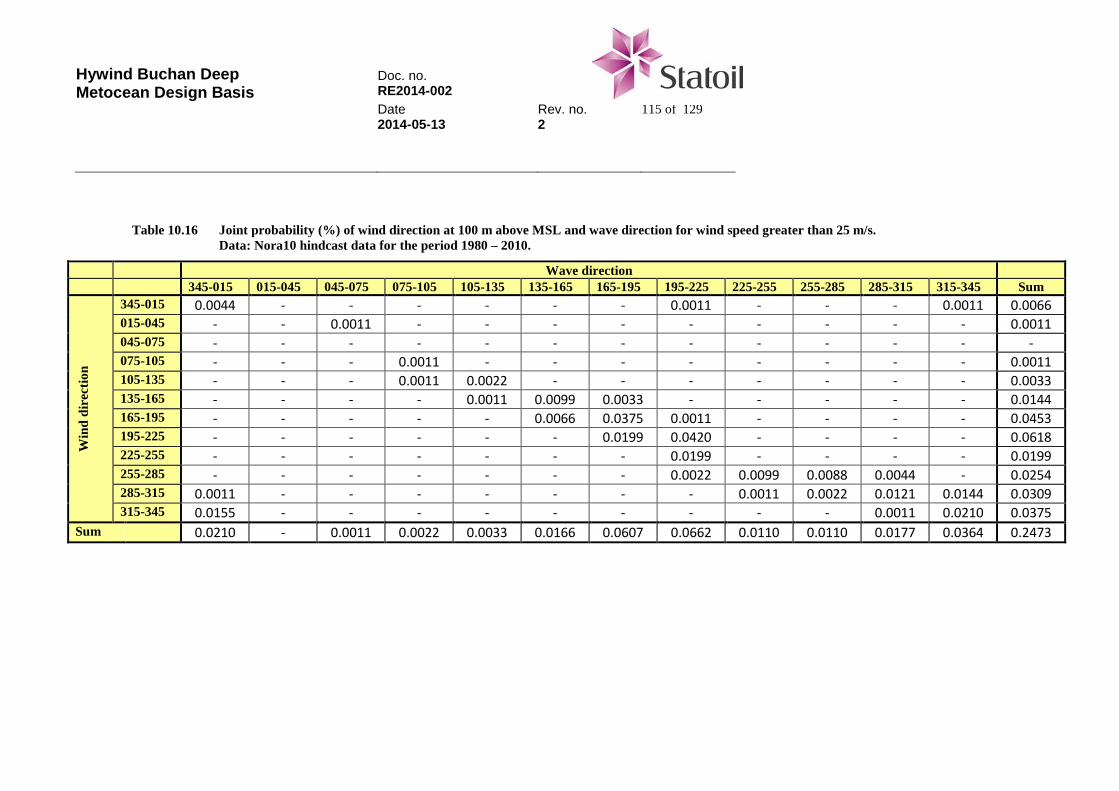
Hywind Buchan Deep Metocean Design Basis
Doc. no. RE2014-002 Date Rev. no. 115 of 129 2014-05-13 2
Table 10.16 Joint probability (%) of wind direction at 100 m above MSL and wave direction for wind speed greater than 25 m/s. Data: Nora10 hindcast data for the period 1980 – 2010.
Wave direction 345-015 015-045 045-075 075-105 105-135 135-165 165-195 195-225 225-255 255-285 285-315 315-345 Sum
Win
d di
rect
ion
345-015 0.0044 - - - - - - 0.0011 - - - 0.0011 0.0066 015-045 - - 0.0011 - - - - - - - - - 0.0011 045-075 - - - - - - - - - - - - - 075-105 - - - 0.0011 - - - - - - - - 0.0011 105-135 - - - 0.0011 0.0022 - - - - - - - 0.0033 135-165 - - - - 0.0011 0.0099 0.0033 - - - - - 0.0144 165-195 - - - - - 0.0066 0.0375 0.0011 - - - - 0.0453 195-225 - - - - - - 0.0199 0.0420 - - - - 0.0618 225-255 - - - - - - - 0.0199 - - - - 0.0199 255-285 - - - - - - - 0.0022 0.0099 0.0088 0.0044 - 0.0254 285-315 0.0011 - - - - - - - 0.0011 0.0022 0.0121 0.0144 0.0309 315-345 0.0155 - - - - - - - - - 0.0011 0.0210 0.0375
Sum 0.0210 - 0.0011 0.0022 0.0033 0.0166 0.0607 0.0662 0.0110 0.0110 0.0177 0.0364 0.2473
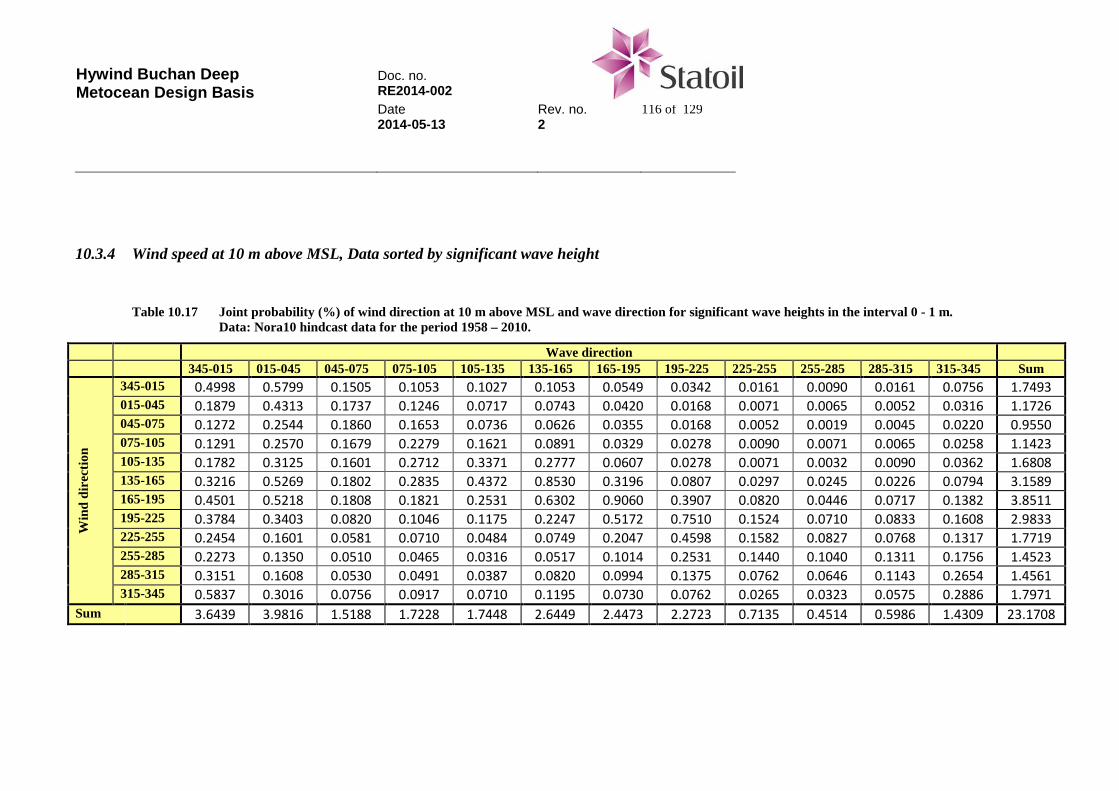
Hywind Buchan Deep Metocean Design Basis
Doc. no. RE2014-002 Date Rev. no. 116 of 129 2014-05-13 2
10.3.4 Wind speed at 10 m above MSL, Data sorted by significant wave height
Table 10.17 Joint probability (%) of wind direction at 10 m above MSL and wave direction for significant wave heights in the interval 0 - 1 m. Data: Nora10 hindcast data for the period 1958 – 2010.
Wave direction 345-015 015-045 045-075 075-105 105-135 135-165 165-195 195-225 225-255 255-285 285-315 315-345 Sum
Win
d di
rect
ion
345-015 0.4998 0.5799 0.1505 0.1053 0.1027 0.1053 0.0549 0.0342 0.0161 0.0090 0.0161 0.0756 1.7493 015-045 0.1879 0.4313 0.1737 0.1246 0.0717 0.0743 0.0420 0.0168 0.0071 0.0065 0.0052 0.0316 1.1726 045-075 0.1272 0.2544 0.1860 0.1653 0.0736 0.0626 0.0355 0.0168 0.0052 0.0019 0.0045 0.0220 0.9550 075-105 0.1291 0.2570 0.1679 0.2279 0.1621 0.0891 0.0329 0.0278 0.0090 0.0071 0.0065 0.0258 1.1423 105-135 0.1782 0.3125 0.1601 0.2712 0.3371 0.2777 0.0607 0.0278 0.0071 0.0032 0.0090 0.0362 1.6808 135-165 0.3216 0.5269 0.1802 0.2835 0.4372 0.8530 0.3196 0.0807 0.0297 0.0245 0.0226 0.0794 3.1589 165-195 0.4501 0.5218 0.1808 0.1821 0.2531 0.6302 0.9060 0.3907 0.0820 0.0446 0.0717 0.1382 3.8511 195-225 0.3784 0.3403 0.0820 0.1046 0.1175 0.2247 0.5172 0.7510 0.1524 0.0710 0.0833 0.1608 2.9833 225-255 0.2454 0.1601 0.0581 0.0710 0.0484 0.0749 0.2047 0.4598 0.1582 0.0827 0.0768 0.1317 1.7719 255-285 0.2273 0.1350 0.0510 0.0465 0.0316 0.0517 0.1014 0.2531 0.1440 0.1040 0.1311 0.1756 1.4523 285-315 0.3151 0.1608 0.0530 0.0491 0.0387 0.0820 0.0994 0.1375 0.0762 0.0646 0.1143 0.2654 1.4561 315-345 0.5837 0.3016 0.0756 0.0917 0.0710 0.1195 0.0730 0.0762 0.0265 0.0323 0.0575 0.2886 1.7971
Sum 3.6439 3.9816 1.5188 1.7228 1.7448 2.6449 2.4473 2.2723 0.7135 0.4514 0.5986 1.4309 23.1708
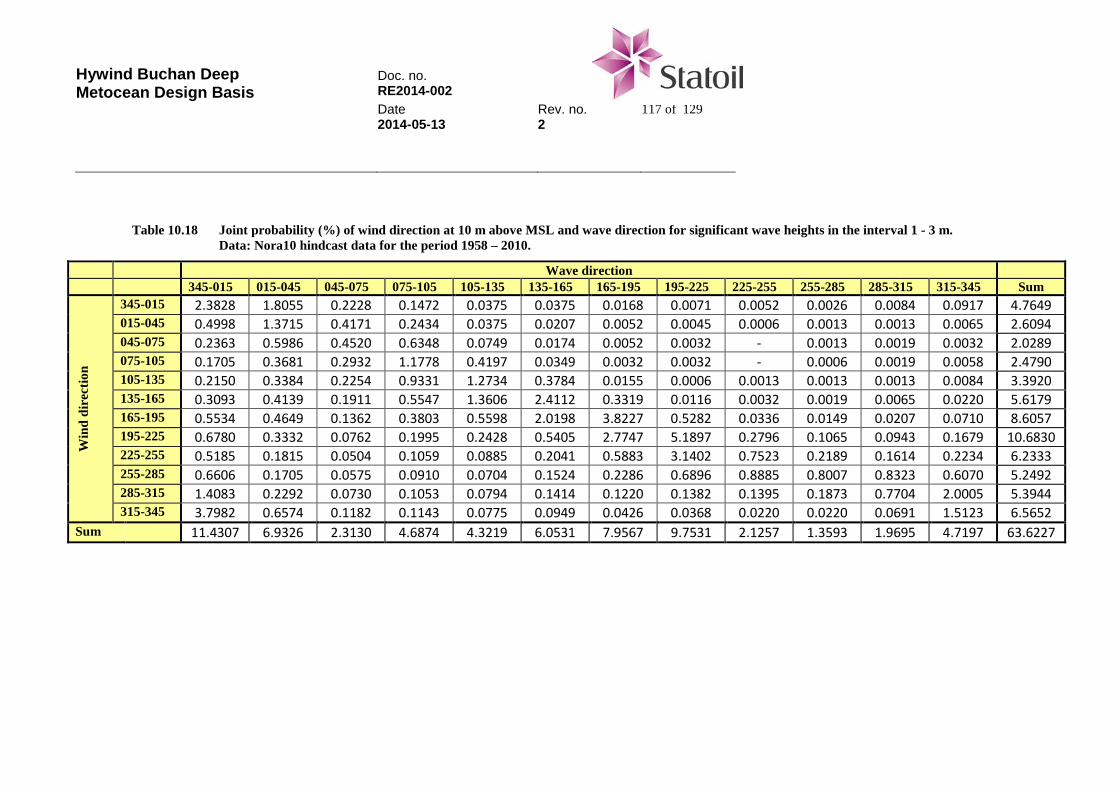
Hywind Buchan Deep Metocean Design Basis
Doc. no. RE2014-002 Date Rev. no. 117 of 129 2014-05-13 2
Table 10.18 Joint probability (%) of wind direction at 10 m above MSL and wave direction for significant wave heights in the interval 1 - 3 m. Data: Nora10 hindcast data for the period 1958 – 2010.
Wave direction 345-015 015-045 045-075 075-105 105-135 135-165 165-195 195-225 225-255 255-285 285-315 315-345 Sum
Win
d di
rect
ion
345-015 2.3828 1.8055 0.2228 0.1472 0.0375 0.0375 0.0168 0.0071 0.0052 0.0026 0.0084 0.0917 4.7649 015-045 0.4998 1.3715 0.4171 0.2434 0.0375 0.0207 0.0052 0.0045 0.0006 0.0013 0.0013 0.0065 2.6094 045-075 0.2363 0.5986 0.4520 0.6348 0.0749 0.0174 0.0052 0.0032 - 0.0013 0.0019 0.0032 2.0289 075-105 0.1705 0.3681 0.2932 1.1778 0.4197 0.0349 0.0032 0.0032 - 0.0006 0.0019 0.0058 2.4790 105-135 0.2150 0.3384 0.2254 0.9331 1.2734 0.3784 0.0155 0.0006 0.0013 0.0013 0.0013 0.0084 3.3920 135-165 0.3093 0.4139 0.1911 0.5547 1.3606 2.4112 0.3319 0.0116 0.0032 0.0019 0.0065 0.0220 5.6179 165-195 0.5534 0.4649 0.1362 0.3803 0.5598 2.0198 3.8227 0.5282 0.0336 0.0149 0.0207 0.0710 8.6057 195-225 0.6780 0.3332 0.0762 0.1995 0.2428 0.5405 2.7747 5.1897 0.2796 0.1065 0.0943 0.1679 10.6830 225-255 0.5185 0.1815 0.0504 0.1059 0.0885 0.2041 0.5883 3.1402 0.7523 0.2189 0.1614 0.2234 6.2333 255-285 0.6606 0.1705 0.0575 0.0910 0.0704 0.1524 0.2286 0.6896 0.8885 0.8007 0.8323 0.6070 5.2492 285-315 1.4083 0.2292 0.0730 0.1053 0.0794 0.1414 0.1220 0.1382 0.1395 0.1873 0.7704 2.0005 5.3944 315-345 3.7982 0.6574 0.1182 0.1143 0.0775 0.0949 0.0426 0.0368 0.0220 0.0220 0.0691 1.5123 6.5652
Sum 11.4307 6.9326 2.3130 4.6874 4.3219 6.0531 7.9567 9.7531 2.1257 1.3593 1.9695 4.7197 63.6227
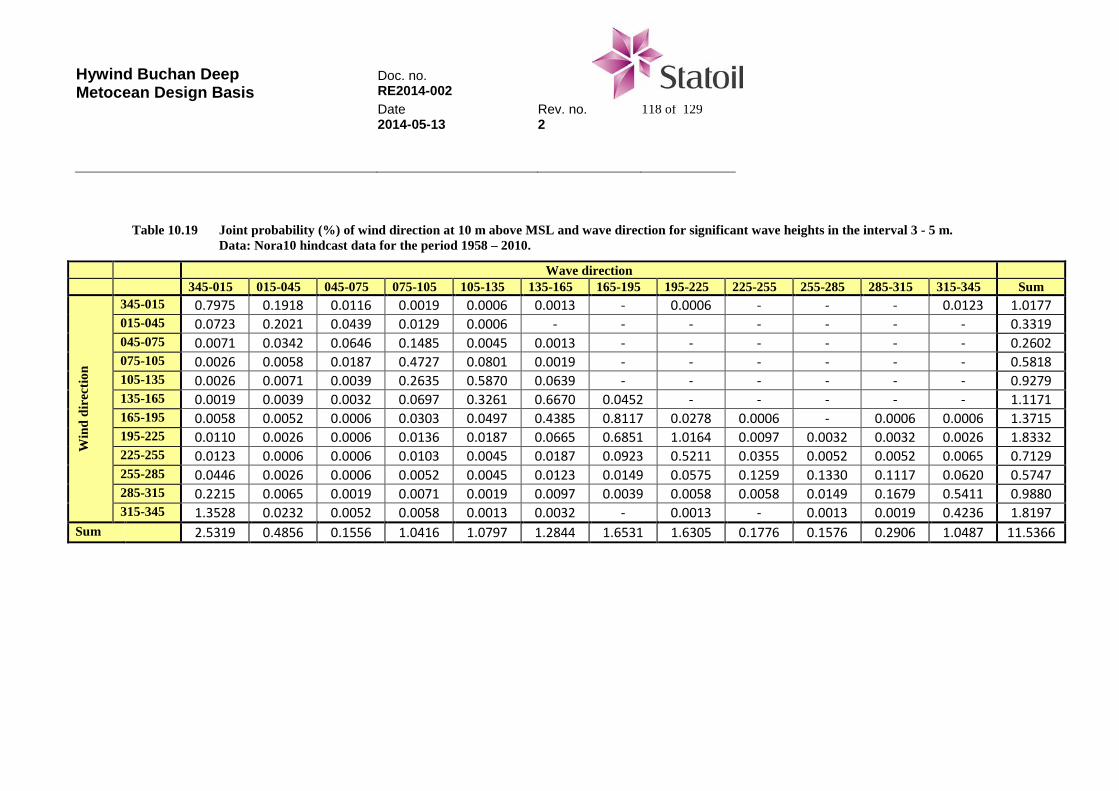
Hywind Buchan Deep Metocean Design Basis
Doc. no. RE2014-002 Date Rev. no. 118 of 129 2014-05-13 2
Table 10.19 Joint probability (%) of wind direction at 10 m above MSL and wave direction for significant wave heights in the interval 3 - 5 m. Data: Nora10 hindcast data for the period 1958 – 2010.
Wave direction 345-015 015-045 045-075 075-105 105-135 135-165 165-195 195-225 225-255 255-285 285-315 315-345 Sum
Win
d di
rect
ion
345-015 0.7975 0.1918 0.0116 0.0019 0.0006 0.0013 - 0.0006 - - - 0.0123 1.0177 015-045 0.0723 0.2021 0.0439 0.0129 0.0006 - - - - - - - 0.3319 045-075 0.0071 0.0342 0.0646 0.1485 0.0045 0.0013 - - - - - - 0.2602 075-105 0.0026 0.0058 0.0187 0.4727 0.0801 0.0019 - - - - - - 0.5818 105-135 0.0026 0.0071 0.0039 0.2635 0.5870 0.0639 - - - - - - 0.9279 135-165 0.0019 0.0039 0.0032 0.0697 0.3261 0.6670 0.0452 - - - - - 1.1171 165-195 0.0058 0.0052 0.0006 0.0303 0.0497 0.4385 0.8117 0.0278 0.0006 - 0.0006 0.0006 1.3715 195-225 0.0110 0.0026 0.0006 0.0136 0.0187 0.0665 0.6851 1.0164 0.0097 0.0032 0.0032 0.0026 1.8332 225-255 0.0123 0.0006 0.0006 0.0103 0.0045 0.0187 0.0923 0.5211 0.0355 0.0052 0.0052 0.0065 0.7129 255-285 0.0446 0.0026 0.0006 0.0052 0.0045 0.0123 0.0149 0.0575 0.1259 0.1330 0.1117 0.0620 0.5747 285-315 0.2215 0.0065 0.0019 0.0071 0.0019 0.0097 0.0039 0.0058 0.0058 0.0149 0.1679 0.5411 0.9880 315-345 1.3528 0.0232 0.0052 0.0058 0.0013 0.0032 - 0.0013 - 0.0013 0.0019 0.4236 1.8197
Sum 2.5319 0.4856 0.1556 1.0416 1.0797 1.2844 1.6531 1.6305 0.1776 0.1576 0.2906 1.0487 11.5366
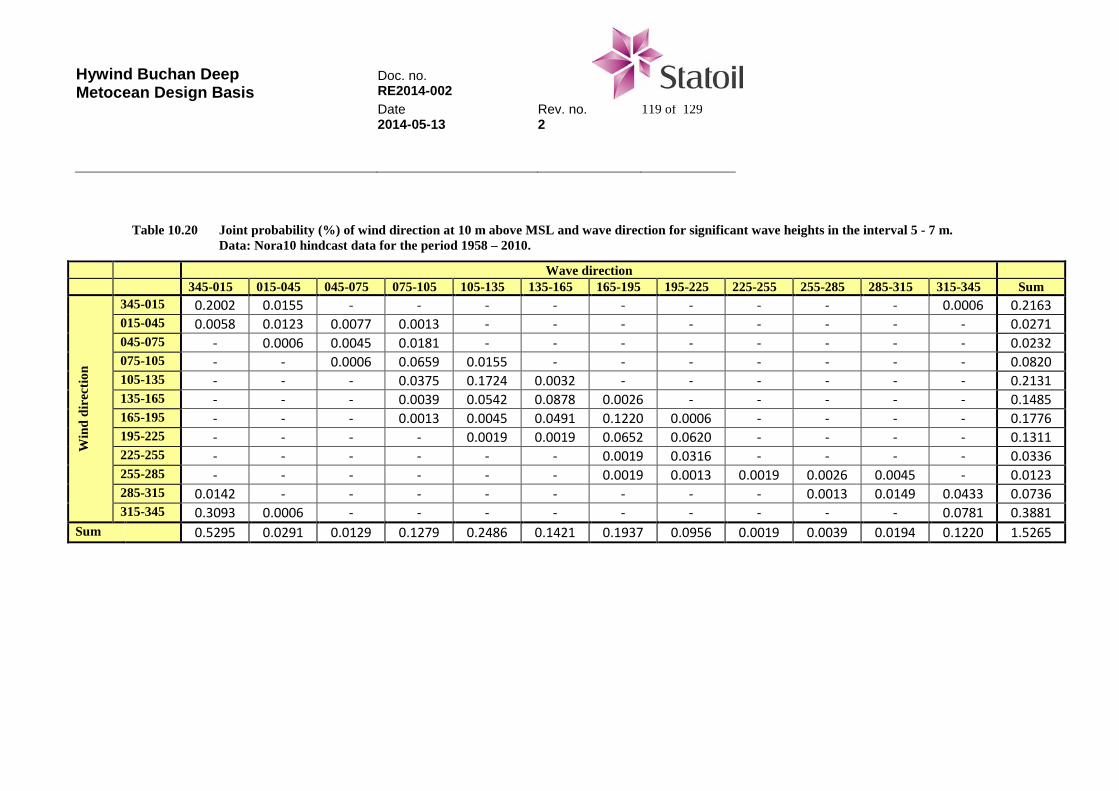
Hywind Buchan Deep Metocean Design Basis
Doc. no. RE2014-002 Date Rev. no. 119 of 129 2014-05-13 2
Table 10.20 Joint probability (%) of wind direction at 10 m above MSL and wave direction for significant wave heights in the interval 5 - 7 m. Data: Nora10 hindcast data for the period 1958 – 2010.
Wave direction 345-015 015-045 045-075 075-105 105-135 135-165 165-195 195-225 225-255 255-285 285-315 315-345 Sum
Win
d di
rect
ion
345-015 0.2002 0.0155 - - - - - - - - - 0.0006 0.2163 015-045 0.0058 0.0123 0.0077 0.0013 - - - - - - - - 0.0271 045-075 - 0.0006 0.0045 0.0181 - - - - - - - - 0.0232 075-105 - - 0.0006 0.0659 0.0155 - - - - - - - 0.0820 105-135 - - - 0.0375 0.1724 0.0032 - - - - - - 0.2131 135-165 - - - 0.0039 0.0542 0.0878 0.0026 - - - - - 0.1485 165-195 - - - 0.0013 0.0045 0.0491 0.1220 0.0006 - - - - 0.1776 195-225 - - - - 0.0019 0.0019 0.0652 0.0620 - - - - 0.1311 225-255 - - - - - - 0.0019 0.0316 - - - - 0.0336 255-285 - - - - - - 0.0019 0.0013 0.0019 0.0026 0.0045 - 0.0123 285-315 0.0142 - - - - - - - - 0.0013 0.0149 0.0433 0.0736 315-345 0.3093 0.0006 - - - - - - - - - 0.0781 0.3881
Sum 0.5295 0.0291 0.0129 0.1279 0.2486 0.1421 0.1937 0.0956 0.0019 0.0039 0.0194 0.1220 1.5265
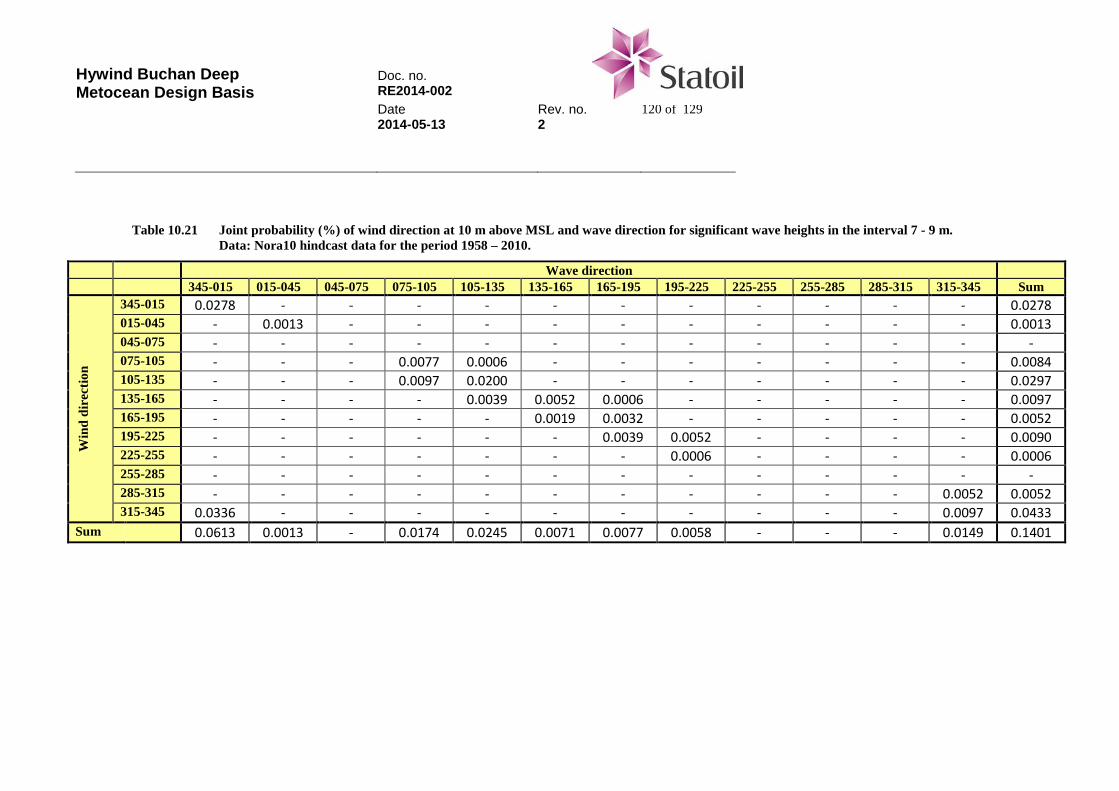
Hywind Buchan Deep Metocean Design Basis
Doc. no. RE2014-002 Date Rev. no. 120 of 129 2014-05-13 2
Table 10.21 Joint probability (%) of wind direction at 10 m above MSL and wave direction for significant wave heights in the interval 7 - 9 m. Data: Nora10 hindcast data for the period 1958 – 2010.
Wave direction 345-015 015-045 045-075 075-105 105-135 135-165 165-195 195-225 225-255 255-285 285-315 315-345 Sum
Win
d di
rect
ion
345-015 0.0278 - - - - - - - - - - - 0.0278 015-045 - 0.0013 - - - - - - - - - - 0.0013 045-075 - - - - - - - - - - - - - 075-105 - - - 0.0077 0.0006 - - - - - - - 0.0084 105-135 - - - 0.0097 0.0200 - - - - - - - 0.0297 135-165 - - - - 0.0039 0.0052 0.0006 - - - - - 0.0097 165-195 - - - - - 0.0019 0.0032 - - - - - 0.0052 195-225 - - - - - - 0.0039 0.0052 - - - - 0.0090 225-255 - - - - - - - 0.0006 - - - - 0.0006 255-285 - - - - - - - - - - - - - 285-315 - - - - - - - - - - - 0.0052 0.0052 315-345 0.0336 - - - - - - - - - - 0.0097 0.0433
Sum 0.0613 0.0013 - 0.0174 0.0245 0.0071 0.0077 0.0058 - - - 0.0149 0.1401

Hywind Buchan Deep Metocean Design Basis
Doc. no. RE2014-002 Date Rev. no. 121 of 129 2014-05-13 2
Table 10.22 Joint probability (%) of wind direction at 10 m above MSL and wave direction for significant wave heights in the interval 9 - 11 m. Data: Nora10 hindcast data for the period 1958 – 2010.
Wave direction 345-015 015-045 045-075 075-105 105-135 135-165 165-195 195-225 225-255 255-285 285-315 315-345 Sum
Win
d di
rect
ion
345-015 - - - - - - - - - - - - - 015-045 - - - - - - - - - - - - - 045-075 - - - - - - - - - - - - - 075-105 - - - - - - - - - - - - - 105-135 - - - - - - - - - - - - - 135-165 - - - - - - - - - - - - - 165-195 - - - - - - - - - - - - - 195-225 - - - - - - - - - - - - - 225-255 - - - - - - - - - - - - - 255-285 - - - - - - - - - - - - - 285-315 - - - - - - - - - - - - - 315-345 0.0032 - - - - - - - - - - - 0.0032
Sum 0.0032 - - - - - - - - - - - 0.0032
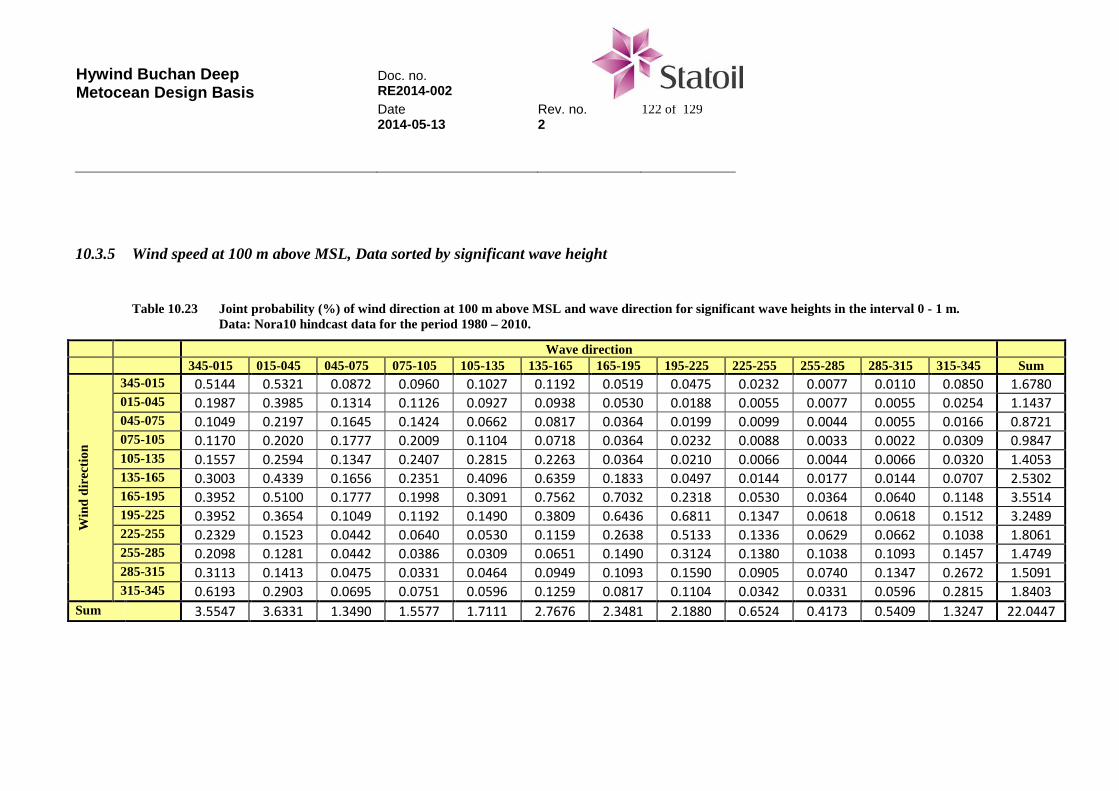
Hywind Buchan Deep Metocean Design Basis
Doc. no. RE2014-002 Date Rev. no. 122 of 129 2014-05-13 2
10.3.5 Wind speed at 100 m above MSL, Data sorted by significant wave height
Table 10.23 Joint probability (%) of wind direction at 100 m above MSL and wave direction for significant wave heights in the interval 0 - 1 m. Data: Nora10 hindcast data for the period 1980 – 2010.
Wave direction 345-015 015-045 045-075 075-105 105-135 135-165 165-195 195-225 225-255 255-285 285-315 315-345 Sum
Win
d di
rect
ion
345-015 0.5144 0.5321 0.0872 0.0960 0.1027 0.1192 0.0519 0.0475 0.0232 0.0077 0.0110 0.0850 1.6780 015-045 0.1987 0.3985 0.1314 0.1126 0.0927 0.0938 0.0530 0.0188 0.0055 0.0077 0.0055 0.0254 1.1437 045-075 0.1049 0.2197 0.1645 0.1424 0.0662 0.0817 0.0364 0.0199 0.0099 0.0044 0.0055 0.0166 0.8721 075-105 0.1170 0.2020 0.1777 0.2009 0.1104 0.0718 0.0364 0.0232 0.0088 0.0033 0.0022 0.0309 0.9847 105-135 0.1557 0.2594 0.1347 0.2407 0.2815 0.2263 0.0364 0.0210 0.0066 0.0044 0.0066 0.0320 1.4053 135-165 0.3003 0.4339 0.1656 0.2351 0.4096 0.6359 0.1833 0.0497 0.0144 0.0177 0.0144 0.0707 2.5302 165-195 0.3952 0.5100 0.1777 0.1998 0.3091 0.7562 0.7032 0.2318 0.0530 0.0364 0.0640 0.1148 3.5514 195-225 0.3952 0.3654 0.1049 0.1192 0.1490 0.3809 0.6436 0.6811 0.1347 0.0618 0.0618 0.1512 3.2489 225-255 0.2329 0.1523 0.0442 0.0640 0.0530 0.1159 0.2638 0.5133 0.1336 0.0629 0.0662 0.1038 1.8061 255-285 0.2098 0.1281 0.0442 0.0386 0.0309 0.0651 0.1490 0.3124 0.1380 0.1038 0.1093 0.1457 1.4749 285-315 0.3113 0.1413 0.0475 0.0331 0.0464 0.0949 0.1093 0.1590 0.0905 0.0740 0.1347 0.2672 1.5091 315-345 0.6193 0.2903 0.0695 0.0751 0.0596 0.1259 0.0817 0.1104 0.0342 0.0331 0.0596 0.2815 1.8403
Sum 3.5547 3.6331 1.3490 1.5577 1.7111 2.7676 2.3481 2.1880 0.6524 0.4173 0.5409 1.3247 22.0447
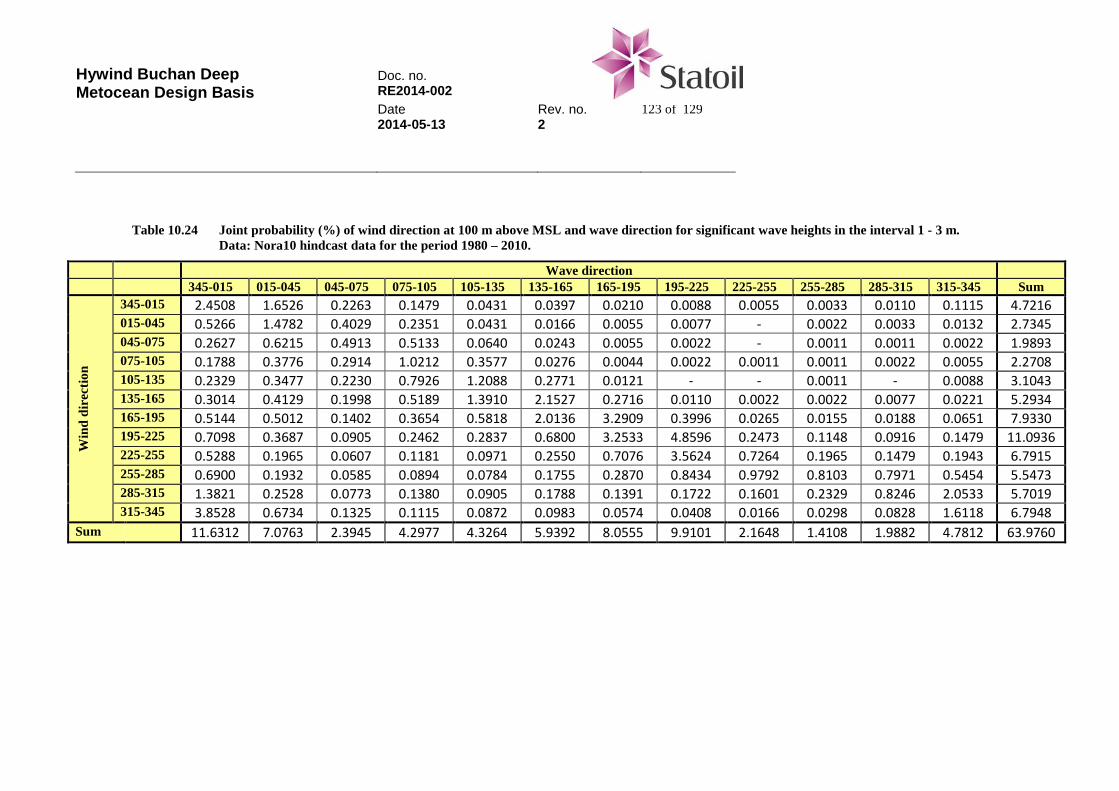
Hywind Buchan Deep Metocean Design Basis
Doc. no. RE2014-002 Date Rev. no. 123 of 129 2014-05-13 2
Table 10.24 Joint probability (%) of wind direction at 100 m above MSL and wave direction for significant wave heights in the interval 1 - 3 m. Data: Nora10 hindcast data for the period 1980 – 2010.
Wave direction 345-015 015-045 045-075 075-105 105-135 135-165 165-195 195-225 225-255 255-285 285-315 315-345 Sum
Win
d di
rect
ion
345-015 2.4508 1.6526 0.2263 0.1479 0.0431 0.0397 0.0210 0.0088 0.0055 0.0033 0.0110 0.1115 4.7216 015-045 0.5266 1.4782 0.4029 0.2351 0.0431 0.0166 0.0055 0.0077 - 0.0022 0.0033 0.0132 2.7345 045-075 0.2627 0.6215 0.4913 0.5133 0.0640 0.0243 0.0055 0.0022 - 0.0011 0.0011 0.0022 1.9893 075-105 0.1788 0.3776 0.2914 1.0212 0.3577 0.0276 0.0044 0.0022 0.0011 0.0011 0.0022 0.0055 2.2708 105-135 0.2329 0.3477 0.2230 0.7926 1.2088 0.2771 0.0121 - - 0.0011 - 0.0088 3.1043 135-165 0.3014 0.4129 0.1998 0.5189 1.3910 2.1527 0.2716 0.0110 0.0022 0.0022 0.0077 0.0221 5.2934 165-195 0.5144 0.5012 0.1402 0.3654 0.5818 2.0136 3.2909 0.3996 0.0265 0.0155 0.0188 0.0651 7.9330 195-225 0.7098 0.3687 0.0905 0.2462 0.2837 0.6800 3.2533 4.8596 0.2473 0.1148 0.0916 0.1479 11.0936 225-255 0.5288 0.1965 0.0607 0.1181 0.0971 0.2550 0.7076 3.5624 0.7264 0.1965 0.1479 0.1943 6.7915 255-285 0.6900 0.1932 0.0585 0.0894 0.0784 0.1755 0.2870 0.8434 0.9792 0.8103 0.7971 0.5454 5.5473 285-315 1.3821 0.2528 0.0773 0.1380 0.0905 0.1788 0.1391 0.1722 0.1601 0.2329 0.8246 2.0533 5.7019 315-345 3.8528 0.6734 0.1325 0.1115 0.0872 0.0983 0.0574 0.0408 0.0166 0.0298 0.0828 1.6118 6.7948
Sum 11.6312 7.0763 2.3945 4.2977 4.3264 5.9392 8.0555 9.9101 2.1648 1.4108 1.9882 4.7812 63.9760
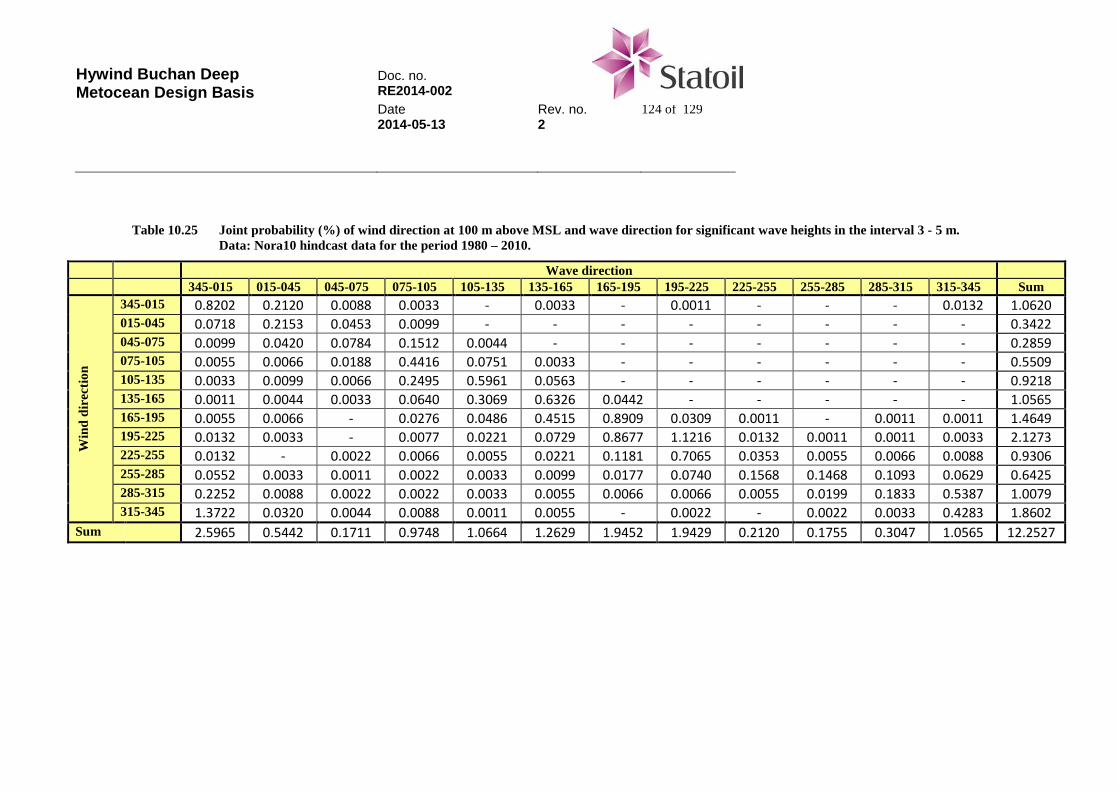
Hywind Buchan Deep Metocean Design Basis
Doc. no. RE2014-002 Date Rev. no. 124 of 129 2014-05-13 2
Table 10.25 Joint probability (%) of wind direction at 100 m above MSL and wave direction for significant wave heights in the interval 3 - 5 m. Data: Nora10 hindcast data for the period 1980 – 2010.
Wave direction 345-015 015-045 045-075 075-105 105-135 135-165 165-195 195-225 225-255 255-285 285-315 315-345 Sum
Win
d di
rect
ion
345-015 0.8202 0.2120 0.0088 0.0033 - 0.0033 - 0.0011 - - - 0.0132 1.0620 015-045 0.0718 0.2153 0.0453 0.0099 - - - - - - - - 0.3422 045-075 0.0099 0.0420 0.0784 0.1512 0.0044 - - - - - - - 0.2859 075-105 0.0055 0.0066 0.0188 0.4416 0.0751 0.0033 - - - - - - 0.5509 105-135 0.0033 0.0099 0.0066 0.2495 0.5961 0.0563 - - - - - - 0.9218 135-165 0.0011 0.0044 0.0033 0.0640 0.3069 0.6326 0.0442 - - - - - 1.0565 165-195 0.0055 0.0066 - 0.0276 0.0486 0.4515 0.8909 0.0309 0.0011 - 0.0011 0.0011 1.4649 195-225 0.0132 0.0033 - 0.0077 0.0221 0.0729 0.8677 1.1216 0.0132 0.0011 0.0011 0.0033 2.1273 225-255 0.0132 - 0.0022 0.0066 0.0055 0.0221 0.1181 0.7065 0.0353 0.0055 0.0066 0.0088 0.9306 255-285 0.0552 0.0033 0.0011 0.0022 0.0033 0.0099 0.0177 0.0740 0.1568 0.1468 0.1093 0.0629 0.6425 285-315 0.2252 0.0088 0.0022 0.0022 0.0033 0.0055 0.0066 0.0066 0.0055 0.0199 0.1833 0.5387 1.0079 315-345 1.3722 0.0320 0.0044 0.0088 0.0011 0.0055 - 0.0022 - 0.0022 0.0033 0.4283 1.8602
Sum 2.5965 0.5442 0.1711 0.9748 1.0664 1.2629 1.9452 1.9429 0.2120 0.1755 0.3047 1.0565 12.2527
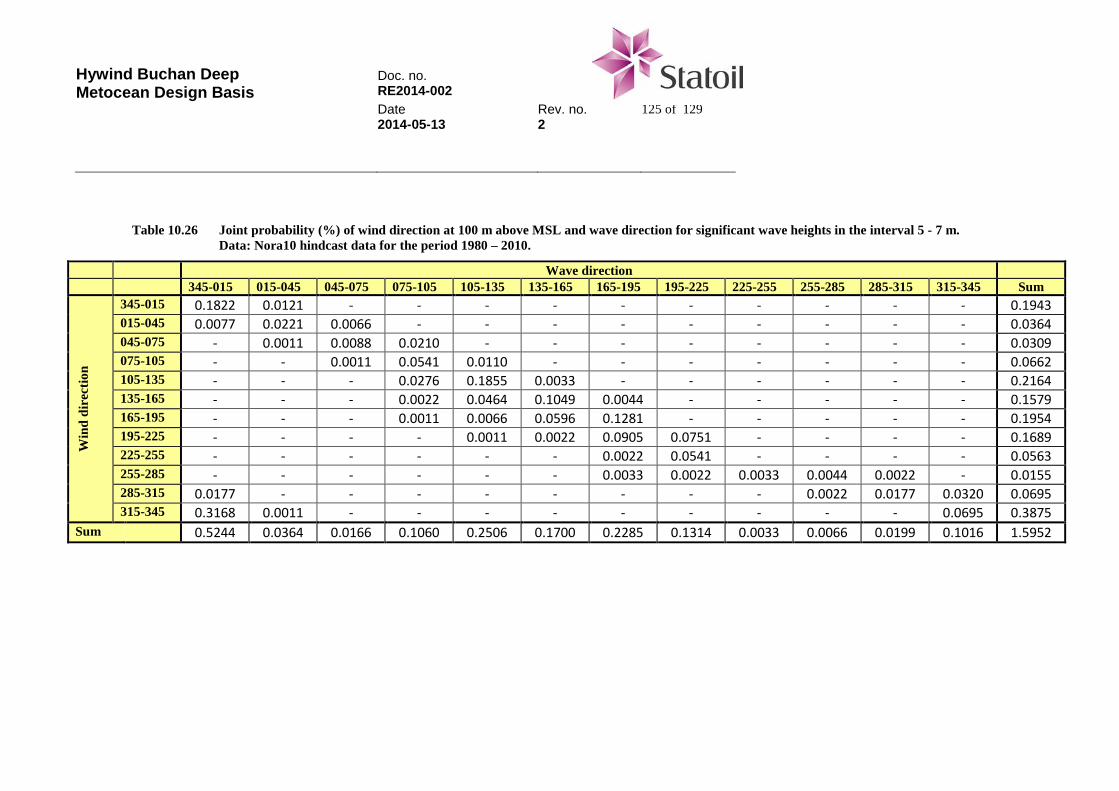
Hywind Buchan Deep Metocean Design Basis
Doc. no. RE2014-002 Date Rev. no. 125 of 129 2014-05-13 2
Table 10.26 Joint probability (%) of wind direction at 100 m above MSL and wave direction for significant wave heights in the interval 5 - 7 m. Data: Nora10 hindcast data for the period 1980 – 2010.
Wave direction 345-015 015-045 045-075 075-105 105-135 135-165 165-195 195-225 225-255 255-285 285-315 315-345 Sum
Win
d di
rect
ion
345-015 0.1822 0.0121 - - - - - - - - - - 0.1943 015-045 0.0077 0.0221 0.0066 - - - - - - - - - 0.0364 045-075 - 0.0011 0.0088 0.0210 - - - - - - - - 0.0309 075-105 - - 0.0011 0.0541 0.0110 - - - - - - - 0.0662 105-135 - - - 0.0276 0.1855 0.0033 - - - - - - 0.2164 135-165 - - - 0.0022 0.0464 0.1049 0.0044 - - - - - 0.1579 165-195 - - - 0.0011 0.0066 0.0596 0.1281 - - - - - 0.1954 195-225 - - - - 0.0011 0.0022 0.0905 0.0751 - - - - 0.1689 225-255 - - - - - - 0.0022 0.0541 - - - - 0.0563 255-285 - - - - - - 0.0033 0.0022 0.0033 0.0044 0.0022 - 0.0155 285-315 0.0177 - - - - - - - - 0.0022 0.0177 0.0320 0.0695 315-345 0.3168 0.0011 - - - - - - - - - 0.0695 0.3875
Sum 0.5244 0.0364 0.0166 0.1060 0.2506 0.1700 0.2285 0.1314 0.0033 0.0066 0.0199 0.1016 1.5952
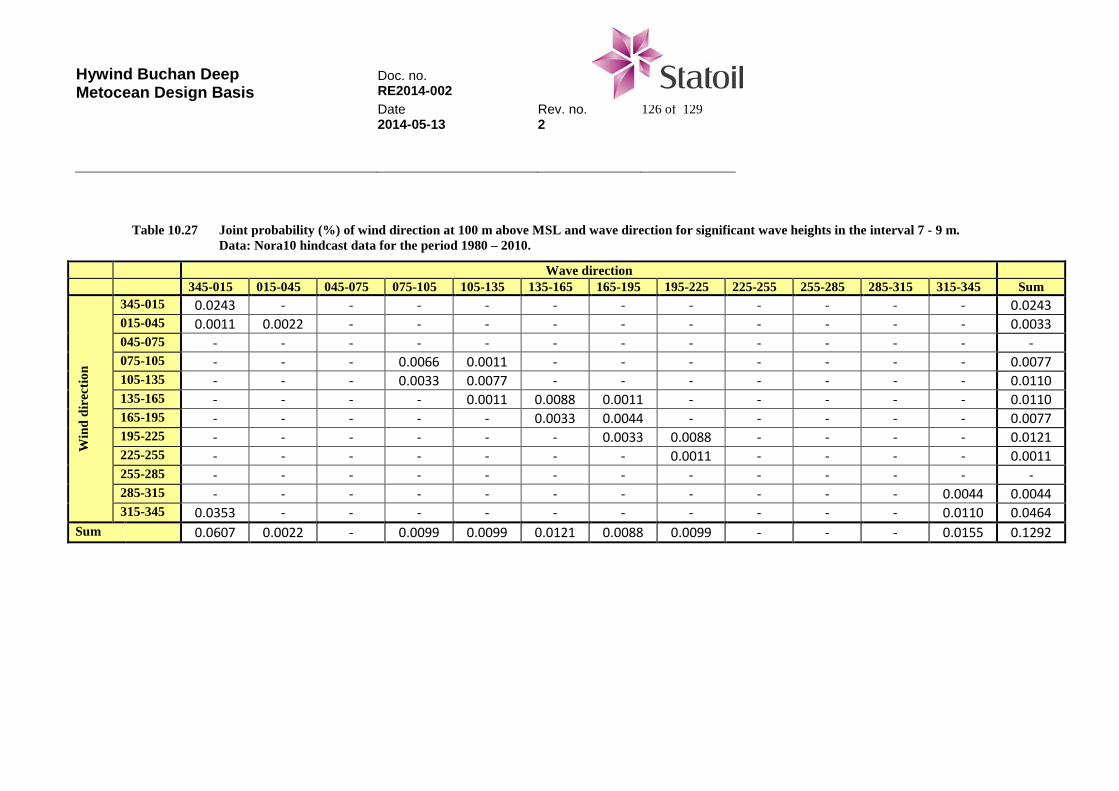
Hywind Buchan Deep Metocean Design Basis
Doc. no. RE2014-002 Date Rev. no. 126 of 129 2014-05-13 2
Table 10.27 Joint probability (%) of wind direction at 100 m above MSL and wave direction for significant wave heights in the interval 7 - 9 m. Data: Nora10 hindcast data for the period 1980 – 2010.
Wave direction 345-015 015-045 045-075 075-105 105-135 135-165 165-195 195-225 225-255 255-285 285-315 315-345 Sum
Win
d di
rect
ion
345-015 0.0243 - - - - - - - - - - - 0.0243 015-045 0.0011 0.0022 - - - - - - - - - - 0.0033 045-075 - - - - - - - - - - - - - 075-105 - - - 0.0066 0.0011 - - - - - - - 0.0077 105-135 - - - 0.0033 0.0077 - - - - - - - 0.0110 135-165 - - - - 0.0011 0.0088 0.0011 - - - - - 0.0110 165-195 - - - - - 0.0033 0.0044 - - - - - 0.0077 195-225 - - - - - - 0.0033 0.0088 - - - - 0.0121 225-255 - - - - - - - 0.0011 - - - - 0.0011 255-285 - - - - - - - - - - - - - 285-315 - - - - - - - - - - - 0.0044 0.0044 315-345 0.0353 - - - - - - - - - - 0.0110 0.0464
Sum 0.0607 0.0022 - 0.0099 0.0099 0.0121 0.0088 0.0099 - - - 0.0155 0.1292
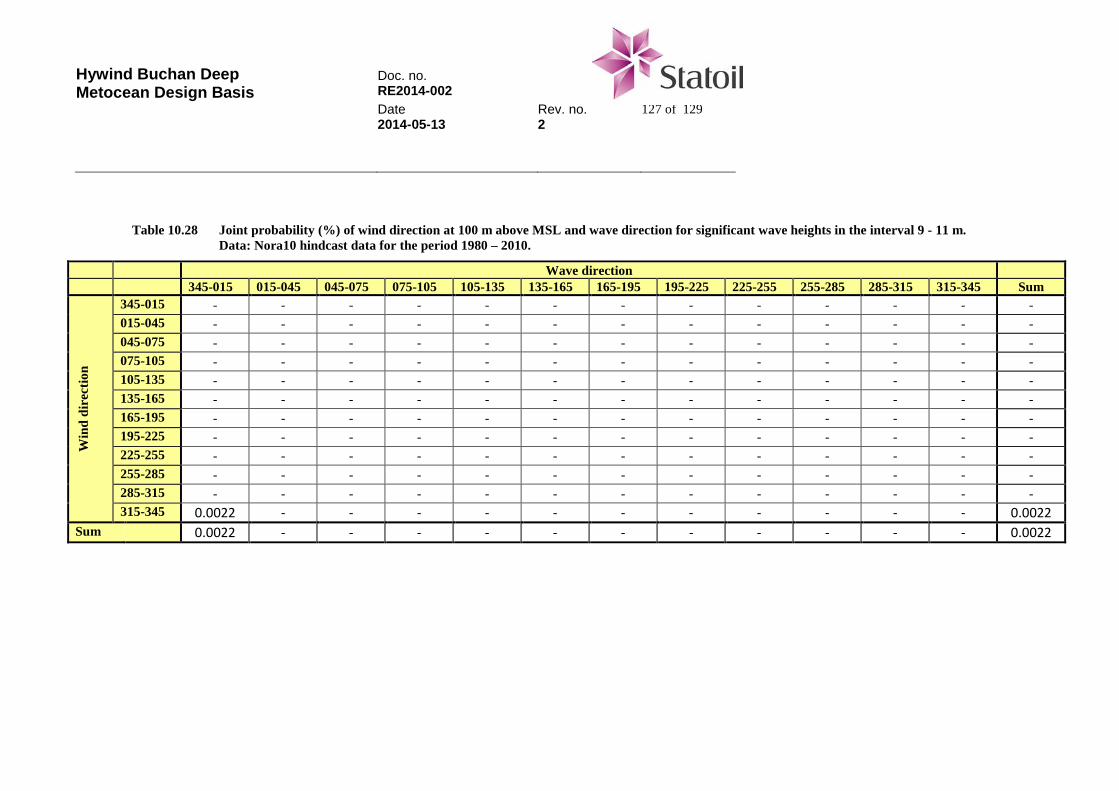
Hywind Buchan Deep Metocean Design Basis
Doc. no. RE2014-002 Date Rev. no. 127 of 129 2014-05-13 2
Table 10.28 Joint probability (%) of wind direction at 100 m above MSL and wave direction for significant wave heights in the interval 9 - 11 m. Data: Nora10 hindcast data for the period 1980 – 2010.
Wave direction 345-015 015-045 045-075 075-105 105-135 135-165 165-195 195-225 225-255 255-285 285-315 315-345 Sum
Win
d di
rect
ion
345-015 - - - - - - - - - - - - - 015-045 - - - - - - - - - - - - - 045-075 - - - - - - - - - - - - - 075-105 - - - - - - - - - - - - - 105-135 - - - - - - - - - - - - - 135-165 - - - - - - - - - - - - - 165-195 - - - - - - - - - - - - - 195-225 - - - - - - - - - - - - - 225-255 - - - - - - - - - - - - - 255-285 - - - - - - - - - - - - - 285-315 - - - - - - - - - - - - - 315-345 0.0022 - - - - - - - - - - - 0.0022
Sum 0.0022 - - - - - - - - - - - 0.0022
Hywind Buchan Deep Metocean Design Basis
Doc. no. RE2014-002 Date Rev. no. 128 of 129 2014-05-13 2
11 References
Standards and Guidelines 1. IEC 61400-3 Edition 1.0 2009-02, Wind turbines – Part 3: Design requirements for offshore wind
turbines. International Electrotechnical Commission (IEC) International Standard. 2. NS-EN ISO 19901-1:2005, Petroleum and natural gas industries - Specific requirements for offshore
structures – Part 1: Metocean design and operating conditions. International Organization for Standardization. URL http://www.standard.no/
3. DnV-OS-J101, Offshore standard, Design of offshore wind turbine structures, October 2007. 4. DNV RP-F105 Free spanning pipelines, Det Norske Veritas, February 2006.
URL: http://www.dnv.no/ressurser/regler_standarder/index.asp 5. BS 6349-1:2000, Maritime structures – Part 1: Code of practice for general criteria. 6. UK Health and Safety Executive (2002), Environmental considerations, Offshore Technology
Report 2001/010, ISBN 0 7176 2379 3. URL: http://www.hse.gov.uk/research/otohtm/2001/oto01010.htm
7. NORSOK Standard N-003 Action and action effects, Edition 2, September 2007. URL: http://www.standard.no/
8. NORSOK Standard N-006 Assessment of structural integrity for existing load-bearing structures, Edition 1, March 2009. URL: http://www.standard.no/
9. NS-EN-1991-1-3, Eurocode 1: Actions on structures – Part 1-3: General actions - Snow loads. URL: http://www.standard.no/
10. Mathiesen, M (2012), Extreme Environmental Conditions, Recommended Practice, Revision 3, Statoil Document No. RE2010-014.
Metocean Design Basis reports 11. None Data sources 12. Matsumoto, K, Takanezawa, T and Ooe, M (2004), NAO99b tidal prediction system.
URL: http://www.miz.nao.ac.jp/staffs/nao99/index_En.html 13. National Oceanographic Data Center (2010), Access to World Ocean Atlas 2009 on-line
Objective Analyses and Statistics. URL: http://www.nodc.noaa.gov/OC5/WOA09/woa09data.html
Reports and journal papers 14. Andersen, O. J. and Løvseth, J. (2006), The Frøya database and boundary layer wind description,
Marine Structures, Vol. 19, pp. 173-192. 15. Andersen, O. J. and Løvseth, J (2010), Stability modifications of the Frøya wind spectrum, Journal
of Wind Engineering and Industrial Aerodynamics, Vol. 98, Issues 4–5, pp. 236–242. 16. Bruserud, K, Nygaard, E and Johannessen, K (2010); Wave and wind calibration atlas for the
Western Europe, Revision 2, Statoil Document No. MMG-MGE-RA 00017.
Hywind Buchan Deep Metocean Design Basis
Doc. no. RE2014-002 Date Rev. no. 129 of 129 2014-05-13 2
17. Fenton, J D and McKee, W D (1989), On calculating the lengths of water waves, Coastal Engineering, Vol. 14, pp. 499-513.
18. Forristall, G. Z. (1978), On the statistical distribution of wave heights in a storm, Journal of Geophysical Research, Vol. 83, No. C5, pp. 2353-2358.
19. Forristall, G. Z. (2000), Wave crest distributions: Observations and second-order theory, Journal of physical oceanography, pp. 1931-1943.
20. Goda, Y (1988), Statistical variability of sea state parameters as a function of wave spectrum. Coastal Engineering in Japan, Vol. 31, No. 1, pp. 39-52
21. Haver, S., Sagli, G. and Gran, T. M. (1998): “Long term response analysis of fixed and floating structures”, Ocean Wave Kinematics, Dynamics and Loads on Structures (OTRC), April-May 1998, Houston, Texas, pp. 240-250.
22. Intergovernmental Panel on Climate Change (2007), Fourth Assessment Report, Climate Change 2007: Synthesis Report, Summary for Policymakers. Preliminary Report November 2007. URL: http://www.ipcc.ch/pdf/assessment-report/ar4/syr/ar4_syr_spm.pdf
23. Mathiesen, M (2010), Wam10 data archive – Use of Wind and Wave data, Revision 2, Statoil memo dated 1 March 2010.
24. Nygaard, E (2011), Dogger Bank – On the uncertainty in the mean wind speed and the wind distribution, Statoil Memo dated 2011-08-03.
25. Plate, E. (1982), Engineering Meteorology, Elsevier Science Ltd, 740 pp. 26. Reistad, M, Breivik, Ø, Haakenstad, H, Aarnes, O J, Furuvik, B R and Bidlot, J-R (2011), A high-
resolution hindcast of wind and waves for the North Sea, Norwegian Sea, and the Barents Sea, Journal of Geophysical Research, 116, C05019, doi: 10.1029/2010JC006402. URL: http://onlinelibrary.wiley.com/doi/10.1029/2010JC006402/suppinfo
27. Scottish Government (), Scotlands Marine Atlas: Information for the Natioanl Marine Plan. URL: http://www.scotland.gov.uk/Publications/2011/03/16182005/0
28. Torsethaugen, K. (2004), Simplified double peak spectral model for ocean waves, SINTEF Fisheries and Aquaculture Report No. STF80 A048052
== End of report